Oxidation of Florfenicol and Oxolinic Acid in Seawater by Ozonation
by
 ,
,
Homin Kye
1, 
Heegun Oh
1,
Youmi Jung
1,
Minhwan Kwon
1,
Yeojoon Yoon
1 ,
,
Joon-Wun Kang
1 and
Tae-Mun Hwang
2,* 1
Department of Environmental Engineering, Yonsei University, 1 Yonseidae-gil, Wonju-si, Gangwon-do 26493, Korea
2
Korea Institute of Civil Engineering and Building Technology, Dae-hwa-Dong 283, Goyangdae-Ro, Ilsanseo-Gu, Goyang-Si, Gyeonggi-Do 10223, Korea
*
Author to whom correspondence should be addressed.
Appl. Sci. 2020, 10(14), 4944; https://0-doi-org.brum.beds.ac.uk/10.3390/app10144944
Submission received: 25 June 2020
/
Revised: 14 July 2020
/
Accepted: 15 July 2020
/
Published: 18 July 2020
(This article belongs to the Special Issue Innovative Water Treatment Technology for Sustainability)
Abstract
:There has been an increase in the use of antibiotics by the aquaculture industry in marine aquaculture for the prevention of diseases in fish. Antibiotics in the water discharged into the sea without treatment can cause disturbances to the marine ecosystem. Therefore, there is a need for research on how the removal of antibiotics used in aquaculture can be achieved. In this study, the removal of two types of antibiotics (florfenicol, FF, and oxolinic acid, OA) used in the aquaculture industry, by ozonation, was evaluated. Currently, there is a lack of research studies on FF and OA removal from seawater by ozonation. Seawater ozonation shows a significantly different oxidation mechanism as compared to that of freshwater. The high amount of Br− in seawater (60 mg/L) allows for a rapid reaction with ozone to produce bromine (HOBr/OBr−) at a rate of 160 M−1s−1. To predict the removal efficiency of antibiotics by ozone and bromine, the species-specific rate constants for the reaction of FF and OA with ozone and bromine were determined. The predicted removal efficiencies of FF and OA using measured rate constants were verified by the ozonation process in water containing bromide ions in similar concentrations as in seawater. The result for FF indicated less than 10% removal during 20 min, with the rate constants of FF with ozone and bromine being 3.2 M−1s−1 and 3.5 M−1s−1, respectively. However, the removal of OA using ozonation was approximately 99% or higher within 90 s. In the presence of bromide ions, approximately 60% of OA was removed by trace ozone within 15 s, and approximately 30% of OA was removed by the generated bromine after 15 s. Comparing the removability of FF and OA used in aquaculture by ozone, it was observed that FF was more difficult to remove because of its low reaction rate constant. Meanwhile, the reaction rates of OA with ozone and bromine were 2.4 × 10³ M−1s−1 and 4.0 × 10² M−1s−1, respectively. At the beginning of the reaction, OA was removed by the trace ozone. Subsequently, OA was removed by the generated bromine after the ozone was decomposed.
Article Highlights
- It is necessary to prevent antibiotics used in marine aquaculture from entering the oceans and harming the aquatic environment.
- In seawater ozonation, ozone reacts rapidly with bromide ion to produce bromine. The primary oxidants of seawater ozonation are trace ozone and stable bromine.
- Ozone and bromine were recommended for FF and OA removal in seawater.
1. Introduction
In the aquaculture industry, some pathogenic organisms cause serious diseases in fish that can result in mass deaths. To prevent the outbreak of diseases, and to promote fish production, many types of antibiotics have been used widely in the aquaculture industry. Because a large proportion of antibiotics or their metabolites are excreted through fish urine and feces, these undesirable compounds can easily enter the aquatic environment [1]. Because regulations regarding antibiotic discharge are non-existent, water containing antibiotics is directly discharged into the sea after use. The antibiotics that remain in the aquatic environment can potentially affect the environment and public health, including causing aquatic toxicity, changes to physical health of domestic animals, food safety issues, and increased antibiotic resistance in pathogenic bacteria [1].
Two antibiotics, namely florfenicol (FF) and oxolinic acid (OA), were selected as target compounds for this study. FF is a broad-spectrum antibiotic permitted as a veterinary drug in animals used for food [2,3]. As a fluorinated derivative of thiamphenicol, FF can inhibit transpeptidation in bacterial protein synthesis, and is effective against gram-negative and gram-positive bacteria [4]. FF demonstrates high efficacy in the control of several bacterial infections in the aquatic environment and is safe for human beings. Therefore, it has been highly recommended in many countries, for use in aquaculture [5]. Oxolinic acid (OA) is a quinolone antibiotic that is widely used in aquaculture, as well as in the poultry and cattle industries. However, OA has been reported as potentially genotoxic, and can cause harm to the environment [6]. Recently, high concentrations of OA have been detected in the aquatic environment, and persistence for long periods in natural water has also been reported [7,8].
With increasing amounts of antibiotics being detected in the aquatic environment, ozonation, ultraviolet irradiation, electrolysis, and chlorination have been used to remove them [9,10,11,12,13,14]. Ozonation has been used for the removal of micropollutants in seawater. Seawater ozonation can protect the aquatic ecosystem from harmful organic substances. The ozone chemistry of seawater is considerably different from that of fresh water because seawater contains a much higher concentration of dissolved anions and cations (e.g., chloride, bromide, magnesium, sulfate), than fresh water [15,16]. Particularly, the bromide ion is a key ion for ozonation because of its high reactivity towards ozone. The reaction between ozone and the bromide ion leads to the formation of the oxidant, bromine (HOBr/OBr−). Seawater contains, on average, 65 mg/L of bromide ions, while fresh water contains less than 1 mg/L. Owing to the high amount of bromide in seawater (65 mg/L), seawater ozonation exhibits a significantly different oxidation mechanism compared to that in freshwater, because ozone reacts rapidly with the bromide ion to produce bromine at a rate of 160 M−1s−1 [17]. Although a high amount of chloride is present in seawater (18,000 mg/L), the rate constant for the reaction of ozone with chloride ions (0.003 M−1s−1) to produce chlorine, (HOCl/OCl−) is lower than that with bromide [17]. Although chlorine is formed during seawater ozonation, it is converted rapidly to bromine as shown by Equation (1).
Thus, the primary oxidant in seawater ozonation is bromine (HOBr/OBr−), with trace ozone. For the efficient control of antibiotics in seawater by ozonation, the concentration of oxidants in seawater, primarily bromine and trace ozone, must be predicted, and the reaction rate between the antibiotic and each oxidant must be analyzed. However, research studies that predict the removal efficiencies of FF and OA from seawater through ozonation are lacking. The aim of this study is (1) to determine the rate constants of target antibiotics, FF and OA, for reactions with ozone and bromine, (2) to predict the removal efficiencies of the target antibiotics using the determined rate constants for seawater ozonation, and (3) to experimentally verify the removal efficiency of antibiotics from water containing bromide ions.
2. Materials and Methods
2.1. Materials
Table 1 shows the chemical characteristics of FF and OA, the target antibiotics. FF and OA of the highest purity (99%) as well as Tert-butyl alcohol (t-BuOH, 99%), phosphoric acid (H3PO4), sodium hydroxide (NaOH), and sodium thiosulfate (Na2S2O3), were purchased from Sigma-Aldrich (USA), while Sodium bromide (NaBr, 99%) was obtained from Junsei (Japan). All experimental stock solutions were prepared using deionized water, which was purified using Easypure II (Thermo Fisher Scientific, Waltham, MA, USA). A saturated ozone stock solution (60–70 mg/L) was prepared using an ozone generator (Ozonia, Zürich, Switzerland) at a cold temperature (<10 °C) from high-purity oxygen. Stock solutions of bromine were prepared by adding excess ozone to potassium bromide solution, according to the procedure described by [18]. The residual ozone in the bromine stock solution was removed by high-purity nitrogen gas within 15 min of adding ozone to the bromide solution.
2.2. Experimental Procedure
2.2.1. Reaction Rate with Ozone
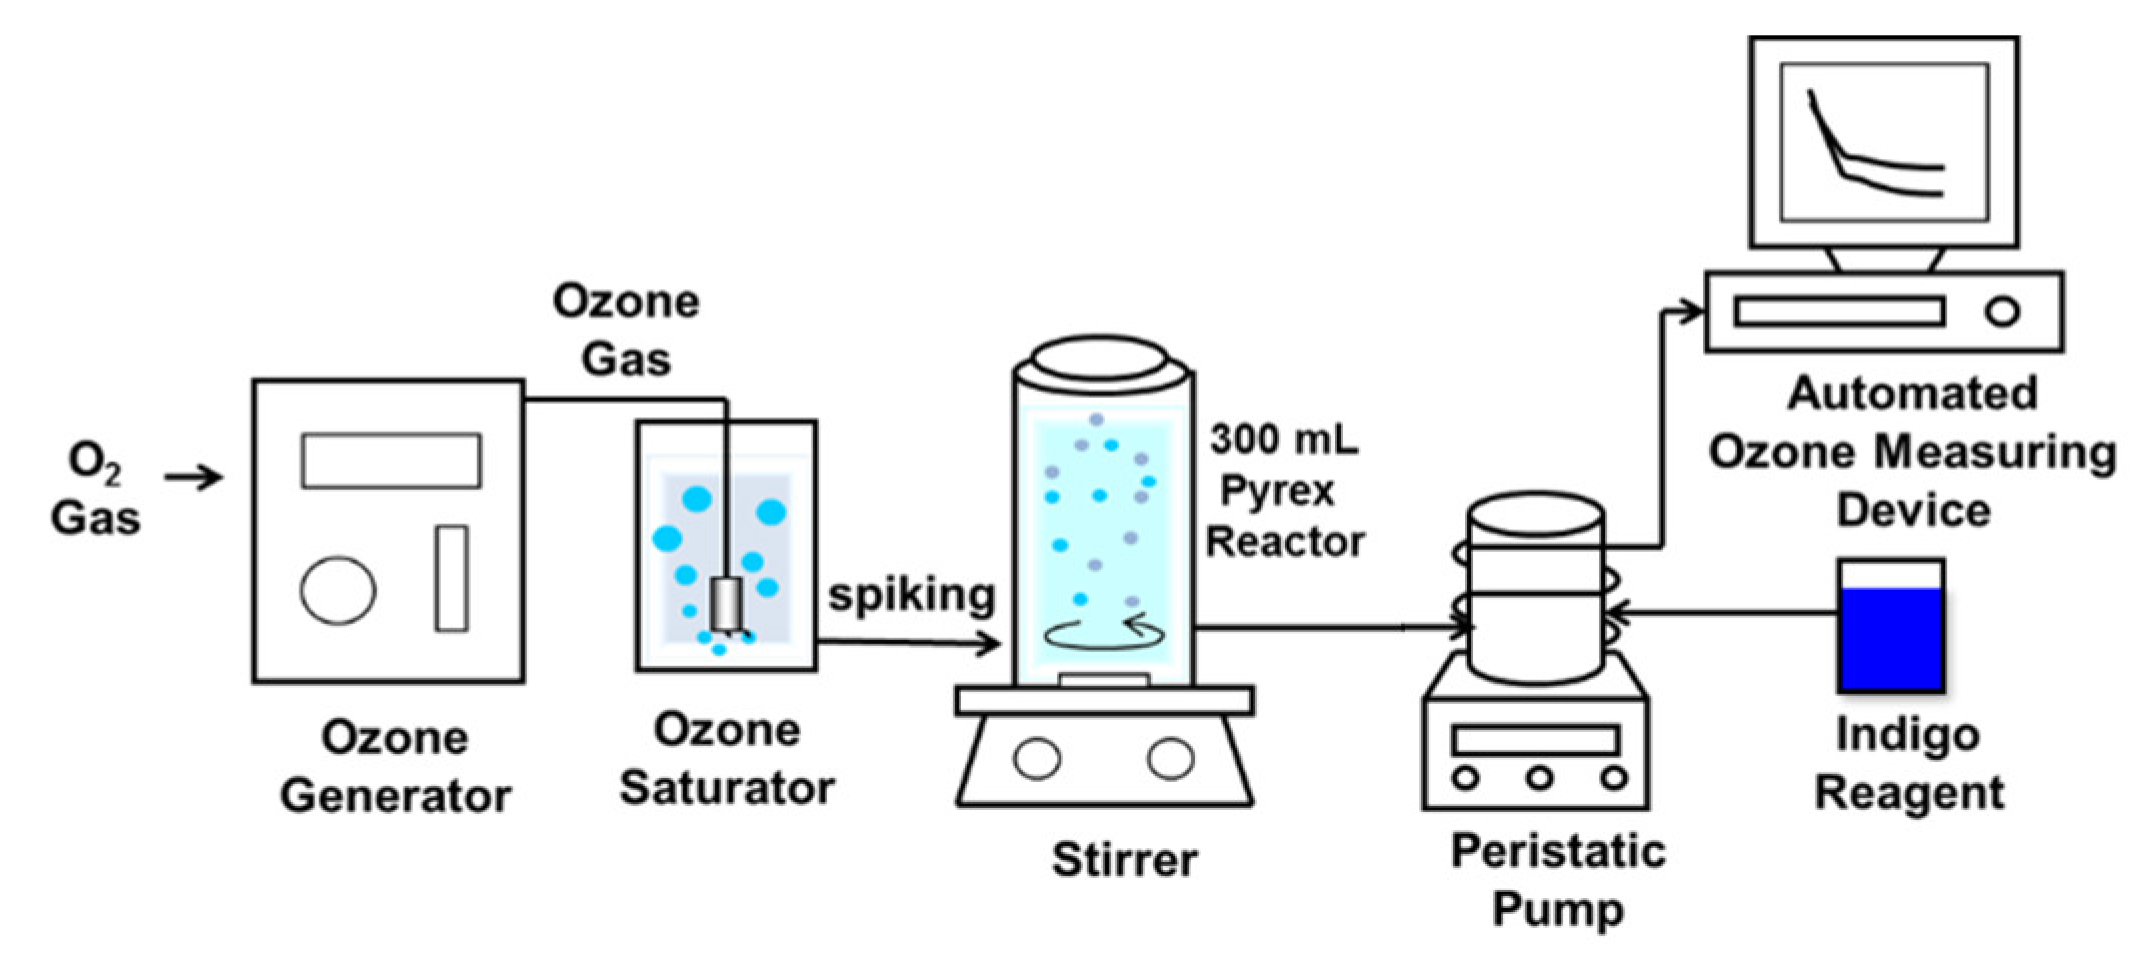
To measure the reaction rates of the target compounds with ozone, ozonation was performed in a 300 mL Pyrex batch reactor at 20.0 ± 0.5 °C. Figure 1 shows a schematic diagram of the overall experimental system for ozonation. A saturated ozone stock solution (60–70 mg/L) was injected into the reactor to achieve the target ozone concentration. The reaction rates of FF and OA with ozone were measured for pseudo first-order reactions; the ozonation reaction of FF was conducted in the FF- excess condition ([O3]0 = 20 μM, [FF]0 = 200 μM). For the reaction rate of OA, the ozone-excess condition was used with 20 μM of ozone and 1 μM of OA. The pH range was maintained at 3 to 9 using a 10 mM phosphate buffer solution. To ignore the effect of hydroxyl radical (•OH) generated during ozonation, on the reaction rate measurements, an excess concentration of t-BuOH (10 mM) was used as a scavenger of •OH (k•OH,t-BuOH = 6.0 × 10⁸ M−1s−1) [19]. The species-specific rate constants were determined by a nonlinear least-squares regression of the experimental value of the apparent rate constant at each pH, for ozonation, using the statistical package for the social sciences (SPSS).
2.2.2. Reaction Rate with Bromine
The bromination reactions of FF and OA were conducted under pseudo first-order conditions of excess bromine concentration. The excess concentration of bromine used was vastly different for measuring the reaction rates of FF and OA with bromine (For FF, [FF]0 = 1 μM and [Bromine]0 = 5000 μM, and for OA, [OA]0 = 1 μM and [Bromine]0 = 20, 50, and 100 μM). At the end of the reaction, sodium thiosulfate (Na2S2O3) was used as a quencher to remove free Bromine. Subsequently, 10 mM phosphate buffer was used to maintain the pH at a range of 3 to 10. Using the experimental values of the reaction rates at various pH values, the SPSS was used to determine the species-specific rate constants.
2.3. Analytical Method
The ozone concentration was determined using the indigo method [20]. Ozone decolorizes the indigo solution, and the decolorization level was measured using a spectrophotometer at 600 nm. Bromine was measured using the N,N-diethyl-p-phenylenediamine colorimetric method at 530 nm, as Br2 (HACH, USA). The target antibiotics, FF and OA, were analyzed using high-performance liquid chromatography (HPLC; Agilent Inc., USA) with a reverse-phase column (XBridge C18 5.0 μm, 4.6 mm 250 mm, 5 μm particle size), and a UV/VIS wavelength detector (used at 225 and 270 nm for FF and OA, respectively). The mobile phase of FF was 75% (volume/volume) 5 mM phosphoric acid, and 25% (volume/volume) methanol. Analysis for OA revealed that the mobile phase was 80% (volume/volume) 10 mM phosphoric acid and 20% (volume/volume) methanol.
2.4. Removal of Antibiotics from Bromide Containing Water
To verify the reaction rate constants of FF and OA obtained, the predicted value of removal efficiency was compared with the experimental results. Ozonation tests for FF and OA were performed in water containing synthetic bromide. This was prepared by adding 60 mg/L of bromide ion maintained at pH 8 using phosphate buffer, to deionized water prepared using Easypure II (Thermo Fisher Scientific, Waltham, MA, USA). The two antibiotics, FF and OA, were injected into the synthetic water at concentrations of 1 μM.
3. Results and Discussion
3.1. Determination of Ozone Rate Constants for the Selected Antibiotics
Kinetics of both FF and OA ozonation indicate second-order reactions of the oxidant (ozone or bromine) and target compound, as shown in Equation (2) and (3).
where the terms [Antibiotic]t, and [Ozone]t represent the total concentrations of the selected pharmaceuticals FF and OA, and ozone (i.e., sum of the concentrations of the different species present in the solution), respectively, and kapp is the apparent second-order rate constant. When [Ozone]t is in significant excess with respect to [Antibiotic]t, a pseudo-first-order rate constant kobs can be introduced, which is equal to kapp[Ozone]t. The second part of Equation (3) can be integrated to yield Equation (4) as follows.
This rate constant typically shows a pH dependence that can be explained by the presence of several species of both the oxidant and antibiotics in the aqueous solution. To determine the species-specific rate constants of FF and OA with ozone, ozonation at various pH conditions ranging from pH 3 to 9, were carried out. The apparent rate constant at each pH value was determined for the pseudo first-order reaction, using the ozone exposure method.
The target antibiotics assume only a single pKa value each in this study. The pKa values for FF and OA are 9 and 6.8, respectively. Considering the chemical characteristics of these antibiotics, the species of FF and OA can be expected to be either neutral or anionic (PhH, Ph−). Thus, two species can be formed as shown in Equations (5) and (6) below:
The two species of antibiotics react with ozone according to Equations (7) and (8).
Hence, the removal of antibiotics can be expressed by Equation (9) below. Considering the equilibrium of the dissociation reactions of FF and OA, the apparent second-order rate constant kapp for FF and OA are given by Equation (10).
where, , , .
The kinetic model represented by Equation (10) allows the determination of the intrinsic rate constants k1 and k2 for the elementary reactions of each pharmaceutical species with each oxidant species.
Because the reaction of FF with ozone presented intermediate or slow reactions in the pre-test phase of FF removal by ozone, the measuring rate constant, kapp, for FF was determined under the pseudo first-order condition with FF in excess ([FF]t >> [O3]t). In general, rate constants for ozonation depend on the speciation of the antibiotic compounds. The ease with which ozone reacts with a molecule will be determined by the structural and chemical properties of the molecule. Being an oxidizing agent, ozone is highly electrophilic in nature. Therefore, it is attracted to antibiotic molecules with the highest electron density. With increasing pH value, the decomposition rate constant of FF with ozone increases. Because the pKa value of FF is 9, FF has a neutral form at pH values lower than 9 and has an ionized form at pH values higher than 9. Therefore, the rate constants for the reaction of FF and OA with ozone increase with the pH value.
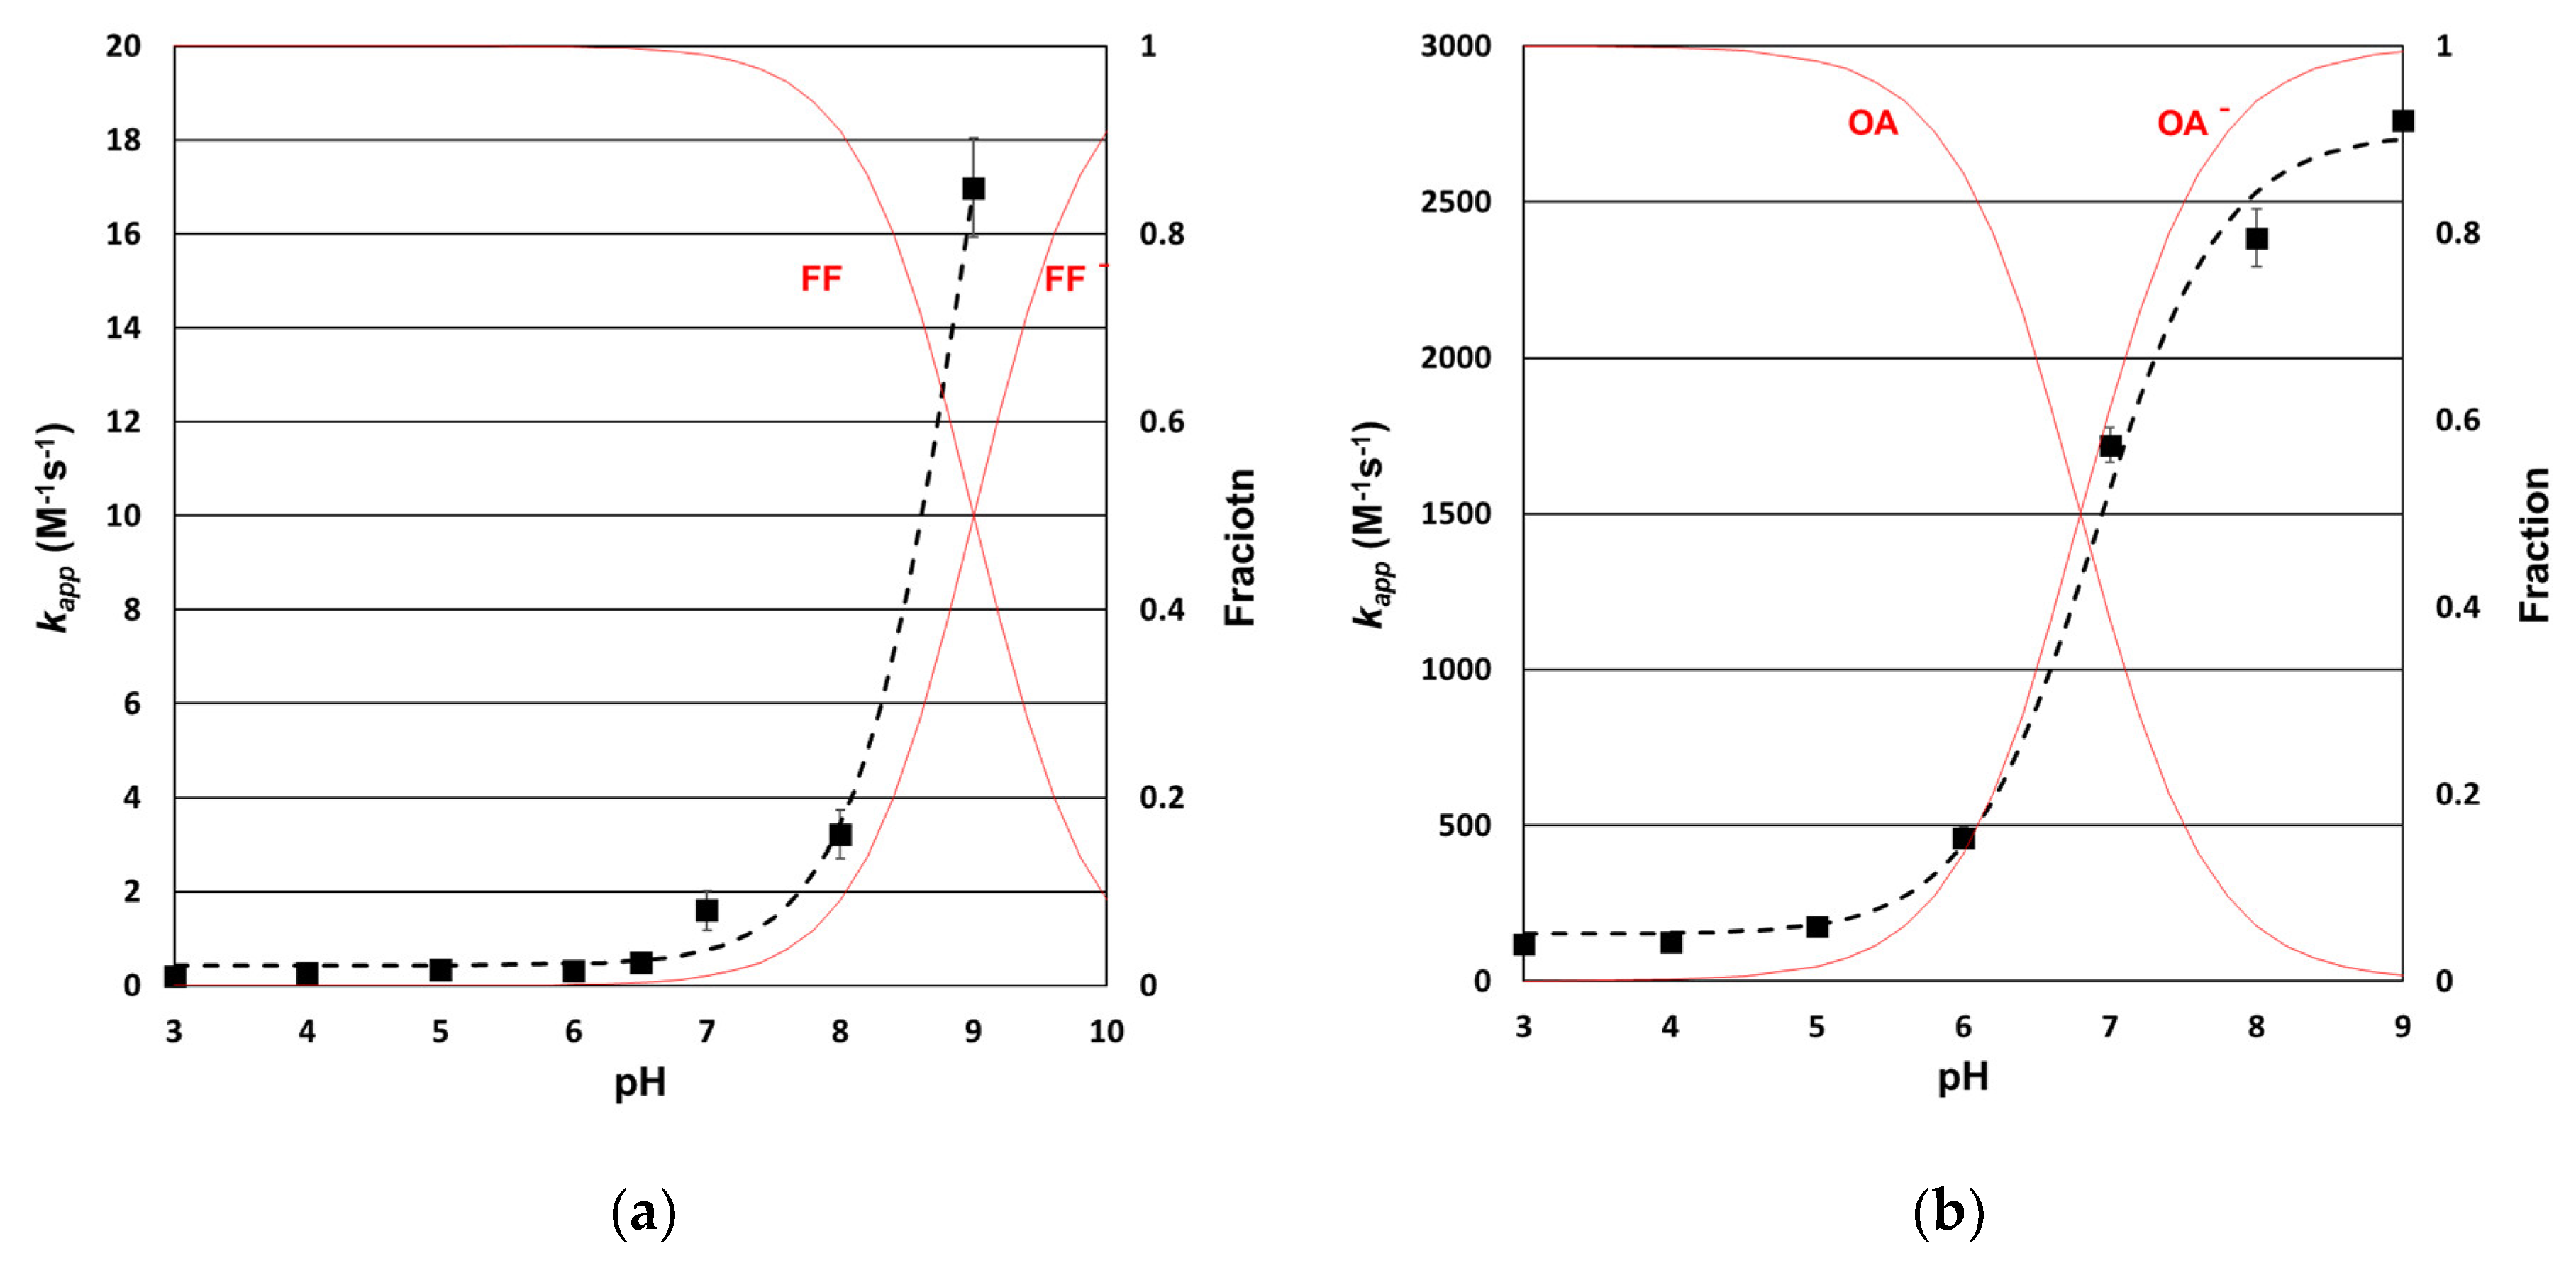
The experimental and calculated values for the apparent rate constants for the ozonation of FF are shown in Figure 2a. The apparent rate constant for the second-order equation, was determined by the pseudo first-order method in the pH range 3–9. The red solid line represents the speciation of FF. The experimental values and calculated values matched well. From the calculated values, the species-specific rate constants k1 and k2 were determined. k1 and k2 were determined as 0.43 M−1s−1 and 33.5 M−1s−1, respectively. k1 represents the neutral form of the reaction of FF with ozone and k2 represents the ionized form of the reaction of FF with ozone. The k2 value is approximately 80 times higher than the k1 value. That is, the ionized form of FF reacts with ozone faster than the neutral form of FF, because deprotonated species react faster with the electrophilic ozone.
To determine the rate constant for the reaction of OA with ozone, the ozone exposure method was used. This method is necessary to measure the ozone decomposition, and the data were evaluated by plotting ln ([OA]/[OA]0) versus ozone exposure. Figure 2b shows the reaction rate of OA with ozone, where ozonation experiments at different pH values from 3 to 8 were performed using the ozone exposure method. The slope of the represents the rate constant for the reaction of OA with ozone. In the case of OA, the apparent second-order rate constant was determined by the ozone exposure method conducted at a pH range of 3–9. The determined apparent rate constants for the reaction between ozone and OA are fitted with respect to their dependence on pH, in Figure 2b. Like FF, the species-specific rate constant of OA was also determined by the nonlinear least-squares regression of the experimental value of the apparent rate constant at each pH, for ozonation. The experimental values and calculated values (dotted line) agree well. Further, the red solid line represents the speciation of OA. The species-specific rate constants k1 and k2 were determined to be 120 M−1s−1 and 2700 M−1s−1, respectively. k1 represents the neutral form of the reaction of OA with ozone, and k2 represents the ionized form of the reaction of OA with ozone.
3.2. Determination of Bromine Rate Constants for the Selected Antibiotics
The second-order rate constant of FF for reaction with bromine was determined using the pseudo first-order method, in the bromine-excess condition. The concentration of bromine was 3 mM for pH 3 to 6, and 5 mM for pH 7 to 9 with the pH adjusted using a 0.2 M phosphate buffer. The rate constant of FF for reaction with bromine was similar for different concentrations of bromine at the same pH value (Table 2).
The species-specific rate constants for reaction of FF or OA with bromine were determined at various pH ranges. The apparent rate constants were determined based on Equations (11)–(16) with KHOBr = 10–8.8, KFF = 10–9, and KOA = 10–6.8.
The removal of FF and OA through bromination reactions corresponding to rate constants k1, k2, k3, and k4, can be expressed by Equation (17).
From Equations (11)–(16), the apparent second-order rate constant kapp for FF and OA, considering the equilibrium of the dissociation reactions of FF and OA, is derived, as given by Equation (18):
where, , , , , , and .
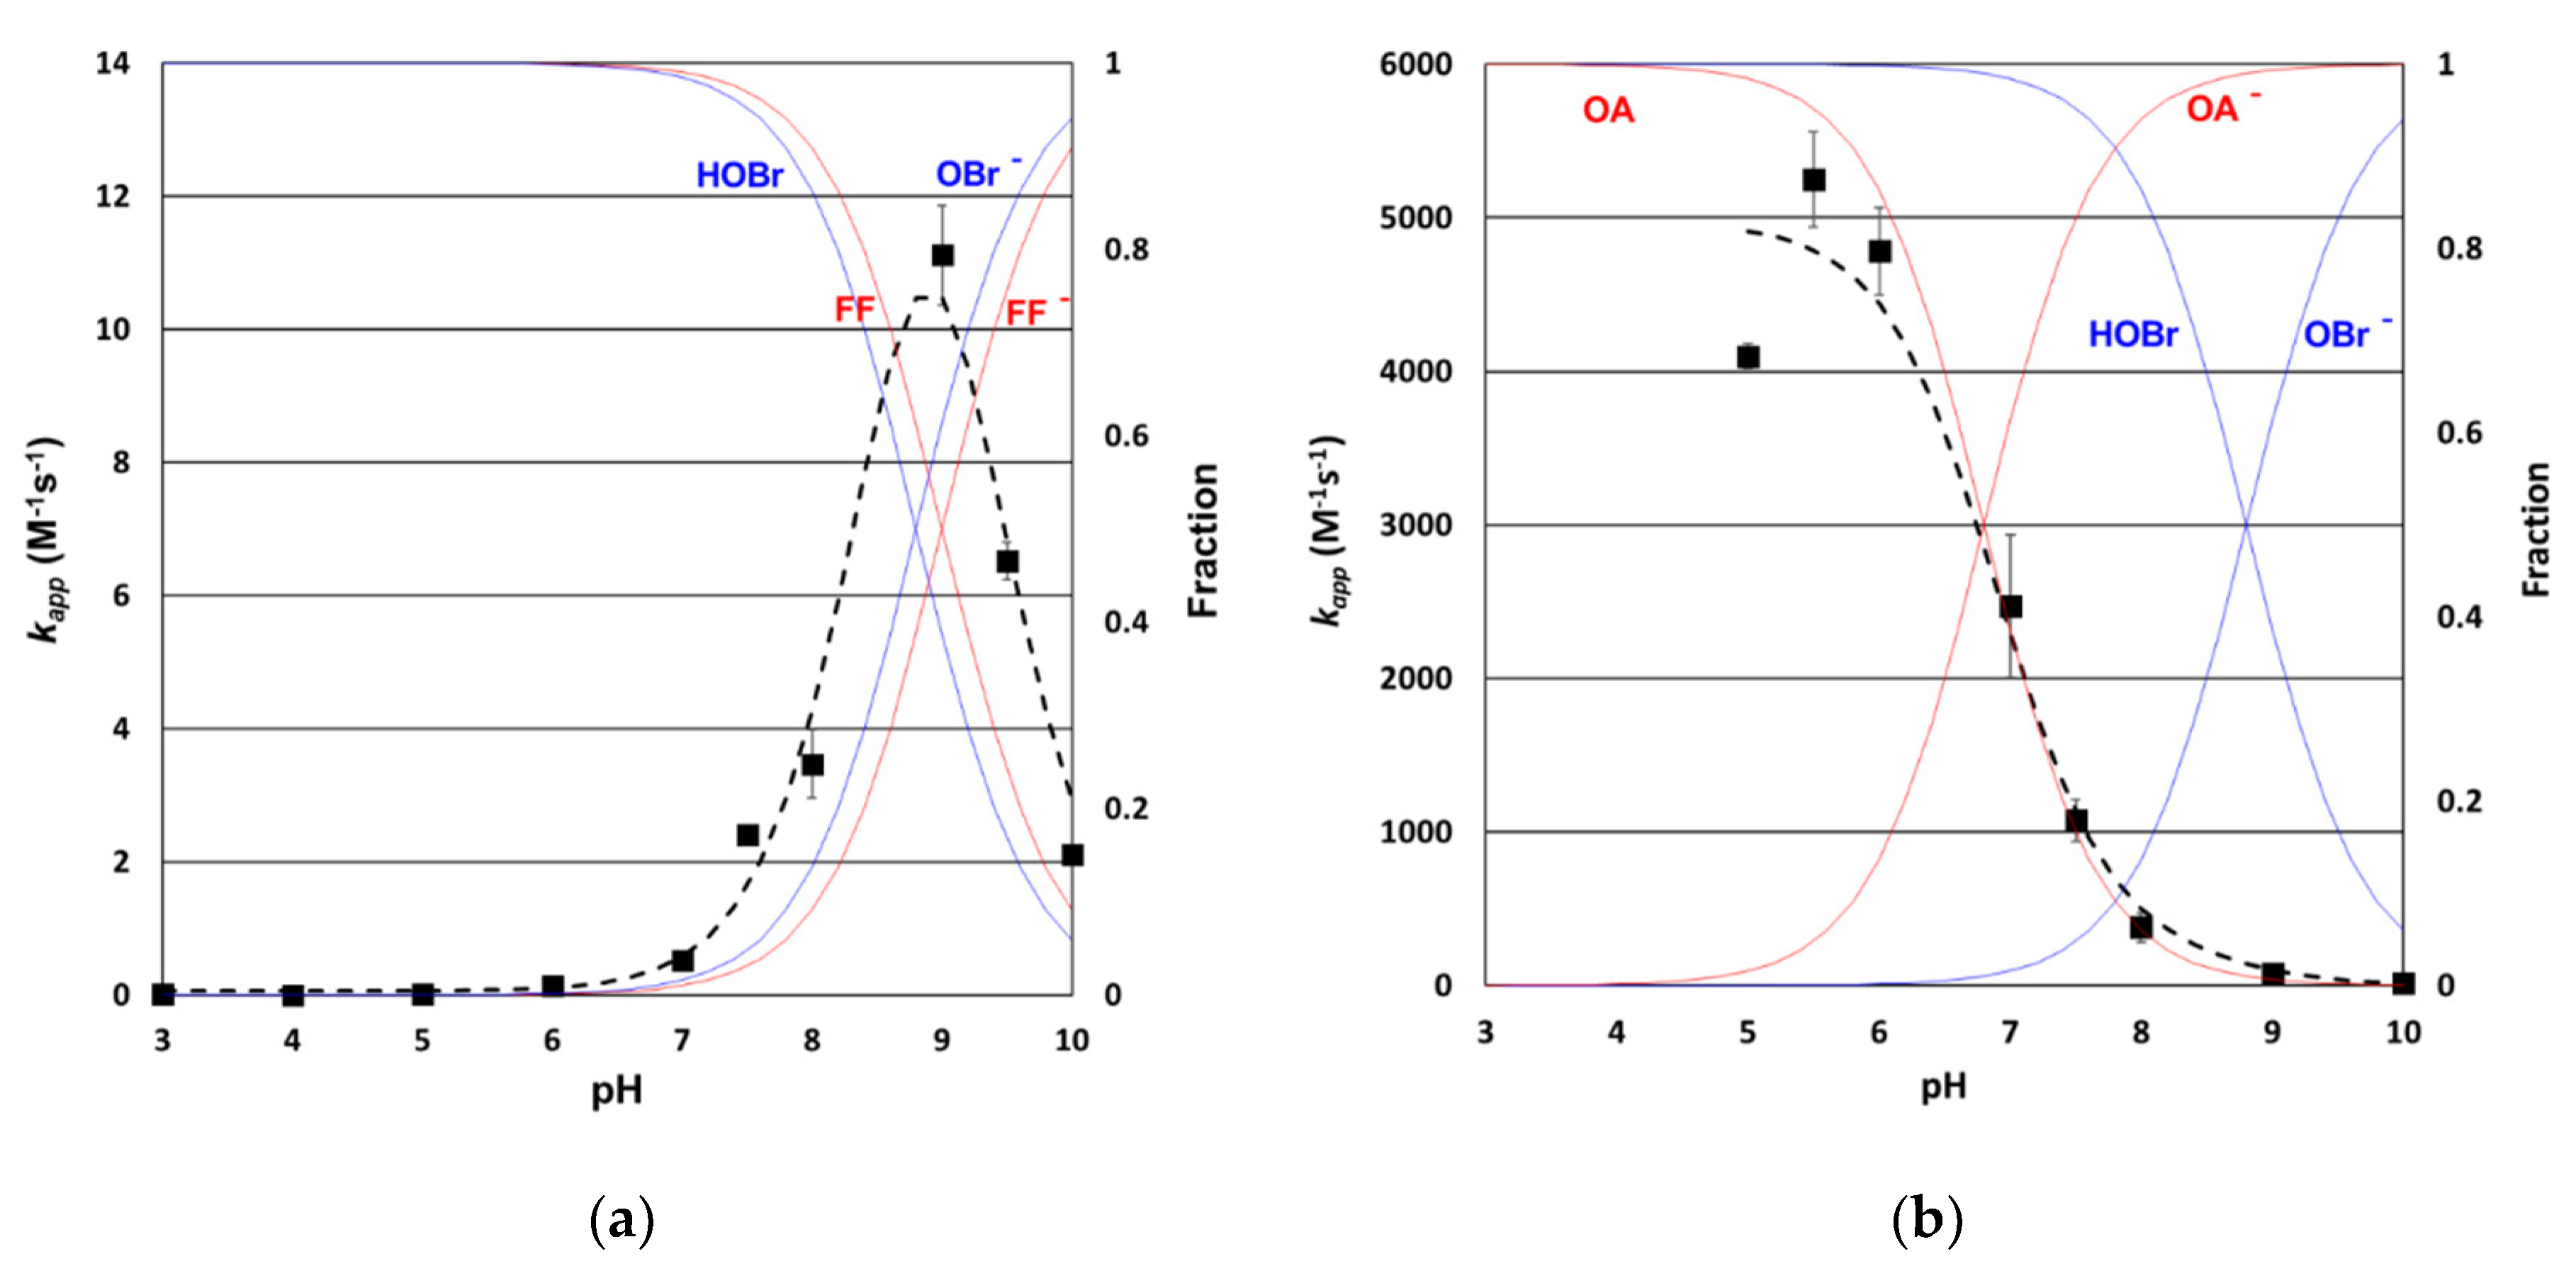
The species-specific rate constants were determined by a nonlinear least-squares regression of the experimental value of the apparent rate constant at each pH for the bromination process. The experimental and calculated values for the apparent rate constants for different values of pH in the range 3–10, for the bromination of FF are shown in Figure 3a. The symbols represent the experimental values while the dotted line represents the calculated values of the apparent rate constant; the solid line represents the speciation of FF and bromine. The experimental values and calculated values matched well. The species-specific rate constants k1, k2, and k3, were obtained as 0.055 M−1s−1, 15.4 M−1s−1, and 24.4 M−1s−1, respectively, and k4 was observed to be negligible.
From Table 1, FF includes an aromatic compound that has a high second-order rate constant for reaction with bromine. However, FF itself has a relatively low rate constant for reaction with bromine because the aromatic ring is deactivated or only slightly activated during bromination, which is characterized by a low reactivity with HOBr. In the case of OA, the apparent second-order rate constant was determined by the pseudo first-order method, for pH values between 5 and 10. The determined apparent rate constants for the reaction between bromine and OA are fitted as a function of pH in Figure 3b. The experimental values and calculated values matched well. The solid line depicts the speciation of bromine and OA. The value of the species-specific rate constant was determined to be 5000 M−1s−1 for k1, which indicates the reaction of a neutral form of OA with bromine, and 290 M−1s−1 for k2, which indicates the reaction of an ionized form of OA reaction with bromine.
3.3. Prediction of Antibiotics Removal Efficiency in Absence of Br—In Synthetic Water
Seawater contains approximately 18,000 mg/L chloride ions and 60 mg/L bromide ions. As mentioned in the introduction, the primary oxidant in seawater ozonation is bromine (HOBr/OBr−), and not ozone, even with this high concentration of chloride ion in seawater. The reaction rate of ozone with bromide ion (160 M−1s−1) is 53,000 times higher than that with chloride ion (kOzone,Cl− = 0.003 M−1s−1). Even though chlorine is generated by the reaction of chloride ion with ozone, the chlorine reacts with bromide ion to generate bromine (2950 M−1s−1). In fact, bromine is the primary oxidant along with trace ozone, for seawater ozonation.
The removal efficiency for the target antibiotics, FF and OA, by seawater ozonation was predicted using the reaction rate constants for the reaction of FF and OA with ozone and bromine determined from this study. To verify the value predicted using the calculated reaction rate, the removal efficiencies of FF and OA from synthetic seawater were evaluated; synthetic sea water was used owing to the difficulties of analysis under real seawater condition. Synthetic seawater was prepared using bromide ions of concentration 60 mg/L, at pH 8, without chloride ions. In this test, the effects of ozone and bromine were considered only with respect to their role in antibiotic removal. The ozone decomposition and bromine formation were measured and compared with the predicted values. Subsequently, the actual removal efficiencies for the target antibiotics, FF and OA, were compared with the predicted values.
3.3.1. Formation of Bromine in Seawater Ozonation
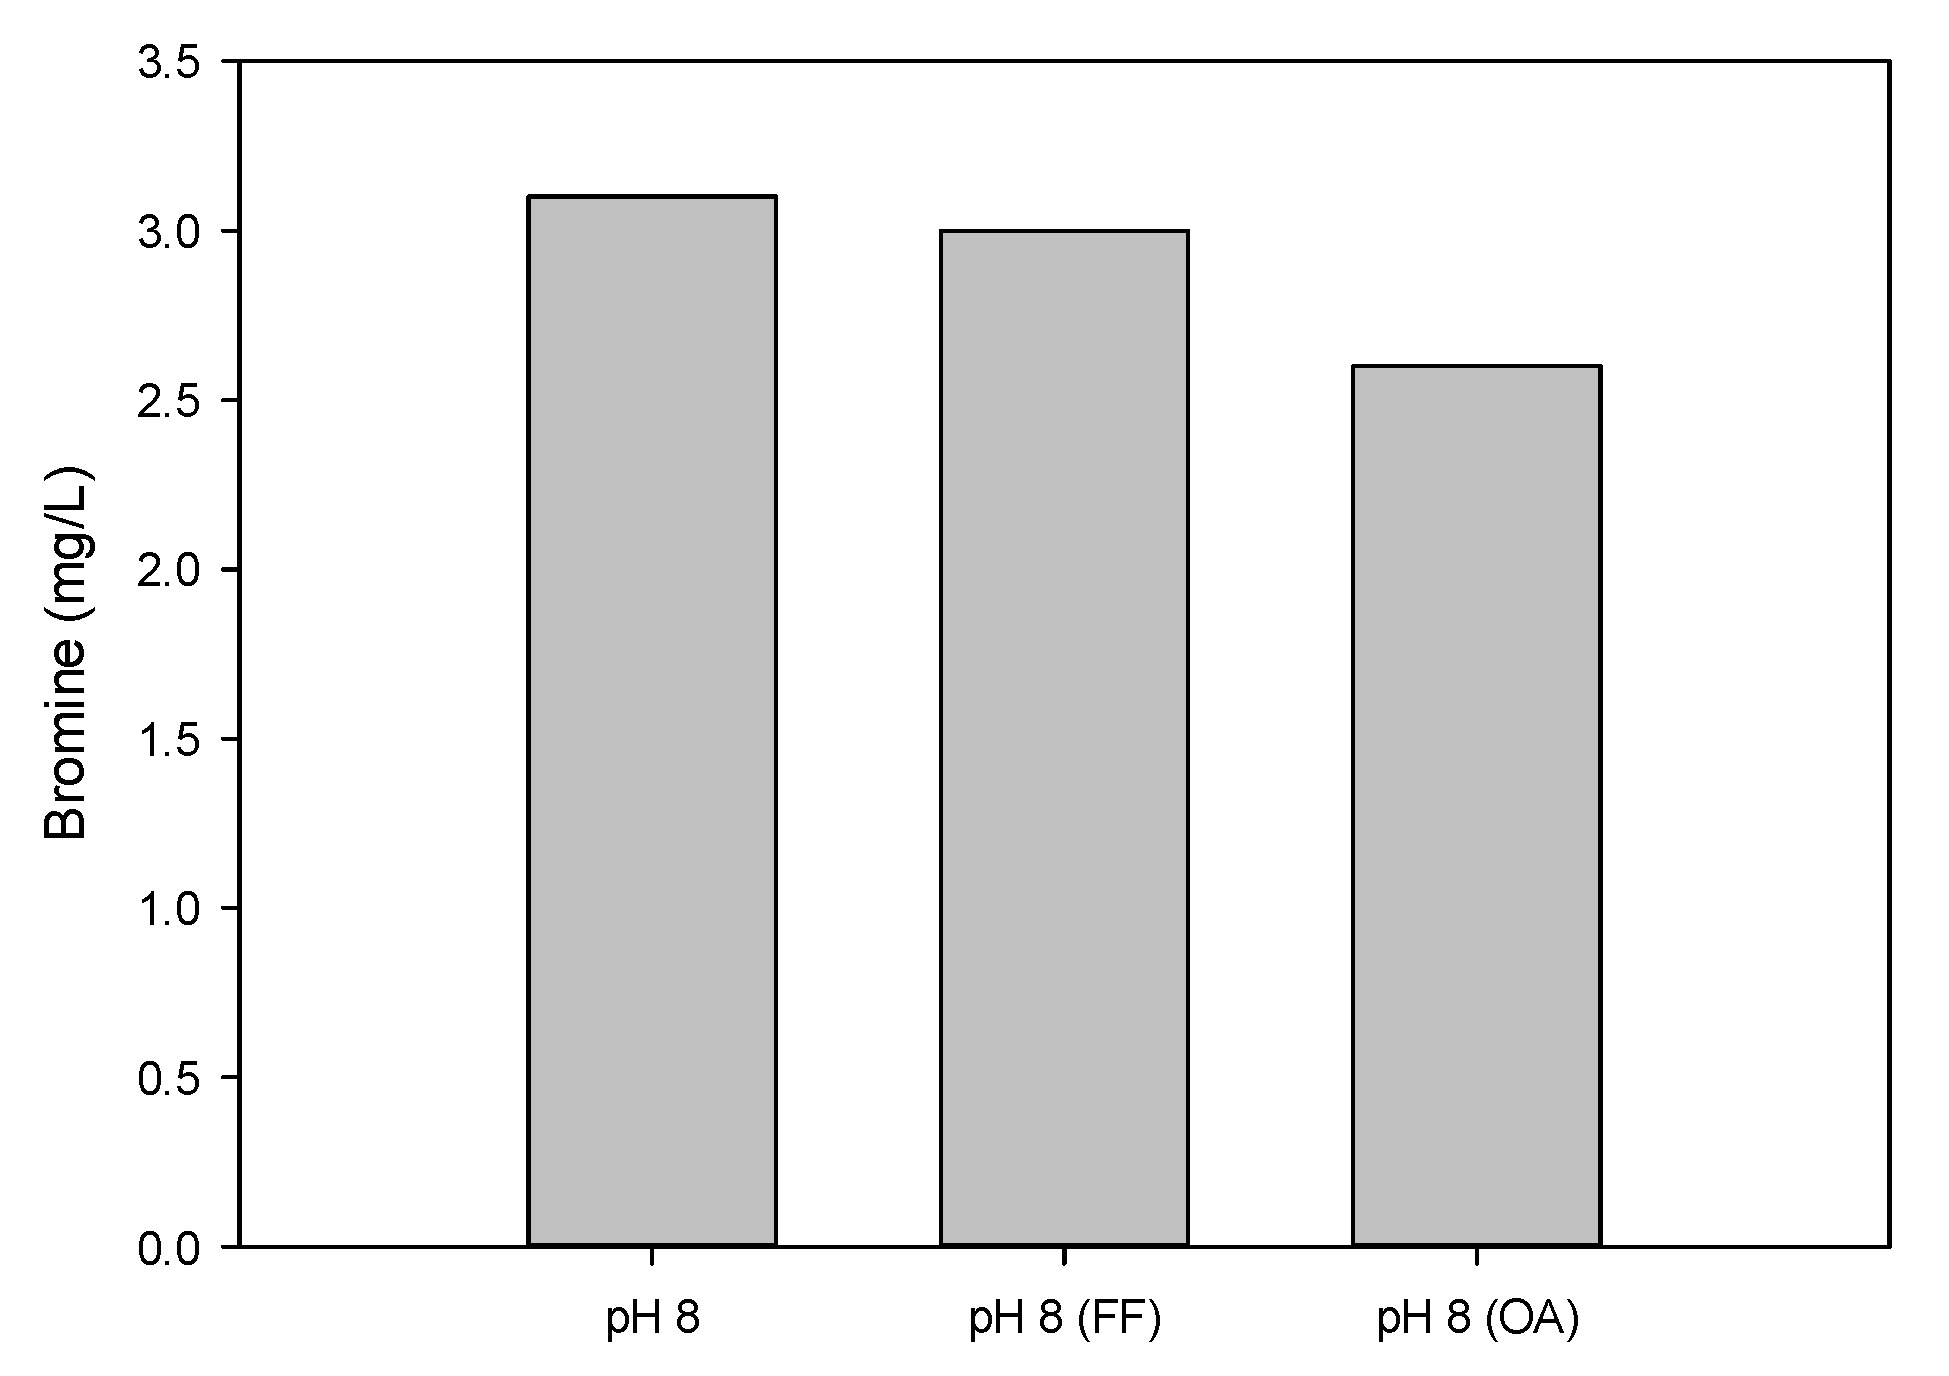
Figure 4 shows the bromine concentration after injecting ozone into synthetic sea water containing bromide ions at pH 8. Reacting ozone with bromide ions in synthetic seawater, 3.1 mg/L of bromine was generated. A previous study [21] predicted ozone decomposition and bromine formation in synthetic seawater. The predicted ozone formation indicated that ozone decomposed rapidly within 20 s, while bromine was generated and became stable after 40 s. The predicted bromine formation of 3.1 mg/L is the same as the experimental value for a dosage of 1 mg/L ozone into water containing 60 mg/L bromide ions at pH 8.
To assess the effect of antibiotics in water on bromine formation, the bromine formation was evaluated in water containing 1 μM of FF or OA. Table 3 shows the comparison of apparent rate constants at given condition. In the water containing 1 μM FF, 3 mg/L of bromine was generated with 1 mg/L ozone. However, in the water containing 1 μM OA, a lower bromine concentration (2.6 mg/L) was generated compared to that in the pH 8 buffer containing only bromide (3.1 mg/L). This is because the rate constant for the reaction of ozone with OA (2400 M−1s−1) is 15 times that with bromide ion (160 M−1s−1). Because ozone reacted competitively with bromide ion and OA, less bromine was formed in the water containing OA. In the case of FF, the reaction rate between ozone and FF was extremely low at 3.2 M−1s−1. Therefore, the effect of FF is negligible in bromine formation.
3.3.2. Removal of FF and OA by Ozonation and Bromination
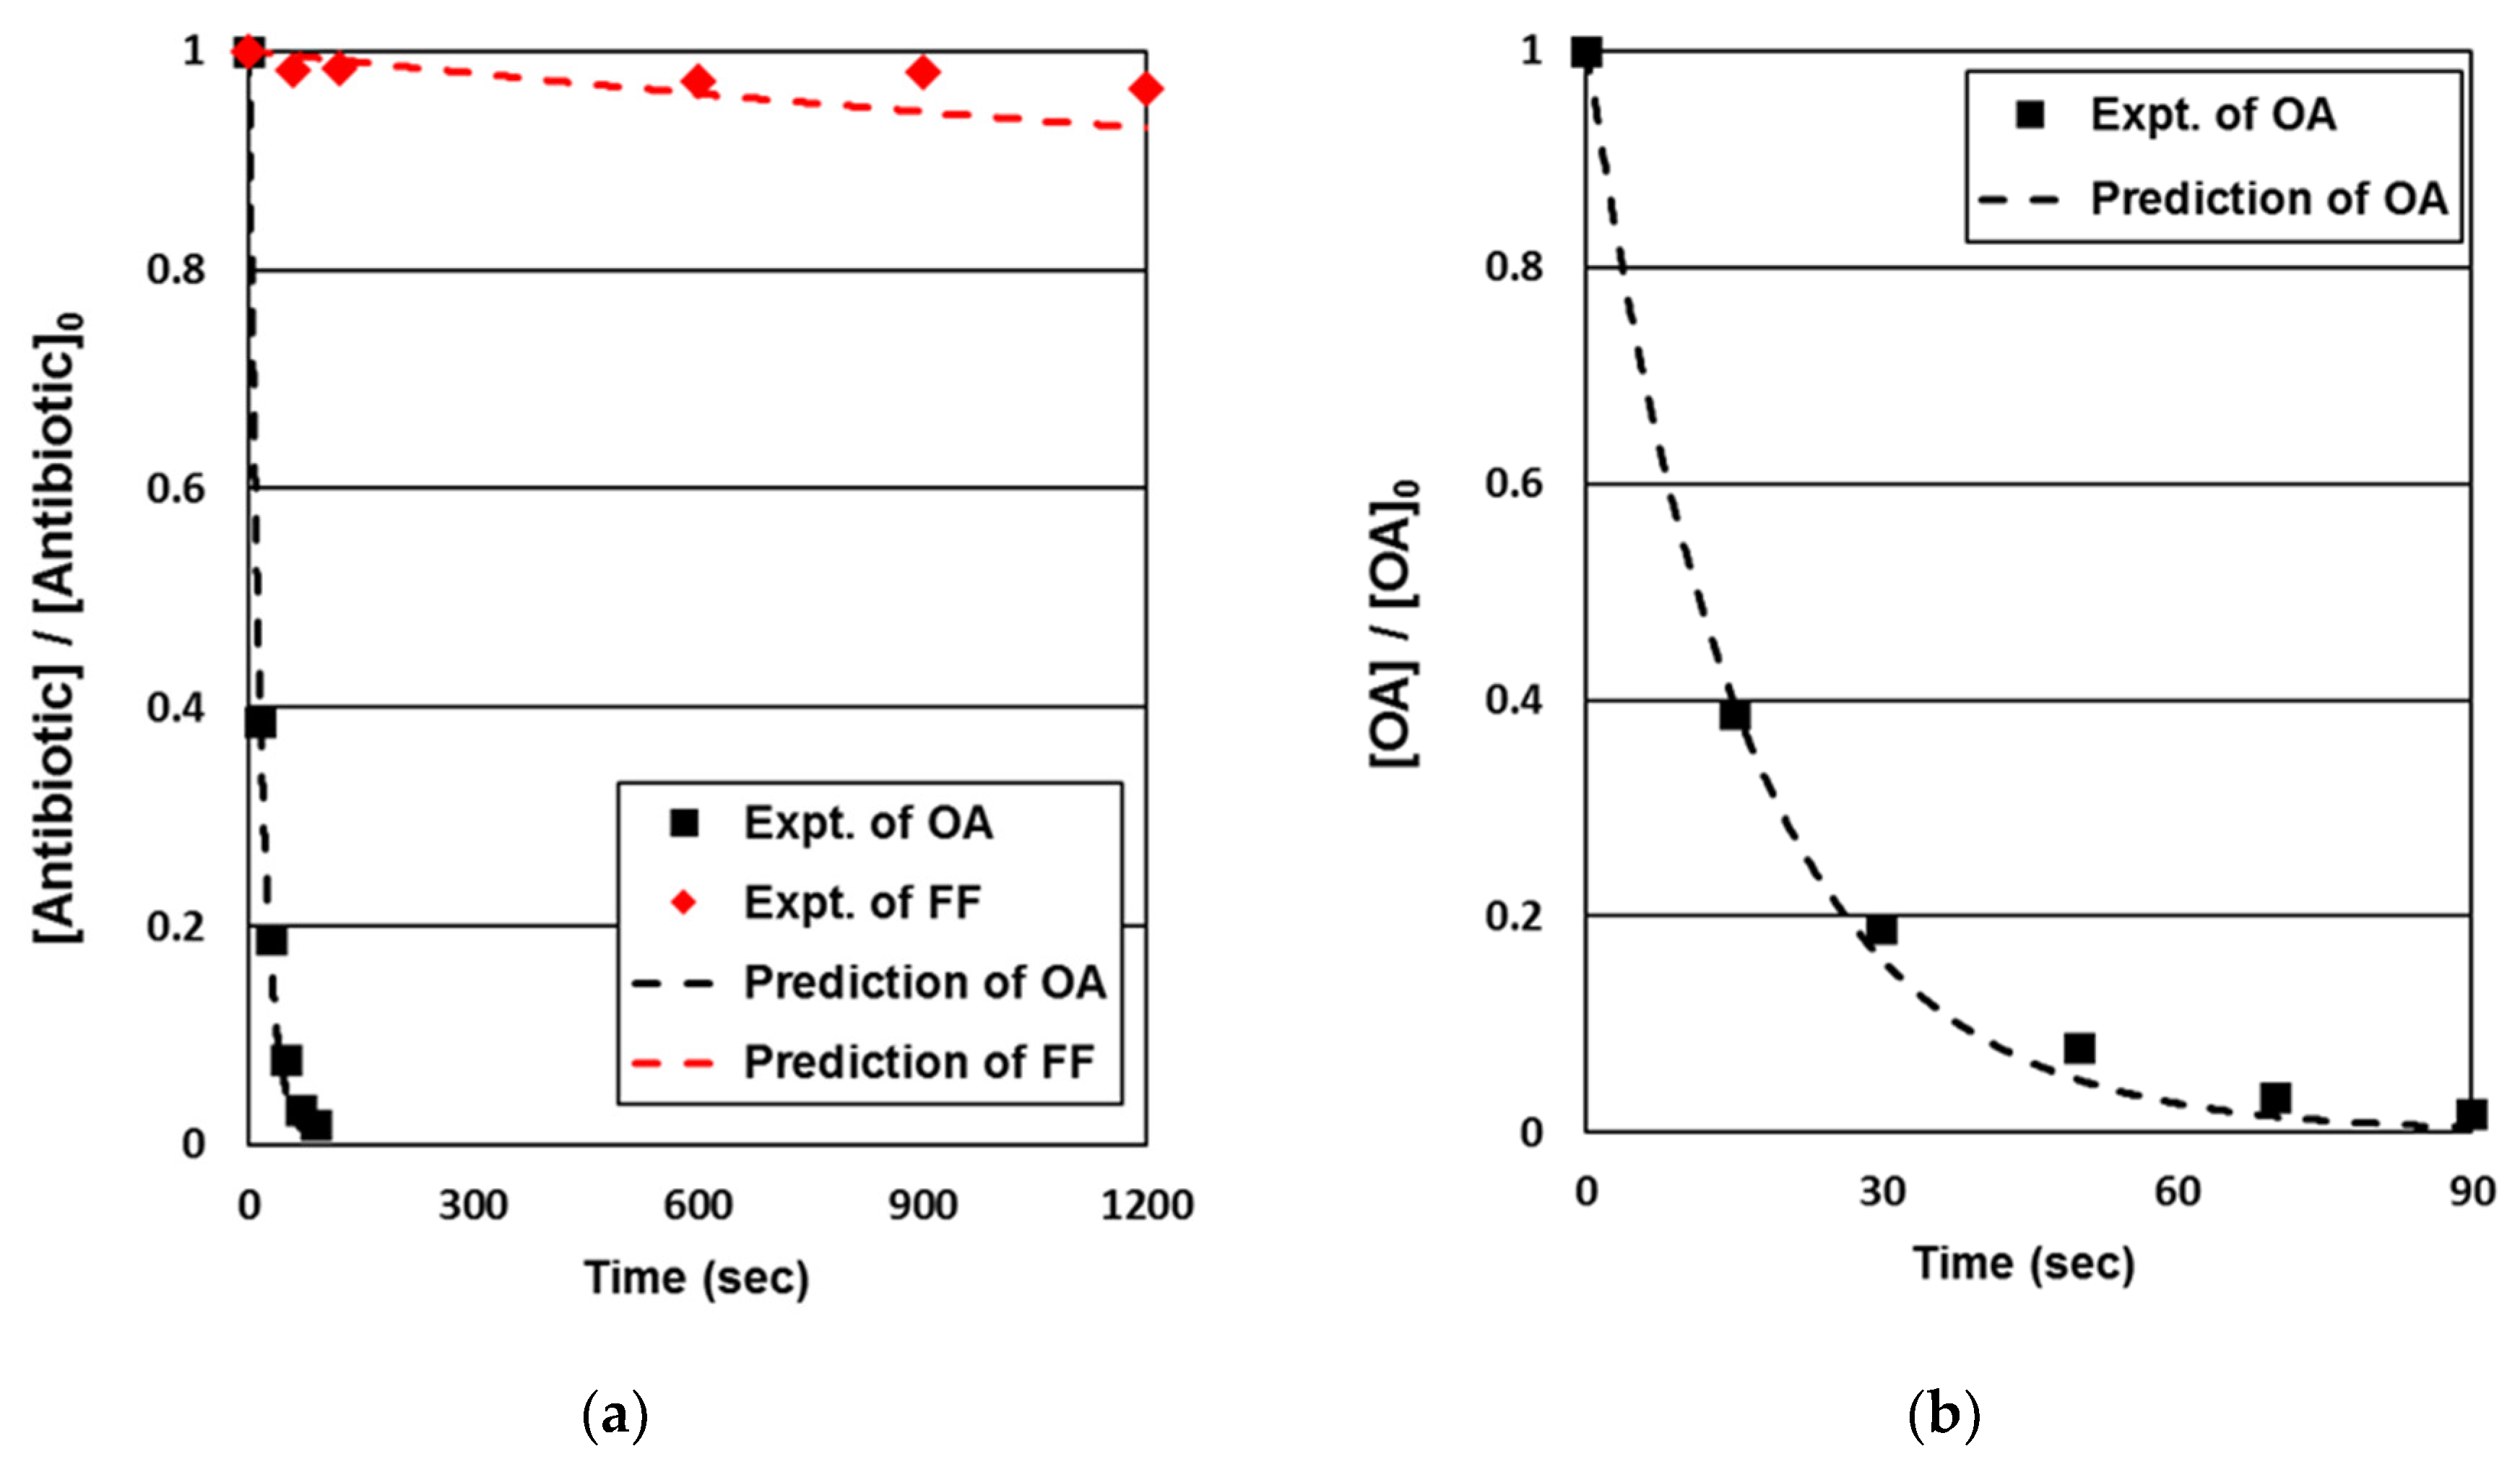
For determining the removal efficiency of antibiotics by ozone only, ozonation was performed in a pH 8 buffer with the target antibiotic, without the presence of bromide ion (Figure 5). Less than 5% FF was removed because the reaction rate of FF with ozone is low, i.e., 3.2 M−1s−1. Thus, the direct removal of FF by ozone is negligible. In the case of OA, however, almost all OA was removed within 90 s by ozonation, owing to the high reaction rate of OA with ozone (2400 M−1s−1). For the removal of OA and FF through ozonation, the experimental values matched well with the predicted values. To assess the effectiveness of antibiotic removal through bromination, 3 mg/L and 2.6 mg/L of bromine were injected into water containing FF and OA, respectively.
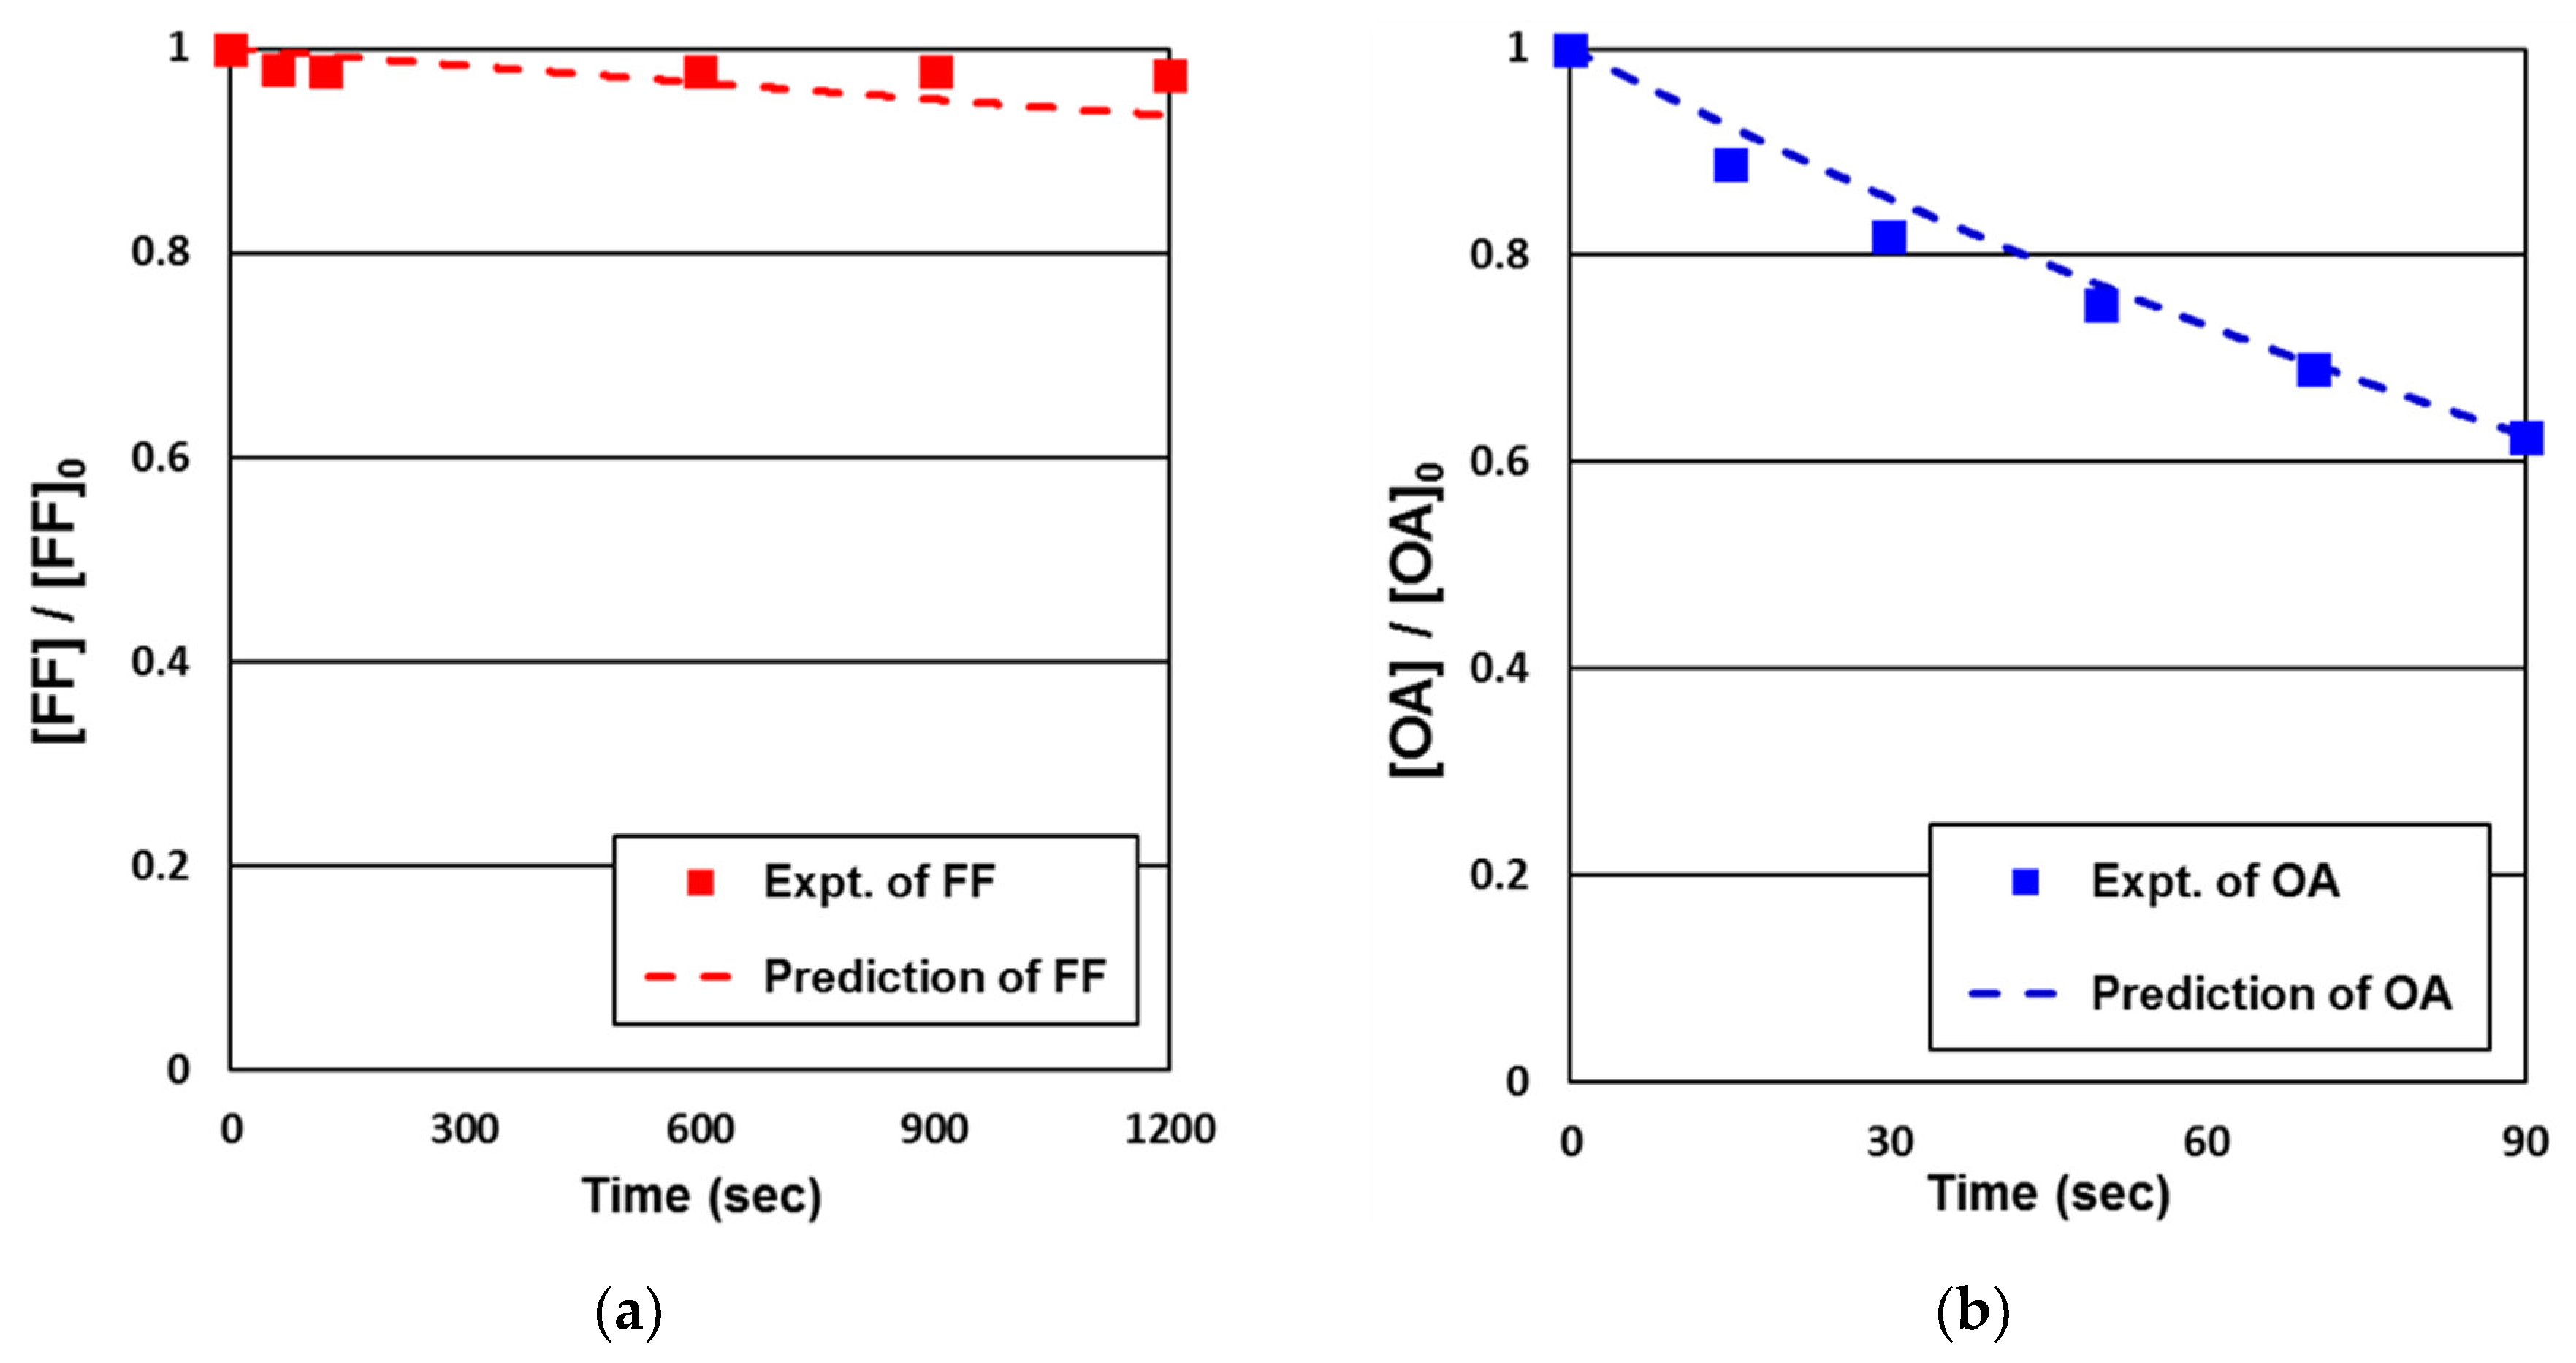
Figure 6 shows the removal of FF and OA by bromination at pH 8. Like the case of ozonation, FF exhibits little removal within 20 min owing to the low reaction rate of FF with bromine (3.5 M−1s−1). However, approximately 40% of OA was removed within 90 s of bromination at 4.0 × 10² M−1s−1. The predictions of FF and OA removal by bromination matched well with the experimental values. The effectiveness of both ozone and bromine for FF and OA removal could be predicted using the reaction rate.
3.4. Removal of FF and OA by Ozonation in Water Containing Br−
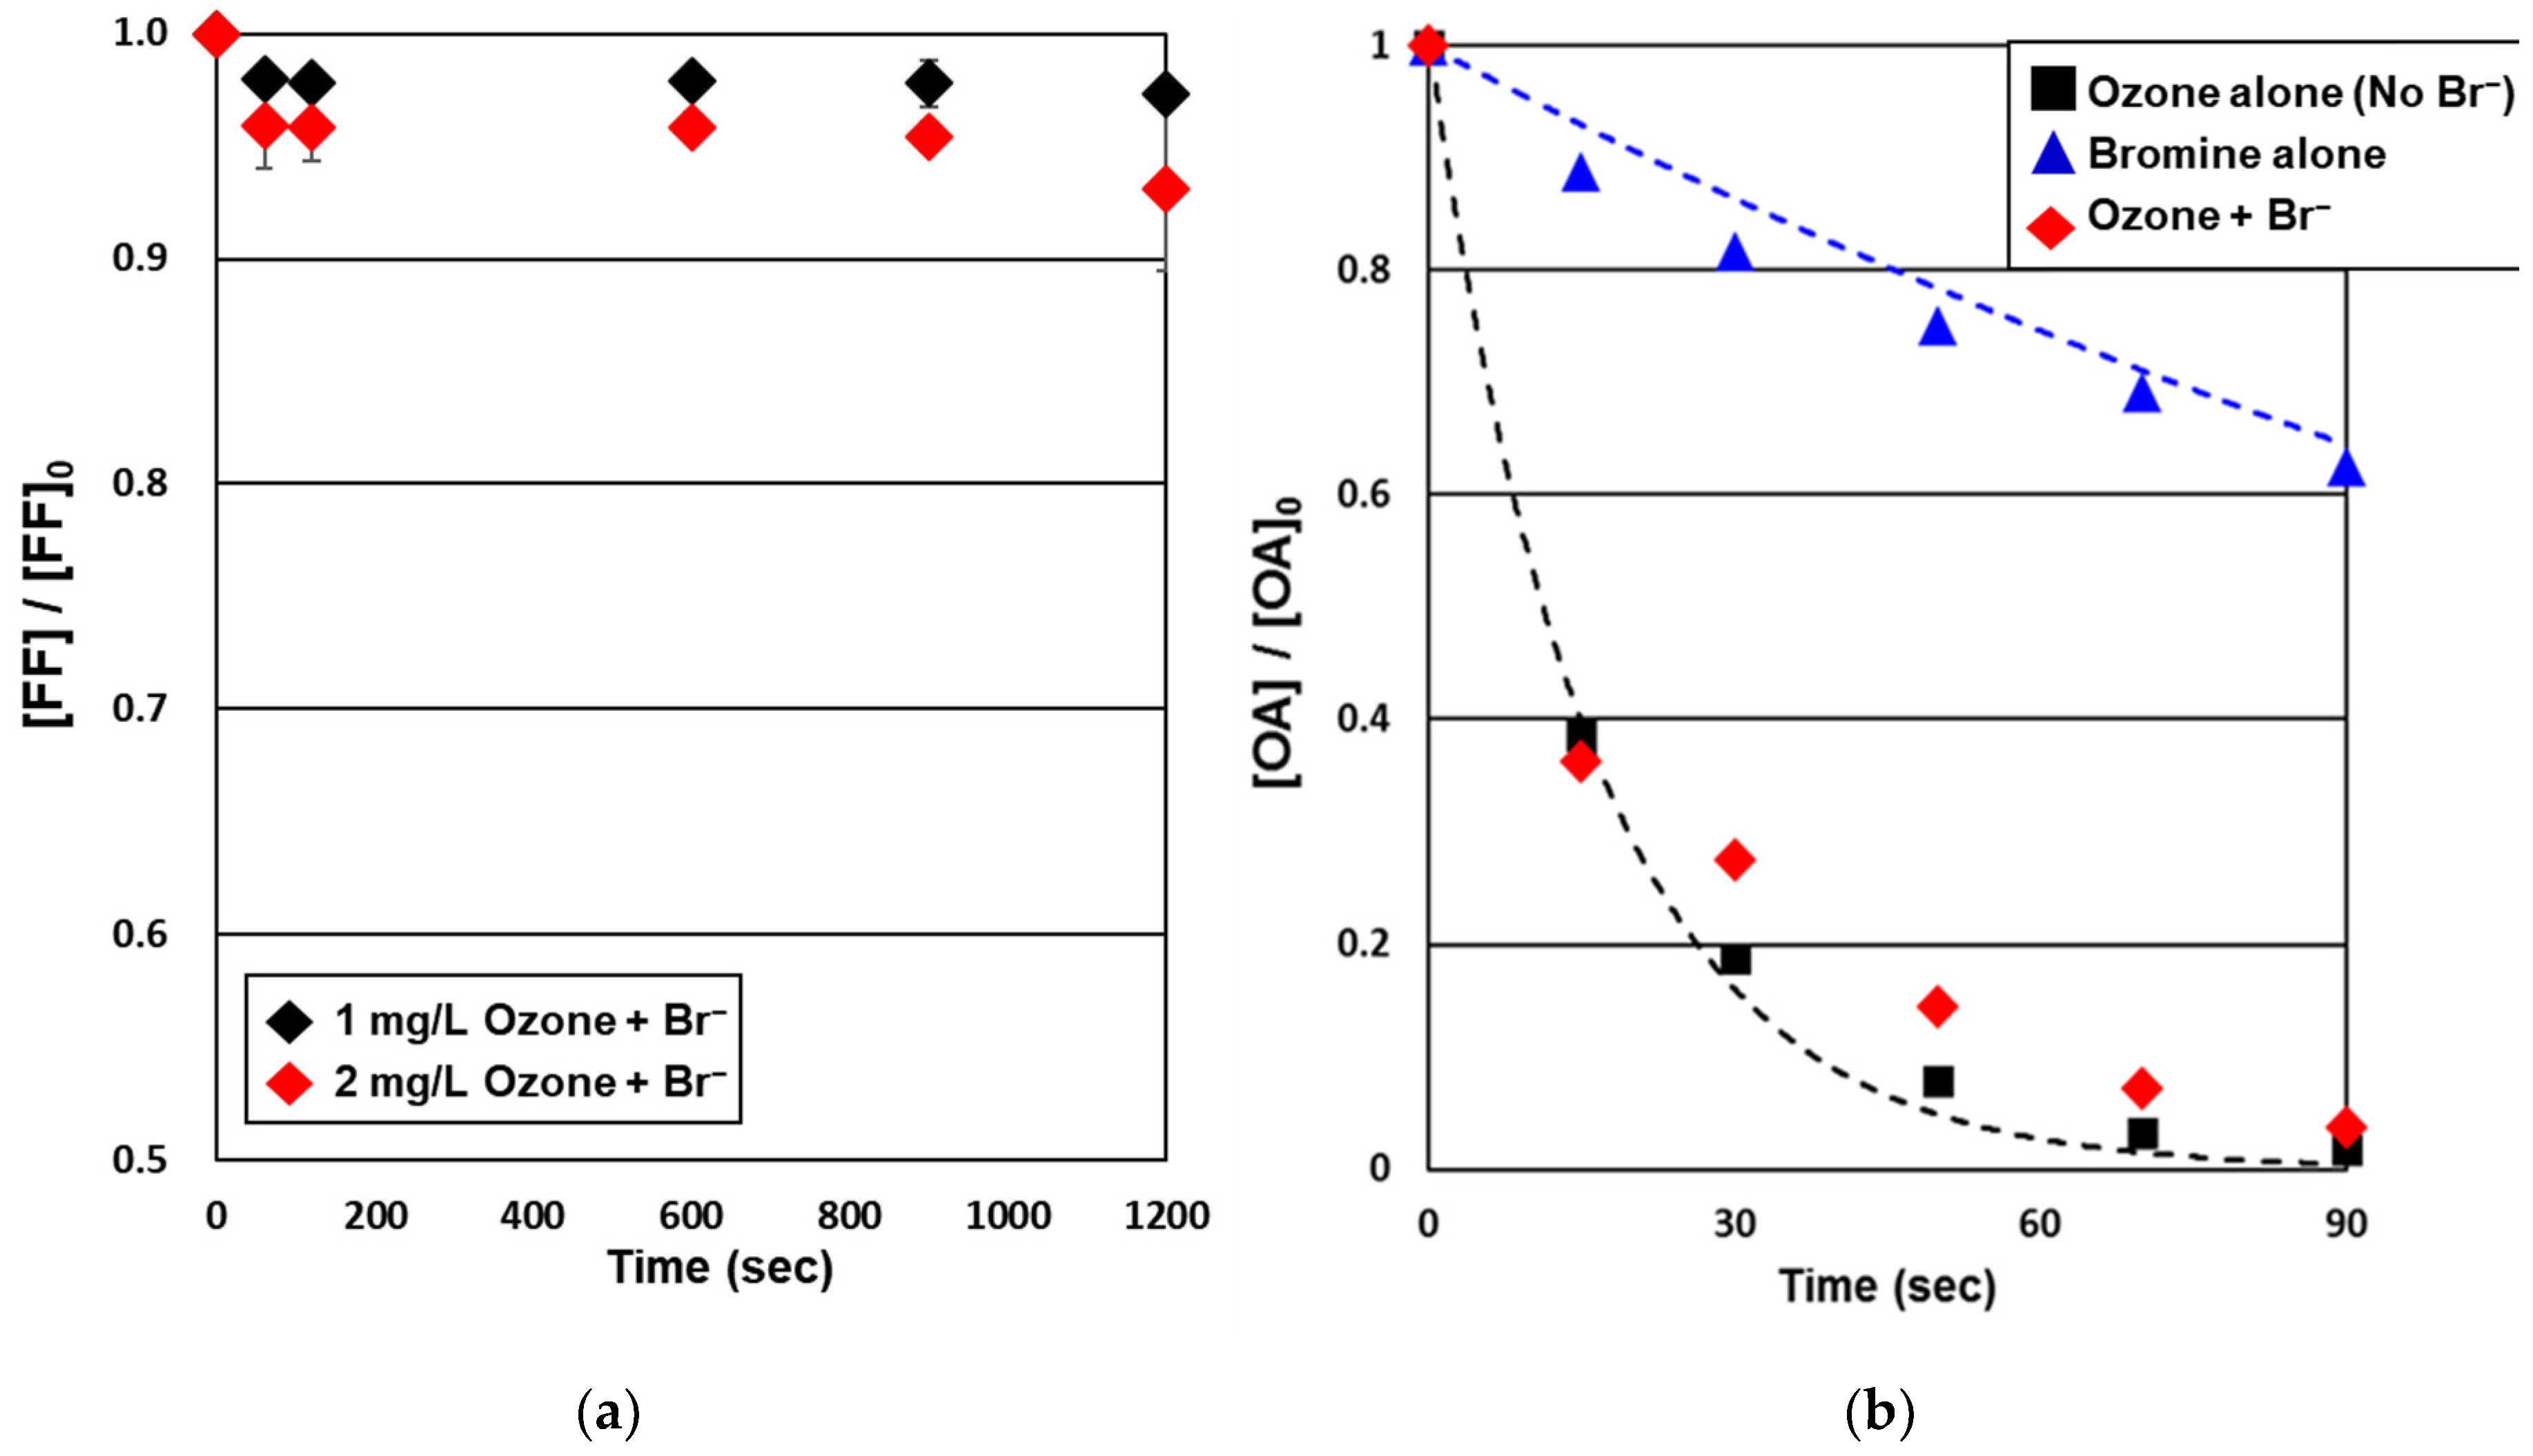
The removal efficiency of FF and OA by ozonation was assessed in water containing 60 mg/L of bromide ion at pH 8. Figure 7a shows the removal of FF with 1 and 2 mg/L of ozone injection. Because of the lower reactivity between FF and the oxidants, ozone, and bromine (kO3,FF = 3.2 M−1s−1 and kBromine,FF = 3.5 M−1s−1), the removal of FF by ozonation in water containing bromide ion was only 4% and 8% within 20 min. In fact, it is difficult to remove FF from seawater by ozonation owing to the lower reactivity of FF with ozone and bromine.
Figure 7 shows the effect of bromide ion on OA removal by ozonation, compared with OA removal in the absence of bromide ion. In the absence of bromide ion, ozone reacted rapidly with OA, and over 99% of OA was removed in 90 s, as shown in Figure 5. However, when bromide ion was present, the removal efficiency of OA was lower than that for ozonation without bromide ion, i.e., less than 10%. OA decreased rapidly within 15 s, and decreased slowly after 15 s. The primary mechanism of OA removal in the first phase of 15 s was trace ozone; subsequently OA was removed by the generated stable bromine. The measured reaction rates of OA with ozone and bromine at pH 8 were as 2.4 × 10³ M−1s−1 and 4.0 × 10² M−1s−1, respectively. These results indicate that trace ozone is more important than bromine for OA removal owing to the reaction rate of ozone being the six times that of bromine. As mentioned in the introduction, both chlorine and ozone have been used in the chemical process for seawater treatment. In seawater chlorination, chlorine reacts rapidly with bromide ions to produce bromine. Ozone and chlorine (bromine) cannot be suggested for FF removal owing to their low reaction rates, thus other chemicals or treatment methods should be considered. To remove OA from seawater, ozonation process can be applied rather than bromination, owing to the rapid reaction rate of ozone with OA. For longer reaction times, both chlorine and bromine can be recommended for the treatment method.
4. Conclusions
In this study, the reaction rates of antibiotics FF and OA with ozone and bromine were determined using the pseudo first-order method. At pH 8 under seawater conditions, the apparent rate constants of FF for reactions with ozone and bromine were determined as 3.2 M−1s−1 and 3.5 M−1s−1, respectively. The reaction rates of OA with ozone and bromine were 2400 M−1s−1 and 400 M−1s−1, respectively. Using the apparent rate constant at various pH conditions, the species-specific rate constants were calculated by nonlinear least-squares regression analysis using experimental values for the apparent rate constant at each pH.
In seawater ozonation, ozone reacts rapidly with bromide ions to produce bromine. The primary oxidants of seawater ozonation are trace ozone and stable bromine. With 1 mg/L of ozone, the bromine formation was measured for the seawater condition with 60 mg/L of bromide ion, with FF and OA. Although the value of bromine formed with FF (3 mg/L) was like the predicted value (3.1 mg/L), the bromine formed with OA (2.6 mg/L) was lower than that with FF owing to the high reaction rate of OA with ozone. The predictions for FF and OA removal by ozonation and bromination, were verified. The removal of FF by both ozone and bromine was negligible, but OA was removed by ozonation within 90 s.
To assess seawater ozonation, ozone was injected into water containing bromide ions at pH 8. The ozone decreased rapidly and bromine was formed simultaneously. Regarding FF removal in seawater, ozonation was not efficient owing to the low reaction rate. In the case of OA, 60% of OA was removed initially by trace ozone. Further, the OA removal by the ozonation of seawater with bromide ions present was like that by bromination. Depending on the treatment conditions, ozone or chlorine (bromine) is recommended for OA removal in seawater.
Author Contributions
Conceptualization, methodology and writing—original draft preparation and editing, H.K.; data curation and formal analysis, H.O.; writing—review and editing, Y.J.; M.K., and Y.Y.; supervision and writing-review, J.-W.K. and T.-M.H.; All authors have read and agreed to the published version of the manuscript.
Funding
This research was funded by [Korea Environment Industry & Technology Institute] grant number [grant code 2020002690003] and [Korea Institute of Civil Engineering and Building Technology] grant number [grant code 20200089-001].
Conflicts of Interest
The authors declare no conflict of interest.
References
- Gao, Y.Q.; Gao, N.Y.; Deng, Y.; Yin, D.Q.; Zhang, Y.S. Degradation of florfenicol in water by UV/Na2S2O8 process. Environ. Sci. Pollut. 2015, 22, 8693–8701. [Google Scholar] [CrossRef] [PubMed]
- Norambuena, L.; Gras, N.; Contreras, S. Development and validation of a method for the simultaneous extraction and separate measurement of oxytetracycline, florfenicol, oxolinic acid and flumequine from marine sediments. Mar. Pollut. Bull. 2013, 73, 154–160. [Google Scholar] [CrossRef] [PubMed]
- Feng, J.-B.; Huang, D.-R.; Zhong, M.; Liu, P.; Dong, J.-D. Pharmacokinetics of florfenicol and behaviour of its metabolite florfenicol amine in orange-spotted grouper (Epinephelus coioides) after oral administration. J. Fish. Diseas. 2016, 39, 833–843. [Google Scholar] [CrossRef] [PubMed]
- Christensen, A.M.; Ingerslev, F.; Baun, A. Ecotoxicity of mixtures of antibiotics used in aquacultures. Environ. Toxicol Chem. 2006, 25, 2208–2215. [Google Scholar] [CrossRef]
- Sapkota, A.; Sapkota, A.R.; Kucharski, M.; Burke, J.; McKenzie, S.; Walker, P.; Lawrence, R. Aquaculture practices and potential human health risks: Current knowledge and future priorities. Environ. Int. 2008, 34, 1215–1226. [Google Scholar] [CrossRef]
- Palominos, R.A.; Mora, A.; Mondaca, M.A.; Pérez-Moya, M.; Mansilla, H.D. Oxolinic acid photo-oxidation using immobilized TiO2. J. Hazard. Mater. 2008, 158, 460–464. [Google Scholar] [CrossRef]
- Rigos, G.; Nengas, I.; Alexis, M.; Troisi, G.M. Potential drug (oxytetracycline and oxolinic acid) pollution from Mediterranean sparid fish farms. Aquat. Toxicol. 2004, 69, 281–288. [Google Scholar] [CrossRef]
- Lai, H.-T.; Chien, Y.-H.; Lin, J.-S. Long-Term transformation of oxolinic acid in water from an eel pond. Aquaculture 2008, 275, 96–101. [Google Scholar] [CrossRef]
- Sutherland, T.F.; Levings, C.D.; Elliott, C.C.; Hesse, W.W. Effect of a ballast water treatment system on survivorship of natural populations of marine plankton. Mar. Ecol. Prog Ser. 2001, 210, 139–148. [Google Scholar] [CrossRef]
- Waite, T.D.; Kazumi, J.; Lane, P.V.Z.; Farmer, L.L.; Smith, S.G.; Smith, S.L.; Hitchcock, G.; Cap, T.R. Removal of natural populations of marine plankton by a large-Scale ballast water treatment system. Mar. Ecol. Prog Ser. 2003, 258, 51–63. [Google Scholar] [CrossRef]
- Tang, Z.J.; Butkus, M.A.; Xie, Y.F.F. Crumb rubber filtration: A potential technology for ballast water treatment. Mar. Environ. Res. 2006, 61, 410–423. [Google Scholar] [CrossRef] [PubMed]
- Jung, Y.J.; Yoon, Y.; Pyo, T.S.; Lee, S.T.; Shin, K.; Kang, J.W. Evaluation of disinfection efficacy and chemical formation using MPUV ballast water treatment system (GloEn-Patrol (TM)). Environ. Technol. 2012, 33, 1953–1961. [Google Scholar] [CrossRef] [PubMed]
- Summerfelt, S.T.; Hochheimer, J.N. Review of ozone processes and applications as an oxidizing agent in aquaculture. Prog Fish. Cult. 1997, 59, 94–105. [Google Scholar] [CrossRef]
- Powell, A.; Chingombe, P.; Lupatsch, I.; Shields, R.J.; Lloyd, R. The effect of ozone on water quality and survival of turbot (Psetta maxima) maintained in a recirculating aquaculture system. Aquacult Eng. 2015, 64, 20–24. [Google Scholar] [CrossRef]
- Perrins, J.C.; Cooper, W.J.; van Leeuwen, J.H.; Herwig, R.P. Ozonation of seawater from different locations: Formation and decay of total residual oxidant - implications for ballast water treatment. Mar. Pollut Bull. 2006, 52, 1023–1033. [Google Scholar] [CrossRef]
- Jung, Y.; Yoon, Y.; Hong, E.; Kwon, M.; Kang, J.W. Inactivation characteristics of ozone and electrolysis process for ballast water treatment using B. subtilis spores as a probe. Mar. Pollut Bull. 2013, 72, 71–79. [Google Scholar] [CrossRef]
- Heeb, M.B.; Criquet, J.; Zimmermann-Steffens, S.G.; von Gunten, U. Oxidative treatment of bromide-containing waters: Formation of bromine and its reactions with inorganic and organic compounds—A critical review. Water Res. 2014, 48, 1–28. [Google Scholar] [CrossRef]
- Pinkernell, U.; Nowack, B.; Gallard, H.; von Gunten, U. Methods for the photometric determination of reactive bromine and chlorine species with ABTS. Water Res. 2000, 34, 4343–4350. [Google Scholar] [CrossRef]
- Buxton, G.V.; Bydder, M.; Arthur salmon, G. Reactivity of chlorine atoms in aqueous solution Part 1 The equilibrium ClMNsbd+Cl−Cl2−. J. Chem. Soc. Faraday Trans. 1998, 94, 653–657. [Google Scholar] [CrossRef]
- Barder, H.; Hoigné, J. Determination of ozone in water by the indigo method. Water Res. 1981, 15, 449–456. [Google Scholar] [CrossRef]
- Jung, Y.; Hong, E.; Kwon, M.; Kang, J.-W. A kinetic study of ozone decay and bromine formation in saltwater ozonation: Effect of O3 dose, salinity, pH, and Temperature. Chem. Eng. J. 2017, 31, 30–38. [Google Scholar] [CrossRef]
Figure 1.
Schematic diagram of the batch reactor for ozonation.

Figure 2.
pH dependence of the apparent rate constants for the ozonation of (a) florfenicol (FF) and (b) oxolinic acid (OA). Symbols: experimental values; dotted line: calculated values of the apparent rate constant; solid line: speciation of florfenicol ([Ozone]0 = 20 μM, [FF]0 = 200 μM, [OA]0 = 1 μM, [t−BuOH]0 = 10 mM, pH 3–9, Temp. = 20 °C).

Figure 3.
pH dependence of the apparent rate constants for the bromination of (a) florfenicol and (b) oxolinic acid. Symbols: experimental values; dotted line: calculated values of the apparent rate constant; solid line: speciation of bromine and florfenicol, ([Bromine]0 = 3000 and 5000 μM, [FF]0 = 1 μM, [OA]0 = 1 μM, pH 3–10, Temp. = 20 °C). ([Bromine]0 = 20 μM, [OA]0 = 1 μM, pH 5–10, Temp. = 20 °C).

Figure 4.
Concentration of bromine formed at synthetic seawater with/without target compound. ([O3]0 = 1 mg/L, [Br−]0 = 60 mg/L, [Antibiotics]0 = 1 μM, Temp. = 20 °C, pH 8).
Figure 4.
Concentration of bromine formed at synthetic seawater with/without target compound. ([O3]0 = 1 mg/L, [Br−]0 = 60 mg/L, [Antibiotics]0 = 1 μM, Temp. = 20 °C, pH 8).

Figure 5.
Removal of (a) FF and OA and (b) OA by ozonation. Symbol: experimental values; dotted line: prediction values ([O3]0 = 1 mg/L, [Antibiotics] = 1 μM, [t-BuOH]0 = 10 mM, Temp. = 20 °C, pH.
Figure 5.
Removal of (a) FF and OA and (b) OA by ozonation. Symbol: experimental values; dotted line: prediction values ([O3]0 = 1 mg/L, [Antibiotics] = 1 μM, [t-BuOH]0 = 10 mM, Temp. = 20 °C, pH.

Figure 6.
Removal of (a) FF and (b) OA, by bromination. Symbol: experimental values; dotted line: prediction values ([Bromine]0 = (a) 3 and (b) 2.6 mg/L, [Antibiotics] = 1 μM, Temp. = 20 °C, pH 8).
Figure 6.
Removal of (a) FF and (b) OA, by bromination. Symbol: experimental values; dotted line: prediction values ([Bromine]0 = (a) 3 and (b) 2.6 mg/L, [Antibiotics] = 1 μM, Temp. = 20 °C, pH 8).

Figure 7.
Effect of Br− on removal by ozonation of (a) FF and (b) OA ([O3]0 = 1 mg/L, [Br−]0 = 60 mg/L, [FF]0 = 1 μM, [OA]0 = 1 μM, [t-BuOH]0 = 10 mM, Temp. = 20 °C, pH 8).
Figure 7.
Effect of Br− on removal by ozonation of (a) FF and (b) OA ([O3]0 = 1 mg/L, [Br−]0 = 60 mg/L, [FF]0 = 1 μM, [OA]0 = 1 μM, [t-BuOH]0 = 10 mM, Temp. = 20 °C, pH 8).


Table 1.
Target antibiotics - structure and general information.
| Florfenicol (FF) | Classes | A Fluorinated Derivative of Thiamphenicol |
 | gram-negative and gram-positive bacteria | |
| M.F. | C12H14Cl2FNO4S | |
| M.W. | 358.21 g/mol | |
| pKa | 9.0 (reference) | |
| Oxolinic Acid (OA) | Classes | Quinolone |
 | gram-negative and gram-positive bacteria | |
| M.F. | C13H11NO5 | |
| M.W. | 261.23 g/mol | |
| pKa | 6.8 (reference) | |
Table 2.
Apparent rate constant for reaction of florfenicol with bromine at pH 3, 7, and 8.
| Florfenicol | ||
|---|---|---|
| [Br2]0 (mM) | PH | Kapp |
| 5 | 3 | 4.5 10−3 |
| 5 | 7 | 5.2 10−1 |
| 3 | 8 | 3.8 |
| 5 | 8 | 3.7 |
Table 3.
Comparison of apparent rate constants at pH 8.
| Pharmaceutical | pKa | Ozone | Bromine |
|---|---|---|---|
| Kapp | Kapp | ||
| Florfenicol (FF) | 9.0 | 3.2 | 3.5 |
| Oxolinic acid (OA) | 6.8 | 2.4 103 | 4.0 102 |
© 2020 by the authors. Licensee MDPI, Basel, Switzerland. This article is an open access article distributed under the terms and conditions of the Creative Commons Attribution (CC BY) license (http://creativecommons.org/licenses/by/4.0/).
Share and Cite
MDPI and ACS Style
Kye, H.; Oh, H.; Jung, Y.; Kwon, M.; Yoon, Y.; Kang, J.-W.; Hwang, T.-M. Oxidation of Florfenicol and Oxolinic Acid in Seawater by Ozonation. Appl. Sci. 2020, 10, 4944. https://0-doi-org.brum.beds.ac.uk/10.3390/app10144944
AMA Style
Kye H, Oh H, Jung Y, Kwon M, Yoon Y, Kang J-W, Hwang T-M. Oxidation of Florfenicol and Oxolinic Acid in Seawater by Ozonation. Applied Sciences. 2020; 10(14):4944. https://0-doi-org.brum.beds.ac.uk/10.3390/app10144944
Chicago/Turabian StyleKye, Homin, Heegun Oh, Youmi Jung, Minhwan Kwon, Yeojoon Yoon, Joon-Wun Kang, and Tae-Mun Hwang. 2020. "Oxidation of Florfenicol and Oxolinic Acid in Seawater by Ozonation" Applied Sciences 10, no. 14: 4944. https://0-doi-org.brum.beds.ac.uk/10.3390/app10144944
Note that from the first issue of 2016, this journal uses article numbers instead of page numbers. See further details here.