Article

Anti-Inflammatory Properties of Mineral-Balanced Deep Sea Water in In-Vitro and In-Vivo Models of Inflamed Intestinal Epithelium

1
Department of Food Science and Technology, Seoul National University of Science and Technology, Seoul 01811, Korea
2
Sempio Fermentation Research Center, 183, Osongsaengmyeong 4-ro, Osong-eup, Heungdeok-gu, Cheongju-si, Chungcheongbuk-do 28156, Korea
*
Author to whom correspondence should be addressed.
Submission received: 3 July 2020 / Revised: 22 July 2020 / Accepted: 24 July 2020 / Published: 28 July 2020
(This article belongs to the Section Environmental Sciences)

Abstract

:

Featured Application

Environmental and Sustainable Science and Technology.

Abstract

This study aimed to determine the effect of deep-sea water (DSW)-derived mineral waters on intestinal health, using a cell model and a dextran sulfate sodium (DSS)-induced enteritis mouse model. DSW was desalted and minerals were added to generate mineral waters that were classified as trace mineral (TM), high magnesium (HM), high magnesium low salt (HMLS), and high magnesium high calcium (HMHC), using a tabletop electrodialysis device. Caco-2 cells cocultured with Raw264.7 cells were either pre-treated or not with the four water groups, and inflammation was induced by treatment with lipopolysaccharide (LPS). Compared to LPS-treated Caco-2 cells, HMLS-cotreated cells maintained high transepithelial electrical resistance, similar to control cells. FITC-dextran permeability was lower in HMLS-treated than in other cells. In vivo, in comparison to DSS-treated mice, colon shortening was inhibited, and disease activity and colon injury were suppressed in HMLS-cotreated mice. RNA-seq of colonic tissues revealed that inflammatory gene expression was similar among the control and HMLS mice, and DSS-induced expression of inflammation-related genes such as TNF-α and NOS2 and inflammatory chemokine genes was suppressed. Our findings suggest that DSW-derived mineral water intake can help reduce colitis symptoms, and the effects may be partially regulated by magnesium and other minerals.

1. Introduction

Inflammatory bowel diseases (IBDs), such as ulcerative colitis and Crohn’s disease, are associated with inflammation in the digestive system, without a specific cause. IBDs are promoted by an abnormal innate immune response from the intestinal microbiota [1,2]. Frequent bloody stool, diarrhea, weight loss, abdominal pain, anemia, and nutrient loss are major clinical symptoms in IBD patients [3,4]. Inflammatory and immune cytokines seem to play a major role in controlling complications such as intestinal inflammation, diarrhea, rectal bleeding, and furuncle formation [5,6]. Autoimmune diseases can also develop from a leaky gut, which is caused by dysregulation of tight junctions (TJ) in the intestinal epithelial barrier [7,8].
Mineral deficiency is associated with various diseases. In the absence of extracellular calcium, myosin light chain kinase is activated to increase the intestinal monolayer TJ permeability. TJ protein complexes in the intestinal monolayer are the main structures controlling intercellular tightness [9,10]. Increased TJ permeability can result from invading harmful molecules and causes systemic disorders of the intestine, leading to dysregulation of the mucosal immune system and inflammation [11]. Magnesium deficiency causes asymptomatic inflammation in the small intestine, rendering the cells sensitive to oxidative stress [12,13].
In modern times, numerous mineral supplements are available in pill form. However, previous studies have shown that minerals have a higher absorption rate when consumed in the ionized form, especially the water-soluble form [14,15,16,17]. Ingested water is the most efficiently absorbed in the intestine. Hence, if drinking water contains a large amount of harmful substances, it can cause a variety of problems, including abdominal pain and diarrhea. The mineral types and contents in drinking water have an important effect on IBD. A study of the correlation between water intake and IBD in Norway suggested that iron in drinking water is an important cause of IBD. A high iron content in drinking water acts as a catalyst for oxidative stress, causing inadequate immune responses that provoke inflammation and stimulate bacterial growth [18]. Among various sources of drinking water, deep-sea water (DSW) is usually pumped from a depth of more than 200 m, and desalted. DSW has numerous minerals, including magnesium (Mg), calcium (Ca), potassium (K), selenium (Se), zinc (Zn), and vanadium (V) [19,20]. Although the health benefits of DSW has been examined in numerous studies, they have focused primarily on the hardness of DSW [19]. In fact, a study showed that, when the effects of the main minerals in DSW (calcium and magnesium), at the same hardness as that of DSW, were examined, the effect was lower than that of DSW [20]. We, therefore, sought to generate water samples that would allow us to determine if the health benefits of DSW were derived from the amount of calcium and magnesium, or that of other trace minerals, or alternatively, by the calcium:magnesium composition ratio.
Numerous studies have demonstrated that DSW is effective in treating metabolic diseases such as obesity and diabetes, and in improving atopy [20,21,22,23,24,25]. Although several studies have investigated the effects of DSW in minimizing immune and metabolic diseases, no studies focused on the effects of DSW on intestinal health [26,27,28,29]. Therefore, this study aimed to evaluate the effect of mineral controlled DSW on intestinal health in enteritis models. DSW is generally richer in magnesium than in calcium. Therefore, to determine the optimal ratio of minerals included in mineral water, DSW was desalted and different ions were added. The effect of the mineral waters on gut health was evaluated using an in vitro coculture system of Caco-2 and Raw264.7 cells, and a dextran sulfate sodium (DSS)-induced enteritis mouse model.

2. Materials and Methods

2.1. Materials

Dulbecco’s modified Eagle’s medium (DMEM), penicillin–streptomycin, nonessential amino acids (NEAA), and HEPES buffer (1 M) were obtained from Gibco (Rockville, MD, USA). Fetal bovine serum (FBS) was purchased from Biowest (Nuailleé Cholet, France). FITC-dextran (4 kDa) (FD4) and LPS from Escherichia coli 011:B4 were obtained from Sigma-Aldrich (St. Louis, MO, USA). DSS (molecular weight: 36,000–50,000) was obtained from MP Biomedicals (Santa Ana, CA, USA). Neutral buffered formalin (10%) solution was purchased from Sigma-Aldrich.

2.2. Preparation of DSW and DSW-Derived Mineral Waters

Mineral water samples were provided by the Sempio Fermentation Research Center (Cheongju, Korea). The mineral water samples were manufactured by processing DSW, obtained at 510 m depth in the East Sea, via different conditions of reverse osmosis and electrodialysis, using a tabletop electrodialysis device (CJT-055, Changjotechno.co., Seoul, Korea). The mineral water samples were classified as trace mineral (TM), high magnesium (HM), high magnesium low salt (HMLS), and high magnesium high calcium (HMHC) depending on mineral content.

2.3. Quantification of Minerals in DSW Using Inductively Coupled Plasma Atomic Emission Spectroscopy

Elemental analyses of DSW were performed using inductively coupled plasma atomic emission spectroscopy (ICPE-9820; Shimadzu, Japan). Emission intensity measurements were made under the following conditions: RF power 1. 2 kW; nebulizer flow 0.75 L/min; and auxiliary gas 0.6 L/min. Heavy metals, such as Cd and Hg, were analyzed by ion chromatography (DRC II, Perkin Elmer, Shelton, CT, USA). The operating conditions were as follows: forward power 1.15 kW; and gas flow rates of 18 L/min (plasma), 1.6 L/min (auxiliary), and 0.75 L/min (nebulizer).

2.4. Cell Culture

Caco-2 human intestinal epithelial cells and RAW264.7 murine macrophages were obtained from the Korean Cell Line Bank (Seoul, Korea). Caco-2 cells were cultured in DMEM supplemented with 10% FBS, 1% MEM-NEAA, 100 µg/mL streptomycin, and 100 U/mL penicillin. RAW264.7 cells were cultured in DMEM supplemented with 10% FBS, 1% HEPES, 100 µg/mL streptomycin, and 100 U/mL penicillin. Cell cultures were incubated in a 5% CO2 humidified incubator at 37 °C.

2.5. Coculture for Inducing Inflammatory Reaction

Caco-2 cells were seeded at 1 × 10⁵ cells/well in Transwell inserts in 6-well plates (0.4-µm pore size; Corning Costar, NY, USA). The cell culture medium was replaced every 2–3 days for 14 days [30]. Then, RAW264.7 cells were seeded at 1 × 10⁵ cells/well on the basolateral side of the Transwell and the plate was incubated for 48 h to facilitate complete cell adherence to the wells. After 48 h, the medium was replaced with serum-free DMEM containing mineral waters to assess the anti-inflammatory activities of the water samples. The serum-free DMEM containing mineral water was prepared by referring to the purchased DMEM powder (CAT. 12800017; Gibco, San Diego, CA, USA) protocol for each DSW-derived mineral water sample. After 24 h, 2 µg/mL of LPS was administered to the basolateral wells and the plate was further incubated for 48 h. The passage number of whole cells used in the experiment was under 30.

2.6. Transepithelial Electrical Resistance (TEER) Measurement

TJ integrity of Caco-2 monolayers was determined by measuring the TEER. DMEM containing mineral waters and DMEM were administered to the apical sides and basolateral wells, respectively, and the plate was incubated for 24 h. Then, LPS was added to the basolateral wells. TEER was measured before and at 0.5, 1, 3, 6, 12, 24, and 48 h after LPS addition using a Millicell ERS instrument (Millipore, Bedford, MA, USA). TEER was measured three times consecutively and reported as Ω (resistance) × cm2 (surface area of the monolayer).

2.7. Permeability Measurement

Transepithelial permeability was measured using FD-4. FD-4 flux experiments were conducted to determine the effect of the mineral waters on the increase in permeability caused by TJ collapse. FD-4 migrates from the apical side of a Transwell insert containing a cell monolayer to the basolateral well through paracellular transport, and the looser is the TJ, the higher is the permeability. An FD-4 solution (1 mg/mL) was added to the apical sides of Caco-2 cell monolayers. The medium in the basolateral wells was collected for analysis of the fluorescence intensity at 48 h after LPS treatment. FD-4 fluorescence intensity was quantified using a fluorescence spectrophotometer (PerkinElmer, Waltham, MA, USA). The excitation and emission wavelengths were 485 and 535 nm, respectively.

2.8. Total RNA Extraction and Quantitative Reverse Transcription (RT-q) PCR

Total RNA was isolated from cultured cells using TRIzol (Life Technologies, Rockville, MD, USA) following the manufacturer’s protocol. cDNA was synthesized by reverse transcription using a High Capacity RNA-to-cDNA Kit and was used for RT-qPCR using the Universal Probe Library method in a Light Cycler 96 system (Hoffmann La Roche, Basel, Switzerland). The PCR thermal cycling was as follows: initial denaturing at 95 °C for 30 s, 40 cycles of 92 °C for 5 s, and 60 °C for 20 s. Relative mRNA levels were calculated using the comparative 2−∆∆Cq method and normalized to the amount of β-actin [31]. The specific primers were as follows: forward 5′-AAGGGAGCCTGTCTATTGGAA-3′ and reverse 5′-AAAAAGCATGCAACTTGAAA-3′ for occludin; forward 5′-AAATTTAACTAATGTCAGACTGGAGGA-3′ and reverse 5′-TCAGCTTGTGGTGAGTAAGAGG-3′ for ZO-1; forward 5′-CACCGTCTGTGTTTGAGCA-3′ and reverse 5′-CAAACCACCGCTTACAGATG-3′ for Claudin-1; forward 5′-AACCTGCATGGACTGTGAAA-3′ and reverse 5′-GGTCAAGTATTGGCGGTCAC-3′ for Claudin-3; forward 5′-AACCTGTCCCCGAGAGAGA-3′ and reverse 5′-GCAAGTGTGAGCAGACCAGT-3′ for Claudin-4; forward 5′-CAGCTCCTGTGGGGAAAG-3′ and reverse 5′-TGCTCTTCAGAACGAGTCACC-3′ for JAM-1; and forward 5′-AAGTCCCTTGCCATCCTAAAA-3′ and reverse 5′-ATGCTATCACCTCCCCTGTG-3′ for the housekeeping gene β-Actin.

2.9. Animals

Thirty-two five-week-old male BALB/c mice were purchased from Samtako (Osan, Korea). The animals were administered a standard rodent diet, with ad libitum access to water, and were housed in rooms maintained at 22 ± 1 °C under a 12-h light/dark cycle. The protocols (SEMI-18-009) were approved by the Institutional Animal Care and Use Committee of Southeast Medi-Chem Institute.

2.10. Colitis Model and Disease

The animals were randomly divided into four groups (n = 8 mice/group), including control, DSS alone, DSS + HMLS, and DSS + TM groups. Mice in the control and DSS alone groups were administered distilled water by oral gavage. Mice in the HMLS and TM groups were provided with mineral water ad libitum, from Day 1 to Day 21. Body weight and dietary intake were recorded once every three days until Day 21. Colitis was induced by the intake of 5% (w/v) DSS-containing drinking water, ad libitum, for seven consecutive days (Days 15–21).

2.11. DAI Scoring

DAI values were calculated based on body weight loss, stool consistency, and fecal bleeding, using the following formula to assess the severity of colonic inflammation [32]: DAI = (weight loss) + (stool consistency) + (fecal bleeding).

2.12. Histological Analysis

A 1-cm portion of the distal end of the colon was fixed in neutral buffered 10% formalin solution, embedded in paraffin, and sliced into 4-µm sections. The sections were deparaffinized in xylene and dehydrated by incubation in ethanol solutions of different concentrations (100%, 90%, 80%, and 70%) for 5 min each, and then stained with hematoxylin and eosin (H&E) for 3 min. Colonic histopathological changes were evaluated using a microscope (E600; Nikon, Tokyo, Japan) at a magnification of 200× [33].

2.13. In-Vivo Intestinal Permeability Measurement

Intestinal permeability in mice was measured using FD-4. Mice were treated with DSS 7 days, which was followed by standard oral gavage (10 µL/g) of FD-4 at a dose of 0.6 mg/g body weight. The mice were euthanized 4 h later, and blood was collected by cardiac puncture. Plasma was separated and FITC fluorescence levels in the plasma determined using a fluorimeter. The fluorescence intensity was quantified using a fluorescence spectrophotometer (PerkinElmer, Waltham, MA, USA) [34].

2.14. Statistical Analysis

Data are expressed as the mean ± standard error of the mean. In-vitro and in-vivo data were analyzed using Duncan’s multiple range test and one-way analysis of variance (ANOVA) in SPSS 20 (SPSS, Chicago, IL, USA) and SAS 9.4 (SAS, Cary, NC, USA), respectively. p-values < 0.05 were considered statistically significant.

2.15. Total RNA Sequencing

Total RNA obtained from mouse colons was subjected to poly-A enrichment. The mRNA thus obtained was reverse-transcribed, fragmented, and amplified using a TruSeq Stranded Total RNA H/M/R Prep kit (Clontech, Mountain View, CA, USA). The library was sequenced using a NovaSeq 6000 sequencing system (Illumina, San Diego, CA, USA) to produce 100-bp paired-end reads. RNA-seq data were submitted to a NCBI Gene Expression Omnibus (accession number: GSE143378).

2.16. Bioinformatics Analysis

Bioinformatics analysis was performed using a reported protocol, with modification [35]. Reads were aligned to a mouse reference genome (mm10) using the TopHat software. Expression was quantified using Cufflinks (http://cole-trapnell-lab.github.io/cufflinks/). Differential expression analysis was performed using Cuffdiff (http://cole-trapnell-lab.github.io/cufflinks/cuffdiff/index.html) and the false discovery rate (FDR) was calculated by adjusting the p-values to control for false positives. An adjusted p-value threshold of 0.05 was chosen to denote significance. Genes with an absolute log2 fold change (FC) of 1 or more were subjected to enrichment analysis. Hierarchical clustering was performed using the HCL function of MeV software (v.4.9.0, open source genomic analysis software; www.tm4.org). Protein–protein interaction (PPI) Network were analyzed using the STRING database and visualized using the STRING database (http://string.db.org/) and Cytoscape 3.7.0 software [36]. To explore potential interactions among proteins, the overlapping differentially expresses genes (DEG) were used to construct a PPI network.

2.17. Functional Enrichment Analysis

Genes deemed significantly differentially expressed between HMLS mice and DSS mice per the above criteria were used as input for the Database from Annotation Integrated Discovery (DAVID) tool for functional enrichment [37]. This tool compares DEG with groups of functionally related genes, such as members of Gene Ontology (GO), to find overrepresentation. Kyoto Encyclopedia of Genes and Genomes (KEGG) pathway enrichment analyses of DEG was analyzed using KEGG pathway database (https://www.genome.jp/kegg/pathway.html).

3. Results

3.1. Mineral Contents of DSW-Derived Water Samples

The main mineral cation composition of DSW-based mineral water samples prepared by dialysis of DSW and used for in vitro and in vivo studies are shown in Table 1. The sodium content of conventional DSW was substantially higher than that of ordinary drinking water. When comparing the contents of Ca2+ and Mg2+, the main divalent minerals in DSW, the Mg2+ content was approximately 3–4 times higher than that of Ca2+. Four DSW-based samples were prepared by desalting and ion addition. TM water had a 3:1 ratio of Mg2+ and Ca2+, similar to DSW. HM water had a higher Mg2+ content than the other waters, whereas the Ca2+ content was very low. HMLS water was high in Mg2+, but the Ca2+ content was adjusted to match that in DSW. HMHC water was formulated to have similar Mg2+ and Ca2+ contents. Detailed mineral compositions of DSW-derived water samples are shown in Table S1.

3.2. Effect of DSW-Derived Mineral Waters on Intestinal Permeability

Transepithelial electrical resistance (TEER) was measured to verify TJ tightness in a Caco-2 intestinal monolayer; the higher the electrical resistance, the tighter the TJ. LPS treatment significantly reduced the TEER by approximately 11% when compared to the TEER value for a control Caco-2 cell monolayer at 48 h (p < 0.05; Figure 1a,b). Pre-treatment with the DSW-derived waters, except HM, inhibited this LPS-induced reduction in TEER to the level observed in the control group. The TEER was increased in all groups, except the HM group, and it was the highest in the HMLS group. In the LPS-treated group, the FD-4 flux was increased by approximately 15.10% compared to that in the control group. However, in the mineral water pre-treatment groups, the fluorescence flux was significantly decreased by 33.5%, 42.6%, 41.9%, and 39.0%, respectively, compared to that in the LPS group (p < 0.05; Figure 1c).

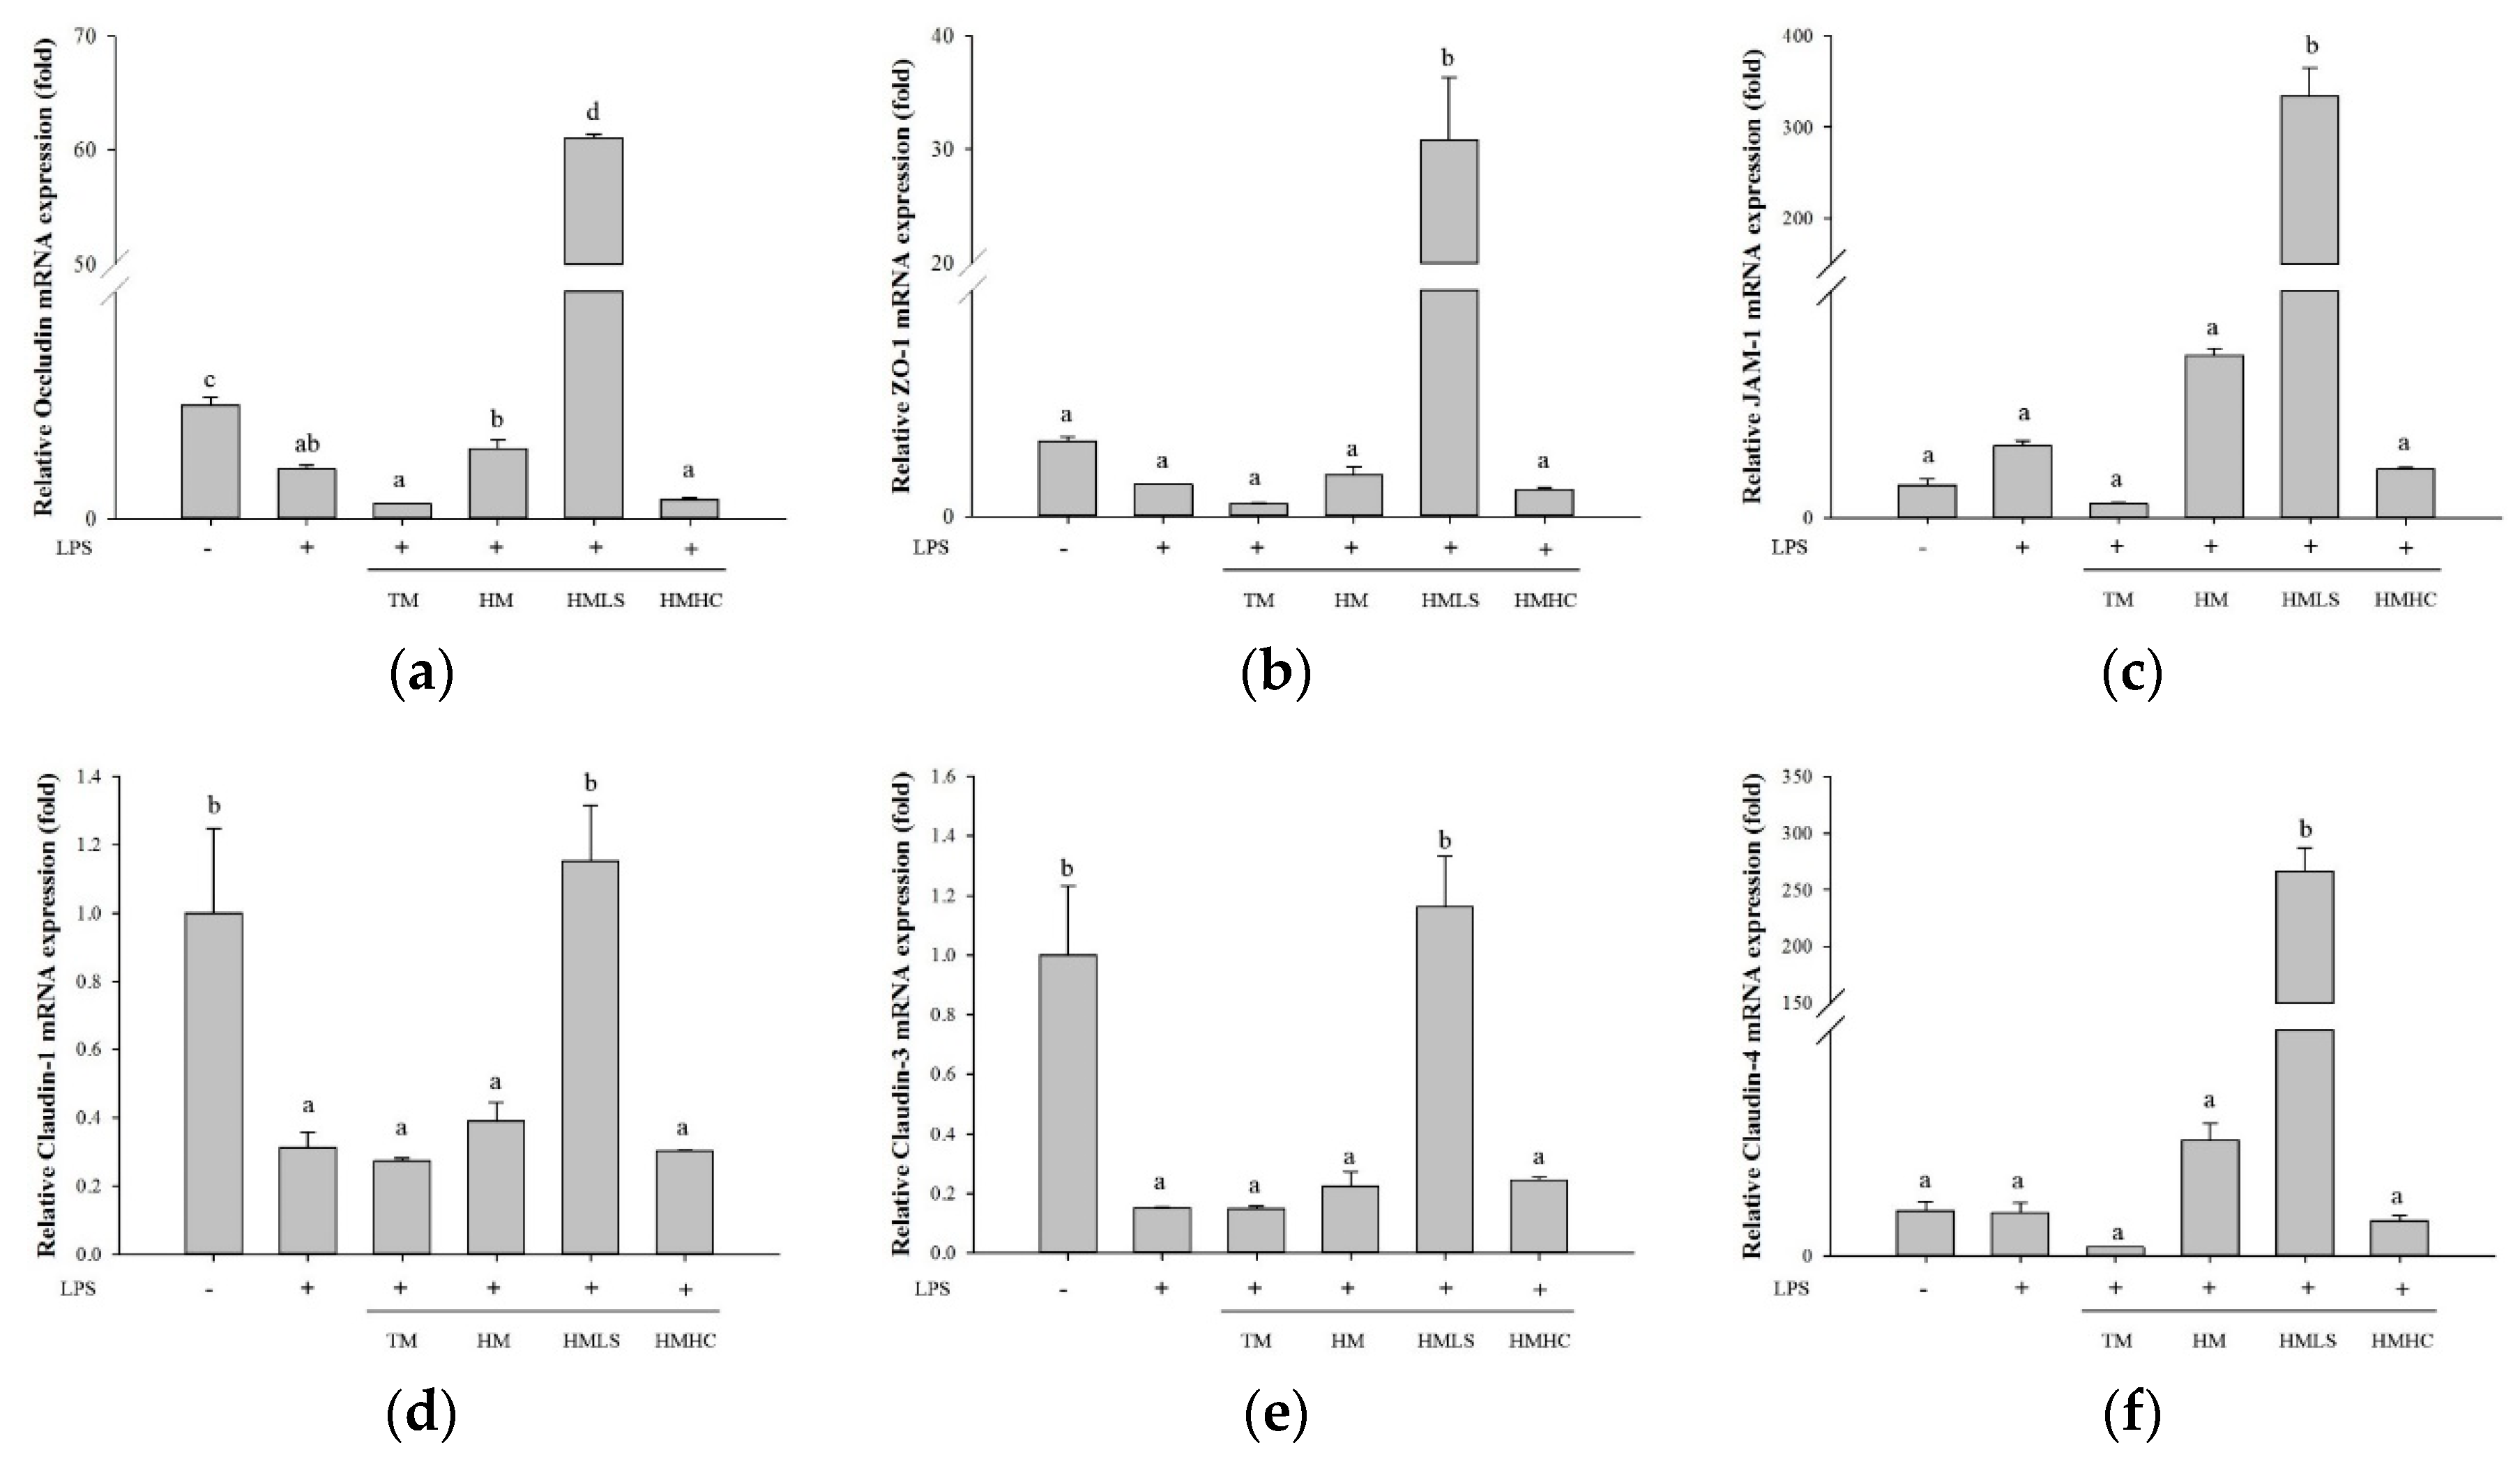
3.3. Effects of DSW-Derived Mineral Waters on the Expression of TJ-Related Proteins

To clarify the mechanism underlying the inhibition of paracellular transport across mineral water-pre-treated Caco-2 monolayers, the expression of TJ-related proteins was investigated at the mRNA level. Occludin mRNA expression was significantly reduced by LPS treatment but was significantly increased by treatment with HMLS water. TM, HM, and HMHC groups showed decreased occludin mRNA expression (p < 0.05; Figure 2a). Zonula occludins (ZO)-1 mRNA expression was slightly, albeit not significantly, decreased by LPS treatment. HMLS water induced a 30-fold increase in ZO-1 mRNA expression compared to the level in the CON group, whereas TM, HM, and HMHC groups showed decreased ZO-1 expression as compared with the CON group (p < 0.05; Figure 2b). JAM-1 mRNA expression was slightly, albeit not significantly, increased by LPS treatment, but was significantly increased by treatment with HMLS water. JAM-1 mRNA expression was slightly reduced in the TM and HMHC groups, and slightly increased in the HM group when compared with the LPS group (p < 0.05; Figure 2c). Claudin-1 and -3 mRNA levels were significantly reduced by LPS treatment, but expression was rescued upon HMLS treatment, whereas the other waters had no effect (p < 0.05; Figure 2d,e). Claudin-4 mRNA expression was not affected by LPS treatment and was only significantly increased upon treatment with HMLS water (p < 0.05; Figure 2f).

3.4. DSW-Derived Mineral Waters Improve Clinical Symptoms of DSS-Induced Colitis

Based on the results of the cell experiments, animal experiments were conducted to compare the effects of TM water containing trace minerals with the same magnesium-to-calcium ratio composition as HMLS, the most effective water. During the seven days of DSS administration (Days 15–21), body weight decreased rapidly when compared to that in the control group. There was no significant difference in body weight between the DSS group and the HMLS and TM groups (Figure 3a,b). Severe diarrhea, blood loss in feces, and body weight loss were considered as a noticeably high DAI. TM intake decreased the DAI when compared to that in the DSS group (Figure 3c,d). In addition, colon length was generally shorter in the DSS group than in the control group. In the HMLS group, colon length was significantly improved (Figure 3e,f).

3.5. Mineral Water Intake Reduces DSS-Induced Colonic Histopathological Changes

With daily DSS treatment, diarrhea and fecal blood in mice were accompanied with colon infection and damage to the intestinal barrier. In hematoxylin and eosin-stained intestinal sections from DSS-treated mice, critical lining disruption and inflammatory cell invasion were observed, whereas HMLS reduced these histopathological colitis symptoms (Figure 4).

3.6. Intestinal Permeability

The fluorescence intensity in the DSS group was 57 times higher than that in the CON group (p < 0.05). In the HMLS group, the fluorescence intensity was 1.5 times higher than that in the DSS group. In the TM group, it was slightly (1.5 times) lower (p < 0.05) (Figure 5).

3.7. Differential Gene Expression Analysis

DEG in intestinal tissues were identified in the CON vs. DSS, DSS vs. HMLS, and DSS vs. TM groups. DEG were identified based on an FDR value cut-off of 0.1 using Cufflinks, and an absolute log FC of at least 2. In total, 786 (350 upregulated, 436 downregulated), 176 (40 upregulated, 136 downregulated), and 77 (58 upregulated, 19 downregulated) DEG were identified in the three above comparisons, respectively. DEG, along with the FC and FDR, are listed in Table S2, and details of the differences between samples are shown in Figure S1. Genes annotated in QuickGO (https://www.ebi.ac.uk/QuickGO/) were mapped; for the TJ genes annotated in QuickGO, there were no significant differences between the DSS and DSW groups (Figure S2). The scatter plots in Figure 6a–c show the FC values for all genes in relation to the adjusted p-value for differential expression in the DSS vs. HMLS and DSS vs. TM groups. DEG for inflammation-related genes in CON vs. DSS groups heatmaps are presented in Figure 6d. The expression pattern in the HMLS group was similar to that in the control group, and the expression patterns in the DSS and TM groups were alike. Inflammation-related DEG between the HMLS and DSS groups are listed in Table 2. In the HMLS group, the expression of nitric oxide synthase (NOS2), which produces free radicals, was the most significantly reduced when compared to its level the DSS group, whereas the expression of C-C motif chemokine ligand 20 (CCL20), which migrates white blood cells to maintain homeostasis, was the most significantly induced (FDR < 0.1).

3.8. PPI Network Analysis

In the network, each node represents a gene, protein, or molecule, and the connections between nodes represent the interactions of these biological molecules, which can be used for identifying interactions and pathway relationships between DEG related to the effect mineral water consumption on colitis. The proteins in the central node may be core proteins or key candidate proteins that likely have vital physiological functions. PPI networks were constructed for the DEG in the DSS and HMLS groups. In the network, there were 173 nodes and 590 edges, which included the 176 DEG (Figure 7a,b). Among the nodes, TNF was identified as the node with the highest degree of connectivity (43). DSS induced the expression of typical inflammation-related genes, such as TNF, NOS2, and various chemokine genes. In addition, regenerating islet-derived protein 3 gene expression was increased. In the TM group, differential expression compared to the DSS group was generally weak. However, chemokine gene expression was increased compared to the DSS group (FDR < 0.1). PPI networks of inflammatory response DEG are shown in Figure S3 (CON vs. DSS and DSS vs. TM).

3.9. GO and KEGG Enrichment Analyses of DEG

Functional enrichment analysis was performed using the 176 DEGs by looking for overrepresentation of functional categories. Using the DAVID functional enrichment tool, annotations were found for 173 genes, and the most significant categories, along with the genes and the direction of change, are shown in Table 3. Three genes without annotation in the DAVID database are listed in Table S3. The most highly enriched GO functional categories among the DEG were “nucleosome” and “nuclear nucleosome”, which are comprised of DNA wound around a multi-subunit core and associated proteins and form the primary packing unit of DNA into higher-order structures. As expected, genes related to inflammatory processes and immune system-related signaling, including systemic lupus erythematosus (SLE), were clearly downregulated in the HMLS compared to the DSS group. The most significantly enriched GO biological processes were “nucleosome assembly”, “regulation of gene silencing”, and “DNA methylation on cytosine” caused by histone-coding proteins (Hist1h2ah, Hist1h3b, and Hist1h2ag). All functionally enriched categories are listed in Table S4. KEGG pathway analysis revealed a reduction in the inflammatory response in HMLS-treated samples; cytokine-related genes, TNF, LTA, and genes in the CCL family were downregulated. KEGG biological pathway analysis revealed an enrichment for genes downregulated in SLE in the HMLS group.

4. Discussion

DSW offers several health benefits, including anti-obesity, anti-diabetic, and anti-immune properties [26,27,28,29]. However, the potential effect of DSW on weakening the intestinal inflammatory response has not been thoroughly investigated. To the best of our knowledge, this is the first study to show that mineral-rich DSW-derived water improves intestinal barrier function and exerts anti-inflammatory activity in the intestinal system.
Most previous studies have determined that the primary functional health benefits of DSW arise from its mineral content [20,21,22,23,24,25,26,27,28,29]. Herein, we sought to investigate whether trace minerals, such as selenium and zinc, or the main minerals, magnesium and calcium, account for the beneficial effects of DSW. To this end, we divided the DSW-derived mineral water into four groups: TM (Trace Mineral) contained only the trace mineral and removed magnesium and calcium, which are the main mineral of DSW; HM (High Magnesium) water was high in magnesium known to be effective in suppressing inflammation; HMLS (High Magnesium Low salt) contained lower magnesium and sodium than HM and had same calcium:magnesium ratio as DSW; and HMHC (High Magnesium High Calcium) was HMLS-based water with additional calcium salt added.
It was decided that the water samples would have low sodium content since DSW is difficult to drink due to its high sodium content [38]. In addition, sodium-rich water can cause dehydration, and, in extreme conditions, it can be fatal. Moreover, high sodium content increases the incidence of inflammation [39,40]. Therefore, the sodium contents of every sample water were lowered to a level acceptable for drinking via electrodialysis.
For the control medium prepared with distilled water, the osmotic pressure was 285.25 mOsmol/L. The osmotic pressures of the medium prepared with DSW-derived mineral water were TM 289.66 mOsmol/L, HM 324.18 mOsmol/L, HMLS 321.08 mOsmol/L, and HMHC 331.76 mOsmol/L. Compared to the composition of the medium, the molar concentration of minerals added to the mineral water did not differ significantly. The role of bicarbonate and phosphate in the medium was to buffer osmotic pressure, thereby minimizing the damage to cells caused by osmotic pressure [41].
Intestinal inflammation was mimicked in Caco-2 cells in vitro by coculturing with Raw264.7 cells and LPS treatment [30]. LPS activates the NF-κB pathway in Raw264.7 cells, inducing the production of NO and inflammatory cytokines, such as TNF-α and IL-6, in these cells, which then reduces the barrier function of Caco-2 through a shared medium. The inflammatory cytokines then bind to TJ in the Caco-2 monolayer and effectively reduce the electrical resistance in the epithelium, indicating effective model establishment [42,43]. Furthermore, rather than exposing immune cells and intestinal cells to single cytokines, exposure to multiple can elicit more complex biological responses [44].
In the case of TEER, the higher is the resistance value, the stronger is the TJ between cells, resulting in higher resistance and an improved physiological state. In the case of the FD-4 flux assay, when the tight junction bond between cells becomes loose, both the permeability and FD-4 flux value increase. Other studies have shown that TJs function as ion transport channels [45], which increases the epithelial resistance value differently, depending on the type and number of ions and determines the absorption of ions. Conversely, in the case of the FD, permeability analysis shows that, unlike the TEER results, every water sample improved permeability.
In this study, function of HMLS led to high TEER and low permeability in the inflamed Caco-2 cell model. Zona occludens-1 (ZO-1) localizes at the cytoplasmic surface of the cell membrane, close to the TJ strands. Occludin is a TJ protein consisting of four transmembrane domains altering epithelial permeability. Junctional adhesion molecules (JAMs) are contributing to the semi-permeable barrier, whereas cytosolic proteins link membrane components to the actin cytoskeleton [46]. It is known that claudin-1, -3, and -4 are pore-sealing claudins. An increased expression of these proteins leads to a very tight epithelia and decreased solute permeability (mainly sodium ions) across the epithelial monolayer [47]. To understand the permeability improvement of DSW derived mineral water function, we chose those genes. Efficacy of all DSW-derived water samples improved TEER and led to low permeability in the inflamed Caco-2 cell model. This narrowing of the TJ spacing is regulated by occludin and claudin-1, and it serves to reduce paracellular permeability. Alternatively, high intestinal permeability due to loose TJs is one of the causes of IBD [48]. Gene expression of occludin, claudin-1, and claudin-3 was high in the HMLS group. However, it is unclear at this time why this particular magnesium:calcium ratio induces high TJ gene expression. In line with our findings, it has been previously reported that magnesium is involved in increasing the mRNA expression of occludin, ZO-1, and claudins [49].
A chronic or acute colitis mouse model can be generated by administering DSS to mice. This model is known to be a good model for studying pathological and immunological properties [50]. Pathological features of the colon in this model include granulation around the epidermis, severe swelling of the tissue wall, hypertrophy of the mucous tissues, and infiltration of granulocytes, including eosinophils [51]. The DSS colitis model has been widely applied for studies examining anti-inflammatory and TJ permeability [52,53], and we, therefore, believed it to be a suitable model our analysis of anti-inflammatory mechanisms associated with the intake of mineral water derived from DSW rather than the intraperitoneal in vivo TJ permeability model that uses LPS [54]. In this study, we provided mice with drinking water containing 5% DSS for seven days to establish an acute colitis model. DSS caused weight loss and colonic tissue damage, and it reduced colon length. Severe inflammation, high lesion depth, and glandular damage, which are typical of acute ulcerative colitis, were observed in the colons of these mice by microscopy [55].
Mice were provided HMLS and TM drinking water ad libitum for 21 days to investigate the effects of DSW-derived waters on colitis. Weight loss in response to colitis was not significantly inhibited. However, HMLS slightly improved colon length and the DAI score. Under intestinal inflammation, mucosal areas of the colon typically show spreading inflammation, damage to the glandular structures, and a reduction in goblet cells [33,56]. Inflammatory cell infiltration and glandular damage were improved upon treatment with HMLS or TM, as indicated by hematoxylin and eosin staining. Similarly, in another study, Mg supplementation resulted in improved restoration of mucosal integrity and channel expression [57]. However, in the current study, due to the high DSS concentration, the pathological symptoms were not found to significantly improve. However, FD-4 permeability results reveal higher permeability in these groups. This can be explained by the fact that intestinal cells were disrupted by DSS before TJ permeability was confirmed. In line with this, we did not identify TJ-related DEG in DSS vs. DSW, likely because the high-level DSS treatment led to intestinal cell destruction. Similarly, in a previous study using 3% DSS, ZO-1 protein expression was not observed on Day 7 after DSS treatment [58].
RNA-seq results from DSS-induced colonic tissues revealed that the majority of DEG were involved in the immune system and inflammatory response. As TNF and NOS2, which had the most protein nodes in the PPI network among the significant DEG between the DSS and HMLS groups, were significantly reduced, other genes related to inflammation were also significantly suppressed. This is in line with previous studies reporting that DSW reduced LPS-induced NO and iNOS expression in Raw 264.7 cells [26]. TNF-α is one of the important inflammatory cytokines and strongly stimulates the production of cytokines such as IL-6 and IL-8, causing cytokine storms [59,60]. TNF-α -inhibitory drugs improve IBD [61]. We found that HMLS, which is high in magnesium, might suppress TNF-α and thus mitigate IBD. In addition, magnesium reportedly inhibits NF-κB and decreases the release of inflammatory cytokines by increasing intracellular basal IĸBα levels [62]. HMLS suppressed inflammatory gene expression more strongly than did TM.
SLE was the most highly represented KEGG pathway in the DEG between DSS and HMLS. SLE is a chronic autoimmune disorder that involves immune dysregulation and antinuclear antibody and affects multiple tissues and organ systems [63]. Based on gene enrichment in the SLE pathway, HMLS promoted the generation of B cells and reduced the expression of H2-Ab1 and Hbb-b1, which are related to MHCII molecules involved in the immune response. This finding was consistent with a previous finding that a calcium-rich diet maintains intestinal permeability and protects from IBD-related intestinal inflammation in HLA-B27 transgenic mice [64].
Further, RNA-seq interestingly revealed that the expression of various histone genes that were downregulated by DSS were rescued upon HMLS water consumption. In general, when DNA damage occurs, histone gene expression decreases [65]. According to KEGG pathway analysis, histones H2A, H2B, H3, and H4, which are involved in the function of autoantigens, were associated with SLE due to active MHCII, B-cell receptor signal transduction, and autoantibodies. In general, H2A and H2B form octamers with H3 and H4 and are involved in the packaging of DNA with nucleosomes [66]. As cells struggle to repair chemotherapy-induced DNA damage, decreased histone transcript levels may indicate cell cycle arrest [67]. Our data support that low expression of histone variants in DSS-induced IBD suggests a correlation with DNA repair mechanisms associated with DNA damage. DNA silencing and repair pathways are activated upon mineral water consumption because miRNA-processing proteins that regulate the genes involved are Mg2+-dependent [68]. However, it remains unknown how minerals affect the expression of these histone variants involved in DNA repair.
DSW contains various minerals. In particular, DSW was found to be richer in magnesium than in calcium. The importance of calcium-to-magnesium intake ratios in minimizing the risk of rectal cancer has been reported; a calcium-to-magnesium ratio of 1.7 or 2.5 significantly reduced cancer, cardiovascular risk, and mortality in a dose-dependent manner [69,70,71]. Calcium and magnesium can antagonize each other’s absorption because they are both divalent ions [72]. This suggests that a balanced mineral intake based on in-vitro and in-vivo experiments should be validated in human studies.
Numerous studies have illustrated that DSW-derived mineral water can serve as a functional food with anti-diabetic, anti-obesity, and anti-inflammatory properties. Further, various natural products extracted using DSW had better functionality than those extracted using distilled water [73,74,75,76,77]. This suggests that DSW has application potential in the development of many functional foods, which requires further study.
Certain limitations were noted in this study. First, calcium and magnesium ratios are important, but this study did not identify the differences in each ratio. Second, in the in vitro model, inflammation is caused by macrophages, causing TJ collapse, whereas DSS induces collapse of the mucosa, causing colitis and ulcers. Therefore, the mechanism of inflammation differs. Moreover, the 5% DSS concentration was too high to clearly observe the anti-inflammatory effects following intake of DSW-derived mineral water. Third, effects of the intestinal microbiota and mucus layer involved in immunity should not be overlooked, but were not directly addressed in this study. Finally, we did not verify protein expression of the inflammatory and TJ genes, which must be confirmed in further studies.

5. Conclusions

This study showed that anti-inflammatory properties of DSW vary depending on the proportion and amounts of magnesium and calcium, the main minerals in DSW. In an in vitro model, a DSW sample with HMLS inhibited the increase in permeability and strongly protected intestinal binding protein expression at the genetic level in LPS-induced cocultured Caco-2 and RAW264.7 cells. In an in vivo model, this DSW sample improved the pathological status in colons of BALB/c mice with DSS-induced colitis. The underlying mechanism was found to involve a reduction in the expression of pro-inflammatory genes, such as TNF-α and NOS2. These findings suggest that, from a nutritional point of view, supplementing drinking water with high magnesium and low salt content may enhance the anti-inflammatory properties and binding protein protection.

Supplementary Materials

The following are available online at https://0-www-mdpi-com.brum.beds.ac.uk/2076-3417/10/15/5183/s1, Figure S1: Different expression gene PCA analysis in all groups. Figure S2: Total tight junction related gene heatmap. Figure S3: PPI networks of inflammatory response DEGs for CON vs. DSS and DSS vs. TM groups Table S1: Detailed mineral components of DSW-derived water samples contents. Table S2: Detailed information on the differentially expressed genes between DSS group and the three groups. Table S3: Differentially expressed genes list not specified in DAVID of each group. Table S4: Detailed functional enrichment analysis of differentially expressed gene between DSS group and each group.

Author Contributions

Conceptualization, G.P., B.G.K., G.-H.J., J.-e.J. and B.S.H.; Data curation, J.N. and K.J.K.; Formal analysis, J.N. and K.J.K.; Investigation, J.N. and K.J.K.; Methodology, J.Y.K.; Project administration, J.Y.K.; Resources, G.P., B.G.K., G.-H.J., J.-e.J. and B.S.H.; Supervision, J.Y.K.; Visualization, J.N. and K.J.K.; Writing—original draft, J.N.; and Writing—review and editing, J.Y.K. All authors have read and agreed to the published version of the manuscript.

Funding

This work was supported by a National Research Foundation of Korea (NRF) grant funded by the Korea government (MEST) (No. 2017R1E1A1A01074320).

Conflicts of Interest

The sponsors had no role in the design, execution, interpretation, or writing of the study.

References

  1. Podolsky, D.K. Inflammatory bowel disease. N. Engl. J. Med. 1991, 325, 1008–1016. [Google Scholar] [CrossRef]
  2. Guo, T.; Song, D.; Cheng, L.; Zhang, X. Interactions of tea catechins with intestinal microbiota and their implication for human health. Food Sci. Biotechnol. 2019, 28, 1617–1625. [Google Scholar] [CrossRef]
  3. Mowat, C.; Cole, A.; Windsor, A.; Ahmad, T.; Arnott, I.; Driscoll, R.; Mitton, S.; Orchard, T.; Rutter, M.; Younge, L. Guidelines for the management of inflammatory bowel disease in adults. Gut 2011, 60, 571–607. [Google Scholar] [CrossRef] [PubMed] [Green Version]
  4. Verhave, M.; Winter, H.S.; Grand, R.J. Azathioprine in the treatment of children with inflammatory bowel disease. J. Pediatrics 1990, 117, 809–814. [Google Scholar] [CrossRef]
  5. Neurath, M.F. Cytokines in inflammatory bowel disease. Nat. Rev. Immunol. 2014, 14, 329–342. [Google Scholar] [CrossRef]
  6. Strober, W.; Fuss, I.J.; Blumberg, R.S. The immunology of mucosal models of inflammation. Annu. Rev. Immunol. 2002, 20, 495–549. [Google Scholar] [CrossRef] [PubMed]
  7. Fasano, A. Leaky gut and autoimmune diseases. Clin. Rev. Allergy Immunol. 2012, 42, 71–78. [Google Scholar] [CrossRef]
  8. Edelblum, K.L.; Turner, J.R. The tight junction in inflammatory disease: Communication breakdown. Curr. Opin. Pharmacol. 2009, 9, 715–720. [Google Scholar] [CrossRef] [PubMed] [Green Version]
  9. Gonzalez-Mariscal, L.; Contreras, R.; Bolivar, J.; Ponce, A.; Chavez De Ramirez, B.; Cereijido, M. Role of calcium in tight junction formation between epithelial cells. Am. J. Physiol. Cell Physiol. 1990, 259, C978–C986. [Google Scholar] [CrossRef]
  10. Ma, T.Y.; Tran, D.; Hoa, N.; Nguyen, D.; Merryfield, M.; Tarnawski, A. Mechanism of extracellular calcium regulation of intestinal epithelial tight junction permeability: Role of cytoskeletal involvement. Microsc. Res. Tech. 2000, 51, 156–168. [Google Scholar] [CrossRef]
  11. Lechuga, S.; Ivanov, A.I. Disruption of the epithelial barrier during intestinal inflammation: Quest for new molecules and mechanisms. Biochim. Biophys. Acta (BBA)-Mol. Cell Res. 2017, 1864, 1183–1194. [Google Scholar] [CrossRef] [PubMed]
  12. Scanlan, B.J.; Tuft, B.; Elfrey, J.E.; Smith, A.; Zhao, A.; Morimoto, M.; Chmielinska, J.J.; Tejero-Taldo, M.I.; Mak, I.T.; Weglicki, W.B. Intestinal inflammation caused by magnesium deficiency alters basal and oxidative stress-induced intestinal function. Mol. Cell. Biochem. 2007, 306, 59–69. [Google Scholar] [CrossRef] [PubMed]
  13. Weglicki, W.B.; Mak, I.T.; Chmielinska, J.J.; Tejero-Taldo, M.I.; Komarov, A.; Kramer, J.H. The role of magnesium deficiency in cardiovascular and intestinal inflammation. Magnes. Res. Off. Organ Int. Soc. Dev. Res. Magnes. 2010, 23, S199. [Google Scholar]
  14. Heaney, R.; Dowell, M. Absorbability of the calcium in a high-calcium mineral water. Osteoporos. Int. 1994, 4, 323–324. [Google Scholar] [CrossRef] [PubMed]
  15. Kiss, S.A.; Forster, T.; Dongó, Á. Absorption and effect of the magnesium content of a mineral water in the human body. J. Am. Coll. Nutr. 2004, 23, 758S–762S. [Google Scholar] [CrossRef]
  16. Böhmer, H.; Müller, H.; Resch, K.-L. Calcium supplementation with calcium-rich mineral waters: A systematic review and meta-analysis of its bioavailability. Osteoporos. Int. 2000, 11, 938–943. [Google Scholar] [CrossRef]
  17. Sabatier, M.; Arnaud, M.J.; Kastenmayer, P.; Rytz, A.; Barclay, D.V. Meal effect on magnesium bioavailability from mineral water in healthy women. Am. J. Clin. Nutr. 2002, 75, 65–71. [Google Scholar] [CrossRef] [Green Version]
  18. Aamodt, G.; Bukholm, G.; Jahnsen, J.; Moum, B.; Vatn, M.H.; Group, I.S. The association between water supply and inflammatory bowel disease based on a 1990–1993 cohort study in southeastern Norway. Am. J. Epidemiol. 2008, 168, 1065–1072. [Google Scholar] [CrossRef]
  19. Nani, M.; Zura, S.; Majid, F.A.A.; Jaafar, A.B.; Mahdzir, A.; Musa, M.N. Potential health benefits of deep sea water: A review. Evid. Based Complement. Altern. Med. 2016, 2016. [Google Scholar] [CrossRef]
  20. Hwang, H.S.; Kim, S.H.; Yoo, Y.G.; Chu, Y.S.; Shon, Y.H.; Nam, K.S.; Yun, J.W. Inhibitory effect of deep-sea water on differentiation of 3T3-L1 adipocytes. Mar. Biotechnol. 2009, 11, 161–168. [Google Scholar] [CrossRef]
  21. Ha, B.; Shin, E.; Park, J.-E.; Shon, Y. Anti-diabetic effect of balanced deep-sea water and its mode of action in high-fat diet induced diabetic mice. Mar. Drugs 2013, 11, 4193–4212. [Google Scholar] [CrossRef]
  22. Hsu, T.-C.; Chiu, C.-C.; Lin, H.-L.; Kao, T.-W.; Chen, L.-J.; Wu, L.-Y.; Huang, C.-Y.; Tzang, B.-S. Attenuated effects of deep-sea water on hepatic apoptosis in STZ-induced diabetic rats. Chin. J. Physiol. 2015, 58, 197–205. [Google Scholar] [PubMed] [Green Version]
  23. Bak, J.-P.; Kim, Y.-M.; Son, J.; Kim, C.-J.; Kim, E.-H. Application of concentrated deep sea water inhibits the development of atopic dermatitis-like skin lesions in NC/Nga mice. BMC Complement. Altern. Med. 2012, 12, 108. [Google Scholar] [CrossRef] [PubMed] [Green Version]
  24. Kimata, H.; Tai, H.; Nakagawa, K.; Yokoyama, Y.; Nakajima, H.; Ikegami, Y. Improvement of skin symptoms and mineral imbalance by drinking deep sea water in patients with atopic eczema/dermatitis syndrome (AEDS). Acta Med. (Hradec Kralove) 2002, 45, 83–84. [Google Scholar] [CrossRef]
  25. Kimata, H.; Tai, H.; Nakajima, H. Reduction of allergic skin responses and serum allergen-specific IgE and IgE-inducing cytokines by drinking deep-sea water in patients with allergic rhinitis. Oto-Rhino-Laryngol. Nova 2001, 11, 302–303. [Google Scholar] [CrossRef]
  26. Kim, Y.-J.; Jung, I.-S.; Song, H.-J.; Choi, E.-Y.; Choi, I.-S.; Choi, Y.-J. Study of deep ground sea-like water on antioxidant activity and the immune response in RAW264. 7 Macrophages. J. Life Sci. 2008, 18, 329–335. [Google Scholar] [CrossRef]
  27. Jung, S.; Joo, E.; Yoo, J.; Kim, Y.; Cho, Y.; Yoon, B.; Cho, J.; Nam, K.; Kwang, S. Effect of the supply of natural water from deep sea rock on the immune response and antioxidant activity in rats. J. Anim. Sci. Technol. 2006. [Google Scholar] [CrossRef] [Green Version]
  28. Lee, K.S.; Chun, S.Y.; Kwon, Y.S.; Kim, S.; Nam, K.S. Deep sea water improves hypercholesterolemia and hepatic lipid accumulation through the regulation of hepatic lipid metabolic gene expression. Mol. Med. Rep. 2017, 15, 2814–2822. [Google Scholar] [CrossRef]
  29. Ha, B.G.; Park, J.-E.; Cho, H.-J.; Shon, Y.H. Stimulatory effects of balanced deep sea water on mitochondrial biogenesis and function. PLoS ONE 2015, 10, e0129972. [Google Scholar] [CrossRef] [Green Version]
  30. Wu, S.-J.; Don, T.-M.; Lin, C.-W.; Mi, F.-L. Delivery of berberine using Chitosan/Fucoidan-Taurine conjugate nanoparticles for treatment of defective intestinal epithelial tight junction barrier. Mar. Drugs 2014, 12, 5677–5697. [Google Scholar] [CrossRef] [Green Version]
  31. Livak, K.J.; Schmittgen, T.D. Analysis of relative gene expression data using real-time quantitative PCR and the 2- ΔΔCT method. Methods 2001, 25, 402–408. [Google Scholar] [CrossRef] [PubMed]
  32. Cooper, H.S.; Murthy, S.; Shah, R.; Sedergran, D. Clinicopathologic study of dextran sulfate sodium experimental murine colitis. Lab. Investig. A J. Tech. Methods Pathol. 1993, 69, 238–249. [Google Scholar]
  33. Rees, V. Chronic experimental colitis induced by dextran sulphate sodium (DSS) is characterized by Th1 and Th2 cytokines. Clin. Exp. Immunol. 1998, 114, 385–391. [Google Scholar]
  34. Tambuwala, M.M.; Cummins, E.P.; Lenihan, C.R.; Kiss, J.; Stauch, M.; Scholz, C.C.; Fraisl, P.; Lasitschka, F.; Mollenhauer, M.; Saunders, S.P. Loss of prolyl hydroxylase-1 protects against colitis through reduced epithelial cell apoptosis and increased barrier function. Gastroenterology 2010, 139, 2093–2101. [Google Scholar] [CrossRef] [PubMed] [Green Version]
  35. Trapnell, C.; Roberts, A.; Goff, L.; Pertea, G.; Kim, D.; Kelley, D.R.; Pimentel, H.; Salzberg, S.L.; Rinn, J.L.; Pachter, L. Differential gene and transcript expression analysis of RNA-seq experiments with TopHat and Cufflinks. Nat. Protoc. 2012, 7, 562. [Google Scholar] [CrossRef] [Green Version]
  36. Smoot, M.E.; Ono, K.; Ruscheinski, J.; Wang, P.-L.; Ideker, T. Cytoscape 2.8: New features for data integration and network visualization. Bioinformatics 2010, 27, 431–432. [Google Scholar] [CrossRef] [Green Version]
  37. Sherman, B.T.; Lempicki, R.A. Systematic and integrative analysis of large gene lists using DAVID bioinformatics resources. Nat. Protoc. 2009, 4, 44–57. [Google Scholar]
  38. Moon, D.-S.; Kim, K.S.; Gi, H.; Choi, M.Y.; Jung, H.J.; Kim, H.J. The hardness water production by RO/NF/ED linking process from deep seawater. J. Korean Soc. Mar. Environ. Energy 2013, 16, 227–238. [Google Scholar] [CrossRef]
  39. Wu, C.; Yosef, N.; Thalhamer, T.; Zhu, C.; Xiao, S.; Kishi, Y.; Regev, A.; Kuchroo, V.K. Induction of pathogenic T H 17 cells by inducible salt-sensing kinase SGK1. Nature 2013, 496, 513–517. [Google Scholar] [CrossRef] [Green Version]
  40. Zhu, H.; Pollock, N.K.; Kotak, I.; Gutin, B.; Wang, X.; Bhagatwala, J.; Parikh, S.; Harshfield, G.A.; Dong, Y. Dietary sodium, adiposity, and inflammation in healthy adolescents. Pediatrics 2014, 133, e635–e642. [Google Scholar] [CrossRef] [Green Version]
  41. Arora, M. Cell culture media: A review. Mater Methods 2013, 3, 24. [Google Scholar] [CrossRef]
  42. Tanoue, T.; Nishitani, Y.; Kanazawa, K.; Hashimoto, T.; Mizuno, M. In Vitro model to estimate gut inflammation using co-cultured Caco-2 and RAW264. 7 cells. Biochem. Biophys. Res. Commun. 2008, 374, 565–569. [Google Scholar] [CrossRef] [PubMed] [Green Version]
  43. Ma, T.Y.; Boivin, M.A.; Ye, D.; Pedram, A.; Said, H.M. Mechanism of TNF-α modulation of Caco-2 intestinal epithelial tight junction barrier: Role of myosin light-chain kinase protein expression. Am. J. Physiol. Gastrointest. Liver Physiol. 2005, 288, G422–G430. [Google Scholar] [CrossRef] [PubMed] [Green Version]
  44. McKay, D.M.; Baird, A.W. Cytokine regulation of epithelial permeability and ion transport. Gut 1999, 44, 283–289. [Google Scholar] [CrossRef] [PubMed] [Green Version]
  45. Tang, V.W.; Goodenough, D.A. Paracellular ion channel at the tight junction. Biophys. J. 2003, 84, 1660–1673. [Google Scholar] [CrossRef] [Green Version]
  46. Vermette, D.; Hu, P.; Canarie, M.F.; Funaro, M.; Glover, J.; Pierce, R.W. Tight junction structure, function, and assessment in the critically ill: A systematic review. ICMx 2018, 6, 37. [Google Scholar] [CrossRef] [Green Version]
  47. Itallie, C.V.; Rahner, C.; Anderson, J.M. Regulated expression of claudin-4 decreases paracellular conductance through a selective decrease in sodium permeability. J. Clin. Investig. 2001, 107, 1319–1327. [Google Scholar] [CrossRef] [Green Version]
  48. Lee, S.H. Intestinal permeability regulation by tight junction: Implication on inflammatory bowel diseases. Intest. Res. 2015, 13, 11. [Google Scholar] [CrossRef] [Green Version]
  49. Pachikian, B.D.; Neyrinck, A.M.; Deldicque, L.; De Backer, F.C.; Catry, E.; Dewulf, E.M.; Sohet, F.M.; Bindels, L.B.; Everard, A.; Francaux, M. Changes in intestinal bifidobacteria levels are associated with the inflammatory response in magnesium-deficient mice. J. Nutr. 2010, 140, 509–514. [Google Scholar] [CrossRef] [Green Version]
  50. Kim, J.J.; Shajib, M.S.; Manocha, M.M.; Khan, W.I. Investigating intestinal inflammation in DSS-induced model of IBD. JoVE J. Vis. Exp. 2012, e3678. [Google Scholar] [CrossRef] [Green Version]
  51. Chassaing, B.; Aitken, J.D.; Malleshappa, M.; Vijay-Kumar, M. Dextran sulfate sodium (DSS)-induced colitis in mice. Curr. Protoc. Immunol. 2014, 104, 15.25. 1–15.25. 14. [Google Scholar] [CrossRef]
  52. Woo, J.K.; Choi, S.; Kang, J.-H.; Kim, D.E.; Hurh, B.-S.; Jeon, J.-E.; Kim, S.Y.; Oh, S.H. Fermented barley and soybean (BS) mixture enhances intestinal barrier function in dextran sulfate sodium (DSS)-induced colitis mouse model. Bmc Complement. Altern. Med. 2016, 16, 1–9. [Google Scholar] [CrossRef] [Green Version]
  53. Kim, M.S.; Kim, J.Y. Ginger attenuates inflammation in a mouse model of dextran sulfate sodium-induced colitis. Food Sci. Biotechnol. 2018, 27, 1493–1501. [Google Scholar] [CrossRef] [PubMed]
  54. Guo, S.; Al-Sadi, R.; Said, H.M.; Ma, T.Y. Lipopolysaccharide causes an increase in intestinal tight junction permeability In Vitro and In Vivo by inducing enterocyte membrane expression and localization of TLR-4 and CD14. Am. J. Pathol. 2013, 182, 375–387. [Google Scholar] [CrossRef] [PubMed] [Green Version]
  55. DeRoche, T.C.; Xiao, S.-Y.; Liu, X. Histological evaluation in ulcerative colitis. Gastroenterol. Rep. 2014, 2, 178–192. [Google Scholar] [CrossRef] [Green Version]
  56. Erben, U.; Loddenkemper, C.; Doerfel, K.; Spieckermann, S.; Haller, D.; Heimesaat, M.M.; Zeitz, M.; Siegmund, B.; Kühl, A.A. A guide to histomorphological evaluation of intestinal inflammation in mouse models. Int. J. Clin. Exp. Pathol. 2014, 7, 4557. [Google Scholar] [PubMed]
  57. Trapani, V.; Petito, V.; Di Agostini, A.; Arduini, D.; Hamersma, W.; Pietropaolo, G.; Luongo, F.; Arena, V.; Stigliano, E.; Lopetuso, L.R. Dietary magnesium alleviates experimental murine colitis through upregulation of the transient receptor potential melastatin 6 channel. Inflamm. Bowel Dis. 2018, 24, 2198–2210. [Google Scholar] [CrossRef] [PubMed]
  58. Poritz, L.S.; Garver, K.I.; Green, C.; Fitzpatrick, L.; Ruggiero, F.; Koltun, W.A. Loss of the tight junction protein ZO-1 in dextran sulfate sodium induced colitis. J. Surg. Res. 2007, 140, 12–19. [Google Scholar] [CrossRef]
  59. Scharl, M.; R Vavricka, S.; Rogler, G. New anti-cytokines for IBD: What is in the pipeline? Curr. Drug Targets 2013, 14, 1405–1420. [Google Scholar] [CrossRef] [Green Version]
  60. Zhang, J.-M.; An, J. Cytokines, inflammation and pain. Int. Anesthesiol. Clin. 2007, 45, 27. [Google Scholar] [CrossRef] [Green Version]
  61. Rutgeerts, P.; Van Assche, G.; Vermeire, S. Optimizing anti-TNF treatment in inflammatory bowel disease. Gastroenterology 2004, 126, 1593–1610. [Google Scholar] [CrossRef] [PubMed] [Green Version]
  62. Sugimoto, J.; Romani, A.M.; Valentin-Torres, A.M.; Luciano, A.A.; Kitchen, C.M.R.; Funderburg, N.; Mesiano, S.; Bernstein, H.B. Magnesium decreases inflammatory cytokine production: A novel innate immunomodulatory mechanism. J. Immunol. 2012, 188, 6338–6346. [Google Scholar] [CrossRef] [Green Version]
  63. Mazzone, R.; Zwergel, C.; Artico, M.; Taurone, S.; Ralli, M.; Greco, A.; Mai, A. The emerging role of epigenetics in human autoimmune disorders. Clin. Epigenetics 2019, 11, 1–15. [Google Scholar] [CrossRef] [PubMed] [Green Version]
  64. Zhu, Y.; Mahon, B.D.; Froicu, M.; Cantorna, M.T. Calcium and 1α, 25-dihydroxyvitamin D3 target the TNF-α pathway to suppress experimental inflammatory bowel disease. Eur. J. Immunol. 2005, 35, 217–224. [Google Scholar] [CrossRef] [PubMed]
  65. Su, C.; Gao, G.; Schneider, S.; Helt, C.; Weiss, C.; O’Reilly, M.A.; Bohmann, D.; Zhao, J. DNA damage induces downregulation of histone gene expression through the G1 checkpoint pathway. Embo J. 2004, 23, 1133–1143. [Google Scholar] [CrossRef] [Green Version]
  66. Mariño-Ramírez, L.; Kann, M.G.; Shoemaker, B.A.; Landsman, D. Histone structure and nucleosome stability. Expert Rev. Proteom. 2005, 2, 719–729. [Google Scholar] [CrossRef]
  67. Becker, K.A.; Stein, J.L.; Lian, J.B.; Van Wijnen, A.J.; Stein, G.S. Establishment of histone gene regulation and cell cycle checkpoint control in human embryonic stem cells. J. Cell. Physiol. 2007, 210, 517–526. [Google Scholar] [CrossRef]
  68. Beckett, E.L.; Yates, Z.; Veysey, M.; Duesing, K.; Lucock, M. The role of vitamins and minerals in modulating the expression of microRNA. Nutr. Res. Rev. 2014, 27, 94–106. [Google Scholar] [CrossRef] [Green Version]
  69. Dai, Q.; Shu, X.-O.; Deng, X.; Xiang, Y.-B.; Li, H.; Yang, G.; Shrubsole, M.J.; Ji, B.; Cai, H.; Chow, W.-H. Modifying effect of calcium/magnesium intake ratio and mortality: A population-based cohort study. BMJ Open 2013, 3, e002111. [Google Scholar] [CrossRef] [Green Version]
  70. Rowe, W.J. Calcium-magnesium-ratio intake and cardiovascular risk. Am. J. Cardiol. 2006, 98, 140. [Google Scholar] [CrossRef]
  71. Zhao, J.; Giri, A.; Zhu, X.; Shrubsole, M.J.; Jiang, Y.; Guo, X.; Ness, R.; Seidner, D.L.; Giovannucci, E.; Edwards, T.L. Calcium: Magnesium intake ratio and colorectal carcinogenesis, results from the prostate, lung, colorectal, and ovarian cancer screening trial. Br. J. Cancer 2019, 121, 796–804. [Google Scholar] [CrossRef] [PubMed]
  72. Dai, Q.; Sandler, R.S.; Barry, E.L.; Summers, R.W.; Grau, M.V.; Baron, J.A. Calcium, magnesium, and colorectal cancer. Epidemiology (Camb. Mass.) 2012, 23, 504. [Google Scholar] [CrossRef] [PubMed] [Green Version]
  73. Hwang, M.H.; Lee, D.G.; Go, E.B.; Cho, M.; Park, Y.S.; Chung, N. Anti-diabetic effect of magnesium salt extracts from deep-sea water in C57BLKS/J-db/db mice. Appl. Biol. Chem. 2017, 60, 95–99. [Google Scholar] [CrossRef]
  74. Maxwell, T.; Lee, K.-S.; Chun, S.-Y.; Nam, K.-S. Mineral-balanced deep sea water enhances the inhibitory effects of chitosan oligosaccharide on atopic dermatitis-like inflammatory response. Biotechnol. Bioprocess. Eng. 2017, 22, 120–128. [Google Scholar] [CrossRef]
  75. Yokota, J.; Kitaoka, T.; Jobu, K.; Takuma, D.; Hamada, A.; Onogawa, M.; Yoshioka, S.; Kyotani, S.; Miyamura, M. Eriobotrya japonica seed extract and deep sea water protect against indomethacin-induced gastric mucosal injury in rats. J. Nat. Med. 2011, 65, 9–17. [Google Scholar] [CrossRef]
  76. Yuan, H.; Chung, S.; Ma, Q.; Ye, L.; Piao, G. Combination of deep sea water and Sesamum indicum leaf extract prevents high-fat diet-induced obesity through AMPK activation in visceral adipose tissue. Exp. Ther. Med. 2016, 11, 338–344. [Google Scholar] [CrossRef] [Green Version]
  77. Lee, K.W.; Shim, J.M.; Kim, D.W.; Yao, Z.; Kim, J.A.; Kim, H.-J.; Kim, J.H. Effects of different types of salts on the growth of lactic acid bacteria and yeasts during kimchi fermentation. Food Sci. Biotechnol. 2018, 27, 489–498. [Google Scholar] [CrossRef]
Figure 1. Effects of DSW-derived mineral waters on TEER and permeability: (a) time course analysis of TEER in a Caco-2 monolayer treated with the indicated mineral waters and LPS; (b) TEER values of the treatment groups at 48 h; and (c) effects of mineral water samples on FITC-dextran permeability. Caco-2 cells were cultured on the apical side of a Transwell insert and Raw 264.7 cells were seeded on the basolateral side. After 24 h, the medium was exchanged for medium containing the water samples, LPS (2 µg/mL) was added to the basolateral side, and the plate was incubated for 48 h. Different letters above the bars indicate significant differences (Duncan’s multiple range test; p < 0.05). The letters are the order of values from small to large.
Applsci 10 05183 g001
Figure 2. Effects of mineral water samples on TJ-related mRNA expression levels. Relative mRNA expression levels in all treatment groups, as measured by qRT-PCR, of: (a) Occludin; (b) ZO-1; (c) JAM-1; (d) claudin-1; (e) claudin-3; and (f) claudin-4. Different letters above the bars indicate significant differences (Duncan’s multiple range test; p < 0.05). The letters are the order of values from small to large.
Applsci 10 05183 g002
Figure 3. Effects of DSW-derived mineral waters on clinical symptoms and colon length in DSS-induced colitis: (a) body weights throughout the experimental period; (b) the area under the curve of the body weight; (c) DAI scores throughout the experimental period; (d) the area under the curve of DAI scores; (e) colon length in each group at the end of the experiment; and (f) representative colons of each group. Con, Control (n = 8); DSS, 5% DSS-induced colitis (n = 6); HMLS, colitis plus HMLS treatment (n = 7); TM, colitis plus TM treatment (n = 7). Different letters above the bars indicate significant differences (Duncan’s multiple range test; p < 0.05). The letters are the order of values from small to large.
Applsci 10 05183 g003
Figure 4. Effects of DSW-derived mineral waters on colonic histopathological changes. Histopathological features of colons from BALB/c mice with 5% DSS-induced colitis. Hematoxylin and eosin staining. Magnification, 200× (bar = 200 mm) (representative samples).
Applsci 10 05183 g004
Figure 5. Mineral waters do not improve DSS-induced intestinal permeability in mice. Mice were provided ad libitum with drinking water (CON), 5% DSS in water (DSS), 5% DSS in HMLS water (HMLS), or 5% DSS in TM water (TM) for seven days. A FD-4 permeability assay was performed on Day 7. Different letters above the bars indicate significant differences (Duncan’s multiple range test; p < 0.05). The letters are the order of values from small to large.
Applsci 10 05183 g005
Figure 6. Differential gene expression in colonic tissues in the treatment groups by RNA-seq analysis. (ac) Correlation of mRNA expression levels (log) in CON vs. DSS, DSS vs. HMLS, and DSS vs. TM. (n; CON = 8, DSS = 5, HMLS = 4, and TM = 5). (d) Heatmap shows the z-scores based on the average of each expressed gene which is related inflammatory response. The squares display the respective frequencies according to the color scale shown on top.
Applsci 10 05183 g006
Figure 7. PPI network of identified DEGs in DSS vs. HMLS groups constructed using the STRING database. Circles represent proteins, lines represent the interaction of proteins, and the results within the circle represent the structure of proteins. Line thickness represents the degree of interaction between proteins (Confidence cut-off score > 0.4). Circle color indicates log2 fold change, with blue indicating downregulated and red indicating upregulated expression. The larger is the circle, the lower is the p-value. (a) PPI network of identified DEGs in DSS vs. HMLS groups (b) PPI network of inflammatory reaction DEGs in DSS vs. HMLS groups.
Applsci 10 05183 g007
Table 1. Main mineral contents of water samples prepared by dialysis of DSW and ion addition.
SampleMineral Contents (ppm)Na/MgMg/Ca
Na+Mg2+K+Ca2+
DSW10,70013804803907.753.5
TM29.56.71.72.44.42.8
HM39.924845.20.780.16318
HMLS361791.741.50.24.3
HMHC133211482000.631.1
DSW (deep sea water), TM (trace mineral), HM (high magnesium), HMLS (high magnesium low sodium), and HMHC (high magnesium high calcium).
Table 2. Inflammatory Differential Gene Expression in the DSS vs. HMLS Group.
Gene IDGene NameFold ChangeFDR
Downregulated
NOS2Nitric oxide synthase 20.1291.13 × 10−3
C2cd4bC2 calcium dependent domain containing 4B0.1631.13 × 10−3
Ccl8C-C motif chemokine ligand 80.2229.43 × 10−2
Reg3gRegenerating family member 3 gamma0.3721.13 × 10−3
Serpina3nSerine (or cysteine) peptidase inhibitor, clade A, member 3N0.3801.13 × 10−3
Crlf2Cytokine receptor like factor 20.4139.42 × 10−3
Tac4Tachykinin 40.4318.63 × 10−2
Ido1Indoleamine 2,3-dioxygenase 10.4341.13 × 10−3
Gbp5Guanylate binding protein 50.4423.10 × 10−2
HckHCK proto-oncogene, Src family tyrosine kinase0.4431.33 × 10−2
TnfTumor necrosis factor0.4791.11 × 10−2
Reg3aRegenerating family member 3 alpha0.4824.53 × 10−2
Upregulated
Hmox1Heme oxygenase 12.0275.79 × 10−3
Ccl20C-C motif chemokine ligand 202.9402.05 × 10−3
FDR, false discovery rate.
Table 3. Functional enrichment analysis of inflammatory DEGs in the HMLS compared to the DSS group.
CategoryTermIDpBenjamini
GO, cellular componentNucleosomeGO:00007865.43 × 10−269.55 × 10⁻²⁴
Nuclear nucleosomeGO:00007889.14 × 10−218.04 × 10⁻¹⁹
Extracellular regionGO:00055761.04 × 10−116.10 × 10⁻¹⁰
Extracellular spaceGO:00056159.96 × 10−104.38 × 10⁻⁸
KEGG pathwaysSystemic lupus erythematosusMmu053222.95 × 10−244.34 × 10⁻²²
AlcoholismMmu050343.57 × 10−182.62 × 10⁻¹⁶
GO, biological processNucleosome assemblyGO:00063343.76 × 10−163.56 × 10⁻¹³
Regulation of gene silencingGO:00609684.25 × 10−122.27 × 10⁻⁹
DNA methylation on cytosineGO:00327761.84 × 10−106.55 × 10⁻⁸
XenophagyGO:00987921.06 × 10−092.40 × 10⁻⁷
GO, Gene Ontology; KEGG, Kyoto Encyclopedia of Genes and Genomes. The DAVID functional analysis tool was used to perform GO analysis to identify overrepresented terms for each module. The Benjamini–Hochberg method was used for multiple test hypothesis correction to control the FDR (FDR < 0.1).

