Scenario-Based Marine Oil Spill Emergency Response Using Hybrid Deep Reinforcement Learning and Case-Based Reasoning

1
School of Geodesy and Geomatics, Wuhan University, Wuhan 430072, China
2
State Key Laboratory of Information Engineering in Surveying, Mapping and Remote Sensing, Wuhan University, Wuhan 430072, China
*
Author to whom correspondence should be addressed.
Appl. Sci. 2020, 10(15), 5269; https://0-doi-org.brum.beds.ac.uk/10.3390/app10155269
Submission received: 15 July 2020
/
Revised: 25 July 2020
/
Accepted: 27 July 2020
/
Published: 30 July 2020
(This article belongs to the Special Issue Machine Learning Techniques Applied to Geospatial Big Data)
Abstract
:Case-based reasoning (CBR) systems often provide a basis for decision makers to make management decisions in disaster prevention and emergency response. For decades, many CBR systems have been implemented by using expert knowledge schemes to build indexes for case identification from a case library of situations and to explore the relations among cases. However, a knowledge elicitation bottleneck occurs for many knowledge-based CBR applications because expert reasoning is difficult to precisely explain. To solve these problems, this paper proposes a method using only knowledge to recognize marine oil spill cases. The proposed method combines deep reinforcement learning (DRL) with strategy selection to determine emergency responses for marine oil spill accidents by quantification of the marine oil spill scenario as the reward for the DRL agent. These accidents are described by scenarios and are considered the state inputs in the hybrid DRL/CBR framework. The challenges and opportunities of the proposed method are discussed considering different scenarios and the intentions of decision makers. This approach may be helpful in terms of developing hybrid DRL/CBR-based tools for marine oil spill emergency response.
1. Introduction
Oil spills have become one of the most severe marine ecological disasters worldwide. With oil imports exceeding 420 million tons in 2017, China surpassed the United States as the world’s largest oil importer for the first time. As a large amount of oil is imported by sea transportation, oil spills frequently occur in China, threatening China’s marine fishery, coastal environment and coastal cities; providing a rapid response following marine oil spill emergencies has received increasing attention. After an accident occurs, direct and effective methods can be used to quickly retrieve similar historical cases by using certain intelligent methods and then assisting decision makers in quickly formulating emergency response plans to cope with the current emergency based on historical experience. Case-based reasoning (CBR) systems compare a new problem to a library of cases and adapt a similar library case to the problem, thereby producing a preliminary solution [1]. Since CBR systems require only a library of cases with successful solutions, such systems are often used in areas lacking a strong theoretical domain model, such as diagnosis, classification, prediction, control and action planning. CBR has been applied to help improve cost-efficiency control during infrastructure asset management in developing countries by estimating costs through retrieving and comparing the most similar instances across a case library [2]. Additionally, farmers have been provided with advice about farming operation management at a high case retrieval speed based on the associated representation method [3].
Many scholars have conducted in-depth research on CBR for natural disaster emergency response and support decision making. Emergency decision makers can effectively respond to emergencies with mobile-based emergency response systems such as the ontology-supported case-based reasoning (OS-CBR) system method [4]. This method has also been used to forecast the probability of finding oil slicks [5]. The generation of secondary emergencies and potential escalation into an emergency cascade has been studied with CBR and historical cases to increase the effectiveness of emergency decision making in preventing cascading disasters [6]. A CBR method based on spatiotemporal trajectory similarity assessment was applied for typhoon disasters [7]. Building information modeling (BIM) has been combined with CBR to estimate replacement costs by retrieving cost information from the industry foundation class (IFC) [8].
Various factors have contributed to the attractiveness of employing case-based methods: reducing the knowledge acquisition effort and noise tolerance based on the approximate nature of these methods and providing straightforward implementation schemes [9]. Compared with similarity matching based on subjective experience, historical knowledge and computer technology can not only accelerate the calculation process but also improve the reliability, which is of great significance in saving time during an emergency response and minimizing the damage caused by marine oil spill accidents. In particular, in the process of using CBR in disaster emergency problems, the static attribute information of the disaster case at a certain time can be employed to obtain a similarity assessment and determine which case best matches the current problem; this approach typically uses the attribute-weighted Euclidean metric for assessment [10]. However, due to the sophisticated hydrogeological and biological factors that influence oil movement, oil pollution is often characterized as an unconventional emergency and is associated with many new and unidentified risk factors, such as those related to spill magnitude uncertainties that may not be foreseeable in the disaster preparedness stage; these effects can lead to difficulty in attribute similarity assessment based on the Euclidean metric. Moreover, weight determination in CBR needs to be fully considered and requires extensive expert knowledge that may affect the timeliness of emergency decisions. Therefore, scenario analysis is of interest because it addresses variable uncertainties and has been applied in many fields, such as risk decision making in emergency response [11], and plan-making in chemical industrial park pollution accidents [12]. In terms of similarity of cases, the reinforcement learning scheme does not need to know the correct case for each input and is used as a feedback signal by generating actions that cause the environment to enter a new state and generate a new feedback signal. In this work, we will exploit the advantages of CBR and scenario analysis in the context of a deep Q-network (DQN) [13,14] to support marine oil spill emergency decision making in prediction and action planning tasks. Our main contributions are as follows:
- A hybrid method using deep reinforcement learning (DRL) and CBR is proposed to produce a preliminary solution for marine oil spill emergencies.
- To address the uncertainty of marine oil spill accidents, a preprocess of constructing a marine oil spill scenario tree is employed, and the scenario is also used to represent historical cases in our CBR system.
- Reward functions are considered based on different decision intentions to supporting decision making; this approach may be helpful for improving the level of oil spill emergency response.
The remainder of this paper is organized as follows. Section 2 presents a brief introduction to the fundamental theory of the proposed framework. Section 3 shows the experimental results to verify the effectiveness of the scenario-based hybrid DRL/CBR method. Finally, a brief discussion is given, and the study conclusions and proposed future work are discussed.
2. Materials and Methods
CBR is defined as the process of reusing experiences to deal with current situations that are similar to ones solved and stored previously [10], and the foundation of the CBR system is the representation and definition of a case. We consider marine oil spill emergency response tasks in which a decision maker addresses marine oil spill accidents and makes decisions based on comparisons with historical data by using similarity measurements to identify a relevant past case. At each time step, the decision maker selects an emergency response action from the set of legal marine oil spill emergency response actions Set and receives feedback as a reward , which represents the result of the emergency response action at step . Note that the emergency response result depends on the entire prior sequence of actions; feedback about an action can only be received after many time steps have elapsed. Therefore, we consider sequences of actions and observations, , and learn the actions that depend on these sequences, which represent the internal state of the marine oil spill observed by the decision maker. This state is a vector of values representing the current status of the oil spill. All the sequences in the emulator are assumed to terminate after a finite number of time steps. This condition gives rise to a large but finite Markov decision process (MDP) [15,16] in which each sequence is a distinct state.
The framework of our approach to scenario-based hybrid CBR/DRL is shown in detail in Figure 1. Scenario analysis provides an approach for addressing unknown but related problems based on marine oil spill historical cases. The CBR [17,18] method provides retention, retrieval, reuse and revision of scenario analysis results, which is formalized as a four-step process [19]. Three of these steps are implemented with the DQN algorithm.
- Retention. Scenario analysis is employed to address marine oil spill accident uncertainties, such as spill magnitude uncertainties and the uncertainties related to spill accident evolution. Each individual historical case can be represented as a detailed “chain of consequences”, which is named the scenario chain in this paper. Through the cluster algorithm, similar scenario instances can be merged as a typical scenario, which consequently expands the scenario and forms a branch to construct scenario trees. Through scenario analysis, marine oil spill cases are stored as scenario instances and scenario trees in the scenario library.
- Retrieval. When applying cases to train the proposed hybrid CBR/DRL model, the scenario library is considered as an environment for the agent to explore, and each marine oil spill scenario instance is regarded as a state of the environment. Thus, each instance is a vector composed of features representing the marine oil spill scenario.
- Reuse. The agent chooses the action with the highest expected value using the -greedy strategy. With the probability of the strategy, the algorithm chooses an action based on the available knowledge, and with the probability of , a random action is selected [20].
- Revision. The revision phase uses the DQN to update to the utilities Q for actions chosen by the agent. Eligibilities represent the cumulative contributions of individual state and action combinations in previous time steps.
2.1. Marine Oil Spill Scenario and Scenario Tree Construction Method
A marine oil spill historical case can be divided into multiple scenarios according to its evolution. Each marine oil spill scenario can be described from the following three aspects: hazard, exposure and human behavior [21]. Since human behavior can strongly affect the results of a disaster, for example, due to the effective implementation of preparedness actions such as evacuation and rescue procedures, it is considered as a controllable driver of the development branch of oil spills. The hazard is the time-space distribution of the intensity of a given marine oil spill accident with an assigned occurrence probability at a given time and in a given geographical area. The exposure is the distribution of the probability that a given element (including people, buildings, infrastructure, the economy, or the environment) is affected by a disaster. In this paper, an oil spill scenario can be represented by a set of scenario elements as , where is a scenario element instance that alternates in type between hazard and exposure. The scenario element instance set , is a vector composed of features, where represents the attributes of a scenario element instance; such attributes may include the tonnage of the oil tanker and the amount of spilled oil as shown in Table 1. In this case, the scenario instance can be represented as
An emergency response scenario is not a typical case, and the core of this approach is to identify instances with similar characteristics. The similar scenario instances are merged into a typical scenario, and consequence scenario instances are linked to the typical scenario. Thus, the expanded branches express the uncertainties of the evolution of marine oil spill accidents. The k-means [22] algorithm is employed to find the similarity scenario instances to minimize the squared error since the marine oil spill is represented as a numeric scenario matrix (dimensions 9 × 13):
where is the mean vector of cluster . A new scenario chain extracted from a marine oil spill case is first decomposed into scenarios based on the corresponding relationships. As the scenario chain increases in size, some similar scenarios can be merged, and as children scenarios are connected, the chain is extended to become a scenario tree. A new scenario is linked to the existing scenario tree node only if the distance to the closest cluster is larger than the threshold parameter . Thus, acts as a mechanism for controlling the density of the scenario instance. If a case cannot be linked to an existing scenario tree, the scenario chain is regarded as an independent initial scenario tree template and added to the scenario library. These branches generally form because of human behavior changes, thus providing significant and intuitive help for decision making.
2.2. Hybrid DRL/CBR Method for Marine Oil Spill Emergency Response
In this research, a marine oil spill emergency response is assumed as an MDP, and the policy is trained by the DQN algorithm using CBR. The CBR system provides an environment for reinforcement learning (RL) agent exploration. Many RL algorithms have been developed to learn approximations of an optimal action based on agent experience in a given environment. The return function is defined in the MDP as follows:
where future rewards are discounted by a factor per time step with a start state . State is a vector composed of features representing a marine oil spill scenario, where is the reward for the current emergency response action. The DQN uses experience to learn value functions that map state-action pairs to the maximal expected reward that can be achieved for a given state–action pair. The optimal action value function is defined as the maximum expected return achievable by following any strategy after a state is reached and an action is taken:
where is a function that maps policies to emergency response actions; emergency response action , and is a list of possible marine oil spill emergency response actions decision makers can take for the current spill scenario. Equation (5) shows that the optimal value function gives the maximum emergency response action value for spill scenario and action achievable by policy :
where is the transition probability and is the reward at state translated to . This equation is in agreement with the following intuition: the optimal strategy involves selecting the emergency response action that maximizes the expected value, which is a -related cumulative reward function when the optimal value of the sequence spill scenario at the next time step is known for all possible emergency response actions . The optimal action value function obeys an important identity known as the Bellman optimization equation, which can also be used as an iterative updating formula with a learning rate parameter :
The Q-network is a neural network with a weight of as a function approximator to estimate the action value function . A Q-network can be trained by minimizing a sequence of the loss function that changes at each iteration , where is the target for iteration and is a probability distribution over a sequence of oil spill scenarios and emergency response actions .
In this paper, the model is trained with an actor–critic strategy [23]. The actor selects a behavior based on probability, and the critic estimates performance based on the actor. The critic is trained at every step, and the actor synchronizes with the parameters of the critic model after specific steps. The neural network of actors and critics consists of a nine-layer convolution neural network for the state function approximator. The input to the neural work is a vector of the oil spill scenario instance. After each step of the exploration, we calculate the Q values corresponding to the current state and action using (6), and (7) is applied to calculate the loss and update the critic model parameters from the previous iteration , which are fixed when optimizing the loss function . The approximator input and output are shown in Figure 2.
The three components based on the hybrid DQN and CBR method for the oil spill emergency response model are detailed as follows:
- State. A marine oil spill scenario instance can be regarded as a state, which is a vector composed of features representing marine oil spill accidents that have been stored in the CBR system. The scenario instance and typical scenario are represented according to Equation (1).
- Reward. An interaction occurs between the marine oil spill scenario observed and the step-by-step process of decision making in a discrete time series. If the emergency response action makes the next scenario safer, the reward of the step is close to 1, and other actions yield reward values close to 0. To reflect the severity of a marine oil spill accident, Dutch scholar W. Koops proposed a DLSA evaluation model for oil spills that used nine individual indicators to analyze oil spill pollution [24]. In the DLSA model, the indicator weights are given by expert knowledge. Human experts, whose time is valuable and scarce, often find it difficult to precisely explain their reasoning. In 1948, the problem of information quantification was solved through the concept of information entropy, which was proposed by Shannon. Based on traditional information entropy, Chen et al. defined the concept of unconventional emergency scenario–response multidimensional entropy [25]. In combination with information theory, we believe that low-probability events that occur during oil spill accidents are important to consider due to our insufficient understanding of these events and the unpredictability of the corresponding risk. In contrast, for accidents with high probability, due to the relatively sufficient knowledge of the corresponding events, response actions can be taken based on the known threat of the accident. In this paper, we consider the quantity of spilled oil, vessel characteristic, sea area, and sea conditions as factors that influence the severity of marine oil spill accidents. In addition, information entropy is employed to assist in measuring the severity of marine oil spill scenarios, instead of using expert knowledge. The eleven indicators considered can be matched among marine oil spill scenario instances. The indicator of scenario instance obeys the distribution . The term is the probability that the indicator has a value at . Thus, the entropy of a marine oil spill scenario can be defined aswhere is the mapping function from indicator to the risk level; the details of this function are given in Appendix A. In this paper, we regard the severity of a marine oil scenario as a binary state that is safe or unsafe. Therefore, we use the sigmoid function [26] to calculate the severity of marine oil scenarios as the reward function,where , and the value of is close to 1, which means that the evolution of marine oil spill accidents tends to become increasingly safe. When the value of is close to 0, the evolution of an accident can gradually become out of control, and the situation can become unsafe. The 11 indicators used in this paper are shown in Table 2.
- Action. From the branches of scenario trees and the International Tanker Owners Pollution Federation Limited (ITOPF) technical information papers, we developed a relatively comprehensive response action set for marine oil spill emergencies, which can be divided into three categories, as shown in Table 3. In this paper, one-hot coding [27] is employed to digitize discrete and disordered features, and this approach mainly uses an n-bit status registry to encode states. The number of marine oil spill emergency response actions is 15. For example, the action “use of booms” can be encoded as [1, 0, 0, 0, 0, 0, 0, 0, 0, 0, 0, 0, 0, 0, 0], and “use of dispersants” can be encoded as [0, 1, 0, 0, 0, 0, 0, 0, 0, 0, 0, 0, 0, 0, 0].
3. Experiments and Results
3.1. The Training of the Action Policy Selection Process in Marine Oil Spill Emergency Response
The proposed methodology is intended to train the action policy selection process in emergency response by fully using historical marine oil spill cases to maximize the cumulative reward and reduce the risk of accidents. In this study, the policy selection method was trained based on information from 55 spills recorded since 1967. The data for these spills were mainly collected from ITOPF, Wikipedia and specific websites. The selected historical case names are listed in Appendix B.
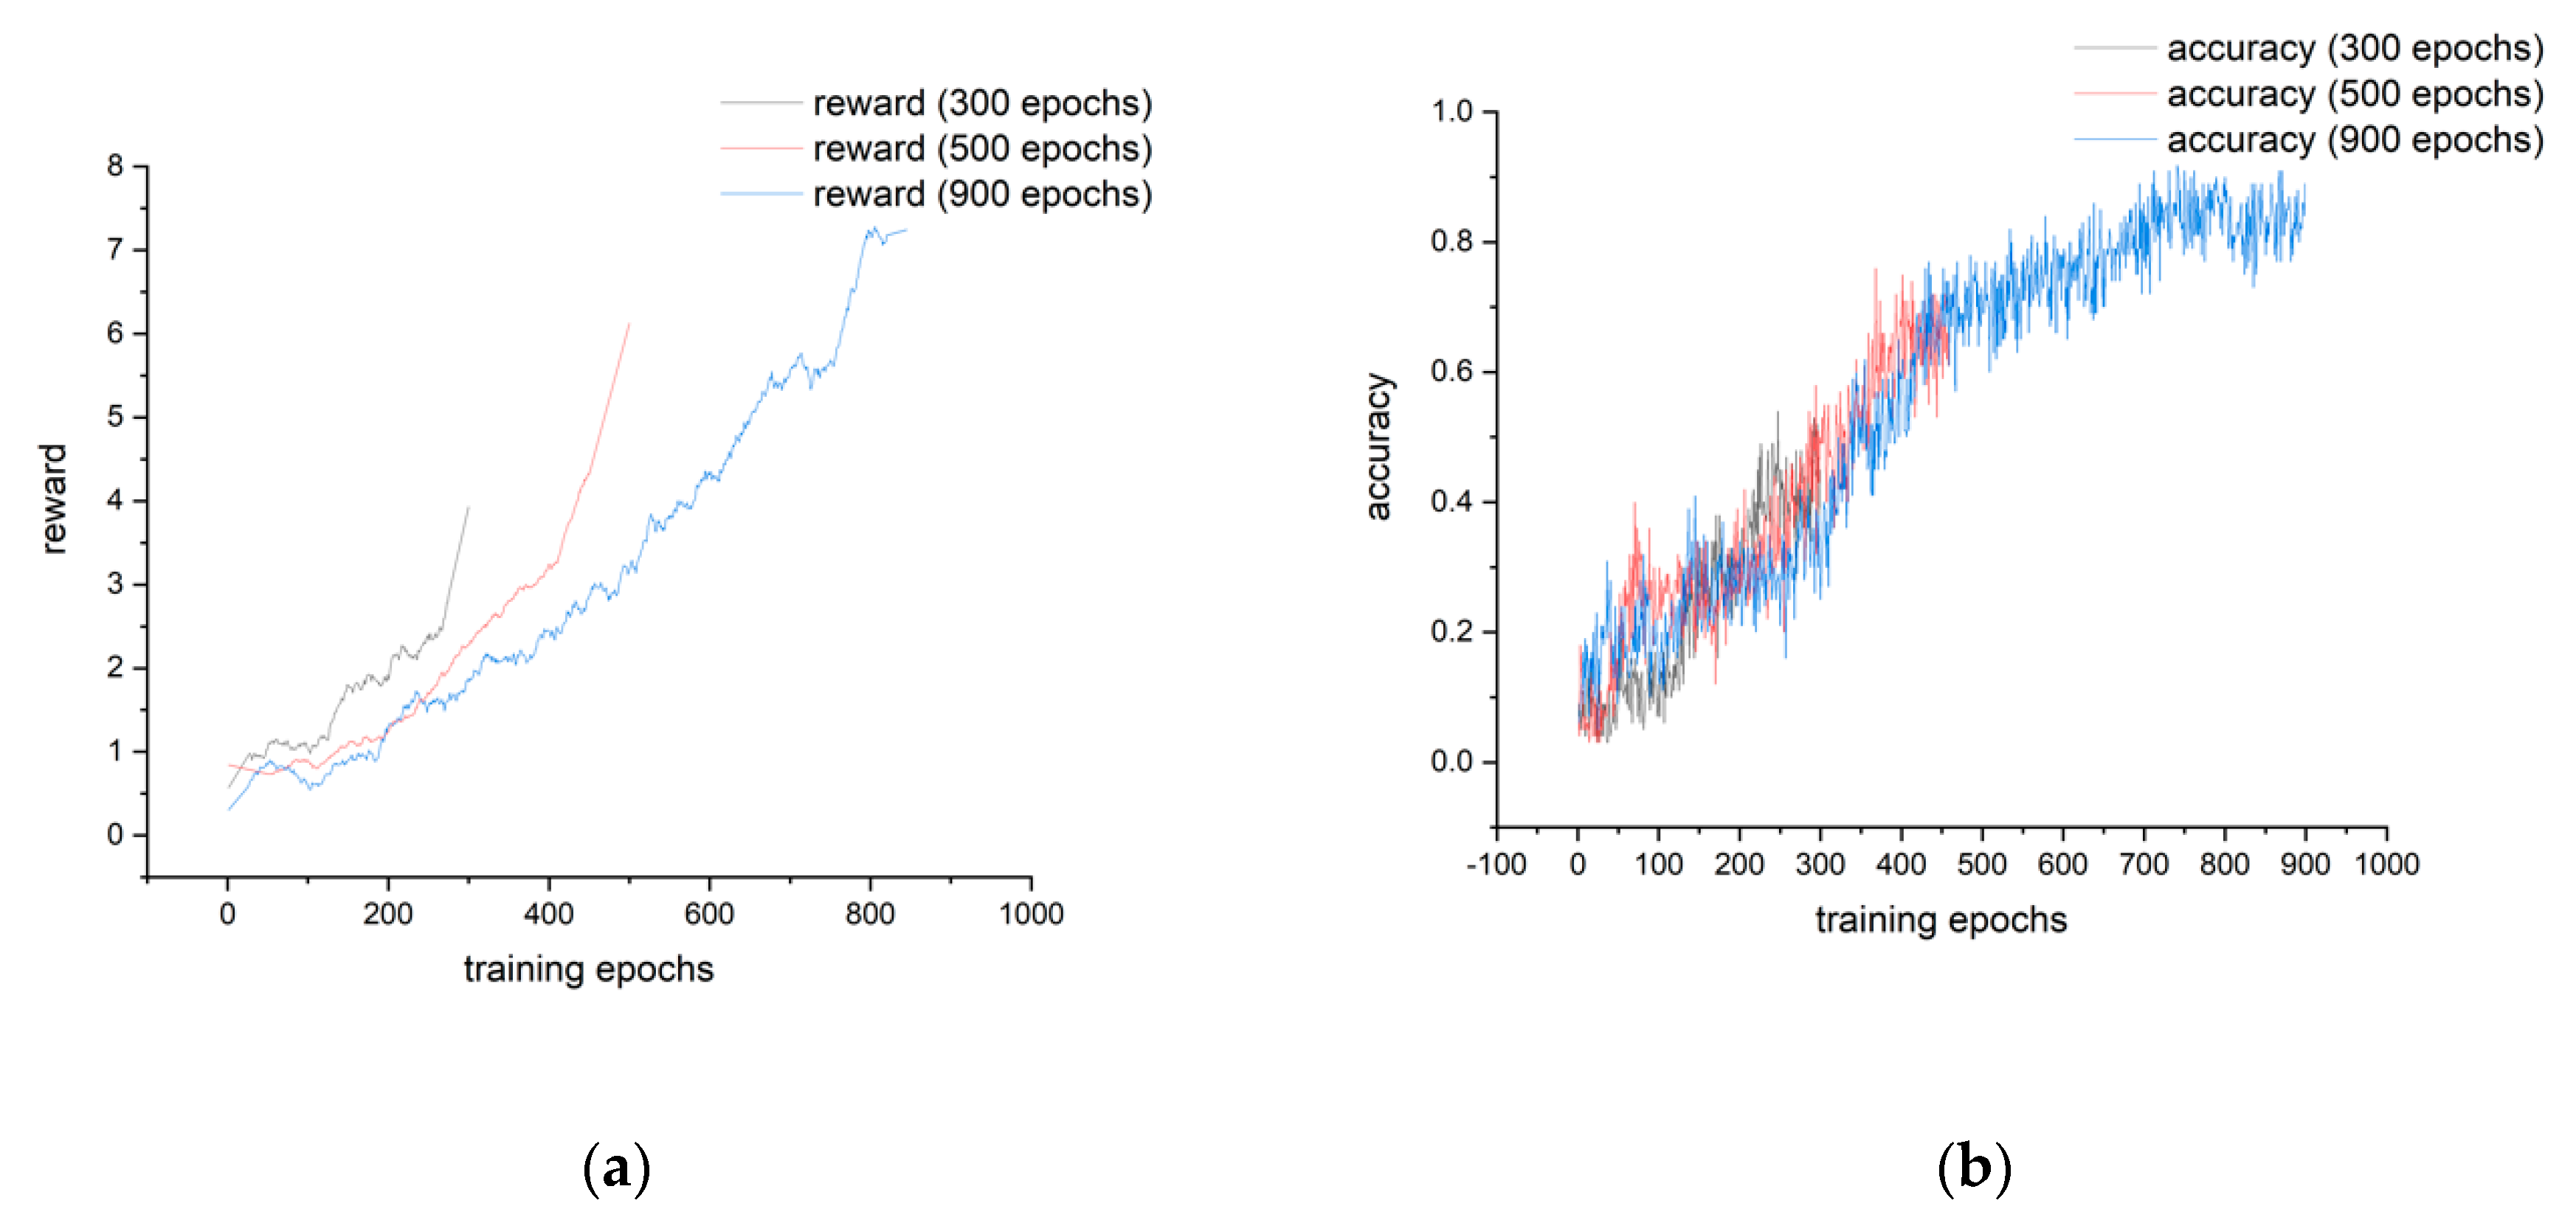
In our experiment, we assumed that 10 continuous emergency response actions should be taken in one epoch; that is, the policy provides recommended actions for 10 marine oil spill instances. The experimental results include the cumulative reward and accuracy of the training models at 300, 500, 900 total epochs. The training curves are shown in Figure 3.
The experimental results show that with an increasing number of training epochs, the cumulative reward and accuracy of the model increase. Specifically, 300 and 500 training epochs are inadequate for training, but the reward and accuracy tend to be smooth and steady after 800 epochs. According to the optimal response policy given by the trained model, the cumulative reward theoretically reaches 7.2. Based on the results of training, we hypothesize that the application of the hybrid DRL/CBR model can assist decision makers in determining the best marine oil spill emergency response by providing effective countermeasures.
3.2. Comparison of Hybrid Application Results and Similarity Matching Results
To support emergency decision making, the trained decision model uses the vector of an oil spill scenario as the inputs and outputs the Q value corresponding to each action. Generally, the higher the Q value is, the greater the probability of taking the corresponding action that the model suggests to the decision maker. To verify the feasibility of the proposed method, four typical marine oil spill scenarios (five scenario instances) are selected in this section, as shown in Table 4. Using these five scenario instance vectors as inputs, the outputs of the state-action value curve are shown in Figure 4.
Figure 4a–d illustrates the Q value of the emergency response action by applying the trained model under four typical scenarios: tanker collision, tanker caught fire, oil spill and marine organism death. Figure 4a shows an oil tanker collision scenario instance under normal sea conditions. The optimal emergency response action suggested by the model is “use of mechanical recycling and sorbent materials”. From the results, the Q value of the optimal action is not far from the Q value of other emergency response actions, including the “use of booms” and the “use of dispersants”. Additionally, in such a tanker collision scenario, all potential actions can be implemented at once. Figure 4b shows an example of a tanker fire scenario under normal sea conditions. The best recommendation given by the model is “extinguishing the fire”, and the Q value for selecting a firefighting emergency response action is much higher than that of other emergency response actions. This recommendation is consistent with the actions taken for the SEA STAR accident. In the historical case of the SEA STAR, the oil tanker exploded during recovery without extinguishing the fire, which led to the ship sinking in the Gulf of Oman. Figure 4c shows the results for two oil spill scenarios. When the sea conditions are normal, various methods for remediating spilled oil are recommended. Moreover, only “mechanical recycling” is recommended under rough sea conditions because oil booms lose efficacy under high wave conditions and dispersants are ineffective in low-temperature water. However, in the case of rough sea conditions, the optimal emergency response action given by the model is “stopping ship leaks”, with the Q value of the action being much higher than that for other actions, which seems unreasonable. Therefore, it is essential to further optimize the values of the indicators used to assess scenarios in the future. Figure 4d represents a biological impairment scenario in marine environments that leads to organism death. The optimal recommendation given by the model is “shut down sensitive resources”, such as affected economic facilities and fish farms. The other recommendations include “spontaneous recovery” and “biological recovery”.
Emergency response actions can be also achieved by scenario instance similarity matching from historical cases in CBR systems. As a comparison, the matrix of typical scenarios is used for similarity calculation, and when the Euclidean distance is less than (defined in Section 2.1), it matches a historical scenario instance. The results are compared in Table 5:
From the results, it is obvious that the proposed method provides richer emergency response action suggestions for the decision maker. Because we changed the sea condition parameters in the oil spill scenario instances “Oil spill scenario—BREAR” and “Marine organism death scenario”, they do not match appropriate scenario instances in the existing CBR system, which need to be revised according to expert knowledge. Moreover, the proposed method suggestions have clear decision intentions: to reduce the severity of oil spills. In general, the application results show that the optimal emergency response model trained to reduce the severity of oil spills can provide a variety of reasonable response actions for decision makers and aid in making decisions during marine oil spill emergencies.
4. Discussion
When using DQN to solve MDP problems, if the design of the reward function is not suitable, the algorithm may display an extremely long convergence time or even not converge at all. In this study, 11 indicators were selected to reflect the severity of marine oil spill accidents and reduce the risk of oil spills. The reward function is regarded as an expression of the decision intent and the value of the reward after each emergency action. Similarly, we constructed another reward function to measure marine biosafety by selecting fixed indicators that meet the conditions for an oil spill close to shore, a fishery farm, a reef or an important habitat type. The intent of this reward function is to optimally protect marine life. The reward function can be simply defined as follows:
where is the minimum distance between spilled oil and these four selected locations in a scenario instance and is the threshold parameter used to indicate that the spilled oil is approaching a biologically sensitive resource. The model was retrained with the new reward function, and the results were applied in oil spill scenario instances extracted from “BRAER” and “TANIO” cases, as shown in Figure 5. Figure 5a shows the result for the oil spill scenario instance in which the tanker “BRAER” was grounded at Garths Ness, with oil flowing into the sea from the moment of impact. From the result, the “shut down sensitive resources” action was taken because an oil spill occurred near the shore. The action “shut down sensitive resources” was also taken in the historical “BREAR” case, thus providing positive feedback for model training. Figure 5b shows the result of using the oil spill scenario instance for the “TANIO” case; this vessel broke into two pieces during violent weather conditions off the coast of Brittany, France. The results show that the new model seems completely insensitive to sea conditions, potentially because the reward function ignores sea condition indicators when calculating the reward.
Another aspect that may limit the quality of the model is the number of states the agent observes from the environment exploration. From the 55 selected historical cases, a total of 193 oil spill scenario instances are extracted, which is far from enough for DQN agent exploring. To solve this problem, some scenario instances in the same cluster are participating in scenario element exchanging to generate more than 800 new scenario instances for experience replay in DQN training. It is still a need to collect more marine oil spill cases to improve the quality of response.
The potential applications of the proposed method can be further explored to aid in marine oil emergency response using different approaches. First, various decision intents can be combined to establish the reward function and train models, which may help improve the level of the marine oil spill emergency response. Second, when faced with a real oil spill accident, we strongly recommend the use of models with different decision intents because a single model cannot fully utilize the scenario tree of historical cases.
5. Conclusions
A new approach that combines the CBR and DRL algorithms to aid in marine oil emergency response decision making is presented in this paper. The proposed method provides a useful task decomposition process that allows agents to learn tactical policies that can assist decision makers in making decisions across different marine spill instances. Compared with traditional CBR, the proposed method only requires knowledge of a marine oil spill scenario or the construction of scenario instances. Because the proposed method combines the reward function in reinforced learning with the decision intention and applies this approach to train multiple models with different decision intents, the suggested emergency response actions are easy to explain and more informative than those produced by the similarity matching-based CBR system. However, the article only gives two reward functions, which is not enough for a real complex marine oil spill accident, and this limitation will be the focus of future studies.
Author Contributions
Conceptualization, K.H.; methodology, K.H.; software, K.H.; validation, W.N., K.H. and N.L.; funding acquisition, N.L. All authors have read and agreed to the published version of the manuscript.
Funding
This research was funded by the National Key R&D Program of China under Grant 2017YFC1405300.
Acknowledgments
The authors would like to thank the reviewers and editors who provided valuable comments and suggestions on this article.
Conflicts of Interest
The authors declare no conflicts of interest.
Appendix A

Table A1.
Level of Damage.
| Level of Damage | Evaluation Value |
|---|---|
| Small | 0~0.2 |
| Normal | 0.2~0.4 |
| Dangerous | 0.4~0.6 |
| Very dangerous | 0.6~0.8 |
| Extremely dangerous | 0.8~1.0 |
Table A2.
Spilled Oil.
| Spilled Oil—Toxicity (Soluble Aromatic Hydrocarbon Derivatives) | Evaluation Value |
| Almost insoluble in water and includes no oil-containing aromatic hydrocarbons | 0.2 |
| Heavy kerosene, some aromatic hydrocarbons and other oils | 0.6 |
| Gasoline, light kerosene, many aromatic hydrocarbons and other oils | 1.0 |
| Spilled Oil—Amount (t) | Evaluation Value |
| <5 | 0.1 |
| 5~50 | 0.3 |
| 50~100 | 0.5 |
| 100~150 | 0.7 |
| 150~200 | 0.9 |
| 200 | 1.0 |
| Spilled Oil—Flammable | Evaluation Value |
| Heavy oil, crude oil, etc. | 0.4 |
| Heavy kerosene, etc. | 0.6 |
| Gasoline, light kerosene, etc. | 0.9 |
Table A3.
Sea Condition.
| Sea Conditions—Wave Height (m) | Evaluation Value |
| <0.1 | 0.1 |
| 0.1~0.5 | 0.2 |
| 0.5~1.25 | 0.4 |
| 1.25~2.5 | 0.6 |
| 2.5~4 | 0.8 |
| 4 | 1.0 |
| Sea Conditions—Wind Speed (m/s) | Evaluation Value |
| <3.3 | 0.1 |
| 3.3~7.9 | 0.2 |
| 7.9~13.8 | 0.4 |
| 13.8~20.7 | 0.6 |
| 20.7~28.4 | 0.8 |
| 28.4 | 1.0 |
| Sea Conditions—Water Temperature (°C) | Evaluation Value |
| 0.1 | |
| 20~25 | 0.3 |
| 15~20 | 0.5 |
| 10~15 | 0.7 |
| 5~10 | 0.9 |
| <5 | 1.0 |
| Sea Conditions—Visibility (n Miles) | Evaluation Value |
| 5 | 0.1 |
| 3~5 | 0.3 |
| 2~3 | 0.5 |
| 1~2 | 0.7 |
| 0.03~1 | 0.9 |
| <0.03 | 1.0 |
Table A4.
Vessel.
| Vessel—Dead Weight Tonnage | Evaluation Value |
| <160,000 | 0.1–0.3 |
| 160,000~319,999 | 0.4–0.6 |
| 320,000~549,999 | 0.7~1.0 |
| Vessel—Age (Year) | Evaluation Value |
| <5 | 0.1 |
| 5~10 | 0.3 |
| 10~15 | 0.5 |
| 15~20 | 0.7 |
| 20~25 | 0.9 |
| 25 | 1 |
Table A5.
Sea Area.
| Sea Area—Self-Purification Capacity | Evaluation Value |
| Good | 0.3 |
| Normal | 0.5 |
| Bad | 0.8 |
| Sea Area—Distance to Offshoring (n MILEs) | Evaluation Value |
| >25 | 0.2 |
| 5~25 | 0.5 |
| 5 | 0.9 |
Appendix B
Table A6.
55 selected significant oil spill cases since 1967.
| Order | Ship/Accident Name | Year | Location |
|---|---|---|---|
| 1 | AEGEAN SEA | 1992 | A Coruña, Spain |
| 2 | AGIOS DIMITRIOS 1 | 2009 | Zhuhai, China |
| 3 | AGIP ABRUZZO | 1991 | Livorno Port, Italy |
| 4 | ALFA 1 | 2012 | Elefsis Bay, Greece |
| 5 | ARAGON | 1989 | Morocco |
| 6 | ARGO MERCHANT | 1976 | Nantucket Shoals, Massachusetts, USA |
| 7 | BALTIC CARRIER | 2001 | Baltic Sea, between Germany and Denmark |
| 8 | BRAER | 1993 | Garth’s Ness, Shetland |
| 9 | BUNGA KELANA 3 | 2010 | Singapore Strait, 13 km south east of Singapore |
| 10 | EAGLE OTOME | 2010 | Sabine Neches waterway, Texas, USA |
| 11 | ECE | 2006 | Channel Islands, UK |
| 12 | ERIKA | 1999 | Bay of Biscay, West of France |
| 13 | EXXON VALDEZ | 1989 | Alaska, USA |
| 14 | FLINTERSTAR | 2015 | Coast of Zeebrugge, Belgium |
| 15 | FU PING YUAN | 2010 | Incheon Port, Republic of Korea |
| 16 | GDANSK | 2011 | Ferrominera Port, Puerto Ordaz, Venezuela |
| 17 | GOLDEN TRADER | 2011 | Western coast, Denmark |
| 18 | GULSAR ANA | 2009 | Madagascar |
| 19 | HAWAIIAN PATRIOT | 1977 | 300 miles west of Hawaii, USA |
| 20 | HEBEI SPIRIT | 2007 | Taean, Republic of Korea |
| 21 | INDEPENDENTA | 1979 | Bosporus, Turkey |
| 22 | JAKOB MAERSK | 1975 | Leixoes Port, Portugal |
| 23 | KATINA P | 1992 | Mozambique Channel, Maputo, Mozambique |
| 24 | KHARK 5 | 1989 | 150 nautical miles off the coast of Morocco |
| 25 | METULA | 1974 | Eastern Strait of Magellan, Chile |
| 26 | NATUNA SEA | 2000 | Singapore Strait/Indonesia/Malaysia |
| 27 | NOVA | 1985 | Khark Island, Iran |
| 28 | OLIVA | 2011 | Nightingale Island, UK |
| 29 | PRESTIGE | 2002 | Spain/France |
| 30 | RENA | 2011 | Tauranga, New Zealand |
| 31 | ROCKNES | 2004 | Bergen, Norway |
| 32 | ROKIA DELMAS | 2006 | La Rochelle, France |
| 33 | SAMHO BROTHER | 2005 | Hsinchu, Taiwan, China |
| 34 | SEA EMPRESS | 1996 | Wales, UK |
| 35 | SEKI | 1994 | Coast of Fujairah, United Arab Emirates |
| 36 | SELENDANG AYU | 2004 | Skan Bay, Unalaska Island, USA |
| 37 | SILVER | 2013 | Coast of Tan-Tan, Morocco |
| 38 | SOLAR 1 | 2006 | Guimaras Straits, Philippines |
| 39 | ST THOMAS DE AQUINAS | 2013 | Cebu Port, Philippines |
| 40 | STOLT VALOR | 2012 | Ras Tanura, Kingdom of Saudi Arabia |
| 41 | TANIO | 1980 | Coast of Brittany, France |
| 42 | TASMAN SPIRIT | 2003 | Karachi Port, Pakistan |
| 43 | TK BREMEN | 2011 | Beach of Kerminihy, Erdeven, France |
| 44 | URQUIOLA | 1976 | Port of La Coruña, Spain |
| 45 | USHUAIA | 2008 | Antarctic Peninsula |
| 46 | SS ALTANTIC EMPRESS | 1979 | 18 miles east of the island of Tobago |
| 47 | ABT SUMMER | 1991 | 900 miles off the coast of Angola |
| 48 | CASTILLO DE BELLVER | 1983 | Cape Town, South Africa |
| 49 | AMOCO CADIZ | 1978 | Coast of Brittany, France |
| 50 | HAVEN | 1991 | Genoa, Italy |
| 51 | ODYSSEY | 1988 | 700 miles off the coast of Nova Scotia, Canada |
| 52 | TORREY CANYON | 1967 | Seven Stone Reef, Land’s End, UK |
| 53 | SEA STAR | 1972 | Gulf of Oman |
| 54 | SANCHI | 2018 | Shanghai, China |
| 55 | IRENES SERENADE | 1980 | Navarino Bay, Greece |
References
- Paulson, P.; Juell, P. Reinforcement learning in case-based systems. IEEE Potentials 2004, 23, 31–33. [Google Scholar] [CrossRef]
- Chou, J.S. Applying AHP-based CBR to estimate pavement maintenance cost. Tsinghua Sci. Technol. 2008, 13, 114–120. [Google Scholar] [CrossRef]
- Zhai, Z.; Martínez Ortega, J.F.; Beltran, V.; Lucas Martínez, N. An Associated Representation Method for Defining Agricultural Cases in a Case-Based Reasoning System for Fast Case Retrieval. Sensors 2019, 19, 5118. [Google Scholar] [CrossRef] [PubMed] [Green Version]
- Amailef, K.; Lu, J. Ontology-supported case-based reasoning approach for intelligent m-Government emergency response services. Decis. Support Syst. 2013, 55, 79–97. [Google Scholar] [CrossRef]
- Mata, A.; Rodríguez, J.M.C. Forecasting the probability of finding oil slicks using a CBR system. Expert Syst. Appl. 2009, 36, 8239–8246. [Google Scholar] [CrossRef] [Green Version]
- Yu, F.; Li, X.Y. Improving emergency response to cascading disasters: Applying case-based reasoning towards urban critical infrasture. Int. J. Disaster Risk Reduct 2018, 30, 244–256. [Google Scholar]
- Keke, Z.; Nianxue, L.; Yingbing, L. STGA-CBR: A Case-Based Reasoning Method Based on Spatiotemporal Trajectory Similarity Assessment. IEEE Access 2020, 8, 22378–22385. [Google Scholar] [CrossRef]
- Kim, H.; Kim, J. A Case-Based Reasoning Model for Retrieving Window Replacement Costs through Industry Foundation Class. Appl. Sci. 2019, 9, 4728. [Google Scholar] [CrossRef] [Green Version]
- Gabel, T.; Riedmiller, M. CBR for state value function approximation in reinforcement learning. In International Conference on Case-Based Reasoning; Springer: Berlin/Heidelberg, Germany, 2005; pp. 206–221. [Google Scholar]
- Watson, I.; Marir, F. Case-based reasoning—A review. Knowl. Eng. Rev. 1994, 9, 327–354. [Google Scholar] [CrossRef]
- Liu, Y.; Fan, Z.-P.; Yuan, Y.; Li, H. A FTA-based method for risk decision-making in emergency response. Comput. Oper. Res. 2014, 42, 49–57. [Google Scholar] [CrossRef] [PubMed]
- Duan, W.; He, B. Emergency Response System for Pollution Accidents in Chemical Industrial Parks, China. Int. J. Environ. Res. Public Heal. 2015, 12, 7868–7885. [Google Scholar] [CrossRef] [PubMed] [Green Version]
- Mnih, V.; Kavukcuoglu, K.; Silver, D.; Graves, A.; Antonoglou, L.; Wierstra, D.; Riedmiller, M. Playing atari with deep reinforcement learning. arXiv 2013, arXiv:1312.5602. [Google Scholar]
- Mnih, V.; Kavukcuoglu, K.; Silver, D.; Rusu, A.A.; Veness, J.; Bellemare, M.G.; Graves, A.; Riedmiller, M.; Fidjeland, A.K.; Ostrovski, G.; et al. Human-level control through deep reinforcement learning. Nature 2015, 518, 529–533. [Google Scholar] [CrossRef] [PubMed]
- Sigaud, O.; Buffet, O. Markov Decision Processes in Artificial Intelligence; Wiley: Hoboken, NJ, USA, 2010. [Google Scholar]
- Sutton, R.S.; Barto, A.G. Reinforcement Learning: An Introduction; MIT Press: Cambridge, MA, USA, 1998. [Google Scholar]
- Kolodner, J. Cased-Based Reasoning Morgan Kaufmann; Morgan Kaufmann Publishers: San Mateo, CA, USA, 1993. [Google Scholar]
- Leake, D.B. Case-Based Reasoning: Experiences, Lessons, and Future Directions; AAAIPress/MIT Press: Menlo Park, CA, USA, 1996. [Google Scholar]
- Sharma, M.; Holmes, M.; Santamaría, J.; Irani, A.; Isbell, C.; Ram, A. Transfer Learning in Real-Time Strategy Games Using Hybrid CBR/RL. IJCAI 2007, 7, 1041–1046. [Google Scholar]
- Watkins, C.J.C.H. Learning from Delayed Rewards. Ph.D. Thesis, King’s College, University Cambridge, Cambridge, UK, 1989. [Google Scholar]
- Huang, K.; Nie, W.; Luo, N. A Method of Constructing Marine Oil Spill Scenarios from Flat Text Based on Semantic Analysis. Int. J. Environ. Res. Public Heal. 2020, 17, 2659. [Google Scholar] [CrossRef] [PubMed] [Green Version]
- Krishna, K.; Murty, M.N. Genetic K-means algorithm. IEEE Trans. Syst. Man, Cybern. Part B (Cybernetics) 1999, 29, 433–439. [Google Scholar] [CrossRef] [PubMed] [Green Version]
- Rosenstein, M.T.; Barto, A.G.; Si, J. Supervised Actor-Critic Reinforcement Learning; Wiley-IEEE Press: Hoboken, NJ, USA, 2004; pp. 359–380. [Google Scholar]
- Cai, W.; Zheng, Y.; Shi, Y.; Zhong, H. Threat Level Forecast for Ship’s Oil Spill-Based on BP Neural Network Model. In Proceedings of the 2009 International Conference on Computational Intelligence and Software Engineering, Wuhan, China, 11–13 December 2009; pp. 1–4. [Google Scholar]
- Chen, Y.; Yang, N.; Song, Z. Research on Unconventional Emergency Scenario-Response Multidimensional Scenario Entropy. In Mathematics in Practice and Theory; Chinese Academy of Sciences: Beijing, China, 2015; Volume 45, No.12. [Google Scholar]
- Finney, D.J. Probit Analysis: A Statistical Treatment of the Sigmoid Response Curve; Cambridge University Press: Cambridge, UK, 1952. [Google Scholar]
- Golson, S. One-hot state machine design for FPGAs. In Proceedings of the 3rd Annual PLD Design Conference & Exhibit, Santa Clara, CA, USA, 30 March 1993; Volume 1. [Google Scholar]
Figure 1.
Four stages of the proposed framework. DQN = deep Q-network.

Figure 2.
The input and output of the approximator based on the neural network.

Figure 3.
Training curves: (a) shows the cumulative reward curve of the proposed method in different epochs, (b) shows the accuracy curve of the proposed method in different epochs.
Figure 3.
Training curves: (a) shows the cumulative reward curve of the proposed method in different epochs, (b) shows the accuracy curve of the proposed method in different epochs.

Figure 4.
Policy application results for marine oil spill decision support. (a) Q value of the emergency response action for tanker collision scenario instance, (b) Q value of the emergency response action for tanker caught fire scenario instance, (c) Q value of the emergency response action for oil spill scenario instances with different sea condition, (d) Q value of the emergency response action for marine organism death scenario instance.

Figure 5.
Results of the retrained model with the new reward function. (a) Q value of the emergency response action for oil spill scenario instance form the case “BRAER” (b) Q value of the emergency response action for oil spill scenario instance from the case “TANIO”.
Figure 5.
Results of the retrained model with the new reward function. (a) Q value of the emergency response action for oil spill scenario instance form the case “BRAER” (b) Q value of the emergency response action for oil spill scenario instance from the case “TANIO”.

Table 1.
Marine oil spill scenario element and scenario element attributes.
| Order | Category | Scenario Element | Scenario Element Attributes |
|---|---|---|---|
| 1 | Hazard | Crude oil | Flash point; Condensation point; Density; Glue content; Sulphur content; Nitrogen content; Hydrogen content; Wax content; Asphalt value; Acid value; Carbon residue; Kinematic viscosity; Distillation range |
| Oil slick | Color; Cover area; Thickness | ||
| Sea condition | Window speed; Wave height; Water temperature; Sea visibility | ||
| 2 | Exposure | Oil tanker | Offshore distance; Vessel age; Tonnage; Amount of spilled oil |
| Offshore oil and gas platform | Geographic position; Vertical height; Carrying capacity | ||
| Marine organisms | Creature name; Wildlife habitat; Number of dead creatures; State of fire or explosion | ||
| Fisheries and mariculture | Geographic position; Breeding number; Species | ||
| Subsea tunnel | Geographic position; Buried depth of tunnel; Length of tunnel; Damaged area | ||
| Port infrastructure | Geographic position; Coastline length; Use of the facility |
Table 2.
Eleven indicators used to measure the severity of marine oil spill scenarios.
| Order | Category | Indicator |
|---|---|---|
| 1 | Spilled oil | Toxicity |
| Amount | ||
| Flammable | ||
| 2 | Vessel | Age |
| Tonnage | ||
| 3 | Sea area | Distance to offshoring |
| Self-purge ability | ||
| 4 | Sea conditions | Wind speed |
| Wave height | ||
| Water temperature | ||
| Visibility |
Table 3.
Summary of human behaviors during a marine oil spill emergency.
| Order | Category | Human Behavior |
|---|---|---|
| 1 | Cleaning spilled oil | Use of booms |
| Use of dispersants | ||
| Use of mechanical recycling and sorbent materials | ||
| 2 | Rescue | Tow oil vessel (potentially over a wide area) |
| Hang signal lights and establish anchors | ||
| Firefighting and fire extinction | ||
| Stopping ship leaks | ||
| Rescue crew | ||
| Abandon vessel | ||
| Voluntary stranding | ||
| 3 | Protection of sensitive marine resources | Shut down sensitive resources |
| Spontaneous recovery | ||
| Biological recovery | ||
| Construct artificial reefs | ||
| Enhancement of fishery resources |
Table 4.
Four typical scenarios (with five scenario instances) in the experiment.
| Order | Typical Scenario | Scenario Instance |
|---|---|---|
| 1 | Tanker collision scenario | Set spilled oil amount. All other parameters are set as default values. Sea condition parameter values set to “normal”. Scenario instance extracted from the case “ATLANTIC EMPRESS”. |
| 2 | Tanker fire scenario | Set spilled oil amount, where the spilled oil is flammable. All other parameters are set as default values. Sea condition parameter values set to “normal”. Scenario instance extracted from the case “ATLANTIC EMPRESS”. |
| 3 | Oil spill scenario | Set spilled oil amount. Sea condition parameter values set to “normal”. Scenario instance extracted from the case “BRAER”. |
| Set spilled oil amount. Sea condition parameter values set to “dangerous”. Scenario instance extracted from the case “TANIO”. | ||
| 4 | Marine organism death scenario | Assume the spilled oil has been cleaned up. Sea condition parameter values set to “normal”. Scenario instance extracted from the case “BRAER”. |
Table 5.
Comparison of the two methods in typical oil spill emergency response action suggestion.
| Scenario Instance | Scenario Similarity Matching | Scenario-Based Hybrid DRL/CBR |
|---|---|---|
| Tanker collision scenario | “Firefighting and fire extinction” | “Use of booms” “Use of dispersants” “Use of mechanical recycling and sorbent materials” “Firefighting and fire extinction” |
| Tanker fire scenario | “Firefighting and fire extinction” | “Firefighting and fire extinction” |
| Oil spill scenario-BREAR | None | “Use of booms” “Use of dispersants” “Use of mechanical recycling and sorbent materials” |
| Oil spill scenario-TANIO | “Cleaning spilled oil” methods are not recommended | “Stopping ship leaks” |
| Marine organism death scenario | None | “Shut down sensitive resources” |
© 2020 by the authors. Licensee MDPI, Basel, Switzerland. This article is an open access article distributed under the terms and conditions of the Creative Commons Attribution (CC BY) license (http://creativecommons.org/licenses/by/4.0/).
Share and Cite
MDPI and ACS Style
Huang, K.; Nie, W.; Luo, N. Scenario-Based Marine Oil Spill Emergency Response Using Hybrid Deep Reinforcement Learning and Case-Based Reasoning. Appl. Sci. 2020, 10, 5269. https://0-doi-org.brum.beds.ac.uk/10.3390/app10155269
AMA Style
Huang K, Nie W, Luo N. Scenario-Based Marine Oil Spill Emergency Response Using Hybrid Deep Reinforcement Learning and Case-Based Reasoning. Applied Sciences. 2020; 10(15):5269. https://0-doi-org.brum.beds.ac.uk/10.3390/app10155269
Chicago/Turabian StyleHuang, Kui, Wen Nie, and Nianxue Luo. 2020. "Scenario-Based Marine Oil Spill Emergency Response Using Hybrid Deep Reinforcement Learning and Case-Based Reasoning" Applied Sciences 10, no. 15: 5269. https://0-doi-org.brum.beds.ac.uk/10.3390/app10155269
Note that from the first issue of 2016, this journal uses article numbers instead of page numbers. See further details here.