Erythemal Solar Irradiance, UVER, and UV Index from Ground-Based Data in Central Spain


Atmosphere and Energy Laboratory, Science Faculty, University of Valladolid, Campus Miguel Delibes 7, 47011 Valladolid, Spain
*
Author to whom correspondence should be addressed.
Appl. Sci. 2020, 10(18), 6589; https://0-doi-org.brum.beds.ac.uk/10.3390/app10186589
Submission received: 16 June 2020
/
Revised: 14 September 2020
/
Accepted: 15 September 2020
/
Published: 21 September 2020
(This article belongs to the Special Issue Solar Radiation: Measurements and Modelling, Effects and Applications)
Abstract
:The study shows an analysis of a 7-year data set measuring Ultraviolet-B (UVB) irradiance values and ultraviolet index TABLEUVI) values derived from ground-based broadband irradiance measurements, satellite-derived total ozone, and UVB solar irradiance recorded in Valladolid (Central Spain). Ultraviolet-B (UVB) solar irradiance measurements in the range (280–315 nm) carried out during the period 2013–2019 at a continental Mediterranean solar station, located in Valladolid (Spain), were analyzed. UVB data recorded using a YES UVB-1 pyranometer were used to estimate erythemal irradiance, ultraviolet erythemal irradiance (UVER), UVI, cumulative dose, and sun protection. Hourly UVER data in January (minimum values) and June (maximum values) were analyzed as an average year for the measurement station. Differences between UVI values at solar noon and the maximum daily value were minimal. It was found that on certain summer days, maximum daily UVI and SED (cumulative daily dose) could be over 12 and 60, respectively. The cumulative dose on the horizontal surface was calculated at the station for different skin types. It was observed that over 45% of the annual dose is received in summer, about 30% in spring, over 15% in autumn, and less than 10% in winter. In addition, the relationship between the maximum daily UVI and the annual accumulated dose in SEDs was studied to provide information on sun protection under low UVI conditions.
1. Introduction
Ultraviolet solar irradiance (UV) causes chemical and biological processes in the lower atmosphere and at the Earth’s surface and has been widely studied in recent decades [1]. UV ranges between 100–400 nm and scattering as well as absorption processes in the atmosphere attenuate the spectral interval. UV radiation (200–400 nm) at the top of the atmosphere represents less than 7% of total irradiance. Stratospheric ozone absorbs the shortest wavelengths (UV-C, 100–280 nm); ozone weakly absorbs wavelengths in the UVB range (280–315 nm) and as a consequence, a small part of UV-B and most UV-A (315–400 nm) radiation reach the Earth’s surface [2]. Sun height and station altitude modify the solar UV irradiance that reaches the ground because they change the sunlight’s path length into the atmosphere. UV variations at the Earth’s surface [3,4] can be caused by atmospheric components such as clouds, total ozone column, aerosols, and desert dust. As a result, 94% of UV energy at ground level corresponds to the UV-A component and 6% to UV-B [5].
UV effects are related to a major increase in illnesses, and UV-B solar irradiance exposure can cause skin cancer, sunburn, ocular damage, cataracts, allergies, and other effects in human beings. Biological response in the UV range is greater at lower wavelengths, such that small increases in UV-B irradiance can have substantial biological effects [6]. Biological sunburn or the erythema effect is one of the most common reactions to UV-B radiation overexposure in humans. It is analyzed through ultraviolet erythemal radiation (UVER), which is defined as the spectrally integrated solar irradiance at ground level weighted with the standard erythema action spectrum curve adopted by the CIE (Commission Internationale de l’Éclairage) in 1987 [7,8]. The effects of UVER on the skin that has not previously been exposed to solar irradiance are usually studied by the UVER minimum dose, which can cause intense reddening of human skin, [9].
Different institutions, such as the World Meteorological Organization (WMO), the (ICNIPR) International Commission on Non-Ionizing Radiation Protection, the World Health Organization (WHO), and (UNEP) the United Nations Environmental Programme, recommend use of the UV Index as an indicator of potential skin damage from solar UV irradiance [10].
In 1995, the global solar UV index, UVI, was recommended for forecasting and informing the public about UV irradiance values that reached the ground [10]. The UVI value is evaluated by multiplying the UVER irradiance value (expressed in W/m2) by 40 and is reported as a value rounded to the nearest integer [11].
As regards the harmful effects, stratospheric ozone depletion, and the increase of erythemal UV doses, authors propose the development of studies, programs, and strategies designed to raise awareness amongst the population of the need for protection from the sun [12].
In 2002, the UV Index (UVI) was standardized by the World Meteorological Organization (WMO) [10], and the World Health Organization (WHO) [10], as a simple indicator of potential skin damage from solar UV irradiance. Previously, within the framework of the European COST-713 Action, the forecast and dissemination of UVI were analyzed recommending the use of radiative transfer models to operationally determine UVI values [13]
Additionally, the WMO (2007, 2008) [14,15] and other national organizations have encouraged the establishment of networks to measure UV irradiance and, more specifically, erythemal irradiance. Many stations have recently started to take continuous measurements and, particularly in the Northern Hemisphere, long-term case studies and trend analyses are being carried out. Different authors (e.g., Lindfors et al., 2007; Chubarova, 2008; Rieder et al., 2008; Antón et al., 2011; [16,17,18,19]) have therefore established modeling approaches to reconstruct past UV radiation time series.
Several researchers now propose smartphone applications for UVI forecasts, given that occupational or recreational sun exposure is crucial to public health. Recent publications have developed algorithms for evaluating erythemal UV doses on sloped surfaces and their application to the human body [20]. In addition, methods for daily vitamin D synthesis in outdoor and indoor conditions are being studied, with a small outdoor UVI sensor sending information to the smartphone, evaluating the user’s daily dose, estimating the amount of vitamin synthesis, and gauging the UVB LED lighting required in indoor conditions [21,22].
In this context, solar measurement station data play a key role and allow UVER irradiance climatology, UVER exposure distribution, UV Index, and sun protection at low UVI levels to be studied to reduce UVER effects on people. The station also advises photo-protection action required for workers, sportsmen and women, walkers, cyclists, children, and so on. The current manuscript provides an analysis of UVB measurements recorded during the period 2013–2019 in Valladolid, Spain, at an altitude of 702 m a.s.l. for estimating UVER, UVI, cumulative doses, and sun protection impact when UVI is below three. Although the authors previously performed a study of radiative and meteorological variables in the same region in a rural area [23,24], the new characteristics and novelties of this work are that the present UVB measurement station is located in the city of Valladolid itself. Data were recorded every minute, with this being the first time that such research has been performed in this area using one-minute data as a measurement timescale. In addition, information about the UVER station in central Spain has been included as one of the 160 solar stations in 25 European countries, showing the station’s activity via web and publishing certain information, as can be seen in reference [25].
2. Materials and Methods
The measurements used in this manuscript were recorded at the solar station located in the University of Valladolid Science Faculty, (SF), situated in the northeast of the city of Valladolid, Spain. In this article, UVB solar irradiance measurements were recorded from July 2013 to March 2019, continuously for 66 months. Table 1 shows the geographical coordinates of the measurement station and the database used in the study. The general characteristics of the meteorological station are maximum temperature near 34 °C in summer with clear skies, while the average minimum temperature is about 3.0 °C in winter. Throughout the year, the mean rainfall is 570 mm.
2.1. Place
Measurements were taken in Spain, on the Iberian Peninsula, in southwest Europe. Latitudes range between 27°–44° N, and longitudes between 19° W and 5° E. The area is bordered by Portugal, the Atlantic Ocean, France, and the Mediterranean Sea and covers 505,990 km2. The most important mountain systems in the country are the Cantabrian Mountains (across northern Spain), the Pyrenees (the natural border with France), the Central System, together with the Iberian System (which runs from the eastern Cantabrian Mountains to the Betic System), and the previously mentioned Betic system (in the southern and eastern parts of the country). The warm Spanish climate is made up of hot summers and cold winters inland and sunny summers and cloudy winters along the coast. The measurement station is located between the Atlantic Ocean and the Mediterranean Basin and is under the influence of Atlantic high pressures from the Azores and low pressures from Iceland. The average yearly temperature during the measurement period was 11.8 °C. The average January temperature was 3.2 °C, while in July the average temperature was 23.8 °C. The average pressure was 1025.4 mb and the mean rainfall was 470.5 mm.
2.2. Equipment
A YES UVB-1 pyranometer (Yankee Environmental Systems Inc., Turners Falls, Massachusetts, 01376) on a horizontal surface [4], which has a spectral sensitivity close to the erythemal action spectrum, was used to record UV-B irradiance [4]. The YES UVB-1 sensor spectral response ranges between 280 and 320 nm, and is similar to the erythemal (sunburn) and DNA damage action spectra. The YES UV-1 Pyranometer characteristics for solar zenith angle between 0–60° has a cosine response above +5%, and the sensitivity is 1.9 Wm−2V−1. The YES UVB-1 sensor was calibrated by the Spanish National Institute in Aerospace Technology (INTA). The radiometer spectral response measured indoors was compared with a Brewer MKIII spectroradiometer outdoors [26]. Sensor uncertainty ranged between 8–9% [27]. From the calibration results, a double input matrix was obtained whose terms depend on the zenith angle and total ozone column, (TOC), values. Erythemal effective irradiance was thus obtained from the sensor output-voltage, multiplying the sensor voltage signal by the corresponding term of the calibration matrix [28]. The corresponding UVER values in Wm−2 were subsequently obtained. Taking into account Hu¨lsen and Gro¨bner’s [29] results, experimental evaluation uncertainties ranged between 4.6–7%.
From satellite-based remote sensing, daily total ozone column data, TOC, were obtained, from TOMS/OMI, (Total Ozone Mapping Spectrometer (NASA)/ Ozone Monitoring Instrument), onboard the Earth-Probe/Aura satellites. Data are the average of a square with a 0.2° side centered on the coordinates of the measurement station. Daily TOC values were retrieved from (http://disc.sci.gsfc.nasa.gov/Aura/data-holdings/OMI/omto3_v003.shtml) at the Valladolid station [30,31]. Daily TOC values range from 282 to 365 DU (Dodson units). In general, daily TOC values display a yearly evolution at the measurement station with maximum values in spring (April, May) and minimum values in autumn (October, November).
A CR23X Campbell data logger was connected to the YES UVB-1 solar sensor. The adapted software-enabled UVB solar irradiance to be recorded each 10 s. Average values were evaluated every one minute and from them hourly and daily values were obtained [4].
Following previous studies and publications [23], a useful data quality control test established the measured data series before processing. The test used aimed to remove faulty data and inaccurate measurements resulting from the response error of the sensor. The test assumes that data are homogeneous, and that data variation is only due to meteorological and climatic situations and that there are no other error reasons. The sensor detection limits and subsequent conditions that made up the quality control test were given by the following expression: UVB ≤ 1.2 UVB0, where UVB is the measured value and UVB0 is the horizontal extraterrestrial solar UVB irradiation. After the test, a total of 5267 values were rejected due to erroneous data (anomalous recording of the sensors). The final number of data that passed the quality test is shown in Table 1.
2.3. Data
The UVER erythemal irradiance data series recorded and obtained at the measurement station comprised 1,347,429 1-min diurnal data, which were used to evaluate 24,132 hourly data and 1881 daily UVER data, as can be seen in Table 1. Measurements were subject to quality control (Section 2.2) to detect any error. The geographical coordinates and altitude of the station are given in Table 1. As explained before, daily TOC data obtained from OMI were also used in the study. In addition, a new variable that we use throughout the manuscript is skin type. Table 2 shows the energy needed to produce one MED of erythemal irradiance for each skin type together with the characteristics of four skin types. However, standard erythemal dose (SED), which corresponds to 100 J/m2 and which is not a function of skin type, should be used instead of the MED [9].
2.4. Method
The difficulty involved in skin photobiology is that the ability of ultraviolet (UV) irradiance to produce erythema in human skin depends strongly on wavelength, and exposure needs to be expressed as an erythemal weighted quantity. In this context, the following variables are defined: Erythema action spectrum, Sr(λ), is a function that represents the spectral dependence of UV’s ability to produce perceptible erythema in human skin. Erythemal spectral irradiance, UVER, represents spectral irradiance on the surface, Eλ, weighted with the erythema action spectrum, Sr(λ), which is therefore based on the action spectrum whose maximum value is one (see Figure 1). If spectral UVER is integrated between 280 and 400 nm, UVER irradiance is obtained: UVER = ∫ Eλ(λ) Sr(λ) dλ (1). Erythemal dose, or erythemal radiant exposure Her = ∫∫ Eλ(λ) Sr(λ) dλ dt (2), which is given as a function of λ and time t.
Action spectra were calculated in various laboratories and field studies for different biological processes; for example, erythemal action spectra were explained by Madronich 1997 [32].
In this study from UVER data, the UVI, minimal MED dose, and the erythemal standard dose, SED, are evaluated. For each day, the daily MED doses are calculated as the UVER daily values in J/m2 divided by the dose required to produce one MED for each type of skin (shown in the last column of Table 2). From these values, cumulative monthly values were calculated. Cumulative daily SED values were obtained as the daily UVER values divided by 100 J/m2, which is the same value for all the days. These evaluations then give some curves that represent the daily MED and SED as a function of the day of the year. Results are applied for sun protection recommendations at low UVI levels.
3. Results
3.1. UVER Solar Irradiation
3.1.1. Daily Values
Figure 2 shows the yearly evolution of the daily (green) and monthly average (red) UVER irradiation values (kJm−2) in Valladolid, Spain, for the period 2013–2019. The curves of the daily and monthly UVER values show a sinusoidal evolution, with minimum values in January and December that range between 0.43 kJ/m2 in January 2018 and 0.47 kJ/m2 in December 2014. Similar results have been obtained by other authors [23].
Monthly maximum values range between 4.61 kJ/m2 in July 2018 and 5.18 kJ/m2 in July 2016. The values obtained in 2018 are slightly lower than those obtained for previous years, due to the importance of the precipitation effect. Maximum daily UVER values range between 5.76 kJ/m2 on 19th June and 6.12 kJ/m2 on 22nd June 2016.
Minimum daily UVER values range between 0.06 kJ/m2 on 31st December 2015 and 0.14 kJ/m2 on 4th January 2016. In addition, there are some strong fluctuations of daily UVER values in winter months that could be explained by the different meteorological events influencing the region.
The situation makes cloud coverage more abundant in winter months (January and February) than in the rest of the year [23], which could be explained by the Atlantic low-pressure systems usually associated with warm air, high winds, and atmospheric lifting.
3.1.2. Hourly Values
Figure 3 shows the monthly mean hourly UVER evolution in Valladolid, Spain, for the period 2013–2019 at the measurement station. The values recorded at 12:00 true solar time (TST) are always the maximum values, with the lowest being obtained in December, 28.3 mWm−2. The highest maximum hourly value obtained in July was 213.7 mWm−2.
Knowing the maximum UVER values is an advantage as this will prove useful for calculating UVI levels. The most representative statistical indices of the UVER irradiance obtained at local noon were evaluated from the measurement station data. In this regard, Table 3 and Table 4 show the results obtained for January and June, respectively.
As can be seen in Table 3, in January, the absolute maximum UVER measured at midday is 61.03 mWm−2 and the absolute minimum is 3.68 mWm−2. The difference between the P95 percentile (in percentage) and the absolute maximum at the station is 20%, which is lower than the difference observed between the P5 percentile and the absolute minimum. The comparison between the absolute extreme values (maximum and minimum) and their corresponding quartile values (Q3 and Q1) was calculated in order to know whether they were representative of the series of measurements, respectively). Therefore, although the minimum values show unexpected extreme values for this month, the maximum values can be seen as typical of UVER at local noon in January.
Table 4 shows that the hourly UVER absolute maximum value in June is 260 mWm−2 and the absolute minimum is 32.1 mWm−2. The difference between the P95 and the absolute maximum is lower than that observed between the P5 percentiles and the absolute minimum. Extreme values were compared with the quartiles and evidenced a variation of between 40%; the Q3 value and the absolute maximum shows a difference whose value is 25 mW m−2, a result similar to that obtained in January. The maximum values may be considered characteristic of UVER at local noon in June while the minimum values may not. Similar results were obtained in Argentina [11]. Both months normally show the highest and lowest UVER records at the measurement station, which might be due to the yearly total ozone column values that exhibit a minimum at the end of the year in the Northern Hemisphere and a maximum in spring (March, April).
3.2. Solar UVI Study
Solar UVI is a variable that provides information regarding UV radiation levels at the Earth’s surface and which indicates the possibility of skin damage [31,32]. UVI is a variable that alerts to the need to use special protective measures when there is human exposure to UV radiation. UVI was prepared by different international institutions, and since its publication in 1995 has improved its use as a health tool to encourage sun protection. At present, over 50 research laboratories monitor UVI in Europe, as can be seen in [16]. Using experimental UVER, the UV index has been evaluated from solar irradiance measurements using two different norms: (a) the value at midday, used up to 1998. (b) the value approved by all the various worldwide organizations, namely, the maximum daily value. Figure 4 offers a statistical analysis of the differences between the UVI values obtained with each norm at the study station. It shows an agreement percentage of 62.1%, but in 20.3% of cases, there was a difference of one UVI unit, while in 5.3% of cases there was a difference of several UVI units.
We, therefore, observe that the UV index at solar noon disagreed with the maximum daily value by one or less in 82.4% of the cases studied in Valladolid, Spain. These results are comparable to those obtained by [26] who analyzed 10 years of UV measurements at 16 of the Spanish UVB Radiometric
Network stations. Results show that the percentage of coincidence is lower for stations at which cloudiness is more variable. Authors [26] have found that the percentage of cases for which the difference between the two criteria was zero or one UVI unit varied between 89%, in A Coruña, Spain, and 95%, in El Arenosillo, Huelva, Spain where the average value is 92%. The result is higher in the south of Spain.
Table 5 displays the percentage (%) of maximum daily UVI values at the measurement station, classified according to exposure levels, using the color code approved by the WHO [10]. UVI reaches high values (6–7) on over 17% of days, very high values (8–10) on over 28%, and extreme values (≥11) in 0.3% of cases in Valladolid, Spain. UVI values of above 10 were normally recorded in warm seasons; namely, spring and summer.
It could be assumed that human skin requires maximum protection when there are high UVI values. This entails the need to wear appropriate clothing and to follow the established rules, e.g., by wearing long-sleeved shirts, sunglasses, hats, total sunscreen of solar protection factor (SPF) 30+, and by avoiding sunbathing between 12.00 and 15.00, the central hours of the day [10].
3.3. Cumulative Doses for Four Different Skin Types
To understand the different cumulative dose evaluations for various skin types, it is worth looking at some definitions, variables, and concepts. It is known that the standard erythema action spectrum shows an internationally accepted representation of the erythema caused by the UV wavelength spectrum parts. It is defined as a spectral UV capacity to produce erythema in human skin. In addition, the action spectrum form is used for public health information and forms part of the standard erythema dose unit (SED) and the minimum erythema dose (MED). The action spectrum of a biological effect describes the wavelength-dependent response for the irradiance. In UV studies, we have observed that different variables, such as UVI, SED, and MED, have been defined, and it is known that UVI indicates the instantaneous sunburning potential of solar irradiance; total erythemal radiation received can be expressed in terms of the standard erythema dose unit (SED), where one SED is defined as 100 Jm−2. The minimum erythema dose (MED) is the minimum dose of erythemal irradiance that produces faint but perceptible reddening of the skin 24 h after receiving irradiance. In addition, the MED is not a standardized term but a personal measure of susceptibility to sunburn. Derived units are thus based on the erythema action spectrum.
As a conclusion, the erythemal action spectrum, (Ser(λ)), should be defined as the spectral dependence of UV capacity to produce erythema in human skin. Erythemal effective irradiance, UVER, is the product function of spectral irradiance and its erythema action spectrum [9] integrated over the wavelength.
In this section, the relationship between maximum daily UVI and the cumulative daily dose in SEDs is analyzed using measured daily UVER data. In addition, to do this the main characteristics of four skin types, as well as the dose required to produce one MED shown in Table 2, are used.
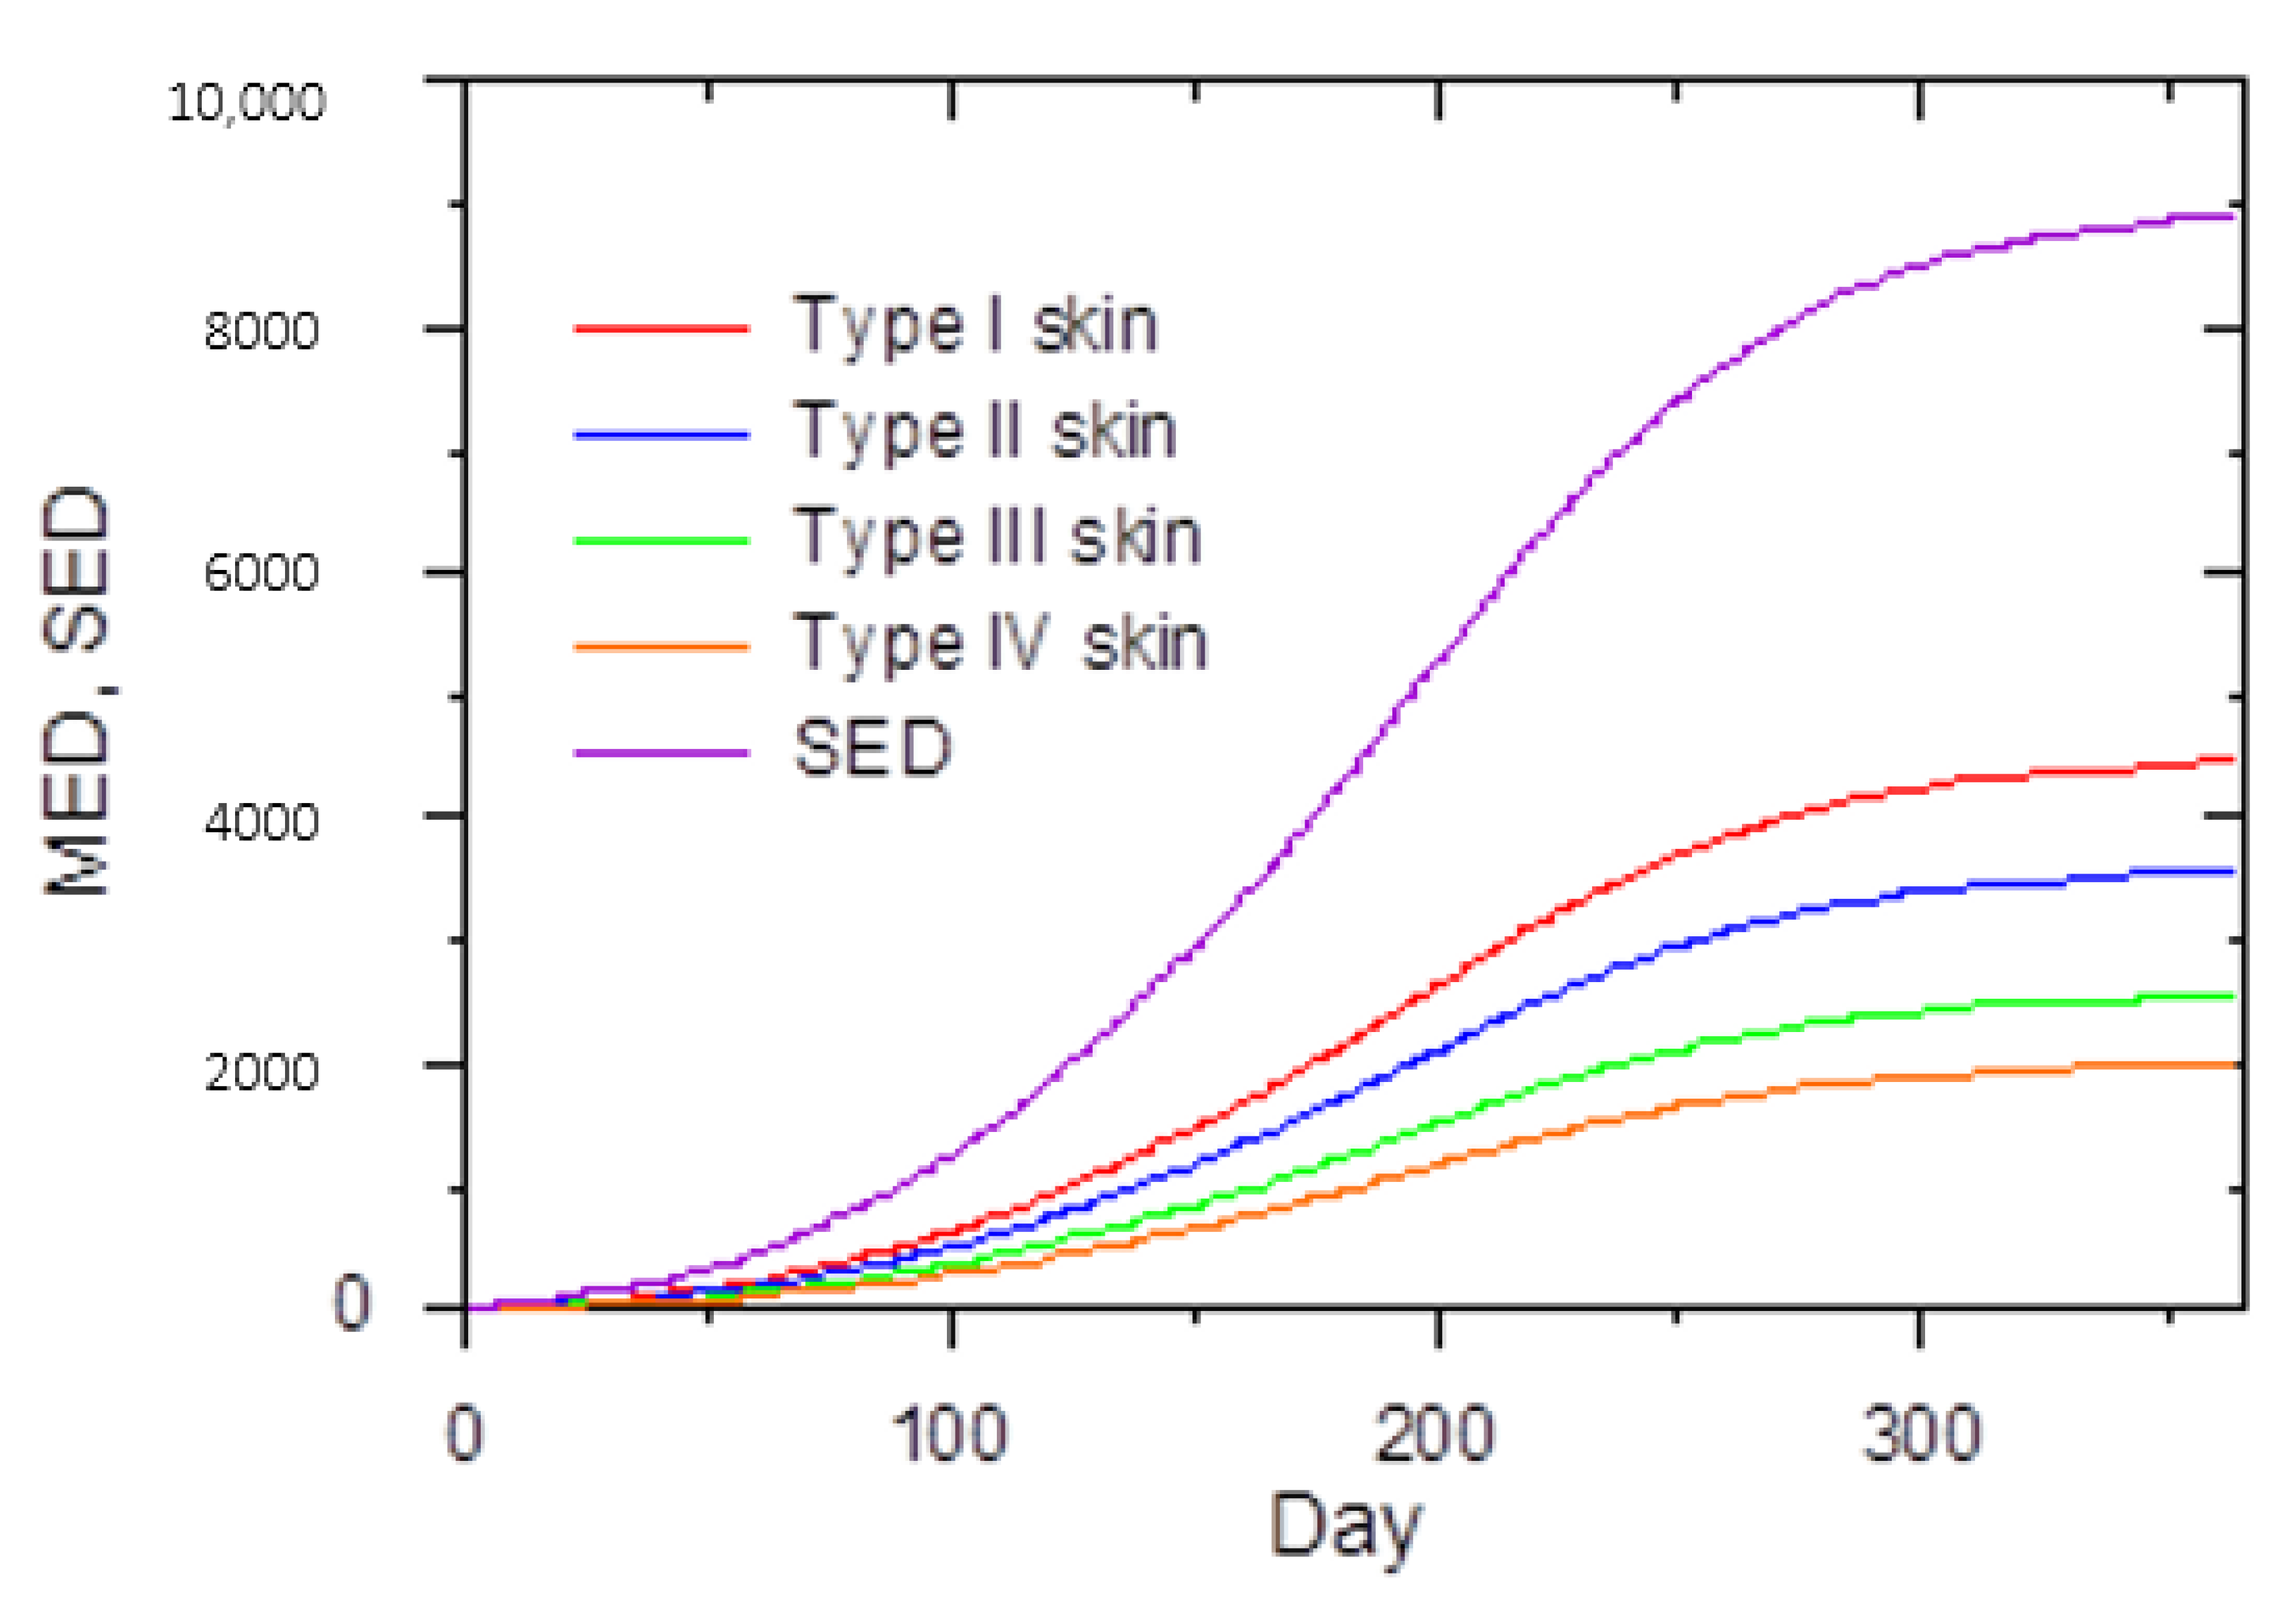
As a result, the yearly cumulative dose for each skin phototype is shown in Figure 5. The Standard Erythemal Dose curves, SED and MED, were obtained by dividing the daily UVER values by the corresponding MED and SED values over an average year at the measurement site. The results indicate the erythemal irradiance received throughout the year in a horizontal position and for continuous and uninterrupted exposure to the sun. Figure 5 shows that the cumulative doses during an average year reach 8921 SEDs in Valladolid. Table 2 shows the main characteristics of four skin types used to carry out the evaluations. The most common skin type in Valladolid, Spain, is phototype II and Figure 5 shows how it could receive an annual cumulative dose of 3559 MED (blue curve).
Figure 5 depicts a clear change in the slope in the cumulative curves in summer (June, July, and August). When the cumulative doses are estimated for each season, we observe that 47.06% of the annual cumulative dose is received in summer, 28.38% in spring, 18.13% in autumn, and 6.42% in winter. The major difference found between summer and winter contributions to the yearly dose is due to the combined effect of the Earth’s orbit around the sun (producing maximum global irradiance in June in the Northern Hemisphere) and the yearly evolution of the total ozone column (showing a maximum in February–April). We, therefore, see that UVER values at these latitudes are much higher in summer and spring than in autumn and winter.
3.4. UVI, Cumulative Doses, and Risks
UVI reports the instantaneous sunburning potential of solar UVER irradiance and supplies information about the risks of sun exposure [10]. In addition, sun protection studies are given in different public actions. These state that sun protection warning is not necessary if the UVI value is below two. Different authors explain how sun exposure damage depends on daily UVI and cumulative daily dose SEDs and not only on UVI [33]. In this section, the relation between maximum daily UVI and cumulative daily dose in SEDs is studied through UVER measured data to explain the above recommendation concerning sun exposure dependence.
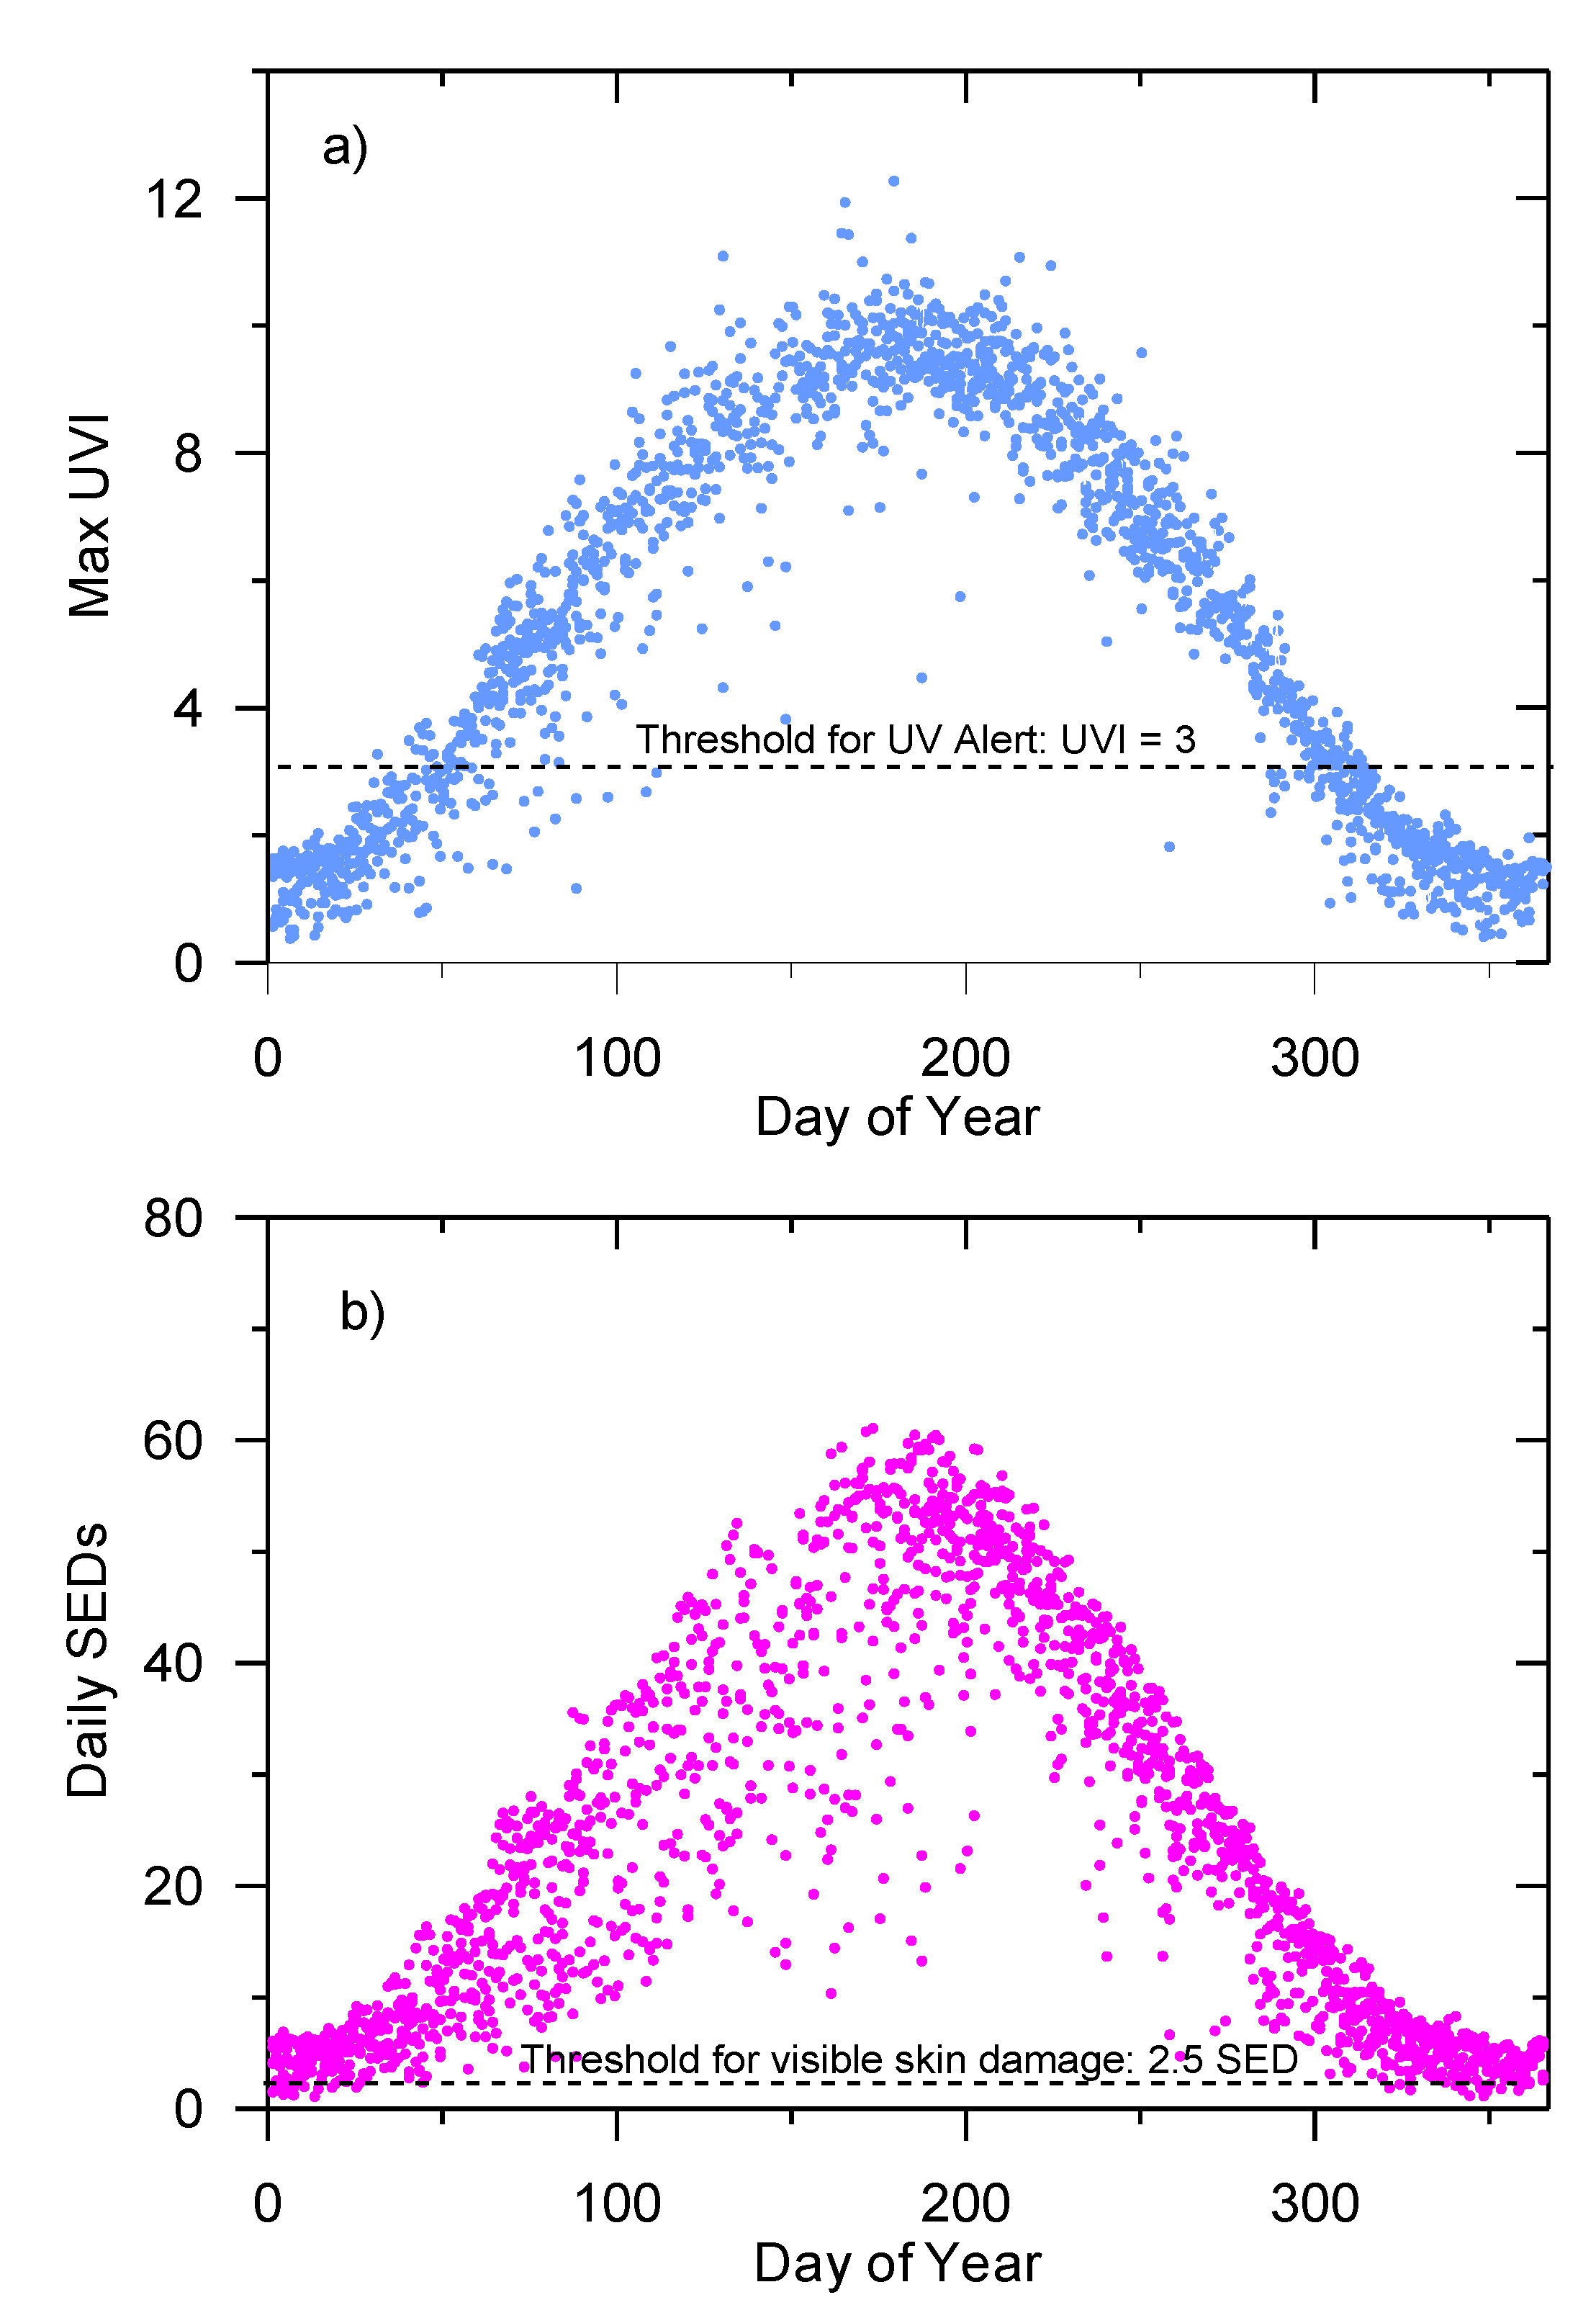
Regarding the results, Figure 6a shows the experimental yearly evolution of maximum daily UVI and daily dose in SEDs measured in Valladolid, Spain, as a function of the day of the year. It can be seen that the maximum daily UVI in summer exceeds 12 (Figure 6a) and that the maximum daily dose can exceed 60 SED (Figure 6b) [33,34]. However, the number of daily SED values below the 2.5 SED threshold is very small.
There is therefore sufficient UVER solar radiation on summer days to cause 24 MEDs of erythemal doses for skin type II (due to 60 J/m2 being equivalent to 24 MEDs, or 1 J/m2 to 2.5 MEDs). This means that sunscreen should have a solar protection factor (SPF) of above 24. Over the winter months, the maximum UVI for clear days is one or two, while the daily dose is between 2.5 and 5 SEDs (see Figure 6).
Figure 7 shows the erythemal irradiance daily dose in SEDs as a function of the maximum UVI value for each day. The data envelope curve corresponds to days with clear skies. Figure 7 shows that there are very few days whose daily doses are below 2.5 SED. In addition, between the maximum UVI below two and the daily dose above 2.5 SED, there are many days where the maximum UVI is below two but the daily dose is above 2.5 SED. Figure 7 shows that the damage threshold for fair skin is exceeded almost every day, including those for which maximum UVI is in the range 0.5 to 3 [23,24]. It can be seen that there are many days when UVI is below 3.0, but that the daily dose is above 10 SEDs and that on a few occasions it even reaches 14 SEDs. Figure 7 shows a blue point, the coordinates for which reflect a UVI of 3.0, and a daily dose of 17.5 SEDs. Other places have reported similar results, with daily doses at mid-latitude sites surpassing 10 SEDs when the maximum UVI is below 3.0 and when visible damage to fair-skinned people can occur in little over an hour [35].
A review is required of the information provided concerning sunburn in mid-latitude areas, when UVI < 3 and sunscreen protection did not recommended. Although the issue might not be as serious in winter months and at high latitudes, such as Northern Europe [36] where maximum UVI is often below 1 and where the daily dose is below 2.5 SED on many winter days. However, similar issues will arise in seasons when maximum UVI values approach UVI = 3.0 [35,37].
In light of the results, and following various authors’ statements [35,36,37] to the effect that “no protection is required for UVI< 3″, public authority recommendations need to be removed or appropriately amended as it is known that skin damage is a function of two variables: UVI and time of exposure, which are related to the cumulative daily dose. Specific information about not needing to use protection should only be given for days when the cumulative daily total UV dose is below the damage threshold; namely, 2.5 SED for skin type II, as can be seen in Figure 7 [35].
4. Discussion
Figure 5 and Figure 6 show how the information given to the public concerning whether or not it is necessary to use sun protection for low UVI might be incomplete. The results to come out of the study are particularly worthy of note for mid-latitude areas. For days when the maximum UVI is below the threshold for recommending protection, the available daily UV sunburn dose is higher than the threshold for visible damage to fair skin. Furthermore, UV damage to vertical body surfaces, such as the face, neck, and legs could have serious effects in winter because, when the sun is lower in the sky, incident UV on such surfaces can be significantly greater than on horizontal surfaces. The head and neck are the body areas where skin damage from sunlight is most noticeable [35,36].
Incorrect public recommendations could have a major adverse effect on health. At mid-latitude stations, there are many days with a maximum UVI below 3.0, but with daily doses that are above the damage threshold. For these stations, the dose on days when peak UVI is below 3 represents approximately 10% of the total annual dose. In contrast, at low-latitude sites, the contribution from days with UVI < 3 is less than 1% of the total. In the limit, at the highest northern latitudes, peak UVI is always less than 3, and 100% of the total annual dose is received on days with a peak UVI of less than 3.0 (although in this case, the daily total dose will usually be below the damage threshold).
As a result, fair-skinned people in mid-latitude areas are sensitive to UV damage, and “No protection” recommendations for long-duration outdoor activities should be revised. The risk of developing skin cancer [31] increases if an SPF 30 sunscreen is not used on days with UVI < 3.0, due to the cumulative dose possibly being higher than that corresponding to days with UVI > 3.0.
5. Conclusions
Measurements of UV erythemal solar irradiance recorded for over five years at a meteorological station located at an altitude of 702 m a.s.l. in Valladolid, Spain, were processed and analyzed. From the measurements, the UVI index and the cumulative doses were obtained and studied.
Yearly UVER evolution at the station shows minimum values in January and maximum values in June. Average hourly monthly UVER values were analyzed at the location. The difference between the Q1 quartile and the absolute minimum is (80%), and the difference between the absolute maximum and the Q3 quartile is small (10.6%). As a result, maximum values are typical at solar noon, whereas minimum values are extremely unusual.
The UVI index shows a slight disagreement between the maximum daily values and the solar noon value. Whereas there are no differences in 62.1% of cases, in 20.3% of cases, the difference was one unit, and in 5.3% of cases were two UVI units. UVI reached extreme, very high, or high values in 46.4% of cases.
Finally, the cumulative yearly doses for each skin phototype and the standard erythemal dose over an average year were studied at the station. During summer and spring, the doses received were two-thirds of the yearly dose, while in winter and autumn the dose received was one-third of the yearly dose.
Recommendations concerning the use of sun cream protection at low UVI levels and sunscreen protection at mid-latitudes should be revised. This could prove to be extremely important in the Mediterranean or similar areas with latitudes about 40° North and less. The conclusion is that the risk of developing skin disease might increase if an SPF 30 sunscreen is not used on days with UVI < 3 because the cumulative dose could be higher than that corresponding to days with UVI > 3.
Author Contributions
Conceptualization, A.d.M. and J.B.; methodology, J.B.; software, A.d.M.; validation, J.B., A.M.; formal analysis, J.B. and A.d.M.; investigation, A.d.M.; resources, J.B.; data curation, A.d.M.; writing—original draft preparation, J.B.; writing—review and editing, A.d.M.; visualization, J.B.; supervision, A.d.M.; project administration, J.B.; funding acquisition, J.B. and A.d.M. All authors have read and agreed to the published version of the manuscript.
Funding
The Spanish Ministry of Science and Innovation funded the research through the (CGL2011-25363) project.
Conflicts of Interest
The authors declare no conflict of interest.
References
- Bilbao, J.; González, P.S.; Castrillo, A.D.M. UV-B climatology in Central Spain. Int. J. Clim. 2008, 28, 1933–1941. [Google Scholar] [CrossRef]
- De Miguel, A.; Bilbao, J.; Román, R.; Mateos, D. Measurements and attenuation of erythemal radiation in Central Spain. Int. J. Clim. 2011, 32, 929–940. [Google Scholar] [CrossRef]
- Palancar, G.G.; Toselli, B.M. Erythemal ultraviolet irradiance in Córdoba, Argentina. Atmos. Environ. 2002, 36, 287–292. [Google Scholar] [CrossRef]
- De Miguel, A.; Román, R.; Bilbao, J.; Mateos, D. Evolution of erythemal and total shortwave solar radiation in Valladolid, Spain: Effects of atmospheric factors. J. Atmos. Sol.-Terr. Phys. 2011, 73, 578–586. [Google Scholar] [CrossRef]
- Iqbal, M. An Introduction to Solar Radiation; Elsevier BV: Amsterdam, The Netherlands, 1983. [Google Scholar]
- Diffey, B.L. Solar ultraviolet radiation effects on biological systems. Phys. Med. Boil. 1991, 36, 299–328. [Google Scholar] [CrossRef] [PubMed]
- McKinlay, A.F.; Diffey, B.L. A reference spectrum for ultraviolet induced erythema in human skin. CIE J. 1987, 6, 17–22. [Google Scholar]
- Diffey, B.L. Human exposure to ultraviolet radiation. Semin. Dermatol. 1990, 9, 2–10. [Google Scholar] [CrossRef]
- Erythema Reference Action Spectrum and Standard Erythema Dose; CIE Standard, CIE Publications: Wien, Austria, 2000; p. 4, ISO/CIE 17166:2019.
- WHO. Global Solar UV Index: A Practical Guide. In A Joint Recommendation of the World Health Organisation, World Meteorological Organisation, United Nations Environment Programme, and the International Commission on Non-Ionizing Radiation Protection; World Health Organization: Geneva, Switzerland, 2002; ISBN 92-4-159007-6. [Google Scholar]
- Utrillas, M.P.; Marín, M.J.; Esteve, A.R.; Salazar, G.A.; Suarez, H.; Castillo, J.; Martinez-Lozano, J.A. UVER and UV index at high altitude in Northwestern Argentina. J. Photochem. Photobiol. B Boil. 2016, 163, 290–295. [Google Scholar] [CrossRef]
- Reuder, J.; Koepke, P. Reconstruction of UV radiation over Southern Germany for the past decades. Meteorol. Z. 2005, 14, 237–246. [Google Scholar] [CrossRef]
- Vanicek, K.; Frei, T.; Litynska, Z.; Schmalwieser, A. UV-Index for the Public; Publication of the European Communities: Brussels, Belgium, 2000. [Google Scholar]
- Rycroft, M. WMO ozone project report no. 25—Scientific assessment of ozone depletion. J. Atmos. Terr. Phys. 1994, 56, 1021–1022. [Google Scholar] [CrossRef]
- WMO. Intercomparison of Global UV Index from Multiband Filter Radiometers: Harmonization of global UVI and spectral irradiance. In GAW Report No. 179; World Meteorological Organization: Geneva, Switzerland, 2008. [Google Scholar]
- Lindfors, A.V.; Kaurola, J.; Arola, A.; Koskela, T.; Lakkala, K.; Josefsson, W.; Olseth, J.A.; Johnsen, B. A method for reconstruction of past UV radiation based on radiative transfer modeling: Applied to four stations in northern Europe. J. Geophys. Res. Space Phys. 2007, 112. [Google Scholar] [CrossRef]
- Chubarova, N.Y. UV variability in Moscow according to long-term UV measurements and reconstruction model. Atmos. Chem. Phys. Discuss. 2008, 8, 3025–3031. [Google Scholar] [CrossRef] [Green Version]
- Rieder, H.E.; Holawe, F.; Simic, S.; Blumthaler, M.; Krzyścin, J.W.; Wagner, J.E.; Schmalwieser, A.W.; Weihs, P. Reconstruction of erythemal UV-doses for two stations in Austria: A comparison between alpine and urban regions. Atmos. Chem. Phys. Discuss. 2008, 8, 6309–6323. [Google Scholar] [CrossRef] [Green Version]
- Antón, M.; Gil, J.E.; Cazorla, A.; Fernández-Gálvez, J.; Vilaplana, J.-M.; Olmo, F.; Alados-Arboledas, L. Influence of the calibration on experimental UV index at a midlatitude site, Granada (Spain). Atmos. Meas. Tech. 2011, 4, 499–507. [Google Scholar] [CrossRef] [Green Version]
- Salvadori, G.; Leccese, F.; Lista, D.; Burattini, C.; Bisegna, F. Use of smartphone apps to monitor human exposure to solar radiation: Comparison between predicted and measured UV index values. Environ. Res. 2020, 183, 109274. [Google Scholar] [CrossRef]
- Salvadori, G.; Lista, D.; Burattini, C.; Gugliermetti, L.; Leccese, F.; Bisegna, F. Sun Exposure of Body Districts: Development and Validation of an Algorithm to Predict the Erythemal Ultra Violet Dose. Int. J. Environ. Res. Public Health 2019, 16, 3632. [Google Scholar] [CrossRef] [Green Version]
- Park, D.-H.; Oh, S.-T.; Lim, J.-H. Development of UVB LED Lighting System Based on UV Dose Calculation Algorithm to Meet Individual Daily UV Dose. Appl. Sci. 2019, 9, 2479. [Google Scholar] [CrossRef] [Green Version]
- De Miguel, A.; Mateos, D.; Bilbao, J.; Román, R. Sensitivity analysis of ratio between ultraviolet and total shortwave solar radiation to cloudiness, ozone, aerosols and precipitable water. Atmos. Res. 2011, 102, 136–144. [Google Scholar] [CrossRef]
- Bilbao, J.; Román, R.; De Miguel, A. Temporal and Spatial Variability in Surface Air Temperature and Diurnal Temperature Range in Spain over the Period 1950–2011. Clim. J. 2019, 7, 16. [Google Scholar] [CrossRef] [Green Version]
- Schmalwieser, A.W.; Gröbner, J.; Blumthaler, M.; Klotz, B.; De Backer, H.; Bolsée, D.; Werner, R.; Tomsic, D.; Metelka, L.; Eriksen, P.; et al. UV Index monitoring in Europe. Photochem. Photobiol. Sci. 2017, 16, 1349–1370. [Google Scholar] [CrossRef] [Green Version]
- Vilaplana, J.-M.; Cachorro, V.E.; Sorribas, M.; Luccini, E.; De Frutos, A.M.; Berjón, A.; De La Morena, B. Modified Calibration Procedures for a Yankee Environmental System UVB-1 Biometer Based on Spectral Measurements with a Brewer Spectrophotometer. Photochem. Photobiol. 2006, 82, 508. [Google Scholar] [CrossRef] [PubMed]
- Pearson, A.; Dean, S.; Clark, I.; Campbell, J.; Grainger, K.; Driscoll, C. NRPB Solar Ultraviolet Radiation Measurement Network. Radiat. Prot. Dosim. 2000, 91, 169–172. [Google Scholar] [CrossRef]
- Webb, A.; Gröbner, J.; Blumthaler, M. A Practical Guide to Operating Broadband Instruments Measuring Erythemally Weighted Irradiance. 2007. Available online: http://www-med-physik.vu-wien.ac.at/uv/COST726/COST726_Dateien/Trainingschool/Materials/Publications/GuideBB_COST726.pdf (accessed on 1 September 2020).
- Hülsen, G.; Gröbner, J. Characterization and calibration of ultraviolet broadband radiometers measuring erythemally weighted irradiance. Appl. Opt. 2007, 46, 5877–5886. [Google Scholar] [CrossRef] [PubMed]
- Bilbao, J.; Román, R.; De Miguel, A.; Mateos, D. Long-term solar erythemal UV irradiance data reconstruction in Spain using a semiempirical method. J. Geophys. Res. Space Phys. 2011, 116, 22211. [Google Scholar] [CrossRef]
- Bilbao, J.; Román, R.; De Miguel, A. Turbidity coefficients from normal direct solar irradiance in Central Spain. Atmos. Res. 2014, 143, 73–84. [Google Scholar] [CrossRef]
- Madronich, S.; McKenzie, R.L.; Björn, L.; Caldwell, M. Changes in biologically active ultraviolet radiation reaching the Earth’s surface. J. Photochem. Photobiol. B: Boil. 1998, 46, 5–19. [Google Scholar] [CrossRef]
- Marin, M.J.; Sola, Y.; Tena, F.; Utrillas, M.P.; Campmany, E.; De Cabo, X.; Lorente, J.; Martınez-Lozano, J.A. The UV Index on the Spanish Mediterranean Coast. Photochem. Photobiol. 2005, 81, 659–665. [Google Scholar] [CrossRef]
- Utrillas, M.P.; Marín, M.J.; Esteve, A.R.; Estellés, V.; Gandia, S.; Núnez, J.; Martinez-Lozano, J.A. Ten years of measured UV Index from the Spanish UVB Radiometric Network. J. Photochem. Photobiol. B Boil. 2013, 125, 1–7. [Google Scholar] [CrossRef]
- McKenzie, R.L.; Lucas, R.M. Reassessing Impacts of Extended Daily Exposure to Low Level Solar UV Radiation. Sci. Rep. 2018, 8, 13805. [Google Scholar] [CrossRef]
- Lehmann, M.; Sandmann, H.; Pfahlberg, A.; Uter, W.; Gefeller, O. ErythemalUVRadiation on Days with LowUVIndex Values—An Analysis of Data from the German SolarUVMonitoring Network over a Ten-year Period. Photochem. Photobiol. 2019, 95, 1076–1082. [Google Scholar] [CrossRef]
- Lehmann, M.; Pfahlberg, A.B.; Sandmann, H.; Uter, W.; Gefeller, O. Implications of Low Levels of the UV Index for Sun Protection. Stud. Heal. Technol. Inform. 2017, 243, 25–29. [Google Scholar]
Figure 1.
Normalized erythema action spectrum, (red), spectral irradiance on the surface (blue), and spectral ultraviolet erythemal radiation (UVER) irradiance (purple).
Figure 1.
Normalized erythema action spectrum, (red), spectral irradiance on the surface (blue), and spectral ultraviolet erythemal radiation (UVER) irradiance (purple).

Figure 2.
Yearly evolution of monthly average (red) and daily (green) UVER solar irradiation values, (kJm−2) in Valladolid, Spain, for the period 2013–2019.
Figure 2.
Yearly evolution of monthly average (red) and daily (green) UVER solar irradiation values, (kJm−2) in Valladolid, Spain, for the period 2013–2019.

Figure 3.
Monthly mean hourly UVER evolution in Valladolid, Spain, (mWm−2) for the period 2013–2019.
Figure 3.
Monthly mean hourly UVER evolution in Valladolid, Spain, (mWm−2) for the period 2013–2019.

Figure 4.
Ultraviolet index (UVI) index differences between values at solar noon and the maximum daily UVI (integer UVI units) in Valladolid, Spain, for the period 2013–2019.
Figure 4.
Ultraviolet index (UVI) index differences between values at solar noon and the maximum daily UVI (integer UVI units) in Valladolid, Spain, for the period 2013–2019.

Figure 5.
Yearly cumulative dose (minimum erythema dose—MED) for different skin types defined by ISO 17166 CIE S 007/E and Standard Erythemal Dose, in Valladolid, Spain, for the period 2013–2019.
Figure 5.
Yearly cumulative dose (minimum erythema dose—MED) for different skin types defined by ISO 17166 CIE S 007/E and Standard Erythemal Dose, in Valladolid, Spain, for the period 2013–2019.

Figure 6.
(a) Experimental yearly evolution of maximum daily UVI (b) and daily dose in SEDs, measured in Valladolid, Spain.
Figure 6.
(a) Experimental yearly evolution of maximum daily UVI (b) and daily dose in SEDs, measured in Valladolid, Spain.

Figure 7.
Daily dose of erythemal UV as a function of maximum UVI measured in Valladolid, Spain. The blue dot shows the mean SED for UVI = 3, calculated for clear days at the measurement station.
Figure 7.
Daily dose of erythemal UV as a function of maximum UVI measured in Valladolid, Spain. The blue dot shows the mean SED for UVI = 3, calculated for clear days at the measurement station.


Table 1.
Geographical coordinates and database figures for the station.
| Period | Latitude (°N) | Longitude (°W) | Altitude (m.a.s.l.) | One Minute Data | Hourly Data | Daily Data | Month Data |
|---|---|---|---|---|---|---|---|
| 2013–2019 | 41.7 | 4.7 | 702 | 1,347,429 | 24,132 | 1881 | 66 |
Table 2.
Skin types by ISO 17166 CIES S 007/E.
| Skin Type | Tanning Ability | Sunburn Susceptibility | Hair Colour | Eye Colour | MED (J/m2) |
|---|---|---|---|---|---|
| I | None | High | Blond/red | Blue | 200 |
| II | Poor | Moderate | Blond | Blue/green | 250 |
| III | Good | Low | Brown | Grey/brown | 350 |
| IV | Very good | Very low | Black | Brown | 450 |
Table 3.
Hourly UVER irradiance (mW m−2) statistical indexes, in January, at solar noon.
| Mean | Median | SD | Kurtosis | Min | Max | Q1 | Q3 | P5 | P95 |
|---|---|---|---|---|---|---|---|---|---|
| 29.4 | 30.9 | 12.31 | −0.651 | 3.68 | 61.03 | 18.7 | 38.63 | 9.41 | 48.39 |
Table 4.
Hourly UVER irradiance (mW m−2) statistical indices at solar noon in June, Valladolid, Spain.
Table 4.
Hourly UVER irradiance (mW m−2) statistical indices at solar noon in June, Valladolid, Spain.
| Mean | Median | SD | Kurtosis | Min | Max | Q1 | Q3 | P5 | P95 |
|---|---|---|---|---|---|---|---|---|---|
| 194 | 214 | 53.62 | 0.971 | 32.1 | 260 | 164 | 235 | 93.1 | 248 |
Table 5.
Days (in %) during the years studied where the shown maximum UVI values are reached.
| UV Index (%) | |||||
| UVI | 0–2 | 3–5 | 6–7 | 8–10 | 11- |
| Low | Moderate | High | Very high | Extreme | |
| UVI (%) | 32.4 | 21.1 | 17.2 | 28.9 | 0.3 |
© 2020 by the authors. Licensee MDPI, Basel, Switzerland. This article is an open access article distributed under the terms and conditions of the Creative Commons Attribution (CC BY) license (http://creativecommons.org/licenses/by/4.0/).
Share and Cite
MDPI and ACS Style
Bilbao, J.; de Migue, A. Erythemal Solar Irradiance, UVER, and UV Index from Ground-Based Data in Central Spain. Appl. Sci. 2020, 10, 6589. https://0-doi-org.brum.beds.ac.uk/10.3390/app10186589
AMA Style
Bilbao J, de Migue A. Erythemal Solar Irradiance, UVER, and UV Index from Ground-Based Data in Central Spain. Applied Sciences. 2020; 10(18):6589. https://0-doi-org.brum.beds.ac.uk/10.3390/app10186589
Chicago/Turabian StyleBilbao, Julia, and Argimiro de Migue. 2020. "Erythemal Solar Irradiance, UVER, and UV Index from Ground-Based Data in Central Spain" Applied Sciences 10, no. 18: 6589. https://0-doi-org.brum.beds.ac.uk/10.3390/app10186589
Note that from the first issue of 2016, this journal uses article numbers instead of page numbers. See further details here.