1. Introduction
Wooden boards are the main components of various products in the wooden furniture industry [
1]. The boards always have to be spliced together to construct a larger board. Moreover, to improve the quality of the product, boards with a similar color are preferred to be spliced together. Traditionally, wooden boards are manually classified by experienced workers, and there is no criteria for classifying wooden boards by color similarity. The efficiency of manual classification is low, and the accuracy cannot be guaranteed due to the similarity of colors and the fatigue of workers. To solve this problem, this paper focuses on the classification of wooden boards with the help of machine vision techniques.
Some research works have been proposed to classify the colors of wood. In [
2], the author used luminosity differences in black walnut wood to discriminate walnut wood color according to color analysis. In [
3], seven wood species were identified based on a specific color of each wood species, which was determined by the analysis of RGB (red, green, blue) color components. The quantitative color analysis performs well only when the color differences between the wood objects are significant. However, the colors of wooden boards are similar; thus, they can hardly be classified by quantitative color measurement.
Machine learning algorithms have been used for image color classification. In [
4], the authors used the k-nearest neighbor (k-NN) classification principle to classify rock images based on color textures. Reference [
5] selected color histograms of three channels in both the RGB and HSV (hue, saturation, value) color spaces as a single feature to recognize induced emotions. In [
6], wooden boards were classified by a supervised machine learning classifier based on the main color characteristic obtained through the HSV color model and the co-occurrence matrix characteristic.
However, these works can hardly be used for the color classification of wooden boards due to the following challenges. First, the colors of wooden boards are similar, which makes manual classification inaccurate and unstable. In this case, the supervised learning algorithms can hardly be used to classify the wooden boards based on their color. Secondly, wooden boards are long; thus, their images have a high resolution, which leads to the growth of the computational complexity. On the other hand, the color is the dominating feature in the image of wooden boards. This characteristic has to be considered to reduce the computational complexity.
To overcome these challenges, in this paper, we firstly analyze the images of wooden boards and derive their characteristics. Based on the analysis, we propose a new mechanism for the color classification of wooden boards. The framework includes image preprocessing, feature extraction, offline clustering, and online classification. The image preprocessing algorithm is used to subtract the background and stains on the surface of the wood. Then, the feature vector is extracted from the processed image based on the 3D color histogram. In the offline clustering, the feature vector sets are partitioned into different clusters by the K-means algorithm. Finally, in the online classification, the clustering result is used as the classifier to classify the new wood image. Furthermore, to process the abnormal images of wooden boards, we propose an improved algorithm with centroid improvement and image filtering. The experiments are executed to prove the effectiveness of the proposed mechanism.
The rest of this paper is organized as follows.
Section 2 gives an overview of various color image classification methods.
Section 3 studies the characteristics of wooden board images. The framework proposed for color classification of wooden boards is described in
Section 4. The algorithm to process the abnormal images is introduced in
Section 5.
Section 6 presents the experimental results to study the performance of the proposed mechanism. Finally, the conclusion is given in
Section 7.
2. Related Work
Color classification of wooden boards is important to improve the quality of wooden furniture where the boards with a similar color are preferred to splice together.
Quantitative color analysis is used to classify the colors of wood. In [
2], the author evaluated walnut wood color using the international CIE (Commission International de l’Eclairage) method and found that luminosity can be used to discriminate color in walnut wood. In [
3], the surface color region of seven wood species was determined by the analysis of RGB color components, and a specific color of each wood species was used to identify wood species present in a chip mixture. In [
7], the authors found that the three parameters (L*, a*, and b*) are adequate for the classification of thermally-modified ash and beech hardwood according to the analysis of the wood color with the CIE L*a*b* color space (L* for the lightness from black to white, a* from green to red, and b* from blue to yellow). In [
8], the authors used the CIE L*a*b* system to discriminate the variability of the wood color and determined the correlation with the wood’s basic density for ten Amazonian tree species.
Machine learning algorithms have become popular solutions for signal processing [
9,
10,
11]. They have also been used for color classification of wooden boards. In [
6], the authors studied the supervised machine learning methods for wood classification based on the main color characteristic obtained through the HSV color model and co-occurrence matrix characteristic. In [
12], the average RGB histogram value for each color channel and the static characteristics of the gray-level co-occurrence matrix were used as features to identify the strength of wood. In [
13], the SVM (support vector machine) model achieved an accuracy of 0.960 for classification of thermally-modified wood using the color lightness parameter as a feature.
In addition, approaches related to the classification of other color images were proposed. In [
4], the k-nearest neighbor (k-NN) classification principle was used to classify rock images based on color features in the Gabor space. Reference [
14] selected eight color features of the images extracted in the HSV, HSL (hue, saturation, lightness), and HSI (hue, saturation, intensity) color spaces to classify farmland images with the k-NN algorithm. In [
15], the authors used SVM to study the performance of color histograms in different color spaces for content based color image classification. Reference [
5] examined the performance of a wide range of classifiers in recognizing induced emotions using the color histogram as a single feature, and different numbers of color histogram bins in both RGB and HSV color spaces were considered in the examination. In [
16], the red, green, and blue color components of the RGB color model were selected as features to classify the different groups of materials with supervised machine learning algorithms.
However, due to the color similarity among wooden boards, the supervised learning algorithms can hardly be used for the color classification of wooden boards. To solve this problem, the clustering algorithms may be a reasonable solution, which has been used to process images in some applications. Reference [
17] used the k-means algorithm to classify galaxies into morphological clusters by their visual similarity. In [
18], the G-means algorithm was used for intrusion detection. In [
19], the authors adopted the fuzzy c-means clustering algorithm for color image segmentation.
Nevertheless, to the best of our knowledge, there is no related work that has used the clustering algorithm for color classification of wooden boards. The images of wooden boards have their own characteristics; thus, related works cannot be used directly. This motivates our work, which will be described in the following sections.
3. Image Characteristics of Wooden Boards
We firstly designed a machine vision testbed to obtain the images of wooden boards. The framework is shown in
Figure 1. It is composed of four main parts: a conveyor, a line scan industrial camera, a computer, and a printer. The wooden boards are automatically moved to the image capture area by a conveyor. The frames with
pixels captured by the camera are continuously combined to obtain a whole image. With the support of the Industrial Internet of Things [
20,
21], the images are transmitted to the computer for color classification. After the image is classified, the computer outputs a label of this wooden board to the printer. Then, the printer prints the label on the surface of the wooden board.
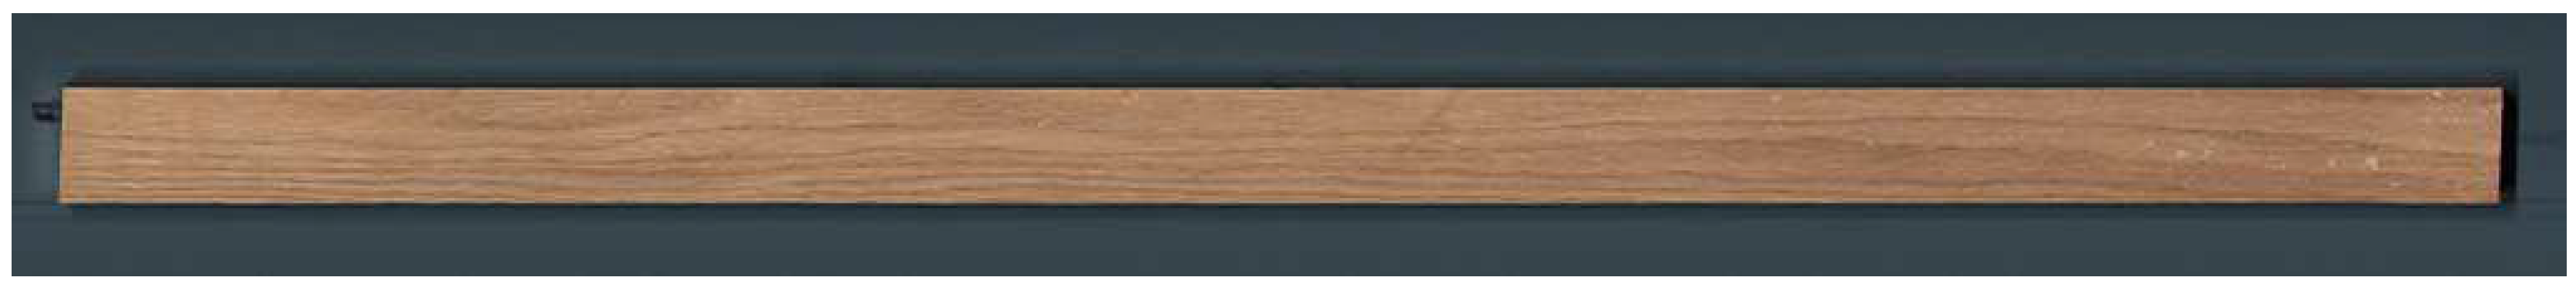
A sample of a wood image obtained through the machine vision system is shown in
Figure 2. The resolution of the captured image is
pixels. Its image has a high resolution, which may lead to high computational complexity. Moreover, it is clear that the color is the dominating feature in the color classification of wooden boards. We will use this characteristic to reduce the computational complexity.
Figure 3 shows the color difference of the wooden boards. When the wooden boards are spliced together, it is easy to justify their difference. However, their colors are generally similar when we observe them separately. In this case, the manual color classification is inaccurate and unstable, and the supervised learning algorithms can hardly be used in this scenario. We will prove this result with experiments in
Section 6.
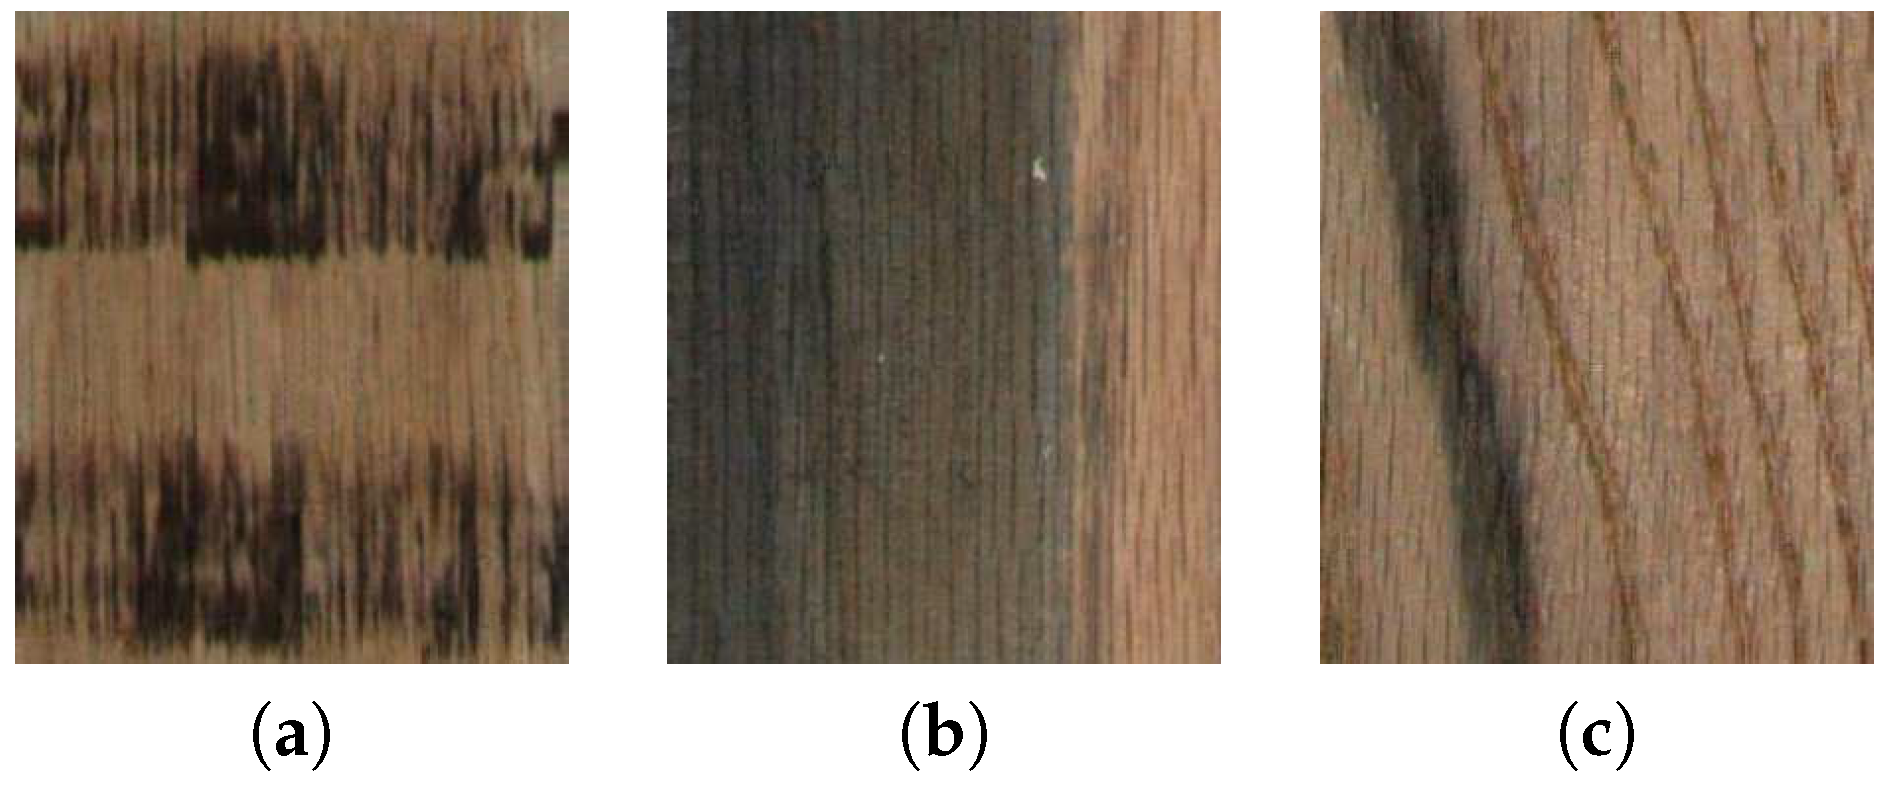
As shown in
Figure 4, there are some stains on the surface of boards. Before the wooden boards are scanned by the camera, there are several processes by which wooden boards are forced to stay straight. Therefore, some wooden boards would receive indentations with dark colors that are generated by machines, as shown in
Figure 4a. Moreover, wooden boards may be dyed by the machines with lubricating oil inevitably, as shown in
Figure 4b. Some boards contain natural defects, as shown in
Figure 4c. These stains would affect the accuracy of the color classification of wooden boards. Therefore, it is necessary to subtract the regions of these stains on the wooden boards.
4. Color Classification of Wooden Boards
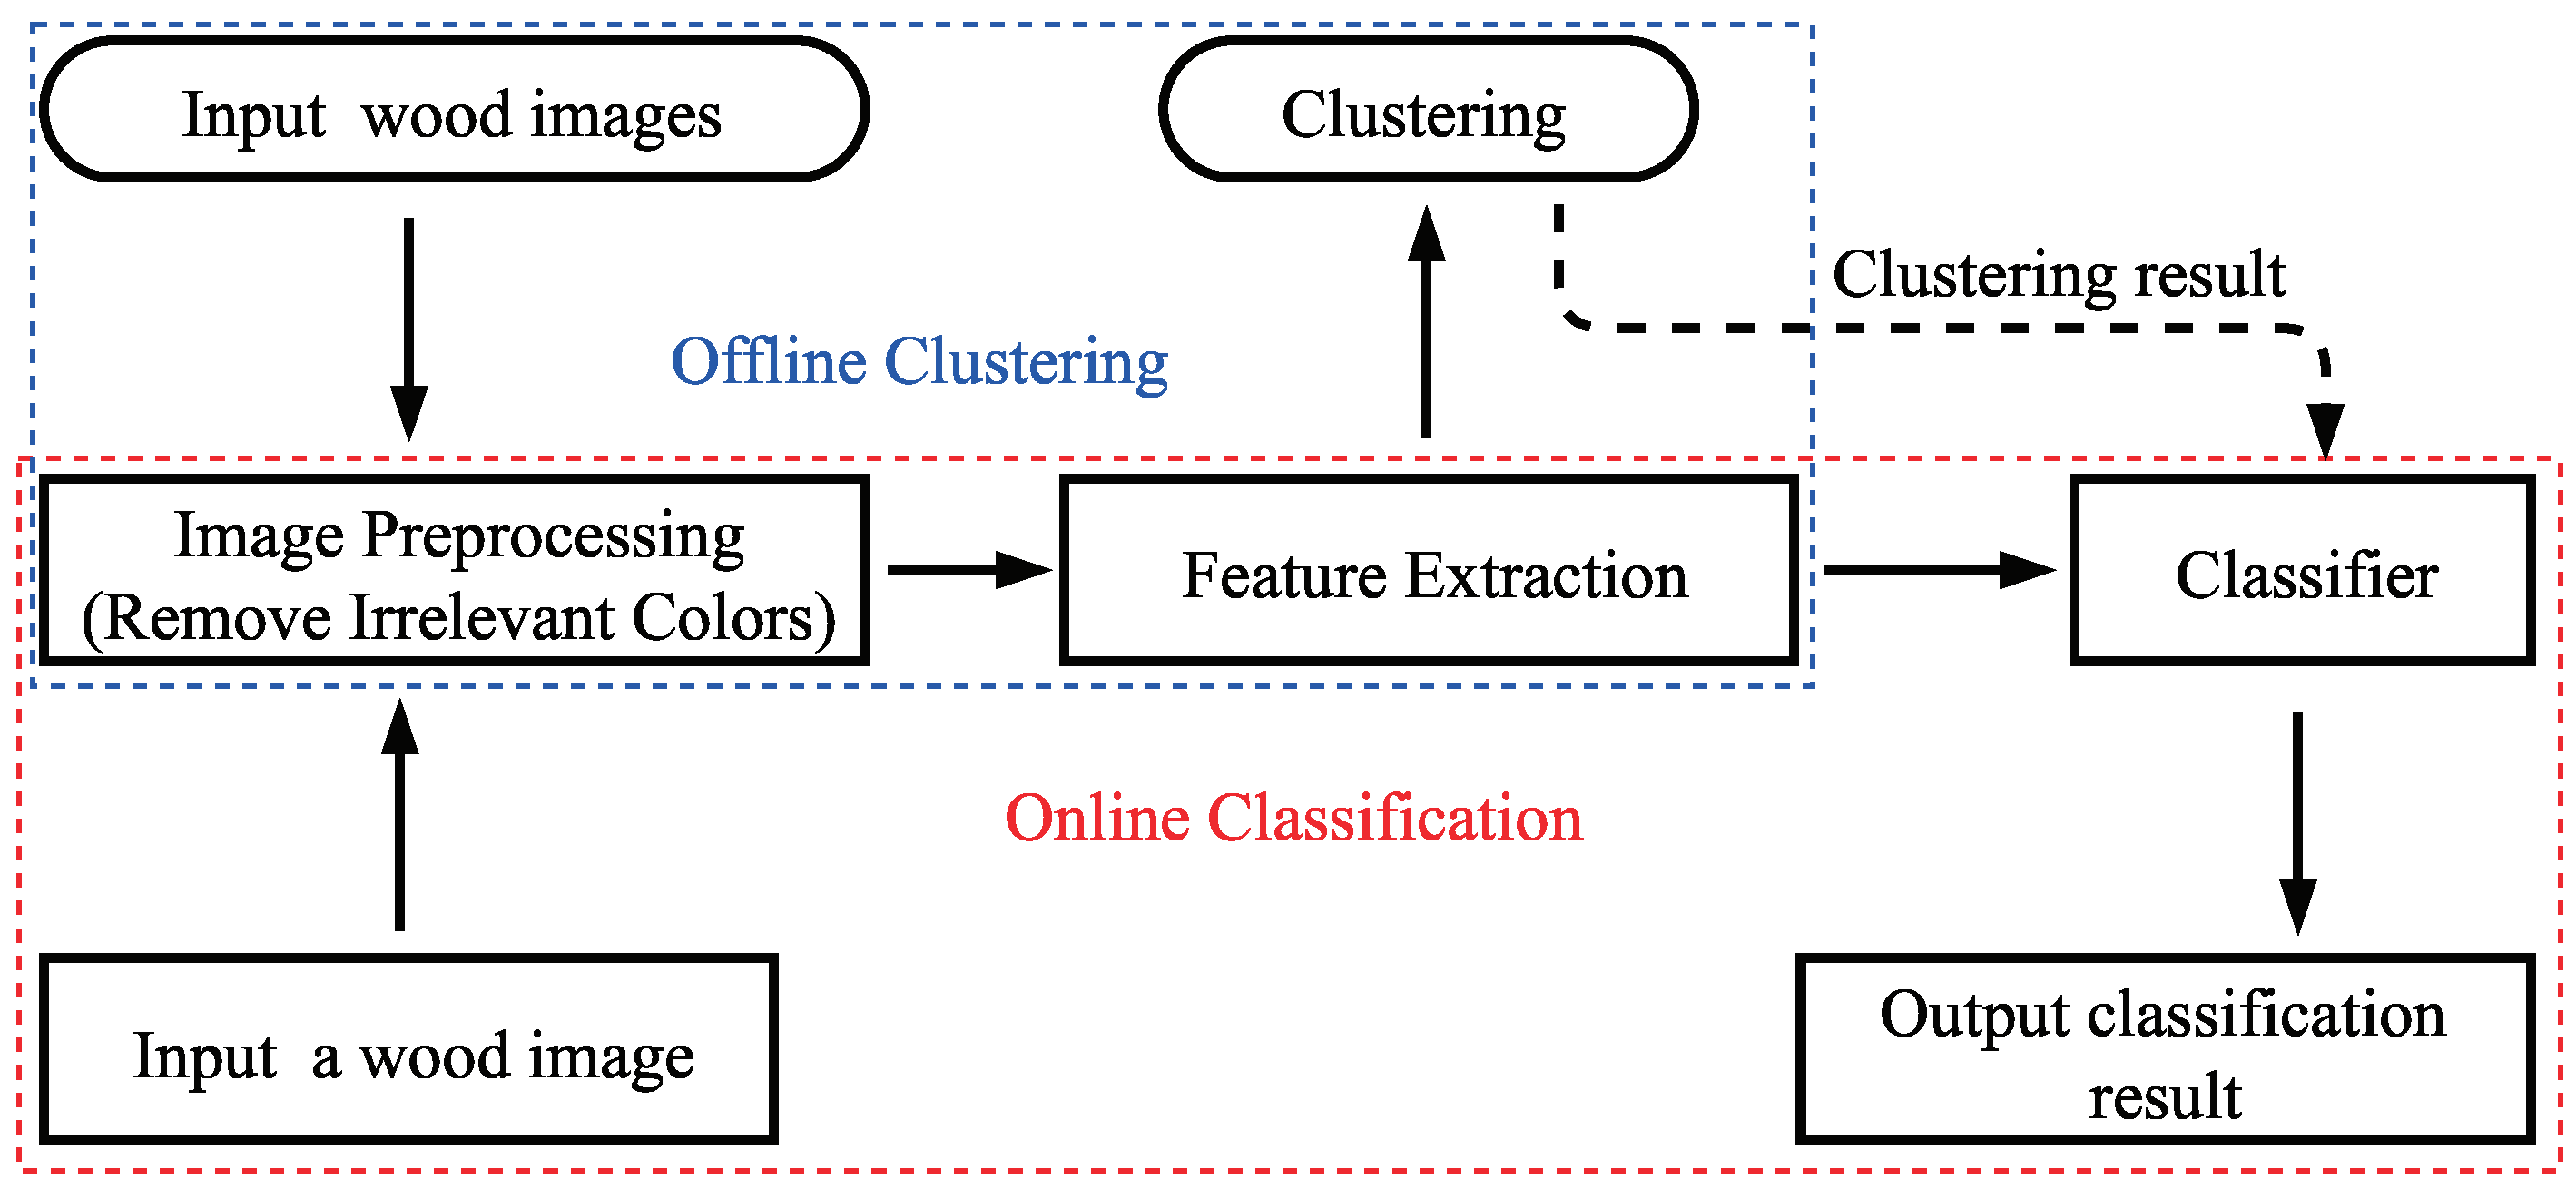
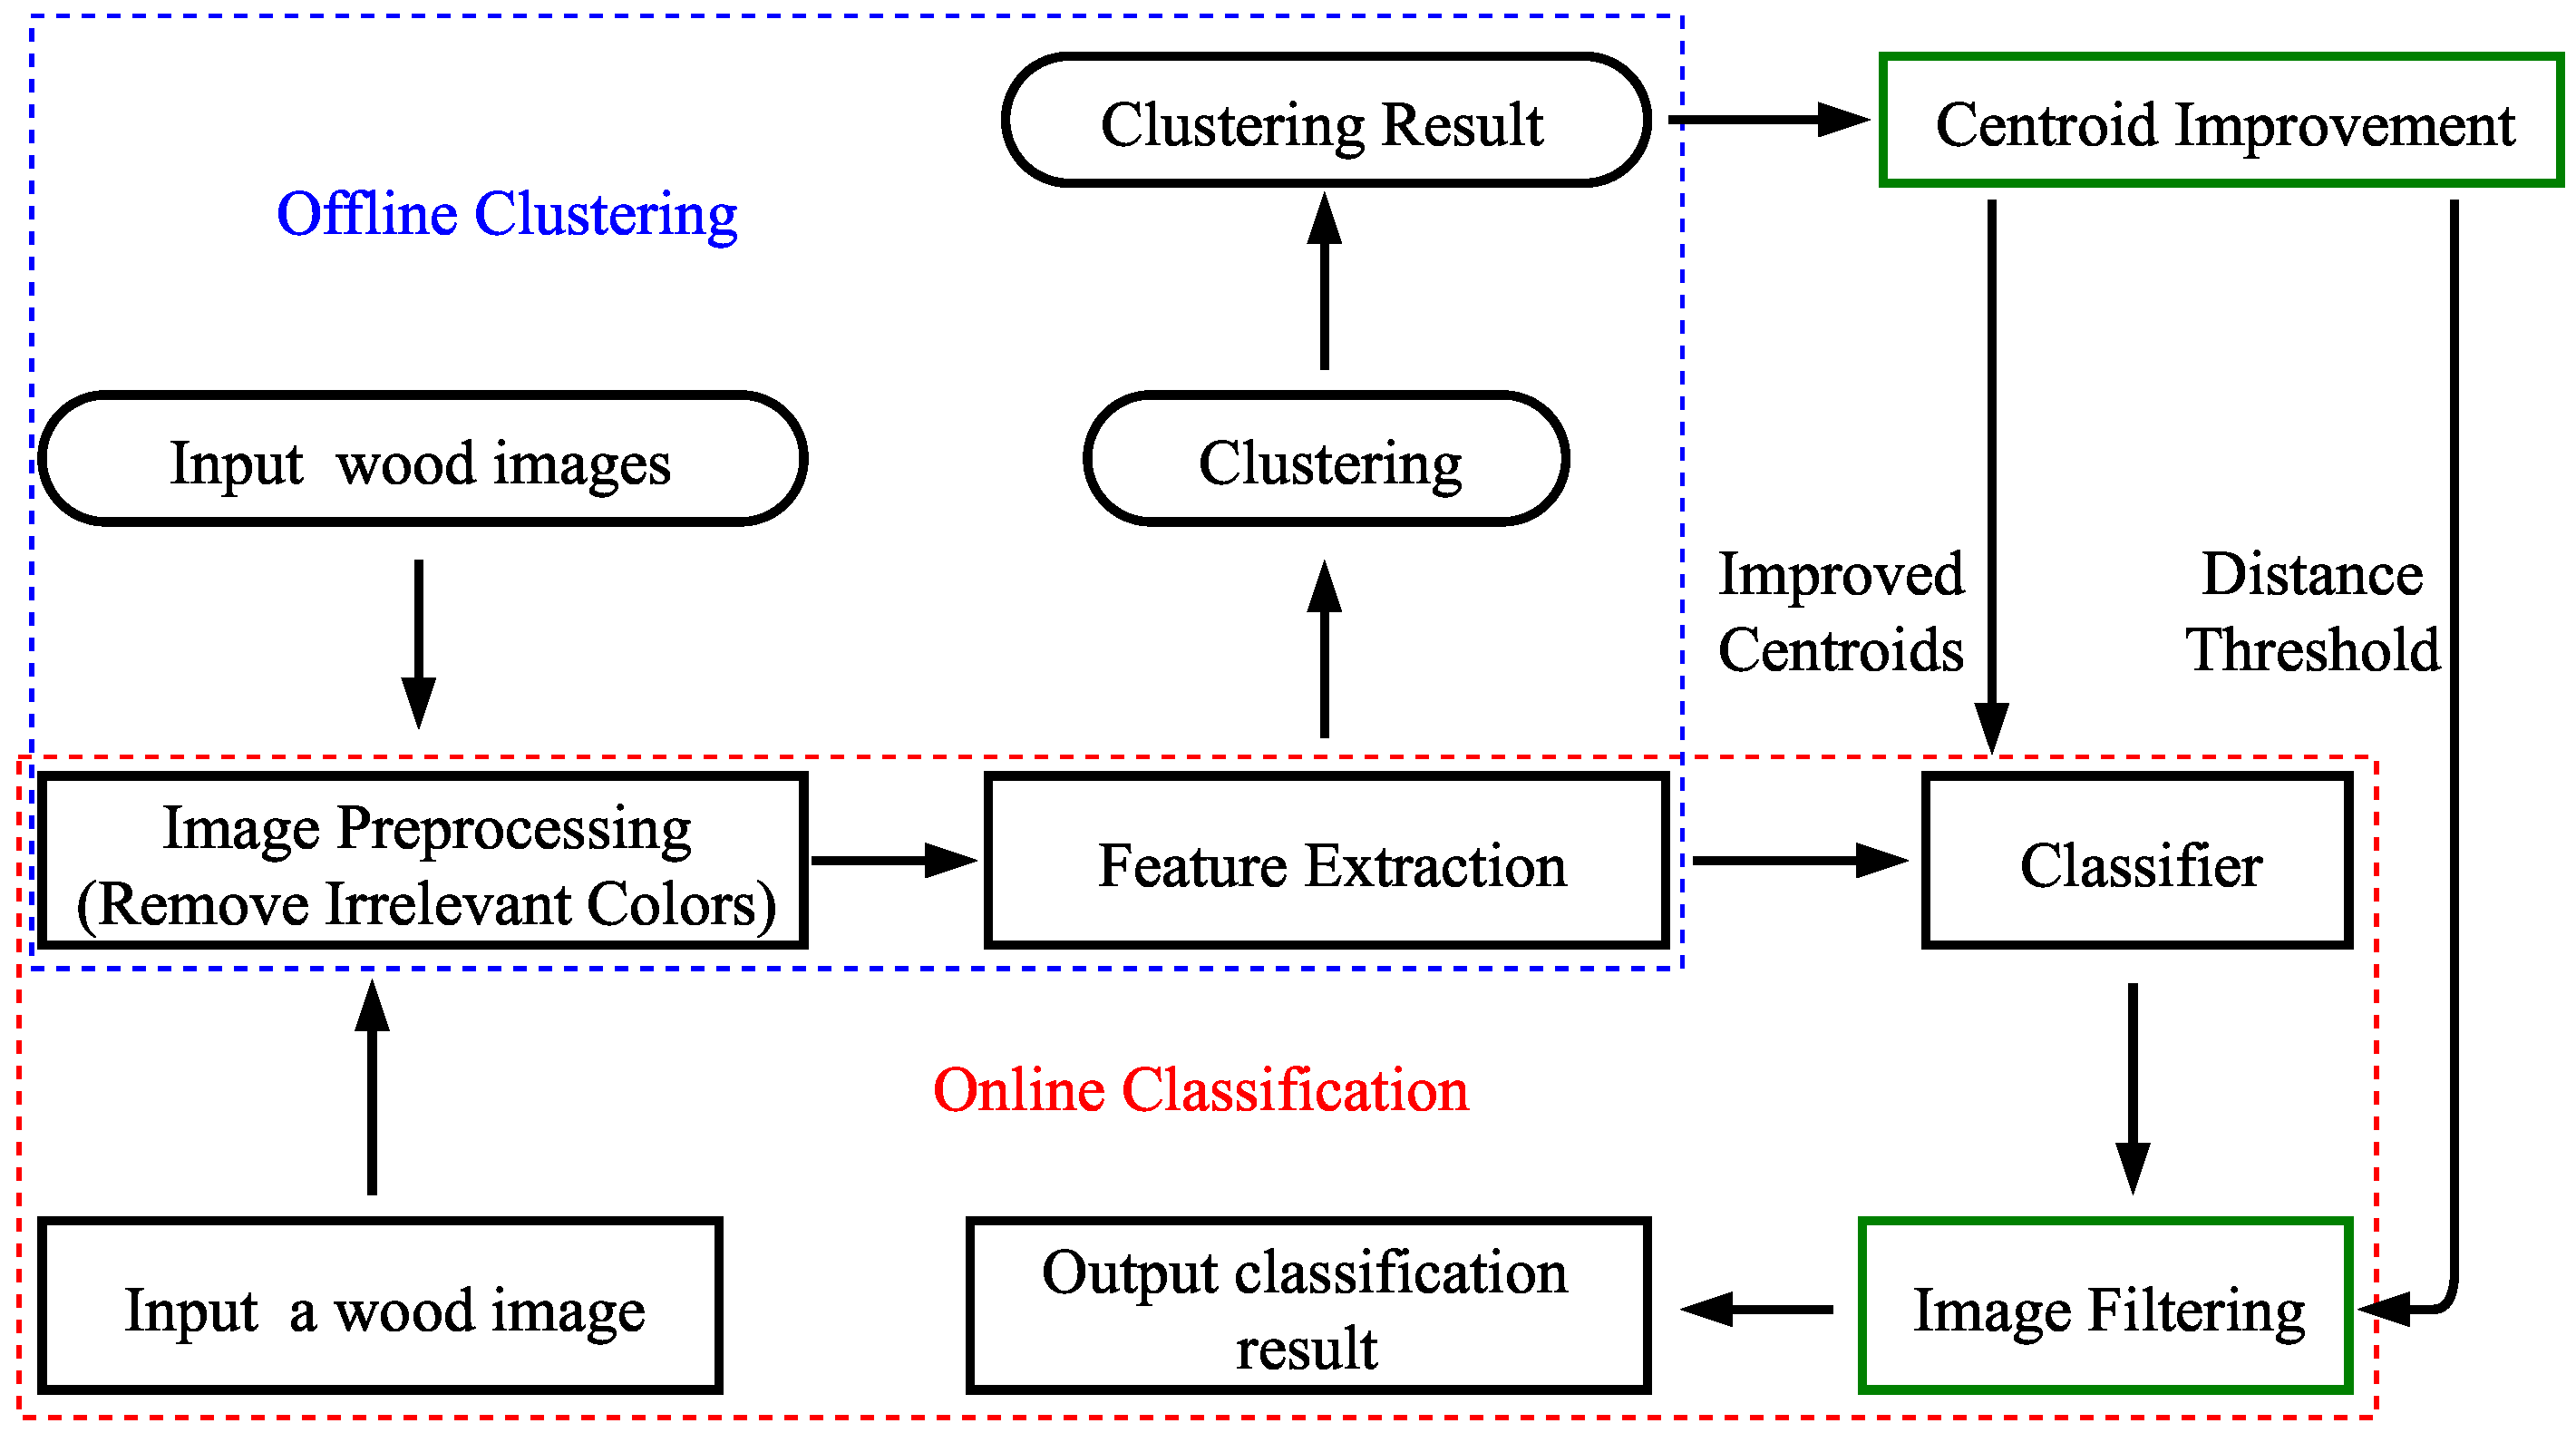
The framework of the proposed mechanism consists of image preprocessing, feature extraction, offline clustering, and online classification, as shown in
Figure 5. The wood images are firstly processed based on the color ranges in the HSV color space to remove irrelevant colors in the image. Then, the feature vector is extracted from the preprocessed wood image in the RGB color space. In the offline clustering, the feature vector sets extracted from the preprocessed wood images are partitioned into different clusters based on the K-means algorithm. The clustering result can be used in the online classification to classify the new wood image. The details are given as follows.
4.1. Image Preprocessing
In the color classification of wooden boards, only the wood color information is useful in the image. Therefore, the HSV color information [
22] is used to process wood images before classification. The wood color ranges in the H, S, and V channels can be used for removing the background and stains simultaneously [
23].
Based on the set of images in the offline phase, we use the image segmentation algorithm to detect the boundaries of the boards and then remove the backgrounds of the wood images. The obtained images are converted from the RGB color space into the HSV color space, and the number of pixels with each value in the H, S, and V channels is calculated, respectively [
24]. We calculate the confidence interval at a
confidence level for the pixel values in the H, S, and V channels, respectively. The intervals can be used to remove the irrelevant colors whose pixel values are not in these intervals. Then, we would obtain wood images whose backgrounds are removed, and irrelevant colors on the surface of wooden boards are transformed into black.
4.2. Feature Extraction
Considering the fact that only color information is useful for color classification of wooden boards, we propose a feature extraction method based on the 3D color histogram [
25]. The RGB color space [
26] is used as the feature extraction space. In order to represent wood color information more accurately, the ranges that describe the color distribution in the three channels need to be specified. The number of pixels with each value in the R, G, and B channels is calculated, respectively, using the preprocessed wood images. Then, the confidence intervals in the RGB channels at a
confidence level are calculated, respectively. Based on the confidence intervals, the wood color subspace can be derived.
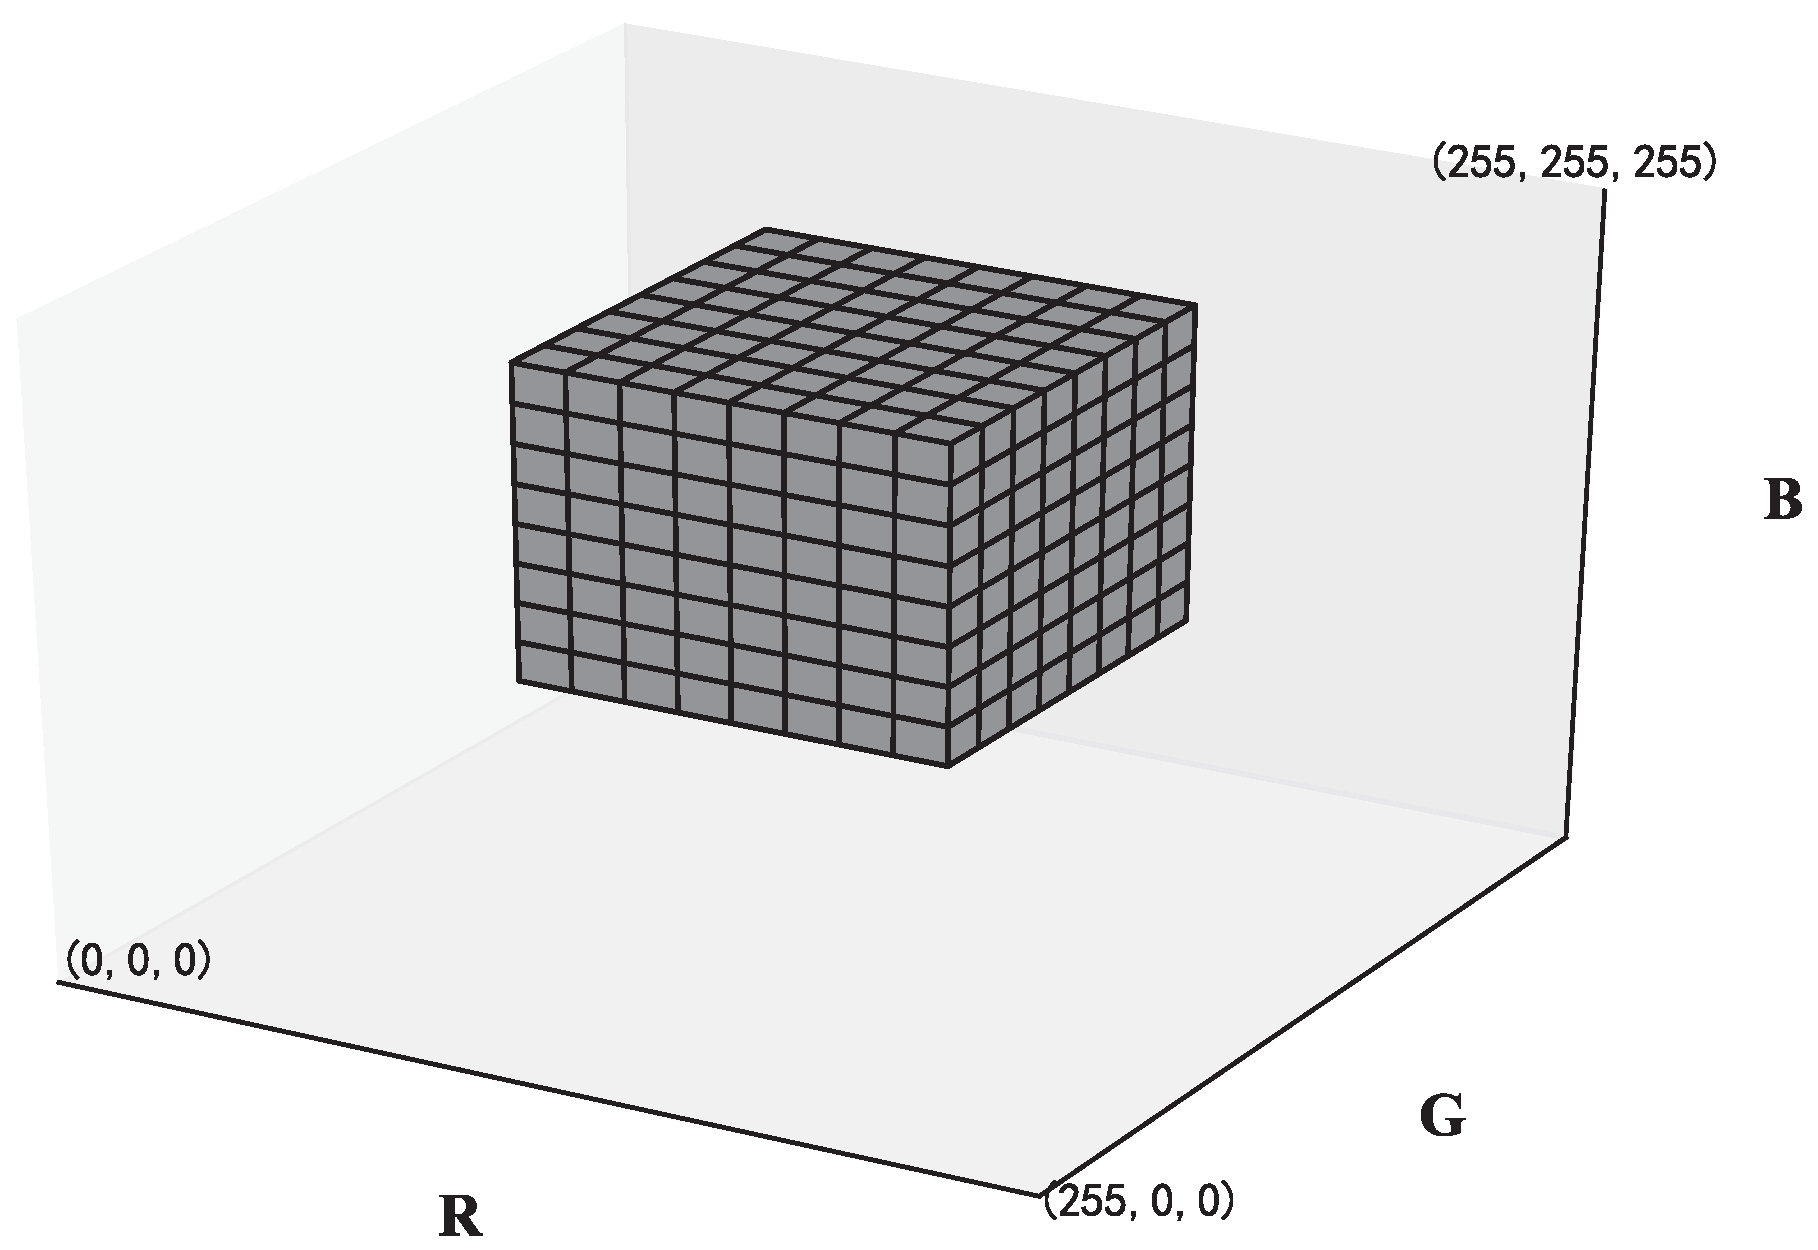
After getting the wood color subspace, we divide the color range into the same number of bins in each dimension. With different numbers of bins in each dimension, the wood color subspace would be partitioned into different numbers of cells. For example, if the number of bins in each dimension is eight, the wood color subspace would consist of
cells, as shown in
Figure 6. For the features extracted from the wood image, the proportions of the number of pixels in each cell to the total number of pixels in the wood color subspace are calculated to represent wood color characteristics. Therefore, the dimension of the extracted feature vector is the third power of the number of bins.
We denote the number of bins as
. When
increases, the number of cells in the wood color subspace increases; thus, the color differences between pixels in each cell would be reduced. On the other hand, more computational resources are required in the offline clustering process. We will evaluate its impact by the experiments in
Section 6.3.
4.3. Offline Clustering
Since it is hard to classify the color of wooden boards manually, the clustering algorithm is used to generate the classifier for the color classification of wooden boards. A large number of wood images should be firstly collected by the testbed. Then, the image preprocessing algorithm is used to remove the background and the stains in the wood image. Obtaining the preprocessed wood images, the feature extraction algorithm is executed to generate feature vector sets of the wood images. Finally, the obtained feature vector sets are partitioned into clusters by using the K-means algorithm.
In the process of clustering by K-means [
27],
k feature vectors would be firstly derived from the feature vector sets as initial centroids, where
k is a user-specified parameter. Each feature vector is assigned to the cluster based on the shortest distance. Then, the centroid of each cluster is updated by taking the mean of the values in each dimension of the feature vectors of each cluster. Some feature vectors may move from one cluster to another cluster. After that, new centroids are calculated, and the feature vectors are assigned to the new clusters. The assignment and update of the centroids repeat, until the convergence criteria are met, i.e., no feature vector changes clusters, or equivalently, until the centroids remain the same. In this paper, the euclidean distance is used to find the distance between feature vectors and centroids.
The number of clusters
k has a great impact on the performance of clustering. More clusters can improve the accuracy of the color classification of wooden boards. However, it also increases the burden of sorting wooden boards after the classification. How to determine the number of clusters will be discussed in
Section 6.2.
4.4. Online Classification
After the offline clustering, the centroids of clusters can be used as a classifier to classify new images in real time. When a new image of a wooden board is obtained by the camera, the background of this image and stains on the surface of the wood would be firstly removed through the image preprocessing algorithm. Then, the feature vector of this preprocessed wood image is generated in the process of feature extraction. Obtaining the feature vector, the distances between the new wood images and centroids are computed. Based on the shortest distance, the class label of the cluster will be assigned to the new image. The color classification is completed.
5. Abnormal Wooden Board Processing
Generally, there are a few abnormal wooden boards whose color is quite different from the others. The images of abnormal wooden boards in the offline clustering would affect the accuracy of centroids. Moreover, the abnormal wooden board should be filtered out in the online classification to ensure the quality of the products.
In this section, we propose an improvement algorithm to process the abnormal wooden boards. It includes centroid improvement and image filtering, as shown in
Figure 7. The details are given as follows.
5.1. Centroid Improvement
The abnormal values of the feature vector generated by abnormal wooden boards would lead to the deviation of the centroid. To eliminate the effects of abnormal wood images in the offline clustering, the centroid improvement algorithm is proposed to improve the centroids.
The feature vectors would be partitioned into different clusters after offline clustering. At each cluster, we calculate the confidence interval at a confidence level for the values in the same dimension of feature vectors, then the values that are not in the interval are considered as the abnormal values and would be removed. The mean of the remaining values is calculated to replace the value in this dimension of the centroid. The same method would be used for all dimensions of the feature vector. Then, the improved centroids can be obtained after all clusters are processed. The improved centroids can be used to classify wood images in the online classification.
5.2. Image Filtering
In the online classification, the abnormal wooden boards have to be filtered out to ensure the quality of products. Thus, the image filtering algorithm is proposed to filter out the abnormal wood boards in the online classification.
We firstly use the improved centroids obtained through the centroid improvement algorithm to calculate the distances between the extracted feature vectors and the improved centroid for each cluster. Then, the confidence interval for distances at a confidence level is calculated, and the distance threshold can be derived by the upper bound of the interval.
In the online classification, when the distance between the image and its centroid is greater than the distance threshold, the new wooden board will be assigned to the abnormal class.
6. Experiments
In the experiments, two sets of images are obtained from the testbed separately. The first set contains 15,000 images, which are used for the offline training. The second set, which contains 1000 images, is used in the online classification to evaluate the performance of the proposed mechanism.
There are four parts of the experiments. At first, wood color distributions in both the HSV and RGB color spaces are studied. Secondly, we test the performance of the classification mechanism using different numbers of clusters and bins. Finally, we study the impact of the abnormal wooden boards processing. The details are given as follows.
6.1. Wood Color Distribution
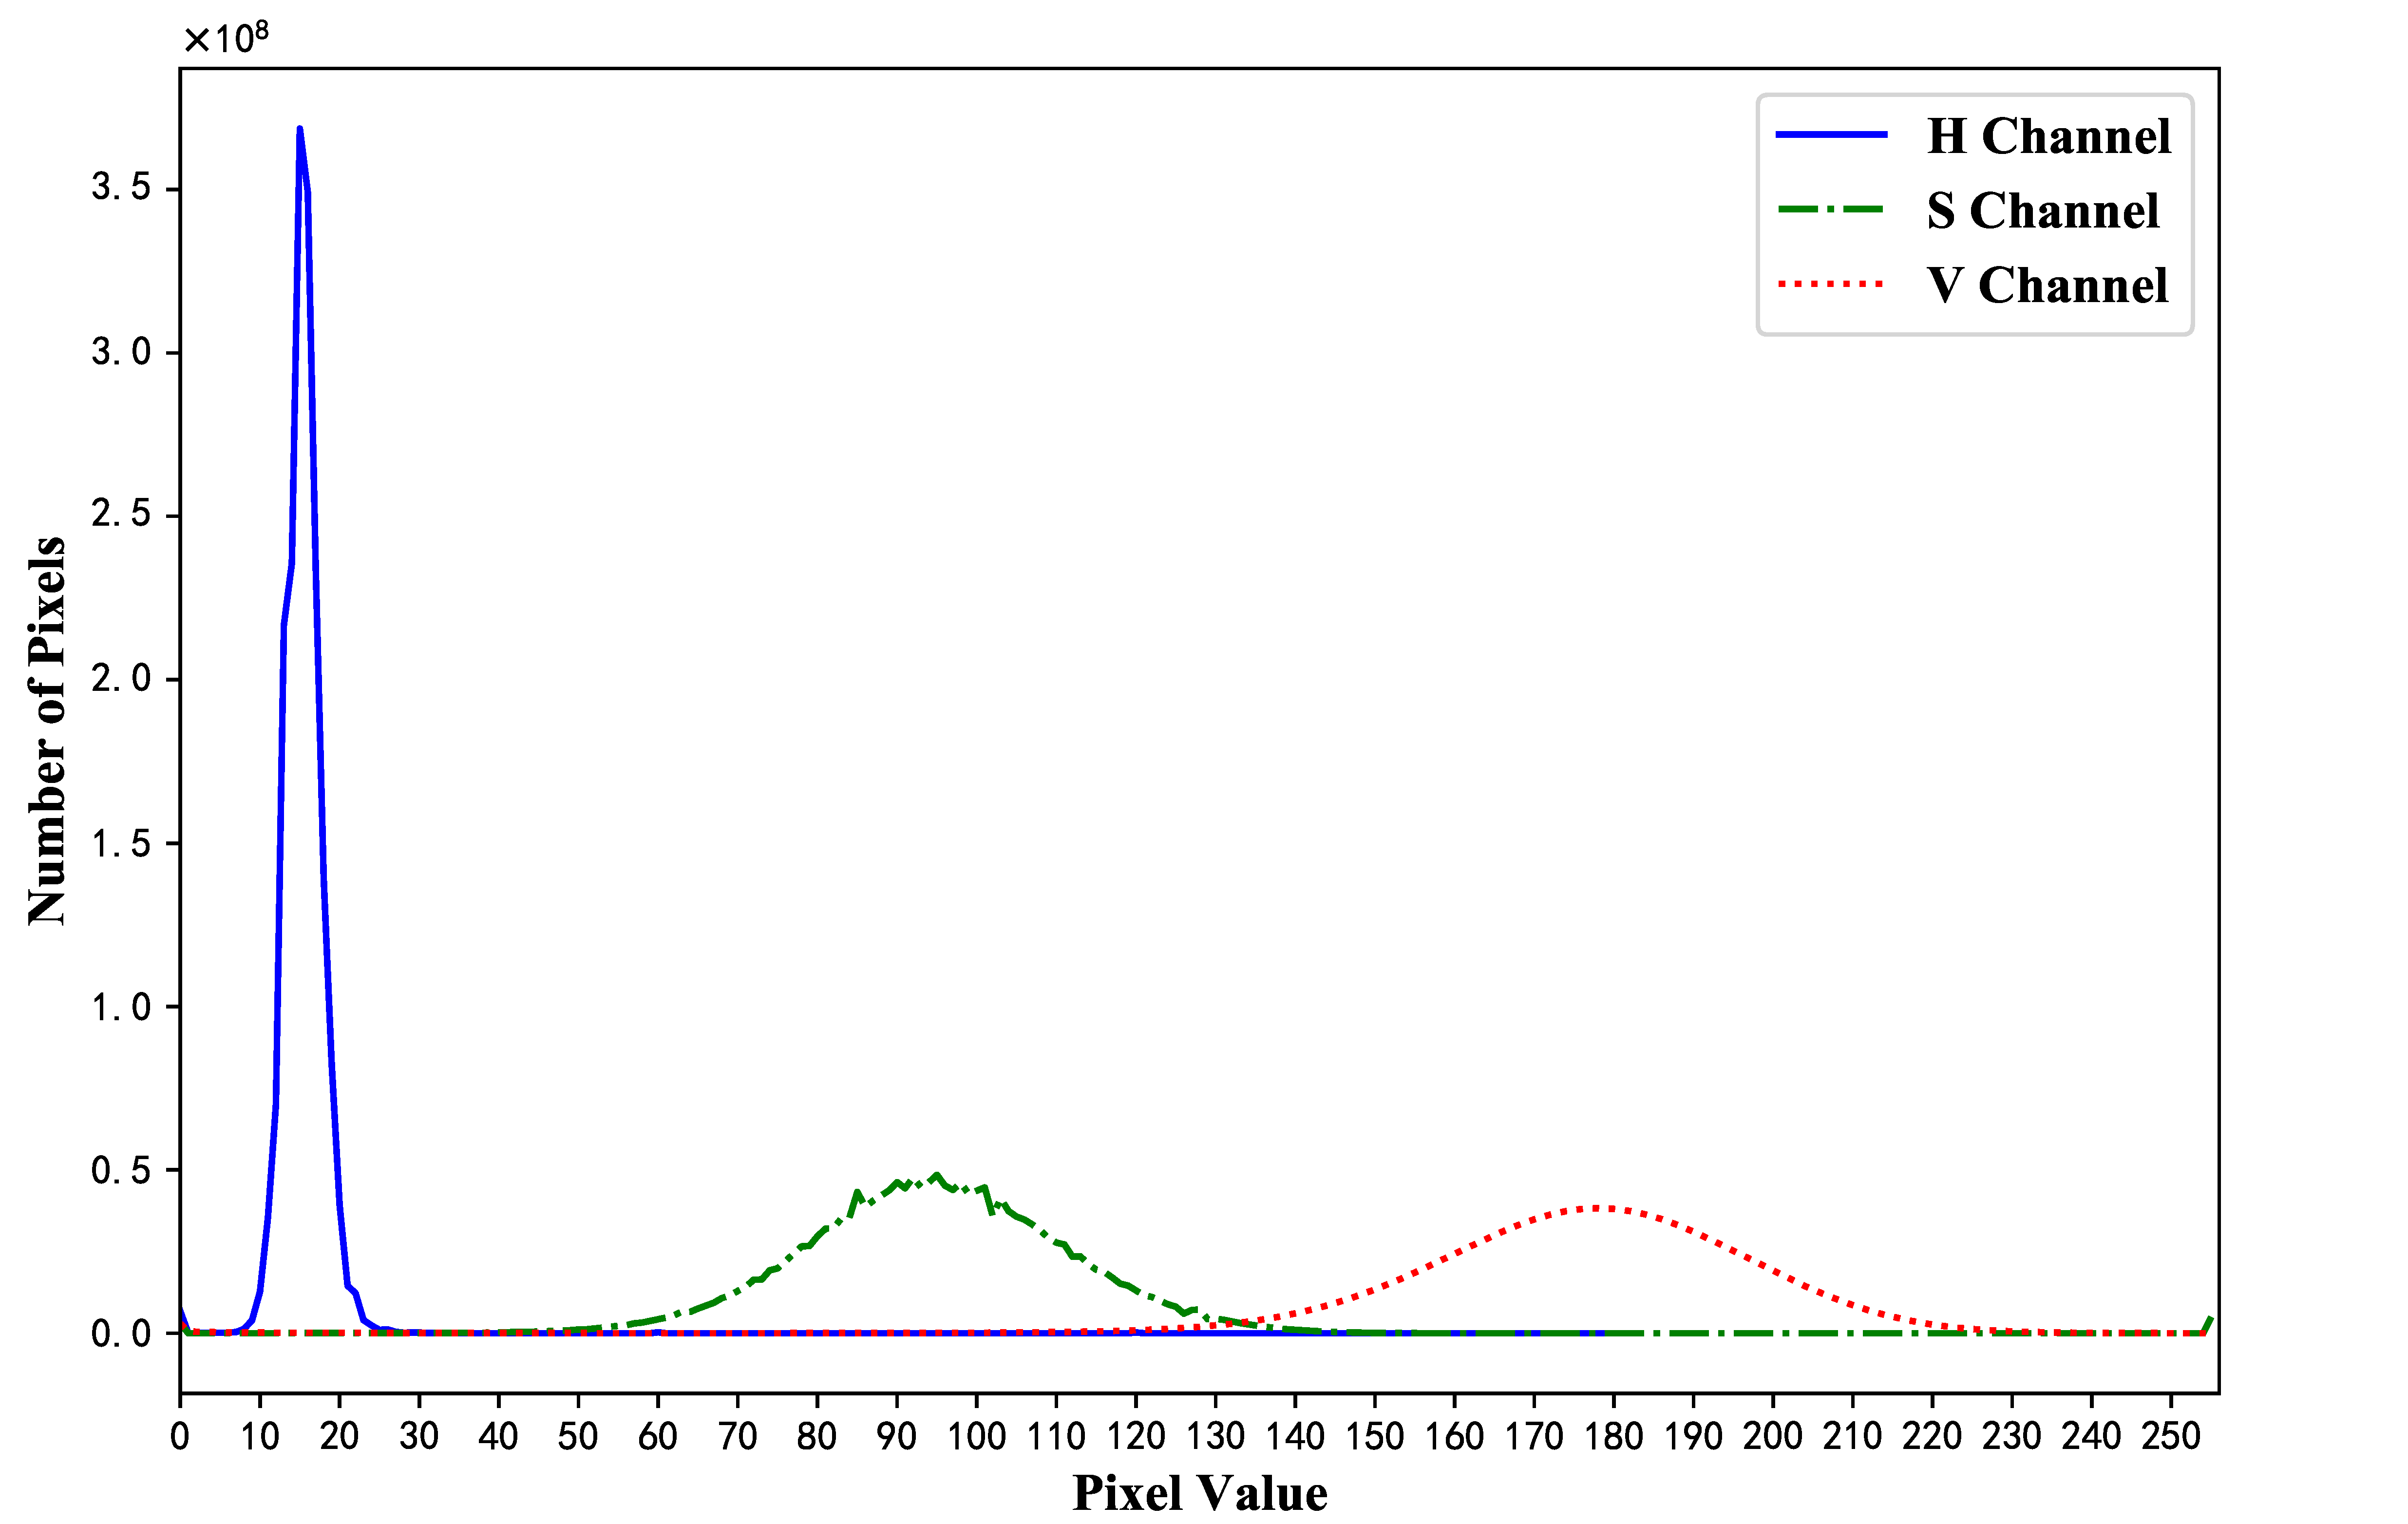
We firstly evaluate the intervals to describe the wood color distribution in the HSV and RGB color space. Based on the 15,000 obtained wood images,
Figure 8 shows the numbers of pixels with each value in the H, S, and V channels, respectively. We calculate the confidence intervals for pixel values at a
confidence level, which are [9, 22] in the H channel, [59, 131] in the S channel, and [134, 219] in the V channel, respectively. According to these intervals, any irrelevant color whose pixel values are not in these intervals can be removed in the process of image preprocessing.
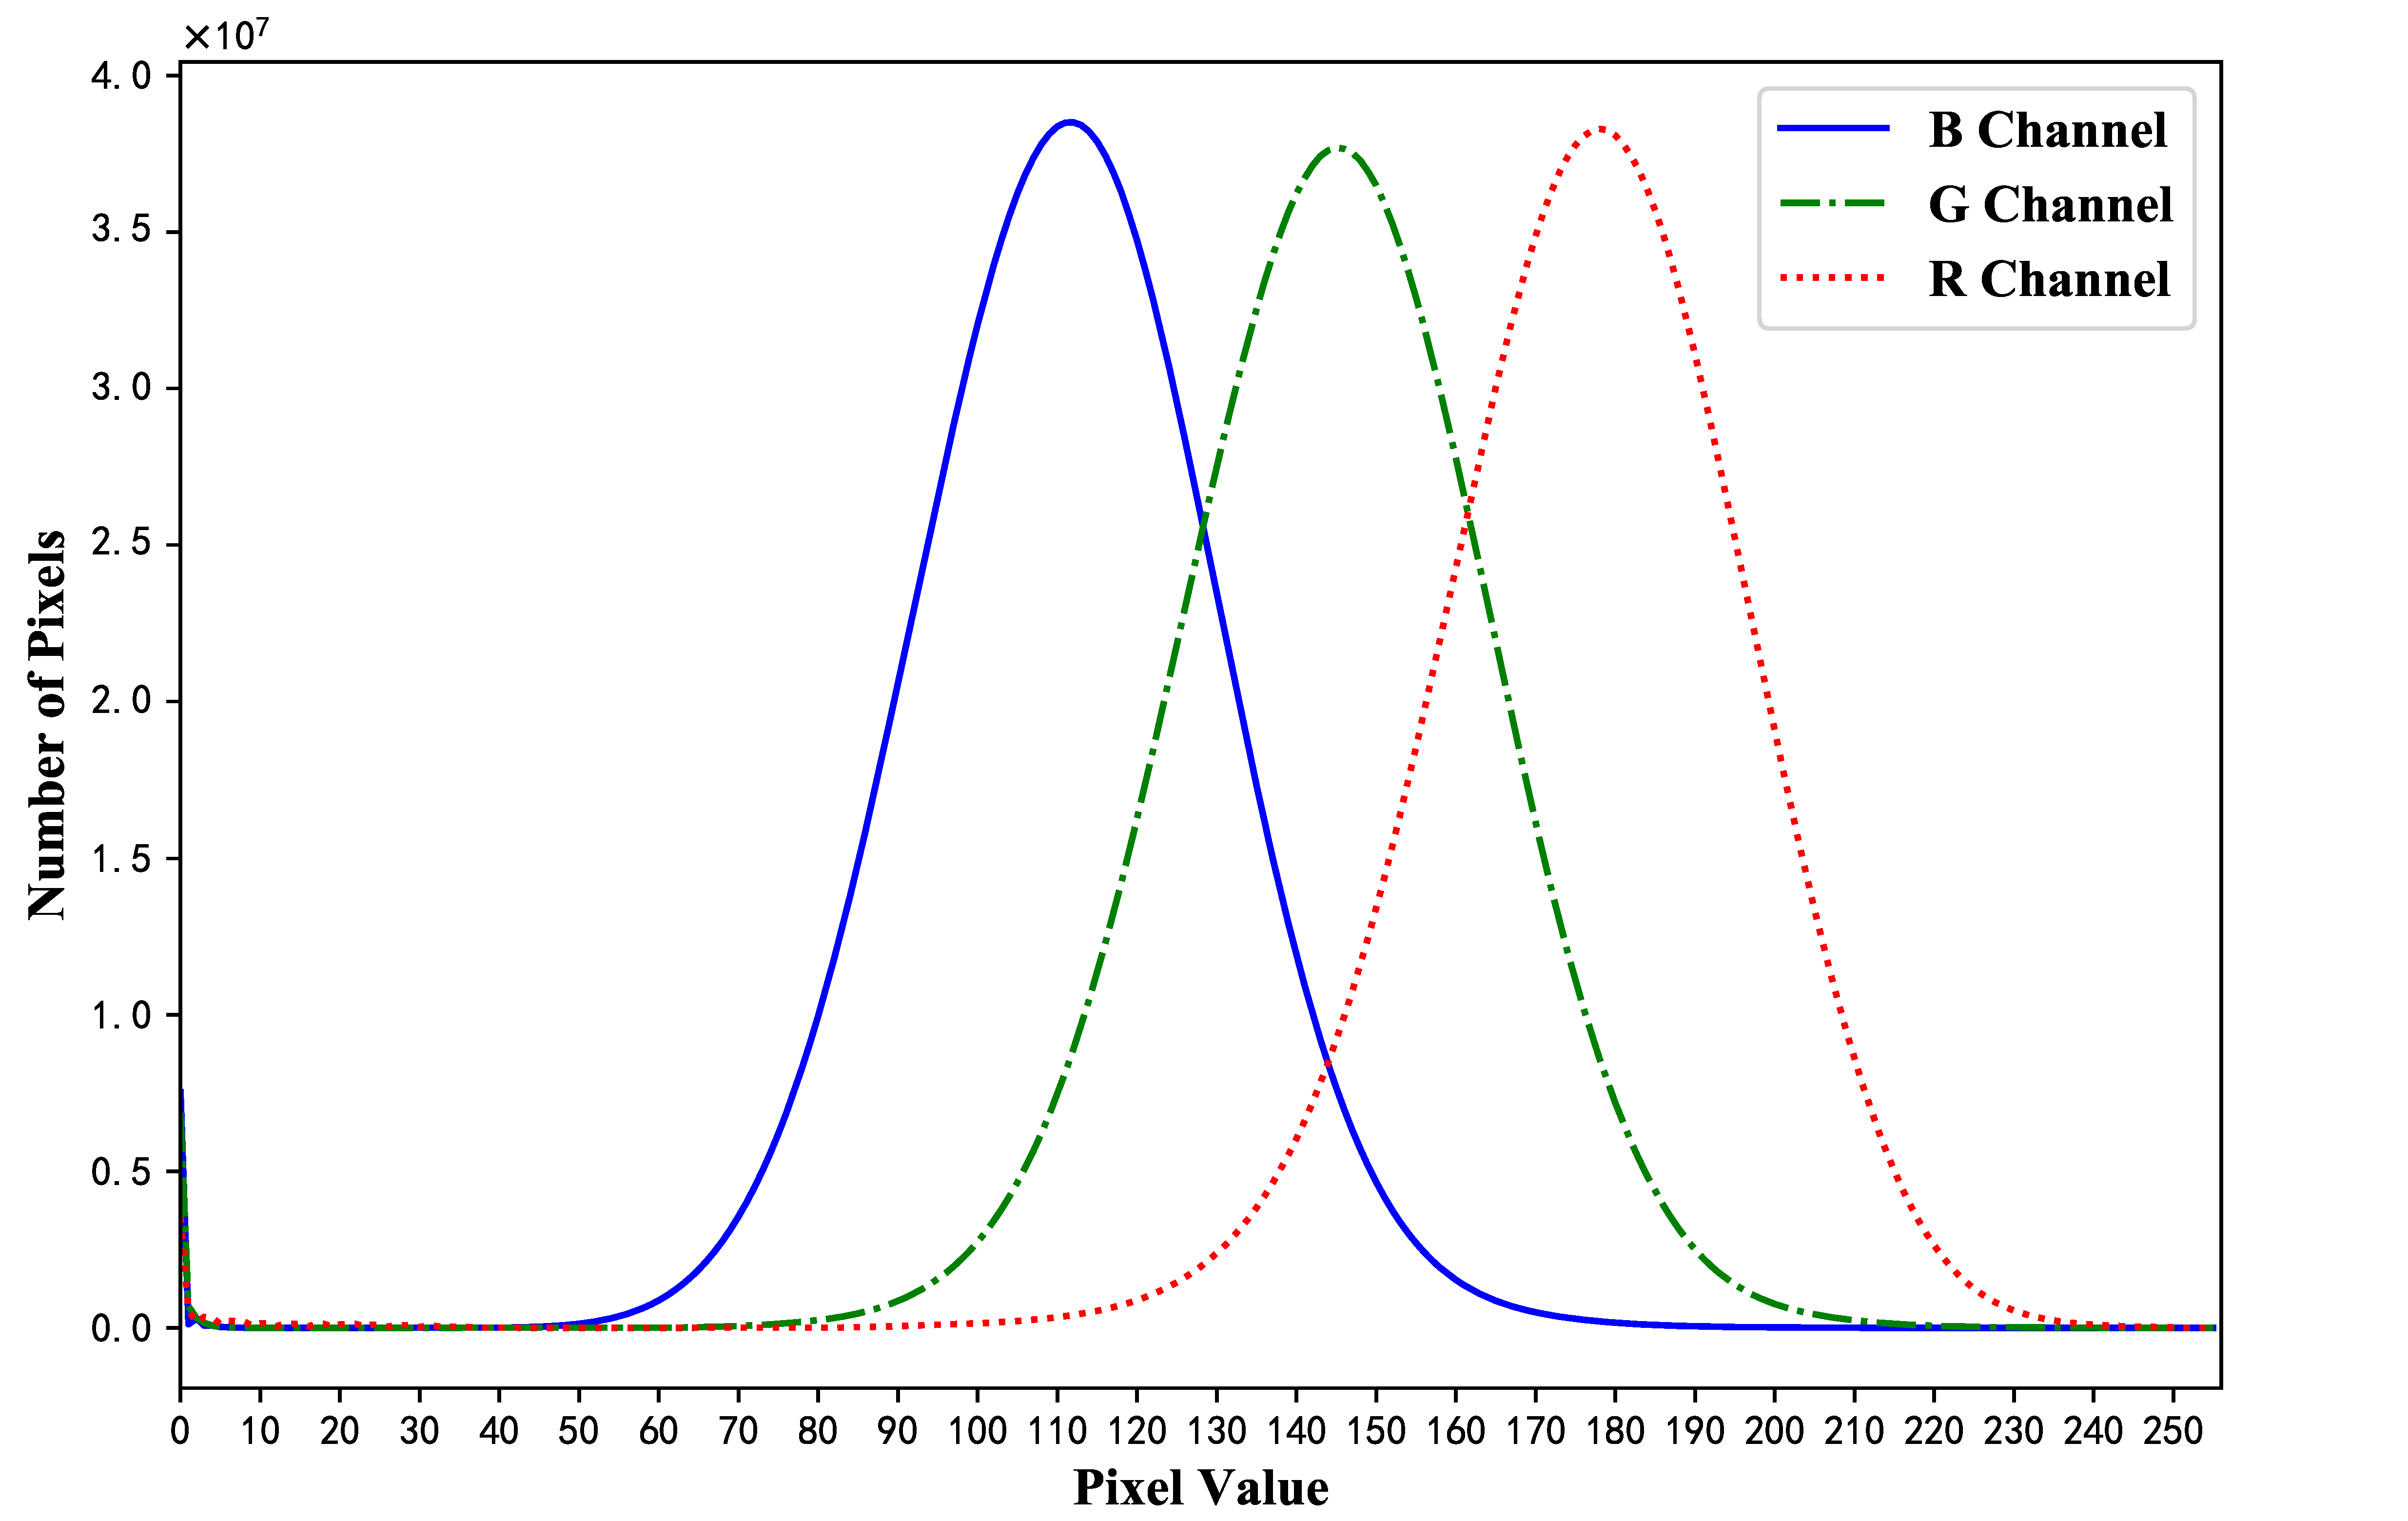
In the RGB color space, the numbers of pixels with each value in the R, G, and B channel are calculated, respectively, as shown in
Figure 9. Similarly, the confidence intervals at a
confidence level for pixel values in the three channels are calculated, which are [134, 218], [105, 185], and [73, 149], respectively. These intervals are used to construct the wood color subspace, in which the features of the wood color are extracted. It is important to note that the wood color subspace is only
of the whole RGB color space. Thus, the extracted features can represent wood colors more accurately.
6.2. Performance with Different Numbers of Clusters
We firstly study the classification performance with different numbers of clusters. The numbers of clusters
k are set as 20, 40, and 60, respectively. The number of bins is fixed at
= 16. Three metrics are used for evaluating the clustering results. The mean squared distance is the average of the squared distances of samples to their closest cluster center. Silhouette scores [
17] range from −1 to 1: a high silhouette score indicates that the object is well matched to its own cluster and distinct from neighboring clusters. The Calinski–Harabasz score of a clustering is in [0, +∞] and should be maximized [
28].
The results are given in
Table 1. When we choose
k to be 20, the mean squared distance is 0.00295, the global mean silhouette score is 0.155, and Calinski–Harabasz score is 1767. When there are 40 clusters, the three values are 0.00225, 0.146, and 1248, respectively. With
k = 60, we obtain 0.00192, 0.143, and 1008. As the number of clusters increases from 20 to 40 and then to 60, the global mean silhouette score and Calinski–Harabasz score decrease, which indicates that the quality of the clustering result becomes poorer. On the other hand, the value of the mean squared distance becomes smaller, which indicates that the similarity between the objects in their own cluster becomes greater. According to the opposite results given above, it is hard to evaluate the performance of the color classification of wooden boards simply based on traditional clustering metrics.
To solve this problem, we propose a new metric to evaluate the accuracy of color classification manually. We design software to display the test image and the representative image simultaneously. The representative image of each cluster is determined by the image in the cluster that is closest to its centroid. Then, the volunteers are asked to filter the images that are clearly different from the representative image. The definition of the proposed classification accuracy is the percentage of images that are not filtered by the volunteers.
In this experiment, one-thousand images are classified by the clustering result with different numbers of clusters, respectively. Five volunteers, which consist of three experts (A, B, and C) and two students (D and E), are asked to judge the classification results.
Table 2 shows the classification accuracy determined by the volunteers. The average classification accuracies of the proposed mechanism with 20, 40, and 60 clusters are
,
, and
, respectively, which indicates that the classification accuracy increases as the number of clusters grows. It is important to note that the classification accuracy with the same number of clusters is obviously different among different volunteers. This verifies the difficulty in classifying wood color manually. On the other hand, it is obvious that the classification accuracy determined by the students is higher than that by the experts. This indicates that the untrained volunteers have difficulty discerning the color differences among some wooden boards.
Furthermore, we compare the images filtered by the three experts. For each pair of experts, the numbers of images filtered by both experts are counted. The results are reported in
Table 3. With
, the number is 41, 34, and 25, respectively. Compared with the result given in
Table 2, the same selected images are fewer than the total number of selected images for each judgment result, which indicates that the experts have different perspectives on comparing the color similarity of wooden boards. This proves that the accuracy of manual classification can hardly be guaranteed; thus, the supervised machine learning algorithms cannot be used in this scenario.
6.3. Performance with Different Numbers of Bins
This section studies the classification accuracy with different numbers of bins . The number of bins is chosen to be 8, 16, and 32, respectively, and the number of cluster is set as .
There are 1000 images classified by the clustering result with different
, respectively. Five volunteers are asked to judge the classification results. The classification accuracies with different values of
are given in
Table 4. The average classification accuracies of the proposed mechanism with
= 8, 16, and 32 are
,
, and
, respectively. The results of the average classification accuracy indicate that the average classification accuracy increases with
increasing from eight to 16, while the average classification accuracy decreases with
increasing from 16 to 32. Considering the results given above and the computational complexity in the offline clustering, the number of bins is recommended to be set as 16 for the color classification of wooden boards.
Moreover, the classification accuracies with determined by experts indicate that the classification mechanism achieves poor performance in this scenario, while it performs better from the perspective of students. It verifies that the manual classification of wooden boards by color is unstable among operators with different experience.
6.4. Effect of Abnormal Wooden Boards’ Processing
In this section, we evaluate the performance of the color classification mechanism with abnormal wooden boards’ processing. The number of bins is set as 16, and the number of cluster is fixed at .
The clustering result with and is firstly used to complete centroids’ improvement and to find a distance threshold used for image filtering. For each cluster, we calculate the confidence intervals at a confidence level for the values in each dimension of the feature vectors. For each dimension, the values that are not in the intervals would be removed. The mean of the remaining values in each dimension is calculated to derive the improved centroid. After getting the new centroids, we calculate the distances between feature vectors and their centroids according to the clustering result. Then, the confidence interval at a confidence level for these distances is calculated, which is . The upper bound is considered as the distance threshold.
Then, we use the improved centroids to classify 1000 images of wooden boards. Compared with the basic mechanism, there are 32 wood images transferred to other clusters. The mean squared distance, the global mean silhouette score, and the Calinski–Harabasz score are calculated for comparison. As reported in
Table 5, the mean squared distance, the global mean silhouette score, and the Calinski–Harabasz score are 0.002557, 0.1265, and 84.43, respectively, in the basic mechanism. With the improved centroids used for classification, they are 0.002556, 0.1273, and 84.67. The mean squared distance decreases, and the global mean silhouette score and the Calinski–Harabasz score become greater. This verifies the effectiveness of the centroid improvement.
Then, we study the effect of the improved centroids and image filtering on the classification accuracy. Using the improved centroids and the distance threshold 0.0062 in the classification, there are 54 wood images filtered out from 1000 images. Five volunteers are asked to process 1000 images, which have been classified by the improved centroids. The classification accuracies with different classification methods are given in
Table 6.
With the basic mechanism for color classification, the average classification accuracy is . For comparison, the average classification accuracy with improved centroids is . When 54 abnormal wood images are filtered by the image filtering algorithm, the classification accuracy reaches up to on average. These results prove the effectiveness of centroid improvement and image filtering.
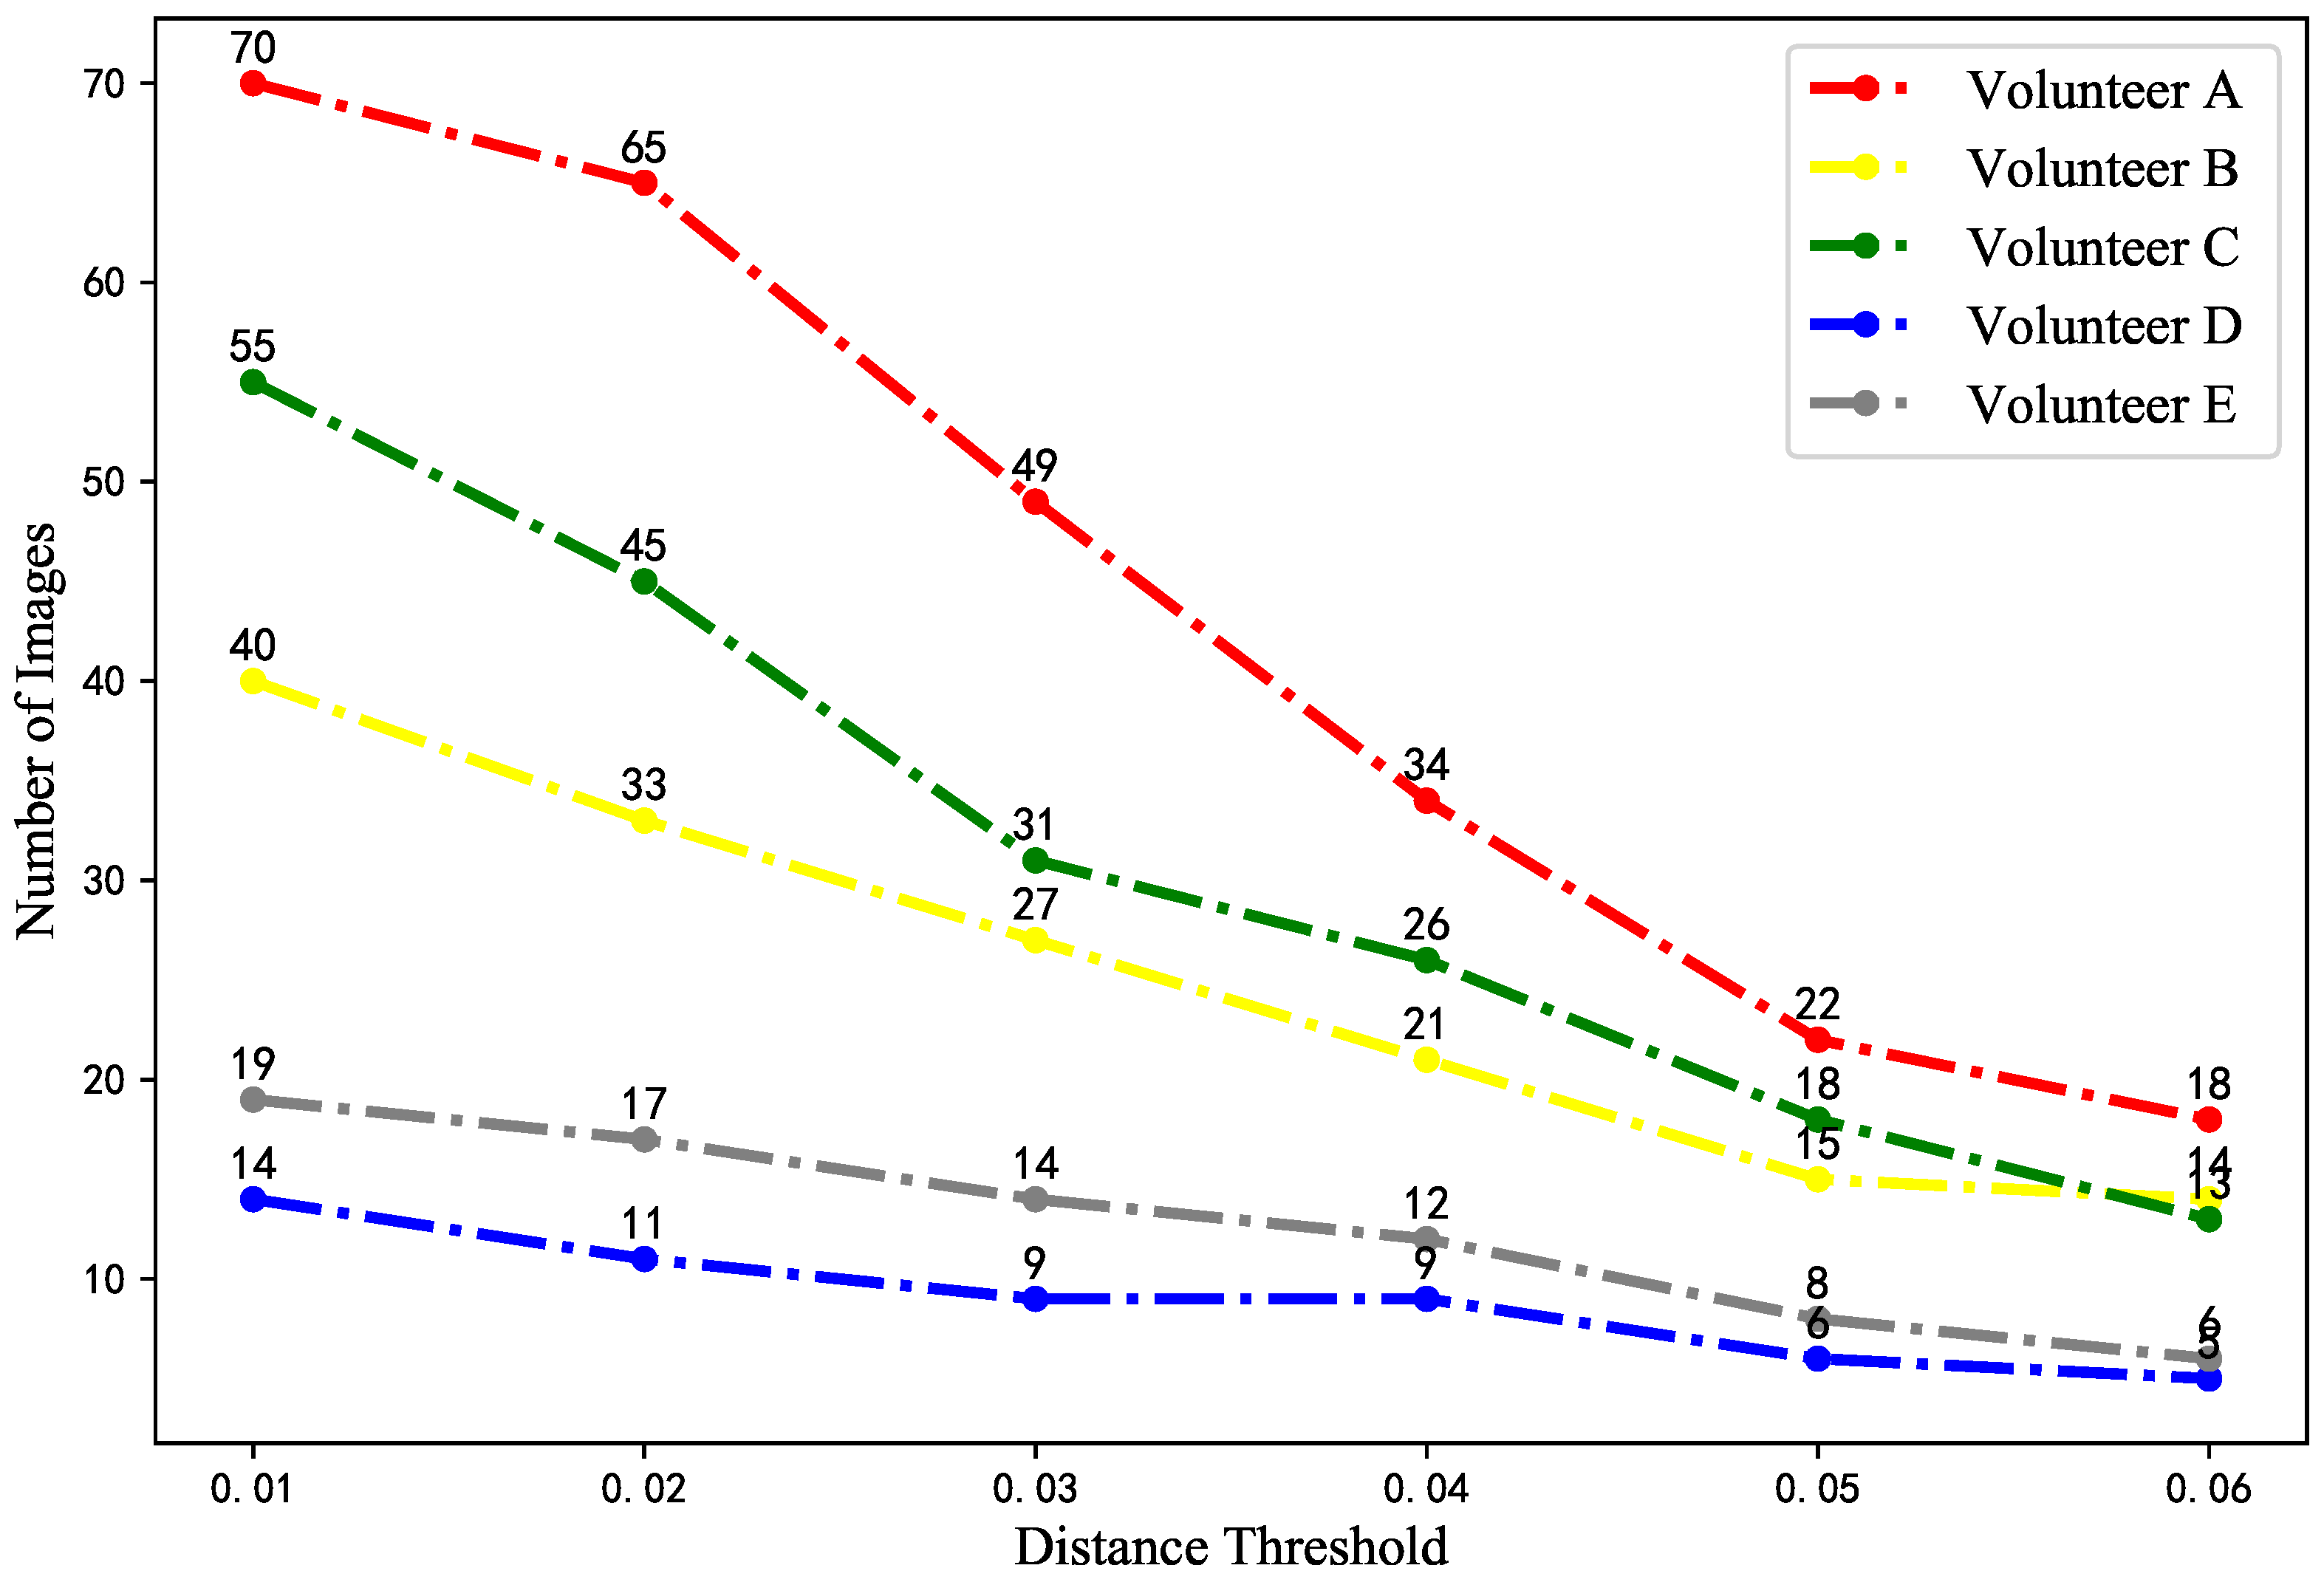
Finally, we study the number of images that are filtered by volunteers and the image filtering algorithm simultaneously. The results are given in
Figure 10. It is clear to see that the number of images increases with the reduction of the distance threshold. This result proves the effectiveness of the image filtering algorithm. Nevertheless, some images with short distances to their centroids are filtered by volunteers. We will study this problem in future works.
7. Conclusions
In this paper, we propose a mechanism for color classification of wooden boards. The mechanism includes image preprocessing, feature extraction, offline clustering, and online classification. The image preprocessing algorithm is used to subtract the background and stains on the surface of the wood. Then, the feature vector is extracted from the preprocessed image. In the offline clustering, the feature vector sets extracted from wood images are partitioned into different clusters by the K-means algorithm. In the online classification process, the clustering result is used as a classifier to classify the new board. Furthermore, to process the abnormal images of wooden boards, we propose an improved algorithm with centroid improvement and image filtering. The experimental results demonstrate the effectiveness of the proposed mechanism. They also prove that the clustering based mechanism is a reasonable solution for classifying the objects that can hardly be classified by human vision due to their color similarity.
In future works, we will study how to improve the classification accuracy by clustering algorithms. New clustering algorithms will be used in the system to check their performance. For example, the G-means algorithm will be considered to process abnormal wooden boards and produce the clustering result simultaneously.
Author Contributions
Conceptualization, Y.L., S.L. and Z.X.; data curation, Y.L., D.C., S.L. and X.L.; formal analysis, Y.L., S.L. and Z.X.; investigation, Y.L., D.C., S.L. and Y.Q.; methodology, Y.L., S.L. and Z.X.; software, Y.L., S.L. and J.Z.; writing, original draft, Y.L. and D.C.; writing, review and editing, Z.X. All authors read and agreed to the published version of the manuscript.
Funding
This research was funded by the National Natural Science Foundation of China Grant Number 61973085 and the Natural Science Foundation of Fujian Province Grant Number 2018J01790.
Conflicts of Interest
The authors declare no conflict of interest.
References
- Rönnqvist, M.; Åstrand, E. Integrated defect detection and optimization for cross cutting of wooden boards. Eur. J. Oper. Res. 1998, 108, 490–508. [Google Scholar] [CrossRef]
- Moslemi, A.A. Quantitative Color Measurement for Black Walnut Wood; Research Paper NC-17; US Department of Agriculture, Forest Service, North Central Forest Experiment Station: Saint Paul, MD, USA, 1967; p. 17. [Google Scholar]
- Gigac, J.; Fišerová, M. Identification of wood species by application of visible spectral reflectance. Wood Res. 2010, 55, 79–86. [Google Scholar]
- Lepistö, L.; Kunttu, I.; Visa, A. Rock image classification using color features in Gabor space. J. Electron. Imaging 2005, 14, 040503. [Google Scholar] [CrossRef]
- Mohseni, S.A.; Wu, H.R.; Thom, J.A.; Bab-Hadiashar, A. Recognizing Induced Emotions With Only One Feature: A Novel Color Histogram-Based System. IEEE Access 2020, 8, 37173–37190. [Google Scholar] [CrossRef]
- Dai, T.H.; Wang, K.Q.; Yang, S.C. Research on wooden board classification based on color and texture features. Xitong Fangzhen Xuebao J. Syst. Simul. 2008, 20, 1372–1376. [Google Scholar]
- Schnabel, T.; Zimmer, B.; Petutschnigg, A.; Schönberger, S. An approach to classify thermally modified hardwoods by Color. For. Prod. J. 2007, 57, 105–110. [Google Scholar]
- Santos e Sousa, W.C.; Barbosa, L.D.J.; Vieira Soares, A.A.; Goulart, S.L.; Protasio, T.D.P. Wood colorimetry for the characterization of Amazonian tree species: A subsidy for a more efficient classification. Cerne 2019, 25, 451–462. [Google Scholar] [CrossRef]
- Fang, S.H.; Yang, Y.H.S. The Impact of Weather Condition on Radio-Based Distance Estimation: A Case Study in GSM Networks With Mobile Measurements. IEEE Trans. Veh. Technol. 2016, 65, 6444–6453. [Google Scholar] [CrossRef]
- Fang, S.H.; Chang, W.H.; Tsao, Y.; Shih, H.C.; Wang, C. Channel State Reconstruction Using Multilevel Discrete Wavelet Transform for Improved Fingerprinting-Based Indoor Localization. IEEE Sens. J. 2016, 16, 7784–7791. [Google Scholar] [CrossRef]
- Yuan, Y.; Sun, X.; Liu, Z.; Li, Y.; Guan, X. Approach of personnel location in roadway environment based on multi-sensor fusion and activity classification. Comput. Netw. 2019, 148, 34–45. [Google Scholar] [CrossRef]
- Sukrisdyanto, O.D.; Purnama, I.K.E.; Nugroho, S.M.S. Wood Strength Classification Based on RGB Color and Image Texture Using KNN Method. In Proceedings of the 2019 International Seminar on Intelligent Technology and Its Applications (ISITIA), Surabaya, Indonesia, 28–29 August 2019; pp. 360–365. [Google Scholar]
- Nasir, V.; Nourian, S.; Avramidis, S.; Cool, J. Classification of thermally treated wood using machine learning techniques. Wood Sci. Technol. 2019, 53, 275–288. [Google Scholar] [CrossRef]
- Miao, R.H.; Tang, J.L.; Chen, X.Q. Classification of farmland images based on color features. J. Vis. Commun. Image Represent. 2015, 29, 138–146. [Google Scholar] [CrossRef]
- Agrawal, S.; Verma, N.K.; Tamrakar, P.; Sircar, P. Content Based Color Image Classification using SVM. In Proceedings of the 2011 Eighth International Conference on Information Technology: New Generations, Las Vegas, NV, USA, 11–13 April 2011; pp. 1090–1094. [Google Scholar]
- Penumuru, D.P.; Muthuswamy, S.; Karumbu, P. Identification and classification of materials using machine vision and machine learning in the context of industry 4.0. J. Intell. Manuf. 2020, 31, 1229–1241. [Google Scholar] [CrossRef]
- Martin, G.; Kaviraj, S.; Hocking, A.; Read, S.C.; Geach, J.E. Galaxy morphological classification in deep-wide surveys via unsupervised machine learning. Mon. Not. R. Astron. Soc. 2020, 491, 1408–1426. [Google Scholar] [CrossRef] [Green Version]
- Zhao, Z.; Guo, S.; Xu, Q.; Ban, T. G-Means: A clustering algorithm for intrusion detection. In Proceedings of the International Conference on Neural Information Processing, Bangkok, Thailand, 1–5 December 2009; Volume 5506, pp. 563–570. [Google Scholar]
- Lei, T.; Jia, X.; Zhang, Y.; Liu, S.; Meng, H.; Nandi, A.K. Superpixel-Based Fast Fuzzy C-Means Clustering for Color Image Segmentation. IEEE Trans. Fuzzy Syst. 2019, 27, 1753–1766. [Google Scholar] [CrossRef] [Green Version]
- Xu, Z.; Wang, R.; Yue, X.; Liu, T.; Chen, C.; Fang, S.H. FaceME: Face-to-Machine Proximity Estimation Based on RSSI Difference for Mobile Industrial Human–Machine Interaction. IEEE Trans. Ind. Inform. 2018, 14, 3547–3558. [Google Scholar] [CrossRef]
- Lin, F.; Dai, W.; Li, W.; Xu, Z.; Yuan, L. A Framework of Priority-aware Packet Transmission Scheduling in Cluster-based Industrial Wireless Sensor Networks. IEEE Trans. Ind. Inform. 2020, 16, 5596–5606. [Google Scholar] [CrossRef]
- Feng, L.; Li, H.; Gao, Y.; Zhang, Y. A Color Image Segmentation Method Based on Region Salient Color and Fuzzy C-Means Algorithm. Circuits Syst. Signal Process. 2020, 39, 586–610. [Google Scholar] [CrossRef]
- Li, H.; Zhao, X.; Su, A.; Zhang, H.; Liu, J.; Gu, G. Color Space Transformation and Multi-Class Weighted Loss for Adhesive White Blood Cell Segmentation. IEEE Access 2020, 8, 24808–24818. [Google Scholar] [CrossRef]
- Hou, G.; Pan, Z.; Huang, B.; Wang, G.; Luan, X. Hue preserving-based approach for underwater colour image enhancement. IET Image Process. 2018, 12, 292–298. [Google Scholar] [CrossRef]
- Han, J.H.; Yang, S.; Lee, B.U. A Novel 3D Color Histogram Equalization Method With Uniform 1-D Gray Scale Histogram. IEEE Trans. Image Process. 2011, 20, 506–512. [Google Scholar] [CrossRef] [PubMed]
- Berman, D.; Treibitz, T.; Avidan, S. Single Image Dehazing Using Haze-Lines. IEEE Trans. Pattern Anal. Mach. Intell. 2020, 42, 720–734. [Google Scholar] [CrossRef] [PubMed]
- Lu, X.; He, Z.; Su, L.; Fan, M.; Liu, F.; Liao, G.; Shi, T. Detection of Micro Solder Balls Using Active Thermography Technology and K-Means Algorithm. IEEE Trans. Ind. Inform. 2018, 14, 5620–5628. [Google Scholar] [CrossRef]
- Guo, B.; Tian, L.; Zhang, J.; Zhang, Y.; Yu, L.; Zhang, J.; Liu, Z. A Clustering Algorithm Based on Joint Kernel Density for Millimeter Wave Radio Channels. In Proceedings of the 2019 13th European Conference on Antennas and Propagation (EuCAP), Małopolskie, Poland, 31 March–5 April 2019; pp. 1–5. [Google Scholar]
Figure 1.
The machine vision testbed.
Figure 1.
The machine vision testbed.
Figure 2.
An image of a wooden board.
Figure 2.
An image of a wooden board.
Figure 3.
Color difference among wooden boards.
Figure 3.
Color difference among wooden boards.
Figure 4.
The irrelevant color information on the surface of wooden boards. (a) Indentation. (b) Lubricating oil. (c) Natural defect.
Figure 4.
The irrelevant color information on the surface of wooden boards. (a) Indentation. (b) Lubricating oil. (c) Natural defect.
Figure 5.
The framework of the color classification of wooden boards.
Figure 5.
The framework of the color classification of wooden boards.
Figure 6.
The wood color subspace in the RGB (red, green, blue) color space with .
Figure 6.
The wood color subspace in the RGB (red, green, blue) color space with .
Figure 7.
The framework of the color classification mechanism with abnormal wooden board processing.
Figure 7.
The framework of the color classification mechanism with abnormal wooden board processing.
Figure 8.
The numbers of pixels with each value in the H, S, and V channels.
Figure 8.
The numbers of pixels with each value in the H, S, and V channels.
Figure 9.
The numbers of pixels with each value in the R, G, and B channels.
Figure 9.
The numbers of pixels with each value in the R, G, and B channels.
Figure 10.
Number of images that are filtered by volunteers and the image filtering algorithm simultaneously.
Figure 10.
Number of images that are filtered by volunteers and the image filtering algorithm simultaneously.
Table 1.
Clustering metrics with different numbers of clusters.
Table 1.
Clustering metrics with different numbers of clusters.
| | k | 20 | 40 | 60 |
|---|
| Metric | |
|---|
| Mean squared distance | 0.00295 | 0.00225 | 0.00192 |
| Global mean silhouette score | 0.155 | 0.146 | 0.143 |
| Calinski–Harabasz score | 1767 | 1248 | 1008 |
Table 2.
Classification accuracies with different numbers of clusters.
Table 2.
Classification accuracies with different numbers of clusters.
| | k | 20 | 40 | 60 |
|---|
| Volunteer | |
|---|
| A | 86.3% | 90.8% | 93.9% |
| B | 92.7% | 94.6% | 96.5% |
| C | 91.2% | 93.5% | 96.1% |
| D | 93.2% | 95.7% | 99.0% |
| E | 95.4% | 96.8% | 98.7% |
| Average | 91.8% | 94.3% | 96.8% |
Table 3.
Number of images filtered by multiple experts with different numbers of clusters.
Table 3.
Number of images filtered by multiple experts with different numbers of clusters.
| | k | 20 | 40 | 60 |
|---|
| Volunteer | |
|---|
| A ∩ B | 41 | 34 | 21 |
| A ∩ C | 34 | 28 | 20 |
| B ∩ C | 25 | 20 | 17 |
Table 4.
Classification accuracies with different numbers of bins.
Table 4.
Classification accuracies with different numbers of bins.
| | | 8 | 16 | 32 |
|---|
| Volunteer | |
|---|
| A | 85.0% | 86.3% | 89.5% |
| B | 84.7% | 92.7% | 81.7% |
| C | 80.7% | 91.2% | 81.4% |
| D | 96.6% | 93.2% | 96.3% |
| E | 95.6% | 95.4% | 94.8% |
| Average | 88.5% | 91.8% | 88.7% |
Table 5.
Comparison of the classification results with different classification mechanisms.
Table 5.
Comparison of the classification results with different classification mechanisms.
| |
Classification Method | Basic Mechanism | Improved Centroids |
|---|
| Metric | |
|---|
| Mean squared distance | 0.002557 | 0.002556 |
| Global mean silhouette score | 0.1265 | 0.1273 |
| Calinski–Harabasz score | 84.43 | 84.67 |
Table 6.
Classification accuracies with different methods.
Table 6.
Classification accuracies with different methods.
| | Method | Basic Mechanism | Improved Centroids | Image Filtering |
|---|
| Volunteer | |
|---|
| A | 90.8% | 93.0% | 94.5% |
| B | 94.6% | 96.0% | 97.3% |
| C | 93.5% | 94.2% | 95.2% |
| D | 95.7% | 98.6% | 99.0% |
| E | 96.8% | 98.1% | 98.6% |
| Average | 94.3% | 96.0% | 96.9% |
© 2020 by the authors. Licensee MDPI, Basel, Switzerland. This article is an open access article distributed under the terms and conditions of the Creative Commons Attribution (CC BY) license (http://creativecommons.org/licenses/by/4.0/).


