A Study on Conversion Fraction and Carbonation of Pozzolan Blended Concrete through 29Si MAS NMR Analysis


1
Department of Civil Engineering, Kyungnam University, Changwon-si 51767, Korea
2
Infra Structure Team, Technical Division, GS E&C, Seoul 03159, Korea
3
Department of Civil Engineering, Kangwon National University, Chuncheon-si 24341, Korea
*
Author to whom correspondence should be addressed.
Appl. Sci. 2020, 10(19), 6855; https://0-doi-org.brum.beds.ac.uk/10.3390/app10196855
Submission received: 25 August 2020
/
Revised: 24 September 2020
/
Accepted: 24 September 2020
/
Published: 29 September 2020
(This article belongs to the Special Issue Multifunctional Cement Composites for Structural Health Monitoring)
Abstract
:The object of this paper is to investigate the carbonation resistance of concretes containing different pozzolanic materials. Three concrete mixtures that included fly ash, silica fume, and nanosilica were prepared, and the mixtures were designed to have similar mechanical properties to exclude the effect of mechanical properties on the carbonation. These pozzolanic materials in concretes have different silicate contents and grain size distributions. Rapid carbonation tests were conducted to investigate the durability of pozzolan blended concretes for carbonation, and the carbonation depth was measured at one, two, four, and eight weeks after 28-day water curing. 29Si NMR (nuclear magnetic resonance) experiments were performed, and the conversion fractions for each pozzolan blended concrete were extracted. The degree of carbonation was also assessed based on the Nuclear magnetic resonance (NMR) results.
1. Introduction
The use of pozzolanic materials in concrete has several benefits. Additional calcium–silicate–hydrates (C-S-H) are generated by the pozzolanic reaction, and the fine pozzolanic particles fill the voids in the cement paste. As a result, the cement matrix becomes denser, and the durability of the concrete is enhanced by decreasing its permeability [1]. Fly ash (FA) and silica fume (SF) are well known pozzolanic materials, and numerous studies have been conducted to study the mechanical and chemical properties of concrete blended with these pozzolanic materials. Recently, nanosilica (NS) has been introduced, and some researchers have tried to use it as an alternative to fly ash and silica fume.
Nanotechnologies have also been applied to concrete technology. Several nanomaterials have been examined for their ability to enhance concrete properties [2,3,4,5,6,7,8,9,10,11]. Fe2O3 nanoparticles and carbon nanotubes have been used as sensors inside the cement paste [2]. TiO2 can be applied for self-cleaning concrete [11]. Nanosilica is a pozzolanic material with a very large surface area, which can enable further growth of the C-S-H [8,9], even with a very small dosage, and which guarantees a much faster reaction than fly ash or silica fume [12]. In this study, nanosilica was blended with concrete to increase its carbonation resistance. In addition, the degree of reaction of the nanosilica was calculated and compared with those of fly ash and silica fume.
This study focused on the carbonation resistance of pozzolan blended concrete. For this, rapid carbonation tests were performed. The relative carbonation resistance for each pozzolan blended concrete can be compared using the rapid carbonation test results. However, these tests are not sufficient to analyze the carbonation phenomenon in-depth, therefore further microstructural analysis of the cement matrix was needed. Several material characterization techniques have been used for cement hydration analysis. For example, NMR, Thermal gravimetric analysis (TGA), Fourier transform infrared spectroscopy (FTIR), Transmission electron microscope (TEM), nano-indentation, and micro-computed tomography have been widely used to analyze the cement hydration kinetics and the microstructure of hardened cement [13,14,15,16,17]. Using NMR spectra, the chemical bonds in the matrix can be observed. In the case of cement paste or concrete, 29Si MAS NMR is usually used and can identify the silicate chains in the cement matrix. By comparing the silicate chains in different cement or concrete mixtures, the differences in the microstructure of the specimens can be explained. In this study, the conversion fraction and degree of carbonation were investigated in-depth using 29Si MAS NMR analysis.
This paper presents the carbonation resistance of three pozzolanic blended concrete mixtures including fly ash, silica fume, and nanosilica. To eliminate the effect of mechanical properties to the carbonation, all tested mixtures were intentionally designed to have similar mechanical properties by adjusting the replacement ratio of pozzolanic materials with cement content. Rapid carbonation tests were conducted, and the carbonation depth was measured. 29Si NMR experiments were conducted to obtain the conversion fractions for each of the pozzolan blended concretes. The degree of carbonation was also observed from the NMR results. From the results, it can be found that the nanosilica blended concrete showed the best carbonation resistance. In addition, the nanosilica blended concrete showed the highest conversion fraction among the specimens, based on the 29Si MAS NMR analysis results.
2. Description of Experimental Program
2.1. Materials and Mixture Design
In this study, the Type I Ordinary Portland cement (OPC) was used to build the specimens. The chemical composition of the Type I OPC is shown in Table 1. C3S and C2S were the main components, and the weight percentages, w/w, of the C3S and C2S were 54.0% and 21.0%, respectively.
In this study, three different pozzolanic materials were selected to investigate carbonation resistance of pozzolan blended concrete materials, as shown in Table 2. The chemical compositions used in this study were analyzed using X-ray fluorescence spectrometry (XRF); the results are also presented in Table 2, which shows that the silica fume and nanosilica were primarily composed of amorphous silica. The weight percentages of SiO2 in the silica fume and nanosilica were 97.38% and 98.82%, respectively. For the fly ash, the weight percentage of SiO2 was 61.18%, which is approximately 36–37% lower than that of the silica fume and nanosilica. The particle size of the pozzolanic material is the important parameter affecting the pozzolanic reaction. Thus, the particle sizes of the fly ash, silica fume, and nanosilica used in this study were analyzed. The mean particle sizes of the fly ash, silica fume, and nanosilica were 4, 0.9, and 0.2 μm, respectively. The nanosilica mean particle size was the smallest among the pozzolanic materials used in this study, being 20 and 4.5 times smaller than fly ash and silica fume, respectively.
It is well known that carbonation rate is highly affected by the porosity of surface, permeability, the types and amount of cement and cementitious materials, and several mechanical properties of concrete. To investigate the effects of pozzolanic materials, the influence of mechanical properties has to be excluded at a given water-to-cementitious ratio by precisely adjusting the replacement ratio of cement by fly ash, silica fume, and nanosilica. Thus, in this study, the pozzolanic materials were used only to increase the carbonation resistance. Thus, the target compressive strength for all specimens was set uniformly as 50 MPa. For this, the concrete mixtures shown in Table 3 were prepared.
The OPC was the reference specimen without any pozzolanic material. FA15 represents the specimen with 15 wt.% of the cement replaced with fly ash. SF35 and NS20 were the specimens with 3.5 wt.% and 2.0 wt.% of the cement replaced by silica fume and nanosilica, respectively. It should be noted that a liquid-state nanosilica with 50% liquid fraction was used in this study. Thus, 1 wt.% of nanosilica was included in the NS20 specimen.
The water to binder ratio, W/B, was set as 0.362 for all specimens. The same amount of water-reducing chemical admixture was used in all specimens. The amount of sand and gravel used for each specimen is also presented in Table 3.
For each mixture design, 60 cylindrical specimens (Ø100 × 200 mm) were prepared for evaluating the mechanical properties: 30, 18, and 12 specimens were used for the test of compressive strength, modulus of elasticity, and splitting tensile strength, respectively. In the case of the compressive strength, measured values from six specimens were averaged. For modulus of elasticity, and splitting tensile strength, at least four measured values were averaged. Three prism specimens (100 × 100 × 400 mm3) for each mixture were casted to assess the carbonation resistance of pozzolan blended concretes.
All specimens were mixed for 2 min in a 0.08 m3 capacity twin-shaft mixer, casted into cylinder or prism molds, and kept in a standard room temperature for 24 h. After demolding, specimens were cured in a water tank at 20 °C until testing ages. The compressive strength, elastic modulus, and splitting tensile strength at the ages of 3, 11, 28, 59, and 112 days were measured.
2.2. Accelerated Carbonation Test
The major object of this study is the effect of pozzolanic materials on carbonation resistance. For this, accelerated carbonation tests were performed. Carbonation is the chemical reaction wherein CO2 gas diffuses into the concrete and reacts with Ca(OH)2 in the cement paste to form calcium carbonate as [18,19]
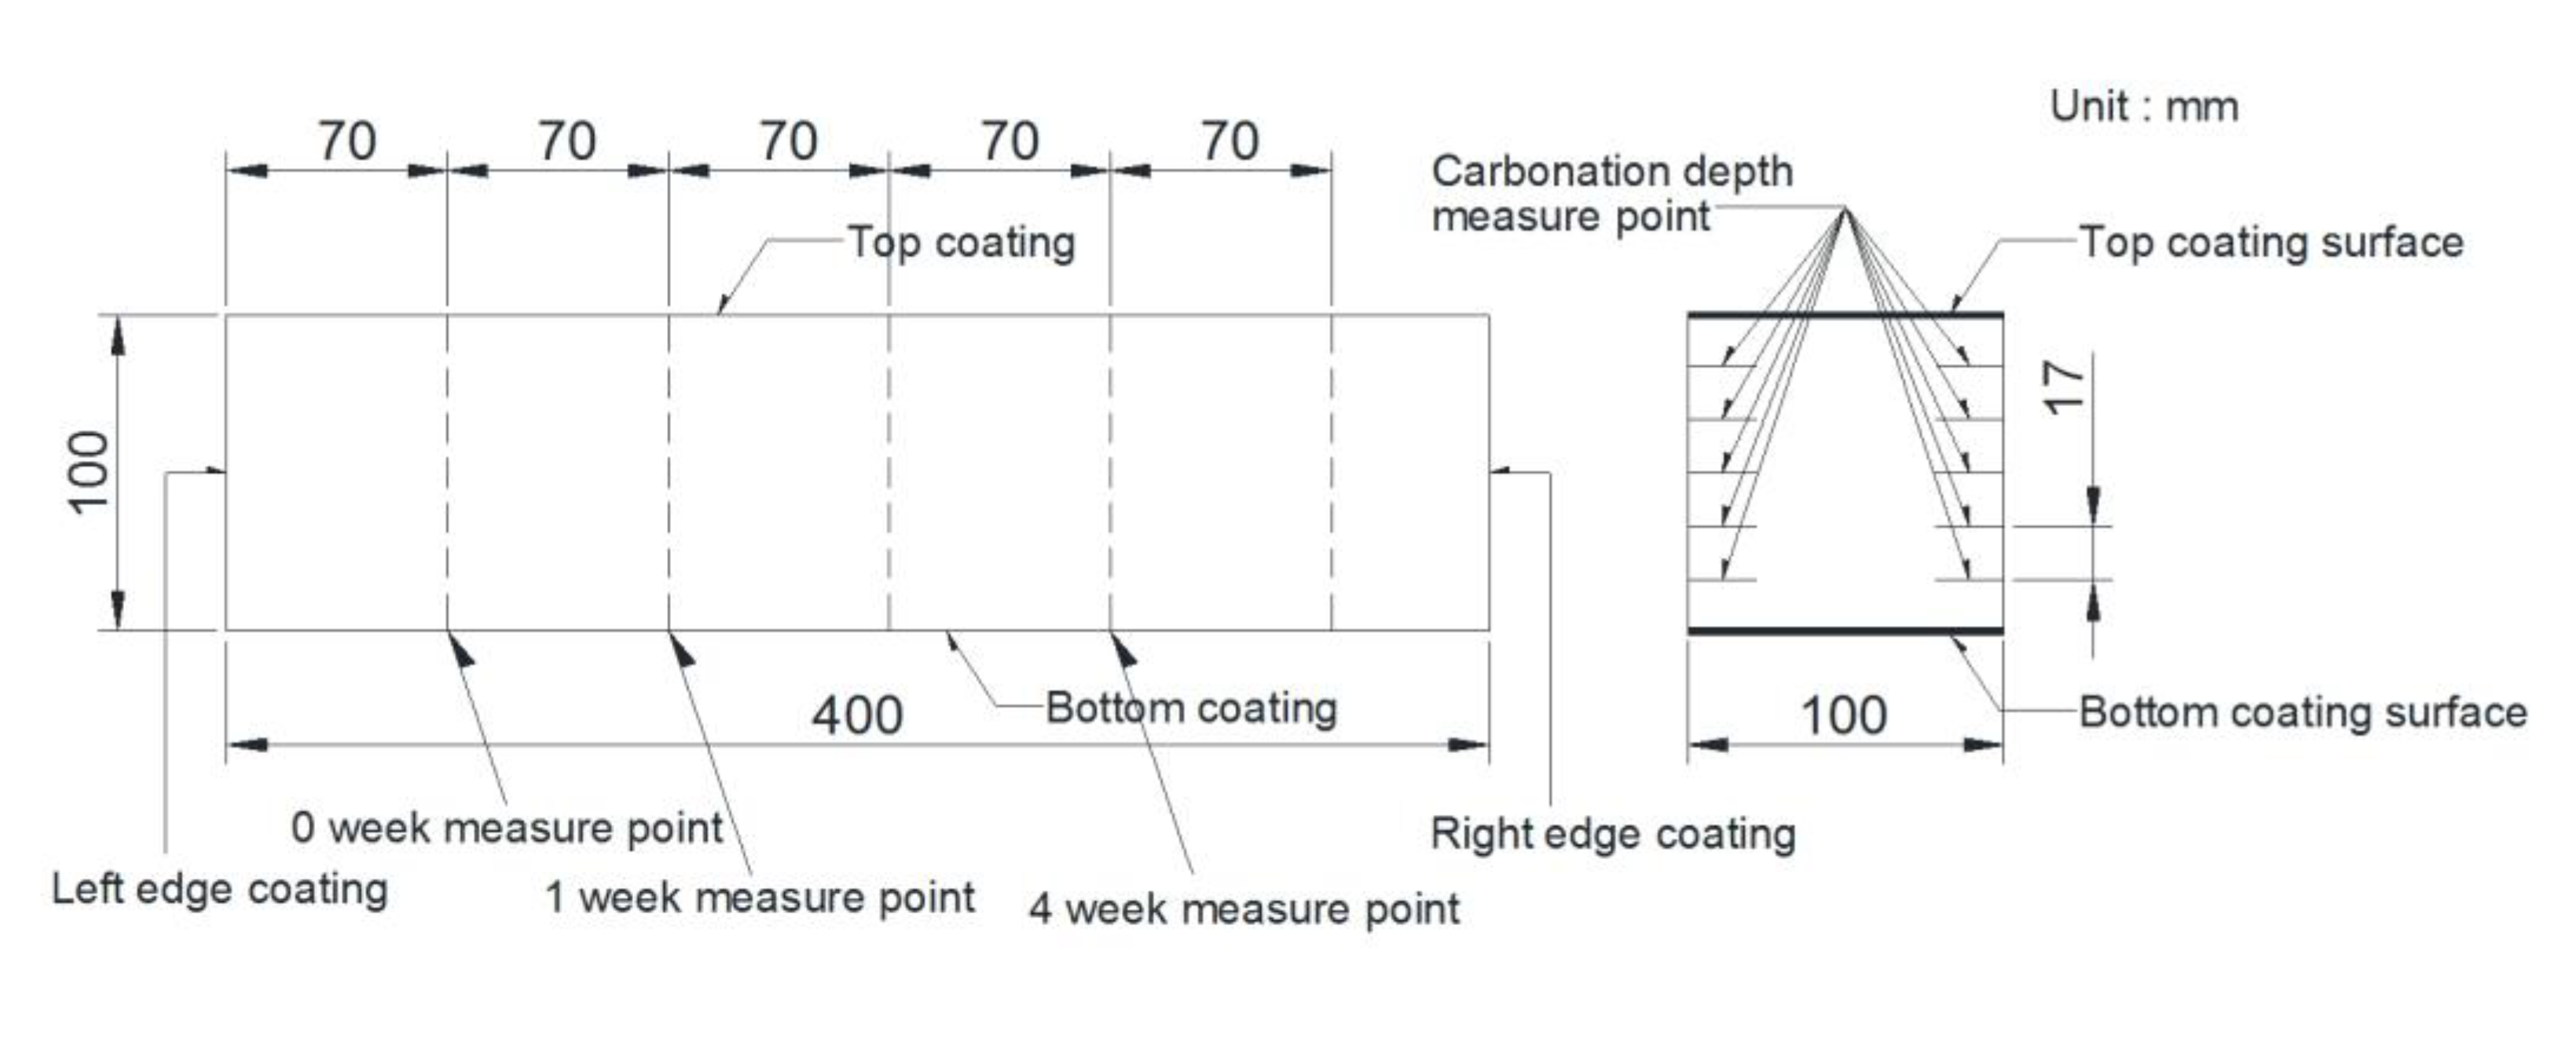
Carbonation of the concrete reduces its pH and removes the protective oxide film on the reinforcement steel, which can result in the corrosion of the reinforcement, and, therefore, must be avoided. The accelerated carbonation test was conducted based on the Korean Standard (KS F 2584) [20], as shown in Figure 1. The test specimen was sealed with epoxy coating except for the measurement section (both sides), and the carbonation depth was measured at one, two, four, and eight weeks after 28-day water curing by spraying with a 1% phenolphthalein solution. The test was performed using gas with a 5% CO2 concentration.
2.3. 29Si MAS NMR
The pozzolan reaction of the concrete specimens in this study was investigated using 29Si MAS (magic angle spinning) NMR (nuclear magnetic resonance). The NMR can be used effectively to analysis the chemical bonds in materials. For the NMR analysis of concrete, solid-state 29Si MAS NMR is used to avoid large peak broadenings caused by several nuclear interactions [21].
As mentioned above, 29Si NMR can be applied to investigate the silicate polymerization [22,23]. A silicate tetrahedron having 1–4 shared oxygen atoms can be expressed as Q1, Q2, Q3, and Q4, respectively. The numbers 1–4 represent the number of shared oxygen atoms. In NMR spectra, the peaks of silicate tetrahedron having Q1, Q2, Q3, and Q4 are plotted at different chemical shift ranges. By integrating the NMR spectra at the respective chemical shift range, the fractions of silicate tetrahedron having Q1, Q2, Q3, and Q4 can be determined. The integration chemical shift ranges for Q1, Q2, Q3, and Q4 are considered in this study as >−75, −82 to −75, −95 to −82, −105 to −95, and <−105 ppm, respectively. Generally, for cement paste where sand and gravel are not included in the sample, Q0 is observed in hydrated cement due to the remaining C3S and C2S. Q1, Q2, and Q3 are detected due to layered structure of C-S-H. Q4 represents the polymerization of quartz, and it is observed in silica rich products such as fly ash, silica fume, and nano-silica. Thus, by comparing the Q4 before and after the pozzolan reaction, the degree of reaction can be estimated [12].
In the case of concrete NMR analysis, the effect of sand must be carefully evaluated. Natural sand includes 80% of SiO2. For the spinning rate of NMR specimen by 1–35 kHz for several hours, solid-state NMR sample should be very fine. Thus, not all sand but some fine grain sand in concrete could be included in the sample. It might appear as Q3 and Q4 phase for OPC concrete. As a result, these Q3 and Q4 phases due to some fine grain sand must be removed to analyze the pozzolan blended concrete.
In this study, the 29Si chemical shifts were referenced with respect to tetramethylsilane Si(CH3)4 (TMS) at 0 ppm, using Si[(CH3)3]8Si8O20 (Q8M8) as a secondary reference, with the major peak being at 11.6 ppm relative to the TMS. NMR spectra were acquired from finely ground powders at a magnetic field of 9.4 T (Varian/Chemagnetics infinity spectrometer) corresponding to the Larmor frequencies 79.51 MHz for 29Si. 29Si experiments used 6 mm zirconia rotors spinning above 7.0 kHz, which was sufficient to concentrate essentially all signal components into their respective center bands.
3. Mechanical Properties and Carbonation Depth
3.1. Mechanical Properties
The mechanical properties of each specimen were evaluated at 3, 7, 28, and 59 days after casting. In addition, the mechanical properties at the age of the accelerated carbonation test (112 days after curing) were also measured. The compressive strength, elastic modulus, and splitting tensile strength were measured based on KS F 2405 [24], KS F 2438 [25], and KS F 2423 [26], respectively.
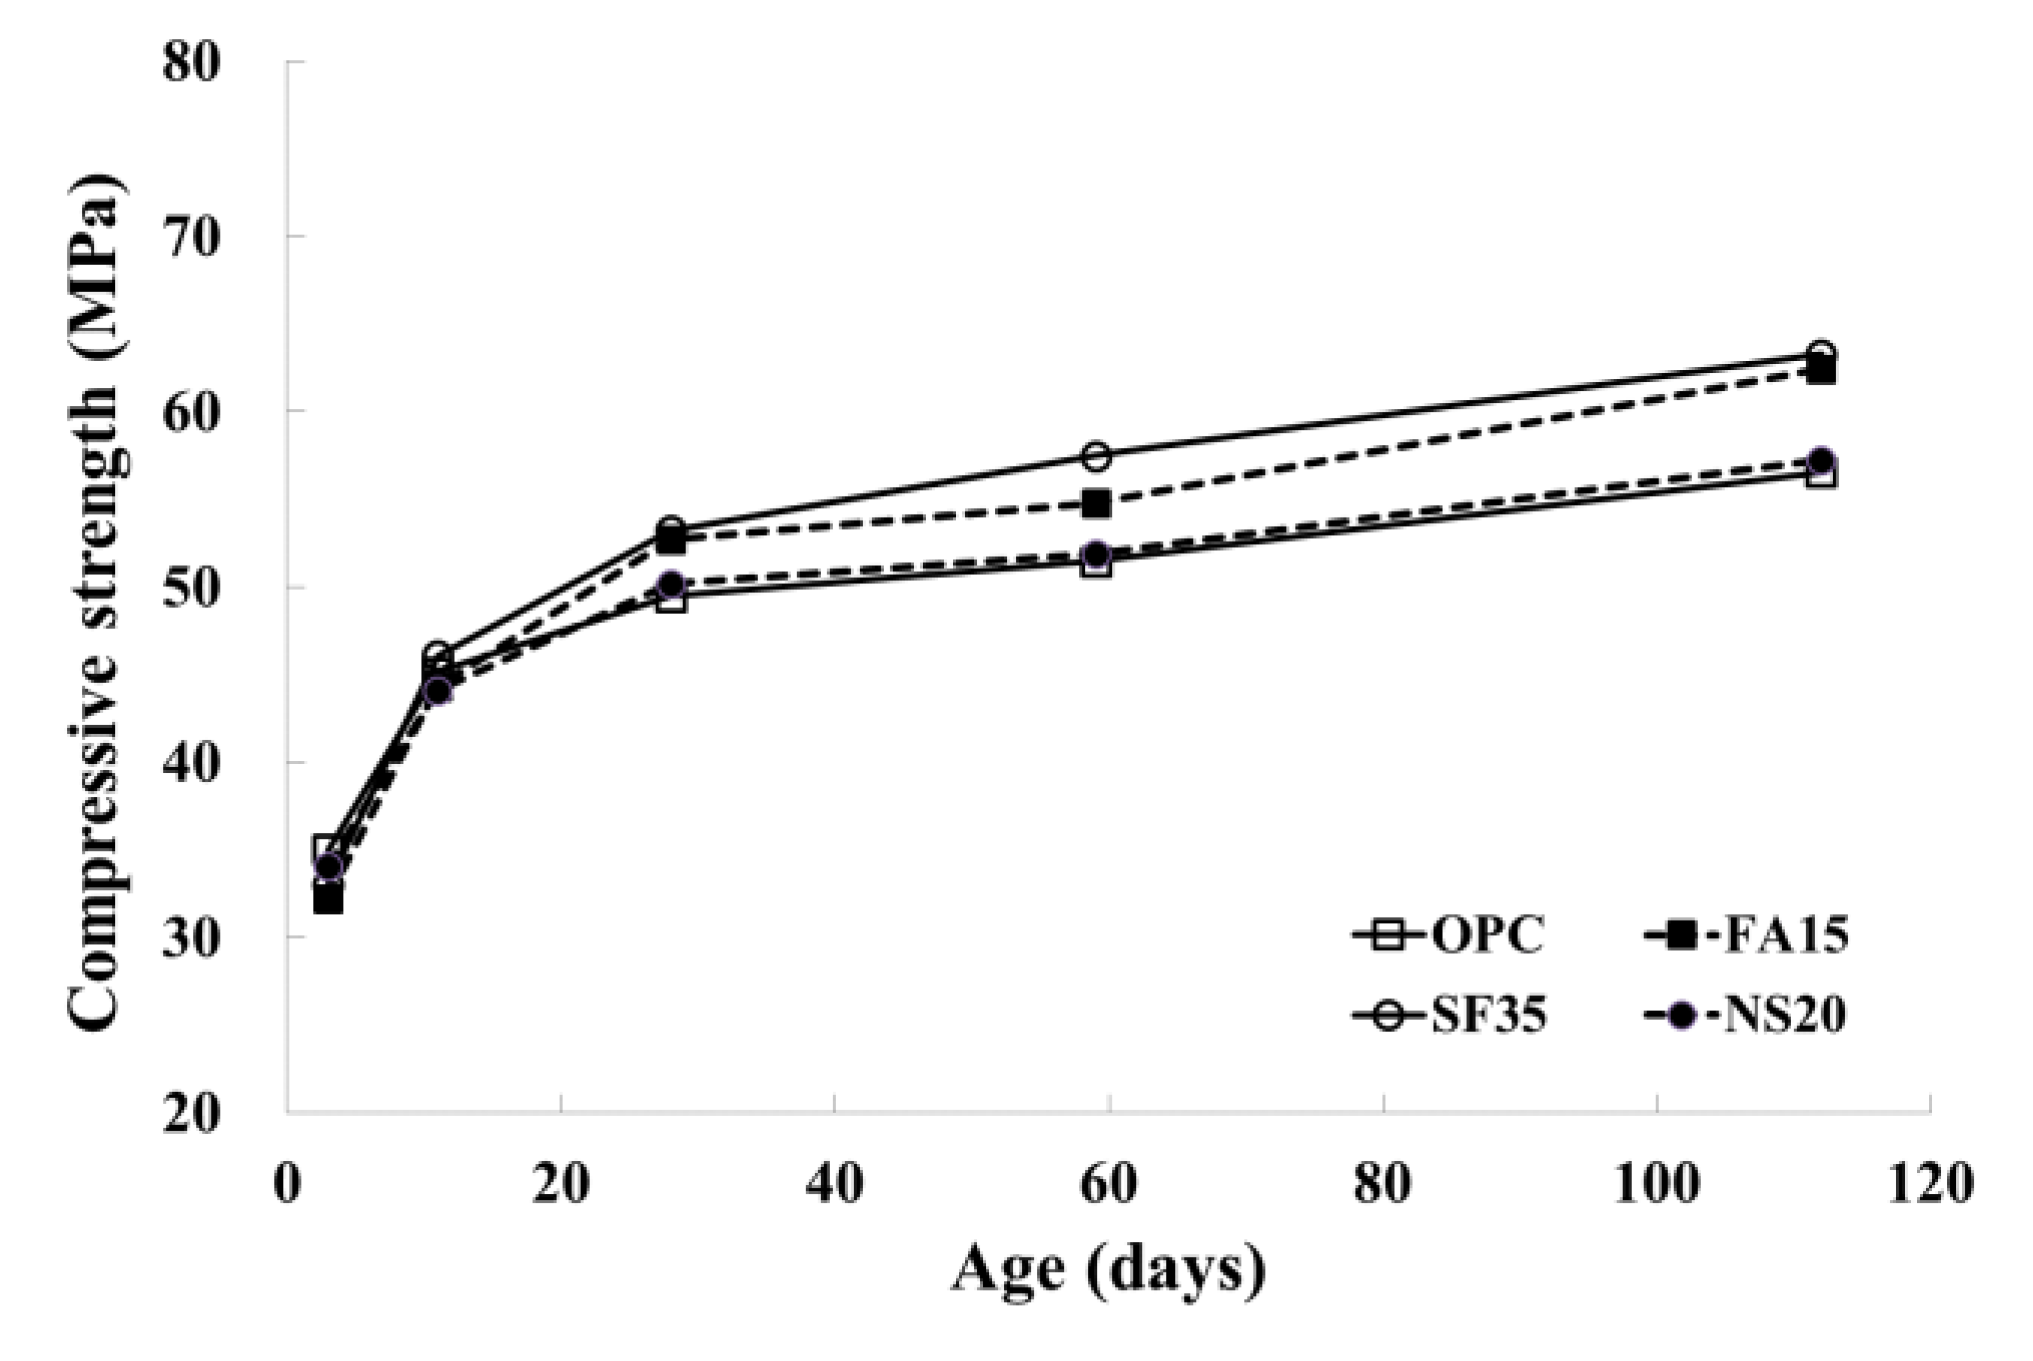
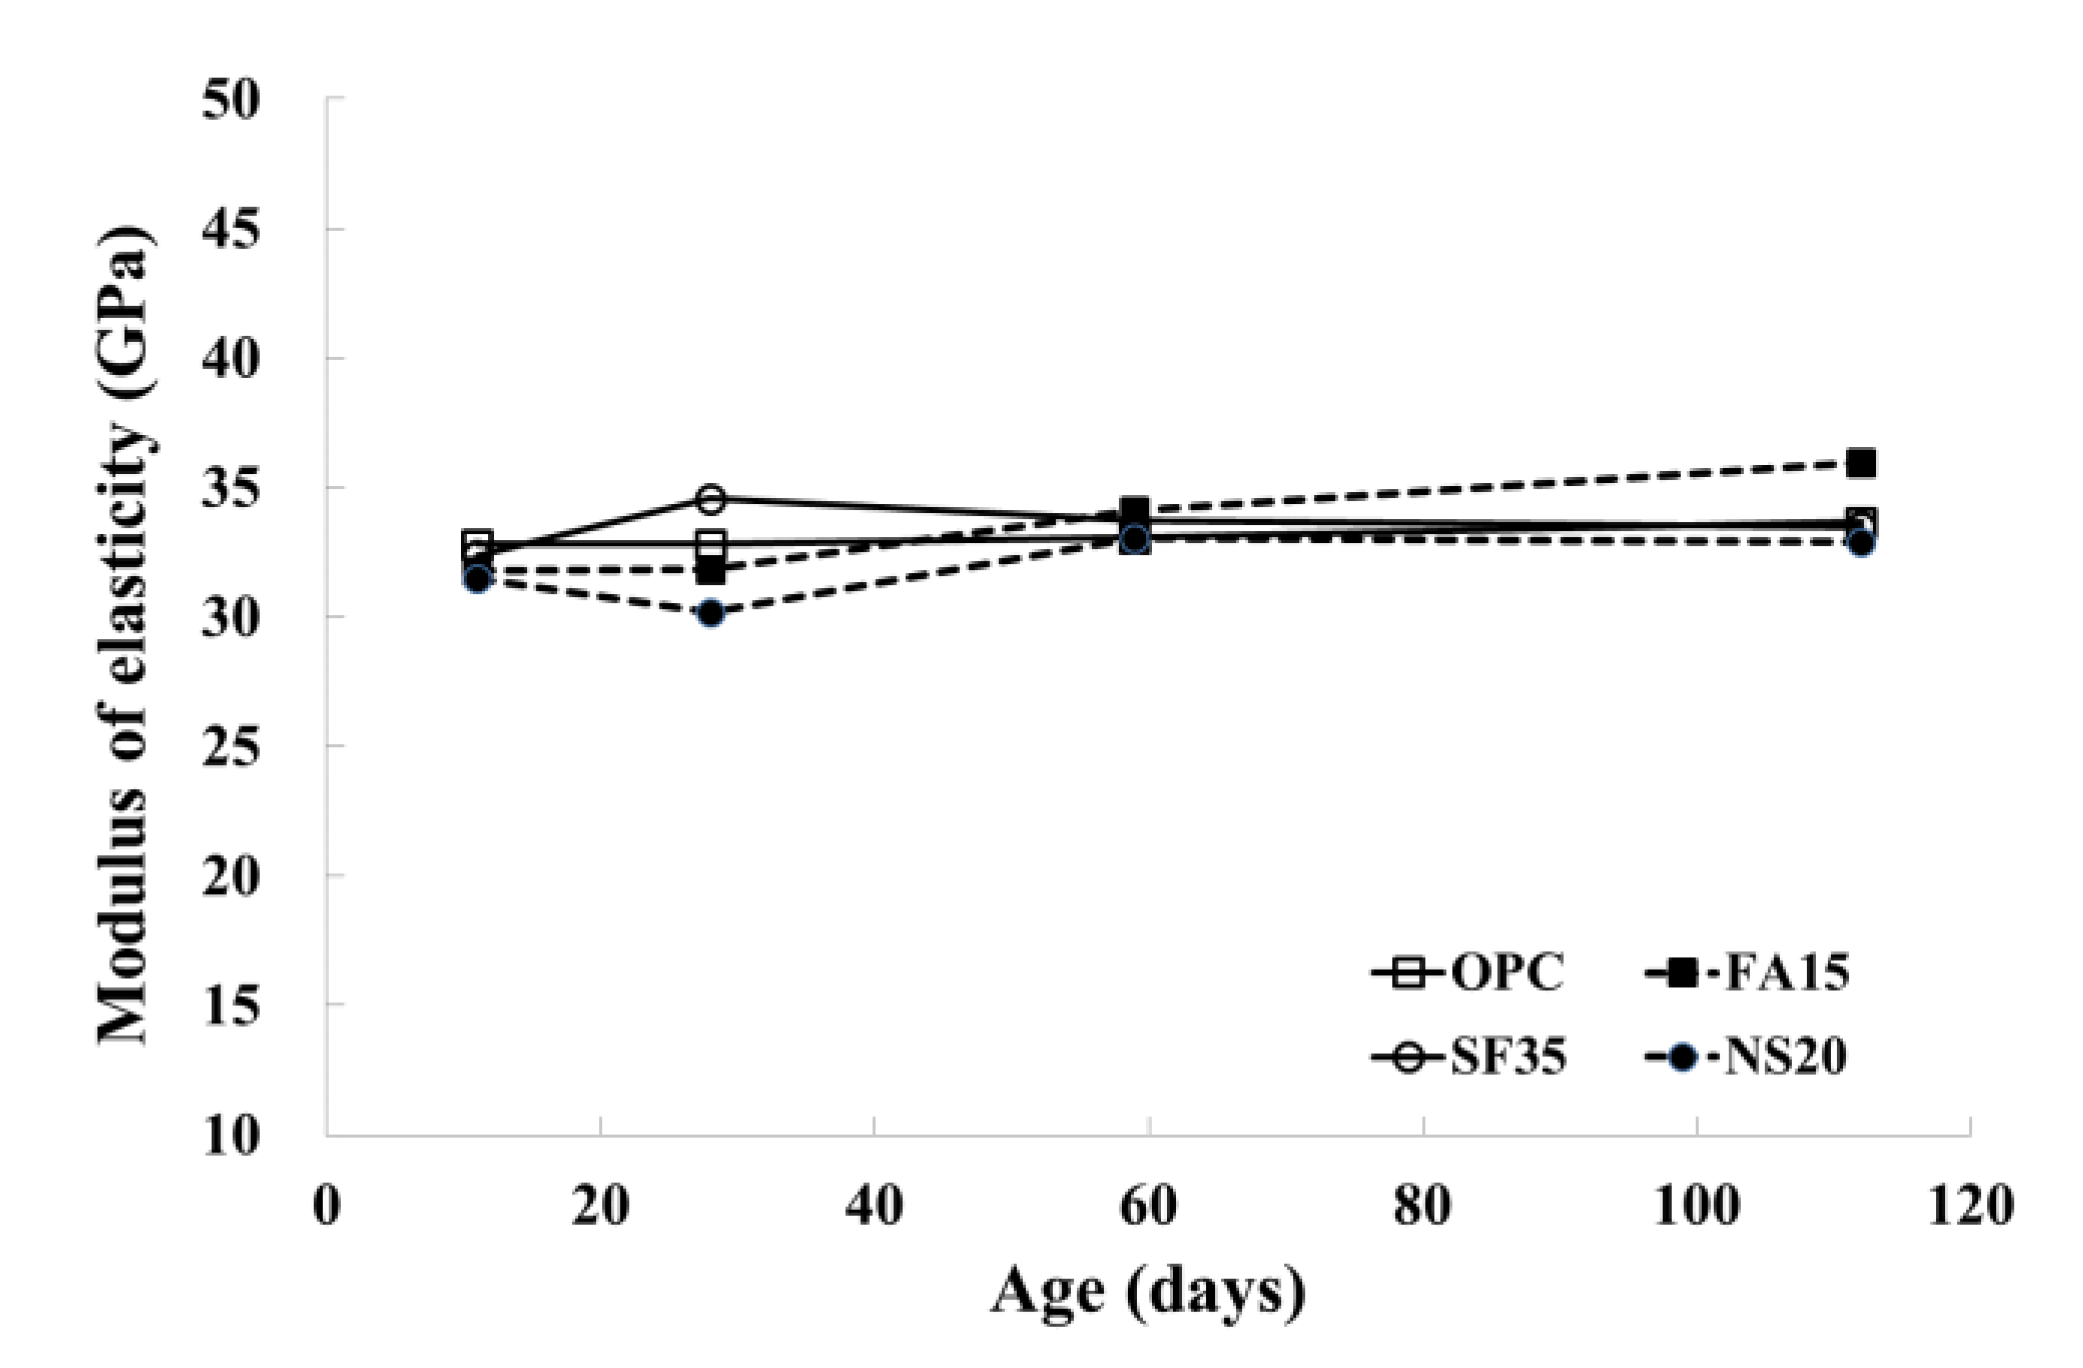
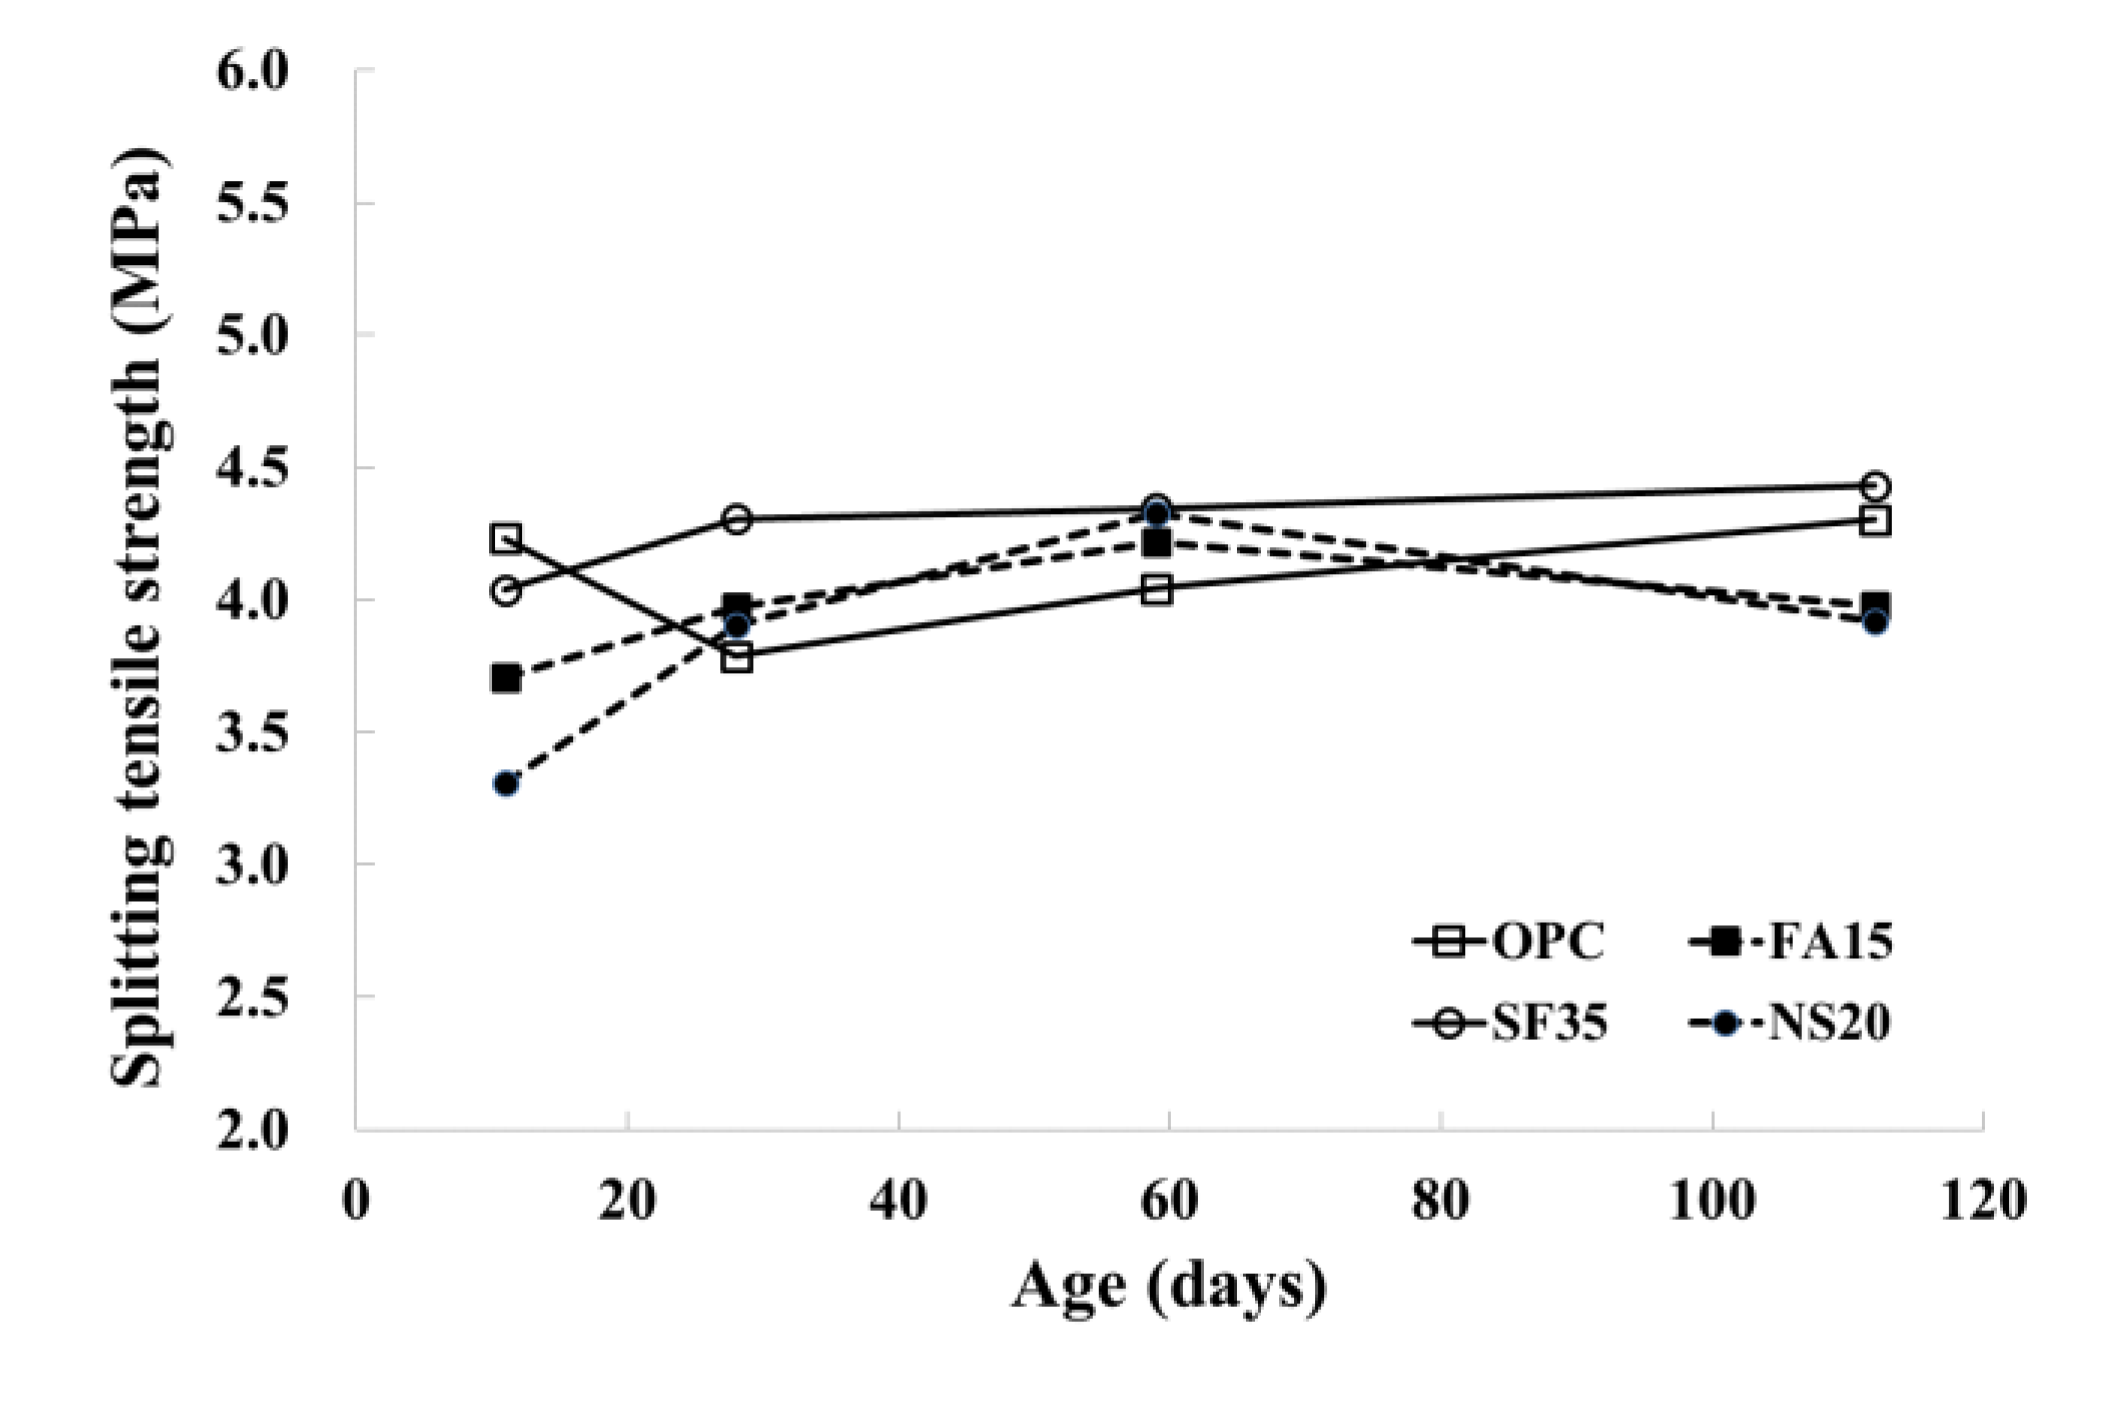
In this study, the target compressive strength was 50 MPa for all mixture designs to remove the compressive strength effect on the carbonation resistance. As shown in Figure 2, the compressive strengths at 28 days after curing were 49.5, 52.7, 53.2, and 50.2 MPa for the OPC, FA15, SF35, and NS20 samples, respectively. Thus, it can be confirmed that the compressive strengths of the test specimens were almost identical, regardless of pozzolanic material type or content. Figure 3 represents the relationship between the elastic modulus and the curing age for the test specimens. There was no significant difference in the type of pozzolanic materials, and the change in the elastic modulus was not significant. The splitting tensile strength evolutions are shown in Figure 4. Similar to the compressive strength and elastic modulus, the splitting tensile strengths of the test specimens were similar to each other. The splitting tensile strengths at 28 days were 3.79, 3.97, 4.31, and 3.90 MPa for the OPC, FA15, SF35, and NS20 specimens, respectively.
3.2. Carbonation Depth
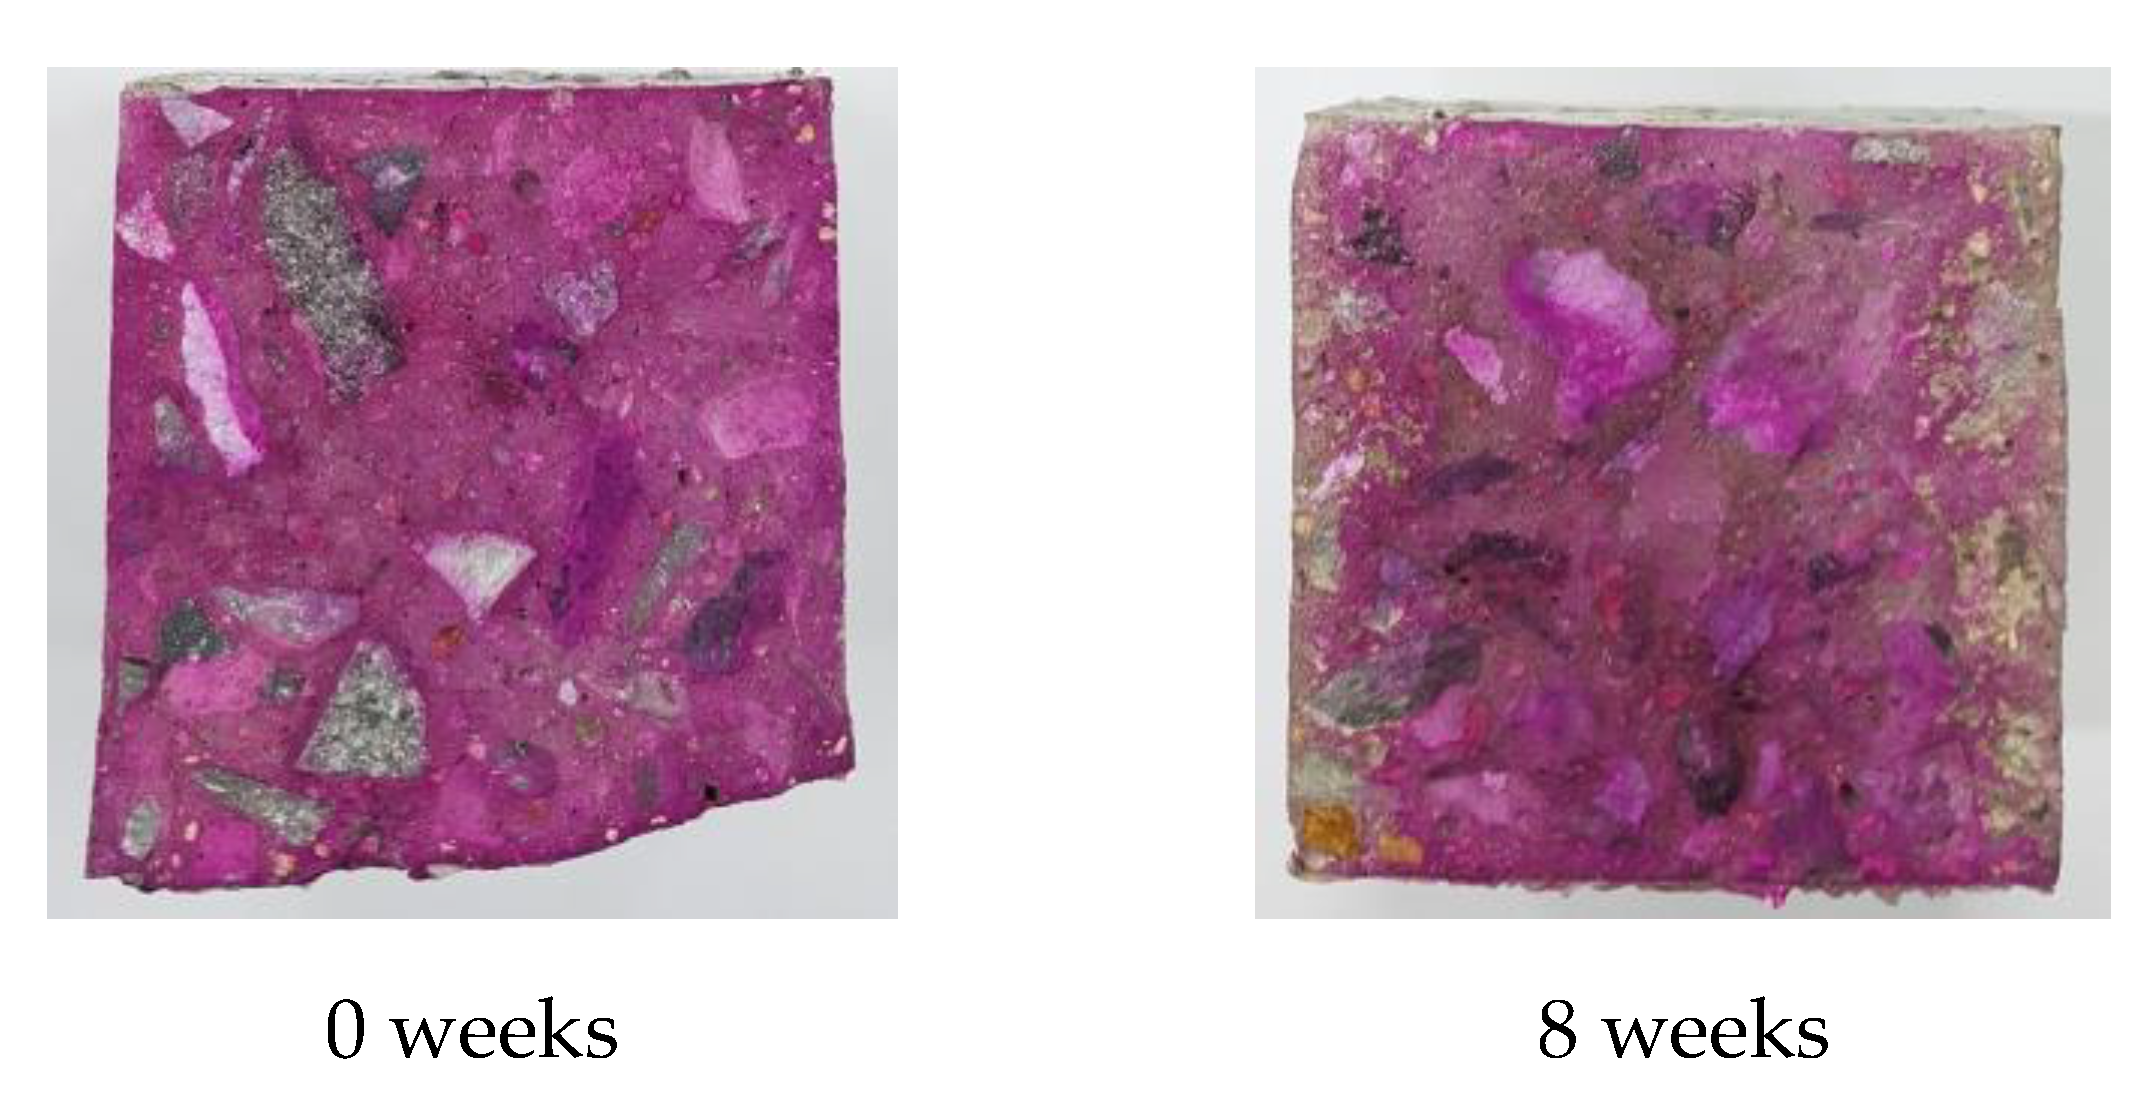
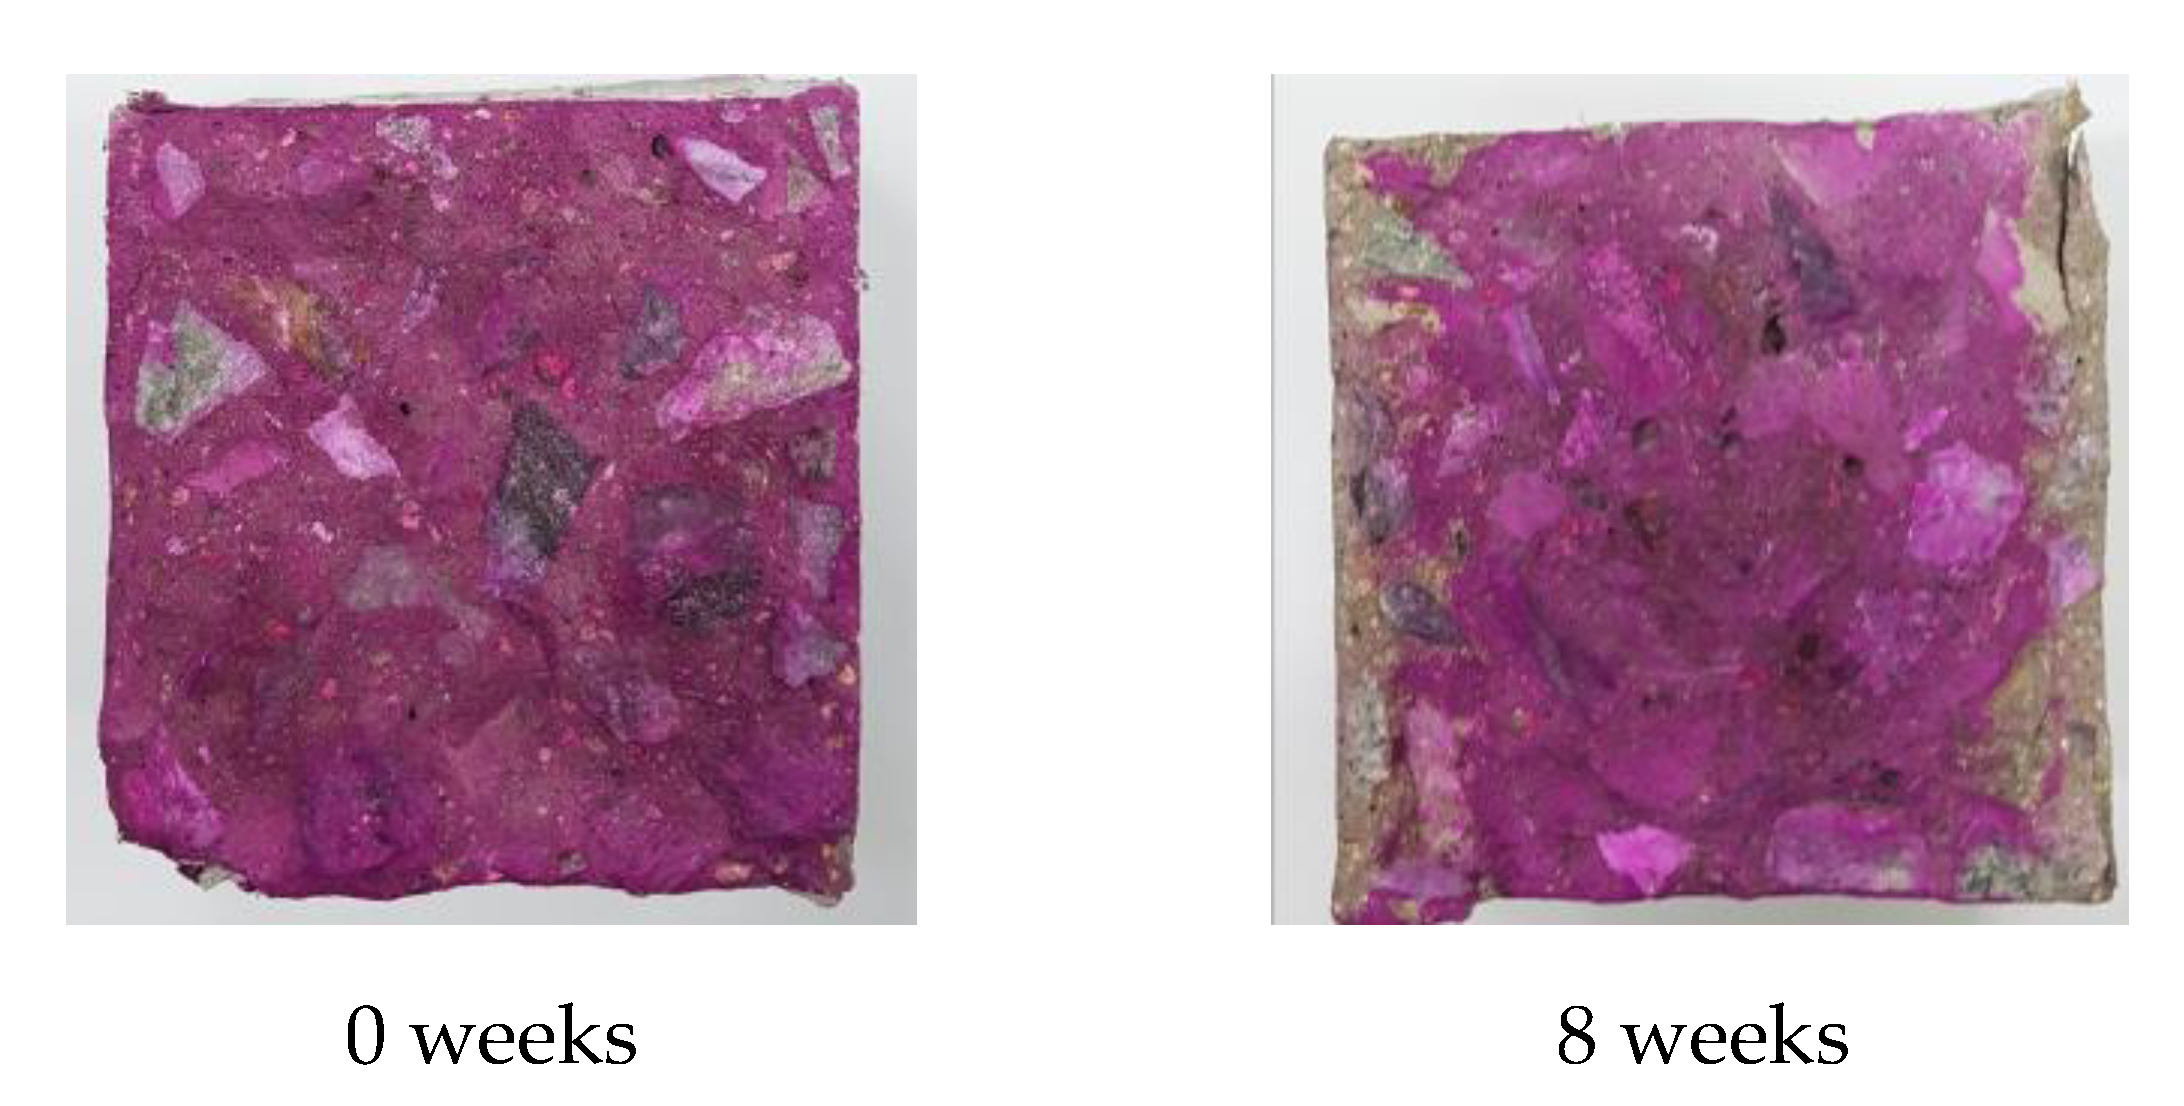
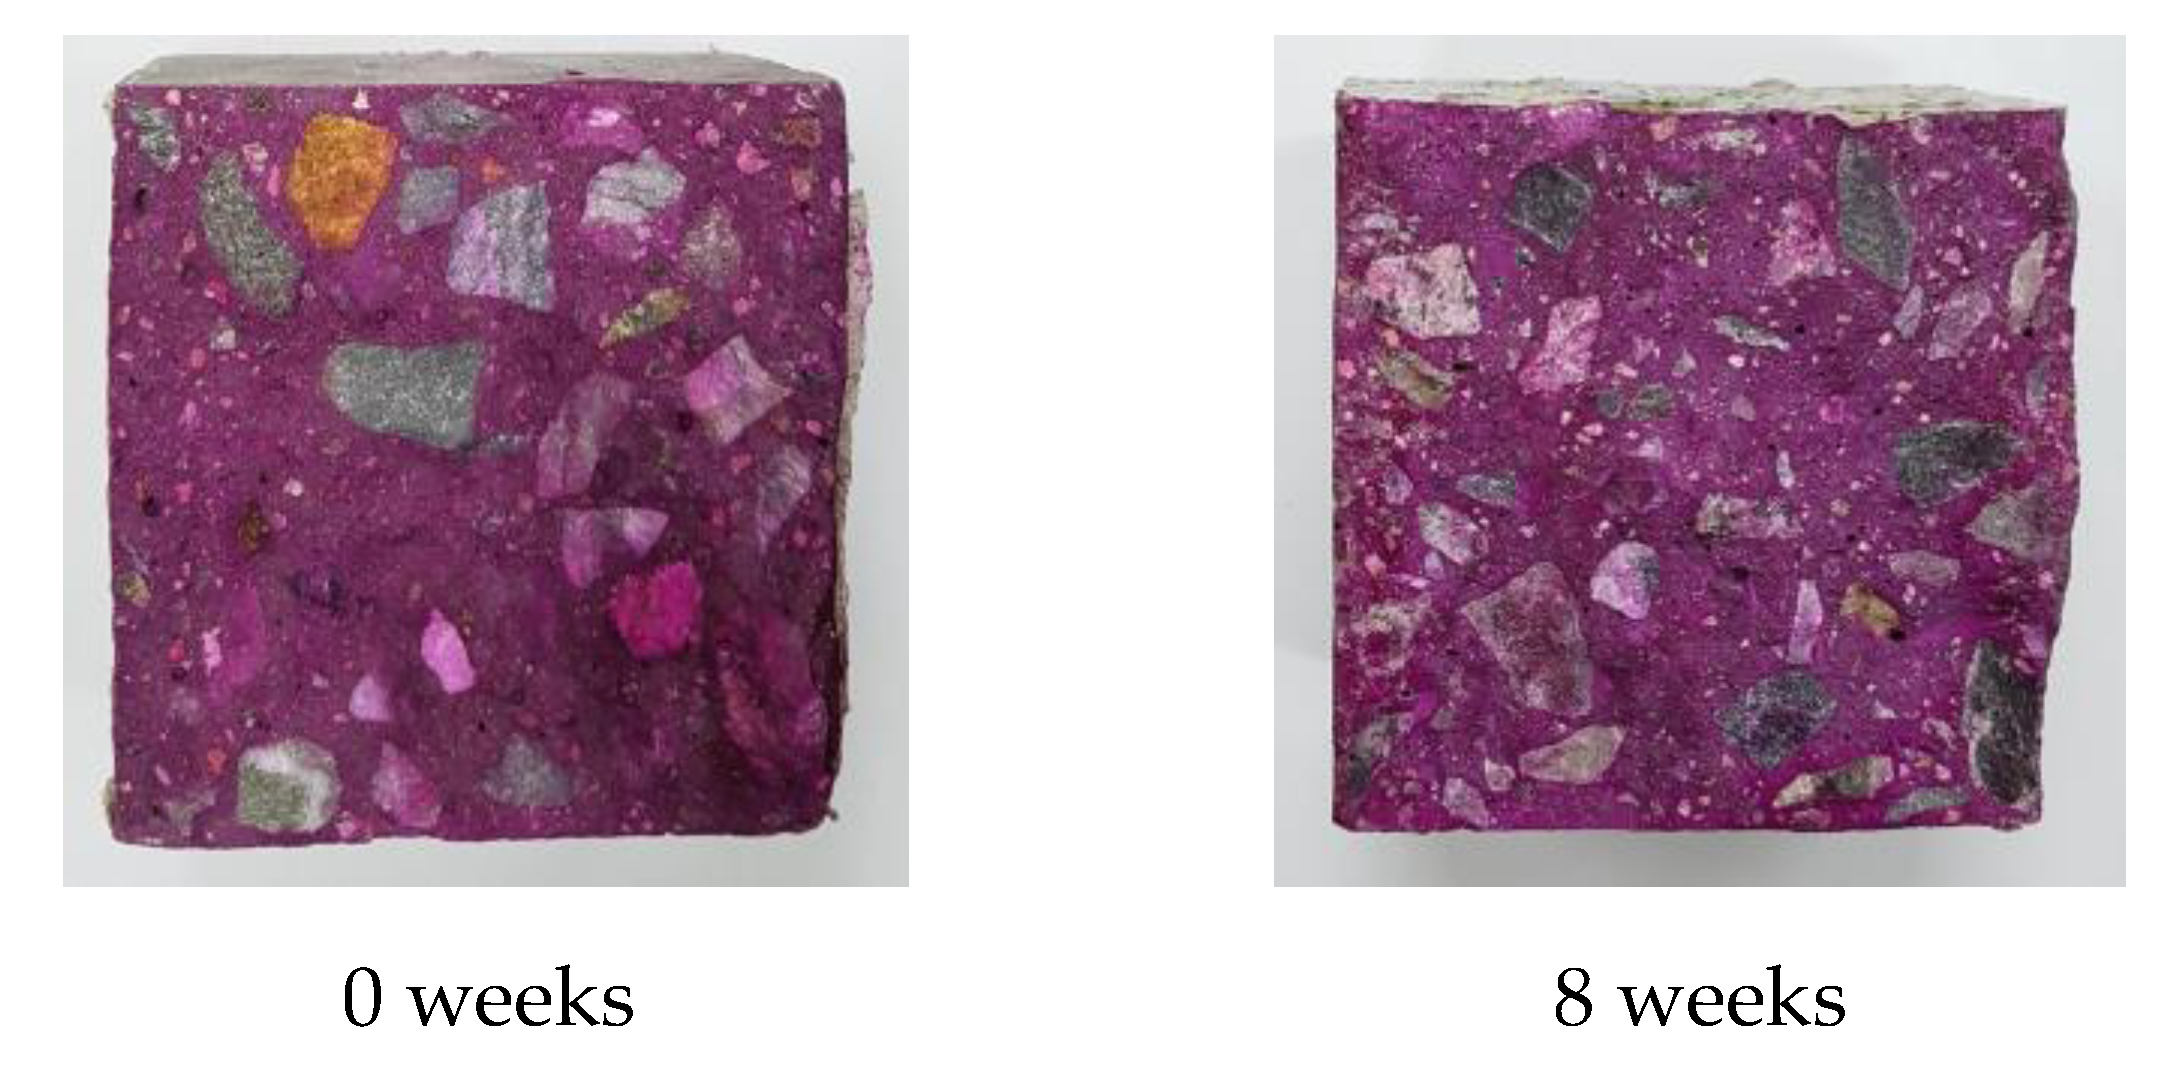
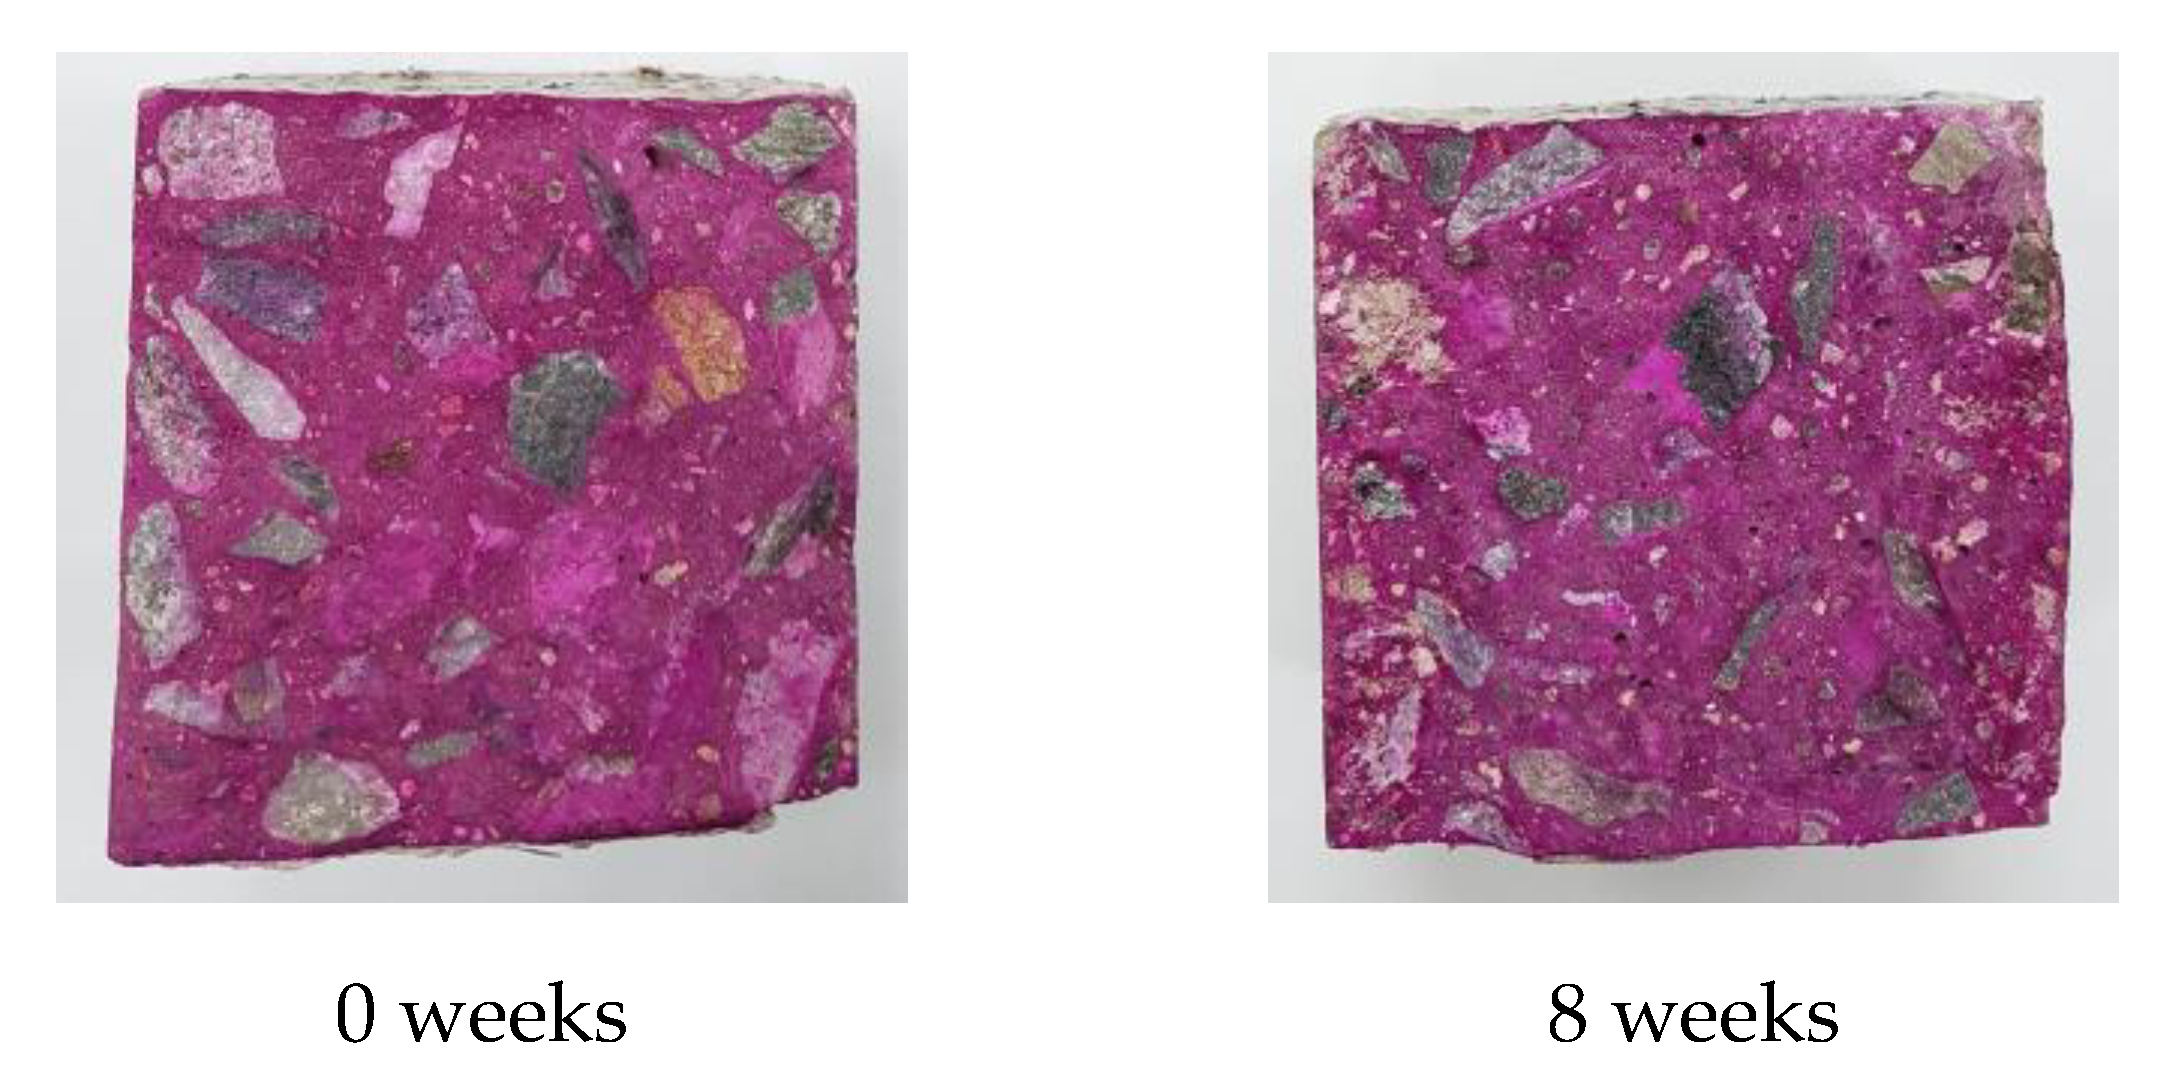
Accelerated carbonation tests were performed, and the carbonation depths for each test specimen were measured according to KS F 2584 [20]. The top and bottom surfaces of the test specimens were sealed, and the carbonation depths were measured on both the left and right sides of the test specimen (Figure 1). Five points for each side were measured by spraying 1% phenolphthalein solution. Finally, the average carbonation depth was calculated. Figure 5, Figure 6, Figure 7 and Figure 8 show sections through the carbonation test specimens of OPC, FA15, SF35, and NS20, respectively, at zero and eight weeks.
Figure 5, Figure 6, Figure 7 and Figure 8 clearly show that the OPC and the specimens with fly ash (FA15) had poor carbonation resistance. For the OPC and FA15 specimens, considerable depths from both sides were not dyed by the phenolphthalein solution. In the case of the SF35 and NS20 specimens, the carbonation was not significant.
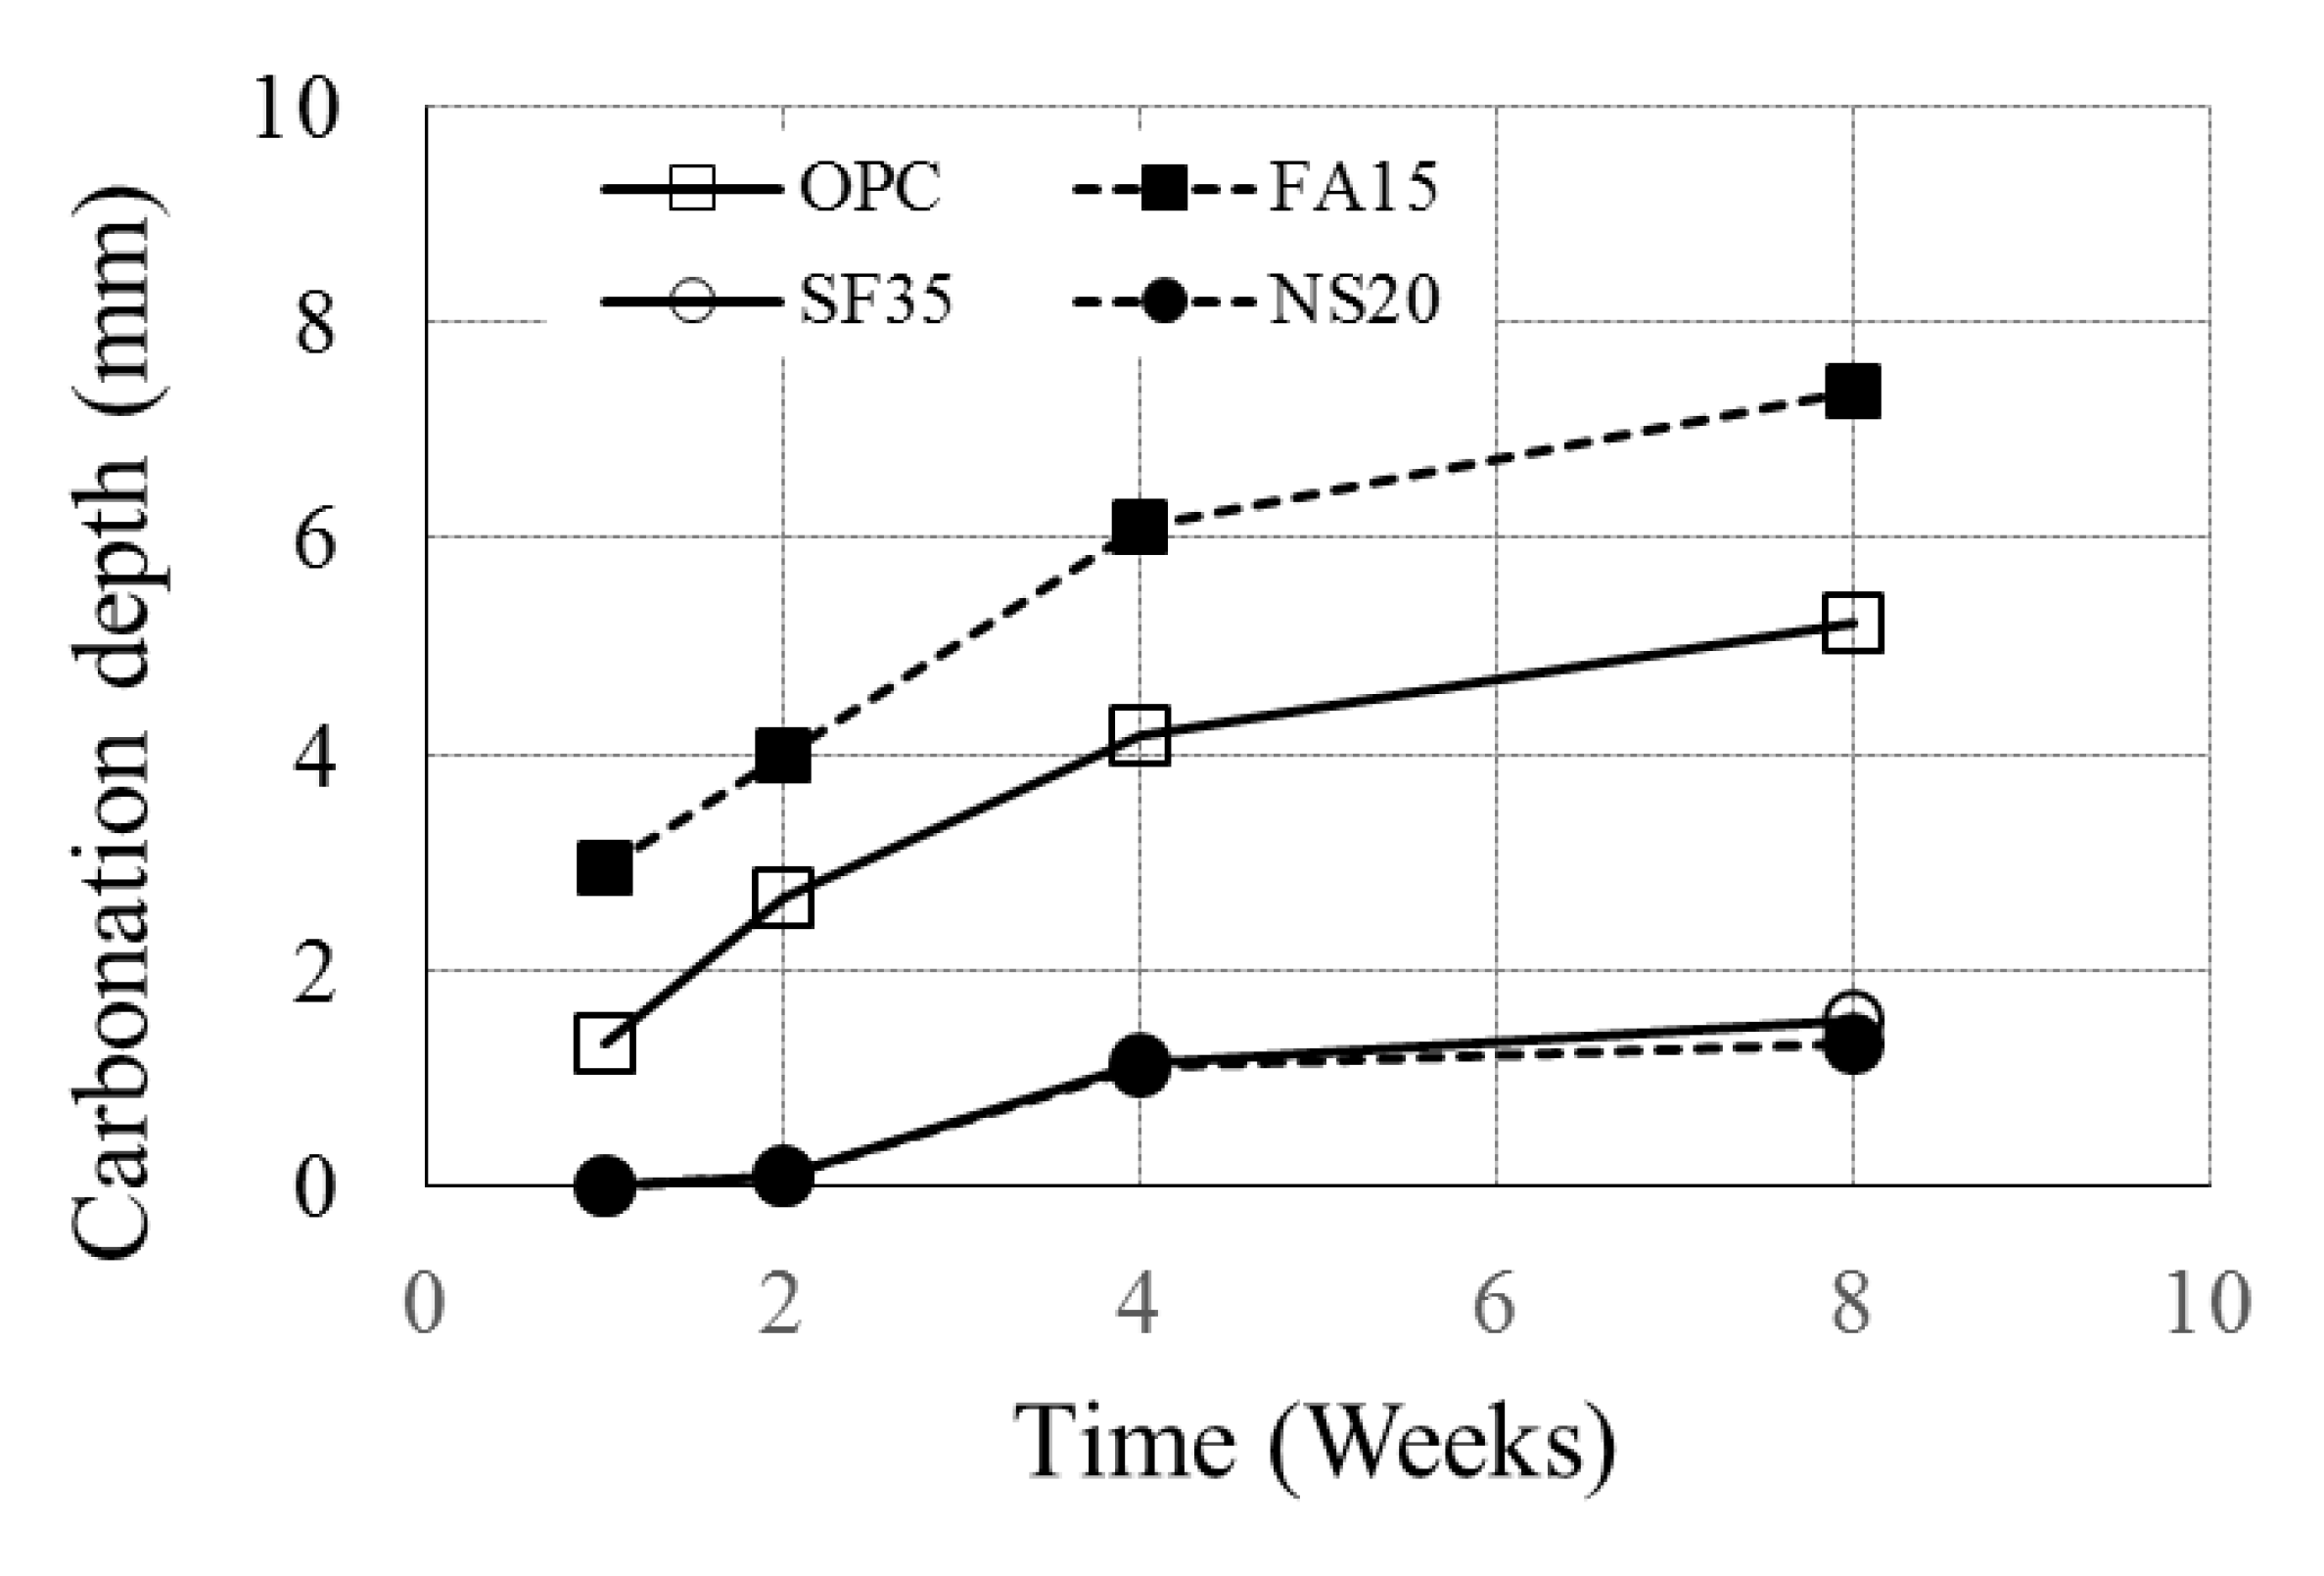
The average carbonation depths were calculated, and the results are presented in Figure 9. FA15 specimens demonstrated a faster carbonation rate than OPC specimens, while the carbonation rates of the SF35 and NS20 specimens were much lower than that of OPC concrete. The average carbonation depth of OPC at eight weeks was 5.21 mm. For FA15, SF35, and NS20, the average carbonation depths were 7.34, 1.55, and 1.34 mm, respectively. When silica fume and nanosilica are used in concrete, the carbonation resistance is enhanced. The average carbonation depth was reduced by approximately 70.2% and 74.3% for SF35 and NS20 specimens, respectively.
4. 29Si MAS NMR Analysis
4.1. 29Si MAS NMR Results
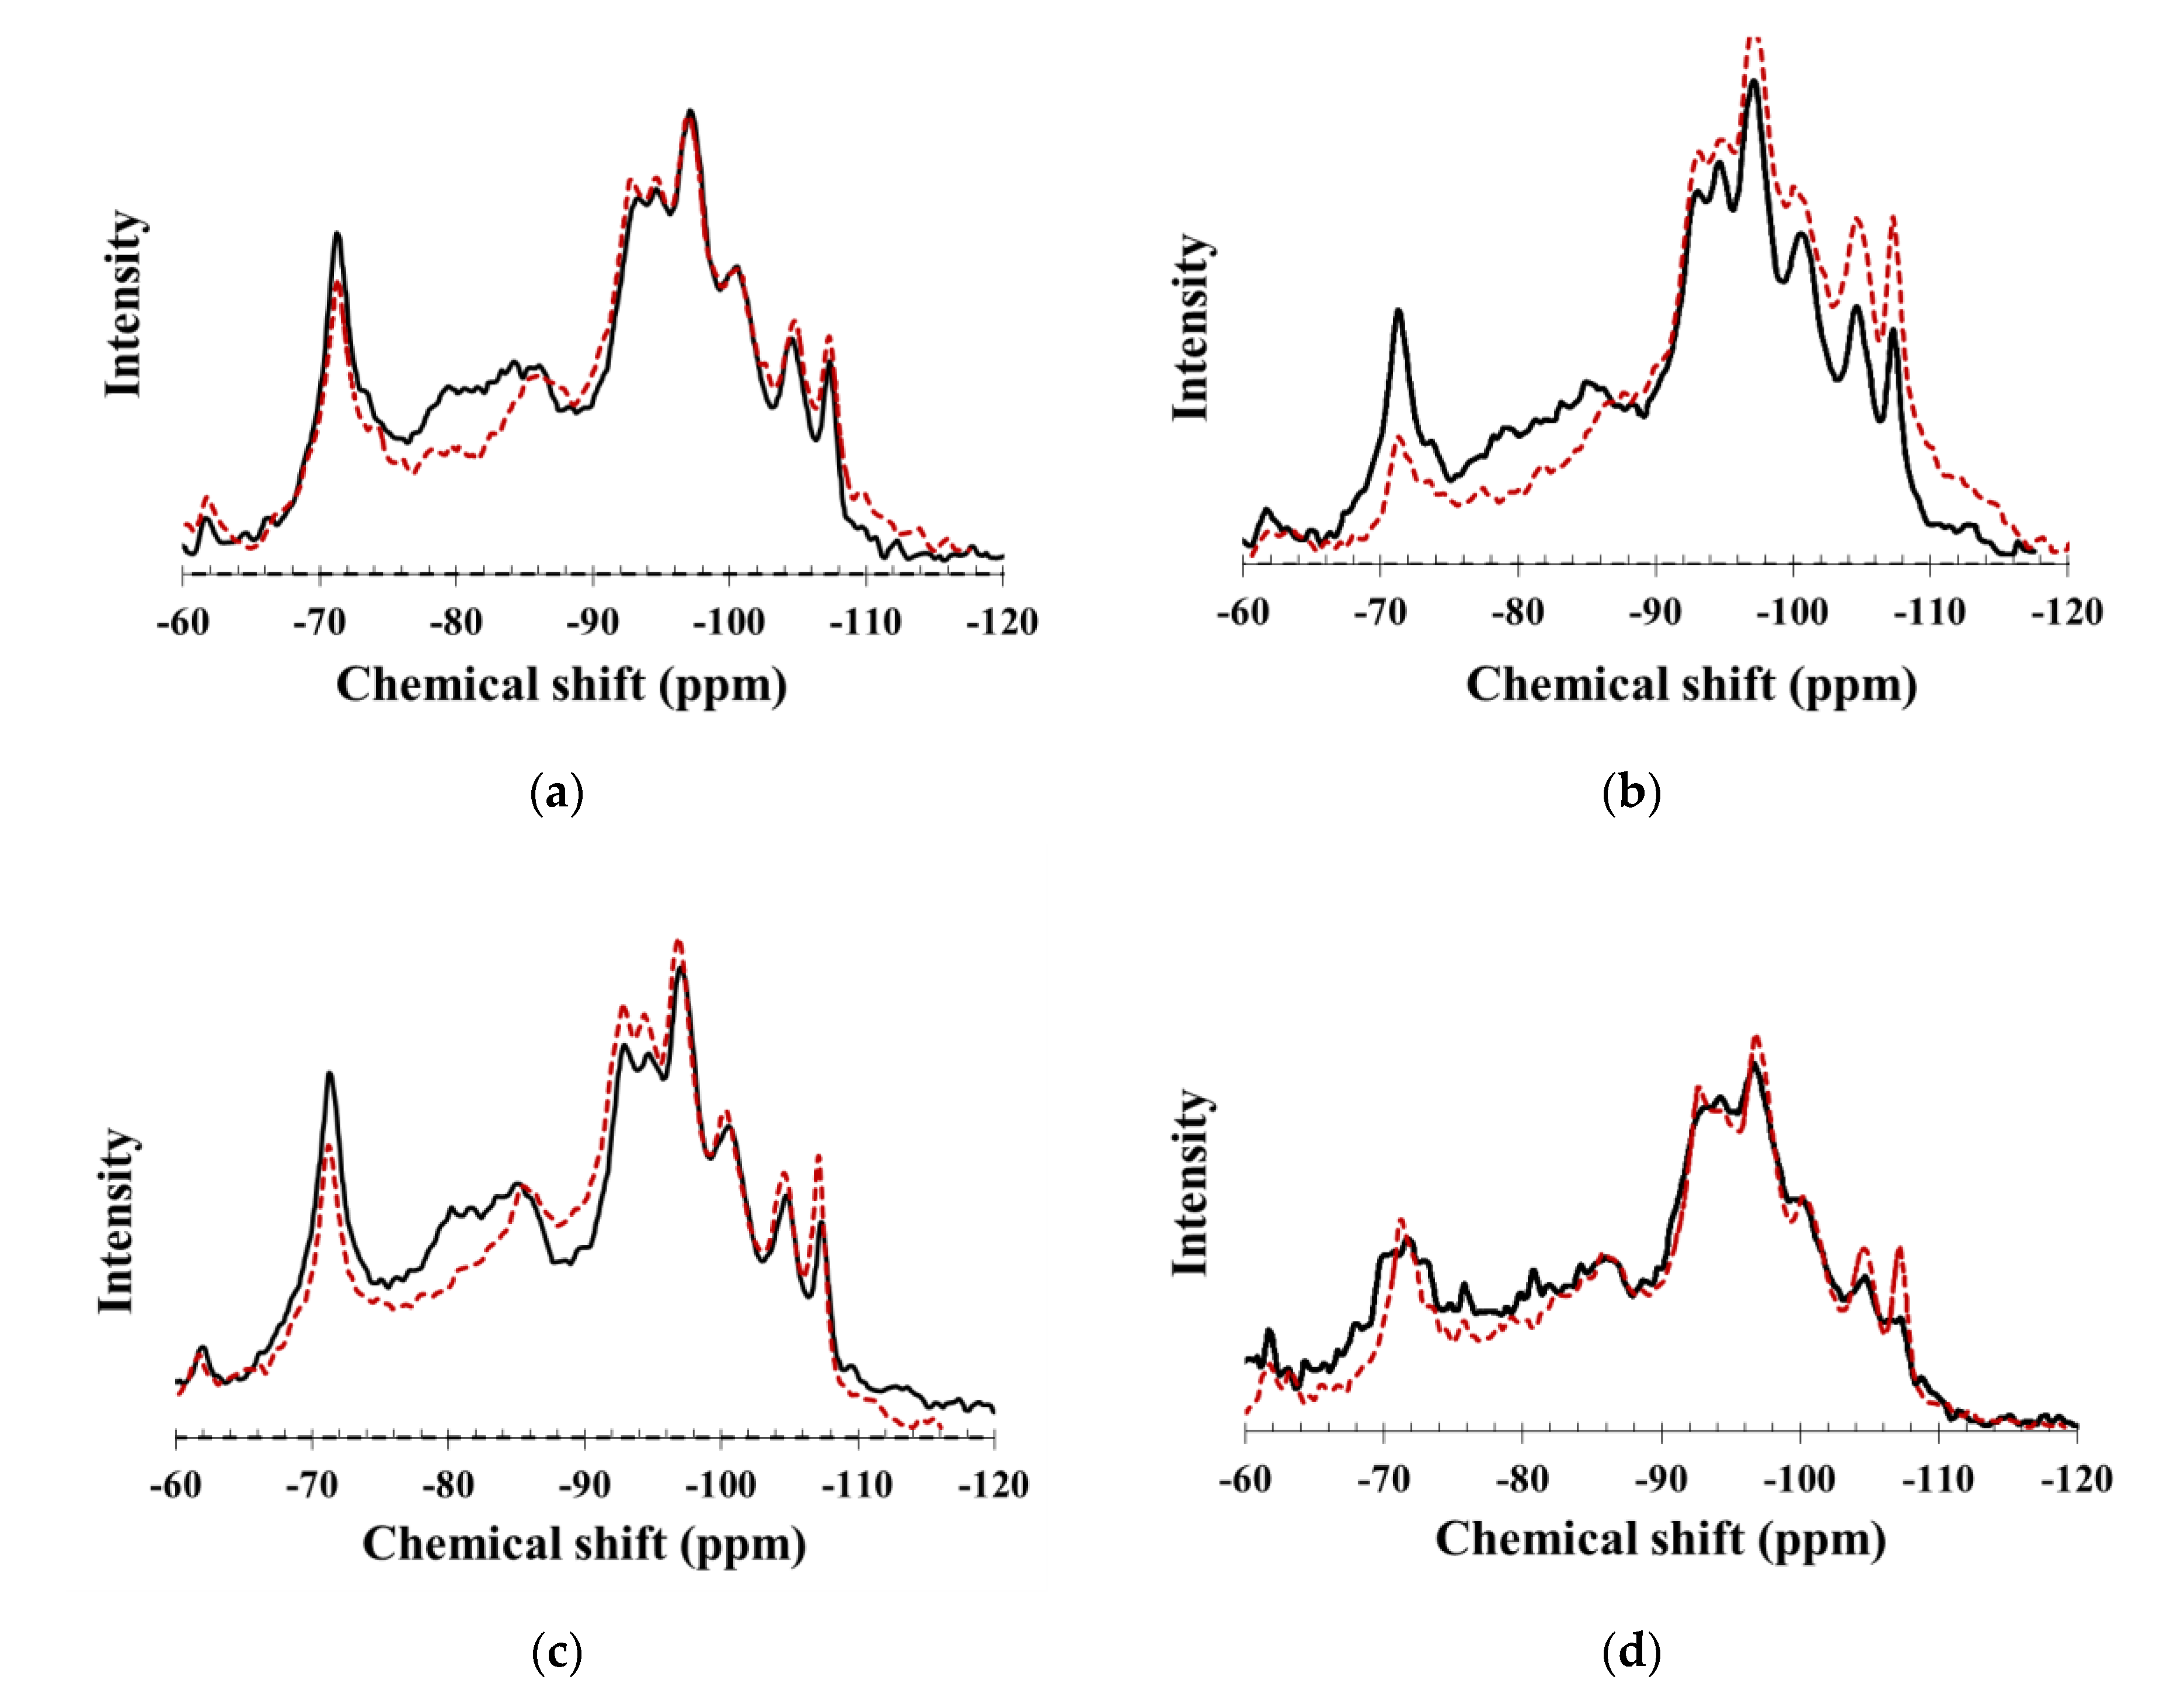
The results of the 29Si MAS NMR analysis for the OPC, FA15, SF35, and NS20 specimens are shown in Figure 10a–d, respectively. In Figure 10a–d, the black lines and the dashed red lines represent the NMR spectra before and after carbonation, respectively.
As shown in Figure 10a–d, the NMR spectra were deconvoluted, and the intensity of Qn was calculated for each specimen (Table 4). In Table 4, the last letter “C” in the label denotes the carbonated specimen. The deconvolution was conducted by integrating the NMR spectra at the respective chemical shift range explained in Section 2.3. The coefficient of variations for the deconvolution functions is defined as standard deviation divided by the average value (%). The average value of the coefficient for all NMR specimens are 1.9%, 13.6%, 6.7%, 2.0%, and 0.9% for Q0, Q1, Q2, Q3, and Q4, respectively.
4.2. Calculation of Conversion Fraction based on 29Si MAS NMR Results
The conversion fraction of pozzolanic material used in this study was calculated based on the 29Si MAS NMR results shown in Section 4.1. The total number of silicate tetrahedra, ƩQ, in the concrete powder sample for NMR can be obtained from
where NA is Avogadro’s constant and ψC3S, ψC2S, and ψS are the molecular weights of C3S, C2S, and S, respectively. These values are assumed as ψC3S = 0.228 kg/mol, ψC2S = 0.172 kg/mol, and ψS = 0.06 kg/mol [11]. p and w are the weight fraction and the weight of subscribed components in the OPC, pozzolans, and sand, respectively. fs is the fraction of sand included in the NMR experiments.
It should be noted that the amount of sand included in the concrete sample is not equal to that of the concrete mixture. In Equation (2), the third term represents the Q3 and Q4 of the natural sand in the concrete sample for the NMR analysis. Thus, the total number of silicate tetrahedra in the sand, ƩQ3,4,Sand, can be obtained from
Similarly, the total number of silicate tetrahedrons in the pozzolans, ƩQ4,Pozzolans, can be calculated as
To calculate the conversion fraction of the pozzolans, the Q3 and Q4 of the natural sand must first be evaluated. Then, the effect of the sand included in the NMR test can be eliminated. In this study, 80% of the SiO2 in the natural sand was considered and the fraction of sand included in NMR experiments, fs, was calculated as followings:
As presented in Equation (5), the total number of silicate tetrahedrons, ƩQ, in the concrete powder sample can be obtained by applying Equation (2) with the chemical composition of the cement (Table 1) and mixture design properties (Table 3) that were used in this study. Then, the fraction of sand included in the NMR experiments, fs, can be calculated with Equation (3), using the NMR results shown in Table 4. From these results, fs was calculated as 35.2%.
By assuming the calculated fs of the OPC was the same as the fs of the specimens with pozzolanic materials (FA15, SF25, and NS20), the conversion fractions of the pozzolans were calculated for the FA15, SF35, and NS20 specimens. The detailed calculation procedure for the FA15 specimen is shown in Equation (6).
As shown in Equation (6), firstly, ƩQ can be obtained from Equation (2). Similarly, ƩQ3,4,Sand and ƩQ4,Pozzolans can be evaluated from Equations (3) and (4). The Q3 and Q4 from the NMR results shown in Table 4 include the Q3 and Q4 of the natural sand. Thus, the Q3 and Q4 in the remaining pozzolanic materials can be obtained by removing the ƩQ3,4,Sand. Finally, the conversion fraction of the pozzolans can be obtained based on the initial silicate tetrahedrons in the pozzolans, ƩQ4,Pozzolans, with the Q3 and Q4 of the pozzolanic materials remaining after the reaction.
From the calculation results, the conversion fractions of the FA15, SF35, and NS20 specimens were 36.3%, 83.1%, and 97.4%, respectively. Thus, it can be concluded that most of the silica fume and nanosilica took part in the pozzolanic reaction.
4.3. Relationship between Carbonation and 29Si MAS NMR Results
The CH (Ca(OH)2) generated by the hydration process keeps the concrete’s pH high. Adding a pozzolanic material, such as fly ash, silica fume, or nanosilica, causes a pozzolanic reaction that consumes CH. Thus, the concrete’s pH is reduced by the pozzolanic reaction, which can accelerate the carbonation. However, at the same time, the pozzolanic reaction generates a C-S-H gel that can reduce the permeability of the concrete and increase its carbonation resistance. As a result, the conversion fraction (or degree of reaction) of the pozzolanic material is very important for carbonation resistance. If the pozzolanic reaction is very fast, the permeability to CO2 gas can be dramatically reduced, and the carbonation resistance can be enhanced, even if pH is somewhat lower than OPC.
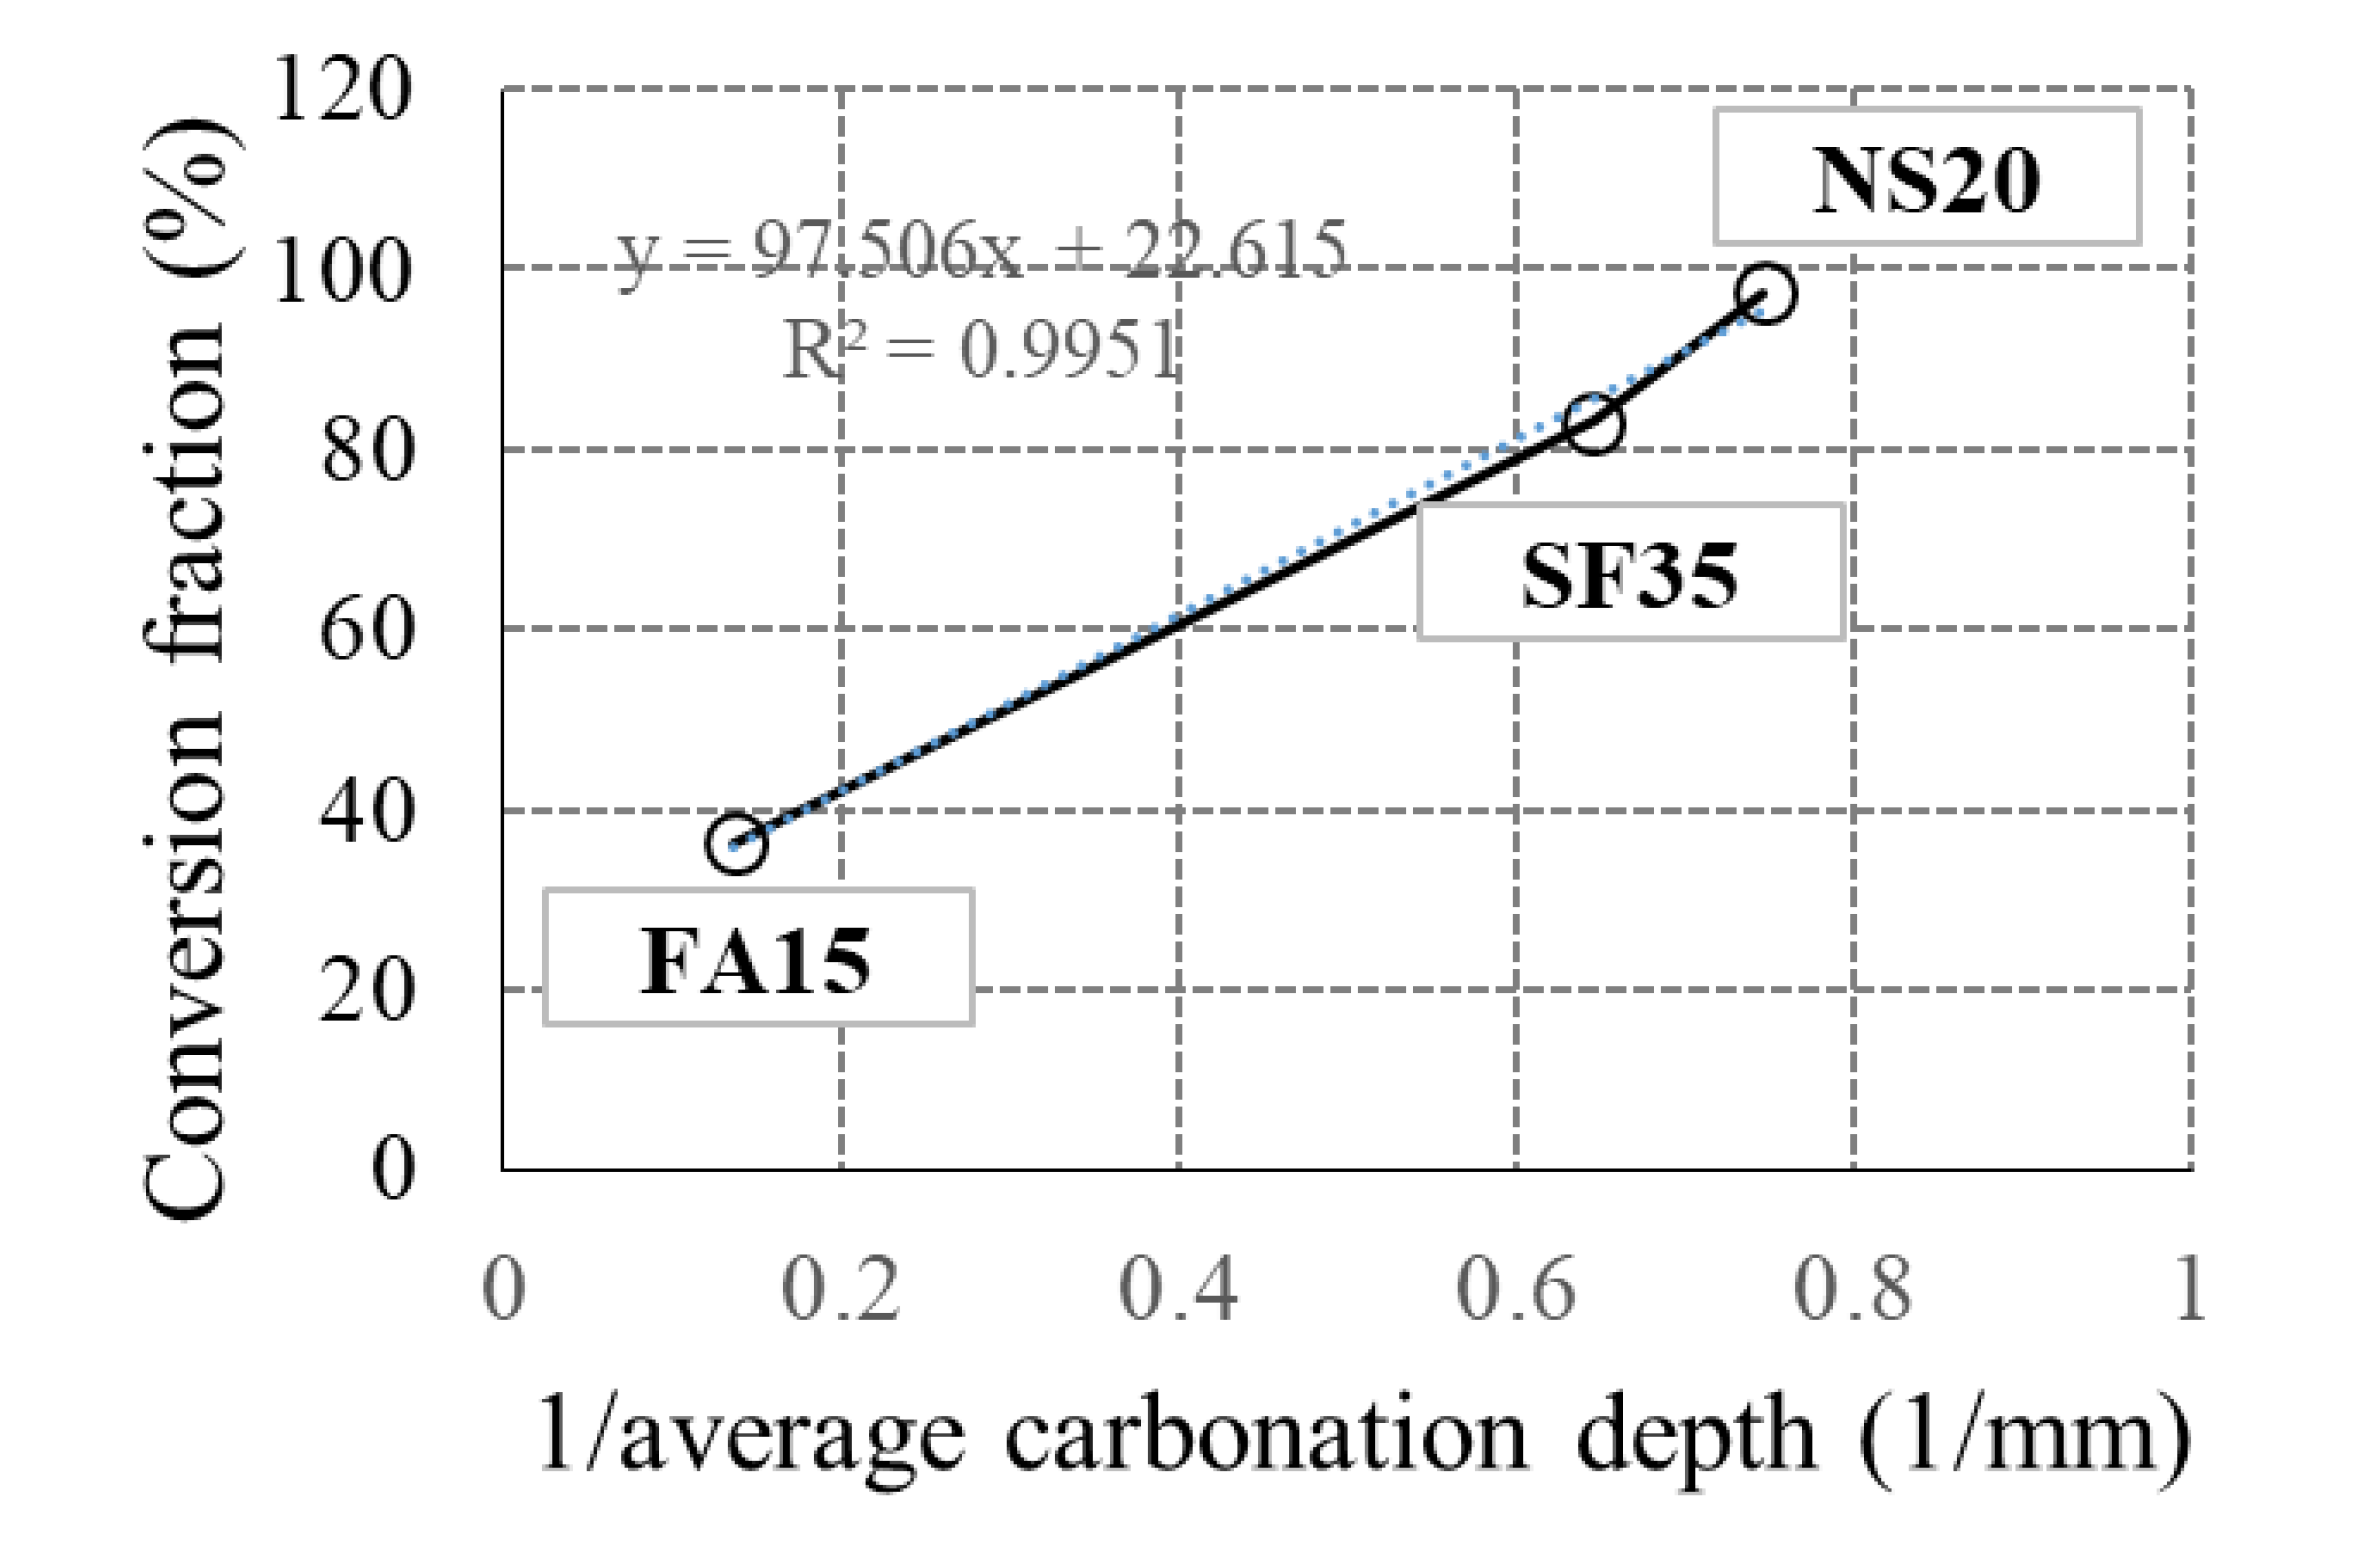
From the results discussed in Section 4.2, the conversion fractions of the SF35 and NS20 specimens were 83.1% and 97.4%, respectively, much higher than that of the FA15 (36.3%). From the accelerated carbonation test, the average carbonation depths were 7.34, 1.55, and 1.34 mm for the FA15, SF35, and NS20 specimens, respectively.
Figure 11 shows the relationship between the conversion fraction and the inverse of the average carbonation depth obtained from this study, which demonstrates a strong linear relationship (R2 =0.9951). Thus, it can be concluded that the carbonation depth of the pozzolan blended concrete is inversely proportional to the conversion fraction of the pozzolanic materials.
There are several sources of calcium during carbonation. Major sources of calcium include the C3S and C2S remaining in the cement matrix. This residual C3S and C2S can be detected by the intensity of Q0 in the 29Si MAS NMR results.
Table 5 shows the change (or difference) in the Qn intensity after carbonation for each pozzolan blended specimen. In Table 5, a minus sign represents a reduction after the carbonation. In Table 5, it can be seen that the Q0 of all the specimens decreased after carbonation. This might be attributed to the fact that the calcium in the remaining C3S and C2S were used during the carbonation. The maximum difference was observed in the concrete with fly ash, which showed the poorest carbonation resistance. When the calcium in the C3S and C2S are used for carbonation, the silicate is separated. This separated silicate may be observed in high-order Qn, such as Q4, and the intensities of Q3 and Q4 were generally increased after carbonation, as shown in Table 5.
In addition, the C-S-H gel can be attacked by acidic fluid and will then generate silica gel as [27].
As Equation (7) shows, the silicate is separated from the C-S-H gel. Thus, as in the case of the reduction of C3S and C2S, the low-order Qn can be decreased with increasing high-order Qn.
5. Conclusions
This paper presents the conversion fraction calculation method for pozzolan blended concrete using 29Si MAS NMR analysis and the relationship between the carbonation resistance of the concrete and the conversion fraction of the pozzolanic materials. Based on the results of this study, the following conclusions were reached.
- The 15%, 3.5%, and 2.0% fly ash, silica fume, and nanosilica blended concrete specimens, respectively, were constructed. All tested mixtures were intentionally designed to have similar mechanical properties to remove the strength effect on the carbonation resistance. The 28-day compressive strengths of the concrete specimens were similar to each other and were all approximately 50 MPa. The differences in the other mechanical properties between the specimens were also not significant.
- Accelerated carbonation tests were conducted. The concrete specimen with fly ash showed the poorest carbonation resistance among the specimens. The average carbonation depths of the silica fume and nanosilica blended concrete specimens were 1.55 and 1.34 mm, respectively. These values were approximately 70.2% and 74.3% lower than that of the OPC specimen.
- The conversion fraction of pozzolans was calculated using 29Si MAS NMR analysis. For this, the amount of sand included in the concrete NMR sample was first evaluated using the results of the analysis of the OPC sample. Then, the conversion fractions were adjusted by removing the effect of the sand. The detailed methodology and procedure are shown in Section 4.2. From the results, the conversion fractions of the fly ash, silica fume, and nanosilica were 36.3%, 83.1%, and 97.4%, respectively. Thus, the nanosilica was almost completely converted.
- The 29Si MAS NMR analysis results before and after carbonation show that the low-order Qn is decreased with increasing high-order Qn after carbonation. This could be attributed to the calcium in the C3S, C2S, and C-S-H being used in the carbonation reaction, and causing the separated silicate to be detected as high-order Qn.
Author Contributions
Methodology, J.M., J.J.K., and K.-S.Y.; investigation, J.J.K., and K.-S.Y.; writing—original draft preparation, J.J.K.; writing—review and editing, J.M., J.J.K., and K.-S.Y.; project administration, J.M. All authors have read and agreed to the published version of the manuscript.
Funding
This study was supported by Research Grant from Kangwon National University.
Conflicts of Interest
The authors declare no conflict of interest.
References
- Youm, K.-S.; Moon, J.; Cho, J.-Y.; Kim, J.J. Experimental study on strength and durability of lightweight aggregate concrete containing silica fume. Constr. Build. Mater. 2016, 114, 517–527. [Google Scholar] [CrossRef]
- Sanchez, F.; Sobolev, K. Nanotechnology in concrete–A review. Constr. Build. Mater. 2010, 24, 2060–2071. [Google Scholar] [CrossRef]
- Halim, S.C.; Brunner, T.J.; Grass, R.N.; Bohner, M.; Stark, W.J. Preparation of an ultra fast binding cement from calcium silicate-based mixed oxide nanoparticles. Nanotechnology 2007, 18, 1–6. [Google Scholar] [CrossRef]
- Harsh, S.; Arora, A.K.; Thomas, V.; Ali, M.M. Studies on cement hydration in the presence of nanosilica. Cem. Int. 2014, 3, 74–78. [Google Scholar]
- Lee, H.-S.; Cho, H.-K.; Wang, X.-Y. Experimental investigation and theoretical modeling of nanosilica activity in concrete. J. Nanomater. 2014, 2014, 121. [Google Scholar] [CrossRef] [Green Version]
- De Windt, L.; Deneele, D.; Maubec, N. Kinetics of lime/bentonite pozzolanic reactions at 20 and 50 °C: Batch tests and modeling. Cem. Concr. Res. 2014, 59, 34–42. [Google Scholar] [CrossRef] [Green Version]
- Li, X.; Gao, H.; Scrivens, W.A.; Fei, D.; Thakur, V.; Sutton, M.A.; Reynolds, A.P.; Myrick, M.L. Structural and mechanical characterization of nanoclay-reinforced agarose nanocomposites. Nanotechnology 2005, 16, 2020–2029. [Google Scholar] [CrossRef]
- Jo, B.-W.; Kim, C.-H.; Tae, G.-H.; Park, J.-B. Characteristics of cement mortar with nano-SiO2 particles. Constr. Build. Mater. 2007, 21, 1351–1355. [Google Scholar] [CrossRef]
- Lothenbach, B.; Saout, G.L.; Gallucci, E.; Scrivener, K. Influence of limestone on the hydration of Portland cements. Cem. Concr. Res. 2008, 38, 848–860. [Google Scholar] [CrossRef]
- Chaipanich, A.; Nochaiya, T.; Wongkeo, W.; Torkittikul, P. Compressive strength and microstructure of carbon nanotubes-fly ash cement composites. Mater. Sci. Eng. A 2010, 527, 1063–1067. [Google Scholar] [CrossRef]
- Norris, A.; Saafi, M.; Romine, P. Temperature and moisture monitoring in concrete structures using embedded nanotechnology/microelectromechanical systems (MEMS) sensors. Constr. Build. Mater. 2008, 22, 111–120. [Google Scholar] [CrossRef]
- Moon, J.; Taha, M.M.R.; Youm, K.-S.; Kim, J.J. Investigation of pozzolanic reaction in nanosilica-cement blended pastes based onsolid-state kinetic models and 29Si MAS NMR. Materials 2016, 9, 99. [Google Scholar] [CrossRef] [Green Version]
- Yu, P.; Kirpatrick, R.J.; Poe, B.; McMillan, P.F.; Cong, X. Structure of Calcium Silicate Hydrate (C-S-H): Near-, Mid-and Far-infrared spectroscopy. J. Am. Ceram. Soc. 1999, 82, 742–748. [Google Scholar] [CrossRef]
- Richardson, I.G. Tobermorite/Jennite- and Tobermorite/Calcium Hydroxide-Based models for the structure of C-S-H: Applicability to hardened pastes of tricalcium silicate, β-dicalcium silicate, Portland cement, and blends of Portland cement with blast-durnace slag, Metakaolin, or silica fume. Cem. Concr. Res. 2004, 34, 1733–1777. [Google Scholar]
- Korb, J.-P.; Monteilhet, L.; McDonald, P.J.; Mitchell, J. Microstructure and texture of hydrated cement-based materials: A proton field cycling relaxometry approach. Cem. Concr. Res. 2007, 37, 295–302. [Google Scholar] [CrossRef]
- Lodeiro, I.G.; Macphee, D.E.; Palomo, A.; Fernandez-Jimenez, A. Effect of alkalis on fresh C-S-H gels. FTIR analysis. Cem. Concr. Res. 2009, 39, 147–153. [Google Scholar] [CrossRef]
- Kim, J.-S.; Youm, K.-S.; Lim, J.-H.; Han, T.-S. Effect of carbonation on cement paste microstructure characterized micro-computed tomography. Constr. Build. Mater. 2020, 263, 120079. [Google Scholar] [CrossRef]
- Thomas, M.D.A.; Skalny, J. Chemical resistance of concrete, Significance of tests and properties of concrete and concrete-making materials. ASTM Int. 2006, STP 169D, 253–273. [Google Scholar]
- Chávez-Ulloa, E.; Camacho-Chab, R.; Sosa-Baz, M.; Castro-Bogres, P.; Pérez-López, T. Corrosion process of reinforced concrete by carbonation in a natural environment and an accelerated test chamber. Int. J. Electrochem. Sci. 2013, 8, 9015–9029. [Google Scholar]
- Korean Standards Association. Standard Test Method for Accelerated Carbonation of Concrete KS F; Korean Standards Association: Seoul, Korea, 2010. [Google Scholar]
- Macomber, R.S. A Complete Introduction to Modern NMR Spectroscopy; John Wiley and Sons: New York, NY, USA, 1998. [Google Scholar]
- Lippmaa, E.; Mägi, M.; Samoson, A.; Engelhardt, G.; Grimmer, A.R. Structural studies of silicates by solid-state high-resolution 29Si NMR. J. Am. Chem. Soc. 1980, 102, 4889–4893. [Google Scholar] [CrossRef]
- Wieker, W.; Grimmer, A.-R.; Winkler, A.; Mägi, M.; Tarmak, M.; Lippmaa, E. Solid-state high-resolution 29Si NMR spectroscopy of synthetic 14Å, 11 and 9Å tobermorites. Cem. Concr. Res. 1982, 12, 333–339. [Google Scholar] [CrossRef]
- Korean Agency for Technology and Standards. Testing Method for Compressive Strength of Molded Concrete Cylinders KS F 2405; Korean Standards Association: Seoul, Korea, 2010.
- Korean Agency for Technology and Standards. Testing method for static modulus of elasticity and Poission′s ratio in compression of cylindrical concrete specimens KS F 2438; Korean Standards Association: Seoul, Korea, 2012.
- Korean Agency for Technology and Standards. Method of Test for Splitting Tensile Strength of Concrete KS F 2423; Korean Standards Association: Seoul, Korea, 2011.
- Mindess, S.; Young, J.F.; Darwin, D. Concrete, 2nd ed.; Pearson Education: London, UK, 2003. [Google Scholar]
Figure 1.
Carbonation test specimens and measurement points.

Figure 2.
Compressive strength vs. age.

Figure 3.
Elastic modulus vs. age.

Figure 4.
Splitting tensile strength vs. age.

Figure 5.
Carbonation test results for OPC.

Figure 6.
Carbonation test results for FA15.

Figure 7.
Carbonation test results for SF35.

Figure 8.
Carbonation test results for NS20.

Figure 9.
Carbonation depth evolution.

Figure 10.
29Si MAS NMR results: (a) OPC; (b) FA15; (c) SF35; and (d) NS20 (solid black lines are before carbonation and dashed red lines are after carbonation).
Figure 10.
29Si MAS NMR results: (a) OPC; (b) FA15; (c) SF35; and (d) NS20 (solid black lines are before carbonation and dashed red lines are after carbonation).

Figure 11.
Relationship between conversion fraction and carbonation depth.


Table 1.
The chemical compositions of Type I Ordinary Potland cement (OPC).
| Chemical Composition | w/w (%) |
|---|---|
| C3S | 54.0 |
| C2S | 21.0 |
| C3A | 11.0 |
| C4AF | 9.0 |
Table 2.
The Chemical compositions of pozzolanic materials.
| Chemical Composition | Fly Ash (FA) w/w (%) | Silica Fume (SF) w/w (%) | Nanosilica (NS) w/w (%) |
|---|---|---|---|
| Silicon dioxide (SiO2) | 61.18 | 97.38 | 98.82 |
| Aluminum oxide (Al2O3) | 19.47 | 0.37 | 0.08 |
| Iron oxide (Fe2O3) | 6.44 | 0.20 | 0.01 |
| Calcium oxide (CaO) | 4.51 | 0.41 | 0.02 |
| Magnesium oxide (MgO) | 0.07 | 0.29 | 0.0 |
| Sodium oxide (Na2O) | 2.30 | 0.17 | 0.84 |
| Potassium oxide (K2O) | 1.59 | 0.28 | 0.0 |
Table 3.
Mixture design.
| Label | W/B (%) | Unit Weight (kg/m3) | ||||||||
|---|---|---|---|---|---|---|---|---|---|---|
| Water | Cement | Fly Ash | Silica Fume | Nano Silica | Sand | Crushed Sand | Gravel | Chemical Admixture | ||
| OPC | 36.2 | 170 | 470 | - | - | - | 452 | 301 | 939 | 3.76 |
| FA15 | 36.2 | 170 | 400 | 71 | - | - | 445 | 297 | 925 | 3.76 |
| SF35 | 36.2 | 170 | 454 | - | 16 | - | 450 | 300 | 936 | 3.76 |
| NS20 | 36.2 | 170 | 461 | - | - | 9 | 448 | 299 | 931 | 3.76 |
Table 4.
Deconvoluted Intensities of Qn.
| Label | Q0 | Q1 | Q2 | Q3 | Q4 |
|---|---|---|---|---|---|
| OPC | 0.182 | 0.104 | 0.157 | 0.437 | 0.120 |
| OPC C | 0.173 | 0.076 | 0.147 | 0.466 | 0.138 |
| FA15 | 0.164 | 0.088 | 0.148 | 0.481 | 0.119 |
| FA15 C | 0.098 | 0.053 | 0.129 | 0.527 | 0.192 |
| SF35 | 0.203 | 0.104 | 0.155 | 0.398 | 0.141 |
| SF35 C | 0.182 | 0.086 | 0.169 | 0.455 | 0.109 |
| NS20 | 0.218 | 0.096 | 0.147 | 0.448 | 0.091 |
| NS20 C | 0.182 | 0.087 | 0.161 | 0.469 | 0.101 |
Table 5.
Difference in Qn after Carbonation.
| Label | Q0 | Q1 | Q2 | Q3 | Q4 |
|---|---|---|---|---|---|
| OPC | −0.009 | −0.028 | −0.01 | 0.029 | 0.018 |
| FA15 | −0.066 | −0.035 | −0.019 | 0.046 | 0.073 |
| SF35 | −0.021 | −0.018 | 0.014 | 0.057 | −0.032 |
| NS20 | −0.036 | −0.009 | 0.014 | 0.021 | 0.01 |
© 2020 by the authors. Licensee MDPI, Basel, Switzerland. This article is an open access article distributed under the terms and conditions of the Creative Commons Attribution (CC BY) license (http://creativecommons.org/licenses/by/4.0/).
Share and Cite
MDPI and ACS Style
Kim, J.J.; Youm, K.-S.; Moon, J. A Study on Conversion Fraction and Carbonation of Pozzolan Blended Concrete through 29Si MAS NMR Analysis. Appl. Sci. 2020, 10, 6855. https://0-doi-org.brum.beds.ac.uk/10.3390/app10196855
AMA Style
Kim JJ, Youm K-S, Moon J. A Study on Conversion Fraction and Carbonation of Pozzolan Blended Concrete through 29Si MAS NMR Analysis. Applied Sciences. 2020; 10(19):6855. https://0-doi-org.brum.beds.ac.uk/10.3390/app10196855
Chicago/Turabian StyleKim, Jung J., Kwang-Soo Youm, and Jiho Moon. 2020. "A Study on Conversion Fraction and Carbonation of Pozzolan Blended Concrete through 29Si MAS NMR Analysis" Applied Sciences 10, no. 19: 6855. https://0-doi-org.brum.beds.ac.uk/10.3390/app10196855
Note that from the first issue of 2016, this journal uses article numbers instead of page numbers. See further details here.