Article

The Effect of Gasification Conditions on the Surface Properties of Biochar Produced in a Top-Lit Updraft Gasifier

1
Department of Biological and Agricultural Engineering, North Carolina State University, Raleigh, NC 27695, USA
2
Department of Mechanical Engineering, Universidad Tecnológica de Panamá, Apartado 0819-07289, El Dorado 0819, Panama
3
College of Energy, Xiamen University, Xiamen 361102, Fujian, China
4
Department of Biological and Agricultural Engineering, Kansas State University, Manhattan, KS 66506, USA
5
Department of Biosystems and Agricultural Engineering, Oklahoma State University, Stillwater, OK 74078, USA
*
Author to whom correspondence should be addressed.
Submission received: 4 November 2019 / Revised: 2 January 2020 / Accepted: 10 January 2020 / Published: 19 January 2020
(This article belongs to the Special Issue Biochar: Productions, Properties and Applications)

Abstract

:
The effect of airflow rate, biomass moisture content, particle size, and compactness on the surface properties of biochar produced in a top-lit updraft gasifier was investigated. Pine woodchips were studied as the feedstock. The carbonization airflow rates from 8 to 20 L/min were found to produce basic biochars (pH > 7.0) that contained basic functional groups. No acid functional groups were presented when the airflow increased. The surface charge of biochar at varying airflow rates showed that the cation exchange capacity increased with airflow. The increase in biomass moisture content from 10 to 14% caused decrease in the pH from 12 to 7.43, but the smallest or largest particle sizes resulted in low pH; therefore, the carboxylic functional groups increased. Similarly, the biomass compactness exhibited a negative correlation with the pH that reduced with increasing compactness level. Thus, the carboxylic acid functional groups of biochar increased from 0 to 0.016 mmol g−1, and the basic functional group decreased from 0.115 to 0.073 mmol g−1 when biomass compactness force increased from 0 to 3 kg. BET (Brunauer-Emmett-Teller) surface area of biochar was greater at higher airflow and smaller particle size, lower moisture content, and less compactness of the biomass.

1. Introduction

Biochar can be produced from a wide variety of organic materials [1]. This carbon rich substance can be used in various applications such as carbon sequestration, soil conditioning, and filtration of pollutants from aqueous and gas media [2,3,4,5]. Initiatives to investigate new ways to produce biochar have been implemented in many parts of the globe [1,6,7,8]. However, to date, slow pyrolysis is still the most known method for biochar production that is characterized by the thermal conversion of biomass in an oxygen-free atmosphere [9,10]. This process can take place at temperatures between 350 °C and 700 °C [1]. The operational parameters and biomass type/properties play an important role in the surface chemistry of biochar. Extensive work has been carried out in the evaluation of pyrolysis systems for the production of biochar with specific properties [1,11,12,13]. For example, Bagreev [14] characterized biochar from sewage sludge. It was reported that chemical modification induced by the variation of temperature caused modification to the chemical composition of the biochar that was initially identified by an increase in pH. Similarly, Mukherjee [15] observed that the properties of biochar can drastically vary when comparing freshly produced biochar with aged biochar.
Biomass gasification has also been demonstrated as an alternative method to produce biochar [16]. However, common gasification processes produce little biochar compared to the amount of gases generated [8]. Consequently, there is insufficient literature on the characterization of the surface chemistry of this biochar. Top-lit updraft (TLUD) gasification is believed to have potential for biochar production because of its relatively high yield of biochar (up to 39%) with relatively low energy input [17,18]. Despite all of this, there is not sufficient literature focused on the surface chemistry and the effect of the operational parameters and physical properties of the biomass in TLUD gasification produced biochars. The characterization of biochars from TLUD gasification can be a major indicator of the possible applications for the produced biochar [2].
The objective of this work was to investigate the effect of airflow rate, moisture content, particle size, and biomass compactness on the surface properties of pine wood biochar produced in a TLUD gasifier. The basic and acid functional groups were measured and correlated with the reaction temperature to identify variations of biochar surface chemistry related to operational conditions. The elemental composition of the biochar was evaluated as an indicator of the overall level of oxidation as a result of the incomplete combustion of biomass. The surface charge of biochar at varying airflow rates was also investigated.

2. Materials and Methods

Pine woodchips were gasified in a TLUD gasifier to generate biochar at different airflow rates (8, 12, 16, and 20 L/min) as described by James [16]. Briefly, the gasification unit mainly consisted of a 152-cm-high black iron tube with 10.1-cm diameter, which was loaded and ignited from the top and air was injected from the bottom, and the pyrolysis front started moving downward leaving biochar on the top and producing syngas. Once the peak reaction temperature was sensed by the bottom thermocouple, the reaction was complete and stopped. Then, biochar was then collected and analyzed after cooling. Biochar produced at 20 L/min under different biomass physical properties was also evaluated, e.g., with varying particle sizes (from 2 to 30 mm), moisture contents (from 10 to 22%), and biomass compactness (from 0 to 3 kg), as presented in James [19]. The pH of the biochar samples was determined by mixing 0.4 g of biochar in 20 mL of de-ionized water for 8 h [14,20]. The resulting solution was filtered with Whatman® filter paper (Qualitative #1) to remove large particles of biochar. Then, the final solution was filtered with nylon filters (0.2 µm). The pH of the solution was measured using a bench pH meter (Model: UltraBasic U-10, Denver Instruments, Bohemia, NY, USA). The Boehm titration method was implemented to determine the surface functional groups of the biochar [21]. Four solutions (NaHCO3, Na2CO3, NaOH, and HCl) of 0.05 M were prepared. Fifty ml of each solution was mixed individually with 1 g of biochar for 24 h. The final solutions were filtered using the same filtration method as the pH analysis. Finally, the solutions were titrated with HCl (bases) or NaOH (acid) solutions using methyl orange and phenolphthalein indicators, respectively. The elemental analysis of biomass and biochar samples was determined using a CHNS/O (carbon, hydrogen, nitrogen, sulfur and oxygen) elemental analyzer (PerkinElmer 2400, Branford, CT, USA). Capsules of two grams of each sample were prepared with a tin capsule standard (PerkinElmer Mod. Pk96 N2411255). The resulting capsules were placed in the analyzer by the autosampler. The elemental composition of the pine woodchips was 47.90% carbon, 1.70% hydrogen, 0.30% nitrogen, 0.20% sulfur, and 49.90% oxygen (calculated by difference) with an ash content of 0.57% [19].
The specific surface area of the biochars was calculated by the BET ((Brunauer-Emmett-Teller)) analysis technique that evaluates the isothermal nitrogen adsorption/desorption at −196 °C [22]. The samples were degassed for 12 h at 250 °C under vacuum before BET analysis. The anion exchange capacity (AEC) of the biochar samples was determined according to Lawrinenko [23]. One gram of biochar was mixed with 40 mL of de-ionized water and 2 mL of KBr (1 M) for 48 h. Then, the biochar residue was filtered with Whatman® filter paper (Qualitative #1) and rinsed to achieve 5 µS conductivity (Model: HI 9813-6, Hanna Instruments, Ann Arbor, MI, USA). Next, 2 mL of CaCl2 (2.5 M) was added to the biochar slurry and mixed for 48 h. The concentrated biochar was then diluted with 200 mL of de-ionized water; 10-mL of this solution was then filtered with Target2® nylon filters (0.2 µm) and further diluted with 100 mL of di-ionized water. Bromide was detected from the final solution using an Ion Chromatograph (Dionex 500, Thermo Fischer Scientific, Sunnyvale, CA, USA). The cation exchange capacity (CEC) was measured based on Kloss [24] and Dumroese [25]. Initially, 2 g of biochar and 40 mL of de-ionized water were mixed overnight. Then, the samples were filtered with Whatman® filter paper (Qualitative #1). The washed biochar was placed in a flask with 20 mL of BaCl2 (0.2 M) and mixed for 2 h. The final solution was filtered with Target2® nylon filters (0.2 µm). The concentrations of Na, K, Mg, Ca, Al, Fe and Mn were measured via Inductively-coupled Plasma-Optical Emission Spectrometer (PerkinElmer 8000, Waltham, MA, USA). AEC and CEC calculations were performed following the methods described by Coleman [26].
Statistical multiple comparison analysis was performed to compare the effect of different levels of treatments. A SAS® GLM (general linear models) procedure with a p-value < 0.1 was implemented.

3. Results and Discussion

3.1. The Effect of Airflow Rate on Biochar Surface Properties

Biochars produced at airflow rates ranging from 8 to 20 L/min were found to be mostly basic (pH > 7.0). As a result, no acidic functional groups were detected on the surface by Boehm titration characterization [19]. Table 1 presents the results of the pH and the basic functional groups of the biochar when the airflow rate increased in the TLUD gasifier. In general, lower airflow rates resulted in biochar with lower pH. However, no statistical difference in pH was found when analyzing all the biochar samples. The basic functional group of the biochar increased with the airflow rate, which significantly increased from 0.0175 to 0.115 mmol g−1. The increase in the basic functional group of the biochar was correlated with the peak temperature of the gasification layer that increased from 661 to 840 °C (R2 = 0.78). With increasing airflow, the O/C atomic ratio of biochar was significantly reduced from 0.14 to 0.1 which induced carbonization due to aromatization in which polycyclic aromatic structures were formed leading to an increase in aromatic carbon concentration [27]. Similarly, Zhu [1] performed microwave pyrolysis experiments of corn stover by increasing the reaction temperature from 550 to 650 °C. The increase in temperature caused reduction in the O/C ratio of the biochar from 0.06 to 0.04 while the H/C ratio did not change. This suggested a more aromatic-based biochar due to the increase in carbon content and reduction of oxygen (O) [4]. As a result, the basic functional groups of biochar increased.
The characterization of the biochar surface functional groups usually presents a combination of carboxylic, lactone, and phenolic acidic groups [14,20]. However, in the analysis of biochar produced at different airflow rates via TLUD gasification, no acidic functionalities were detected. This could be attributed to the fact that the carbonization of biomass in a controlled oxygen-rich atmosphere usually leads to the absence of acidic components on the surface of biochar when the reaction temperature increases [21,28]. Contrary to this, Gomez-Sarranon et al. [29] and Otake et al. [30] reported that carbon-oxygen groups of acidic characters such as lactone and anhydride can be formed on the surface of carbon materials after air oxidation. However, the temperatures used in both research work were relatively low, 250 °C and 377 °C, respectively. Otake et al. [30] suggested that the air-oxidized chars can present carboxylic acid groups based on the assumption that the hydrolysis of carboxylic anhydride occurs in aqueous solutions. This carboxylic anhydride was formed at temperatures above 650 K and carboxylic acids were only promoted at lower temperatures. Since the lowest temperature reported in the present work was 614 °C, it was likely that no acidic functional groups were formed at higher temperatures when the fixed particle size was tested. In addition, the predominant alkaline nature of the produced biochar in the present study agrees with previously reported data [31]. Boehm [21] reported that the oxidation of black carbon at 420 °C did not present acidic functional groups because of the rapid carbonization of organic materials in the presence of oxygen. The BET surface area was also found to be positively correlated with the peak temperature (R2 = 0.99) and with the basic functional group concentration of biochar (R2 = 0.73). This suggests that the increase in peak temperature not only promotes the basic functionality [31], but also enhances the porosity of the carbon-rich material [32]. Downie et al. [33] compared data of biochar produced at varying conditions, and found that the specific surface area of biochar can be enhanced by the micro-porosity. Similarly, it was found that higher reaction temperatures increased biochar porosity.
The results of the surface charge of the biochar are also presented in Table 1. The CEC of biochar from wood chips increased from 3.43 to 6.33 cmole kg−1 when the airflow rate increased from 8 to 20 L/min. This increase in the CEC of the biochar can be associated with the combustion temperature (R2 = 0.55) that increased with increasing airflow rate. Nguyen [34] carried out experiments to study the effect of carbon decomposition of oak wood biochar produced with slow pyrolysis. The carbonization temperature caused variations in the CEC of the biochar, which decreased from 13.1 to 8.9 cmole kg−1 as the temperature increased from 350 to 600 °C. The increase in CEC in biochar from top-lit updraft gasification can also be attributed to the degree of oxidation due to the partial oxidation of the biomass. For instance, Lehmann [35] stated that biochar could have higher CEC due to long-term natural oxidation. Biochar extracts from the Amazonian have been exposed to oxidation for centuries; as a result, they present high CEC that can range from 0.79 to 21.3 cmol kg−1 [36]. The use of biomass gasification for biochar production can represent more extreme oxidation of biochar that is due to thermochemical reactions. On the contrary, natural oxidation is the result of exposure to biotic and abiotic interactions [12]. In addition, the AEC of the biochar was found to significantly decrease from 1.38 to 1.01 cmol kg−1 when the airflow increased from 8 to 16 L/min, whereas it significantly increased from 1.01 to 1.59 cmol kg−1 when the airflow was further increased from 16 to 20 L/min. The increase in the AEC might be due to the increasing degree of oxidation presented by the H/C ratio reduction from 0.29 to 0.27 when the airflow increased from 16 to 20 L/min. The CEC was positively correlated with the AEC (R2 = 0.58). A similar correlation of the AEC and CEC was reported in a previous work where biochar was produced from oak wood to test the physiochemical effects of aging on biochar [15]. The results indicated that increasing the pyrolysis temperature from 250 to 650 °C caused decrease in the AEC from 4.9 to 4.5 cmol kg−1 and reduced the CEC from 39.9 to 10.2 cmol kg−1. Based on limited data available in Table 1, there existed a strong positive linear correlation between CEC and basic functional group (Functional group = 31.083CEC + 2.5018, R2 = 0.9215), but no correlation was found between AEC and functional group. Because pH was not significantly different among all airflows, the correlation was not considered pH dependent.
To compare with other techniques, Table 2 summarizes the properties of biochar from different raw materials produced via pyrolysis and TLUD gasification. It is apparent that the TLUD gasification with low reaction temperatures (small airflow) resulted in biochars of smaller BET surface area and less surface charges than those of pyrolysis biochars. However, at high airflow (20 L/min), the BET surface area of TLUD biochar was much greater than pyrolysis biochars, although surface charges were still smaller. Regardless of airflow, TLUD gasification biochar from the present study was generally more basic (with higher pH) than pyrolysis biochars. H/C and O/C ratios of the biochars were similar based on the available data.

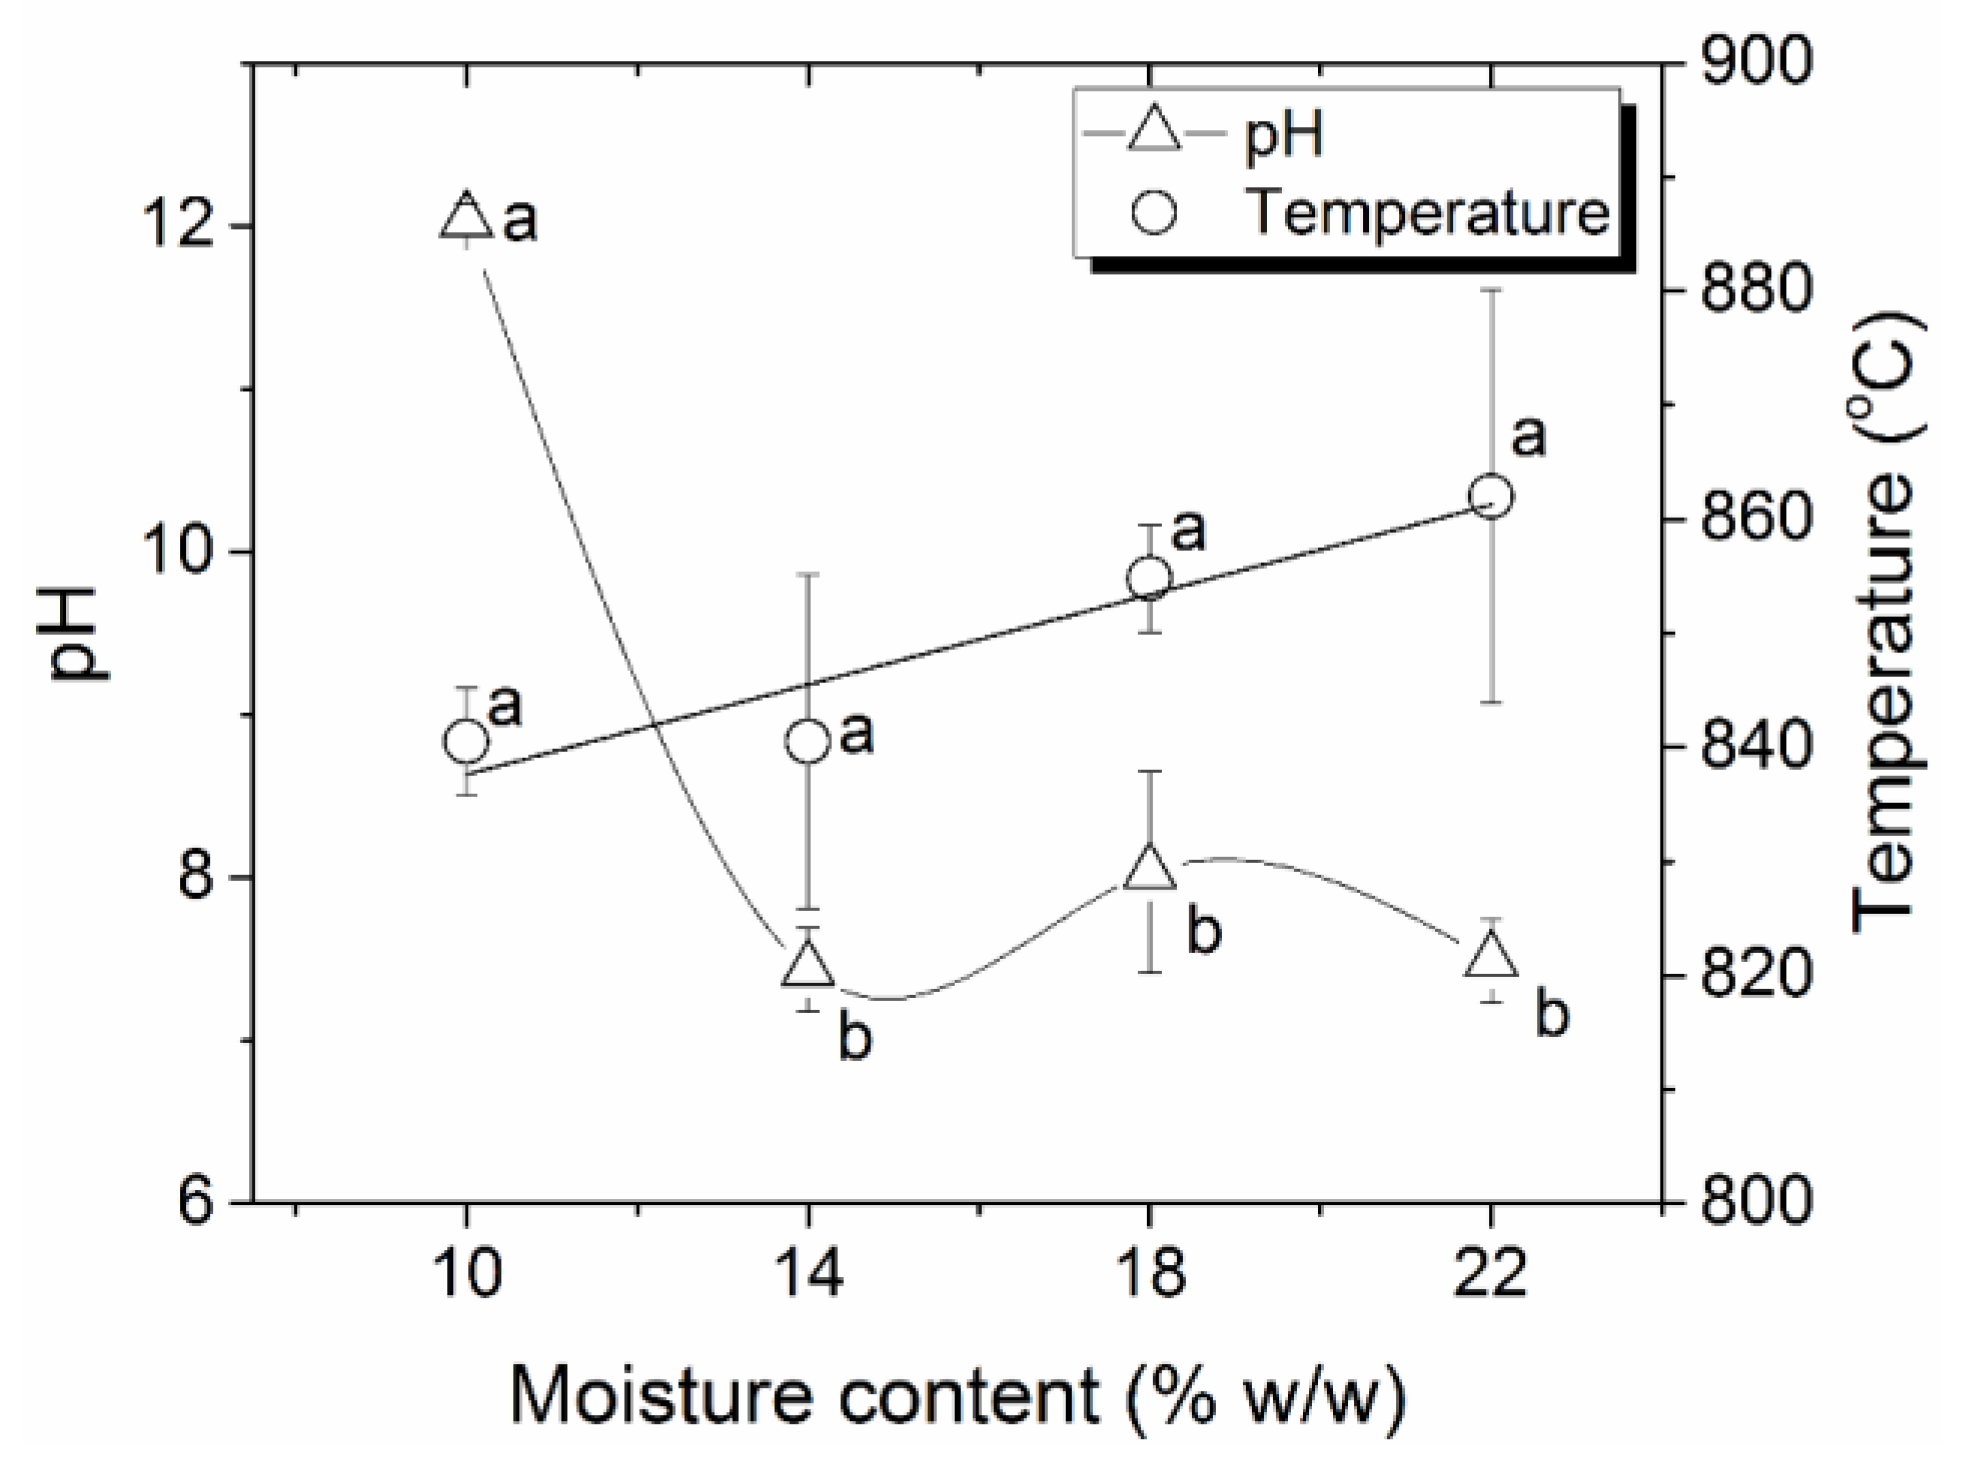
3.2. The Effect of Biomass Moisture Content on Biochar Surface Properties

The pH of the biochar was significantly reduced from 12.0 to 7.43 when the moisture content of the biomass varied from 10 to 14% (Figure 1). However, further addition of moisture did not encourage the reduction of pH of the biochar. As a result, the variation in moisture content did not show acid functional groups in the biochar. Moreover, higher moisture content resulted in more basic functional groups that significantly increased from 0.115 to 0.15 mmol g−1 (Table 3). The basic functional group exhibited a correlation with the reaction temperature (R2 = 0.66) and pH (R2 = 0.81). This effect can be associated with the fact that the O/C atomic ratio was also significantly reduced from 0.1 to 0.068 when the moisture content increased from 10 to 14%, which was also related to more aromatic compounds in the biochar [32]. The O/C atomic ratio was correlated with pH (R2 = 0.87) that increased at higher O/C ratios. In addition, the H/C ratio was also positively correlated with pH (R2 = 0.97). All of these indicate that the addition of moisture to the biomass promoted the reduction of the oxidation effect that resulted in lower pH levels. Thus, it caused an increase in the basic functional group of biochar. The BET surface area of biochar was also reduced from 405.3 m2 g−1 to 352.8 m2 g−1 because of the increase in the moisture content of the biomass (R2 = 0.84). This reduction can also be attributed to the inhibition of oxidation due to the excess of moisture.

3.3. The Effect of Biomass Particle Size on Biochar Surface Properties

Figure 2A shows that biochar from particles with 2 mm size had a pH of 1.1, which increased to 12.0 when increasing the average particle size to 7 mm. However, further increasing the particle size from 7 to 30 mm led to reduced pH from 12.0 to 2.3. Likewise, the reaction temperature was strongly positively correlated with the pH (R2 = 0.91) (Figure 2B). Therefore, the variation in particle size and temperature not only contributed to the changing pH of the biochar, but they also affected its surface chemistry because of the extreme pH levels, as presented in Table 4. The carboxylic acidic functional groups of biochar decreased from 0.012 to 0 mmol g−1 when the particle size increased from 2 to 7 mm, whereas further increasing the particle size from 7 to 30 mm caused an increase of carboxylic functional groups from 0 to 0.012 mmol g−1. Opposite to this, the basic functional group was maximum at the particle size of 7 mm and decreased to 0.012 mmol g−1 at smaller or larger particles. Acidic biochars exhibited carboxylic and basic functionalities which were correlated with the reaction temperature with R2 of 0.88 and 0.73, respectively. This was different from the airflow and moisture content experiments that only had the basic functional groups. In addition, pH was found to be correlated with the carboxylic and basic functional groups with R2 of 0.96 and 0.63, respectively.
Variations in the carbonization temperature have been observed to play an important role in the surface chemistry of biochar, and these changes can be initially identified by measuring the pH of the carbonized materials. This effect has been widely reported in the literature [11,37]. The increase in peak temperature from 657 to 840 °C when the particle size increased from 2 to 7 mm indicated an increase in the oxidation of the biomass (Figure 2B). This degree of oxidation can be observed in the decrease of the H/C atomic ratio from 0.35 to 0.27 that suggested a decrease in polar functional groups (e.g., carboxylic) [1]. Likewise, it was evident that the acidic condition of the biochar was not achieved at 7 mm particle size (pH = 12.04). In the opposite way, the increase in particle size from 7 to 30 mm resulted in lower peak temperatures from 840 to 614 °C. Consequently, the carboxylic functional group increased, and the H/C ratio raised from 0.27 to 0.54 which was also correlated with the reaction temperature (R2 = 0.72). Likewise, the reaction temperature was correlated with the BET surface area (R2 = 0.88, which was reduced from 405.3 to 6.2 m2 g−1 as the average particle size increased from 7 to 30 mm (Table 4). Similar behavior on the surface chemistry was reported by Kim et al. [4] who prepared biochar for aqueous metal removal experiments. The results showed that, as reaction temperature decreased from 600 to 300 °C, the pH of the biochar was reduced from 10 to 8.2. Thus, the H/C ratio of the biochar increased from 0.3 to 0.96. Overall, it was observed that larger biomass particles promoted a higher level of aromatization since the O/C ratio decreased from 0.11 to 0.09. This can be attributed to the increased density of individual particles since the oxidation reactions are limited to the external surface of the biochar particles [38].

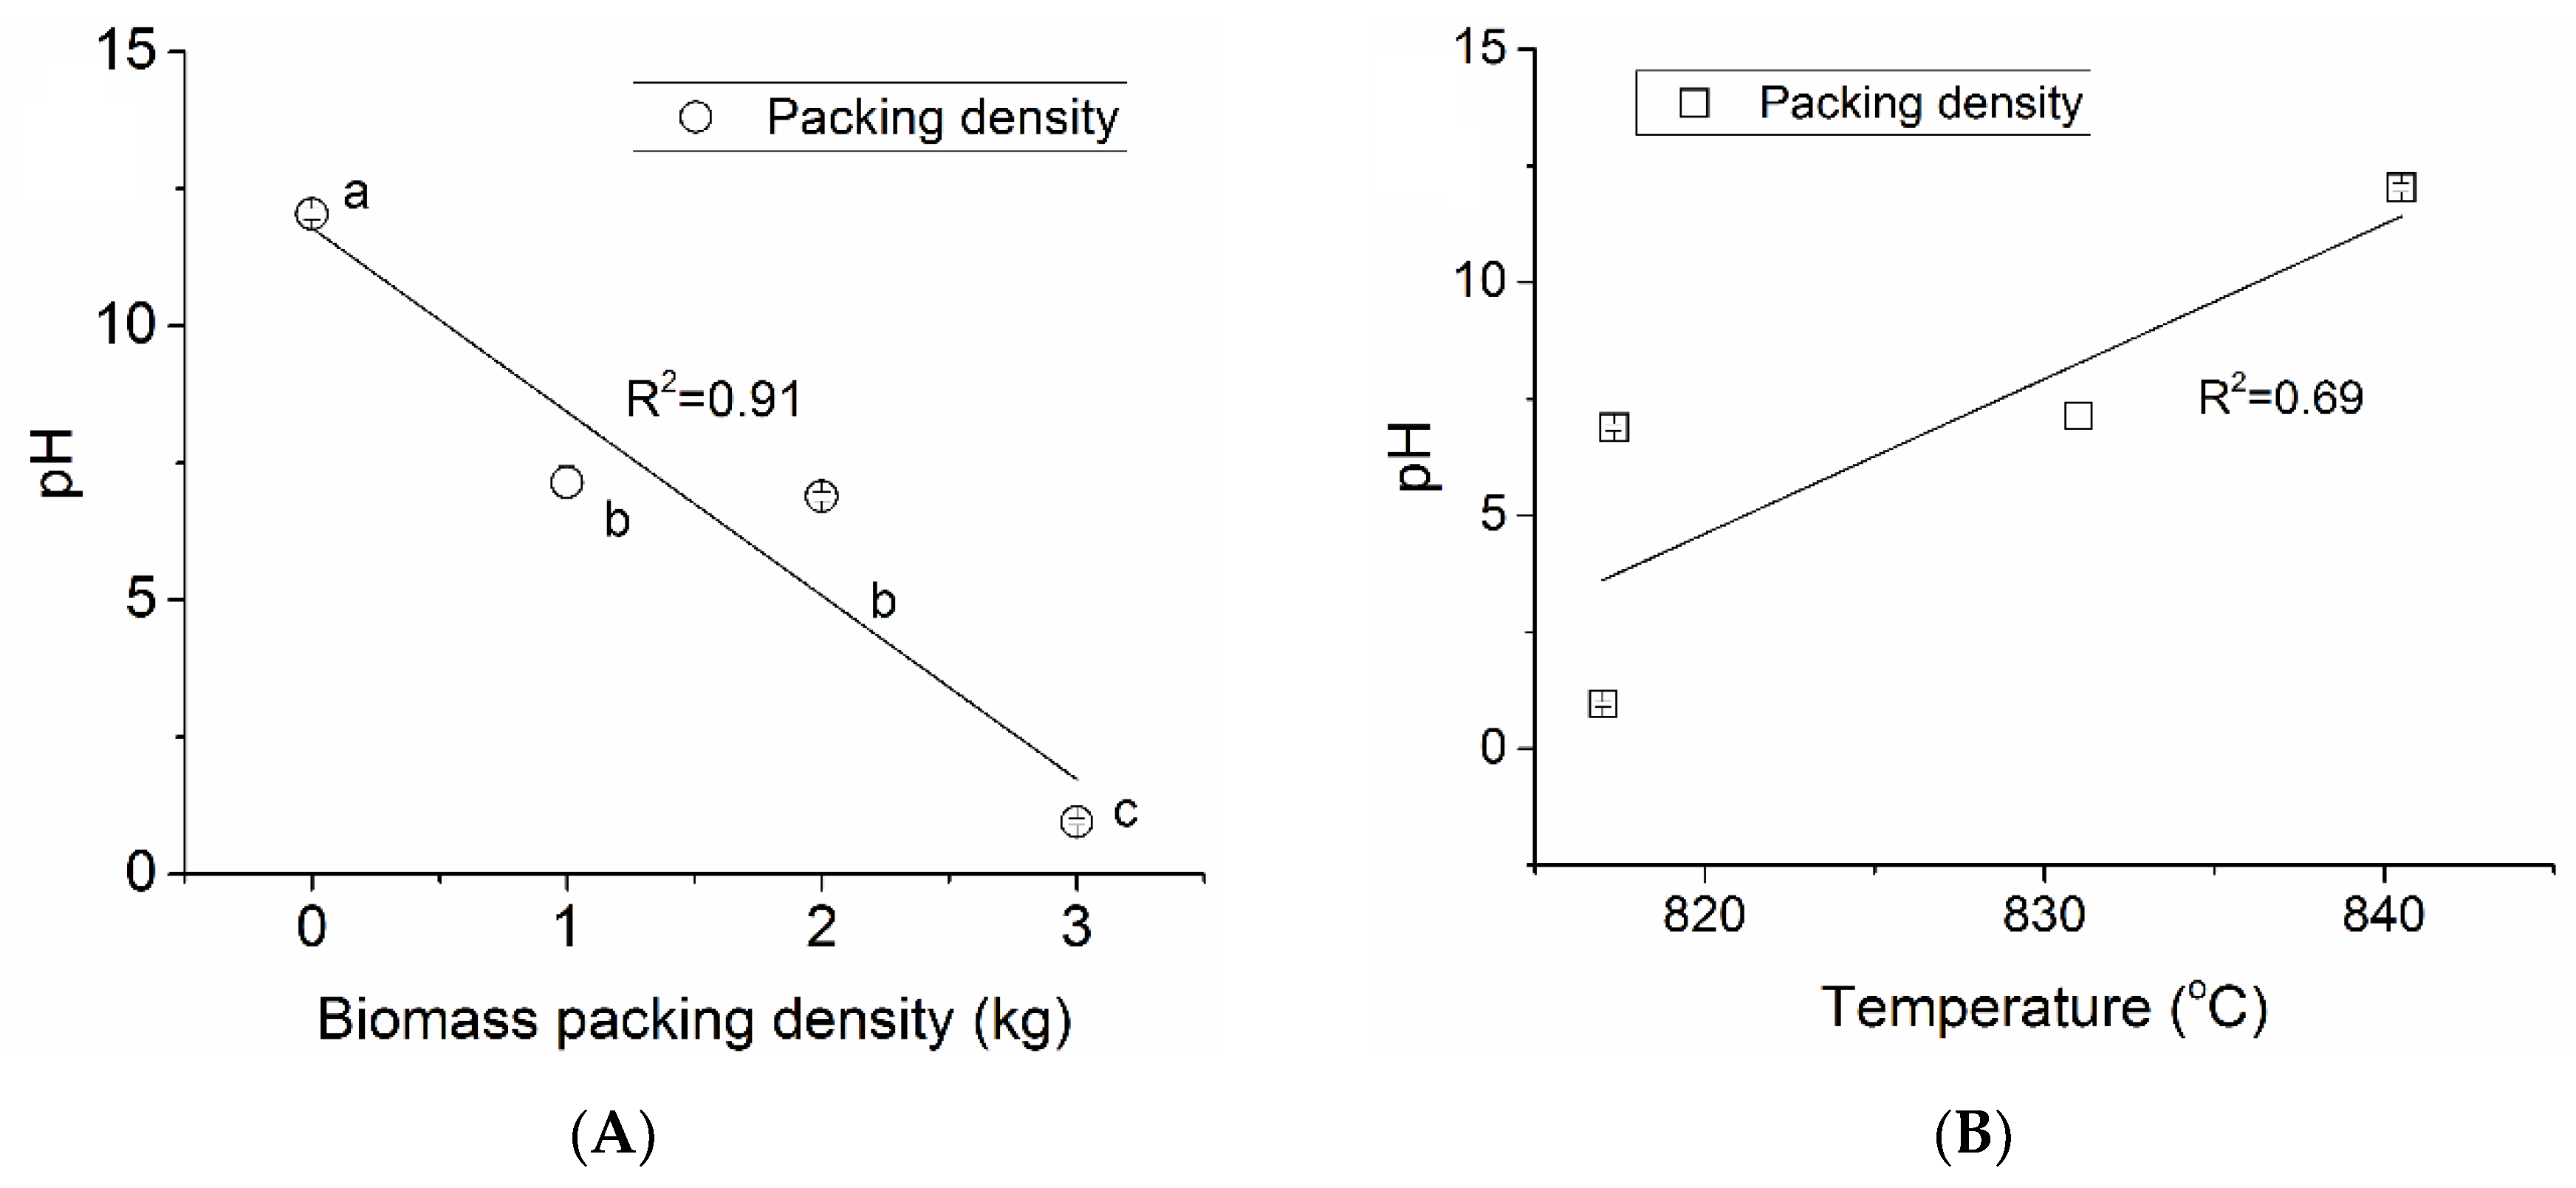
3.4. The Effect of Biomass Compactness on Biochar Surface Chemistry

Figure 3A shows the correlation between pH and biomass compactness (R2 = 0.91). As the biomass compactness increased from 0 to 3 kg, the pH of the biochar decreased from 12.0 to 0.95. The reaction temperature was positively correlated with pH (R2 = 0.69), Figure 3B. As a result, it was found that the carboxylic functional groups of the biochar increased from 0 to 0.016 mmol g−1, while the formation of basic functional groups was surpassed from 0.115 to 0.073 mmol g−1 (Table 5). The variation in individual functional groups of biochar was highly correlated with reaction temperature and pH. The carboxylic and basic functional groups showed R2 of 0.91 and 0.95, respectively, as the reaction temperature increased. Similarly, pH was correlated with the carboxylic and basic functional groups with R2 of 0.85 and 0.87, respectively. The increase in biomass compactness meant that more biomass was available per unit volume within the TLUD gasifier. Consequently, relatively less air was available for the incomplete oxidation reactions, which resulted in lower reaction temperatures that led to a decrease in BET surface area (from 405.3 to 191.8 m2 g−1). The change in the proportion of biomass relative to the available oxygen can also be observed in the O/C ratio that was significantly reduced from 0.1 to 0.063 when the biomass was compacted from 0 to 1 kg. The reduction in the O/C ratio indicated that the reactions were driven in a less oxidative atmosphere. Moreover, further compacting the biomass (>2 kg) did not significantly affect the O/C ratio, which could be attributed to an insignificant change in the peak reaction temperature. The decrease in O/C ratio in biomass pyrolysis processes represents carbonization due to aromatization and dehydrogenation reactions that commonly occur due to changes in the reaction temperature [4]. Therefore, in the TLUD gasification process, the decrease in biochar O/C ratio might be further encouraged by the reduced oxygen relative to the amount of biomass.
In previous studies, TLUD gasification was demonstrated as a feasible alternative method for biochar production under varying reaction conditions and biomass physical properties [16,19]. The yield of pine woodchips biochar varied from 16.2 to 27.1% when the airflow increased from 8 to 20 L/min [16]. Biomass particle size (2 to 30 mm), moisture content (10 to 22%), and compactness (0 to 3 kg) also showed significant impacts on biochar yield, which ranged from 12.2 to 21.8%, 9.9 to 12.0%, and 12.2 to 17.0%, respectively [19]. The production of biochar through biomass TLUD gasification presents a potential implementation for making activated carbon and catalyst support. This is because the high degree of oxidation that under specific gasification conditions could lead to carboxylic biochars. In addition, the manipulation of surface characteristics of biochar linked to the operational conditions and biomass properties could produce biochars for different applications, such as wastewater treatment, soil amendment, and heat and power generation.

4. Conclusions

The effect of operational parameters and biomass physical properties on biochar surface properties was investigated. When the airflow rate increased, the BET surface area and basic functional groups of biochar also increased due to increases in reaction temperature, but no acidic functional groups were observed because of the oxidative nature of the process. The CEC of biochar also increased when the airflow rate increased, driven by a higher degree of oxidation in the top-lit updraft gasifier. The variations in the physical properties of the biomass were found to significantly affect the surface chemistry of the biochar. The increase in moisture content resulted in lower biochar pH and small BET surface area due to reduced oxidative effects in the reactor. Furthermore, the increase in woodchip particle size reduced the BET surface area of biochar and initially increased the pH of biochar, but further increase in particle size above 7 mm caused lower pH. As a result, the carboxylic functional groups reduced when the particle size increased to 7 mm, but increased for larger particles. The basic functional groups had an opposite trend versus particle size. Likewise, the increase in biomass compactness caused a decrease in the pH and smaller BET surface area of biochar because of less available air for combustion relative to the amount of biomass in the gasifier chamber, which caused less aggressive oxidation. Therefore, increase in compactness increased the carboxylic functional groups and reduced the basic functional groups.

Author Contributions

The manuscript was written through contributions of all authors. A.M.J.R and W.Y. conceptualized the experiments and wrote the manuscript. A.M.J.R., D.W. (Duo Wang), D.W. (Donghai Wang), and A.K. performed the experiments of physical and chemical properties, and proofread the manuscript. W.Y., D.W. (Donghai Wang), and A.K. were awarded funds to carry out this project. All authors have read and agreed to the published version of the manuscript.

Funding

This material was based upon the work supported by the U.S. National Science Foundation, Grant No. 1462732, the USDA National Institute of Food and Agriculture, Hatch project number NC02613, and the USDA National Institute of Food and Agriculture, Grant No. 12690802. The lead author was also partially supported by the SNI (Sistema Nacional de Investigación, in Spanish) funded by the SENACYT (National Bureau of Science, Technology and Innovation) from the Government of Panama.

Acknowledgments

We thank Praveen Kolar and Brian Jackson at North Carolina State University for the access to their labs to perform the surface chemical analyses of the biochar samples.

Conflicts of Interest

The authors declare no conflict of interest.

References

  1. Zhu, L.; Lei, H.; Wang, L.; Yadavalli, G.; Zhang, X.; Wei, Y.; Liu, Y.; Yan, D.; Chen, S.; Ahring, B. Biochar of corn stover: Microwave-assisted pyrolysis condition induced changes in surface functional groups and characteristics. J. Anal. Appl. Pyrolysis 2015, 115, 149–156. [Google Scholar] [CrossRef] [Green Version]
  2. Ahmad, M.; Rajapaksha, A.U.; Lim, J.E.; Zhang, M.; Bolan, N.; Mohan, D.; Vithanage, M.; Lee, S.S.; Ok, Y.S. Biochar as a sorbent for contaminant management in soil and water: A review. Chemosphere 2014, 99, 19–33. [Google Scholar] [CrossRef]
  3. Cheng, C.-H.; Lehmann, J.; Engelhard, M.H. Natural oxidation of black carbon in soils: Changes in molecular form and surface charge along a climosequence. Geochim. Cosmochim. Acta 2008, 72, 1598–1610. [Google Scholar] [CrossRef]
  4. Kim, W.-K.; Shim, T.; Kim, Y.-S.; Hyun, S.; Ryu, C.; Park, Y.-K.; Jung, J. Characterization of cadmium removal from aqueous solution by biochar produced from a giant Miscanthus at different pyrolytic temperatures. Bioresour. Technol. 2013, 138, 266–270. [Google Scholar] [CrossRef]
  5. Wang, Q.; Wang, B.; Lee, X.; Lehmann, J.; Gao, B. Sorption and desorption of Pb(II) to biochar as affected by oxidation and pH. Sci. Total Environ. 2018, 634, 188–194. [Google Scholar] [CrossRef] [Green Version]
  6. Brewer, C.E.; Schmidt-Rohr, K.; Satrio, J.A.; Brown, R.C. Characterization of biochar from fast pyrolysis and gasification systems. Environ. Prog. Sustain. Energy 2009, 28, 386–396. [Google Scholar] [CrossRef]
  7. Kim, K.H.; Kim, J.Y.; Cho, T.S.; Choi, J.W. Influence of pyrolysis temperature on physicochemical properties of biochar obtained from the fast pyrolysis of pitch pine (Pinus rigida). Bioresour. Technol. 2012, 118, 158–162. [Google Scholar] [CrossRef]
  8. Qian, K.; Kumar, A.; Patil, K.; Bellmer, D.; Wang, D.; Yuan, W.; Huhnke, R.L. Effects of biomass feedstocks and gasification conditions on the physiochemical properties of char. Energies 2013, 6, 3972–3986. [Google Scholar] [CrossRef]
  9. Brick, S.; Lehmann, J.; Kramer, J. Biochar: Assessing the Promise and Risks to Guide US Policy Author. Available online: http://www.nrdc.org/energy/files/biochar_paper.Pdf (accessed on 30 July 2019).
  10. Jameel Keshwani, D.R.; Carter, S.; Treasure, T.H.; Cheng, J.H. Thermochemical conversion of biomass to power and fuels. Biomass Renew. Energy Process. 2010, 10, 437–487. [Google Scholar]
  11. Mukherjee, A.; Zimmerman, A.R.; Harris, W. Surface chemistry variations among a series of laboratory-produced biochars. Geoderma 2011, 163, 247–255. [Google Scholar] [CrossRef]
  12. Cheng, C.-H.; Lehmann, J.; Thies, J.E.; Burton, S.D.; Engelhard, M.H. Oxidation of black carbon by biotic and abiotic processes. Org. Geochem. 2006, 37, 1477–1488. [Google Scholar] [CrossRef]
  13. Moreno-Castilla, C.; López-Ramón, M.; Carrasco-Marín, F. Changes in surface chemistry of activated carbons by wet oxidation. Carbon 2000, 38, 1995–2001. [Google Scholar] [CrossRef]
  14. Bagreev, A.; Adib, F.; Bandosz, T.J. pH of activated carbon surface as an indication of its suitability for H2S removal from moist air streams. Carbon 2001, 39, 1897–1905. [Google Scholar] [CrossRef]
  15. Mukherjee, A.; Zimmerman, A.R.; Hamdan, R.; Cooper, W.T. Physicochemical changes in pyrogenic organic matter (biochar) after 15 months of field aging. Solid Earth 2014, 5, 693–704. [Google Scholar] [CrossRef] [Green Version]
  16. James, R.A.M.; Yuan, W.; Boyette, M.D.; Wang, D. Airflow and insulation effects on simultaneous syngas and biochar production in a top-lit updraft biomass gasifier. Renew. Energy 2018, 117. [Google Scholar] [CrossRef]
  17. Huangfu, Y.; Li, H.; Chen, X.; Xue, C.; Chen, C.; Liu, G. Effects of moisture content in fuel on thermal performance and emission of biomass semi-gasified cookstove. Energy Sustain. Dev. 2014, 21, 60–65. [Google Scholar] [CrossRef]
  18. Nsamba, H.K.; Hale, S.E.; Cornelissen, G.; Bachmann, R.T.; Nsamba, H.K.; Hale, S.E.; Cornelissen, G.; Bachmann, R.T. Improved Gasification of Rice Husks for Optimized Biochar Production in a Top Lit Updraft Gasifier. J. Sustain. Bioenergy Syst. 2014, 4, 225–242. [Google Scholar] [CrossRef] [Green Version]
  19. James R., A.; Yuan, W.; Boyette, M. The Effect of Biomass Physical Properties on Top-Lit Updraft Gasification of Woodchips. Energies 2016, 9, 283. [Google Scholar] [CrossRef] [Green Version]
  20. Das, L.; Kolar, P.; Classen, J.J.; Osborne, J.A. Adsorbents from pine wood via K2CO3-assisted low temperature carbonization for adsorption of p-cresol. Ind. Crop. Prod. 2013, 45, 215–222. [Google Scholar] [CrossRef]
  21. Boehm, H.P. Chemical Identification of Surface Groups. Adv. Catal. 1966, 16, 179–274. [Google Scholar]
  22. Brunauer, S.; Emmett, P.H.; Teller, E. Adsorption of Gases in Multimolecular Layers. J. Am. Chem. Soc. 1938, 60, 309–319. [Google Scholar] [CrossRef]
  23. Lawrinenko, M.; Laird, D.A. Anion exchange capacity of biochar. Green Chem. 2015, 17, 4628–4636. [Google Scholar] [CrossRef] [Green Version]
  24. Kloss, S.; Zehetner, F.; Dellantonio, A.; Hamid, R.; Ottner, F.; Liedtke, V.; Schwanninger, M.; Gerzabek, M.H.; Soja, G. Characterization of Slow Pyrolysis Biochars: Effects of Feedstocks and Pyrolysis Temperature on Biochar Properties. J. Environ. Qual. 2012, 41, 990–1000. [Google Scholar] [CrossRef] [PubMed]
  25. Dumroese, R.K.; Heiskanen, J.; Englund, K.; Tervahauta, A. Pelleted biochar: Chemical and physical properties show potential use as a substrate in container nurseries. Biomass Bioenergy 2011, 35, 2018–2027. [Google Scholar] [CrossRef]
  26. Coleman, N.T.; Weed, S.B.; McCracken, R.J. Cation-Exchange Capacity and Exchangeable Cations in Piedmont Soils of North Carolina1. Soil Sci. Soc. Am. J. 2010, 23, 146–149. [Google Scholar] [CrossRef]
  27. Shafizadeh, F.; Sekiguchi, Y. Development of aromaticity in cellulosic chars. Carbon 1983, 21, 511–516. [Google Scholar] [CrossRef]
  28. Banik, C.; Lawrinenko, M.; Bakshi, S.; Laird, D.A. Impact of pyrolysis temperature and feedstock on surface charge and functional group chemistry of biochars. J. Environ. Qual. 2018, 47, 452–461. [Google Scholar] [CrossRef] [Green Version]
  29. Gómez-Serrano, V.; Piriz-Almeida, F.; Durán-Valle, C.J.; Pastor-Villegas, J. Formation of oxygen structures by air activation. A study by FT-IR spectroscopy. Carbon 1999, 37, 1517–1528. [Google Scholar]
  30. Otake, Y.; Jenkins, R.G. Characterization of oxygen-containing surface complexes created on a microporous carbon by air and nitric acid treatment. Carbon 1993, 31, 109–121. [Google Scholar] [CrossRef]
  31. Al-Wabel, M.I.; Al-Omran, A.; El-Naggar, A.H.; Nadeem, M.; Usman, A.R.A. Pyrolysis temperature induced changes in characteristics and chemical composition of biochar produced from conocarpus wastes. Bioresour. Technol. 2013, 131, 374–379. [Google Scholar] [CrossRef]
  32. Sun, Y.; Gao, B.; Yao, Y.; Fang, J.; Zhang, M.; Zhou, Y.; Chen, H.; Yang, L. Effects of feedstock type, production method, and pyrolysis temperature on biochar and hydrochar properties. Chem. Eng. J. 2014, 240, 574–578. [Google Scholar] [CrossRef]
  33. Downie, A.; Crosky, A.; Munroe, P. Physical Properties of Biochar. In Biochar for Environmental Management Science and Technology; Johannes, L., Stephen, J., Eds.; Earthscan: London, UK, 2012; pp. 45–64. ISBN 9781849770552. [Google Scholar]
  34. Nguyen, B.T.; Lehmann, J. Black carbon decomposition under varying water regimes. Org. Geochem. 2009, 40, 846–853. [Google Scholar] [CrossRef]
  35. Lehmann, J. Bio-energy in the black. Front. Ecol. Environ. 2007, 5, 381–387. [Google Scholar] [CrossRef] [Green Version]
  36. Liang, B.; Lehmann, J.; Solomon, D.; Kinyangi, J.; Grossman, J.; O’Neill, B.; Skjemstad, J.O.; Thies, J.; Luizão, F.J.; Petersen, J.; et al. Black Carbon Increases Cation Exchange Capacity in Soils. Soil Sci. Soc. Am. J. 2006, 70, 1719–1730. [Google Scholar] [CrossRef] [Green Version]
  37. Bagreev, A.; Bandosz, T.J.; Locke, D.C. Pore structure and surface chemistry of adsorbents obtained by pyrolysis of sewage sludge-derived fertilizer. Carbon 2001, 39, 1971–1979. [Google Scholar] [CrossRef]
  38. Bryden, K.M.; Ragland, K.W. Combustion of a Single Wood Log Under Furnace Conditions. In Developments in Thermochemical Biomass Conversion; Springer Link: Madison, WI, USA, 1997. [Google Scholar]
Figure 1. The pH and reaction temperature of biochar produced under varying biomass moisture contents (airflow 20 L/min, particle size 7 mm, and biomass compactness 0 kg). Different letters represent significant different level at 10%.
Applsci 10 00688 g001
Figure 2. (A) pH of biochar produced from wood chips with varying particle sizes (airflow 20 L/min, moisture content 10%, and biomass compactness 0 kg), and (B) the correlation between pH and reaction temperature. Different letters represent significant difference level at 10%.
Applsci 10 00688 g002
Figure 3. (A) pH of biochar from wood chips produced at varying biomass compactness (airflow 20 L/min, moisture content 10%, particle size 7 mm), and (B) the correlation between pH and reaction temperature. Different letters represent significant difference level at 10%.
Applsci 10 00688 g003
Table 1. Chemical properties of biochar from wood chips at varying airflows (moisture content 10%, average particle size 7 mm, and biomass compactness 0 kg). BET: Brunauer-Emmett-Teller; CEC: Cation Exchange Capacity; AEC: anion exchange capacity.
Airflow (L/min)Peak Temperature (°C)pH of BiocharBasic Functional Groups mmol g−1AECCECBET Surface Area m2 g−1Atomic Ratio
cmol kg−1cmol kg−1 H/CO/C
8661.33 d10.39 a0.0175 c1.38 a3.43 b56.00.27 a0.14 a
12743.00 c11.99 a0.02 c1.03 b3.03 b239.20.26 a0.10 b
16798.33 b10.49 a0.0625 b1.01 b3.90 b319.40.29 a0.10 b
20840.50 a12.04 a0.115 a1.59 a6.33 a405.30.27 a0.10 b
Different superscripts represent significant differences in the order of a > b > c > d.
Table 2. Properties of biochars produced under different conversion methods. BET: Brunauer-Emmett-Teller; CEC: Cation Exchange Capacity; AEC: anion exchange capacity; TLUD: Top-lit Updraft.
Conversion MethodBiomass TypeReaction Temp. (°C)BET Surface Area (m2/g)pHSurface Charge cmol Kg−1H/CO/CRef.
CECAEC
PyrolysisPine6502857114.5N/AN/A[11]
PyrolysisOak6501848.618.4N/AN/A0.3[15]
PyrolysisCorn stover700N/A109.050.29N/A[28]
PyrolysisRed oak600N/A109.82.60.31N/A[28]
TLUD gasificationPine66156.010.393.431.380.270.14*
TLUD gasificationPine840.50405.312.546.331.590.270.10**
N/A—value not available in the reference; * results of this study at 8 L/min, particle size 7 mm, 10% moisture content, not compacted biomass; ** results of this study at 20 L/min, particle size 7 mm, 10% moisture content, not compacted biomass.
Table 3. Atomic ratios and basic functional groups of biochar from pine woodchips produced at varying biomass moisture contents. BET: Brunauer-Emmett-Teller.
Moisture Content (%)Basic Functional Groups
(mmol g−1)
BET Surface AreaAtomic Ratios
(m2 g−1)H/CO/C
100.115 c405.30.271 a0.100 a
140.135 b380.30.200 a0.068 b
180.137 a-b384.00.200 a0.065 b
220.150 a352.80.186 a0.075 b
Different superscripts represent significant differences in the order of a > b > c.
Table 4. Chemical properties of biochar from wood chips produced with varying particle sizes. BET: Brunauer-Emmett-Teller.
Avg. Particle Size (mm)Functional GroupsBET Surface AreaAtomic Ratios
Carboxylic (mmol g−1)Basic (mmol g−1)(m2 g−1)H/CO/C
20.012 a0.059 bN/A *0.356 a-b0.113 a
70 b0.115 a405.30.271 b0.100 a
170.011 a-b0.026 c50.90.382 a-b0.070 b
300.012 a0.012 c6.20.545 a0.088 a-b
N/A—Not Available. * BET surface area analysis was not performed due to high tar content in the biochar. Different superscripts represent significant differences in the order of a > b > c.
Table 5. Chemical properties of biochar from wood chips produced with varying biomass compactness. BET: Brunauer-Emmett-Teller.
Biomass Compactness
(kg)
Functional GroupsBET Surface AreaAtomic Ratios
Carboxylic (mmol g−1)Basic (mmol g−1)m2 g−1H/CO/C
00 b0.115 a405.30.271 a-b0.100 a
10.004 b0.093 a266.70.246 b0.063 b
20.011 a-b0.081 a281.90.248 a-b0.067 b
30.016 a0.073 a191.80.331 a0.070 b
Different superscripts represent significant differences in the order of a > b.

