Use of Smart Technology to Improve Management of Utility Tunnels


1
School of Civil Engineering, Tongji University, Shanghai 200092, China
2
Laboratoire de Génie Civil et géo-Environnement, Université de Lille, 59000 Lille, France
*
Author to whom correspondence should be addressed.
Appl. Sci. 2020, 10(2), 711; https://0-doi-org.brum.beds.ac.uk/10.3390/app10020711
Submission received: 31 December 2019
/
Revised: 12 January 2020
/
Accepted: 15 January 2020
/
Published: 20 January 2020
(This article belongs to the Section Civil Engineering)
Abstract
:This paper presents a smart solution for the utility tunnel, which allows hosting a wide range of water and energy utilities in an accessible underground space. It is well known that utility tunnels offer major advantages such as the possibility to inspect, maintain, and easily extend urban utilities without excavation, thereby eliminating disturbances related to urban excavation such as traffic jams, noise, pollution, and pavement degradation. However, despite these advantages, the effective development of this facility remains below expectations, because of serious challenges related to the security and governance of this “shared space”. The solution presented in this paper is based on discussions with experts and companies involved in the design, construction, and management of utility tunnels, as well as on the authors’ experiences in the design and implementation of smart solutions for urban utilities. The paper firstly presents the major challenges of utility tunnels and then discusses how theb smart technology could help in coping with these challenges. The paper presents the architecture of this solution, as well as the main layers of monitoring, information system data analysis, and system control. It also presents the methodology to be followed for the implementation of this smart solution. Finally, the paper discusses two major issues for utility tunnels: fire risk and risk assessment. The paper shows that the use of smart technology allows developing a comprehensive digital solution, which uses advanced monitoring system to collect real-time data about the tunnel environment and functioning. These data can be easily shared by authorized staffs. Analysis of these data allows improving the utility tunnel security and performances.
1. Introduction
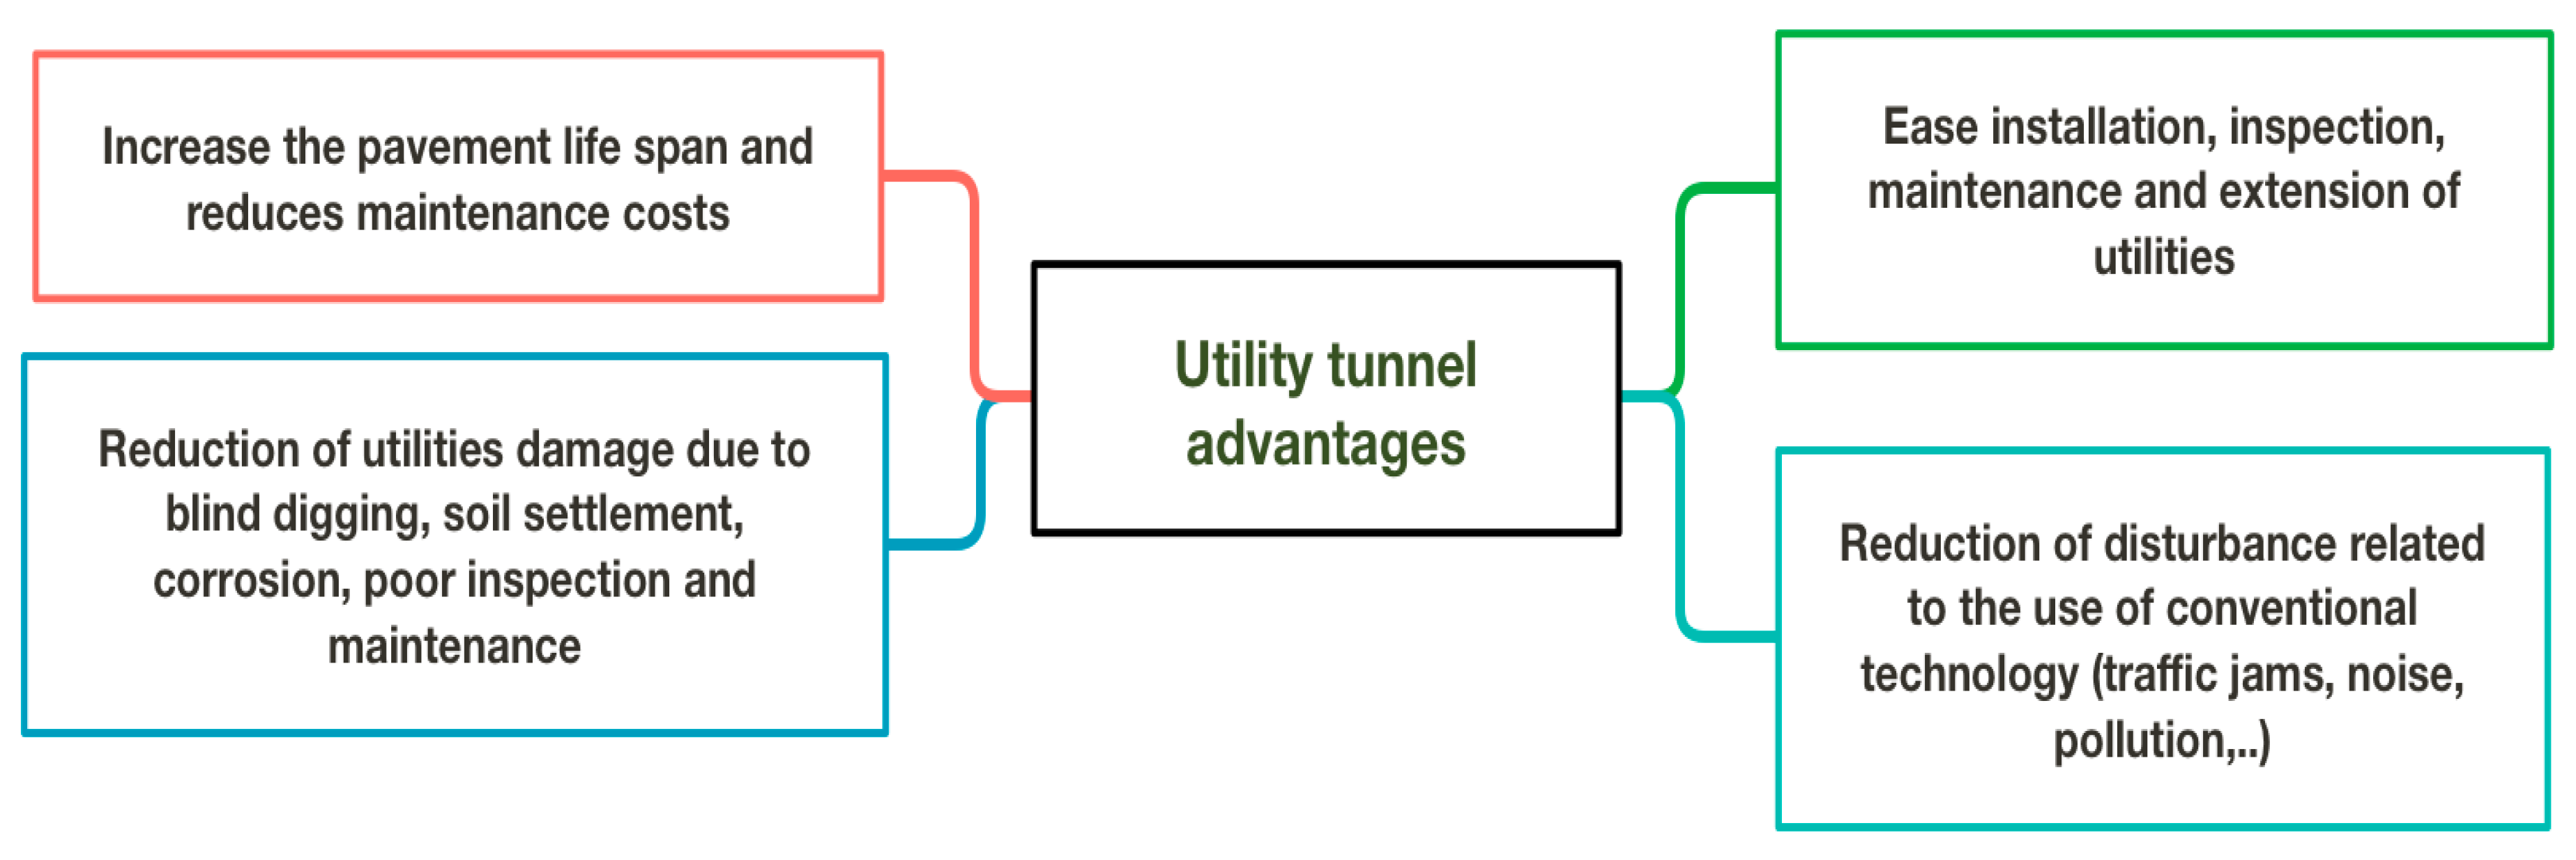
The concept and advantages of utility tunnels were discussed in previous papers [1,2,3,4]. The main advantage of this tunnel consists of hosting a wide range of urban utilities in an accessible space, such as water supply, water drainage, electrical power, gas, heat, and telecommunications. Therefore, it offers the possibility of realizing the inspection, maintenance, renovation, and extension of utilities in safe conditions without the necessity to make excavations or street cuts. In addition, it reduces traffic congestion, as well as working noise and pollution, due to pavement cutting and trenching. It facilitates the inspection of utilities and, consequently, reduces expenses related to utility maintenance. According to Reference [5], a lack of utilities’ inspection constitutes the principal utility hazard. In addition, utility tunnels contribute to the sustainable development of the urban underground space [6,7,8], because they optimize the use of this space for utilities and public services. Figure 1 summarizes the advantages of utility tunnels.
Despite these advantages, the effective development of utility tunnels remains below expectations, because of serious barriers and challenges, which mainly concern the security and the governance of this facility [9,10,11,12,13,14,15]. This paper presents how the smart technology can help in coping with these challenges. This technology is rapidly developing for the management of complex urban systems. It provides a high capacity to collect comprehensive data concerning urban systems and environment, as well as to share, analyze, and transform these data into operational information that improves the efficiency and security of urban systems. This technology creates a friendly collaborative working environment, where data and information are shared, and collaborative decisions are taken. It offers the possibility to track and evaluate the performance of complex systems, thereby taking adequate measurements to enhance this performance. This technology is particularly efficient in improving the security of complex systems. Indeed, thanks to the comprehensive monitoring system, it allows detecting early operating faults, thereby confining these faults and preventing their extension to larger areas. It also increases the capacity of complex systems to operate in degraded modes and to improve their self-healing capacity.
The solution presented in this paper is based on discussions with experts and companies involved in the design, construction, and management of utility tunnels, as well as on the experience of the authors in the design and implementation of smart solutions for urban utilities [16,17,18,19], in addition to the construction of a large-scale demonstrator of a smart city [20]. The smart solution is presented in two parts. The first concerns the identification of challenges facing utility tunnels, while the second describes the construction of the smart solution, including specifications, architecture, and implementation.
2. Utility Tunnel Challenges
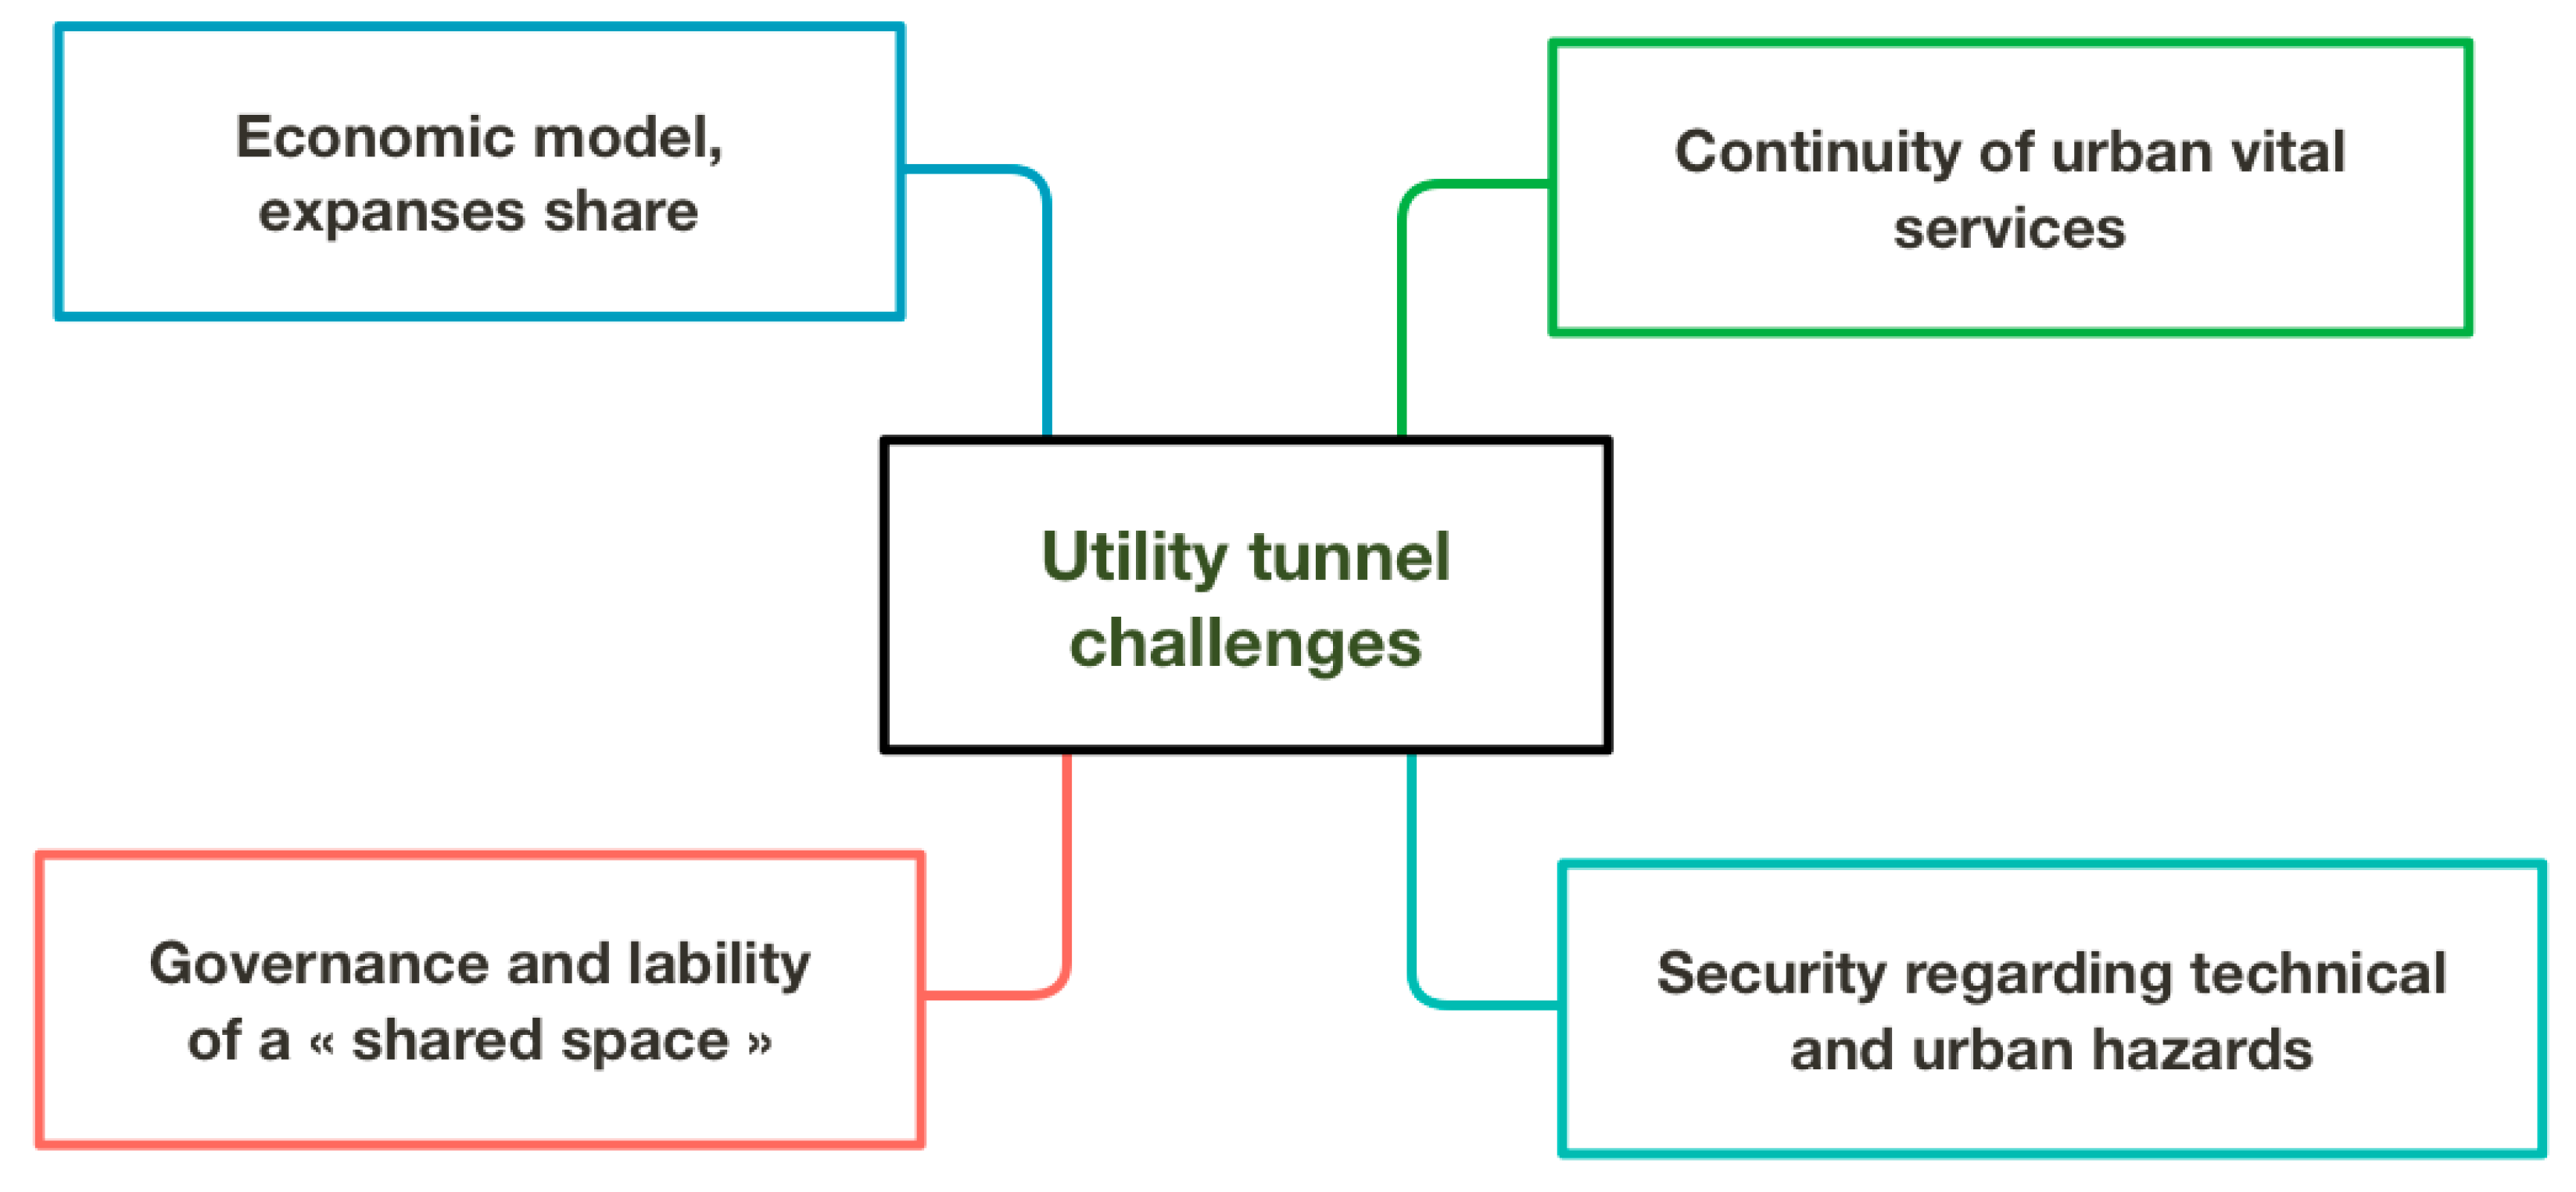
As a complex facility, composed of a multitude of complex systems providing vital urban services, the utility tunnel is subject to serious challenges, which are summarized in Figure 2. The major challenge of this facility concerns the continuity of services related to hosted utilities. An incident in an utility tunnel could result in a chain of incidents and to the interruption of vital urban services. Incidents in utility tunnels could result from technical problems such as water leaks, floods, gas leaks, electrical outages, and maintenance operations. The utility tunnel could also be subject to vandalism, sabotage, and terrorism activities.
The security of utility tunnels constitutes a major concern for public authorities, as well as for tunnel managers and partners [8,10,21]. Fire is the major risk for this facility. Based on extensive analysis of this risk, Reference [22] showed the necessity to establish a fire-safety strategy for utility tunnels, including restrictions on the use of materials in tunnel construction and equipment, compatibility of hosted utilities, tunnel compartmentalization, tunnel access control, implementation of an early fire detection system, and ventilation control. According to a report of the Federal Highway Administration, flood also constitutes a serious risk for utility tunnels [4].
Management and liability also constitute serious challenges for companies in charge of hosted utilities [7,11,12,13]. Generally, these companies are worried about liability involving the risk of explosion and flood, as well as the presence of other companies working in the same space. Companies expect transparency concerning tunnel governance and the sharing of expenses from the utility tunnel manger.
These challenges constitute serious barriers to the development of utility tunnels. The sections below show how smart technology can help to cope with these challenges.
3. Smart System Design
3.1. Specifications
The smart solution of the utility tunnel aims at the construction of a comprehensive system that uses smart technology to cope with the challenges presented in Figure 2.
Figure 3 summarizes the specifications for the smart system. It should collect data concerning the utility tunnel assets and operation. Asset data are integrated into a three-dimensional (3D) digital model including both the tunnel and the hosted utilities, with identification and geo-localization attributes for all components. Operating data are collected via sensors used in monitoring the tunnel and hosted utilities. The smart system should also include applications for online access and update of inspection and maintenance data.
The smart system should conduct real-time and historical data analysis using engineering and security software, as well as advanced ICT (information and communication technology) tools such as machine learning and artificial intelligence. This analysis turns collected data into operating information to detect abnormal events, check the integrity of the tunnel and hosted utilities, and improve the tunnel efficiency and security via the use of a control system of the tunnel and utilities.
The use of machine learning and artificial intelligence permits conducting a comprehensive analysis of historical data to figure out major trends and categories in the responses of the tunnel components to different operating and environmental conditions, to evaluate their performances, to detect anomalies in their functioning, and to explore the interaction among these components. Analysis of real-time data, together with historical data, permits detecting operating anomalies related to safety or component performances, as well taking mitigation measurements.
The control layer includes electronic components such as switches, breakers, valves, locks, motors, and pumps that allow online or automatic control of the tunnel equipment and hosted utilities. Control could be automatic or online according to optimization and safety rules, together with the results of data analysis.
A dashboard allows real-time visualization of the tunnel operating data, including incidents, alarms, and performances indicators. The smart system should edit and diffuse incidents and performances reports.
3.2. Smart System Architecture
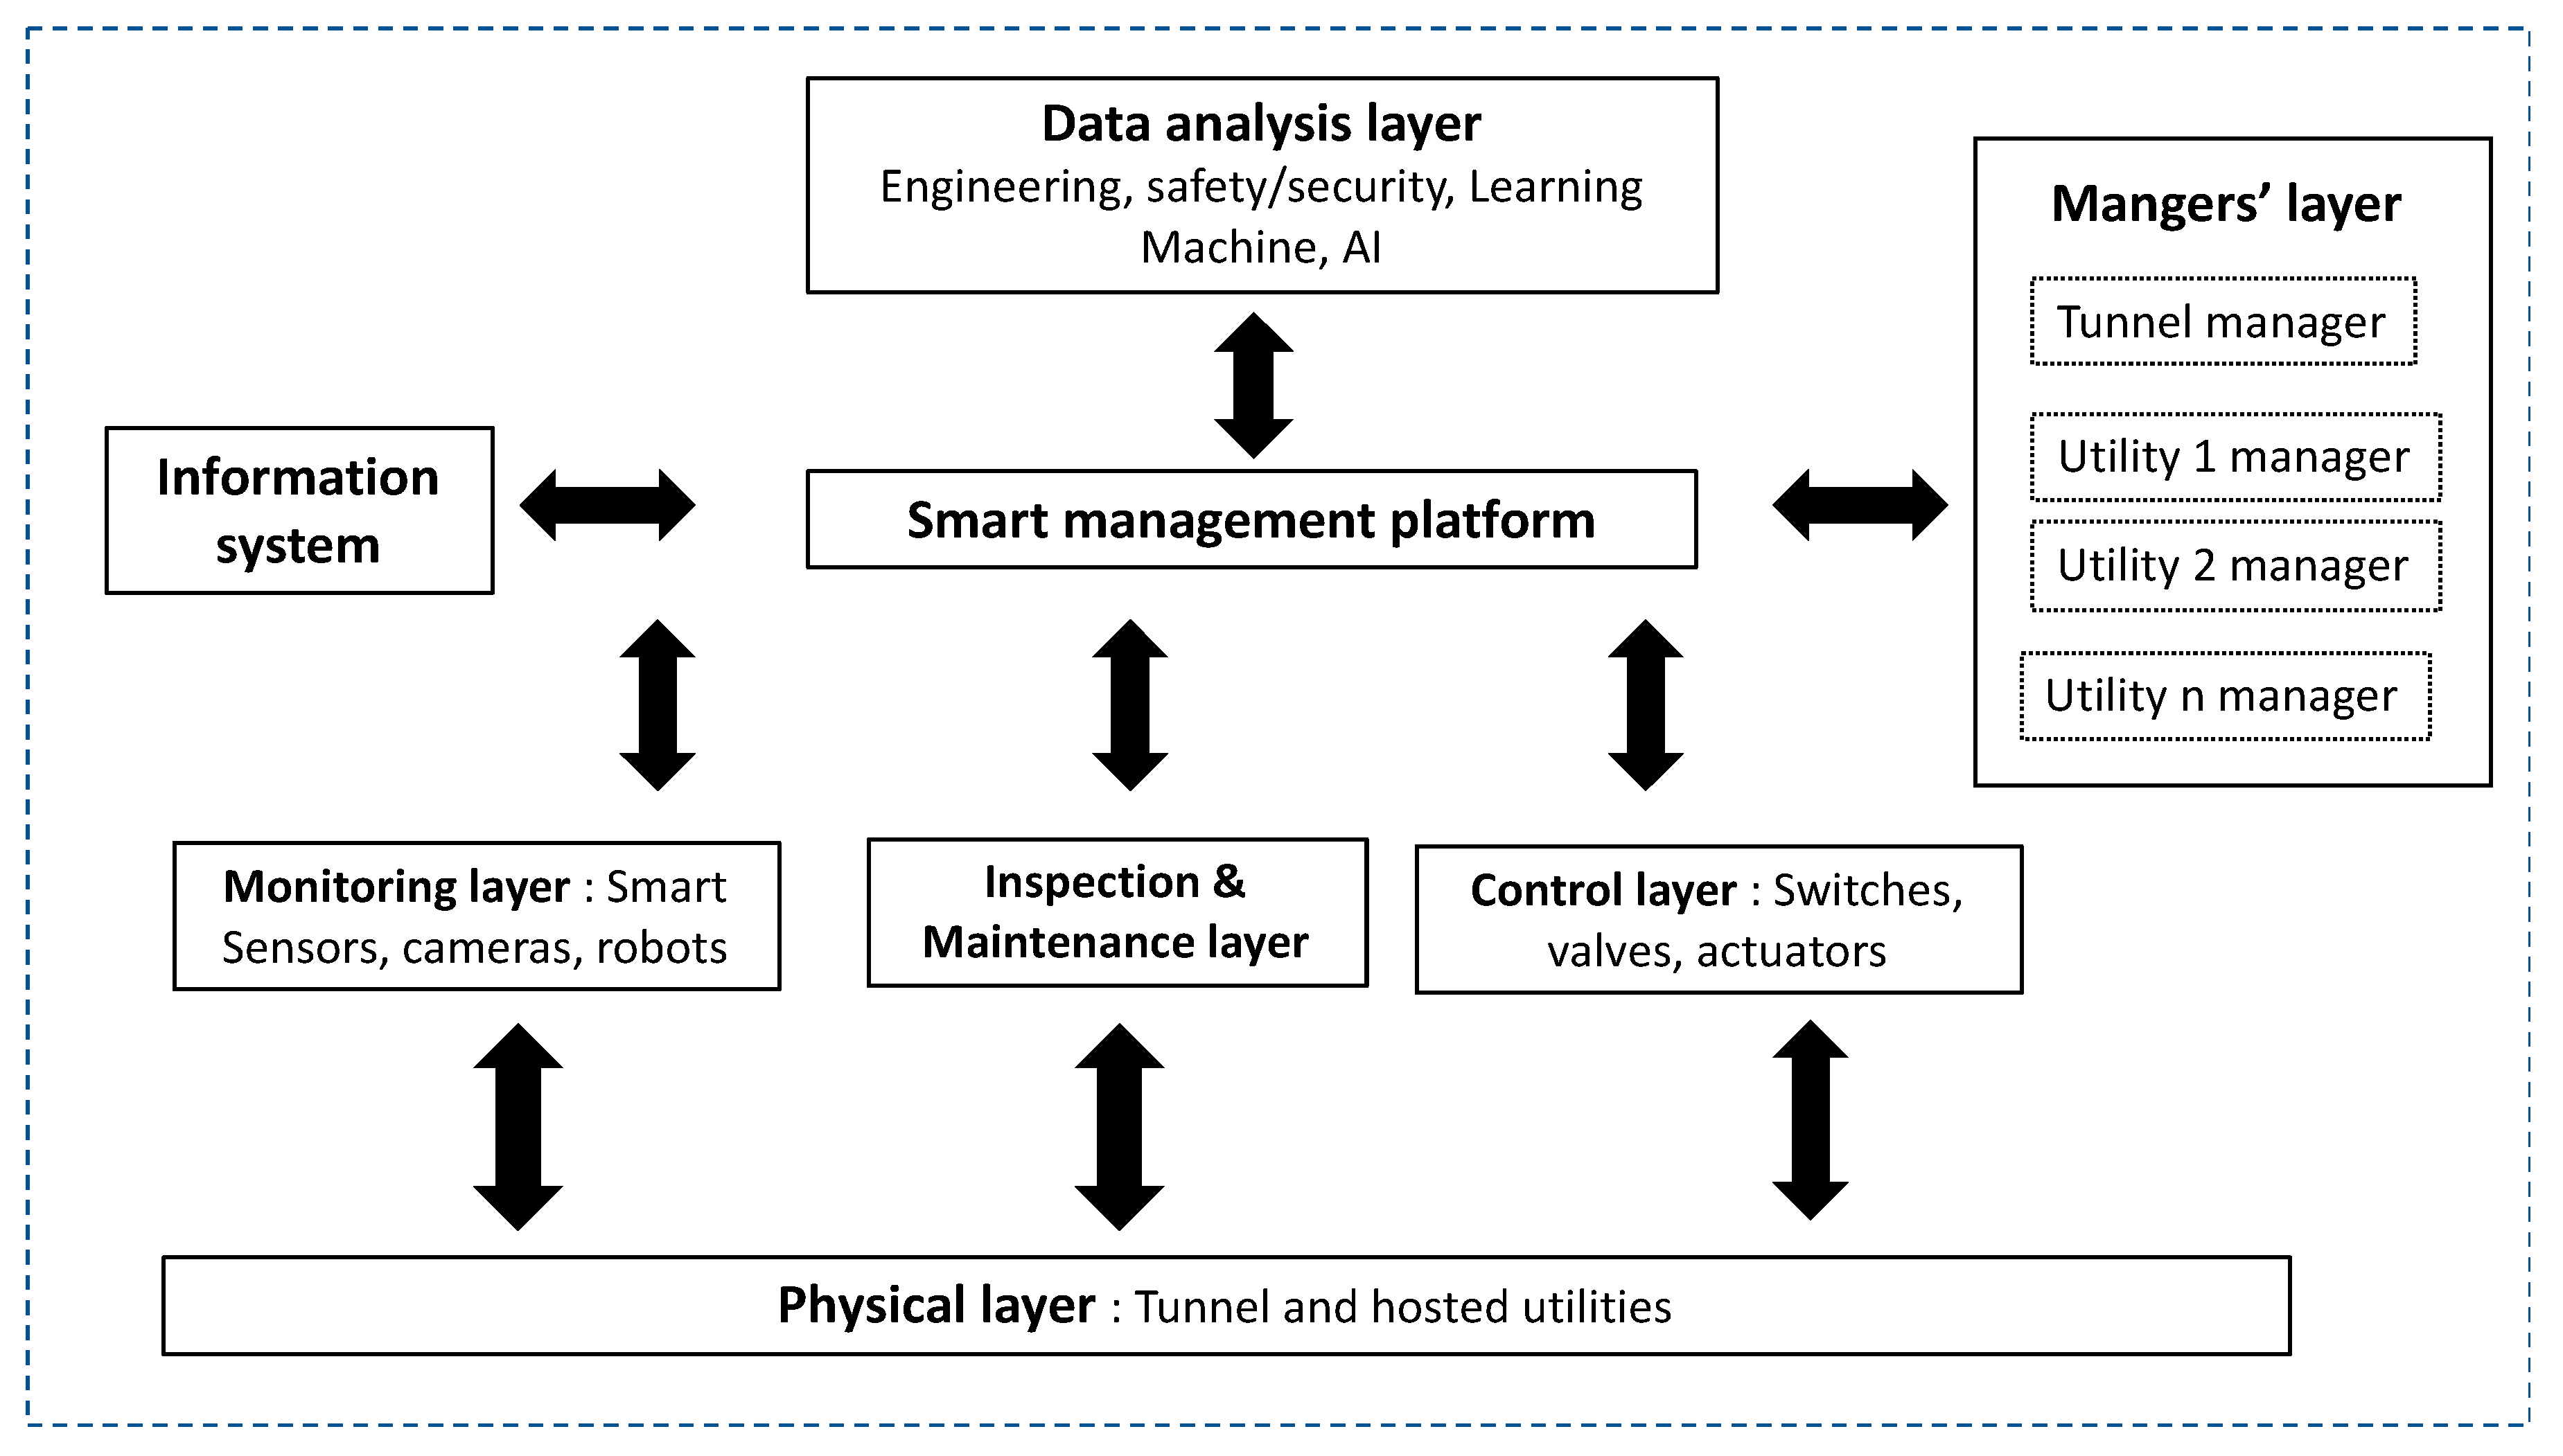
The architecture of the smart management system is described in Figure 4. A smart management platform ensures the coordination of the system components, which include the following layers: manager layer, physical layer, monitoring layer, inspection and maintenance layer, information system layer, analysis layer, and control layer.
The platform ensures coordination and interaction among the layers of the smart system. The physical layer concerns the physical components of the tunnel and hosted utilities. Information about the functioning of these components is collected via sensors in the monitoring layer, while information about their maintenance and inspection is collected from maintenance operators via the maintenance layer. Collected data are stored in the tunnel information system, transmitted to the tunnel managers, and analyzed using data analysis tools and software. The results of analysis are transmitted via the platform to the tunnel managers, who can, according to these results, operate manual actions related to safety and system performances. Results can also be used to operate automatic actions via the control layer (switches, valves, motors, pumps, etc.).
3.3. Manager Layer
The manager layer concerns the mangers of the tunnel and hosted utilities. The tunnel manager is in charge of tunnel security, as well as the operating conditions according to the agreement with utilities managers. The management of the utility tunnel requires the creation of a management committee, which sets up and shares information about the operating and security requirements of each utility, as well as the general requirements for the tunnel operation and security. This committee conducts analyses of utilities interactions and the impact of any incident on both the tunnel and utilities. It sets up procedures to be followed in case of any incident. The tunnel and utilities managers can access authorized data and information via the smart management platform.
3.4. Physical Layer
The physical layer includes the tunnel and hosted utilities, as well as their equipment. This layer is subject to strict operation and quality control requirements, including operating conditions and performance, as well as monitoring, inspection, and maintenance.
A 3D digital model is used for the digital representation of the tunnel and utilities assets. This model includes digital identification and geo-localization of the components of the tunnel and hosted utilities. Each component is equipped with RFID tags (radio-frequency identification), which provide dynamic information about the component including manuals, guides, photos, and videos. BIM (building information modeling) is used for the construction of this model, as well as for the asset management and 3D visualization.
3.5. Monitoring Layer
The monitoring layer concerns the tunnel and hosted facilities.
3.5.1. Tunnel Monitoring
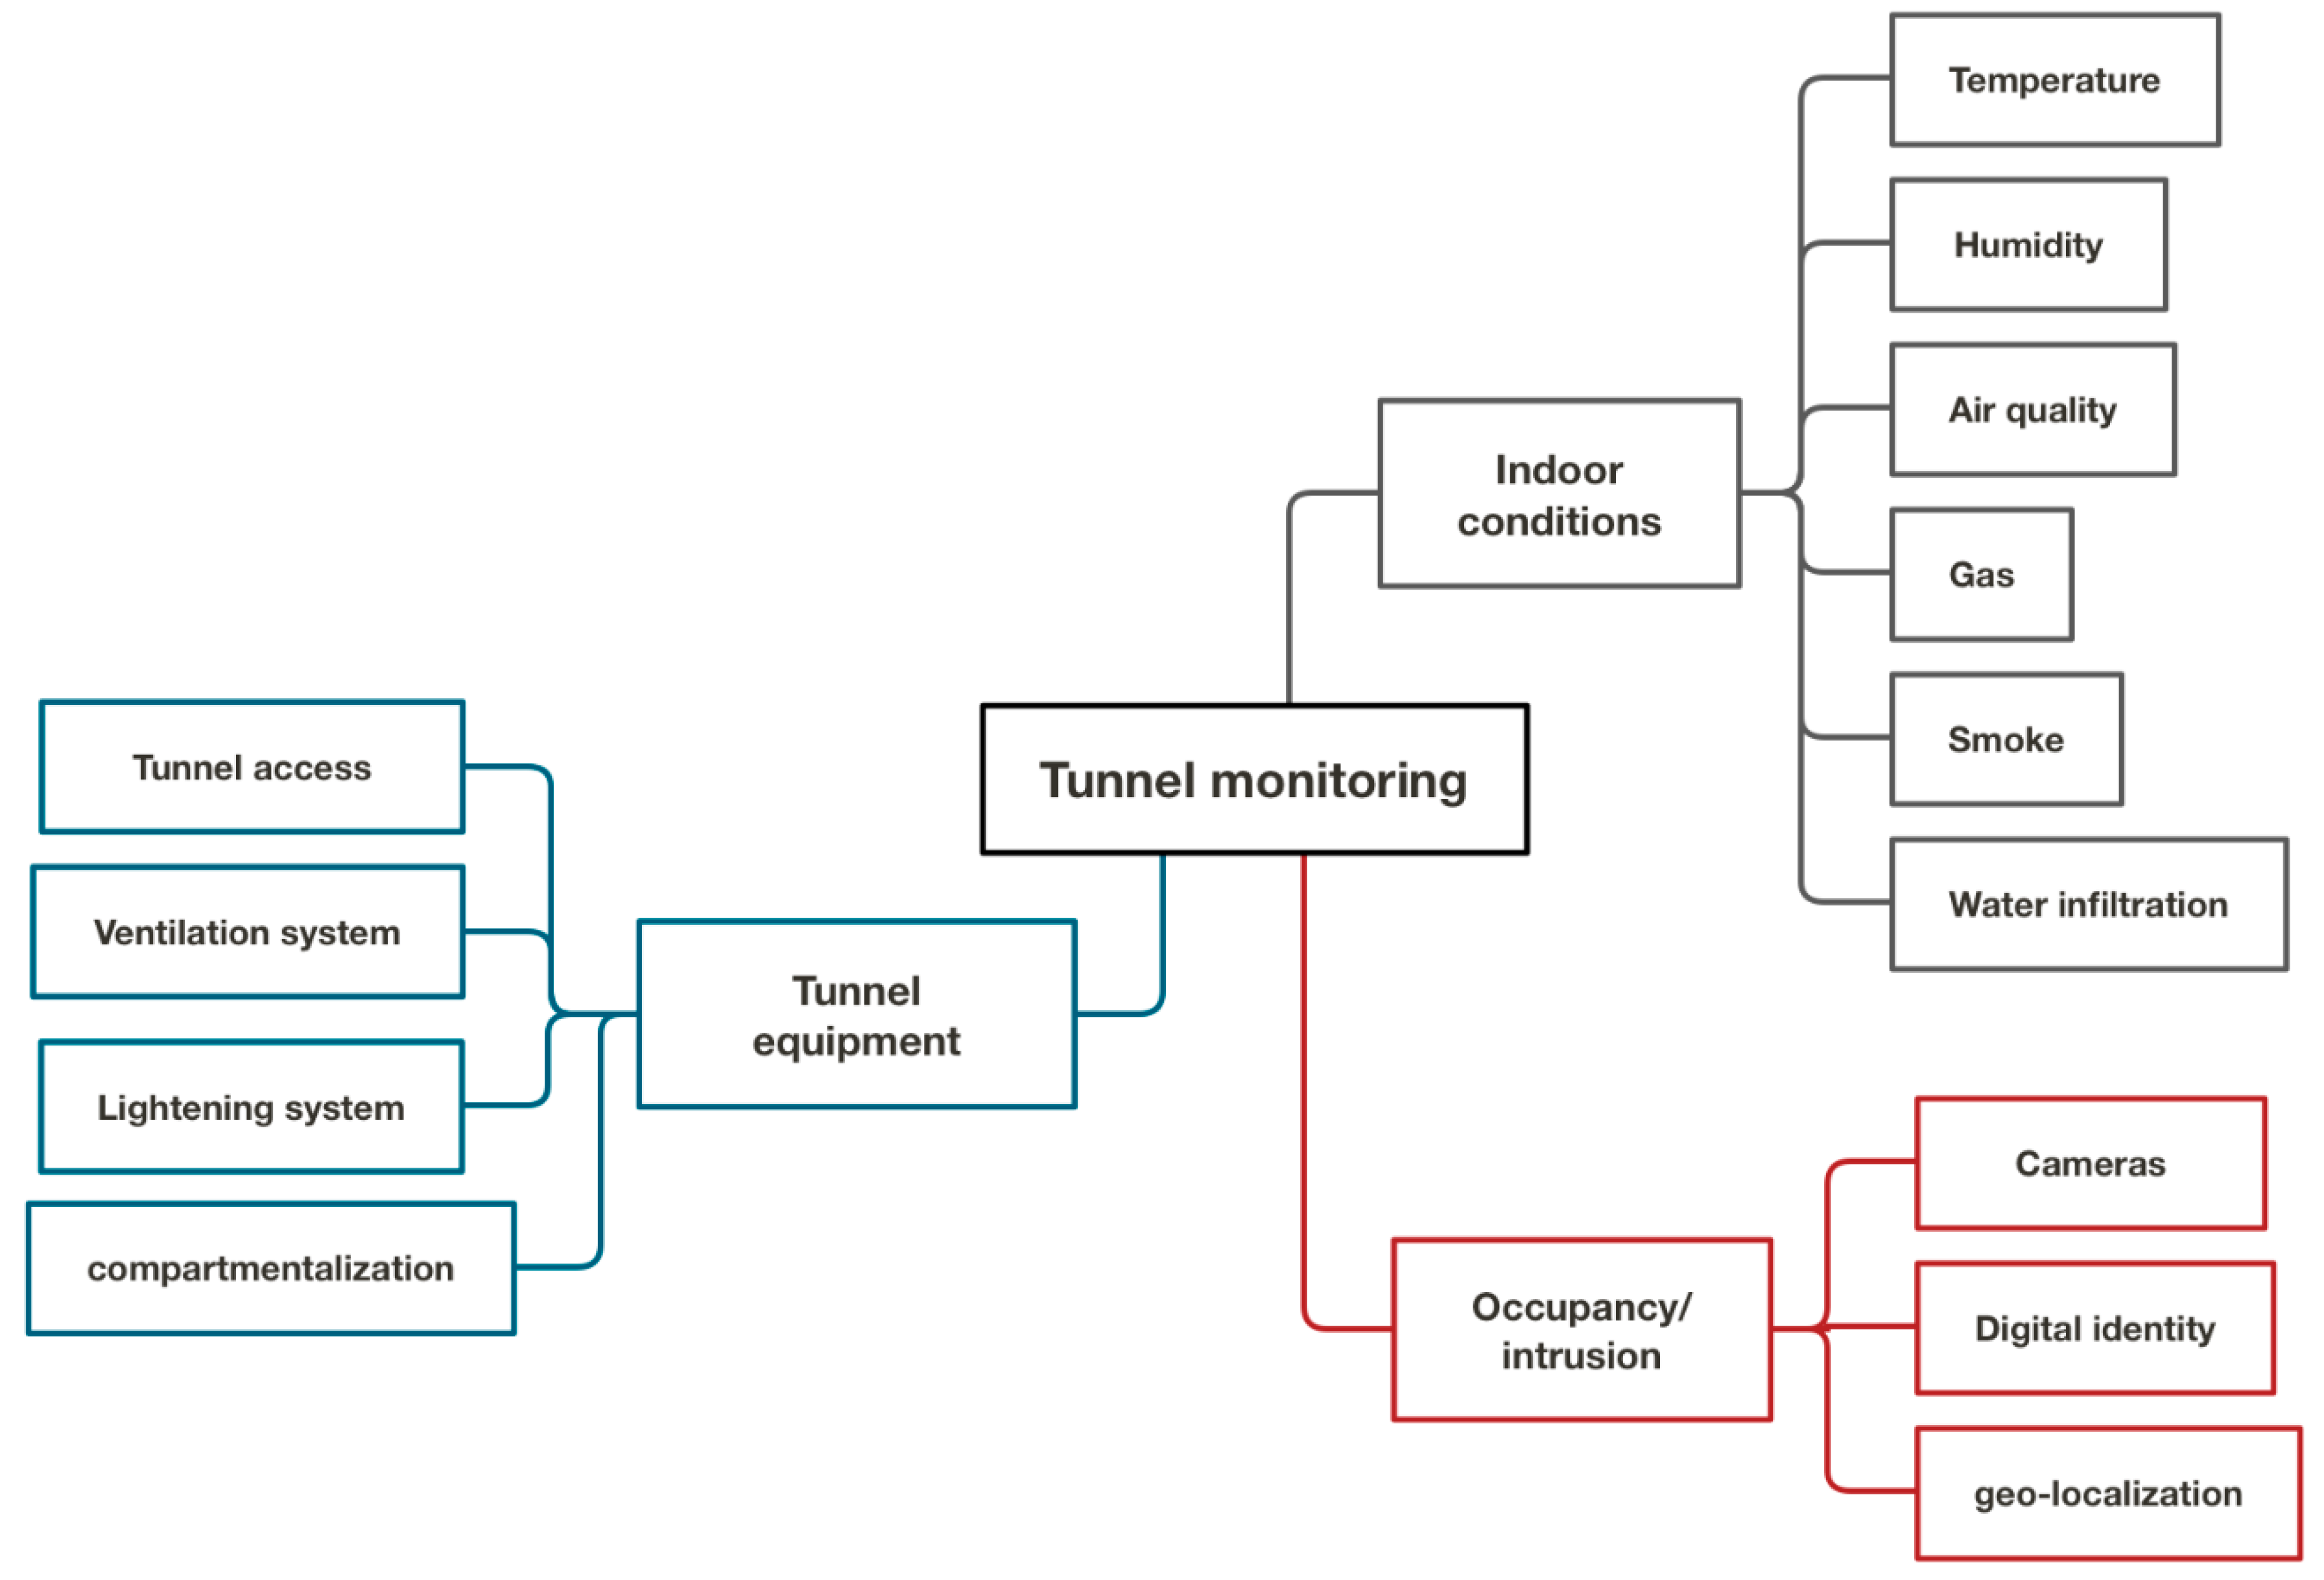
Figure 5 illustrates the tunnel monitoring. It includes smart sensors to follow indoor conditions such as temperature, humidity, air quality, smoke, gas emission, and water infiltration. Survey cameras are used to track intrusions in the tunnel. Staff access to the tunnel is controlled using a digital identification system. For each staff member, the system provides information about the identity, contact, and hierarchy, as well as authorized area in the tunnel. Presence in the tunnel is tracked using an internal geo-localization system [23,24]. At each instant, the system provides identities of staff members in the tunnel, as well as their positions. The system also provides the history of staff presence in the tunnel.
Tunnel monitoring concerns also the tunnel equipment, such as the tunnel access (open/closed, identity of users), compartmentalization equipment, ventilation system (debit, temperature, etc.), and lighting system (on/off, color).
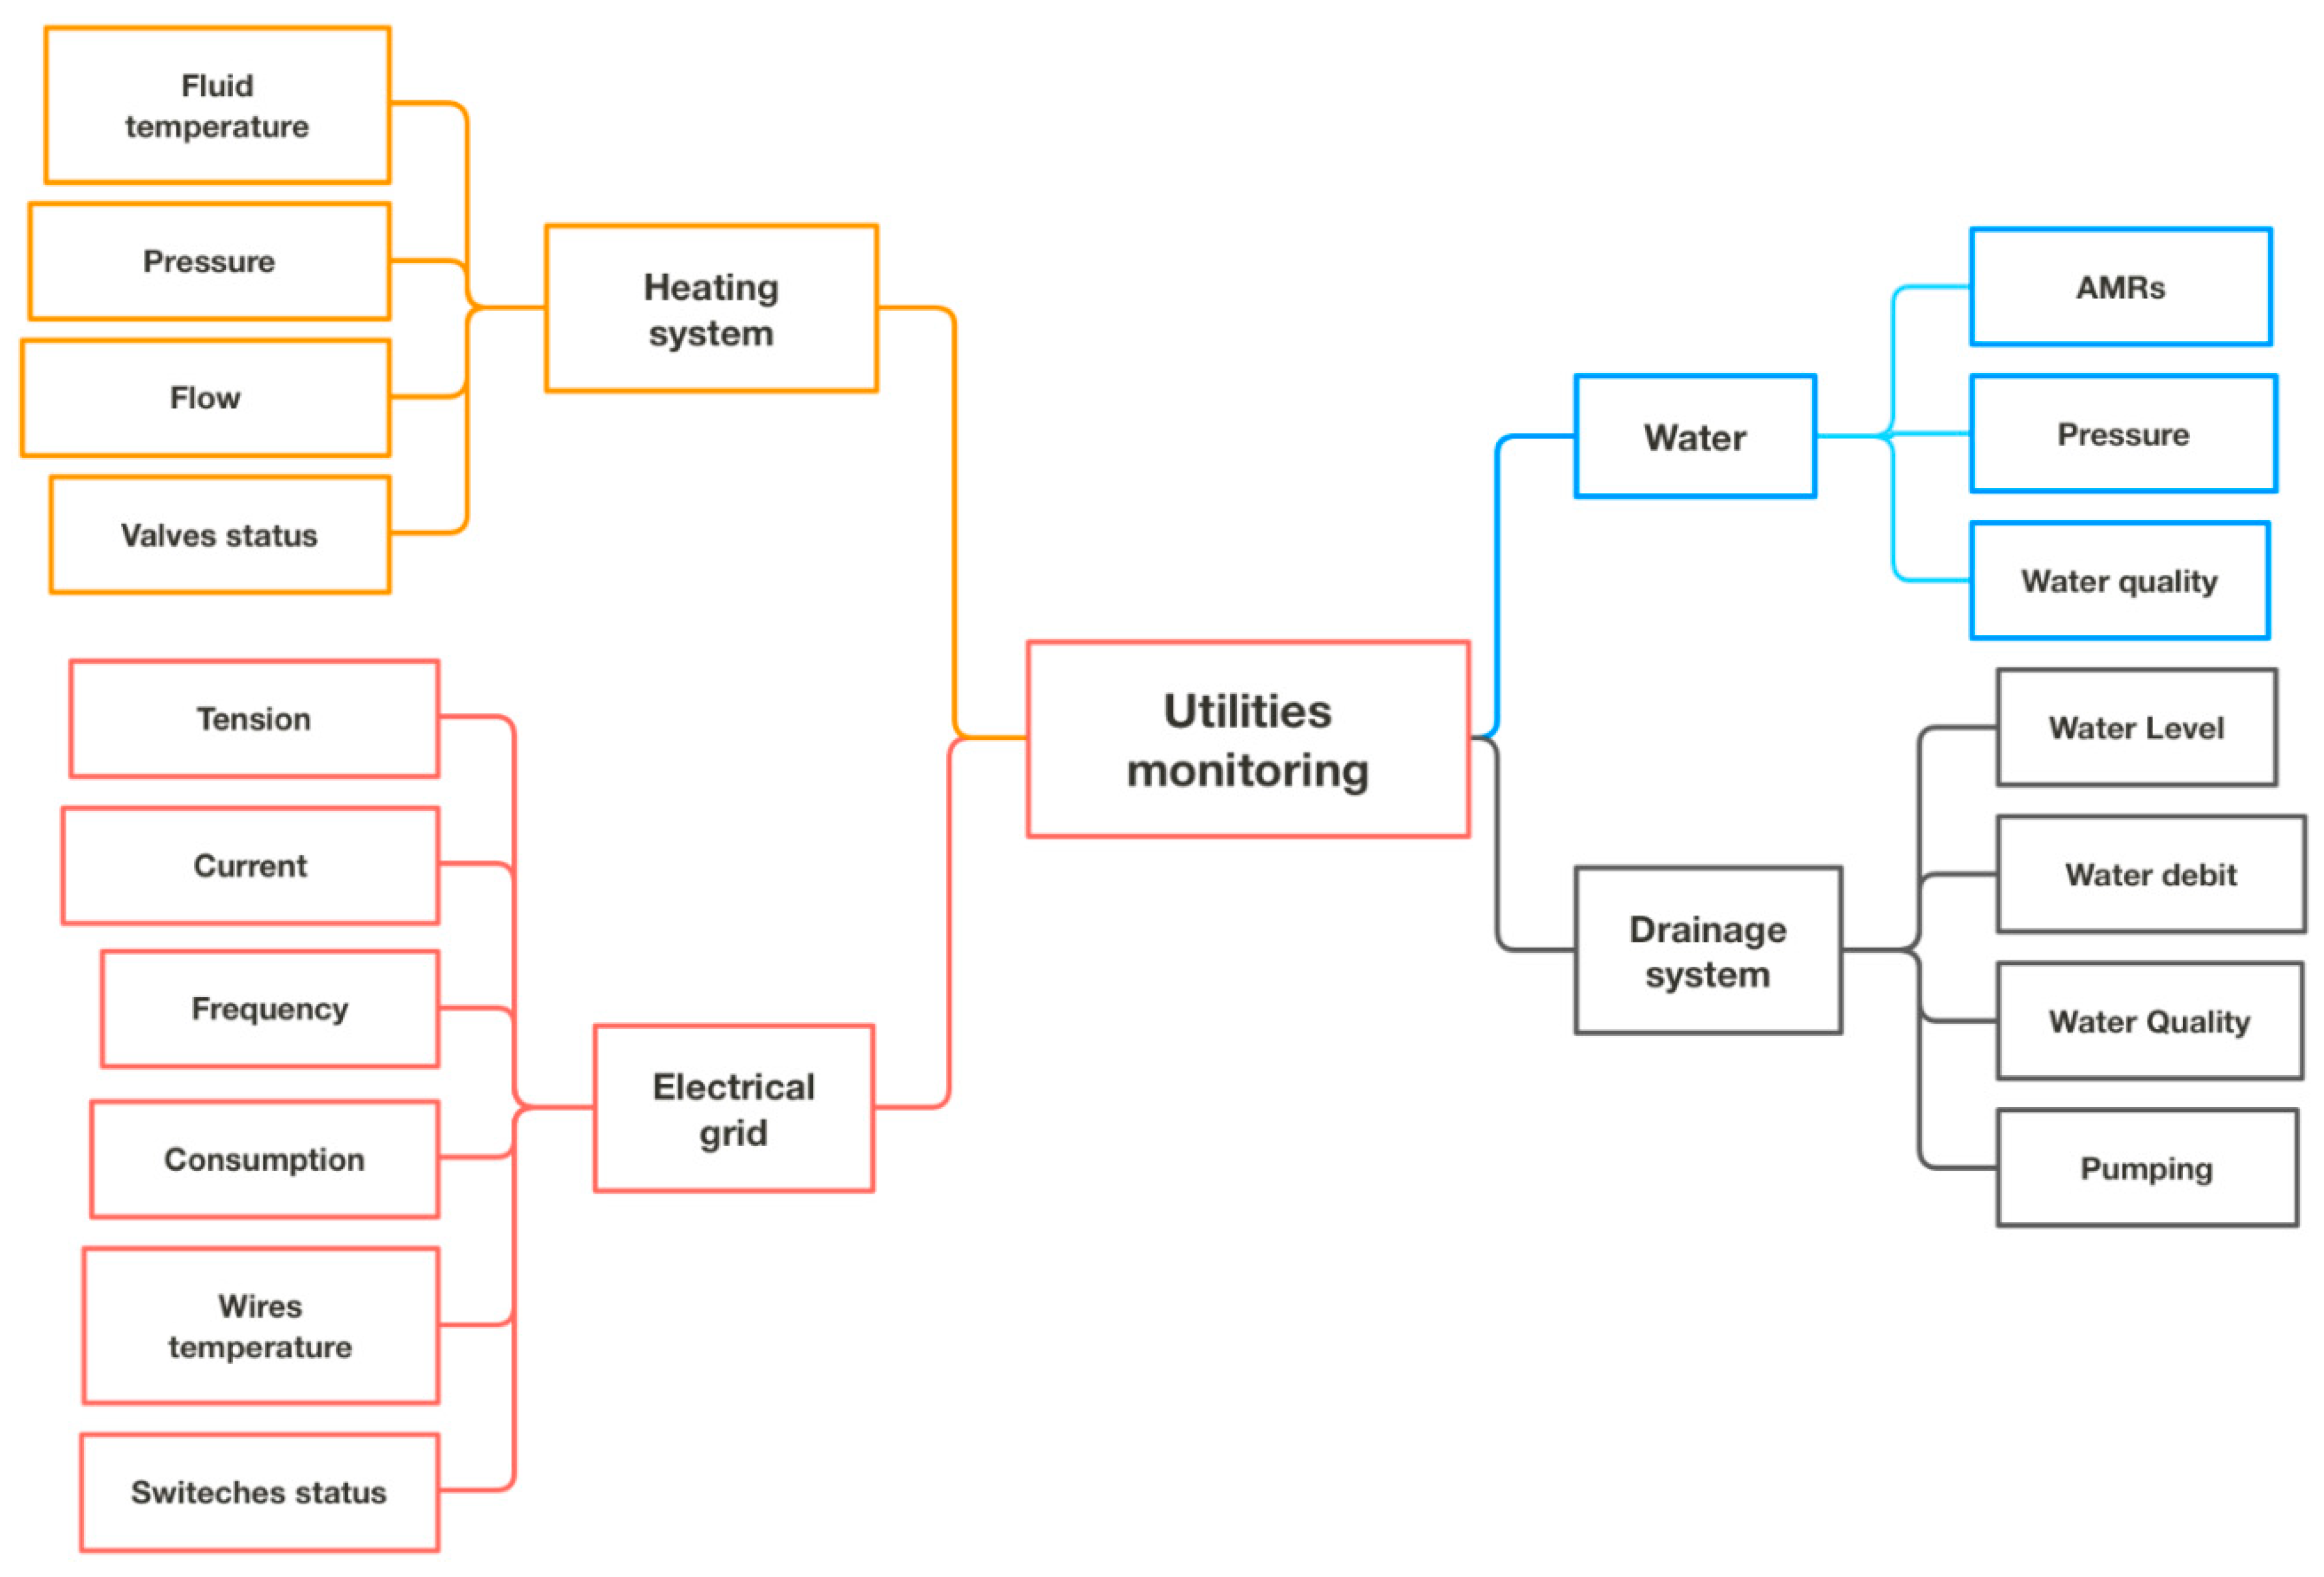
3.5.2. Utilities Monitoring
The smart technology achieved a high level of maturity in utilities management. The use of this technology in utility tunnels is facilitated by the ease of access to utilities and favorable conditions for utilities monitoring. Figure 6 summarizes the smart monitoring of the following utilities: drinking water, water drainage, district heating, and electrical grid.
The drinking water system is monitored by AMRs (automatic meter readings) measuring water debit, pressure cells to record the water pressure, and water quality devices for real-time control of the water quality (turbidity, pH, temperature, chlorine, conductivity). This system allows rapid detection of water leaks and water contamination.
The drainage system is monitored by sensors following the water level and flow, as well as water quality (turbidity, temperature, pH, etc.) and pumping equipment. This monitoring system allows early detection of floods and faults in pumping equipment.
The electrical grid is monitored by sensors measuring the electrical tension, current, and frequency, as well as switch status (on/off) and electrical wire temperature. This system allows early detection of faults in the electrical grid.
The district heating system is monitored by sensors recording fluid temperature, pressure, and flow, as well as the state of valves (open/closed). This system allows early fault detection, as well as improvement of the system performance.
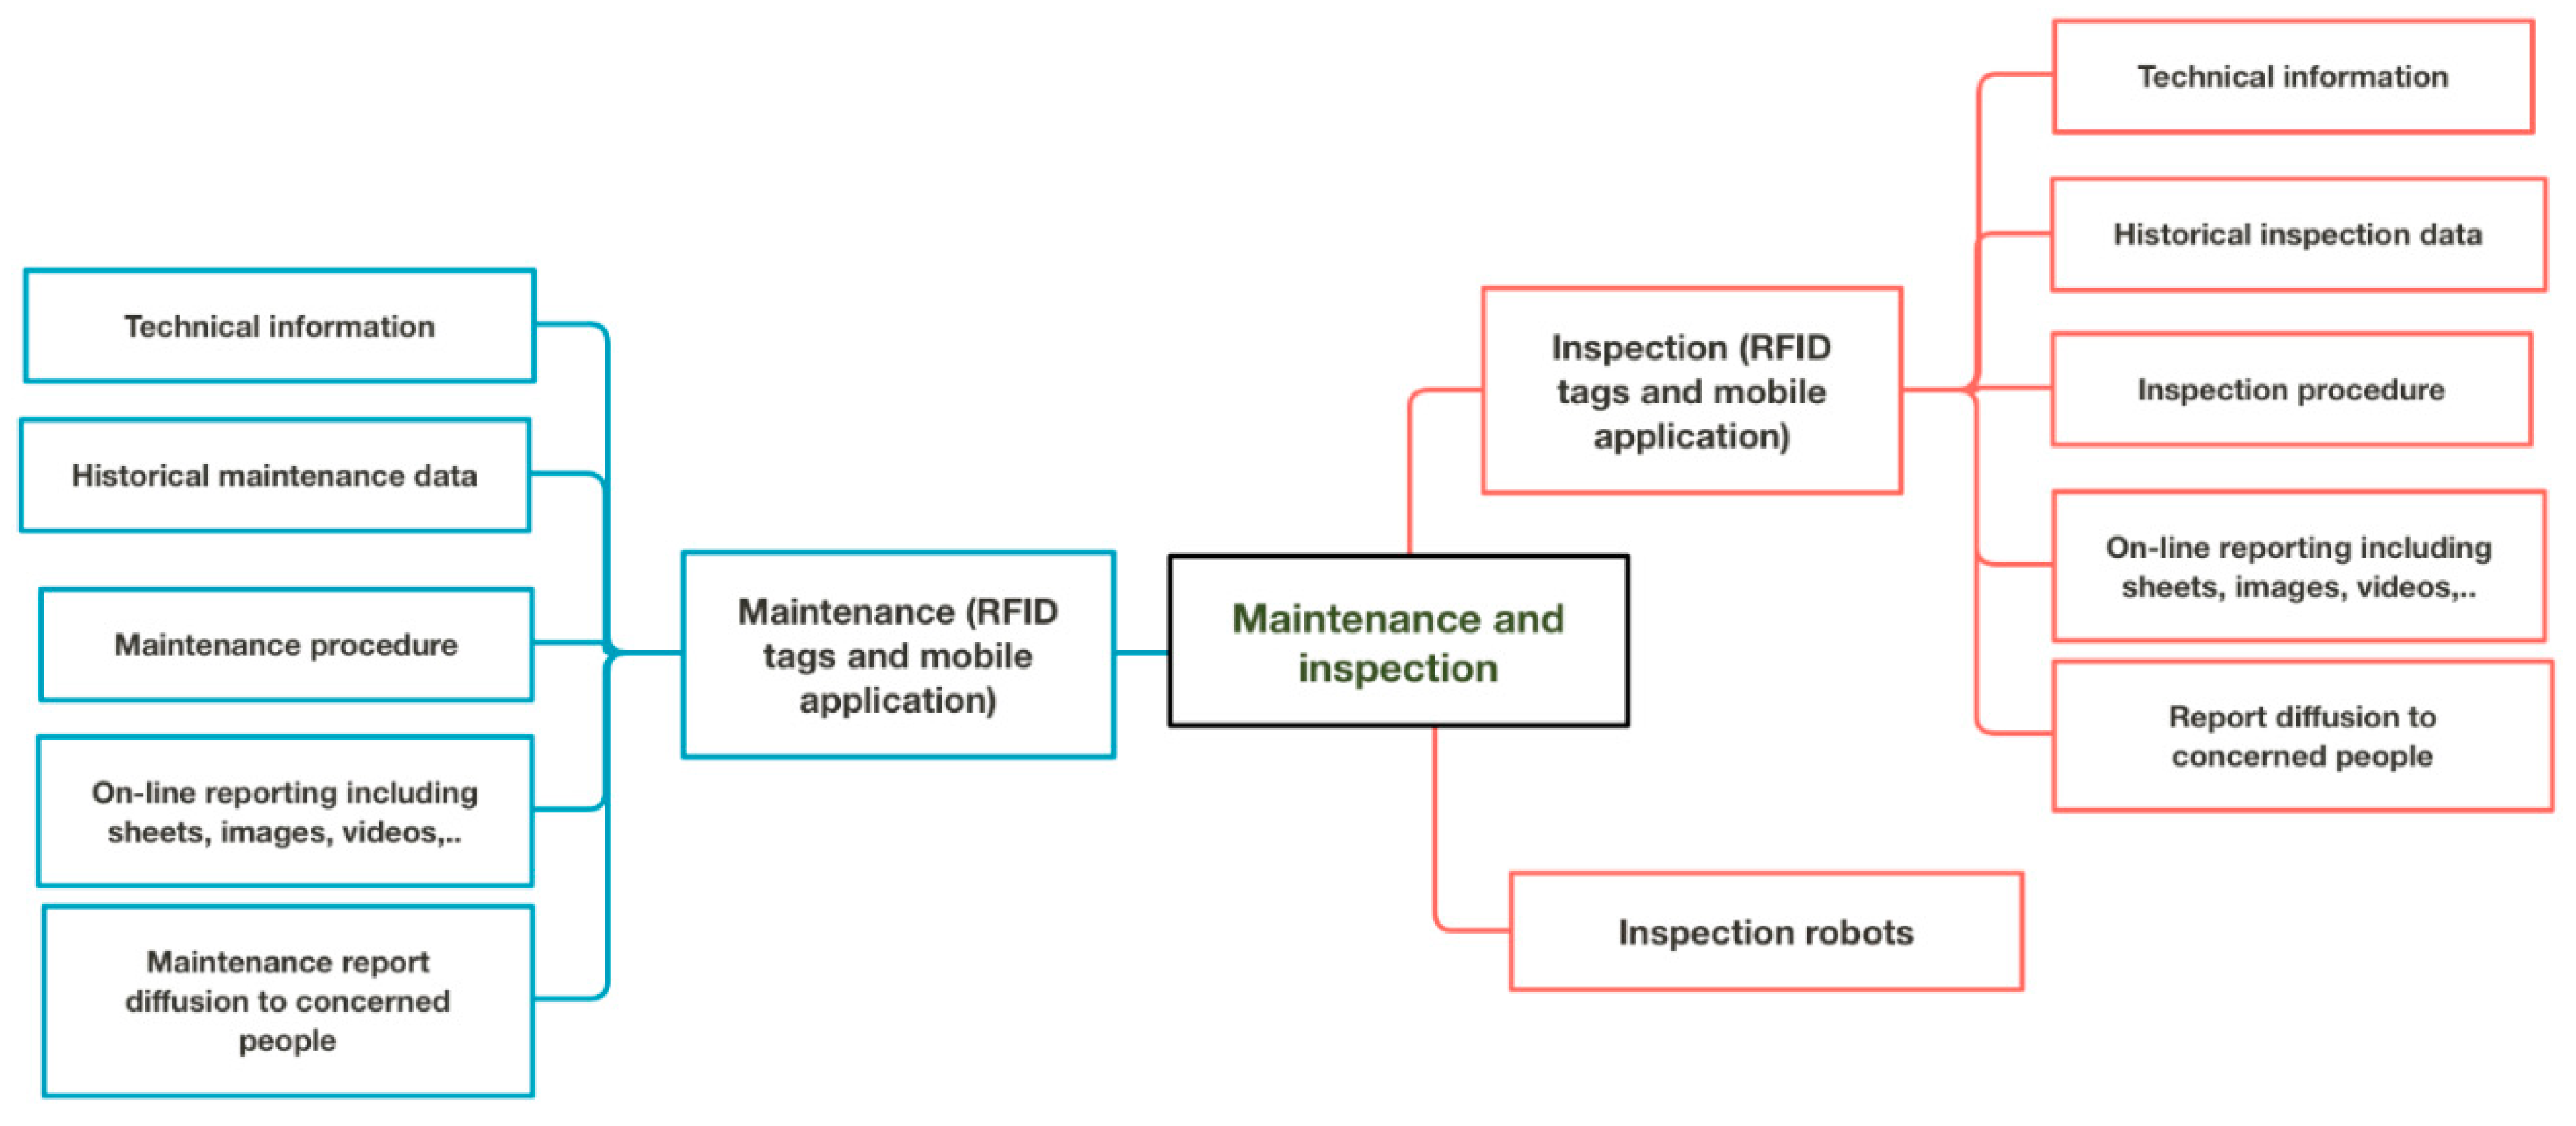
3.6. Inspection and Maintenance Layers
The inspection and maintenance of the utility tunnel constitute major concerns for the tunnel safety and performances. Requirements and procedures for the smart inspection and maintenance of each component of the tunnel and hosted utilities should be established and coordinated by the concerned manager. Each inspection and maintenance operation should be controlled and result in an online report, which is transmitted to concerned staff and authorities.
Figure 7 illustrates how smart technology can help in improving the quality of inspection and maintenance of utility tunnels. In addition to the digital identification and geo-localization of the tunnel and utilities components, each component is equipped with inspection and maintenance RFID tags, which are connected to the “smart management platform” via mobile application.
The inspection tags provide the inspection procedure and documents, as well as historical data. They allows controlling the inspection quality, as well as online reporting, via specific protocols. The inspection report could include sheets, images, and videos. The report is automatically transmitted to staff concerned by the inspection, with alerts in case of need for urgent intervention.
RFID maintenance tags are used in the same way as the inspection tags to improve and control the quality of maintenance.
Robots are equipped with sensors to measure some parameters such as air quality, temperature, and humidity and to take videos in restricted-access areas. They can also be used to conduct regular and automatic inspections of the tunnel and its equipment to detect anomalies such as cracks, water infiltration, presence of smoke and gas, etc.
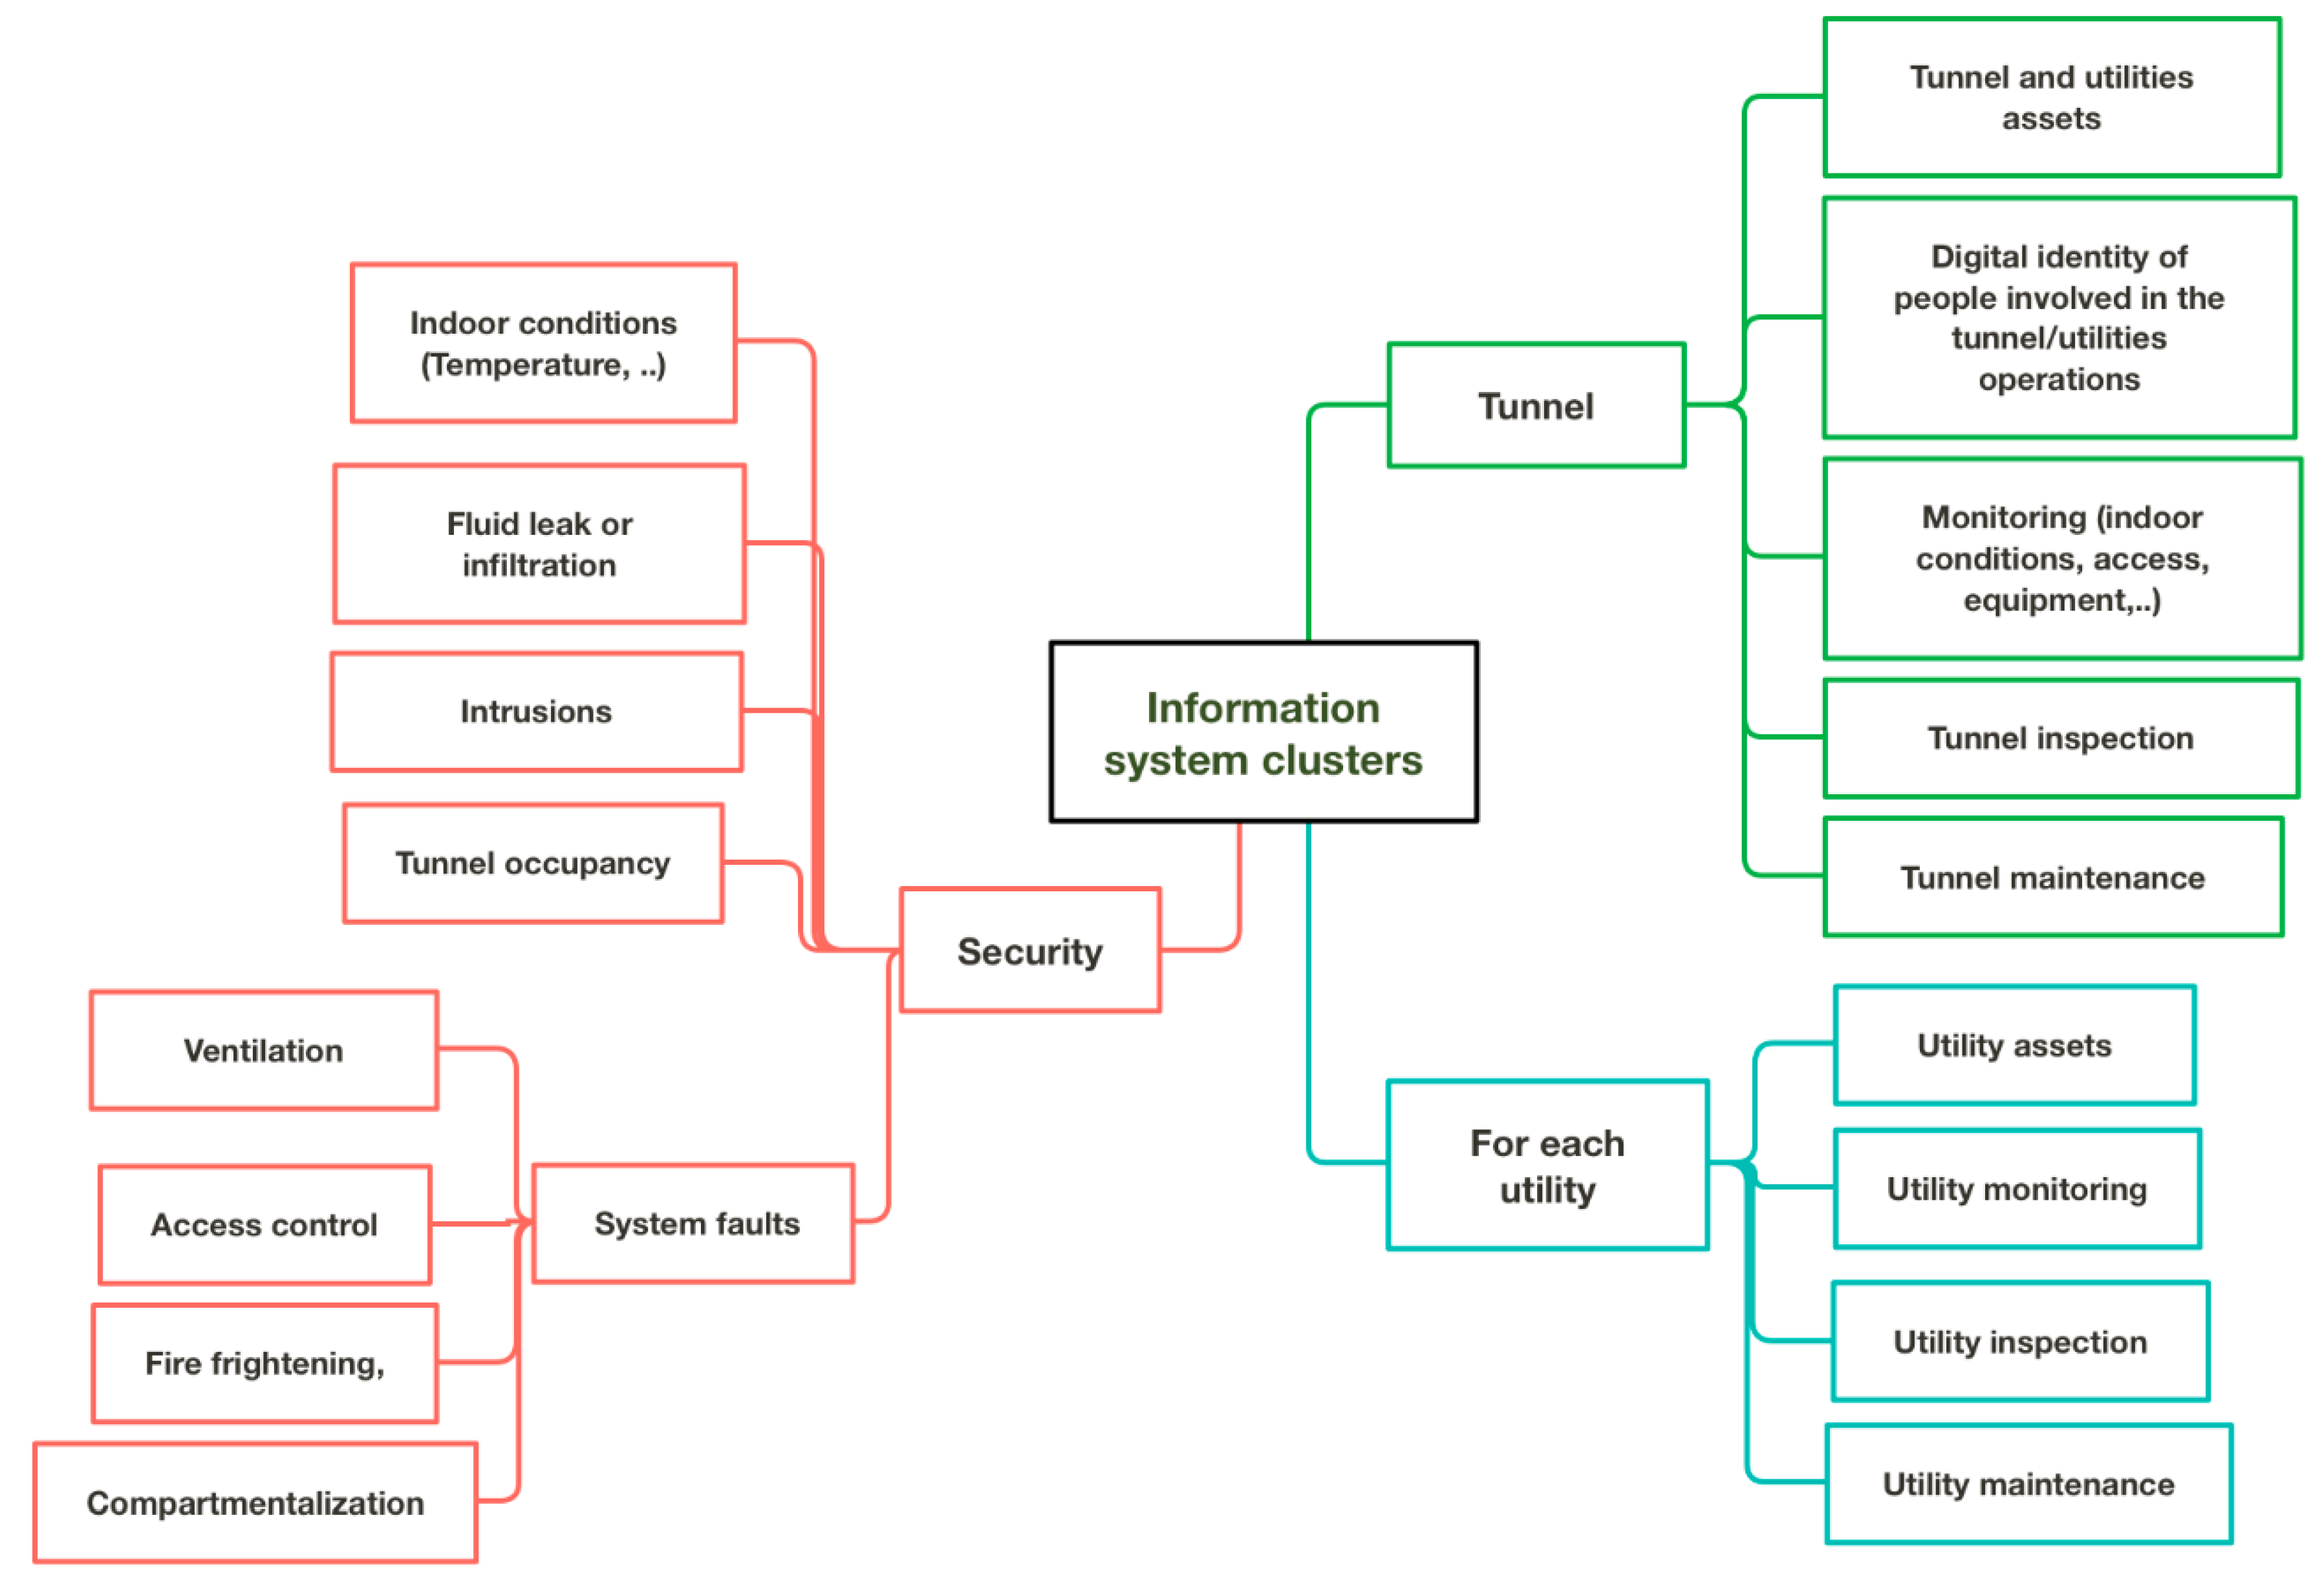
3.7. Information System
Data and information concerning the tunnel and hosted utilities assets, as well as their monitoring, inspection, maintenance, and operation, are stored via the smart management platform in an information system. New data are firstly controlled and eventually cleaned according to specific protocols before integration into the information system. The information system includes structured data such as sheets and time-series data, as well as unstructured data such as images, videos, audio etc.
Organization of the information system in clusters allows meeting the operation and security requirements of the tunnel and hosted utilities (Figure 8). The tunnel cluster includes data and information related to the tunnel and utilities assets, as well as the digital identity of staff members involved in the tunnel or utilities operation. It also includes data concerning the tunnel monitoring, inspection, and maintenance. Each utility cluster includes data related to the utility assets, monitoring, inspection, and maintenance. The security cluster includes data related to the utility tunnel security and incident management, such as indoor conditions, fluid leaks, intrusions, faults in the security system (ventilation, firefighting, compartmentalization, access control, etc.), and human presence.
A “key actor” is designated for each data cluster. His role is to work with other key actors, as well as with the tunnel and utilities mangers, to establish procedures related to data purchase, verification, cleaning, validation, processing, sharing, and quality control. Procedures should also include data use for incident and security management.
3.8. Control Layer
The control layer includes electronic devices, switches, valves, motors, pumps, and locks, which can be remote-controlled via the smart platform. Electronic locks are used for online control of the tunnel access. Smart pumps are used for the control of ventilation, smoke extraction, firefighting, and water evacuation. Smart motors are used for closing/opening the tunnel compartmentalization doors and access. Smart valves are used to control the water flow or pressure in the drinking water and district heating systems. Smart switches are used for the control of the electrical grid.
3.9. Data Analysis
Data analysis concerns the transformation of real-time and historical data into operational information, to improve the efficiency and security of the tunnel and hosted utilities.
Security analysis aims at improving the early detection of abnormal events such as water or gas leaks, water infiltration, unusual increases in the temperature, and illegal intrusions, as well as faults in the tunnel equipment related to access control, ventilation, smoke extraction, and firefighting. It aims also at conducting rapid security procedures including automatic actions such as turning off/on tunnel equipment, closing/opening access, closing/opening compartmentalization doors, turning on firefighting systems, smoke evacuation, alerting staff inside the tunnel, and sending alerts to staff and authorities concerned by the incident.
Early incident detection is based on the comparison of real-time data with references values or baseline values, which could be completed and enhanced by cross-data analysis and artificial intelligence. According to the degree of violation of the reference values, a risk score is attributed to the event, and an appropriate procedure is activated. This procedure can include additional verification, alerts, turning off/on equipment, or emergency service intervention.
Post-incident analysis is crucial. It concerns analysis of data collected during the incident, as well as pre- and post-incident data. It includes also the staff response to the incident and the interaction with the tunnel and utilities managers. This analysis allows understanding the incident response of systems and staff. It allows also checking the efficiency of incident management procedures and improving these procedures, including incident early detection and response strategies.
3.10. Layer Interaction
The smart platform is responsible for layer interaction.
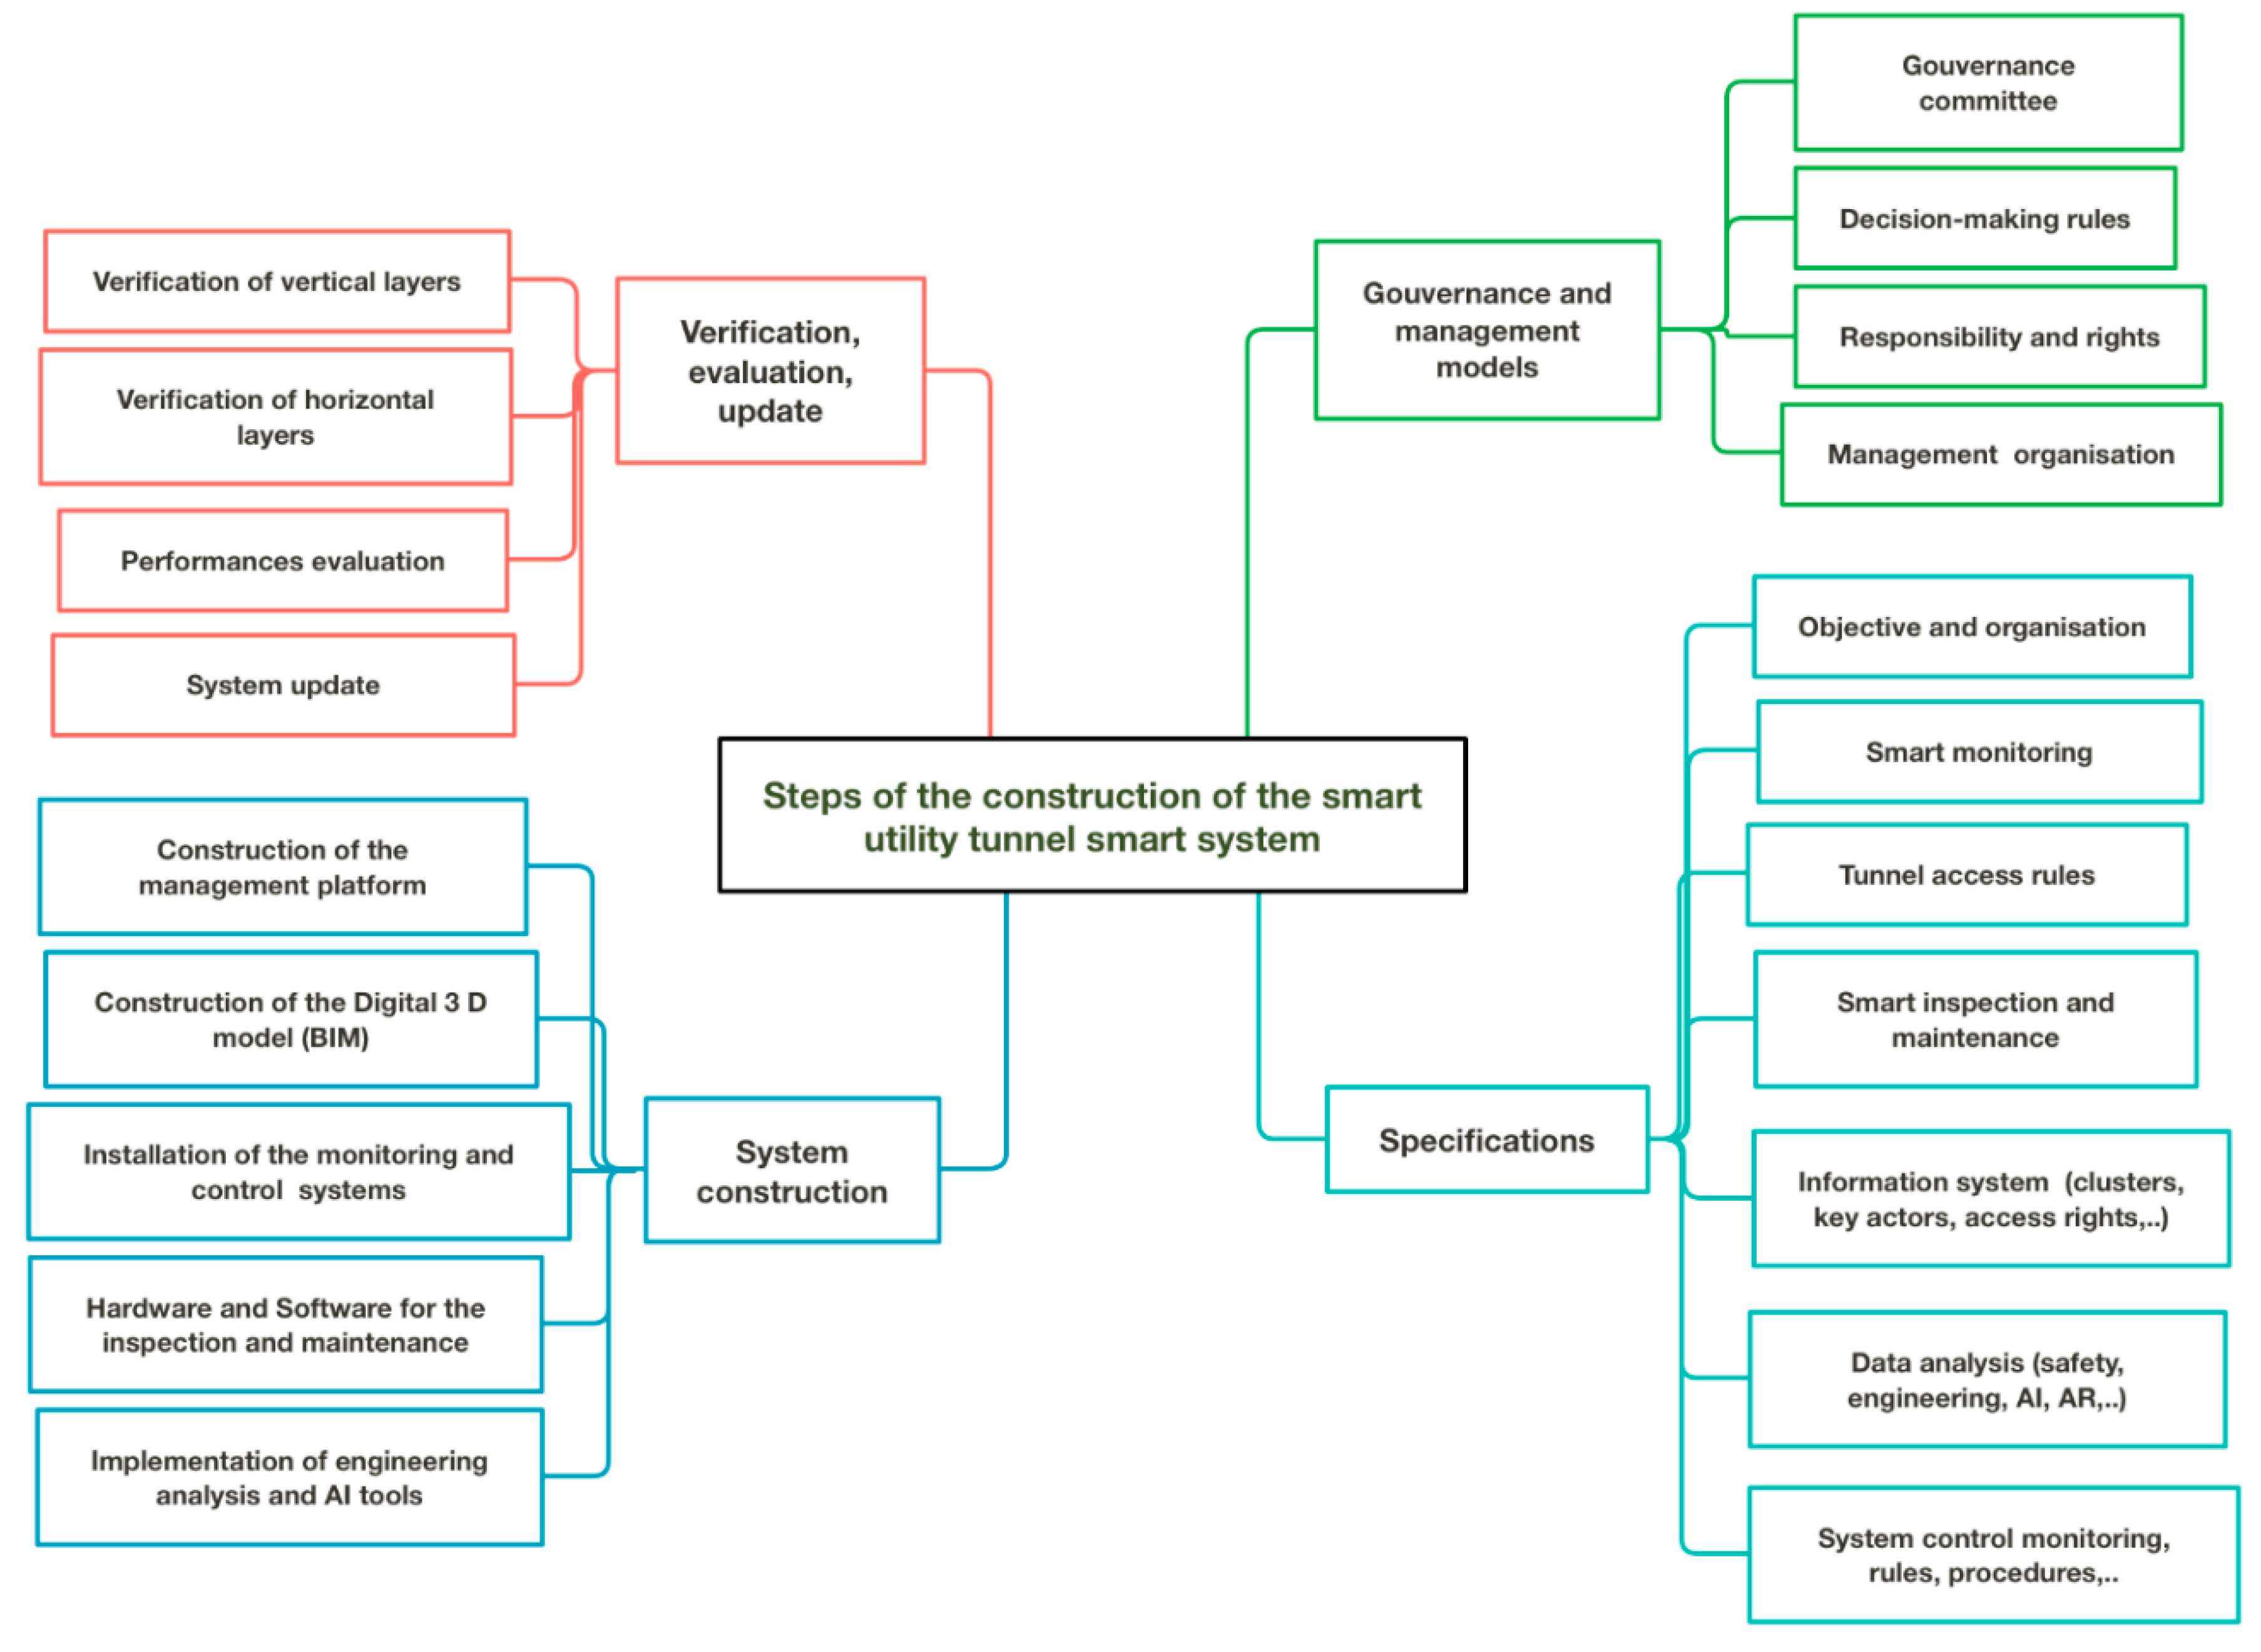
4. Construction of the Smart System
Figure 9 details the methodology of the construction of the smart system for the utility tunnel. It includes four steps: (1) setting up the governance and management system, (2) establishing the smart system specifications, (3) construction of the smart system, and (4) verification, evaluation and update of the system.
Effective governance is crucial for efficient management of the utility tunnel. It is based on a governance committee, which is composed of the tunnel and utilities managers, as well as authorities concerned by the utility tunnel. The governance committee sets up clear rules for decision-making, responsibilities, and rights of the utility tunnel partners, as well as for the management methods.
The specification step concerns establishing specifications for the smart utility tunnel components, such as monitoring, tunnel access rules, inspection, maintenance, information systems, data analysis, system control, and crisis management.
The smart system construction consists of building the components of the system according to the specifications defined in the second step. It concerns the construction of the smart management platform, realization of the 3D digital model of the tunnel and hosted utilities, installation of the monitoring and control systems, implementation of the maintenance and inspection procedures, integration of analysis tools and software, and crisis management procedures.
The last phase concerns the verification and evaluation of the smart system. It concerns verification of vertical layers, which correspond to utilities, as well as horizontal layers, which concern the tunnel and the security layer. The performance of these layers is evaluated regularly according to performance indicators. The system is regularly updated to enhance system security and efficiency.
5. Fire Risk
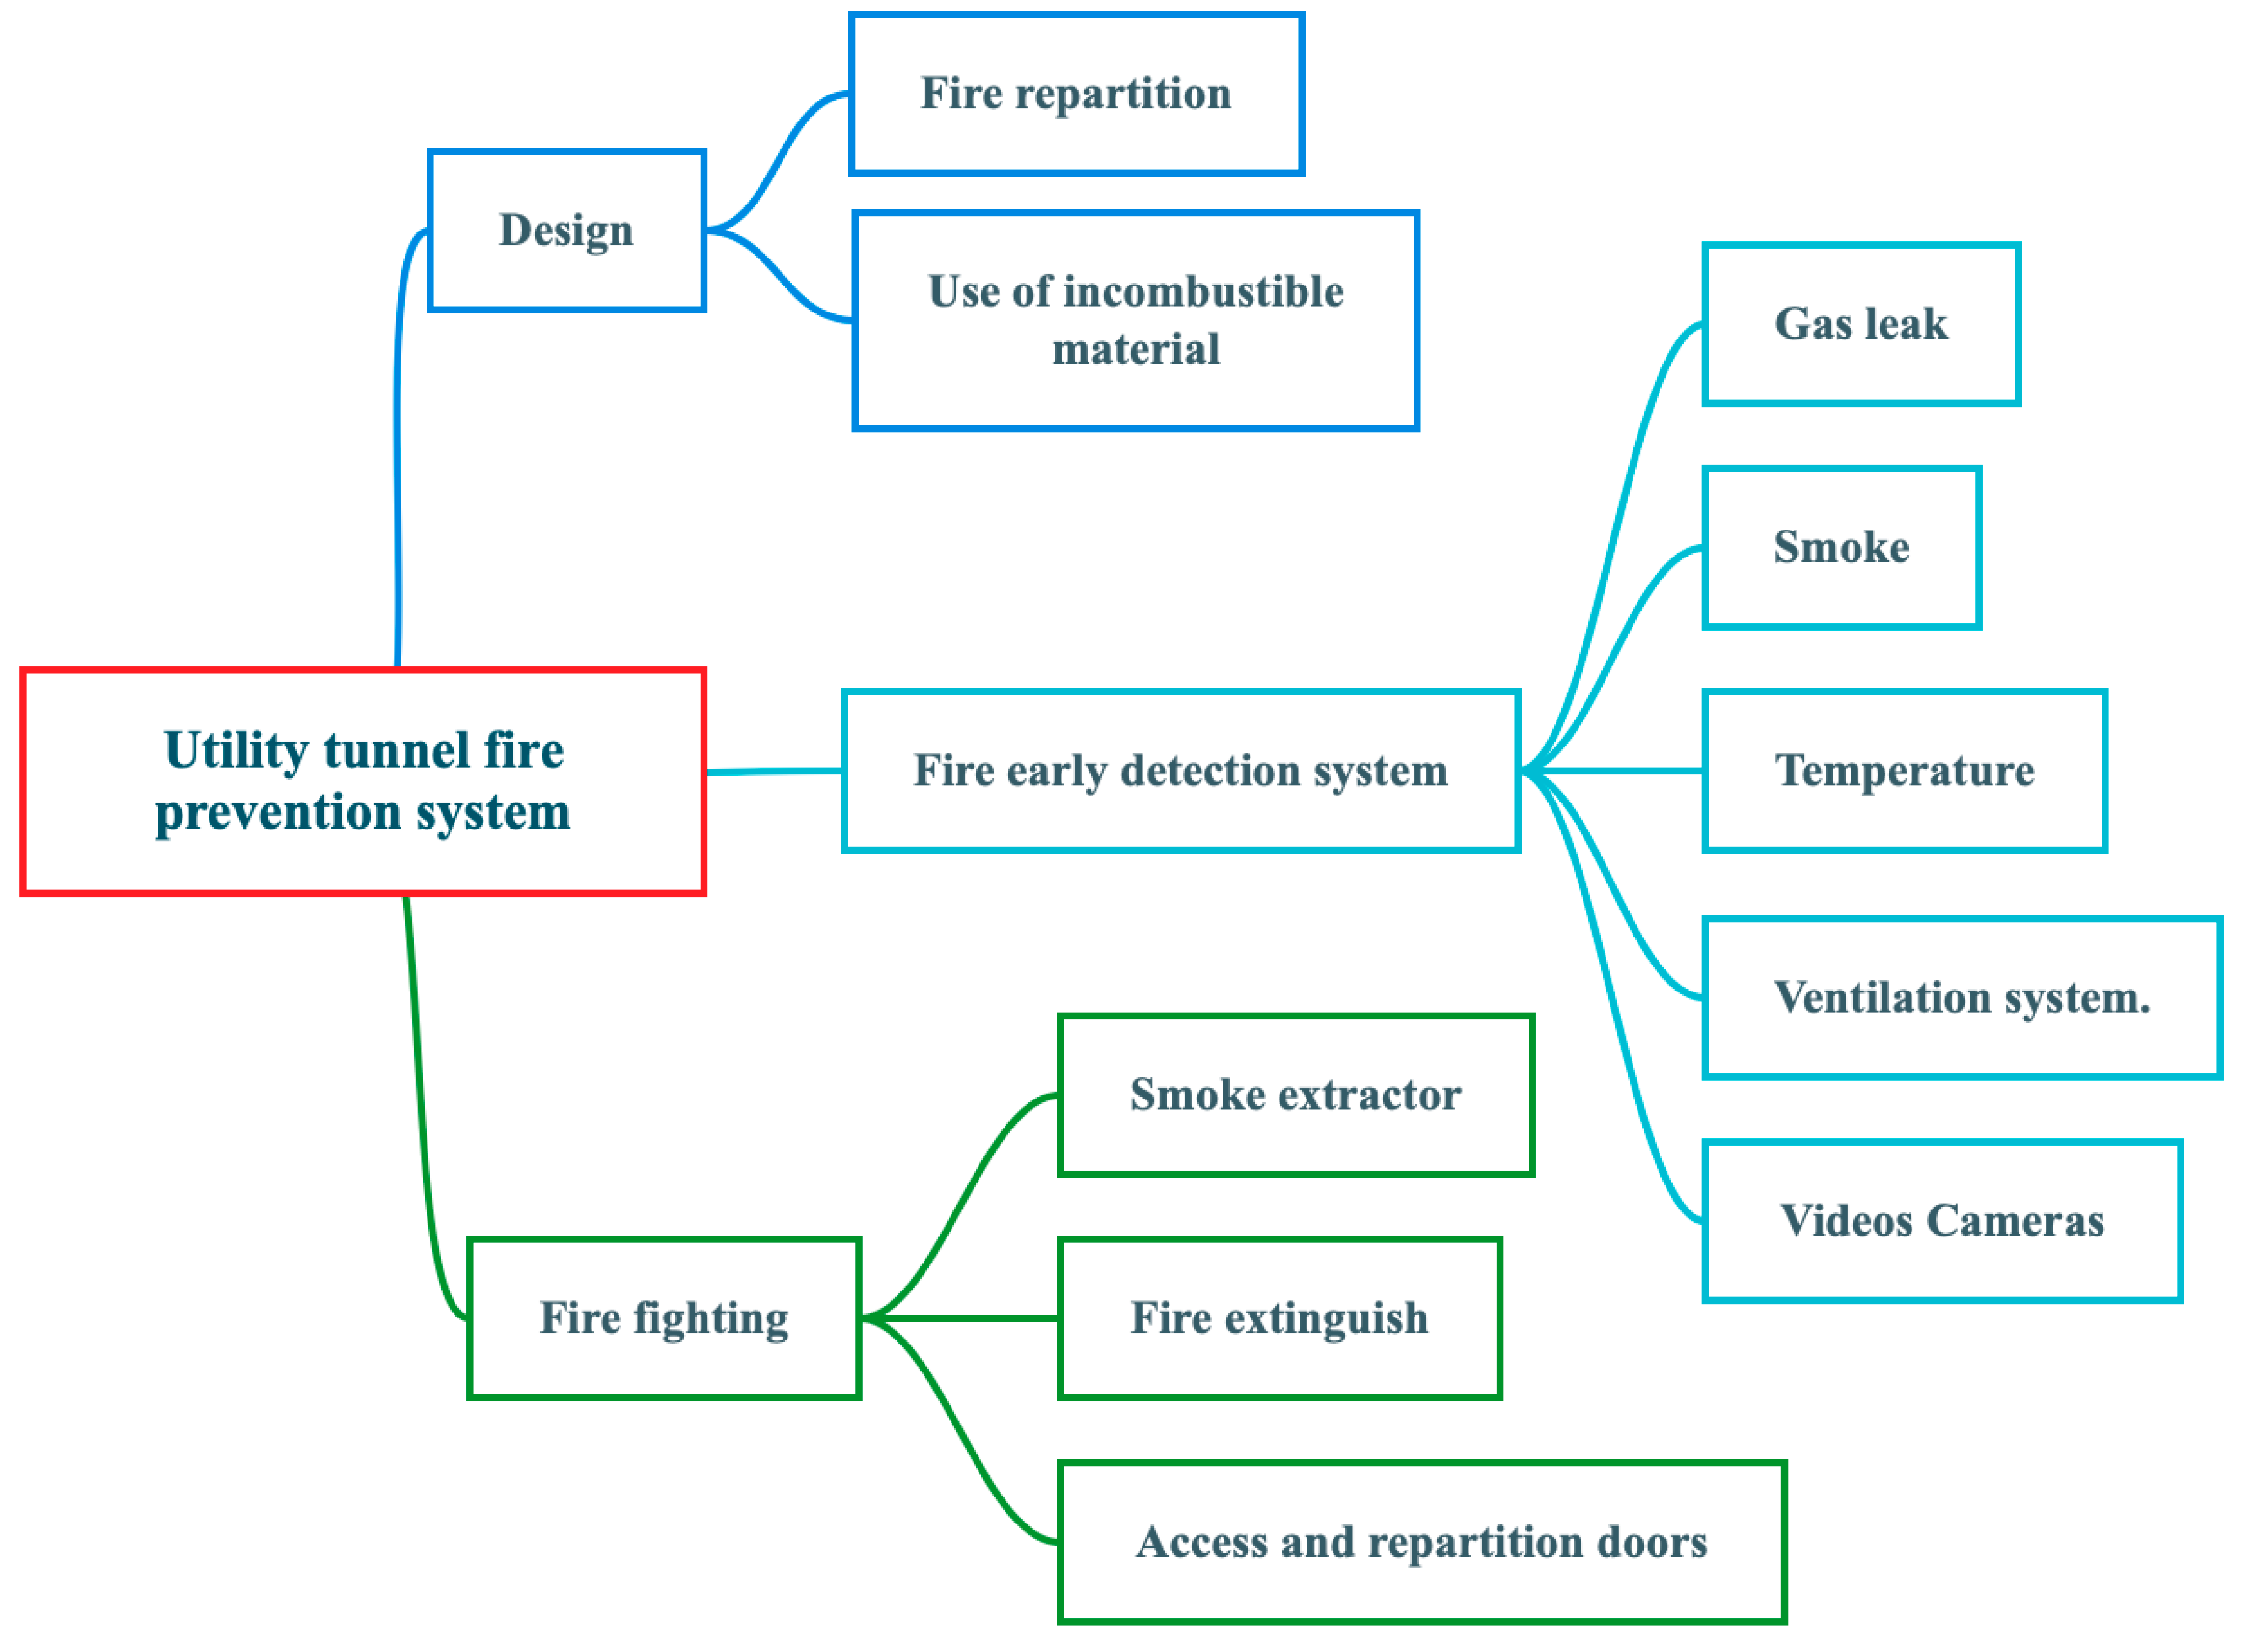
Fire constitutes a major hazard for utility tunnels, because of its dramatic impact on the tunnel and hosted utilities, as well as the multitude of fire risk factors in the utility tunnel. Fire in the utility tunnel can be caused by electrical equipment, gas leaks, sewage combustible gas, insulating materials used in the heating system, ventilation faults, and maintenance activity [22]. Since fire in the utility tunnel can develop and extend very quickly, great attention should be paid to the fire prevention system. This system concerns tunnel design, fire early detection system and firefighting. Figure 10 summarizes the recommendations of Zhang et al. [22] for fire prevention in utility tunnels. Tunnel design focuses on the utility tunnel fire partition and on the use of incombustible materials in the load-bearing structure and tunnel equipment. The fire early detection system includes monitoring of gas leaks, smoke, temperature increases, and ventilation systems. It also includes video cameras. The fighting system includes smoke extraction systems, control of the access and partition doors, and automatic fire extinguishers. The latter can use high-expansion foam for high efficiency and low economy cost.
The smart tunnel system ensures automatic coordination of data collection through the early monitoring system, data analysis using engineering, safety, and IT tools to rapidly detect fire risk, a warning system for technical and emergency services, and automatic control of the firefighting system including door repartitioning, smoke extraction, and fire-extinguishing equipment.
6. Risk Assessment
Risk assessment of the utility tunnel aims at ensuring a safe and healthy environment in the tunnel, as well as the continuity of the tunnel services. The first step in risk assessment concerns the identification of risk hazards related to hosted utilities, such as those related to gas, electrical power, drinking water, sewage, and chilled water, as well as the tunnel ventilation system and maintenance works. Table 1 summarizes risks related to each factor according to Reference [9].
Since security in the utility tunnel is complex with a multitude of interdependent risk factors, it is recommenced to use a qualitative risk assessment approach, which is based on the classification of risks [25,26]. This approach includes two phases. The first phase concerns monitoring of the risk factor using smart sensors or cameras as described in Section 3. The second phase concerns the evaluation of the risk level for each factor according to its impact on the tunnel integrity and services (Severity factor) and to the probability of its occurrence (Likelihood factor). The risk level is estimated as follows:
Risk level = Severity factor × Likelihood factor
Table 2 provides scales used for the determination of likelihood and severity factors, while Table 3 shows the risk level [26]. The determination of the scale of each risk factor should be done according to historical data, as well as according to the operating team and experts’ experiences. In the utility tunnel, the severity factor is generally high, because any hazard in the tunnel could lead to dramatic consequences, while the likelihood factor should be low, because tunnel managers should take technical and operating precautions to reduce the probability of occurrence of any hazard in the utility tunnel. According to Canto-Perello and Curiel-Esparza [9], risk assessment in the utility tunnel should consider a “synergetic” effect; the combination of different risk events could result in an important amplification of the impact of the sum of these events. This effect could be considered by the transformation of Equation (1) as follows:
Risk level = Severity factor × Likelihood factor × Synergetic factor.
The Synergetic factor designates risk amplification due the synergetic effect.
7. Conclusions
This paper presented a smart solution for utility tunnels, which allows improving the security and collective governance of this facility. The construction of this solution was based on discussions with experts and companies involved in the design, construction, and management of utility tunnels. These discussions resulted in the identification of utility tunnel challenges, as well as the specifications and the architecture of the smart solution.
The smart solution allows setting up an efficient collective governance system. At each instant, it provides a multi-scale fine picture of the tunnel and utilities operation and environment, with an improved capacity to early detect abnormal events and to take rapid measurements to confine these events. The construction of this smart solution allows effective involvement of the utility tunnel partners in the design, construction, and use of this comprehensive solution. This involvement constitutes a major key in the optimal and safe management of the utility tunnel.
Risk assessment in the utility tunnel constitutes a major issue. Considering the complexity of this issue, because of the multitude of risk factors and the “synergetic” effect, a qualitative risk assessment approach is proposed. This approach is based on the identification of risk factors, and the determination of severity, likelihood, and synergetic factors. These factors can be determined according to historical data, as well as to the tunnel team and experts’ experiences.
Author Contributions
I.S. worked on the methodology conceptualization and writing the original draft and revised version, while H.B., X.X. and Z.Z. contributed to the methodology and conceptualization. All authors have read and agreed to the published version of the manuscript.
Funding
This research received no external funding.
Conflicts of Interest
The authors declare no conflict of interest.
References
- Kolonko, A.; Madryas, C. Modernization of underground pipes in towns in Poland. Tunn. Undergr. Space Technol. 1996, 11, 215–220. [Google Scholar] [CrossRef]
- Cano-Hurtado, J.; Canto-Perello, J. Sustainable development of urban underground space for utilities. Tunn. Undergr. Space Technol. 1999, 14, 335–340. [Google Scholar] [CrossRef]
- Canto-Perello, J.; Curiel-Esparza, J. Human factors engineering in utility tunnel design. Tunn. Undergr. Space Technol. 2001, 16, 211–215. [Google Scholar] [CrossRef]
- Kuhn, B.; Jasek, D.; Brydia, R.; Parham, A.; Ullman, B.; Blaschke, B. Utility Corridor Structures and Other Utility Accommodation Alternatives in TxDOT Right of Way. Federal Highway Administration Report, FHWA/TX-03/4149-1. 2002. Available online: https://static.tti.tamu.edu/tti.tamu.edu/documents/4149-1.pdf (accessed on 16 September 2019).
- Madryas, C. Forensic investigations of buried utilities failures in Poland. Tunn. Undergr. Space Technol. 2008, 23, 199–205. [Google Scholar] [CrossRef]
- Curiel-Esparza, J.; Conto-Perdlo, J.; Calvo, M.A. Establishing sustainable strategies in urban underground engineering. Sci. Eng. Ethics 2004, 10, 523–530. [Google Scholar] [CrossRef]
- Hunt, D.V.L.; Nash, D.; Rogers, C.D.F. Sustainable utility placement via Multi-utility tunnels. Tunn. Undergr. Space Technol. 2014, 39, 15–26. [Google Scholar] [CrossRef] [Green Version]
- Canto-Perello, J.; Curiel-Esparza, J.; Calvo, V. Strategic decision support system for utility tunnel’s planning applying A’WOT method. Tunn. Undergr. Space Technol. 2016, 55, 46–152. [Google Scholar] [CrossRef]
- Canto-Perello, J.; Curiel-Esparza, J. Risks and potential hazards in utility tunnels for urban areas. Proc. Inst. Civ. Eng. –Munic. Eng. 2003, 156, 51–56. [Google Scholar] [CrossRef]
- Canto-Perello, J.; Curiel-Esparza, J. An analysis of utility tunnel viability in urban areas. Civ. Eng. Environ. Syst. 2006, 23, 11–19. [Google Scholar] [CrossRef]
- Canto-Perello, J.; Curiel-Esparza, J.; Calvo, V. Criticality and threat analysis on utility tunnels for planning security policies of utilities in urban underground space. Expert Syst. Appl. 2013, 40, 4707–4714. [Google Scholar] [CrossRef]
- Curiel-Esparza, J.; Canto-Perello, J.; Calvo, M.A. Use agreements and liability considerations in utility tunnels. In Proceedings of the VII International Congress on Project Engineering, Pamplona, Spain, 8–10 October 2003; Volume 1, pp. 1–6. [Google Scholar]
- Canto-Perello, J.; Curiel-Esparza, J. Assessing governance issues of urban utility tunnels. Tunn. Undergr. Space Technol. 2013, 33, 82–87. [Google Scholar] [CrossRef]
- Sun, F.; Liu, C.; Zhou, X. Utilities tunnel’s finance design for the process of construction and operation. Tunn. Undergr. Space Technol. 2017, 69, 182–186. [Google Scholar] [CrossRef]
- Calvo-Peñ, V.; Cantó-Perello, J.; Jorge Curiel-Esparza, J. Urban underground sustainability: Utility tunnels joint-use case study. In Proceedings of the ICOVACS 2010—International Conference on Value Chain Sustainability, Valencia, Spain, 15–17 November 2010. [Google Scholar]
- Abbas, O.; Abou Rjeily, Y.; Sadek, M.; Shahrour, I. A large-scale experimentation of the smart sewage system. Water Environ. J. 2017, 31, 515–521. [Google Scholar] [CrossRef]
- Abou Rjeily, Y.; Abbas, O.; Sadek, M.; Shahrour, I.; Chehade, F.H. Flood forecasting within urban drainage systems using NARX neural network. Water Sci. Technol. 2017, 76, 2401–2412. [Google Scholar] [CrossRef]
- Farah, E.; Shahrour, I. Leakage Detection Using Smart Water System: Combination of Water Balance and Automated Minimum Night Flow. Water Resour. Manag. 2017, 31, 4821–4833. [Google Scholar] [CrossRef]
- Attoue, N.; Shahrour, I.; Younes, R. Smart Building: Use of the ANN Approach for Indoor Temperature Forecasting. Energies 2018, 11, 395. [Google Scholar] [CrossRef] [Green Version]
- Shahrour, I.; Abbas, O.; Abdallah, A.; Rjeily, Y.A.; Afaneh, A.; Aljer, A.; Ayari, B.; Farrah, E.; Sakr, D.; Al Masri, F. Lessons from a Large Scale Demonstrator of the Smart and Sustainable City. In Happy City Book; Brdulak, A., Brdulak, H., Eds.; Springer International Publishing: Berlin/Heidelberg, Germany, 2017. [Google Scholar] [CrossRef]
- Gilbert, P.H.; Isenberg, J.; Baecher, G.B.; Papay, L.T.; Spielvogel, L.G.; Woodard, J.B. Infrastructure issues for cities—Countering terrorist threat. J. Infrastruct. Syst. 2003, 9, 44–54. [Google Scholar] [CrossRef]
- Zhang, X.; Guan, Y.; Fang, Z.; Liao, Y. Fire risk analysis and prevention of urban comprehensive pipeline corridor. Procedia Eng. 2016, 135, 463–468. [Google Scholar] [CrossRef] [Green Version]
- Lin, P.; Li, Q.B.; Fan, Q.X.; Gao, X.Y. Real-time monitoring system for workers’ behavior analysis on a large-dam construction site. Int. J. Distrib. Sens. Netw. 2013. [Google Scholar] [CrossRef]
- Khoury, H.M.; Kamat, V.R. Evaluation of position tracking technologies for user localization in indoor construction environments. Autom. Constr. 2009, 18, 444–457. [Google Scholar] [CrossRef]
- Dufour, A.; Snozzi, M.; Koster, W.; Bartram, J.; Ronchi, E.; Fewtrell, L.; World Health Organization. Assessing Microbial Safety of Drinking Water, Improving Approaches and Methods, Published on Behalf of the World Health Organization and the Organization for Economic Co-operation and Development by IWA Publishing. 2003. Available online: http://www.who.int/water_sanitation_health/dwq/9241546301full.pdf (accessed on 16 September 2019).
- Saab, C.; Shahrour, I.; Hage Chehade, F. Risk Assessment of Water Accidental Contamination Using Smart Water Quality Monitoring. Expo Health 2019. [Google Scholar] [CrossRef]
Figure 1.
Main advantages of utility tunnels.

Figure 2.
Challenges facing utility tunnels.

Figure 3.
Specifications of the utility tunnel smart system.

Figure 4.
Architecture of the utility tunnel smart management system.

Figure 5.
Tunnel smart monitoring.

Figure 6.
Main utilities monitoring.

Figure 7.
Inspection and maintenance data of the tunnel and hosted utilities.

Figure 8.
Data clusters in the information system.

Figure 9.
Construction of the utility tunnel smart system.

Figure 10.
Utility tunnel fire prevention system.


Table 1.
Risk factors in the utility tunnel [9].
Table 1.
Risk factors in the utility tunnel [9].
| Tunnel Component | Related Risk |
|---|---|
| Gas lines | Gas leaks |
| Electrical equipment | Combustible material used, wires and equipment, electrical circuits, line heating |
| Drinking water | Water leaks |
| Sewage | Toxic and flammable emissions, humidity, floods, |
| Chilled water | presence of toxic gases and microorganisms, water leaks, heating of the tunnel equipment |
| Ventilation | Mechanical or electrical faults |
| Maintenance work | Fire, damage to existing equipment |
Table 2.
Scales for likelihood and severity factors.
| Likelihood Factor Scale | Severity Factor Scale | ||
|---|---|---|---|
| Category | Scale | Category | Scale |
| Likely | 4 | Major | 4 |
| Moderate | 3 | Moderate | 3 |
| Unlikely | 2 | Minor | 2 |
| Rare | 1 | Insignificant | 1 |
Table 3.
Risk-level estimation from likelihood and severity factors.
| Severity of Consequences | ||||
|---|---|---|---|---|
| Likelihood | Insignificant | Minor | Moderate | Major |
| Likely | Moderate | High | High | Very High |
| Moderate | Low | Moderate | High | High |
| Unlikely | Low | Moderate | Moderate | High |
| Rare | Low | Low | Low | Moderate |
© 2020 by the authors. Licensee MDPI, Basel, Switzerland. This article is an open access article distributed under the terms and conditions of the Creative Commons Attribution (CC BY) license (http://creativecommons.org/licenses/by/4.0/).
Share and Cite
MDPI and ACS Style
Shahrour, I.; Bian, H.; Xie, X.; Zhang, Z. Use of Smart Technology to Improve Management of Utility Tunnels. Appl. Sci. 2020, 10, 711. https://0-doi-org.brum.beds.ac.uk/10.3390/app10020711
AMA Style
Shahrour I, Bian H, Xie X, Zhang Z. Use of Smart Technology to Improve Management of Utility Tunnels. Applied Sciences. 2020; 10(2):711. https://0-doi-org.brum.beds.ac.uk/10.3390/app10020711
Chicago/Turabian StyleShahrour, Isam, Hanbing Bian, Xiongyao Xie, and Zixin Zhang. 2020. "Use of Smart Technology to Improve Management of Utility Tunnels" Applied Sciences 10, no. 2: 711. https://0-doi-org.brum.beds.ac.uk/10.3390/app10020711
Note that from the first issue of 2016, this journal uses article numbers instead of page numbers. See further details here.