Optical Wave Guiding and Spectral Properties of Micro/Nanofibers Used for Quantum Sensing and Quantum Light Generation


Quantum Physics Technology Directorate, Agency for Defense Development, Daejeon 34186, Korea
*
Author to whom correspondence should be addressed.
Appl. Sci. 2020, 10(2), 715; https://0-doi-org.brum.beds.ac.uk/10.3390/app10020715
Submission received: 10 December 2019
/
Revised: 14 January 2020
/
Accepted: 15 January 2020
/
Published: 20 January 2020
(This article belongs to the Special Issue Recent Development of Quantum Sensing and Metrology)
Abstract
:Subwavelength optical micro/nanofibers have been widely used as basic building blocks in the field of quantum sensing and quantum light source by virtue of their properties which include pronounced evanescent field, large surface area, and small optical mode area. This paper presents theoretical studies on the propagation properties of the guided optical wave and the spectral properties of entangled photons from spontaneous four-wave mixing in micro/nanofibers. We first analyze numerically single-mode propagation, field distribution, fraction of power, and group-velocity-dispersions by solving Maxwell’s equations with boundary conditions in cylindrical coordinates. Then, optical wave guiding properties of micro/nanofibers are applied to estimate the spectral properties such as central wavelengths and bandwidths of the created photons via spontaneous four-wave mixing that can be tailored by controlling diameter and length of micro/nanofibers. This theoretical work provides useful guidelines to design micro/nanofiber-based quantum sensing and quantum light sources for quantum technologies.
1. Introduction
Optical micro/nanofibers (MNFs) are usually referred to one-dimensional optical waveguide with the diameter close to or smaller than the wavelength of guided light, which confines and guides the beam by the total internal reflection at the silica(SiO)-air interface [1,2,3,4]. Recently, MNFs have been extensively studied for quantum optics and photonic quantum information because of their extraordinary properties which include low transmission loss, high-nonlinearity, large evanescent fields, and small bending radius [5,6,7,8]. The strong radial confinement much longer than the Rayleigh range of a focused Gaussian beam has made it possible to efficiently couple atoms to the fiber mode via the evanescent field [9,10,11,12,13]. With these waveguiding properties, MNFs, so far, have been used for broad application in optical sensing [14,15,16,17,18,19,20,21,22,23], optical trapping [24,25], evanescent field coupling [26], and quantum optics [27,28]. Also, the flexibility and mechanical strength of MNFs have been able to offer great advantage to demonstrate various microstructures as sensing head, such as loop, coil, and optical coupler [29,30,31]. In addition, thanks to the strong field confinement and tunable dispersion, MNFs have been applied to nonlinear optics [32,33,34,35,36]. Furthermore, MNFs have been used as quantum light sources based on spontaneous four-wave mixing (SFWM) process, that are suitable for directly connecting to other fiber-based system with negligible coupling loss [37,38,39,40,41]. Their small optical mode areas provide low-threshold optical nonlinear effect, so that MNFs significantly enhance photon-pair generation in a short length of MNF. Compared to the area of normal single-mode fiber about 100 m, an MNF has 1 m. A few years ago, the generation of correlated photon-pairs via SFWM was experimentally demonstrated in a micro/nanofiber [42]. By using 15 cm long MNF with the diameter of 900 nm and the laser centered at 1040 nm, correlated photon-pairs were generated at 1310 nm and 850 nm, respectively, that are compatible with the telecom-band fiber system and the high efficiency single photon detector (SPD) for the near IR region. In a very recent study, photon-pairs were generated in a 12 cm long MNF with a 615 nm diameter [43]. For the 725 nm pump beam, the signal and idler photons were created at 632 and 850 nm, respectively, which can be detected by Si-based SPDs with high quantum efficiency.
In this work, we theoretically investigate optical wave guiding properties and the spectral properties of entangled photon pairs via SFWM process in MNFs. Thanks to the extraordinary properties such as pronounced evanescent field and small mode area, MNFs have become powerful tools for quantum sensing, detection, and photon-pair generation. In particular, by controlling the waveguide dimension, photon-pairs are designed at one’s desired wavelengths. Here, based on the exact solutions of the Maxwell’s equations, we first numerically calculate the propagation constants for guided optical modes through a circular silica-air optical fiber with a subwavelength-diameter, and then evaluate field distributions, fractional power, effective diameters, group velocity, and group-velocity-dispersions according to the changes of the fiber diameter and the wavelength of the light. Finally, optical wave guiding properties based on numerical caculations are applied to estimate spectral properties such as central wavelengths and bandwidths of the created photons via spontaneous four-wave mixing in MNFs.
This paper is organized as follows: Section 2 is devoted to the analysis of the Maxwell’s equation in the step-index cylindrical wire model, and from the exact solutions of the Maxwell’s equation, Section 3 presents propagation constants and fundamental modes in MNFs. Based on the mode properties, Section 4 and Section 5 describe the fractional power, effective diameter, group velocity, and group velocity dispersion that are essential parameters to estimate spectral properties of entangled photon-pair via spontaneous four-wave mixing (SFWM). In Section 6, the SFWM in an MNF is introduced with phase-matching conditions, and finally spectral properties of created photons are shown in Section 7. It is summarized in Section 8.
2. Light Propagation in Step-Index Cylindrical Wires
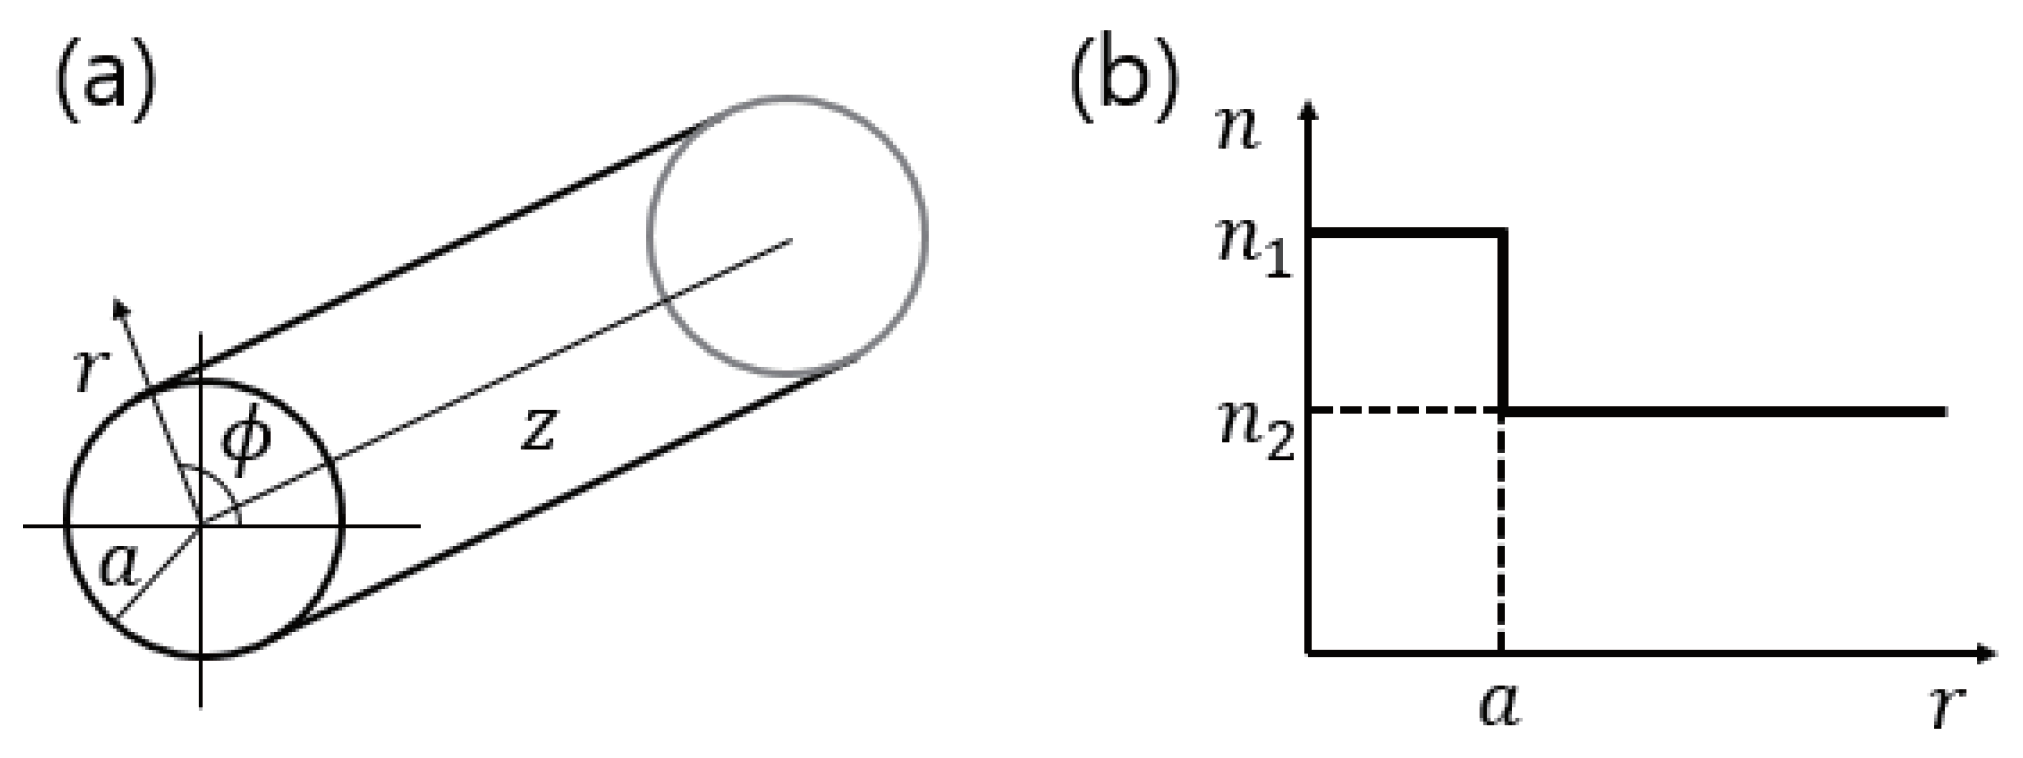
We first consider the geometry of a step-index optical fiber with a circular cross-section as shown in Figure 1a. An MNF has a silica core of radius a with refractive index and an infinite air-clad of refractive index of . The corresponding refractive index profile can be written as
where . According to the Sellmeier equation, the refractive index for fused silica at room temperature can be given by [44]
Since a short length of the MNF is sufficient for microphotonic scales, we assume that both media are non-absorbing and have a magnetic permeability equal to the vacuum permeability . The corresponding Maxwell’s equations can be reduced to Helmholtz equations [1,3]
where , is the wavelength of the light, is the propagation constant, and are the electric field vector and the magnetic field vector, respectively. The longitudinal propagation constant of various modes can be determined by the eigenvalue equations of Equation (3) [1,3,45]:
with
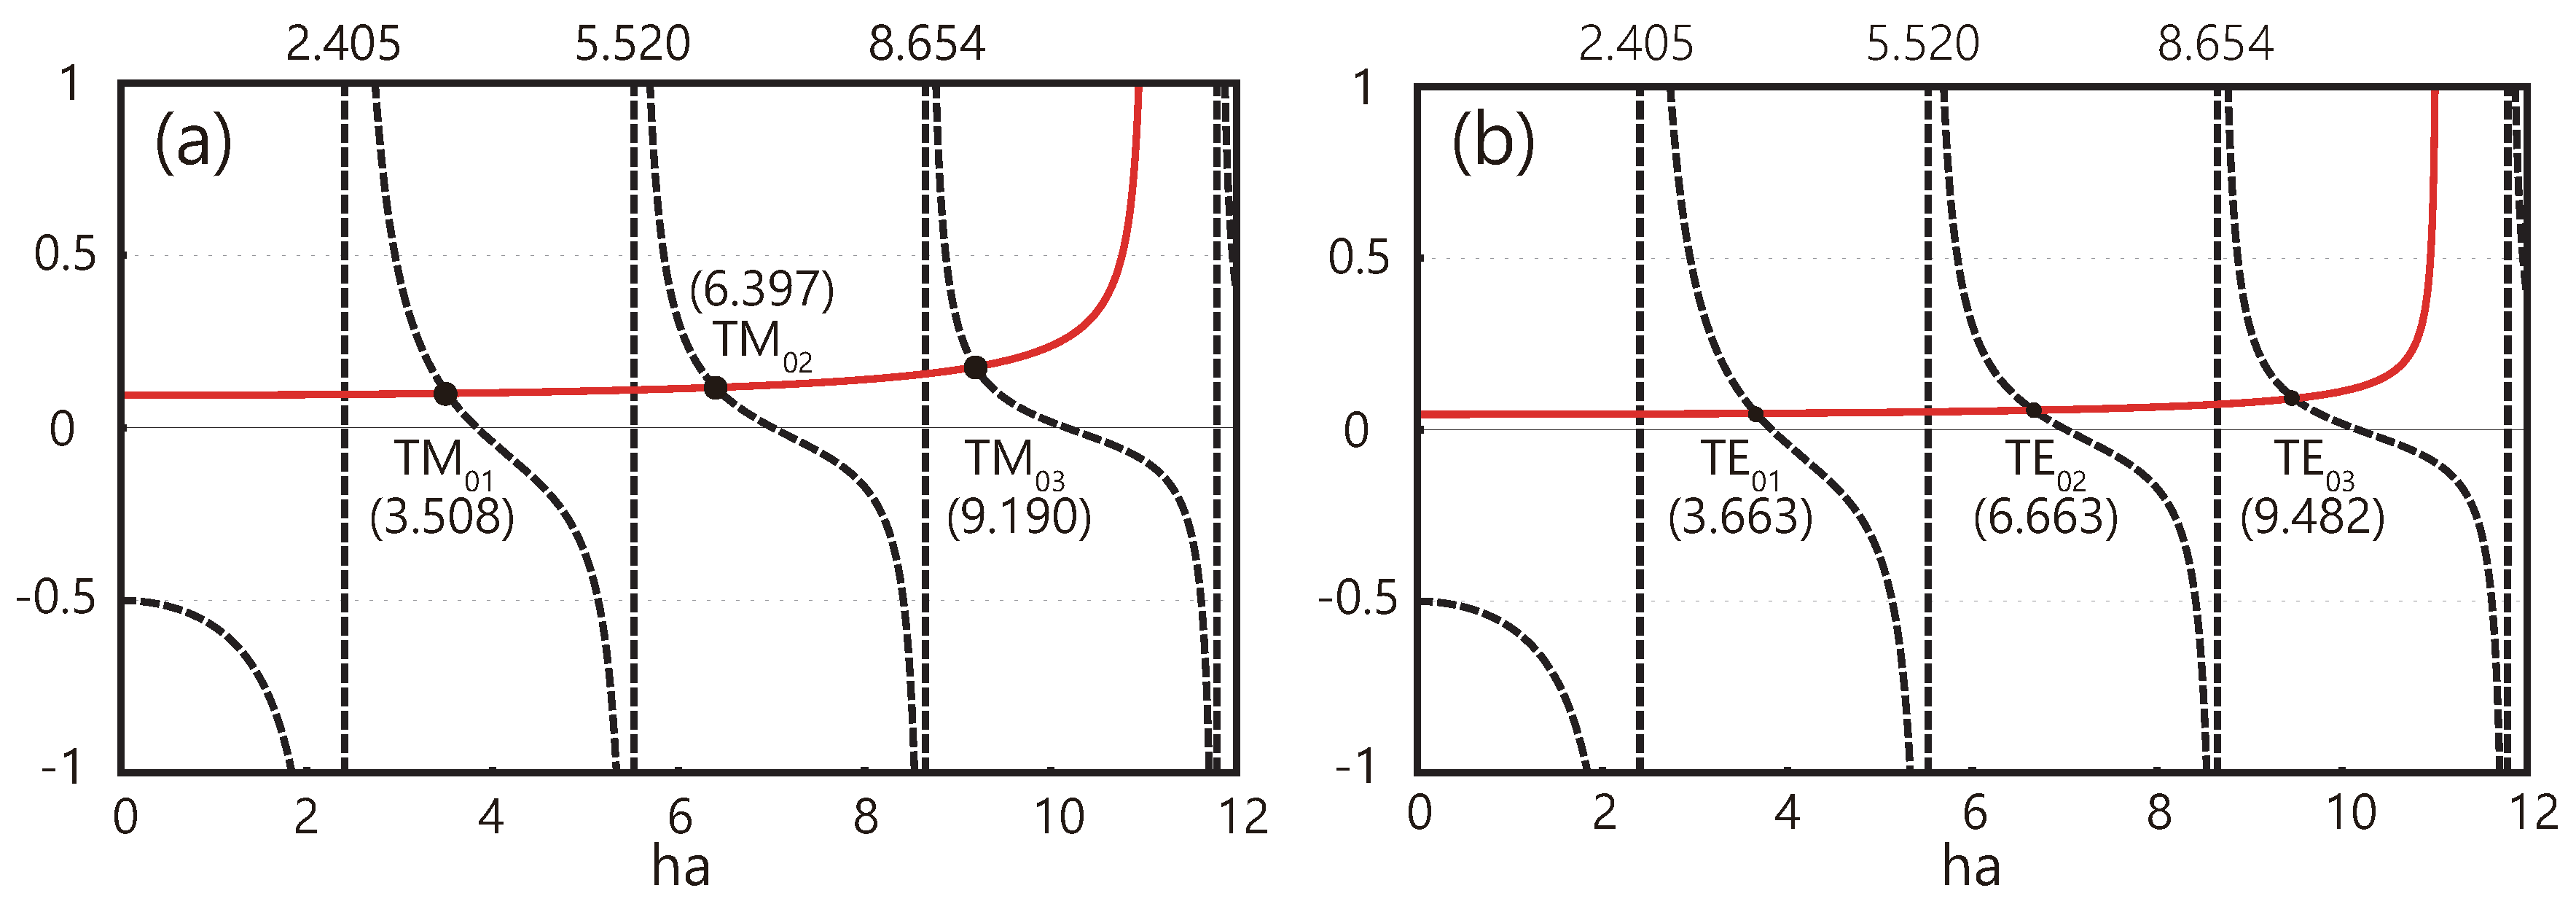
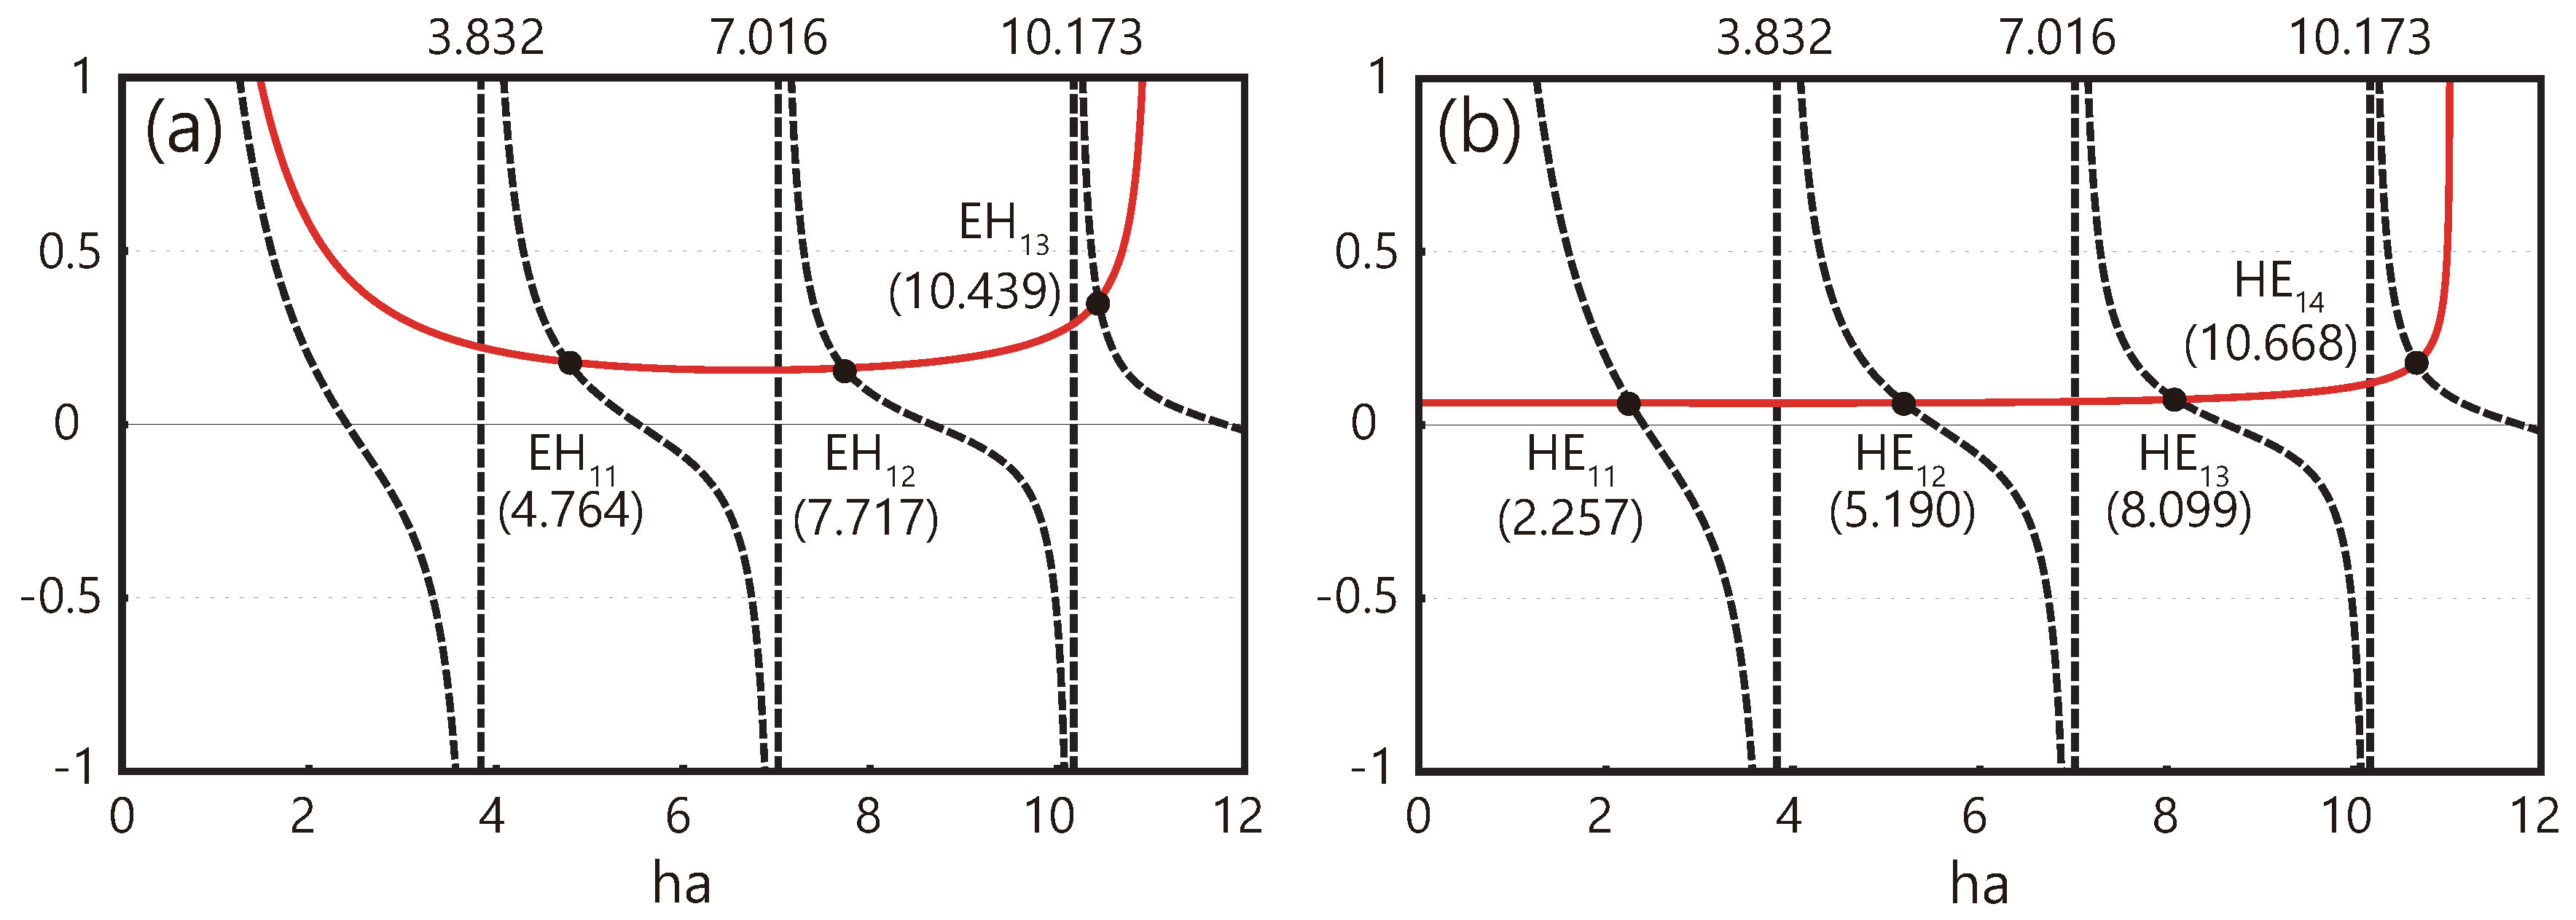
where and characterize the fields inside and outside the fiber. These two parameters are directly related to the V-number, which determines the fraction of the optical power in a certain mode confined to the fiber core. and are the Bessel functions of the first kind and the modified Bessel functions of the second kind, respectively. There are different solutions depending on the value l in Equation (4). For , the ± signs stand for the TM and TE modes that are transversal magnetic and electric modes, respectively. For , the ± signs lead to two different states of modes, the HE and EH which imply being larger and smaller than , respectively [45,46].
Figure 2 shows the solutions of the TM and TE modes of Equation (4) that the magnetic field (electric field) is perpendicular to the fiber axis. Both modes are placed at . That means that any non-fundamental mode is not allowed to propagate inside the fiber below the lowest cut-off value of 2.405. Therefore, the single mode condition for the silica-air waveguide is . Figure 3 shows the solutions of the EH and HE modes at . There is a lower limit in V-number for the EH modes so that the EH modes are not allowed below the single mode condition. The HE mode is only the fundamental mode which can always propagate inside the fiber since it has no cut-off value.
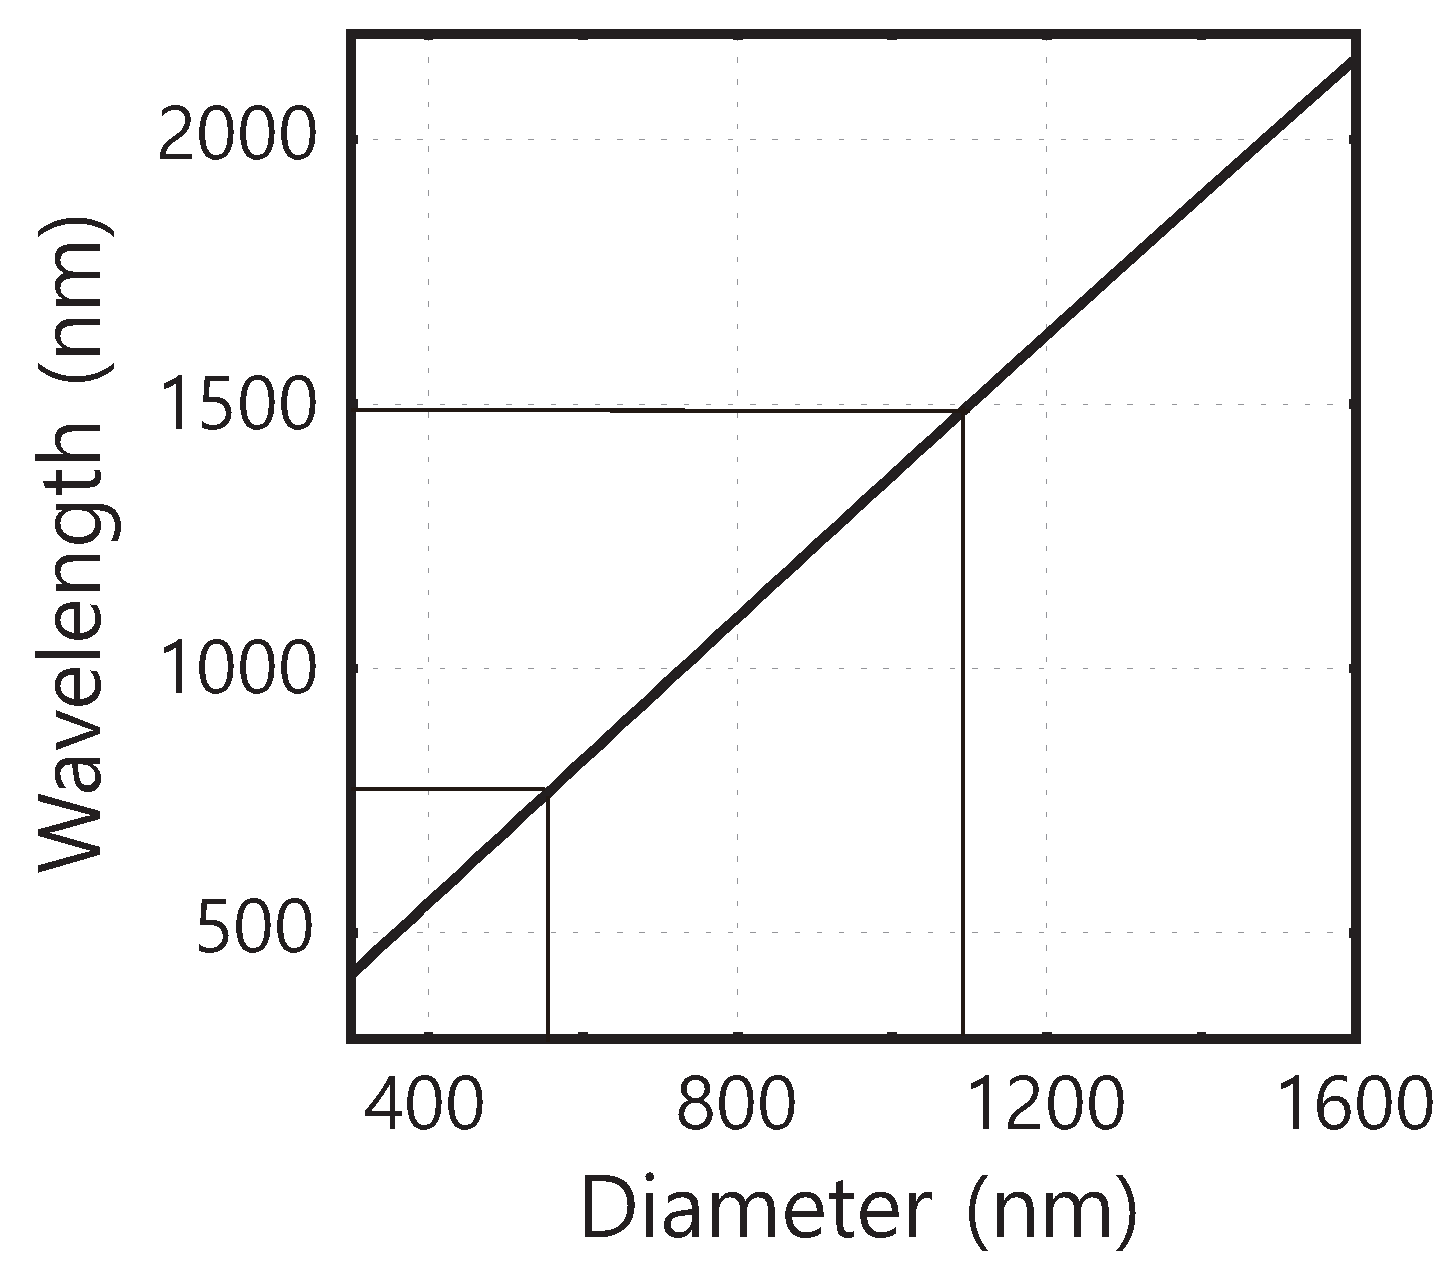
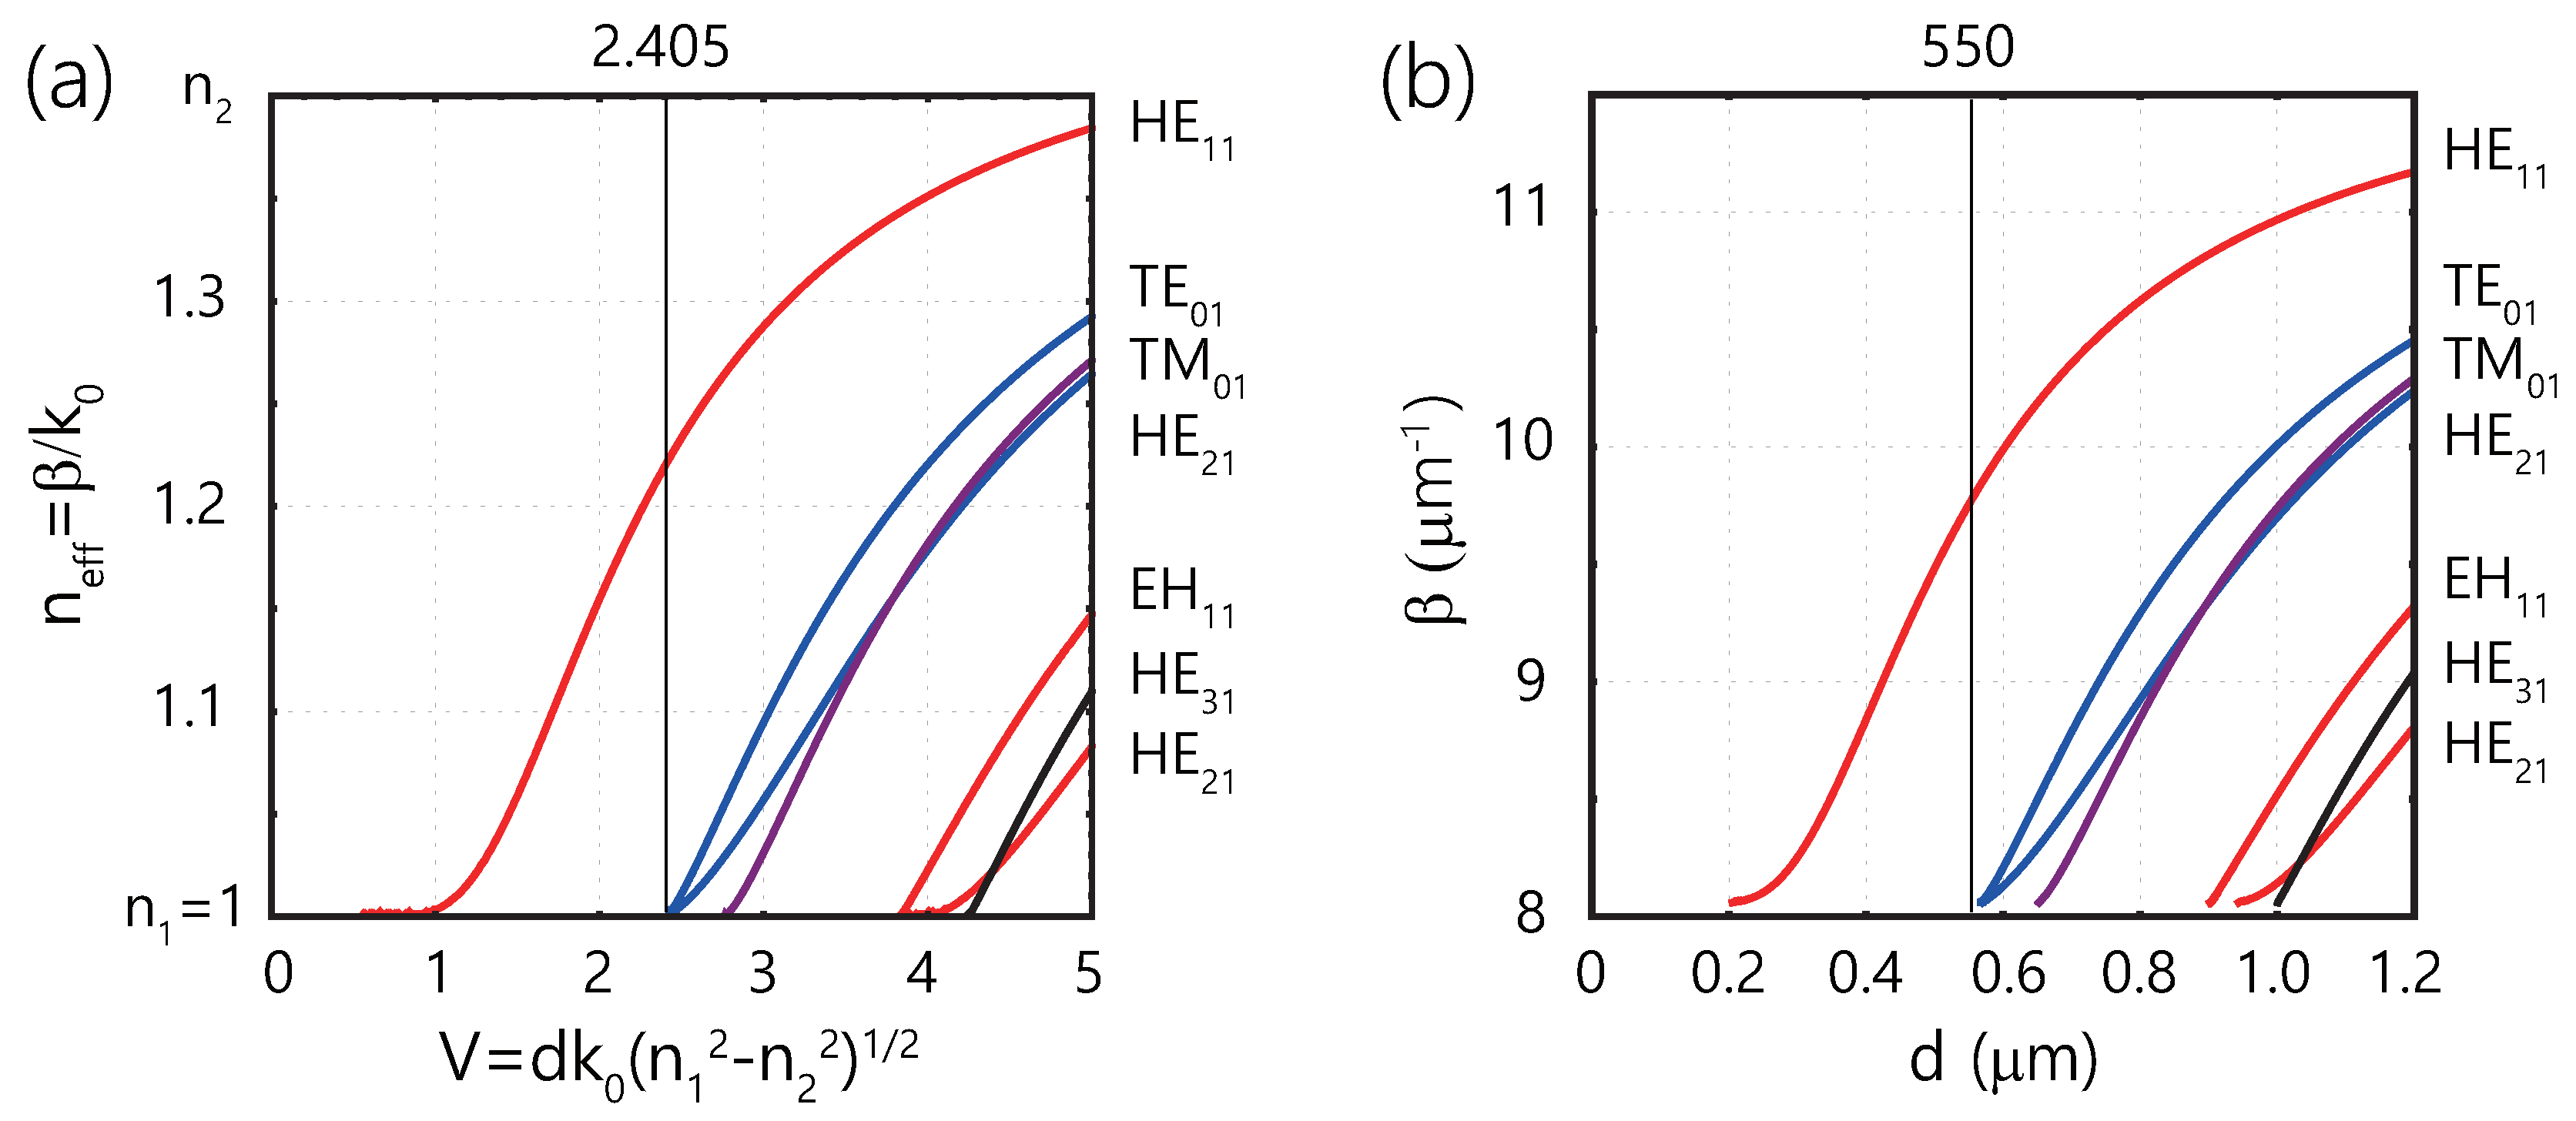
Figure 4 shows the single mode condition of the silica-air waveguide as a function of the wavelengths and wire diameters. A silica-air MNF with a diameter less than 550 nm will always have a single-mode propagation at the wavelength of 780 nm. For the telecom-band wavelength of 1.5 m, a diameter of MNF should be less than 1.1 m to be a single-mode waveguide.
3. Propagation Constant and Fundamental Mode HE
In order to investigate the propagation constant as a function of a diameter d, the Equation (4) can be rewritten in terms of and d,
Figure 5a presents the propagation constant (or effective refractive index) as a function of V-number for the first seven modes. The first two excited modes TM and TE lie at so that the single-mode and multi-mode regimes are clearly distinguished. When V-number decreases, tends to be close to . It means that the field will propagate more into the surrounding medium while decreasing the diameter. Figure 5b shows the dependence of the propagation constant as a function of a diameter at the wavelength of 780 nm. The HE mode only propagates for 550 nm.
We now study a fundamental mode HE with rotating polarization. In the cylindrical coordinates (), for (inside the fiber), the solutions of Maxwell’s equations for the electric field can be given by [1,45,47]
For ,
where
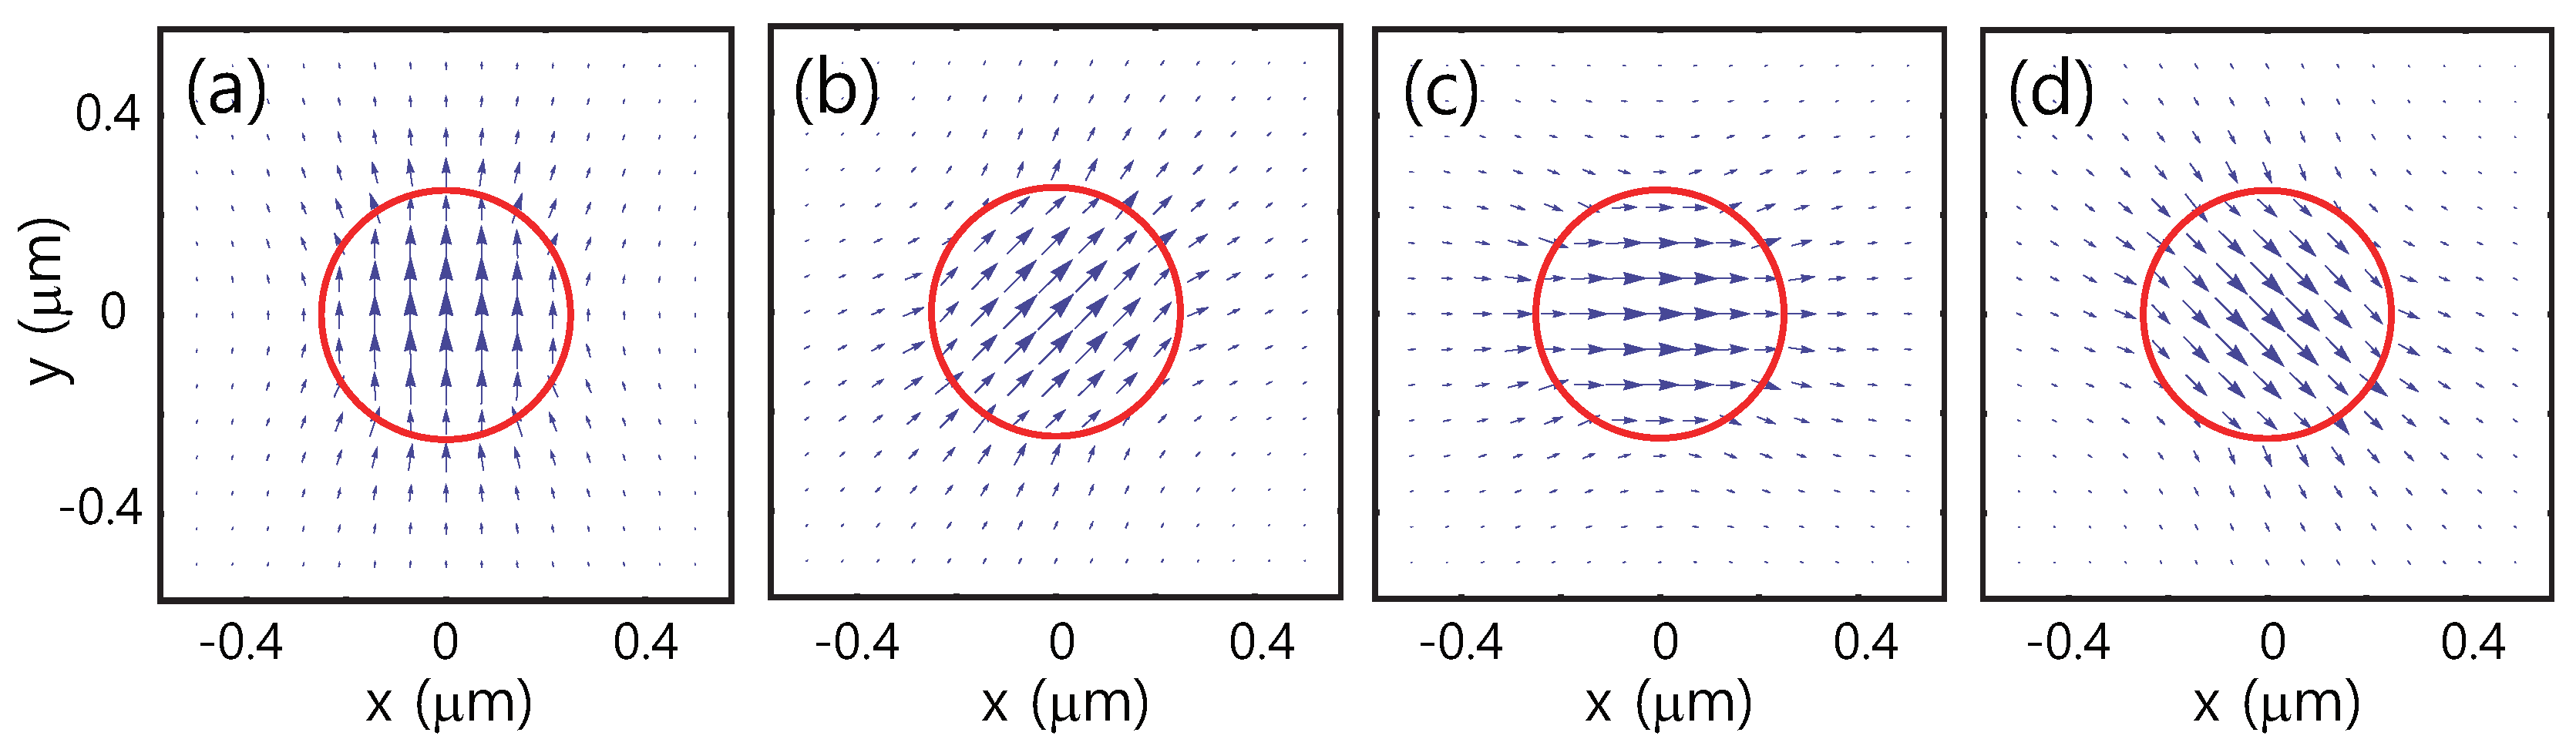
The +(−) sign in Equations (7) and (8) accounts for clockwise (counterclockwise) rotation of the polarization around the z-axis. The coefficient A is determined by the normalization condition. Figure 6 shows vector plots of the electric field component transversal to the z-axis at time , and . We perform numerical calculations for a silica-air fiber with a radius nm at a wavelength of nm. A red circle describes the fiber surface. With increasing time, the real part of the transversed electric field rotates along the circular or elliptical with respect to the fiber axis.
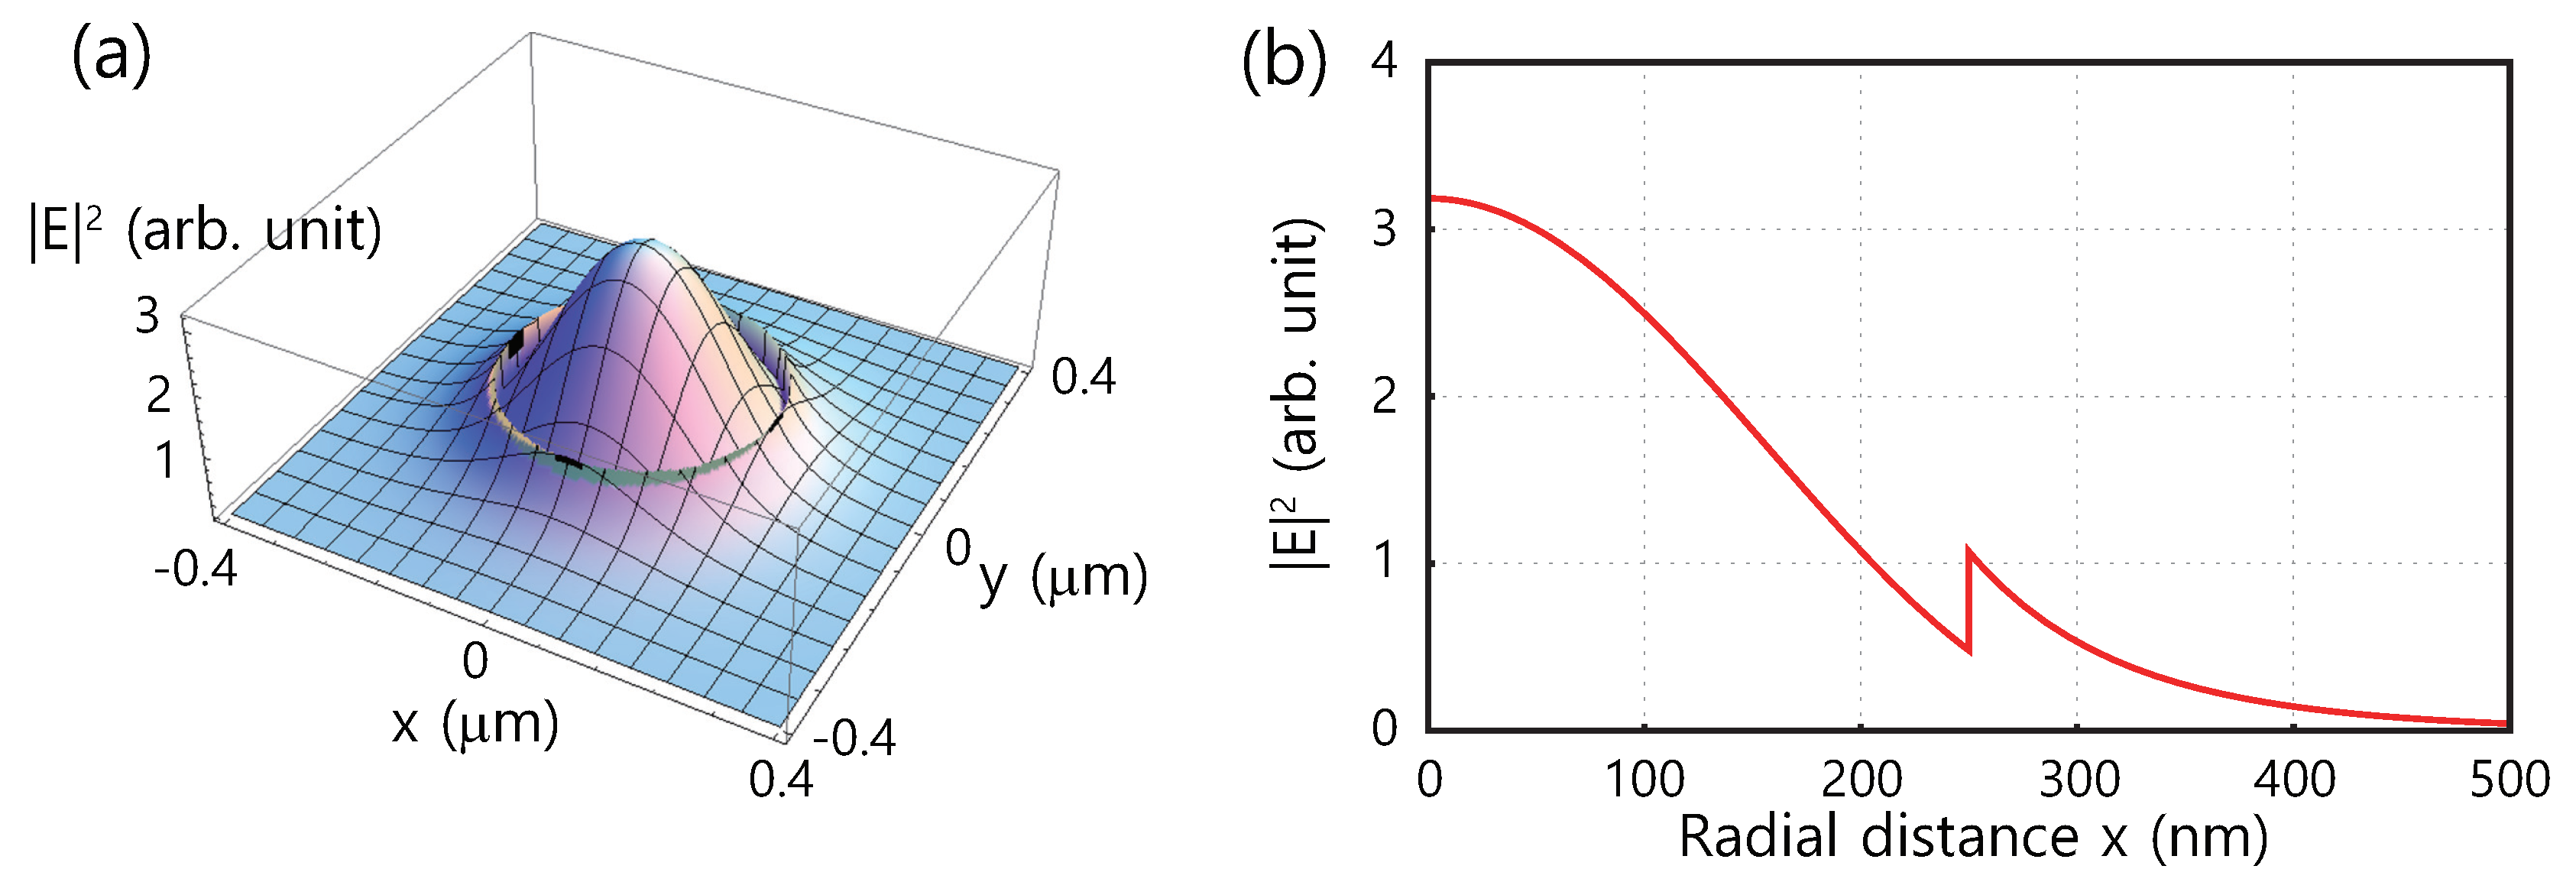
To apply for sensing and trapping of atoms by the optical force of an evanescent wave around an MNF [10,11,12], it is necessary to calculate the optical potential which is proportional to the total intensity of the electric field. From the electric field in the HE mode with rotating polarization, we can easily calculate the total intensity which is given by
Since the total intensity is independent of , the distribution of is cylindrically symmetric as shown in Figure 7. Since the polarization of the field breaks the symmetry, in general, the electric field propagating in the fiber is not cylindrically symmetric. However, for the rotating polarization, averaging over a period washes out this symmetry breaking. The regions of and can be clearly identified due to the discontinuity at the boundary . This strong discontinuity arises from the large refractive index difference between the bulk and the surrounding medium as well as from the strong radial confinement of the field when .
We now present the field equations of the fundamental HE mode with quasi-linear polarization. In the cylindrical coordinates (), for (inside the fiber), the solutions of Maxwell’s equations for the Cartesian components of the electric field can be obtained by [1,45,47]
For ,
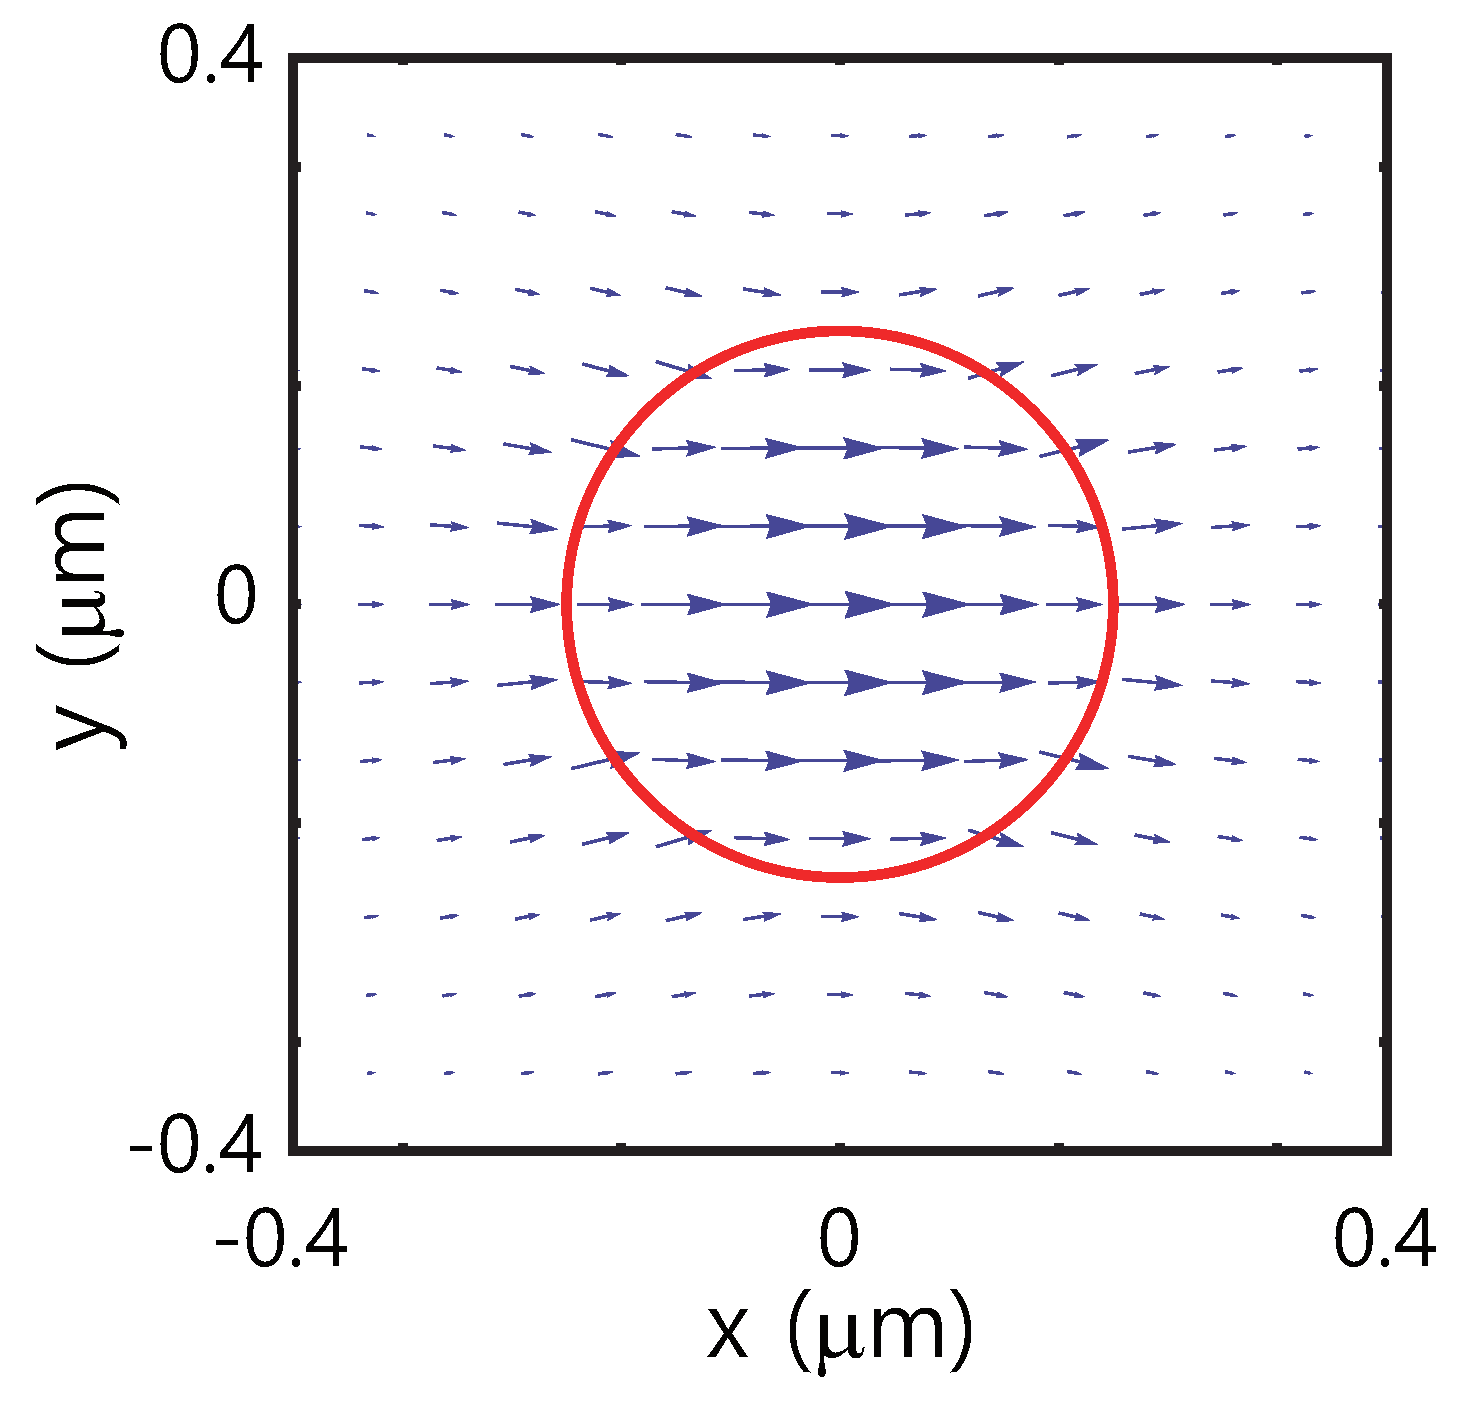
The angle accounts for the orientation axis of the polarization of the electric field. Two sets of the solutions corresponding to and imply x-polarization and y-polarization, respectively. On the contrary to the rotational polarization, the polarization of transversed field does not depend on time but it is position-dependent as shown in Figure 8. The total intensity of the electric field can be given by
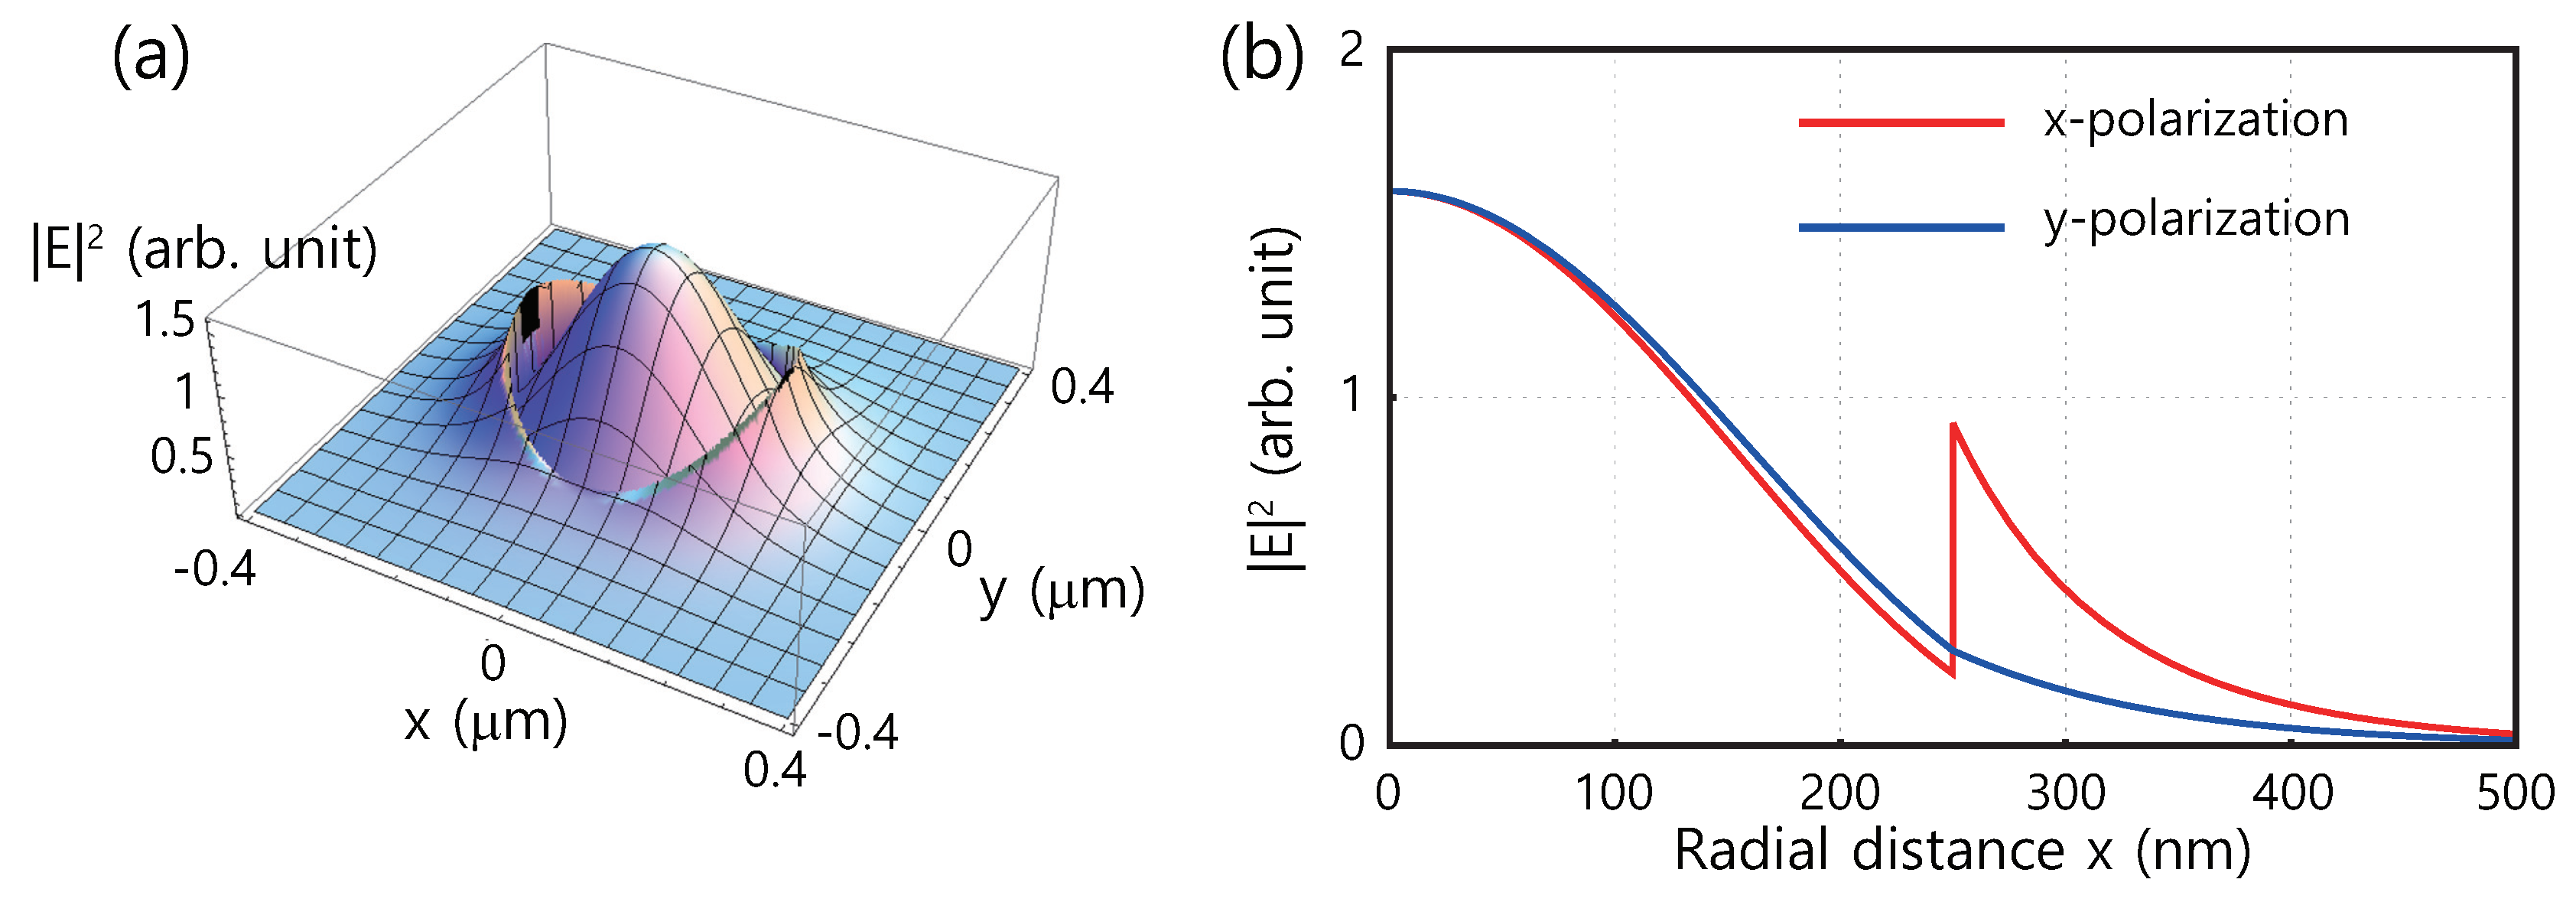
Figure 9a presents the total intensity of the electric field in a fundamental HE mode with quasi-polarization. We choose the x-axis as the major orientation of polarization (). A discontinuity of the field intensity takes place at the fiber surface because of the boundary condition for the radial component of the electric field. It is dramatically induced by the large gap between the refractive indices and . The spatial distribution of the field intensity is not cylindrically symmetric. The terms in Equation (13) break the symmetry and make much larger evanescent field in the regions, where the field component is transversal to the fiber surface.
Figure 9b shows the spatial distribution of the field along the different polarization axis. The z-component of the electric field disappears while the transversed component is parallel to the fiber surface, and it becomes the maximum value while the transversed component is perpendicular to the fiber surface. For the HE mode with quasi-linear polarization, the evanescent field on the surface of an MNF can reach the maximum intensity at . In fiber-based sensing application, the diameter-dependent power density at the fiber-air interface is important to design possible strong interaction outside the media [48].
4. Fraction of Power Propagating Inside and Outside a Micro/Nanofiber
In this section, we investigate the fractional power and effective diameter of the fundamental mode guided in an MNF. In the case of propagation in an optical fiber, the average flux transmitted through the fiber is written by the z-component of the cycle-averaged Poynting vector [49]
For the HE mode, the z-components of Poynting vector are obtained by [1,3]
where
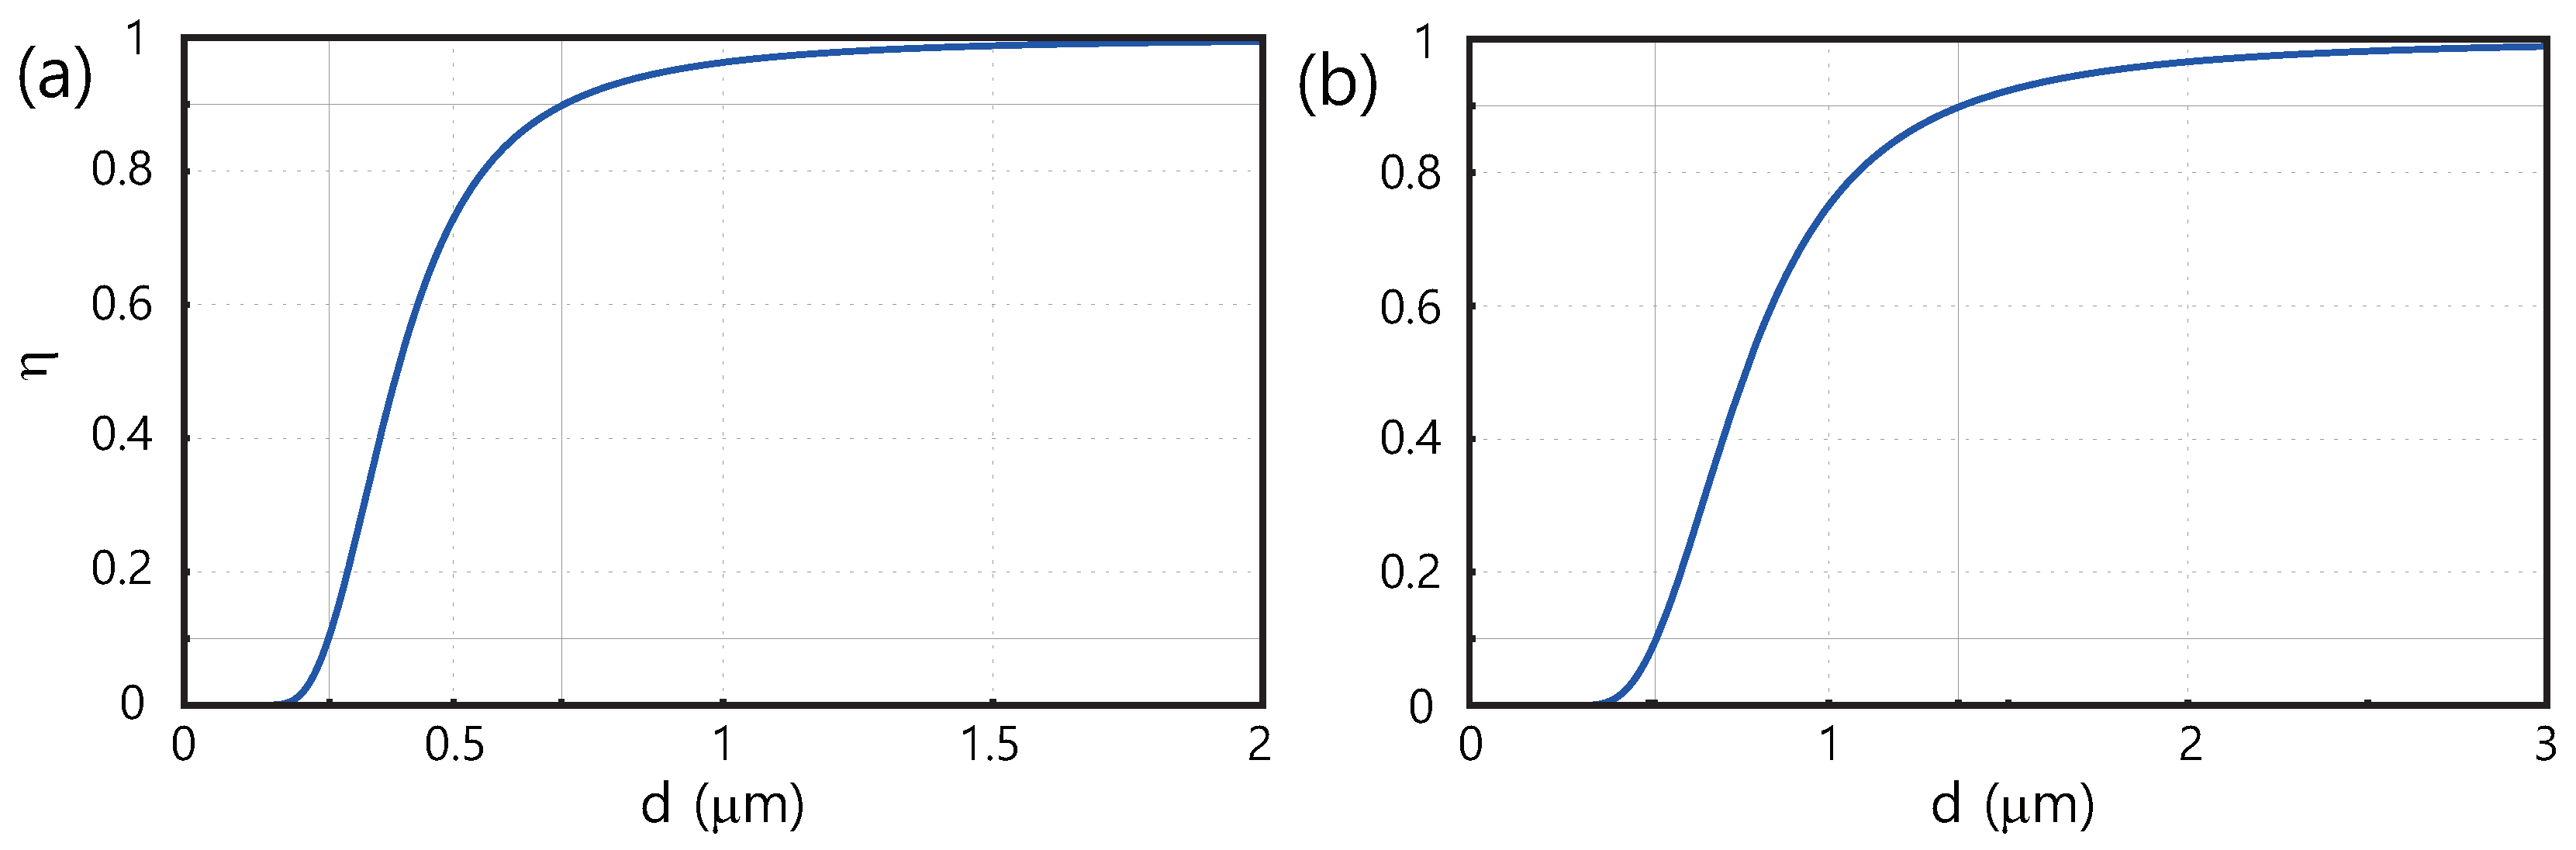
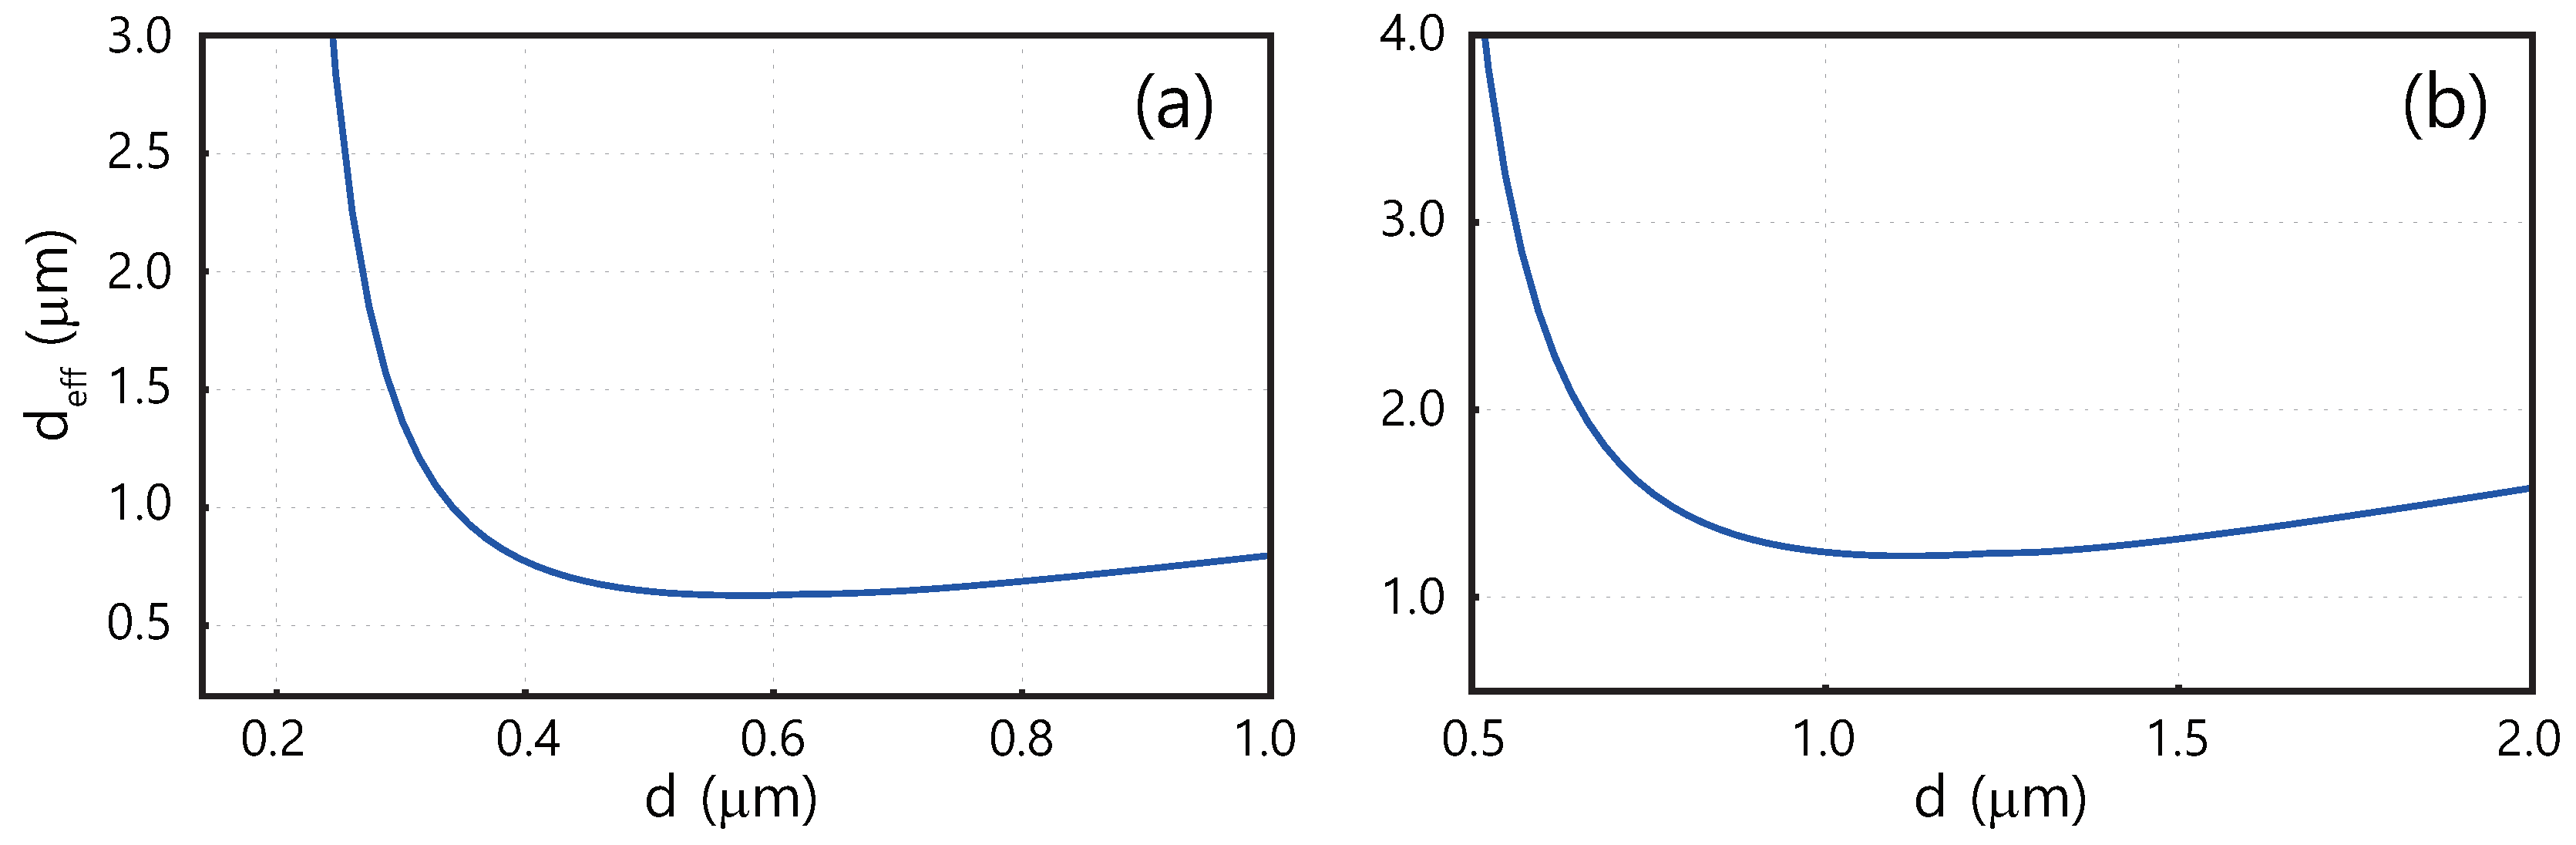
The radial and azimuthal components transversal to the fiber axis, and , describe the fraction of the energy flow of the electromagnetic field that does not propagate. The fraction of power propagating inside and outside the fiber can be given by , where and [3]. The fractional power is related to the diameter-dependent group velocity and waveguide dispersion. Figure 10 shows the fraction of power for the fundamental mode inside the core as a function of the diameter at nm and m. At nm (m), the 90% energy inside the core is confined by nm (m) of an MNF whereas the rest of the energy is confined by 270 nm (515 nm) of it. Because of the highly confined optical modes in high-index contrast structures, a tight bending radius of less than 5 m can be achieved, that results in compact guided optical components while giving more flexibilities in the photonic circuit layout [50,51,52,53]. Now, let us define the effective radius, , which is a hypothetic radius for possessing 86.5% (=1) of the total power [3]. can be obtained from for and for , where . As the diameter decreases, d is getting larger so that it leads most of light energy to propagate in air. In Figure 11, the major power can be confined within nm at nm and m at m.
5. Group Velocity and Group Velocity Dispersion (GVD)
The knowledge of group velocity and dispersion property of MNFs are very useful for designing fiber-based quantum sensing and quantum light generation. They have dependences of the dimension of a diameter and the wavelength of an optical wave. Group velocity of the MNF can be given as [1,3]
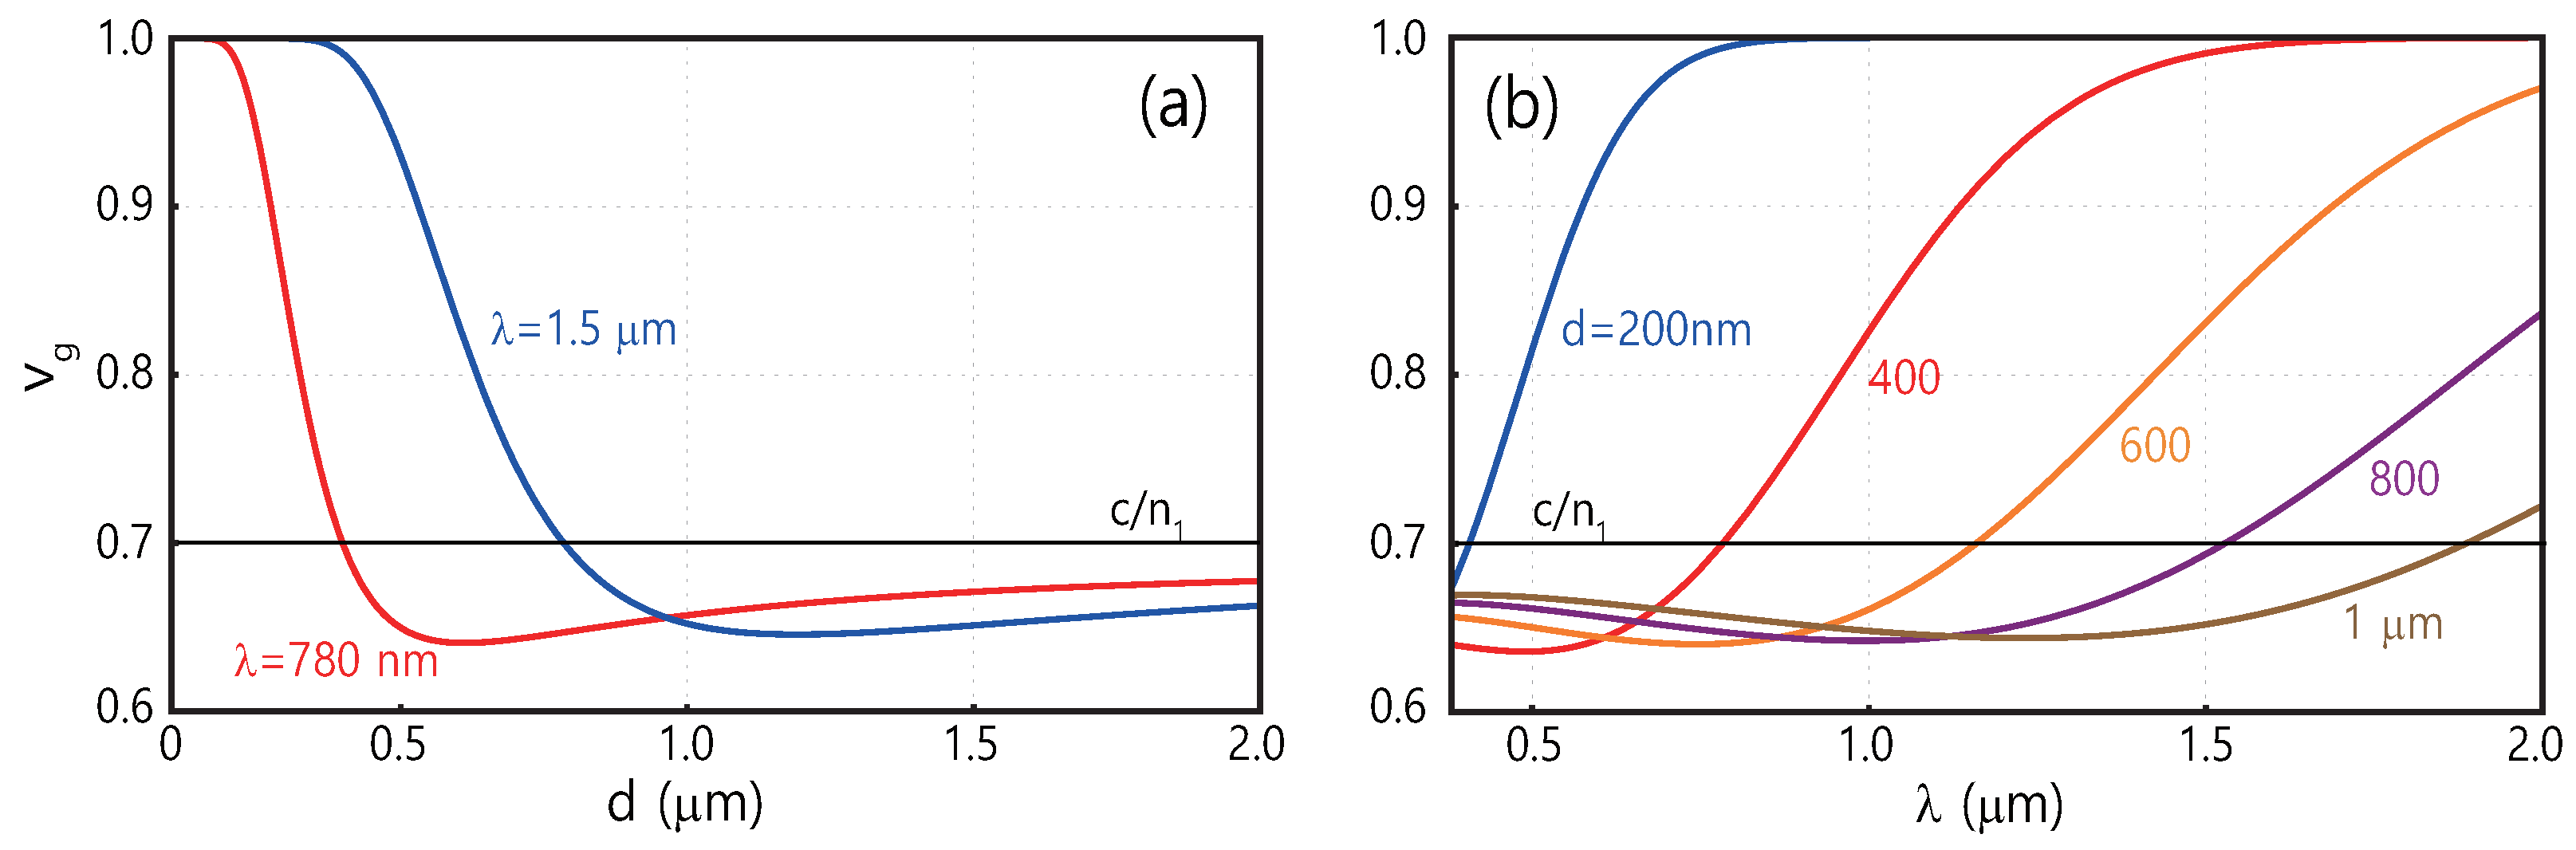
Diameter-dependent group velocities of the fundamental modes are shown in Figure 12a. As the diameter decreases, group velocity, approaches the speed of light in vacuum because most of the light energy propagates in air. When the diameter becomes large enough, approaches which is the group velocity of a plane wave in the optical fiber. For a large value of the wavelength compared to the diameter, approaches the speed of light, c, as shown in Figure 12b. Based on the group velocity, we can obtain diameter- and wavelength-dependent group velocity dispersion (GVD) which is written by [3,54]
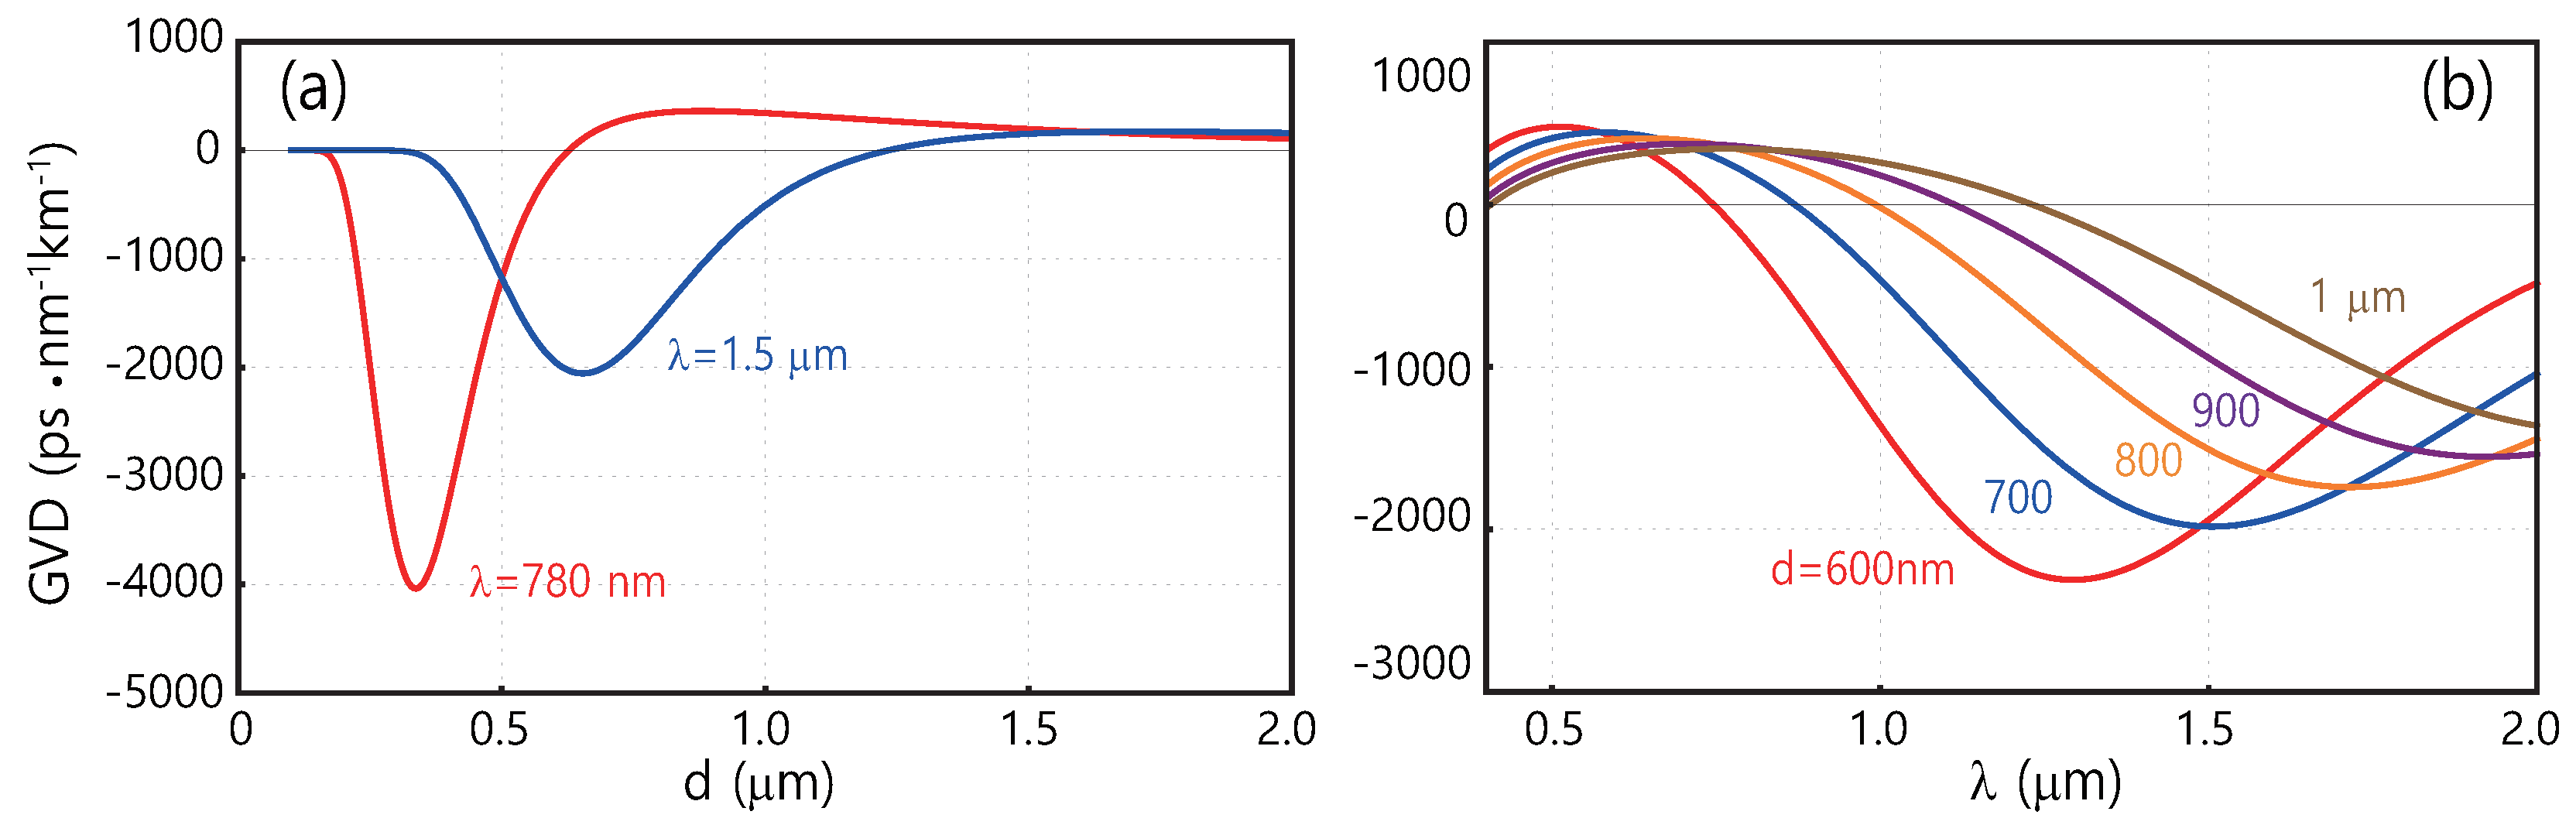
The optical dispersions of MNFs are affected by both the material dispersion and the waveguide dispersion. In particular, the waveguide dispersion is strongly modified by the waveguide dimension. Therefore, when we determine the optimum diameter for generating entangled photon pairs, it is useful to estimate GVD parameter of MNFs according to the changes of the diameter and the wavelength as depicted in Figure 13. As the MNF diameter and the wavelength increase, zero GVDs are up-shifted.
6. Spontaneous Four-Wave Mixing (SFWM)
The SFWM process is mediated by a nonlinear susceptibility, wherein two pump photons are annihilated by the medium, and then create two different photons, called signal and idler. MNFs can be used as quantum light sources generating entangled photon pairs via SFWM process. The small mode area of the MNF strongly enhances nonlinear coefficient which is roughly 100 times larger than that of the standard single-mode fiber. The SFWM process must satisfy both energy conservation and phase-matching condition which are given by
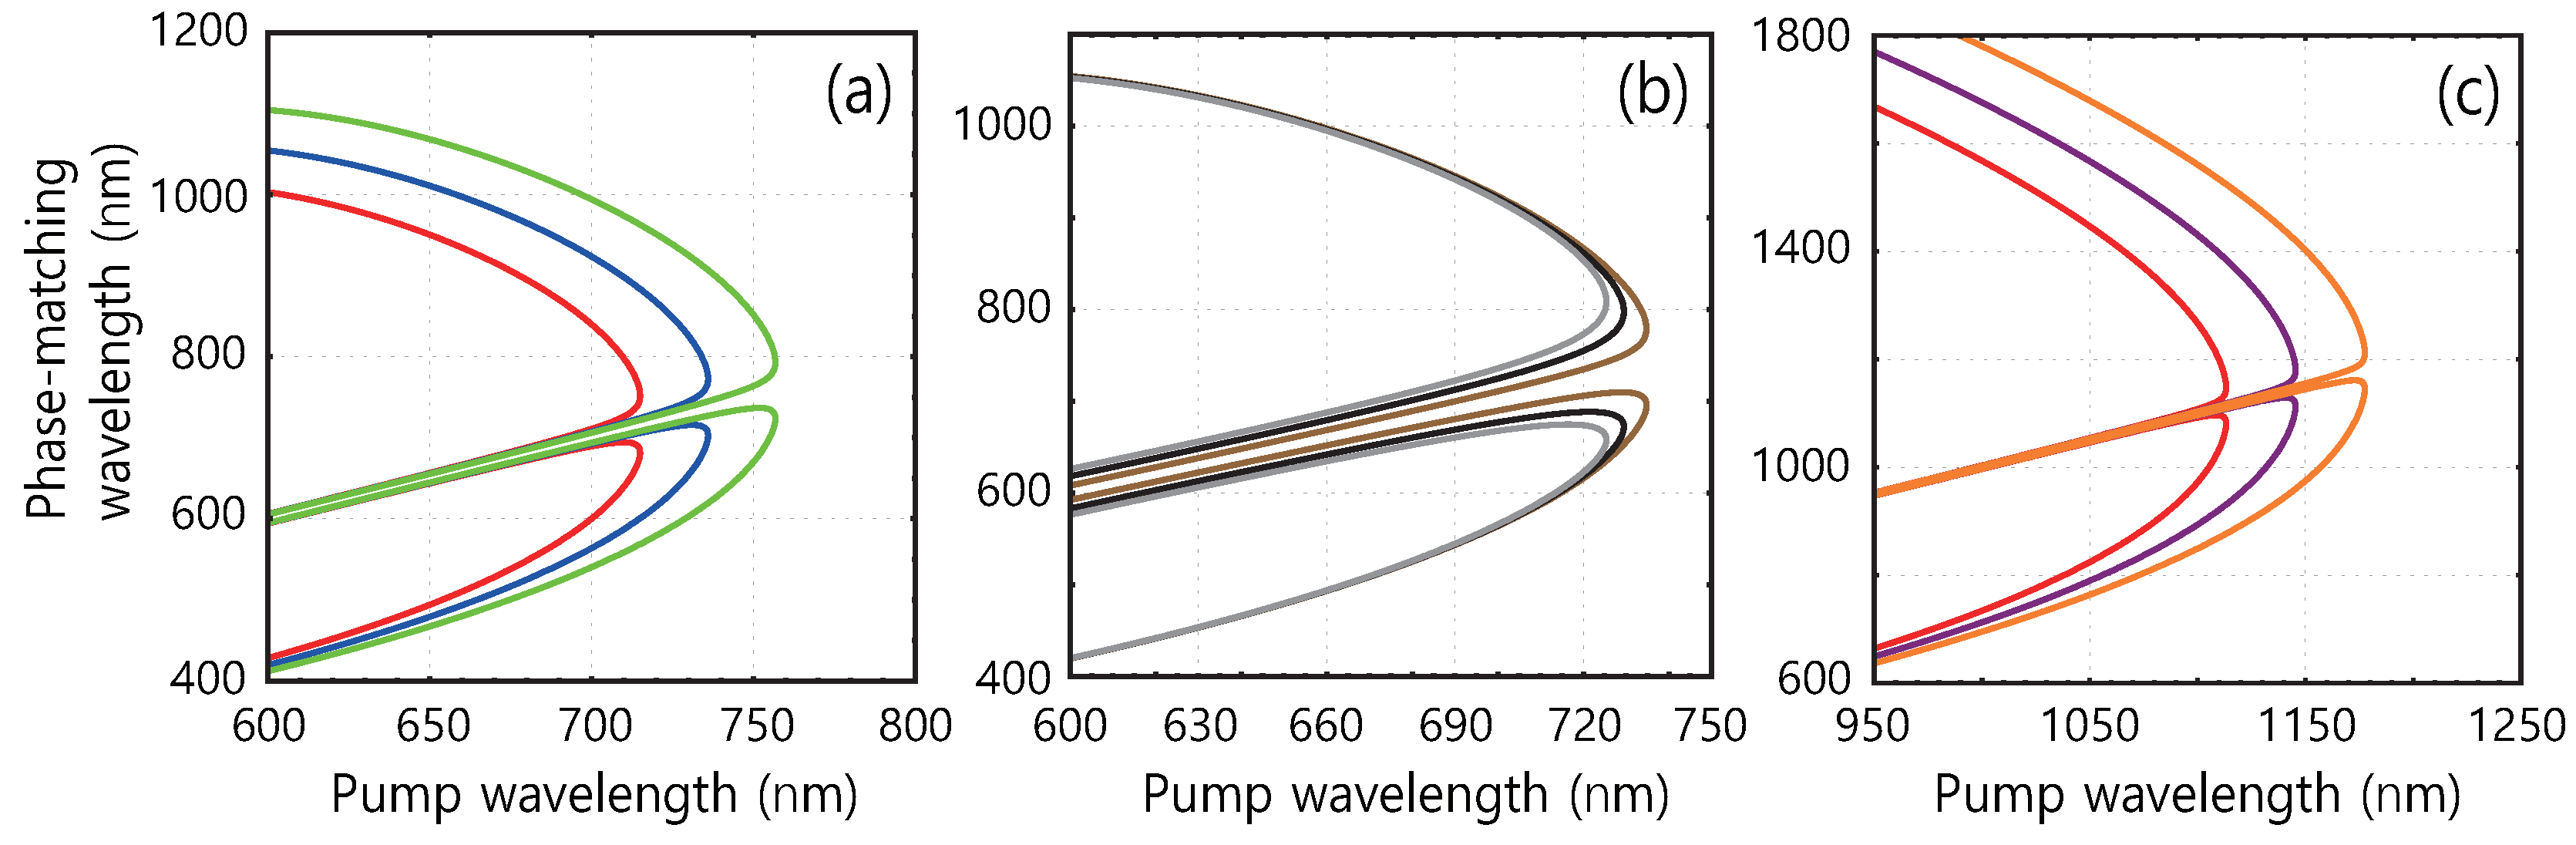
where and are propagation constants and angular frequencies, respectively. The last term, , refers to the contribution of the self-phase modulation. The nonlinear coefficient, , can be given as , where m/W is the second-order nonlinear index of silica, is the peak power of the pump laser, and is the effective mode area. When we consider the reasonable pump power, i.e., 0.5 mW-average power, the self-phase modulation term leads the phase-matching condition to have two different regions in the normal dispersion regime. Figure 14a shows numerically calculated phase-matching curves of the signal and idler photons for various MNF diameters as a function of the pump wavelength. As a diameter increases, overall phase-matching curves are shifted toward the long wavelength. In the region where the phase-matched wavelengths are far-detuned from the pump wavelength, the wavelengths of created photon pair are weakly power-dependent. On the contrary, the region which is close to the pump wavelength has strong dependence of the pump power. As the pump power increases, the wavelength difference between signal and idler photons becomes large as shown in Figure 14b. Here, in order to consider pump power dependences in numerical calculations, we assume that a femto-second pulsed laser is operated at 78 MHz repetition rate. When a spectral filter with the full width at half-maximum of 1 nm is used, for the sech-shape pulse, the pulse duration and peak power are obtained. From the conditions of Figure 14a,b, we can design from visible to NIR photon-pair sources working in the silicon-based single photon detector (SPD) [43]. In Figure 14c, one of the entangled photon-pair is generated at a telecom-band wavelength which is compatible with the existing fiber-based system, while the other photon has a NIR wavelength which can be detected in high efficiency by using the silicon-based SPD. Moreover, due to the large detuning between the pump and signal (idler) photons, Raman noise can be significantly suppressed at the room temperature [42]. Therefore, by the proper diameter control and the pump wavelength selection, photon-pair can be created at one’s desired wavelengths.
We now present a theoretical study of the two-photon state generated by SFWM with degenerated pump photons. The interaction Hamiltonian of SFWM process can be written as
where is a non-linear susceptibility that characterizes the non-linear process, and the effective length of the crystal is L. The pump beam can be expressed with plane wave, . The signal and idler photons are quantized as
where and represent the frequencies and wave vectors of signal (s) and idler (i), respectively. A is the single-mode cross-section area. and are the creation operators for signal and idler photons. The Hamiltonian becomes
where is the phase-mismatching condition. Hence we can obtain the two-photon state as
where refers to the joint spectral amplitude (JPA) that consists of the pump envelope function and the phase-matching function.
7. Joint Spectrum
The joint spectral amplitude, , is an important physical quantity to show the spectral property and directly influence on the amount of entanglement in a photon-pair. Now, it is convenient to apply the integration transformation, , in Equation (23). (with ) represents the frequency detuned from the center frequency, . From the phase-matching condition , each (with ) can be extended into a Taylor series around the center frequency which is given by . For the degenerate pump beams, . As a result, the joint spectrum of the generated photon pair can be given as
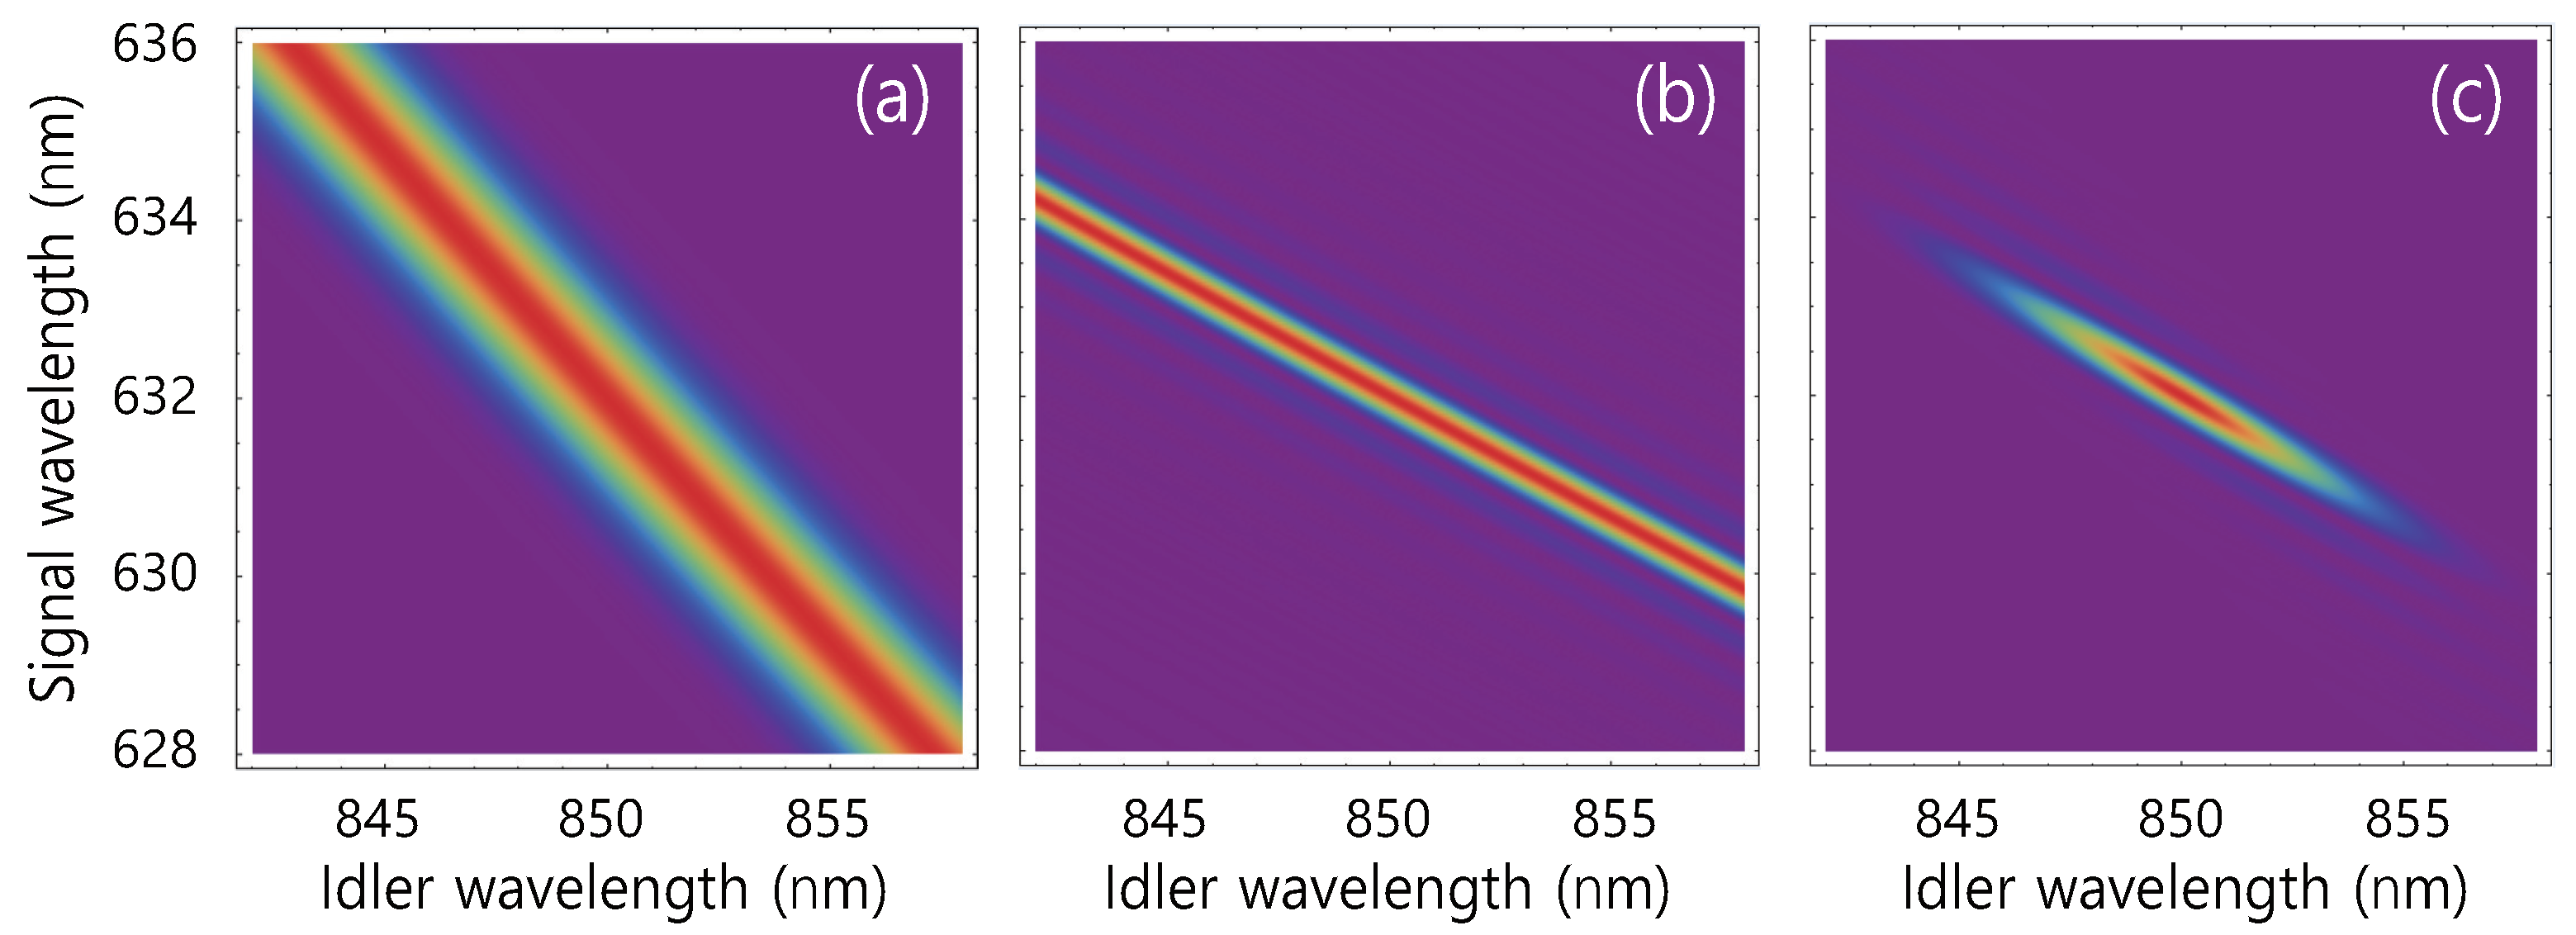
where B and C are normalized constants which do not contribute to the joint spectrum property, are the bandwidths of pump beams, and (with ) represents the group delay between the pump and signal () or idler (). v indicates the group velocity. If the group velocity of pump photon is the same as that of signal photon, both exist in the medium at the same time such that . If they have different group velocities, they gradually become temporally separated in the fiber which is called temporal walk-off. is the pump envelope function which is governed by the energy conservation and depends on the spectral envelope of the pump beam. is called the phase-matching function which accounts for the momentum conservation and depends on the dispersion property in the fiber. For example, Figure 15 represents a JSA whose formula is given in Equation (24). Here, the pump beam centered at 725 nm and a 12-cm long MNF with 615 nm-diameter are used for numerical calculation. For the degenerate pump beams at 725 nm, temporal walk-off between pump beams is negligible in which they are overlapped for the length of the fiber. In Ref. [43], the signal and idler photons are generated at 632 nm and 850 nm, respectively. There are central and side lobes which are related to the wings of the sinc function. Due to relatively narrow bandwidth of pump beam ( nm) and long fiber length, bandwidths of signal and idler photons are about 2 nm and 5 nm, respectively. Another example is shown in Figure 16. For the pump beam centered at nm and nm bandwidth, signal and idler are generated at 800 nm and m, by using a 5 cm-long and 950 nm-diameter MNF. As a result, relatively broader bandwidth of pump beam and shorter fiber length than the previous case, lead signal and idler photons to have broad bandwidths about 5 nm and 15 nm.
In Figure 15 and Figure 16, the JSA describes strong spectral correlation between the signal and idler photons because of energy and momentum conservation constraints. In other words, if the signal (idler) photon is detected to herald the production of the idler (signal) one, the heralded photon is not in a pure state but in a mixed state. This is not suitable for the Linear Optics Quantum Computing (LOQC) protocol which is based on frequency-uncorrelated photons, allowing direct heralding of single photons in pure state. Generally, in photonic quantum computing, the error rates of logic gates increase with photon state impurity which decreases the Hong-Ou-Mandel (HOM) dip visibility [55]. In the heralded process, the detection of one photon in a twin-photon source indicates that the other photon is projected into a single-photon state. Photon-pairs created in SFWM are usually frequency-entangled due to energy and momentum conservation constraints [56,57]. Therefore, in this case, the heralding process projects the twin photon into a mixed state [58]. Even though this entanglement can be eliminated by using spectral and spatial filters, it degrades the production rate of created photons and heralding efficiency [59]. Here, we show that frequency-entangled states can be factorable states by controlling pump bandwidth and group delay. In the JSA, given in Equation (24), always exhibits an anti-diagonal slope in frequency space, since the maximum value is governed by the relation . On the other hand, the slope of is determined by the condition , so that the angle of the slope in frequency space depends on the signs of the group velocities of pump, signal, and idler. We now present mathematical condition for generating factorable states by using Gaussian approximation, with . Consequently, JSA can be given as [60,61]
In order to make a factorable state in the JSA, the frequency entangled term between the signal and idler, , should be eliminated. Therefore, the factorable condition can be given by
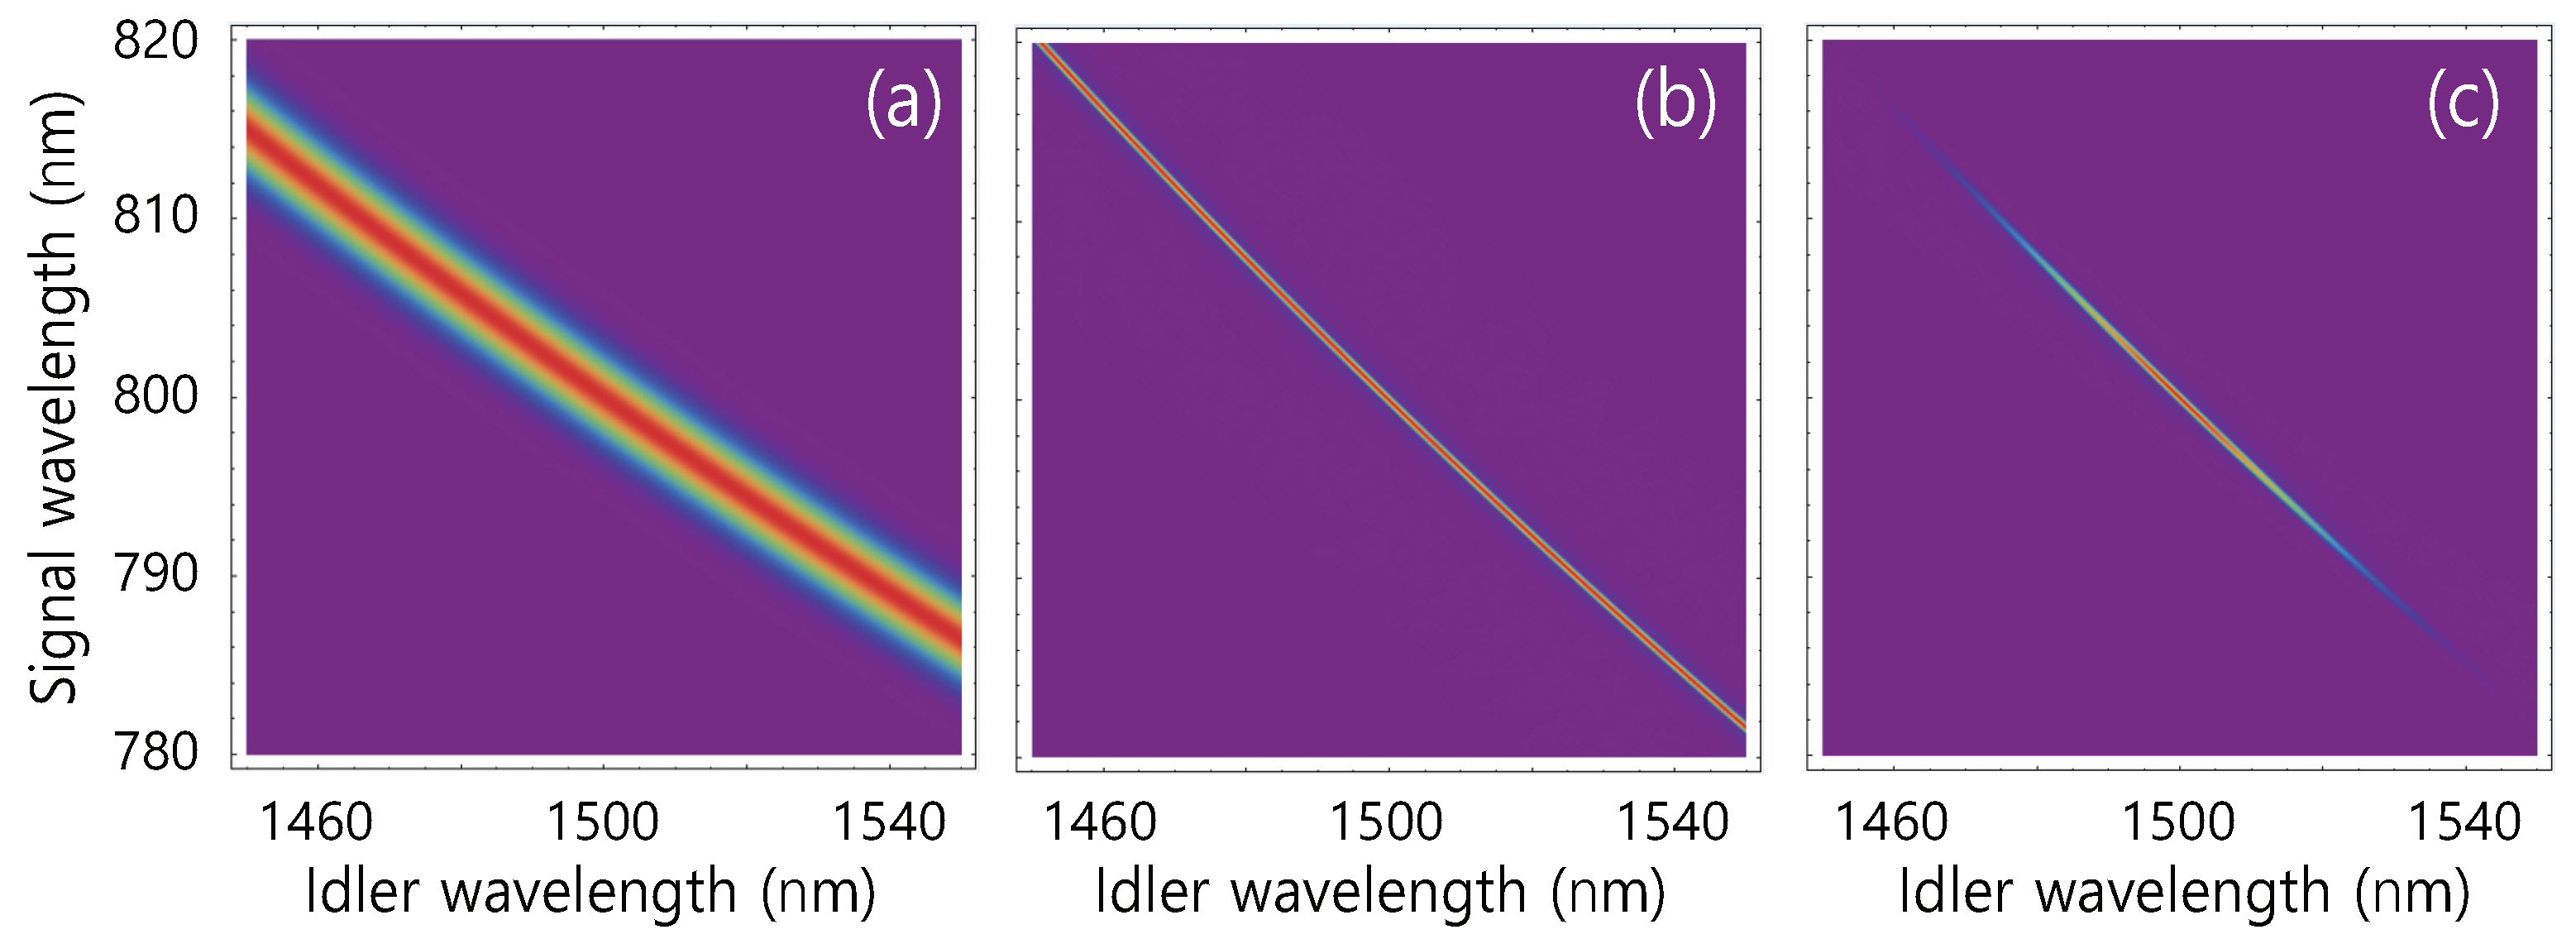
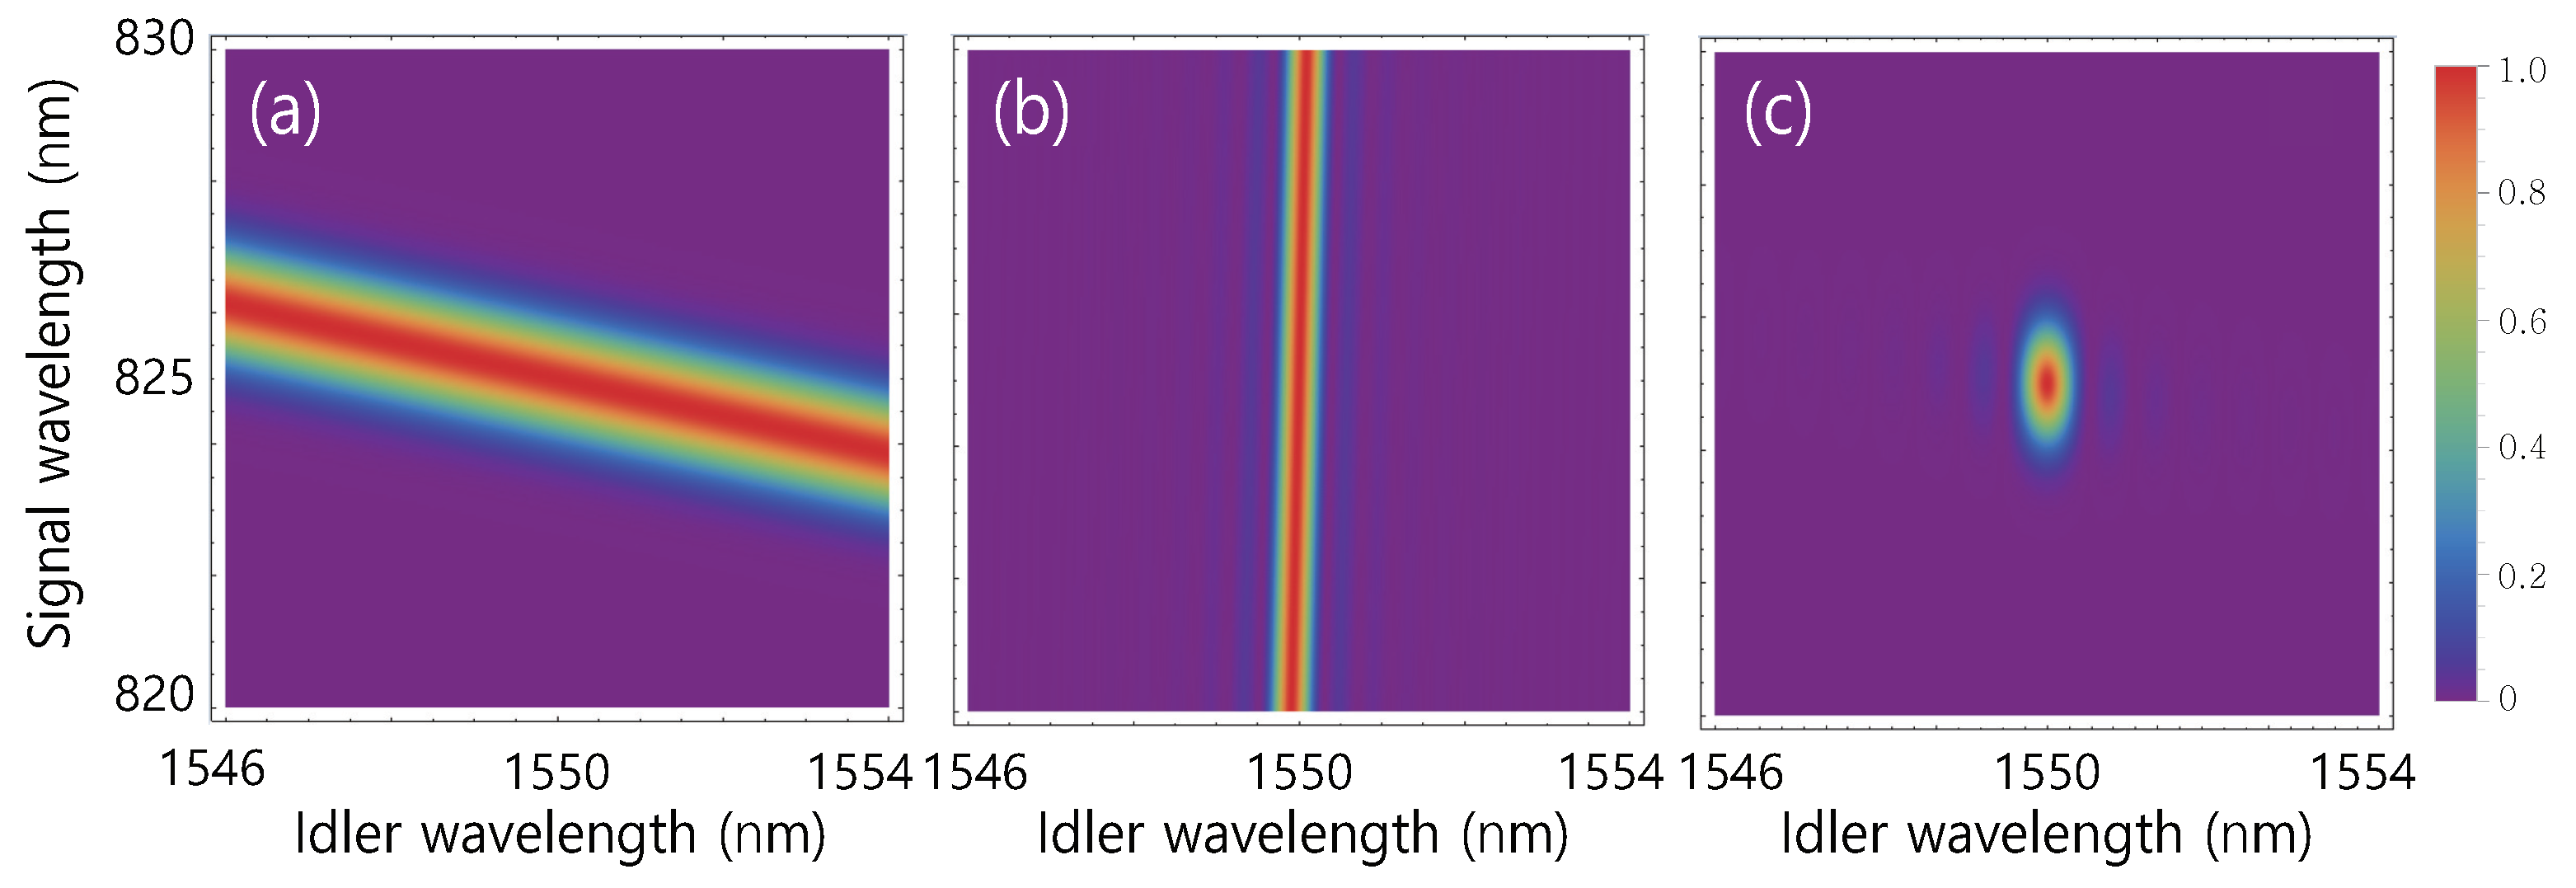
There are two conditions for factorizing photon-pair state. If, for the broad pump width, , either or is satisfied, generated photons are factorable. But, since the pump wavelength is very close to the wavelength of either signal or idler photon, it is difficult to suppress the pump noise. The second condition is that the two terms and are canceled each other. In this case, group delays and have different signs and the phase-matching function exhibits a positive slope. The most conventional way to reduce the correlation between the signal and idler photons is to use spectral filters. By choosing narrowband signal and idler photons, they consist of a single spectral mode that makes them uncorrelated. However, using a filter with narrow bandwidth brings about a reduction in the probability that the photon transmits through it, and reduces the efficiency of generation. Figure 17 illustrates the possibility of generating experimentally realizable uncorrelated photon-pairs without employing spectral filters. Here, for 1164 nm pump, a 5 cm-long MNF with 810 nm-diameter can generate uncorrelated photon-pairs with 825 nm and 1.55 m. In this condition, idler photons at 1.55 m are compatible with the telecom-band fiber-based system, while the signal photons at 825 nm have high detection efficiency in a Si-based single photon detector that makes it suitable to build heralded single photon sources in telecom-band with high efficiency. Also, the Raman noise can be significantly suppressed due to the large detuning between pump and signal/idler photons. As a result, in Figure 17c, uncorrelation between photon-pairs is not completely observed due to the sinc-shaped phase-matching function. The secondary lobes along the vertical axis always cause a small amount of correlation between signal and idler, although the main peak is not correlated. In this case, we are able to suppress the secondary peaks of the sinc function by using a spectral filter. Because of the side lobes which are less than 10% of the total intensity, the photon flux suffers from a little reduction in a high peak signal. It is on the contrary to the correlated main peak cases in Figure 15 and Figure 16.
8. Conclusions
We demonstrated theoretical study about the single-mode guiding properties and the spectral properties of entangled photon pairs via SFWM process in MNFs. Numerical simulations based on the exact solutions of the Maxwell’s equations manifested characteristics of essential parameters, such as the propagation constants for guided optical modes, field distributions, fraction of power, and effective diameters. These parameters are important in quantum sensing and detection implementing the light-matter interaction via evanescent field. In addition to the pronounced evanescent field, small optical area significantly enhances entangled photon-pair generation via the SFWM process in MNFs. Based on the obtained parameters, group velocity and GVD are used for investigating spectral properties of entangled photon-pairs. As a result, we can estimate phase-matching condition and JSA depending on the pump wavelength and tapered diameters of MNFs in NIR and telecom-band regimes, and show the possibility of uncorrelated photon-pair generation via MNFs that are suitable for LOQC protocol. Our theoretical work provides useful guidelines to design micro/nanofiber-based quantum sensing and quantum light source used for quantum technologies.
Author Contributions
Theoretical design and modeling, Y.S.I., Z.K., and S.-Y.L.; Simulation, Y.S.I.; writing-original draft preparation, Y.S.I.; writing-review and editing, Y.S.I., Z.K., and S.-Y.L.; supervision, S.-Y.L. All authors have read and agreed to the published version of the manuscript.
Funding
This work was supported by a grant to Quantum Standoff Sensing Defense-Specialized Project funded by Defense Acquisition Program Administration and Agency for Defense Development.
Conflicts of Interest
The authors declare no conflict of interest.
References
- Snyder, A.W.; Love, J.D. Optical Waveguide Theory; Chapman and Hall: New Tork, NY, USA, 1983. [Google Scholar]
- Tong, L.; Gattass, R.; Ashcom, J.B.; He, S.; Lou, J.; Shen, M.; Maxwell, I.; Mazur, E. Subwavelength-diameter silica wires for low-loss optical wave guiding. Nature 2003, 426, 816–819. [Google Scholar] [CrossRef] [PubMed]
- Tong, L.; Lou, J.; Mazur, E. Single-mode guiding properties of subwavelength-diameter silica and silicon wire waveguides. Opt. Express 2004, 12, 1025–1035. [Google Scholar] [CrossRef] [PubMed]
- Tong, L.; Sumetsky, M. Subwavelength and Nanometer Diameter Optical Fiber; Springer: Dordrecht, The Netherlands, 2009. [Google Scholar]
- Aksenov, V.A.; Voloshin, V.V.; Vorob’ev, I.L. Losses in single-mode optical fibers occuring in isolated bends of small radius: Rectangular profile of refractive index. J. Commun. Technol. Electron. 2004, 49, 690–698. [Google Scholar]
- Tong, L.; Hu, L.; Zhang, J.; Qiu, J.; Yang, Q.; Lou, J.; Shen, Y.; He, J.; Ye, Z. Photonic nanowires directly drawn from bulk glasses. Opt. Express 2006, 14, 82–87. [Google Scholar] [CrossRef] [PubMed]
- Chen, Y.; Zheng, R.; Lu, Y.; Ming, H. Fiber-optic surface plasmon resonant sensor with low-index anti-oxidation coating. Chin. Opt. Express 2011, 9, 100605. [Google Scholar] [CrossRef]
- Jing, J.Y.; Wang, Q.; Wang, B.T. Refractive index sensing characteristics of Carbon nanotube-deposited photonic crystal fiber SPR sensor. Opt. Fiber Technol. 2018, 43, 137–144. [Google Scholar] [CrossRef]
- Polynkin, P.; Polynkin, A.; Peyghambarian, N.; Mansuripur, M. Evanescent field-based optical fiber sensing device for measuring the refractive index of liquid in microfluidic channels. Opt. Lett. 2005, 30, 1273–1275. [Google Scholar] [CrossRef]
- Kien, F.L.; Balykin, V.I.; Hakuta, K. Scattering of an evanescent light field by a single cesium atom near a nanofiber. Phys. Rev. A 2006, 73, 013819. [Google Scholar] [CrossRef]
- Nayak, K.P.; Melentiev, P.N.; Morinaga, M.; Kien, F.L.; Balykin, V.I.; Hakuta, K. Optical nanofiber as an efficient tool for manipulating and probing atomic fluorescence. Opt. Express 2007, 15, 5431–5438. [Google Scholar] [CrossRef]
- Sagúe, G.; Vetsch, E.; Alt, W.; Meschede, D.; Rauschenbeutel, A. Cold-Atom Physics Using Ultrathin Optical Fibers: Light-Induced Dipole Forces and Surface Interactions. Phys. Rev. Lett. 2007, 99, 163602. [Google Scholar] [CrossRef] [Green Version]
- Sagúe, G.; Baade, A.; Rauschenbeutel, A. Blue-detuned evanescent field surface traps for neutral atoms based on mode interference in ultra-thin optical fibres. New J. Phys. 2008, 10, 113008. [Google Scholar] [CrossRef] [Green Version]
- Lou, J.; Tong, L.; Ye, Z. Modeling of silica nanowires for optical sensing. Opt. Express 2005, 13, 2135–2140. [Google Scholar] [CrossRef] [PubMed]
- Brambilla, G.; Xu, F.; Horak, P.; Jung, Y.; Koizumi, F.; Sessions, N.; Koukharenko, E.; Feng, X.; Murugan, G.; Wilkinson, J.; et al. Optical fiber nanowires and microwires: Fabrication and applications. Adv. Opt. Photonics 2009, 1, 107–161. [Google Scholar] [CrossRef]
- Brambilla, G. Optical Microfibre Devices. Opt. Laser Technol. 2016, 78, 76–80. [Google Scholar] [CrossRef] [Green Version]
- Zhang, L.; Lou, J.; Tong, L. Micro/nanofiber optical sensors. Photon. Sens. 2011, 1, 31–42. [Google Scholar] [CrossRef] [Green Version]
- Zhang, H.; Wang, S.; Gong, Y.; Liu, T.; Xu, T.; Zhang, Y. A Quantitative Robustness Evaluation Model for Optical Fiber Sensor Networks. J. Light. Technol. 2013, 31, 1240–1246. [Google Scholar] [CrossRef] [Green Version]
- Wang, Q.; Zhao, W.M. Comprehensive Review of Lossy Mode Resonance-based Fiber Optic Sensors. Opt. Laser. Eng. 2018, 100, 47–60. [Google Scholar] [CrossRef]
- Qian, Y.; Zhao, Y.; Wu, Q.L.; Yang, Y. Review of Salinity Measurement Technology Based on Optical Fiber Sensors. Sens. Actuators B Chem. 2018, 260, 86–105. [Google Scholar] [CrossRef]
- Guo, X.; Ying, Y.B.; Tong, L. Photonic nanowires: From subwavelength waveguides to optical sensors. Acc. Chem. Res. 2014, 47, 656–666. [Google Scholar] [CrossRef]
- Yan, S.C.; Xu, F. A review on optical microfibers in fluidic applications. J. Micromech. Microeng. 2017, 27, 093001. [Google Scholar] [CrossRef]
- Tong, L. Micro/nanofibre optical sensors: Challenges and prospects. Sensor 2018, 18, 903. [Google Scholar] [CrossRef] [PubMed] [Green Version]
- Kien, F.L.; Balykin, V.I.; Hakuta, K. Atom trap and waveguide using a two-color evanescent light field around a subwavelength-diameter optical fiber. Phys. Rev. A 2004, 70, 063403. [Google Scholar] [CrossRef] [Green Version]
- Murugan, G.S.; Brambilla, G.; Wilkinson, J.S.; Richardson, D.J. Optical propulsion of individual and clustered microspheres along sub-micron optical wires. Jpn. J. Appl. Phys. 2006, 47, 6716. [Google Scholar] [CrossRef]
- Huang, K.; Yang, S.; Tong, L. Modeling of evanescent coupling between two parallel optical nanowires. Appl. Opt. 2007, 46, 1429–1434. [Google Scholar] [CrossRef] [PubMed]
- Kien, F.L.; Gupta, S.D.; Nayak, K.P. Nanofiber-mediated radiative transfer between two distant atoms. Phys. Rev. A 2005, 72, 063815. [Google Scholar] [CrossRef]
- Nayak, K.P.; Sadgrove, M.; Yalla, R.; Kien, F.L.; Hakuta, K. Nanofiber quantum photonics. J. Opt. 2018, 20, 073001. [Google Scholar] [CrossRef]
- Sumetsky, M.; Dulashko, Y.; Fini, J.M.; Hale, A.; DiGiovanni, D.J. The microfiber loop resonator: Theory, experiment, and application. J. Light. Technol. 2006, 24, 242. [Google Scholar] [CrossRef]
- Xu, F.; Brambilla, G. Demonstration of a refractometric sensor based on optical microfiber coil resonator. Appl. Phys. Lett. 2008, 92, 101126. [Google Scholar] [CrossRef] [Green Version]
- Ding, M.; Wang, P.; Brambilla, G. A microfiber coupler tip thermometer. Opt. Express 2012, 20, 5402–5408. [Google Scholar] [CrossRef]
- Wiedemann, U.; Karapetyan, K.; Dan, C.; Alt, W.; Irsen, S.; Meschese, D. Measurement of Submicrometre Diameters of Tapered Optical Fibres Using Harmonic Generation. Opt. Express 2010, 18, 7693–7704. [Google Scholar] [CrossRef]
- Wang, F.; Wang, K.; Yao, C.; Jia, Z.; Wang, S.; Wu, C.; Qin, G.; Ohishi, Y.; Qin, W. Tapered Fluorotellurite Fibers for Broadband Supercontinuum Generation. Opt. Lett. 2016, 41, 634–637. [Google Scholar] [CrossRef] [PubMed]
- Coillet, A.; Grelu, P. Third-harmonic generation in optical microfibers: From silica experiments to highly nonlinear glass prospects. Opt. Commun. 2012, 285, 3493–3497. [Google Scholar] [CrossRef]
- Li, Y.H.; Zhao, Y.Y.; Wang, L.J. Demonstration of almost octavespanning cascaded four-wave mixing in optical microfibers. Opt. Lett. 2012, 37, 3441–3443. [Google Scholar] [CrossRef] [PubMed]
- Tang, S.-H.; Wu, Z.-W.; Xu, F.; Lu, Y.-Q. Simulation of optical microfiber strain sensors based on four-wave mixing. IEEE Sens. 2016, 16, 3068–3074. [Google Scholar] [CrossRef]
- Fan, J.; Dogariu, A.; Wang, L.J. Generation of correlated photon pairs in a microstructure fiber. Opt. Lett. 2005, 30, 1530–1532. [Google Scholar] [CrossRef] [PubMed]
- Alibart, O.; Fulconis, J.; Wong, G.K.L.; Murdoch, S.G.; Wadsworth, W.J.; Rarity, J.G. Photon pair generation using four-wave mixing in a microstructured fibre: Theory versus experiment. New J. Phys. 2006, 8, 67. [Google Scholar] [CrossRef]
- Takesue, H.; Inoue, K. 1.5-μm band quantum-correlated photon pair generation in dispersion-shifted fiber: Suppression of noise photons by cooling fiber. Opt. Express 2005, 13, 7832–7839. [Google Scholar] [CrossRef]
- Chen, J.; Li, X.; Kuma, P. Two-photon-state generation via four-wave mixing in optical fibers. Phys. Rev. A 2005, 72, 033801. [Google Scholar] [CrossRef]
- Park, K.; Lee, D.; Ihn, Y.S.; Kim, Y.-H.; Shin, H. Observation of photon-pair generation in the normal group-velocity-dispersion regime with slight detuning from the pump wavelength. New J. Phys. 2018, 20, 103004. [Google Scholar] [CrossRef]
- Cui, L.; Li, X.; Guo, C.; Li, Y.H.; Xu, Z.Y.; Wang, L.J.; Fang, W. Generation of correlated photon pairs in micro/nano-fibers. Opt. Lett. 2013, 38, 5063–5066. [Google Scholar] [CrossRef] [Green Version]
- Kim, J.-H.; Ihn, Y.S.; Kim, Y.-H.; Shin, H. Photon-pair source working in a silicon-based detector wavelength range using tapered micro/nanofibers. Opt. Lett. 2019, 44, 447–450. [Google Scholar] [CrossRef] [PubMed]
- Klocek, P. Handbook of Infrared Optical Materials; Marcel Dekker: New Tork, NY, USA, 1983. [Google Scholar]
- Sagúe, G. Cold Atom Physics Using Ultra-Thin Optical Fibers. Ph.D. Thesis, University of Bonn, Bonn, Germany, 2008. [Google Scholar]
- Yariv, A. Optical Electronics; Chapman and Hall: New Tork, NY, USA, 1991. [Google Scholar]
- Kien, F.L.; Liang, J.Q.; Hakuta, K.; Balykin, V.A. Field intensity distributions and polarization orientations in a vacuum-clad subwavelength-diameter optical fiber. Opt. Commun. 2004, 242, 445–455. [Google Scholar] [CrossRef] [Green Version]
- Hartung, A.; Brueckner, S.; Bartelt, H. Limits of light guidance in optical nanofiber. Opt. Express 2010, 18, 3754–3761. [Google Scholar] [CrossRef] [PubMed]
- Bures, J.; Ghosh, R. Power density of the evanescent field in the vicinity of a tapered fiber. J. Opt. Soc. Am. A 1999, 16, 1992–1996. [Google Scholar] [CrossRef]
- Manolatou, C.; Johnson, S.G.; Fan, S.; Villeneuve, P.R.; Haus, H.A.; Joannopoulos, J.D. High-density integrated optics. J. Light. Technol. 1999, 17, 1682. [Google Scholar] [CrossRef]
- Kakarantzas, G.; Dimmick, T.E.; Birks, T.A.; Roux, R.L.; Rusell, P.S. Miniature all-fiber devices based on CO2 laser microstructuring of tapered fibers. Opt. Lett. 2001, 26, 1137–1139. [Google Scholar] [CrossRef]
- Qi, Z.M.; Matsuda, N.; Itoh, K.; Murabayashi, M.; Lavers, C.R. A design for improving the sensitivity of a Mach-Zehnder interferometer to chemical and biological measurands. Sens. Actuat. 2002, B81, 254–258. [Google Scholar] [CrossRef]
- Son, G.; Han, S.; Park, J.; Kwon, K.; Yu, K. High-efficiency broadband light coupling between optical fibers and photonic integrated circuit. Nanophotonics 2018, 7, 1845–1864. [Google Scholar] [CrossRef]
- Saleh, B.E.A.; Teich, M.C. Fundamentals of Photonics; John Wiley and Sons: New Tork, NY, USA, 1991. [Google Scholar]
- Hong, C.K.; Ou, Z.Y.; Mandel, L. Measurement of subpicosecond time intervals between two photons by interference. Phys. Rev. Lett. 1987, 59, 2044. [Google Scholar] [CrossRef] [Green Version]
- Law, C.K.; Wamsley, I.A.; Eberly, J.H. Continuous frequency entanglement: Effective finite Hilbert space and entropy control. Phys. Rev. Lett. 2000, 84, 5304. [Google Scholar] [CrossRef]
- Lvovsky, A.I.; Wasilewski, W.; Banaszek, K. Decomposing a pulsed optical parametric amplifier into independent squeezer. Phys. Rev. Lett. 2007, 54, 721–733. [Google Scholar] [CrossRef] [Green Version]
- U’Ren, A.B.; Silberhorn, C.; Erdmann, R.; Banaszek, K.; Grice, W.P.; Walmsley, I.A.; Raymer, M.G. Generation of pure-state single-photon wavepackets by conditional preparation based on spontaneous parametric downconversion. arXiv 2006, arXiv:quant-ph/0611019. [Google Scholar]
- Mosley, P.J.; Lundeen, J.S.; Smith, B.J.; Wasylczyk, P.; U’Ren, A.B.; Silberhorn, C.; Walmsley, I.A. Heralded generation of ultrafast single photons in pure quantum states. Phys. Rev. Lett. 2008, 100, 133601. [Google Scholar] [CrossRef] [PubMed] [Green Version]
- Cohen, O.; Lundeen, J.S.; Smith, B.J.; Puentes, G.; Mosley, P.J.; Walmsley, I.A. Tailored photon-pair generation in optical fiber. Phys. Rev. Lett. 2009, 102, 123603. [Google Scholar] [CrossRef] [Green Version]
- Cohen, O. Generation of Uncorrelated Photon-Pairs in Optical Fibers. Ph.D. Thesis, University of Oxford, Oxford, UK, 2009. [Google Scholar]
Figure 1.
Step-index mathematical model: (a) Geometry of an air-clad cylindrical wire. (b) Schematic refractive index profile of an air-clad cylindrical wire.
Figure 1.
Step-index mathematical model: (a) Geometry of an air-clad cylindrical wire. (b) Schematic refractive index profile of an air-clad cylindrical wire.

Figure 2.
Solutions for the (a) TM modes and (b) TE modes of Equation (4) at . The right- and left-hand sides of Equation (4) are plotted by the solid-red and black-dashed lines, respectively.

Figure 3.
Solutions for the (a) EH modes and (b) HE modes of Equation (4) at . The right- and left-hand sides of Equation (4) are plotted by the solid-red and black-dashed lines, respectively.

Figure 4.
Wavelength for single mode condition of a silica-air waveguide as a function of a diameter, .
Figure 4.
Wavelength for single mode condition of a silica-air waveguide as a function of a diameter, .

Figure 5.
(a) Numerical solutions of effective refractive index, , as a function of V-number for the first seven modes. (b) Numerical solutions of propagation constant, , as a function of diameter at 780 nm.
Figure 5.
(a) Numerical solutions of effective refractive index, , as a function of V-number for the first seven modes. (b) Numerical solutions of propagation constant, , as a function of diameter at 780 nm.

Figure 6.
Vector field plots of the electric component perpendicular to the fiber axis in the fundamental HE mode for rotating polarization at (a) , (b) , (c) , (d) under the conditions of nm and nm.
Figure 6.
Vector field plots of the electric component perpendicular to the fiber axis in the fundamental HE mode for rotating polarization at (a) , (b) , (c) , (d) under the conditions of nm and nm.

Figure 7.
(a) The total intensity of the electric field in the fundamental mode HE with rotating polarization. (b) Radial dependence of the total intensity of the electric field. Parameters are same as used in Figure 6.
Figure 7.
(a) The total intensity of the electric field in the fundamental mode HE with rotating polarization. (b) Radial dependence of the total intensity of the electric field. Parameters are same as used in Figure 6.

Figure 8.
Vector field plot of the electric field component perpendicular to the z-axis in the fundamental HE mode with (x-polarization). Parameters are same as used in Figure 6.
Figure 8.
Vector field plot of the electric field component perpendicular to the z-axis in the fundamental HE mode with (x-polarization). Parameters are same as used in Figure 6.

Figure 9.
(a) The total intensity of the electric field in a fundamental mode HE with quasi-linear polarization. (b) Radial dependences of the total intensity of the electric field at (x-polarization) and (y-polarization). Parameters are same as used in Figure 6.
Figure 9.
(a) The total intensity of the electric field in a fundamental mode HE with quasi-linear polarization. (b) Radial dependences of the total intensity of the electric field at (x-polarization) and (y-polarization). Parameters are same as used in Figure 6.

Figure 10.
Fraction of power of the fundamental modes inside the core (a) at nm and (b) at m. Grey solid lines present the diameters for confining 10% and 90% energy inside the core.
Figure 10.
Fraction of power of the fundamental modes inside the core (a) at nm and (b) at m. Grey solid lines present the diameters for confining 10% and 90% energy inside the core.

Figure 11.
Effective diameters of the fundamental modes as a function of diameter (a) at nm and (b) at 1.5 m.
Figure 11.
Effective diameters of the fundamental modes as a function of diameter (a) at nm and (b) at 1.5 m.

Figure 12.
Group velocity of the fundamental modes (a) as a function of diameter at nm and m, (b) as a function of wavelength at different diameters.
Figure 12.
Group velocity of the fundamental modes (a) as a function of diameter at nm and m, (b) as a function of wavelength at different diameters.

Figure 13.
Group velocity dispersion of the fundamental modes (a) as a function of diameter at nm and m, (b) as a function of wavelength at different diameters.
Figure 13.
Group velocity dispersion of the fundamental modes (a) as a function of diameter at nm and m, (b) as a function of wavelength at different diameters.

Figure 14.
(a) Phase-matching curves of the signal and idler as a function of the pump wavelength at 610 nm (red), 615 nm (blue), and 630 nm (green) in diameter. Average pump power is 0.5 mW. (b) Power dependence of the phase-matching curves at 1.0 mW (brown), 5.0 mW (black), and 10 mW (gray) in average pump power. Here, d is fixed at 650 nm. (c) Phase-matching curves of the signal and idler as a function of the pump wavelength at 900 nm (red), 925 nm (purple), and 950 nm (orange) in diameter. Average pump power is 0.5 mW.

Figure 15.
(a) Pump envelope function, , governed by energy conservation. (b) Phase-matching function, , governed by momentum conservation. (c) Joint spectral amplitude, , as expressed in Equation (24). nm, nm, and a 12 cm-long MNF with the 615 nm-diameter are used for numerical simulation.
Figure 15.
(a) Pump envelope function, , governed by energy conservation. (b) Phase-matching function, , governed by momentum conservation. (c) Joint spectral amplitude, , as expressed in Equation (24). nm, nm, and a 12 cm-long MNF with the 615 nm-diameter are used for numerical simulation.

Figure 16.
(a) Pump envelope function, , governed by energy conservation. (b) Phase-matching function, , governed by momentum conservation. (c) Joint spectral amplitude, , as expressed in Equation (24). nm, nm, and a 5 cm-long MNF with the 950 nm-diameter are used for numerical simulation.
Figure 16.
(a) Pump envelope function, , governed by energy conservation. (b) Phase-matching function, , governed by momentum conservation. (c) Joint spectral amplitude, , as expressed in Equation (24). nm, nm, and a 5 cm-long MNF with the 950 nm-diameter are used for numerical simulation.

Figure 17.
(a) Pump envelope function, , governed by energy conservation. (b) Phase-matching function, , governed by momentum conservation. (c) Joint spectral amplitude, , as expressed in Equation (24).
Figure 17.
(a) Pump envelope function, , governed by energy conservation. (b) Phase-matching function, , governed by momentum conservation. (c) Joint spectral amplitude, , as expressed in Equation (24).

© 2020 by the authors. Licensee MDPI, Basel, Switzerland. This article is an open access article distributed under the terms and conditions of the Creative Commons Attribution (CC BY) license (http://creativecommons.org/licenses/by/4.0/).
Share and Cite
MDPI and ACS Style
Ihn, Y.S.; Kim, Z.; Lee, S.-Y. Optical Wave Guiding and Spectral Properties of Micro/Nanofibers Used for Quantum Sensing and Quantum Light Generation. Appl. Sci. 2020, 10, 715. https://0-doi-org.brum.beds.ac.uk/10.3390/app10020715
AMA Style
Ihn YS, Kim Z, Lee S-Y. Optical Wave Guiding and Spectral Properties of Micro/Nanofibers Used for Quantum Sensing and Quantum Light Generation. Applied Sciences. 2020; 10(2):715. https://0-doi-org.brum.beds.ac.uk/10.3390/app10020715
Chicago/Turabian StyleIhn, Yong Sup, Zaeill Kim, and Su-Yong Lee. 2020. "Optical Wave Guiding and Spectral Properties of Micro/Nanofibers Used for Quantum Sensing and Quantum Light Generation" Applied Sciences 10, no. 2: 715. https://0-doi-org.brum.beds.ac.uk/10.3390/app10020715
Note that from the first issue of 2016, this journal uses article numbers instead of page numbers. See further details here.