A Human Health Toxicity Assessment of Biogas Engines Regulated and Unregulated Emissions


1
Department of Engineering and Management, University of Padova, 36100 Vicenza, Italy
2
Department of Industrial Engineering, University of Padova, 35131 Padova, Italy
*
Author to whom correspondence should be addressed.
Appl. Sci. 2020, 10(20), 7048; https://0-doi-org.brum.beds.ac.uk/10.3390/app10207048
Submission received: 24 August 2020
/
Revised: 25 September 2020
/
Accepted: 30 September 2020
/
Published: 11 October 2020
(This article belongs to the Special Issue 10th Anniversary of Applied Sciences: Invited Papers in Energy Section)
Abstract
:The aim of the work is to evaluate the damage to human health arising from emissions of in-operation internal combustion engines fed by biogas. The need of including also unregulated emissions like polycyclic aromatic hydrocarbons (PAHs), aldehydes and dioxins and furans is twofold: (i) to cover the lack in biogas engine emissions measurements and (ii) to complete the picture on biogas harmfulness to human health by identifying the substances with the highest impact. To this purpose, an experimental campaign is conducted on six biogas engines and one fed by natural gas all characterised by an electric power of 999 kWel. Collected data are used to perform an impact analysis on human health combining the Health Impact Assessment and the Risk Assessment. Measurements show that PAHs, aldehydes and diossin and furans are almost always below the detection limit, in both biogas and natural gas exhausts. The carcinogenic risk analysis of PAHs for the two fuels established their substantial equivalence. The analysis of equivalent toxicity of dioxins and furans reveals that biogas is, on average, 10 times more toxic than natural gas. Among regulated emissions, NOx in the biogas engines exhausts are three times higher than those of natural gas. They are the main contributors to human health damage, with approximately 90% of the total. SOx ranks second and accounts for about 6% of the total damage. Therefore, (i) the contribution to human health damage of unregulated emissions is limited compared to the damage from unregulated emissions, (ii) the damage per unit of electricity of biogas engines exhausts is about three times higher than that of natural gas and it is directly linked to NOx, (iii) obtaining a good estimation of the human health damage from both biogas and natural gas engines emissions is enough of a reason to consider NOx and SOx.
1. Introduction
Biogas fuel is produced from the natural degradation of organic materials by micro-organisms under anaerobic conditions. The process is called anaerobic digestion (AD), and commonly used feedstocks are energy crops, animal manure and slurries, municipal organic waste, industrial and agricultural waste and residues, sewage sludge, etc. Considering that these feedstocks are available worldwide, biogas can be produced all around the world with micro to large facilities.
Typically, the biogas fuel is composed of methane, carbon dioxide, and other impurities like water, hydrogen sulphide, nitrogen, oxygen, ammonia, siloxanes and particles. After the cleaning process, the produced biogas can be combusted in boilers for heating purposes or in internal combustion engines (ICEs) and gas turbines for electricity production only (see, e.g., [1,2,3]). Properly arranged ICEs, gas turbines or boilers equipped with steam or organic Rankine cycle turbogenerators allow biogas to be burned and simultaneously generate heat and electricity, this arrangement being the so called combined heat and power (CHP) unit (see, e.g., [4,5,6]).
Alternatively, if the application requires a high energy content fuel, the biogas needs to be upgraded. By cleaning the biogas from impurities and separating the carbon dioxide, the energy content of upgraded biogas (typically called biomethane) becomes comparable to that of natural gas (NG). Biomethane can be directly injected into the natural gas network and/or stocked in tanks and then used as a substitute for fossil fuels in automotive applications (see, e.g., [7,8,9,10,11]).
Therefore, due to its availability and versatility of use, biogas can be, on the one hand, an opportunity for developed and developing countries to
- Reduce their fossil fuels dependency.
- Develop wastes and residues supply chains.
- Extend the use of biofuels in both the energy and transport sectors.
- Mitigate climate change effects thanks to the reduction of greenhouse gases emissions.
On the other hand, biogas production is stable and programmable. Hence, the electricity generation from biogas does not suffer from variability and unpredictability like wind and solar power. There is no risk of a large and unforeseeable mismatch between electricity demand and production, a gap that is hard to manage and which can result in grid faults or blackout. Note that techniques and devices able to manage the issues induced by the variability of wind and solar production are being widely investigated in the last few decade. As shown by the large number of published works, researchers and, among them, also the authors of the present work, focused, firstly on fossil fuels-based units flexibilization [12,13,14,15,16] and, then on: (i) innovative energy storage technologies like pumped thermal energy systems [17,18,19,20], liquid air energy storage [21], hydrogen [22], etc. and (ii) dynamic energy management of electric grids with high renewable penetration [23,24].
Therefore, biogas is an attractive renewable energy pathway especially for countries strongly dependent on fossil fuels imports. However, it can also be an issue for the environment as well as a cause of the reduction or even disruption of food supplies [25,26,27,28,29,30,31]. In fact, massive government supports can force farmers to redirect large agricultural areas from food to energy crops cultivation and force the heavy use of chemical substances like pesticides, fertilisers, etc.
Despite these justified concerns, biogas is playing a key role in the energy sector decarbonization.
In 10 years (2008–2017), the biogas installed electricity capacity (IEC) grew from 6699 MW to 16,915 MW. However, despite the IEC double-up, it constituted only the 0.77% of the total renewable energy IEC [32]. The low percentage is easy to explain because, even though biomass is distributed all around the globe, biogas facilities are mainly located in Europe (12,064 MW—71.3% of the total), while the Americas and Asia accommodate only the 17.7% (2989 MW) and 6.6% (1115 MW) of the total, respectively.
With an IEC of 6157 MW, Germany leads both the world and the European scoreboard. In practice, the Germany accommodates 36.4% of the world IEC and 51% of the European ones. In total, 81.3% of the total American biogas IEC (2989 MW) is installed in the USA while, in Asia, the situation is slightly different because the leading nation is Thailand with 475 MW, China follows closely with 429 MW.
Italy, with 1352 MW, ranks in second place after Germany in the European scoreboard and it is considered one of the most advanced countries in the world for biogas technology (see, e.g., [33,34,35]).
By looking deeper at the world biogas growth rates and established support policies (see, e.g., [34,35]), it is clear that the European Union (EU) considers biogas as a key renewable energy source (RES) that can help to reduce energy related CO2 emissions and to reinforce energy security.
In fact, at the time of writing, the vast majority of biogas facilities are located in Europe and biogas fuel is used to generate electricity in stationary plants equipped with internal combustion engines. The conversion efficiency depends on the ICE size and technological advancement but, usually, it ranges between 31% and 43% for electricity-only plants, while it can achieve 78–91% in CHP units.
Despite ICE’s high efficiency, fuel renewability and stringency in force emissions standards, biogas facilities are a source of concern for people living close to them due to the emission of ICEs into the atmosphere.
To cover the lack of literature and to provide the answers required by citizens, in this work, the authors firstly analyse the biogas ICE emissions regulatory framework with the aim of identifying the commonly tracked substances (usually called “regulated emissions”). Then, since there is a lack of biogas ICE emission measurements, the authors conceptualize and perform an experimental campaign devoted to measure not only regulated emissions but also the so called “unregulated emissions” on in-operation facilities. These are points of novelty for both the literature and biogas sector. In fact, the results can complete the picture of biogas engines emissions and allow to identify the substances with the highest impact on human health. In this regard, using the data collected during the experimental campaign, the authors perform an impact analysis on human health combining the Health Impact Assessment (HIA) and the Risk Assessment (RA). The HIA is adopted for estimating the harmfulness to human health of both types of biogas engine emissions—regulated and unregulated. The procedure is then integrated with the RA for two groups of dangerous substances belonging to “unregulated emissions” with the aim of evaluating also their carcinogenic hazard level.
In addition, to complete the analysis on emissions, the authors extended the investigation also to the biogas direct competitor: the natural gas fuel. To this end, an ICE fed by natural gas and characterised by the same nameplate data of the biogas ICEs is included in the experimental campaign. In this manner, the outcomes of the performed investigation can be used, on the one hand, to provide a clear answer to people leaving close to biogas facilities and, then, to improve their public acceptance. On the other hand, the work outcomes can also be a good starting point for the emission standards update.
The rest of the work is organised as follows. In Section 2, the most relevant literature is presented and discussed in order to highlight the actual state of the art while Section 3 reports the characteristics of the biogas facilities including the ICEs’ design specifications. Section 4 describes the adopted investigation methods while experimental measurements and health damage computations are presented and discussed in Section 5. Finally, in Section 6, conclusionconcluding remarks are given.
2. Literature Review
In this section, it is firstly defined the meaning of “regulated” and “unregulated” emissions and the substances commonly tracked by the Italian standard (see Section 2.1).
Subsequently, to point out the need of emissions values coming from on-site measurements, the most relevant works dealing with biogas ICEs emissions are presented and discussed (see Section 2.2).
Finally, starting from the available works dealing with biogas plants Life Cycle Assessment (LCA), the main differences in terms of methodology and outcomes between the proposed analysis and previously published works are reviewed (see Section 2.3).
2.1. Regulated and Unregulated Emissions
In the literature, the definition of both regulated and unregulated emissions is clearly stated.
Regulated emissions are substances that have regulatory limits for their maximum levels, while unregulated emissions are compounds without fixed regulatory limits.
However, an uncertain aspect of these definitions concerns the substances that must be included in the “regulated” or “unregulated” emissions groups.
This is important because, due to the absence of a common and widely adopted emissions standard, the regulatory body of each country independently defines the type of substances that need to be tracked and their maximum levels.
Substances commonly considered as “regulated emissions” for ICEs are NOx, SOx, HCl, volatile organic compounds (VOCs), CO and particulate matter (PM), while aldehydes, polycyclic aromatic hydrocarbons (PAHs), dioxins and furans are considered “unregulated emissions”.
The Italian standard (Legislative Decree No. 118 of May 19th, 2016 [36]) distinguishes the limits based on fuel type and, in some cases, based also on the engine nameplate thermal power. For biogas ICEs, NOx, CO, HCl and VOCs are considered regulated emissions, while, for natural gas, tracked substances are NOx, SOx and particulate.
A detailed description of the Italian legislation is given in [33,34,35] while a comparison between German and Italian regulatory frameworks is presented in Appendix A.1.
Note that the German standard includes formaldehyde among regulated emissions. So, it is possible to claim that Germany is one step ahead of other EU countries, because it is working to limit toxic and volatile compounds which are known to be human carcinogens. An aspect which confirms that measuring the so called “unregulated emissions” which comprise formaldehyde is a crucial point in view of the prevention of disease and the standards update.
Consequently, the results of the experimental campaign presented in this work can complete the picture of biogas engines emissions by investigating both regulated and unregulated emissions. Additionally, it can also allow us to identify the substances with the highest impact on human health, to compute the health damage and to provide an answer to people’s concerns about polluting content of biogas engine waste gases. Finally, the outcomes of the investigation can be used to update the in-force emission standards in view of improving the public acceptance of biogas ICEs.
These aspects are a point of novelty because the vast majority of published investigations are focused on biogas ICEs’ performance and regulated emissions, while only a few have analysed the unregulated ones.
2.2. Engines Emissions Measurements
One of the point of novelty of the proposed work is the on-site measurements of commercially available and in-operation biogas units. A need arising from the fact that the vast majority of published works analyse ICEs’ emissions like NOx, CO2, PM and unburned hydrocarbons (UHC) adopting lab-scale engines and simulated biogas as fuel (see, e.g., [37,38,39,40]).
Lab-scale engines are usually single-cylinder or car ICEs, while simulated biogas is a mixture of CO2 and methane or natural gas. So, they do not include the entire set of compounds detectable in biogas produced in commercially available AD units. Simulated biogas is characterised by a constant composition of CH4 and CO2, while in commercial plants the biogas composition can vary throughout the year, since the AD process is influenced by several factors like the feedstock type, the biological reaction time, the temperature, etc.
Only Kristensen et al. [41] and Nielsen et al. [42] examined both regulated and unregulated emissions. In particular, in 2000, Kristensen et al. monitored several Danish facilities fed by both biogas and natural gas with the aim of computing the emission factors. The analysed biogas facilities included plants fed by manure and agricultural wastes, but also ones which treated waste-water. So, compared to the authors’ plants, which adopt manure and energy crops, there is no uniformity in diets, plants nameplate power, ICEs technology and emissions legal limits. In regard to emission factors computations, Kristensen et al. considered PAHs and aldehydes, while in the present work, authors consider PAHs, aldehydes, and dioxins and furans, substances that are difficult to track and rarely measured especially in commercially available units.
Similarly, Nielsen et al. [42] evaluated the emission inventories of Danish stationary combustion plants and, among them, also those of biogas facilities. The investigation referred to plants in operation before the year 2011. The considered pollutants are: CO, CO2, NOx, NMVOCs, methane, nitrogen dioxide, ammonia, sulphur dioxide, PM, heavy metals, polychlorinated dibenzo-p-dioxins (PCDDs), polychlorinated dibenzofurans (PCDFs), hexachlorobenzene and PAHs. Biogas was derived from manure and organic waste (75% of the total amount of produced biogas) or from landfill and sludge. So, also in this case, compared to the authors’ plants there is no uniformity in diets, ICEs technical features or emissions legal limits.
Based on the literature review, it is clear that the present experimental campaign can be considered a starting point for increasing knowledges on regulated and unregulated emissions of MW-size ICEs fed by biogas derived from agricultural feedstock. In addition, this set of measurements can allow the computation of the damage to human health as well as contributing to an emissions standard update.
2.3. Health Impact Assessment and Risk Assessment
As previously discussed, the absence of a common emissions standard, e.g., at EU level, is a point of concern for stakeholders because each country can restrict the substances which it considers the most dangerous. However, within the same country, it can happen that local authorities impose limits that differ from the ones fixed at national level. So, the non-uniformity in emissions standards clearly raises worries in the population living closer to these plants. At the same time, the uncertainties reinforce the need for an experimental campaign focused on ICEs emissions (regulated and unregulated) and aiming to compute the human heath damage and provide a clear answer to stakeholders’ concerns.
To this purpose, in this work, the Health Impact Assessment is adopted for estimating the harmfulness to human health of both types of biogas ICE emissions, regulated and unregulated. The procedure is then integrated with the Risk Assessment for two groups of dangerous substances, PAHs and dioxins and furans, with the aim of evaluating also their carcinogenic hazardousness. Despite impact analyses on human health are still in progress and subject to the uncertainties that such complex problems entail, their application to biogas sector is a point of novelty. In addition, as recommended by the technical literature, the use of HIA and RA is the only way to obtain a more reliable evaluation framework [43].
HIA methods estimate the damage caused by an emission as the number of years lost by a population due to disability or early death (disability-adjusted life year—DALY) [44]. These methods can be found within Life Cycle Impact Assessment (LCIA) procedures, which are recognised methods for the assessment of environmental and human health impacts also in the biogas sector.
RA methods estimate the dangerousness of a substance, or a class of related substances, by means of relative toxicity coefficients, determined by toxicological techniques [45,46].
Among the published works, the one presented by Lijó et al. [47] evaluates the environmental aspects and energy requirements of a biogas plant through the LCA approach. The assessment considers six environmental impact categories and an energy one. No evaluations of human health impacts are given.
Petrov et al. [48,49] performed an HIA on the air surrounding a gasification plant, studying five scenarios. Emissions impacts are estimated according to the emission factors listed in the literature and are divided by day/night and for the four seasons. They introduced the concept of an intake fraction in order to take into account the amount of pollutant inhaled by a population compared to the amount emitted by the plant. This ratio multiplied by the mass emitted by the plant and the human toxicological effect factor provides the impact score expressed in DALY.
Fernández-Nava et al. [50] applied an LCIA technique to study the management of municipal solid waste. They defined six options and highlighted the best one from the point of view of four damage categories.
Fusi et al. [51] performed an LCIA with the aim of assessing the environmental impacts of biogas plants devoted to electricity production and fed with agricultural bio-products and/or wastes. They compared multiple biogas production techniques and identified their impacts for some impact categories.
Basically, LCIA results are useful to policy makers, but may not be particularly significant for other stakeholders (e.g., the inhabitants of the areas surrounding a biogas plant). In fact, a life cycle assessment devoted to the evaluation of the life cycle environmental impacts associated with electricity generation from biogas reveals that the main contributors to the impacts are the production of biomass and the operation of the anaerobic digesters [51]. Similarly, if the LCA focuses on the environmental impact of biogas, the results underline that impacts are less related to emissions coming from biogas combustion compared to those coming from biomass storage and digestate management [52].
Therefore, these kinds of analyses do not provide the answers required by citizens because the research topic is neither the pollutant content of ICEs’ waste gases, nor experimental measurements on in-operation plants.
In addition, an analysis aiming to provide a picture of the environmental impact of the entirety of the biogas facilities (from biomass production to waste management) is not able to precisely indicate which substances need to be tracked at the ICE stack. This is because emissions data are difficult to obtain and, then, usually taken from databases. However, available dataset store values referred to cases characterised by a different stage of technological development, environmental conditions and emissions limits.
For these reasons, this work aims to answer the previous issues using the innovative techniques of health impact analysis, and using the emission values measured during the experimental investigation.
3. Biogas and Natural Gas Facilities Design Features
The experimental campaign is preceded by an in-depth analysis of both the Italian biogas sector and the plant structure. In this manner, a significant number of biogas units can be selected and, then, experimentally analysed.
Two basic concepts are followed during the selection of the facilities:
- Units need to have the same nameplate thermal power of the ICE.
- The mix of feedstock used as input needs to be different in all the investigated units.
In this manner, plants are comparable because the ICEs have the same thermal and electrical power. However, being the mix of feedstock different, similarities and discrepancies in both the biogas composition and the engines’ regulated and unregulated emissions can be highlighted.
The sector analysis firstly highlights that the most widespread ICE design power is 999 kWel.
Historical reasons dating back to 2011–2012 lie behind this size. In particular, the development of the Italian biogas sector was driven by the most generous feed-in tariff ever set in Europe: 280 €/MWh guaranteed for 15 years to units with design power up to 999 kWel. So, in 2011–2012, Italy registered a rocketing growth in biogas installations and the vast majority of the installed units were built with the maximum admissible electric power: 999 kWel.
Based on this findings, the six selected units are made up of the same devices and powered by an internal combustion engine characterised by thermal and electrical nameplate power equal to 2459 and 999 kW, respectively. The ICE electrical efficiency is equal to 40.58% while the engine compression ratio and speed are respectively 12.5:1 and 1500 rpm. Additional details about the engine construction characteristics can be found in the manufacturer’s datasheet [53].
As for the biogas units, the NG ICE is selected after a detailed analysis of the Italian cogeneration sector [54]. The selected engine has the same nameplate power, manufacturer and specifications. It also started operating in 2012 as the biogas ones. Therefore, biogas and natural gas engines are characterized by the same technological advances. In this way, their emissions are comparable.
In terms of fuel consumption, a biogas ICE requires 547 Nm3 h−1 of raw biogas while an NG ICE takes 281 Nm3 h−1 of natural gas from the grid. Biogas ICEs release 5312 kg h−1 of waste gases at a temperature of 457 C into the atmosphere.
Note that the exhaust gases temperature is extremely high because the heat content of the waste gases is not recovered with a waste heat recovery unit (WHRU). Nonetheless, biogas engines are CHP units because the heat content of both the ICE cooling water and the lube oil is used to heat up a water flow rate which flows into the digester walls and guarantees control of their operating temperature.
Among the analysed plants, BGP 1, 2 and 3 are not equipped with WHRU. Hence, the stack temperature varies from 470 to 500 C.
In the case of BGP 4, the engine is equipped with an organic Rankine cycle, while BGP 5, BGP 6 and NG ICE are equipped with a heat exchanger which produces hot water or steam. The installation of the WHRUs guarantees exhaust gases temperatures lower than 200 C.
Figure 1 presents the adopted diet and emissions limits for each biogas unit.
Although the considered biogas plants are subject to emissions limits set in [55] and characterised by the same layout and power unit, the local authority sets different limits.
In particular the BGP 2 NOx and CO maximum values are respectively 10% and 50% lower than the onesthose set for BGP 1. No reasons can be found to explain such values, especially because both plants are located in the same Italian region and just a few kilometres away from each other.
However, to fulfil the legal limits, the ICE calibration and control strategy are different compared to the other biogas units.
Note also that, the VOCs limit set for BGP 1 and BGP 2 is 50% higher than in other facilities. Fortunately, in this case, the reason is easy to explain. Before January 1st, 2017, the regulatory limit for VOC as TOC was 150 mg Nm−3 while, after that date, a new standard entered into force and the limit became 100 mg Nm−3. All Italian plants adjusted their engine calibration in order to reduce VOCs emissions before the end of June 2017.
With regard to the natural gas engine, the regional authority assigned the legal limits: 350 mg Nm−3 for NOx, 35 mg Nm−3 for SOx and 5 mg Nm−3 for PM.
4. Materials and Methods
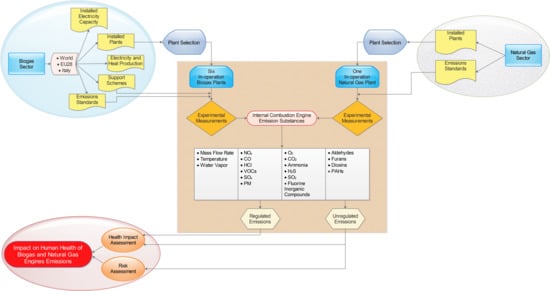
Figure 2 summarises the investigation procedure adopted in the present work.
In order to ensure adequate validation of the testing procedures as well as compliance with the regulations and laws in force, ICE waste gases composition measurements are carried out with the support of a specialised laboratory. The measurements performed are certificated with an uncertainty at 95% confidence level.
ICE exhausts are analysed to detect both regulated and unregulated compounds. For biogas, the regulated species are NOx, CO, VOCs and HCl, while for natural gas they are NOx, PM and SO2. On the other hand, unregulated substances include ammonia, hydrogen sulphide, chlorine and fluorine compounds, aldehydes, PAHs and dioxins and furans.
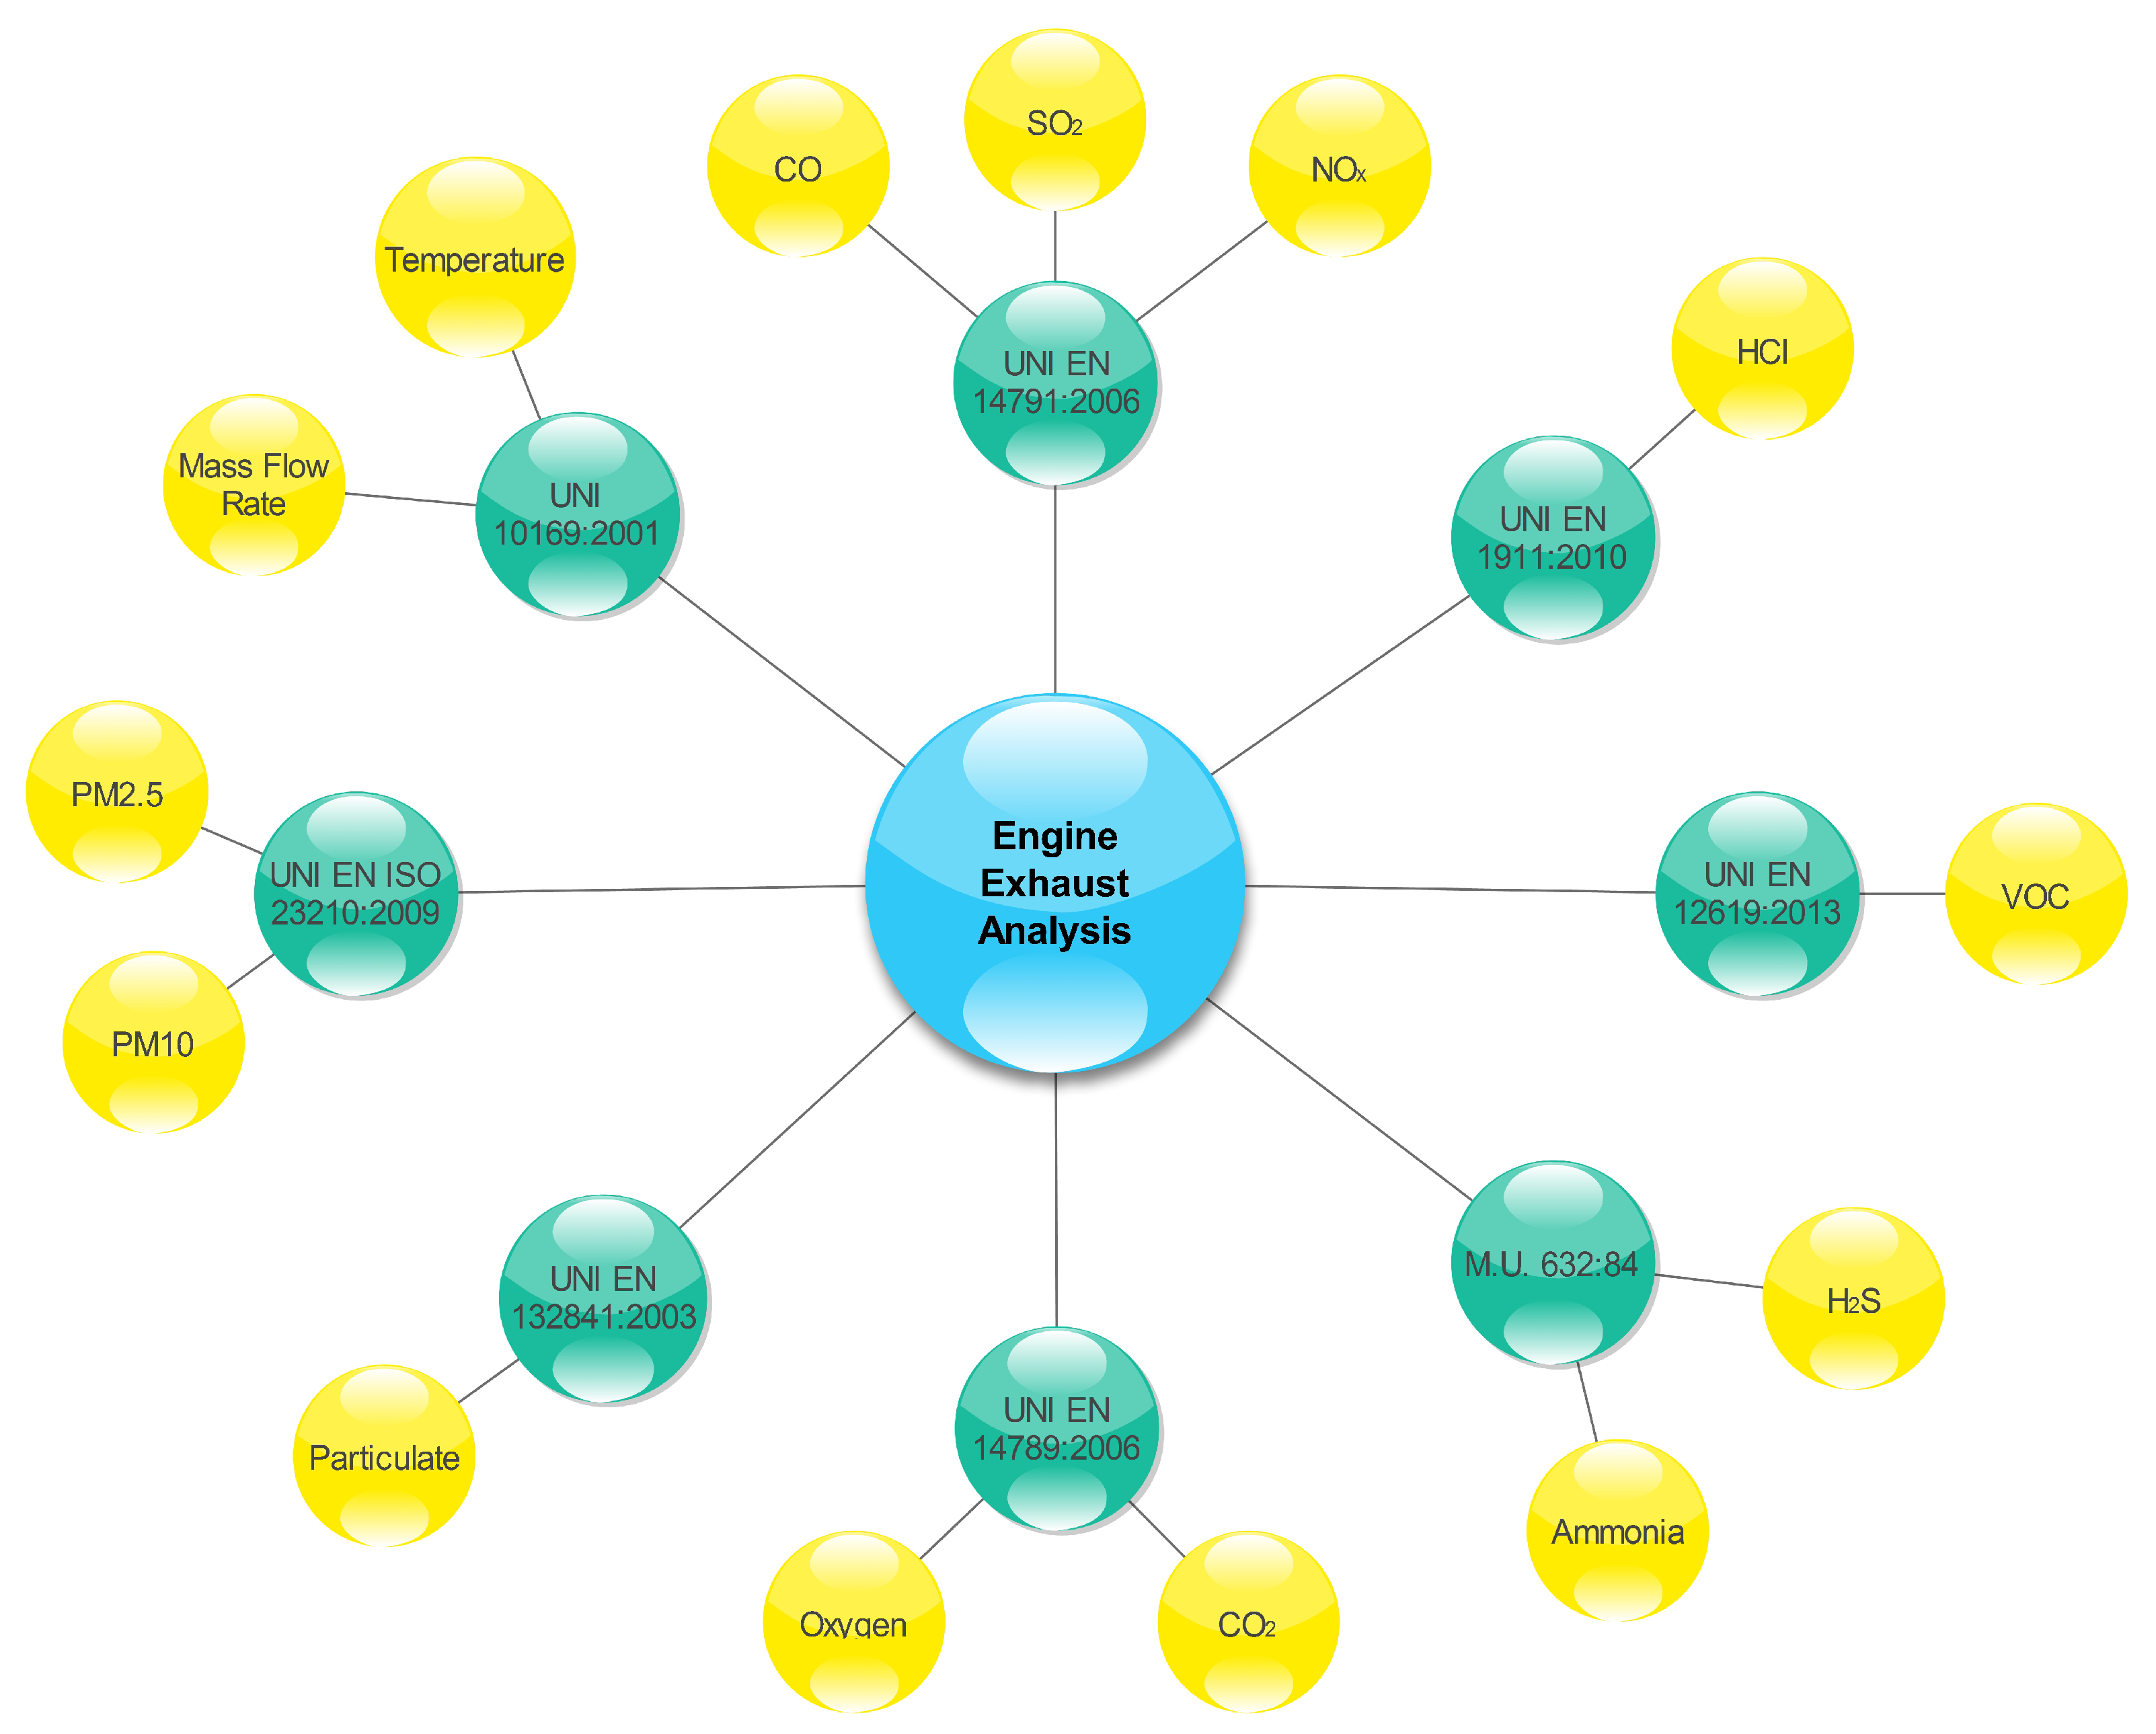
Figure 3 summarises the standards used to measure the engine exhausts composition while, for aldehydes, the CARB 430 1991 reference is used. Dioxins and furans are measured following the prescriptions stated in UNI EN 1948 123:2006 while, PAHs are measured in accordance with D.M. 5/08/2000 GU n. 223 of 23/09/2000 All. 3.
Note that, in BGPs 1,2 and 3, PAHs and dioxins and furans can not be measured because waste gases temperature is higher than 300 C, the maximum admissible value for the instrumental apparatus.
As suggested by the Italian Institute of Health, to avoid bias in trend identification, a value equal to half of the detection limit is set in the calculations for all measurements below that limit [56].
In regard to emissions of PAHs, aldehydes and dioxins and furans, the carcinogenicity of compounds is identified by applying the classification proposed by the International Agency for Research on Cancer (IARC) [57].
Risk analysis on PAHs and dioxins and furans is performed using the method outlined by the World Health Organization [58], while the damage to human health induced by regulated and unregulated emissions is estimated by means of the HIA, a method derived from the works performed by Jolliet et al. [44] and Frischknecht et al. [59].
5. Results and Discussion
In Section 5.1, biogas and natural gas regulated emissions are presented and discussed in comparison with the data available in the literature. Then, in Section 5.2, unregulated emissions values are analysed again for both biogas and natural gas powered engines. The detected values are also compared with data available in the literature.
The risk analysis is presented in Section 5.3 with the aim of evaluating the cancer hazardousness of PAHs and dioxins and furans. Finally, in Section 5.4, the analysis of damage to human health for both regulated and unregulated emissions is given.
Before proceeding with the above-mentioned analyses, the biogas composition, the engines’ exhaust gas temperatures, and mass flow rates are briefly discussed.
As shown in Table 1, although the ICEs are identical, the exhaust gases mass flow rates are different due to the diverse engine calibration in terms of the air-to-fuel ratio, fuel injection pressure, etc. In fact, the use of different feedstock mixes affects the biogas volumetric percentage of methane. In particular, in plants BGP 1-BGP 5, it ranges from 51% to 55%, while in BGP 6 it is 47%. Consequently, the lower heating value of BGP 6 biogas is equal to 17.99 MJ Nm−3 while values ranging from 19.67 and 20.64 MJ Nm−3 are registered for BGP 1-BGP 5. This aspect, coupled with the different regulatory limits, means that the ICEs are calibrated in different manners and this leads to measured flow rates that vary from 4000 to 5100 Nm3 h−1.
For more details on the biogas composition and ways to recover the heat content of exhaust gases, refer to [6,34].
5.1. Regulated Emissions: Experimental Results and Literature Comparisons
Table 2 lists the content of regulated emissions in both biogas and natural gas ICEs exhausts.
Measurements reveal that nitrogen oxides exceed the prescribed limits in three cases. This is a consequence of a slow deviation of the engines from the best operating point. The cause is the variability of the biogas composition along the year.
The natural gas engine NOx emission is 59% lower than the regulatory limit. Due to the constant fuel composition, it is easier to calibrate the NG ICE and run it at the best operating point. For this reason, beingsince NOx are compounds easily measurable, canit may be useful to equip both type of engines with a continuous measurement system. In this way, limit exceedance is avoided also in the case of fuel composition variations.
Hydrogen chloride and carbon monoxide, regulated substances only for biogas, are always under the fixed limits. In particular, CO emissions are at least 40% lower than the prescribed limit, while HCl is higher than the instrument threshold only in the case of BGP 4. Nonetheless, the detected value is approximately 86% lower than the prescribed limit (10 mg Nm−3).
SOx and particulates are regulated emissions only for natural gas ICEs. For them a maximum value of 35 mg Nm−3 and 5 mg Nm−3 is set, respectively. In the analysed NG plant, only SO2 was detectable. As clearly shown in Table 2, the measured values for both SOx and PM are two orders of magnitude lower than the regulatory limits.
Comparing the natural gas engine’s CO, HCl, SO2 and PM emissions with the biogas ones reveals that the BG plants’ SO2 emissions are not comparable with the NG ICE emissions. Only three plants do not exceed 35 mg Nm−3 while the BGP 4 SO2 emissions are 3.8 times higher than the regulatory limit set for natural gas ICEs. This outcome underlines the need, on the one hand, to monitor such substances but, on the other hand, to introduce an appropriate legal limit for SOx also in the case of biogas ICEs.
VOCs are another set of compounds which need to be tracked only in the case of biogas. Analysing the VOCs values, it is clear that they exceeded the limit of 100 mg Nm−3. However, in this case, a thorough discussion is needed.
Total VOCs are composed of methane and non-methane VOCs. NMVOCs are mainly aldehydes, PAHs, dioxins and other compounds arising during the various stages of the combustion process but which do not reach complete oxidation. On the contrary, methane VOCs result from the fuel methane quota that remains unburned.
The values listed in Table 2 refer to total VOCs while the limit set by the standards refers to NMVOCs because methane VOCs are not considered harmful to human health. Due to NMVOCs high global warming potential, they are harmful only to the environment.
This aspect was not clear in the first Italian Standard [55]. Thus, the authors measured total VOCs. In this way, comparisons can be done also with the data available in the literature because they do not distinguish between methane and non-methane VOCs.
It is interesting to note that biogas and natural gas total VOCs are comparable.
To the authors’ knowledge, in the literature only a few works have analysed biogas emissions. For this reason, after an in-depth literature review, the authors selected the work by Kristensen et al. [41], which disclosed the emission factors detected at biogas and natural gas plants located in Denmark in the years 2000.
In Kristensen et al.’s investigation, biogas is mainly derived from agricultural wastes (manure), but they also included emissions analysis where biogas is produced at waste deposit sites and waste-water treatment plants. The general composition of biogas is: 65% methane and 35% CO2; a very different content compared with those measured in this experimental campaign [35].
However, it is still valuable to compare Kristensen et al.’s data with the authors’ average weighted values of the emissions, despite the different biomass composition in input, diverse stages of ICEs development and the unknown regulatory limits set in Denmark during Kristensen et al.’s experimental measurements.
Despite the descrepances showed in Table 3, a general reduction in both biogas and natural gas emission values can be observed.
NOx in biogas and natural gas emissions is largely reduced. Thus, from the 2000s to today, NOx emissions have more than halved. An reduction observable also in the case of CO, as previously, for both fuels.
PM emissions in the authors’ biogas plants are an order of magnitude lower than those reported by Kristensen et al. while, in the case of natural gas, the authors’ value is reduced by half of Kristensen et al.’s.
The SO2 emissions of Kristensen et al. and of the authors are comparable only in the case of biogas, while nothing can be said for natural gas due to the lack of reference.
The only exception is the VOCs content in biogas units. Under analysis biogas units are characterised by a higher VOCs value compared to that detected by Kristensen et al., while in the case of natural gas, the authors’ computations show a lower value. This is probably related to actions on the legal limits and/or a technical evolution of the gas engines.
5.2. Unregulated Emissions: Experimental Results and Literature Comparisons
The “unregulated emissions” considered in the present study are: PAHs, aldehydes and dioxins and furans. Measured values are reported in Appendix A.2.1. In particular, Table A1 lists PAH emissions while Table A2 and Table A3 report the quantity of aldehydes and dioxins and furans detected in the ICEs waste gases, respectively.
Unregulated emissions are measurable only in ICEs equipped with WHRUs because, due to the technical limits of instruments, the exhaust gases temperature needs to be lower than 300 C.
To evaluate the carcinogenic hazards to humans, the authors grouped each detected substance in the proper category. Categories are defined by the International Agency for Research on Cancer [57] and are as follows:
- Group 1: carcinogenic to humans;
- Group 2A: probably carcinogenic to humans;
- Group 2B: possibly carcinogenic to humans;
- Group 3: not classifiable as to its carcinogenicity to humans;
- Group 4: probably not carcinogenic to humans.
For a clearer explanation, the group assigned to each compound is listed in Table A1, Table A2 and Table A3 in the column named “IARC”.
The analysis reveals that:
- Among PAHs belonging to group 1, only benzo(a)pyrene is detected in the engines’ exhaust gases. However, in all production facilities, the detected values are below the detection limit.
- PAHs belonging to groups 2A and 2B are mostly below the detection limit. Dibenzo(a,h) anthracene and dibenzo(a,l)pyrene are for both biogas and natual gas ICEs below instrumental limit while cyclopeta(c,d)pyrene is detected in BGP 5 and totally absent in BGP 6 and NG exhaust gases. Benzo(b)fluoranthene and naphthalene, which belong to group 2B, are detected in both BG and NG units. In particular, naphthalene is present in biogas ICEs with values double or triple those in the NG case.
- Only some PAHs which belong to group 3 are above the detection limit. In particular, pyrene, fluoranthene and phenanthrene are substances detected in biogas units (BGP 5 and BGP 6) as well as in the one powered by natural gas.
Comparisons between biogas and natural gas measurements do not show an appreciable difference between the two fuels. Additional analysis on the dangerousness of PAHs is given in Section 5.3 through a carcinogenic risk analysis to better underline any potential sources of risk.
Aldehydes measurements show values below the detection limits except for Formaldehyde. Formaldehyde is the most dangerous substance and it is considered carcinogen to humans. Formaldehyde values show a variability of about 40 times among biogas plants. Such a large interval may depend on both the diet and the ICE calibration.
However, the German standard sets a limit at 60 mg Nm−3 for formaldehyde. However, in authors’ measurements, the highest value is two orders of magnitude lower (0.88 mg Nm−3). So, the detection of formaldehyde in biogas ICEs’ exhaust can not be considered a source of particular concern.
Also in the case of dioxins and furans the risk seems limited since the detected values are very low or below the detection limit. The only dioxin ever detected is 2,3,7,8PeCDF (2,3,4,7,8-pentachlorodibenzofuran) which, unfortunately, is a known carcinogen. However, the value is very low because it is expressed in ng Nm−3. Thus, it can not be considered a source of particular concern, although the values measured in BGP 5 and BGP 6 are an order of magnitude higher than in NG ICE waste gases.
For the sake of completeness, the experimental results are compared with the emission factors detected by Kristensen et al. [41]. Computations are listed in Table A4 and Table A5 ( Appendix A.2.2).
The measured PAHs in biogas and NG engines are almost always lower than Kristensen et al.’s ones except in the case of phenanthrene, fluoranthene, fluorene and pyrene, which are higher in the authors’ case. However, as those compounds belong to group 3, they do not constitute a concern.
Regarding aldehydes comparisons, the major difference is in the values of formaldehyde. Kristensen et al.’s biogas units produced about 200 times more formaldehyde than in the present research, whereas NG produced about 400 times. Differences linked to plants diets, emissions legislation and ICEs’ technological advancement and calibration.
5.3. Risk Analysis
Starting from the experimental campaign results on unregulated emissions, the toxicity for human health of two emission classes, PAHs and dioxins-furans, is computed and comparisons are made considering natural gas as the reference fuel.
Toxicity for human health is studied by medical science for well-defined classes of agents that operate through a common mode of action for the same toxic endpoint. Examples of this approach are the “Relative Potency Factors” for carcinogenic compounds and the “Toxicity Equivalence Factors” (TEFs) for PAHs and dioxin-like compounds.
Carcinogenic risk analysis for PAHs is carried out in accordance with TEF approach proposed by the World Health Organization [58]. PAHs are classified on a scale of relative potency with respect to benzo(a)pyrene. B(a)P is the most dangerous PAH and its potency is assumed equal to 1. Thus, the concentration (x) of each compound (i) - xi (kg Nm−3) can be expressed as an equivalent concentration of B(a)P by means of TEF (kgB(a)P kg−1), and the PAHs emissions of a fuel can be expressed in terms of equivalent B(a)P by means of the following formula:
Several TEF scales are available in the literature [58]. However, in medical science, the most adopted is the Nisbet and LaGoy [60] scale. So, the authors use this in their computations. Note that, the weight of each compound largely depends on the assigned TEF coefficient. As an example, dibenzo(ah)pyrene and dibenzo(al)pyrene are characterised by a TEF equal to 1 like B(a)P, while dibenzo(ah)anthraces presents a TEF equal to 5. Therefore, among PAHs, the highest contribution is not limited to B(a)P.
The B(a)Peq for the emissions of the four plants are summarised in Figure 4a while the calculations performed are given in Table A6.
The PAHs of BGP 4 are all under the detection limit; so this conditioned the B(a)Peq value while, for the other plants, the values are more reliable. In fact, comparing the mean biogas B(a)Peq with the natural gas shows that the biogas toxicity is about 30% lower than that of natural gas. However, excluding BGP 4, comparisons do not highlight differences between biogas and natural gas. Therefore, it can be concluded that the two fuels are substantially equivalent.
Computation of toxic equivalency of dioxins and furans are carried out using the following equation:
where TEFs values are derived from Van den Berg et al. [46] while xi is the concentration of the i-th compound detected during the experimental campaign.
Figure 4b summarises the main outcomes while Table A7 lists each computed TEQ and the total equivalent toxicity.
Dioxins and furans which mostly contribute to the equivalent total toxicity are 2,3,7,8-TCDD, 1,2,3,7,8-PeCDD and 2,3,4,7,8-PeCDF. They have the highest values of TEF. However, conversely to PAHs, the analysis reveals that the NG total TEQ is about 10 times lower than the average value computed for biogas.
5.4. Analysis of Damage to Human Health for Regulated and Unregulated Emissions
A damage assessment analysis is conducted to properly evaluate the weight of biogas plant emissions. To do that, the Health Impact Assessment is used. This is an approach derived from the Life Cycle Impact Assessment [59,61].
The LCIA is a method which can be used to assess the impact on human health or on the environment of emissions produced by human activities. As shown in Figure 5, the LCIA is made up of four steps.
The first step is called the “emissions inventory” and it is used to build an inventory of emissions released into the environment by, e.g., the biogas plant. The second step (“characterization”) allows the emissions to be assigned to the relevant impact categories, within which they are transformed into equivalent emissions of a substance taken as reference. The third step is named “damage assessment” and its aim is to count the damage caused by each equivalent issue by evaluating it in DALY units. The last step, called “normalization”, aims to collect the outcomes of the four damage categories and, after a normalization process, it provides a single value.
Since the focus of this work is only on the effects of biogas engine regulated and unregulated emissions on human health, the damage to ecosystems and climate change are left to future studies.
In the case of emissions regulated by the Italian standard for biogas (NOx, CO, VOC and HCl) and NG engines (NOx, PM and SOx expressed as SO2), they appear only in the first two impact categories (see Figure 5). So, the damage assessment is limited to the “respiratory inorganics” category and the “respiratory organics” category and stops at the third step which is the “human health” step.
However, if both regulated and unregulated emissions are considered, among the six impact categories used to assess damage to human health (respiratory inorganics, respiratory organics, carcinogens, non-carcinogens, ionizing radiation, ozone layer depletion), only the first four are involved because the remaining two are not-significant, since none of the substances found in this investigation are present in them. For this reason, the analysis stops again at the third step.
The quantification of damage (DA) caused by a substance is done by multiplying the quantity of the substance itself “x” (kgemission), by the characterization factor “Cf” (kgsubstance,eq. ) and for the specific damage “sd” (DALY ).
The damage is expressed in DALY and represents the number of years of life lost by a population due to premature death and/or disability caused by a single harmful emission.
This investigation considers a population equal to that of Europe (431 million inhabitants), since the specific damage values have been obtained through statistical evaluations carried out on the basis of the whole European population. In addition, based on data collected by the authors, the average number of operating hours of each biogas plant exceeds 8000 h per year. So, it is assumed that the BG and NG plants run for 8000 h per year.
For each impact categories, the damage analysis outcomes are summarized in Figure 6. For a clearer explanation, in Appendix A.2.4, the computations performed are also listed. For each plant, the specific damage in DALY Nm−3 and the damage per unit of electricity produced (expressed in DALY GJ−1) are given.
It should be noted that some substances are present in more than one category, indicating that they can cause several types of damage. For example, formaldehyde can cause cancer but also respiratory damage. So, it belongs to the “carcinogens” category as well as the “respiratory organics” family. However, formaldehyde can additionally cause various other disorders. So, it is included also in the “non-carcinogens” category.
In the following, the analysis outcomes of each category are discussed.
Respiratory inorganics. Natural gas shows an impact three to four times lower than biogas (see Figure 6a). To justify this discrepancy, it is interesting to analyse the impact of each substance belonging to this category (see Table A8). The most harmful emission is NOx. This is not related to the quantity of the compound but to the high value of the characterization factor. In conclusion, since NOx concentration in the biogas engines is higher than in the natural gas one, the average damage related to the biogas is about 3.5 times the damage produced by natural gas emissions.
Respiratory organics. For this category, Figure 6b shows that the damage from biogas and natural gas exhaust is comparable. However, again, it is important to understand the impact of each substances. As shown in Table A9, the most harmful emissions are VOCs. This is related to their huge amounts, which are about 10000 times higher than those of other substances. Being VOCs is comparable in biogas and natural gas engines emissions, it can be concluded that the average damage related to biogas is approximately equal to that from natural gas.
Carcinogens. Due to the high exhaust gases temperature in three plants, some substances can not be measured. So, the evaluation of this damage is difficult. Nonetheless, the results obtained for BGPs 4, 5 and 6 can be compared with those for NG and, at the plots in Figure 6c, it is clear that the damage related to biogas is approximately double that from natural gas.
In fact, based on the values listed in Table A10, formaldehyde produces the highest damage in plants without WHRUs such as BGPs 1, 2 and 3 due to the absence of measurements related to other harmful substances. In the case of BGP 4, 5, 6 and the NG engine, besides formaldehyde, the most impactful substance is dioxin 2,3,7,8 TCDD due to its high characterization factor, although B(a)P continues to assume significant percentages.
Therefore comparisons shows that biogas produces damage that is almost twice that caused by natural gas.
Non-carcinogens. The analysis reveals that (i) the impacts of biogas and natural gas are comparable (see Figure 6d) and (ii) formaldehyde and dioxins continue to be the most harmful substances (details are given in Table A11). Acrolein also shows high damage values. But, its concentration is always below the detection limit.
Based on the category analysis, it can be concluded that the average damage from biogas is approximately 40% higher than that from natural gas.
In Table 4, the total damage of each impact category is expressed as percentage of the total.
The most damaging category is the “respiratory inorganics” for both biogas and natural gas powered ICEs. However, in the case of biogas, the impacts of this category accounts for 96.8–98.5% while, in the NG unit, its contribution is approximately 93%.
In the NG ICE, the impact on the total damage of the “respiratory organics” category reaches 6.7%, while in the biogas case it is always half of this value. So, it can be concluded that, for biogas and natural gas plants, the main impact is on the respiratory tract. Fortunatly, their emissions are not carcinogenic at all, unlike those of diesel engines, as stated by IARC [57]. The last two categories can not be considered a source of particular concern.
It is also possible to claim that the average damage of biogas is about three times that of natural gas. Therefore, it is interesting to investigate individual emissions to identify the most dangerous one.
With this purpose, in Table 5, the six emissions with the highest specific damage are combined. For the six biogas plants, an average value of each compound is computed.
NOx is the most harmful compound, as it causes, for both fuels, more than 90% of human damage. Therefore, since NOx in biogas engine emissions is three times higher than in NG exhausts, biogas is about three times more harmful than natural gas.
The specific damage from SO2 is negligible in natural gas, but not in biogas. The high sulphur content in biogas emissions can be linked to the degradation of some types of aminoacids (e.g., methionine) contained in maize and wheat.
The specific damage related to VOCs is the same for the two fuels, while the damage caused by formaldehyde is double in the case of biogas with respect to natural gas.
For the dioxin 2,3,7,8TCDD, the factor is about 7. The case of acrolein is the opposite. As already observed, these two substances have impacts but the relative measures are often below the instrumental limit. So, being in trace, their values are not a source of high concern.
It is also worth comparing the values obtained in the counting both regulated and unregulated emissions damage assessment with those counting only regulated emissions.
The first and second row of Table 6, list the health damage computed considering the regulated emissions of biogas and natural gas, respectively. Independently from the considered substances, the health damage caused by biogas is about three times higher than that of natural gas. In the third line, the damage is assessed by considering the set of regulated emissions of both fuels. This computation allows to verify whether there are chemical species, neglected by the legislator, which contribute in a not negligible way to the damage. The comparison among rows 1 to 3 shows that the contributions of SO2 and PM for the biogas damage are small but not negligible (about 7% of the total). Similarly, in the case of NG, the contribution to total damage of CO, HCl and VOCs is approximately 8%. Though, it is small but not negligible. Considering that SO2 and VOCs are the second contributor to biogas and natural gas damage, respectively, it can be inferred that these two compounds play a key role. For this reason, they should be included in future standards update, among the regulated species for biogas and natural gas, respectively.
Considering the current state of knowledge and the very small detected quantities, the comparison between the third and fourth line shows that the contribution to human health damage of unregulated emissions is limited.
It is worth noting that computing the human health damage considering only NOx and SO2 allows to obtain a good estimation for both fuels. In fact, using NOx and SO2 instead of the combined regulated emissions introduce an underestimation of the human health damage of 3.3% in the case of biogas and of 5.6% in the case of natural gas.
6. Conclusions
The aim of the present work is to evaluate the damage to human health arising from both regulated and unregulated emissions from biogas and natural gas internal combustion engines.
Particular attention is devoted to unregulated emissions, which are not usually explicitly foreseen by emission standards, but are contained within macro-groups, which in turn are required by standards, such as volatile organic compounds, unburned hydrocarbons or particulates.
The unregulated emissions considered in this research are polycyclic aromatic hydrocarbons, aldehydes and dioxins and furans.
Six biogas plants and one natural gas engine are involved in the analysis. All the engines entered into operation in 2012, were built by the same manufacturer, are characterised by an electric power of 999 kWel and have the same degree of technological development. The involvement of an engine fuelled by natural gas is needed to make comparisons between emissions released by biogas ICEs and their direct competitor.
Measurements show that PAHs are present in biogas exhausts in small quantities, almost always below the detection limit. This is particularly true for benzo(a)pyrene, belonging to the group that is carcinogenic to humans.
Also PAHs belonging to group 2A, i.e., probable carcinogens to humans, are in quantities below detectable level. The same is true also for the natural gas. The carcinogenic risk analysis of PAHs for the two fuels established their substantial equivalence.
The most dangerous aldehyde, formaldehyde, is also the only one detected in significant quantities. Even if the quantity is small, the level in biogas is about five times higher than in natural gas.
Also dioxins and furans are detected in small quantities in both fuels, and almost always below the detection limit. The analysis of equivalent toxicity shows that biogas is, on average, 10 times more toxic than natural gas.
A more complete picture of the toxicity of both fuels is provided by the analysis of damage to human health assessed in the “Health Impact Assessment”. The main outcomes are:
- The damage per unit of electricity caused by biogas is about three times the damage caused by natural gas.
- Among the four impact categories, “respiratory inorganics” is the most important because it contains NOx and SOx; the two substances with the highest impact. For this reason, “respiratory inorganics” accounts for approximately 97% of the total damage caused by the entire set of emissions. Among other categories, only the “respiratory organics” contributes in a non-negligible way.
- The classification of the most harmful substances shows NOx in the first place. It produces, on average, over 90% of the damage to human health for both biogas and natural gas. However, the damage generated by NOx from biogas is about three times higher than from natural gas. SO2 is present in all investigated biogas exhausts and it accounts for about 6% of the total damage while it is practically absent in natural gas. The VOCs produce quantitatively similar damage for both fuels. Hence, the investigation highlights the role of NOx and SOx. However, SOx is not classified as “regulated emissions” for biogas ICEs. So, being the SOx contribution to the total damage non-negligible, this compound needs to be included among the biogas “regulated emissions”. There is also the need to fix a proper limits in order to reduce the harmfulness to humans of biogas fuel.
Based on actual scientific knowledge and performed computations, it is possible to conclude that:
- Among unregulated emissions, formaldehyde is 5 time higher in biogas exhausts than in natural gas ones.
- NOx in the biogas engines exhausts is three times higher than those of natural gas.
- HIA and RA analyses complement each other and provide a picture of the damage to human health.
- Carcinogenic risk evaluation reveals that B(a)Peq of biogas and natural gas are comparable.
- Biogas toxic equivalency of dioxins and furans in the biogas exhausts is 10 times higher than in the natural gas exhausts.
- The contribution to human health damage of unregulated emissions is limited due to their very small quantities.
- For biogas and natural gas ICEs, considering NOx and SOx is enough to obtain a good estimation of the damage to human health.
- The damage per unit of electricity computed from biogas engines exhausts is about three times higher than from natural gas.
Author Contributions
Conceptualization, A.M. and A.B.; Data curation, A.M. and A.B.; Formal analysis, A.M. and A.B.; Funding acquisition, A.M.; Investigation, A.M. and A.B.; Methodology, A.M. and A.B.; Writing—original draft, A.B.; Writing—review & editing, A.M. and A.B. All authors have read and agreed to the published version of the manuscript.
Funding
This research was funded by “Fondazione Cariverona” grant number “2015.0873—3 Poli 5”.
Acknowledgments
The authors acknowledge “Fondazione Cariverona” for selecting and financing the research project named “Studio per l’implementazione delle fermentazioni anaerobiche a fini energetici e analisi del loro impatto ambientale”. Grant number “2015.0873—3 Poli 5”.
Conflicts of Interest
The authors declare no conflict of interest.
Abbreviations
The following abbreviations are used in this manuscript:
| AD | anaerobic digestion |
| B(a)P | benzo(a)pyrene |
| BGP | biogas plant |
| Cf | characterization factor |
| CHP | combined heat and power |
| DA | damage |
| DALY | disability-adjusted life year |
| DF | duel fuel |
| eq | equivalent |
| EU | European Union |
| HIA | Health Impact Assessment |
| IARC | International Agency for Research on Cancer |
| ICE | internal combustion engine |
| i-th | compound |
| LCA | Life Cycle Assessment |
| LCIA | Life Cycle Impact Assessment |
| n.a. | not available |
| n.d. | not detectable |
| NG | natural gas |
| NMVOCs | non-methane volatile organic compounds |
| Pel | Electric Power, W |
| Pth | Thermal Power, W |
| PAHs | polycyclic aromatic hydrocarbons |
| PCDDs | polychlorinated dibenzo-p-dioxi ns |
| PCDFs | polychlorinated dibenzofurans |
| PM | particulate |
| RA | Risk Assessment |
| RES | Renewable Energy Sources |
| sd | specific damage |
| TEF | Toxicity Equivalence Factor |
| TEQ | Toxic Equivalency |
| TOC | total organic carbon |
| UHC | unburned hydrocarbons |
| VOCs | volatile organic compounds |
| WHRU | waste heat recovery unit |
| x | emission concentration |
Appendix A
Appendix A.1. Italian and German Regulatory Frameworks
To highlight the differences among tracked substances that can be considered “regulated emissions”, the Italian standard is, firstly, analysed and, then, compared with the German regulatory framework. Germany is the sector leader and the most advanced country in biogas technologies. So, the most appropriate country to compare with.
As shown in Figure A1, the Italian standard (Legislative Decree No. 118 of May 19th, 2016 [36]) distinguishes the limits based on fuel type and, then, according to the engine nameplate thermal power.
Figure A1.
Italian regulatory limits for biogas and natural gas plants [36].
Figure A1.
Italian regulatory limits for biogas and natural gas plants [36].

NOx is included among the regulated emissions for both fuels, despite different values fixed as regulatory limits. CO, HCl and VOCs are included among regulated substances for ICEs fed by biogas, but not for natural gas. Conversely, SOx and PM need to be tracked in the case of NG ICEs but not in biogas engines.
Note that, in the updated legislation, it is clearly stated that: (i) the volatile organic compounds are expressed as Total Organic Carbon (TOC) and their legal limit includes only non-methane volatile organic compounds (NMVOCs); (ii) SOx are expressed as SO2. An clarification necessary to solve the misunderstanding introduced by the previous legislation [55].
Contrary to the Italian standard, the German legislation differentiates based on fuel type but sets different limits depending on the engine type and, in some cases, also based on the ICE thermal power as clearly summarized in Figure A2.
Figure A2.
German regulatory limits for biogas plants [62].
Figure A2.
German regulatory limits for biogas plants [62].

Both legislations set limits for NOx and CO, while HCl and VOCs are considered less important than SOx and formaldehyde by the German regulation. Formaldehyde is an organic substance known for its carcinogenicity. So, Germany is working to limit toxic and volatile compounds which are known to be human carcinogens, not only setting limits but also establishing supports to boost their reduction. In fact, to encourage formaldehyde reduction, the German government granted a bonus of 0.01 € per kWh to biogas plants able to simultaneously respect the legal limits set for the pollutants and maintain formaldehyde levels under 40 mg Nm−3 [63].
Appendix A.2. Unregulated Emissions Values and Damage Calculations
Appendix A.2.1. Unregulated Emissions Detected Values
This section reports unregulated emissions values collected during the experimental campaign. Measurements refer to three biogas unit and to the ICE fed with natural gas. In particular, Table A1 lists the measured PAH emissions while Table A2 and Table A3 report the aldehydes and dioxins and furans, respectively.
In Tables, the column named “IARC” reports the category of carcinogenicity according to the classification introduce by the International Agency for Research on Cancer [57].
Note that, PAH, aldehydes and dioxins and furans can be measured only in the case of ICE equipped with a WHRU because adopted instruments can work with waste gases temperature lower than 300 C.

Table A1.
PAHs measured in both biogas and natural gas exhausts. Listed values are given in g Nm−3.
| Substance | IARC | BGP 4 | BGP 5 | BGP 6 | NGP |
|---|---|---|---|---|---|
| Acenaphthene | 3 | <2.2 × 10⁻³ | 5.2 × 10⁻³ | 1.3 × 10⁻² | 7.1 × 10⁻³ |
| Acenaphthylene | 3 | <2.2 × 10⁻³ | <3.1 × 10⁻³ | 1.5 × 10⁻² | 1.8 × 10⁻² |
| Anthracene | 3 | <2.2 × 10⁻³ | 1.8 × 10⁻² | 5.0 × 10⁻³ | 1.5 × 10⁻³ |
| Benzo(a)anthracene | 2B | <2.2 × 10⁻³ | <3.1 × 10⁻³ | <1.3 × 10⁻³ | <1.3 × 10⁻³ |
| Benzo(a)pyrene | 1 | <2.2 × 10⁻³ | <3.1 × 10⁻³ | <1.3 × 10⁻³ | <1.3 × 10⁻³ |
| Benzo(b)fluoranthene | 2B | <2.2 × 10⁻³ | 7.7 × 10⁻³ | <1.3 × 10⁻³ | 4.6 × 10⁻³ |
| Benzo(e)pyrene | 3 | <2.2 × 10⁻³ | 9.0 × 10⁻³ | <1.3 × 10⁻³ | 6.4 × 10⁻³ |
| Benzo(ghi)perylene | 3 | <2.2 × 10⁻³ | <3.1 × 10⁻³ | <1.3 × 10⁻³ | 1.8 × 10⁻² |
| Benzo(j)fluoranthene | 2B | <2.2 × 10⁻³ | <3.1 × 10⁻³ | <1.3 × 10⁻³ | <1.3 × 10⁻³ |
| Benzo(k)fluoranthene | 2B | <2.2 × 10⁻³ | <3.1 × 10⁻³ | <1.3 × 10⁻³ | <1.3 × 10⁻³ |
| Cyclopenta(c,d)pyrene | 2A | <2.2 × 10⁻³ | 3.4 × 10⁻³ | n.d. | n.d. |
| Coronene | 3 | <2.2 × 10⁻³ | <3.1 × 10⁻³ | n.d. | n.d. |
| Chrysene | 2B | <2.2 × 10⁻³ | 7.8 × 10⁻³ | <1.3 × 10⁻³ | <1.3 × 10⁻³ |
| Dibenzo(a,e)fluoranthene | 3 | <2.2 × 10⁻³ | <3.1 × 10⁻³ | n.d. | n.d. |
| Dibenzo(a,e)pyrene | 3 | <2.2 × 10⁻³ | <3.1 × 10⁻³ | <1.3 × 10⁻² | <1.3 × 10⁻² |
| Dibenzo(a,h)anthracene | 2A | <2.2 × 10⁻³ | <3.1 × 10⁻³ | <1.3 × 10⁻³ | <1.3 × 10⁻³ |
| Dibenzo(a,h)pyrene | 2B | <2.2 × 10⁻³ | <3.1 × 10⁻³ | <1.3 × 10⁻² | <1.3 × 10⁻² |
| Dibenzo(a,i)pyrene | 2B | <2.2 × 10⁻³ | <3.1 × 10⁻³ | <1.3 × 10⁻² | <1.3 × 10⁻² |
| Dibenzo(a,l)pyrene | 2A | <2.2 × 10⁻³ | <3.1 × 10⁻³ | <1.3 × 10⁻² | <1.3 × 10⁻² |
| Phenanthrene | 3 | <2.2 × 10⁻³ | 8.8 × 10⁻¹ | 8.8 × 10⁻² | 3.6 × 10⁻² |
| Fluoranthene | 3 | <2.2 × 10⁻³ | 7.7 × 10⁻¹ | 1.5 × 10⁻² | 5.0 × 10⁻³ |
| Fluorene | 3 | <2.2 × 10⁻³ | 1.6 × 10⁻¹ | 3.4 × 10⁻² | 1.8 × 10⁻² |
| Ideno(1,2,3c,d)pyrene | 2B | <2.2 × 10⁻³ | <3.1 × 10⁻³ | <1.3 × 10⁻³ | 8.4 × 10⁻² |
| Naphthalene | 2B | <2.2 × 10⁻³ | 1.1 | 1.5 | 4.2 × 10⁻¹ |
| Perylene | 3 | <2.2 × 10⁻³ | <3.1 × 10⁻³ | n.d. | n.d. |
| Pyrene | 3 | <2.2 × 10⁻³ | 1.2 | 3.4 × 10⁻² | 5.6 × 10⁻³ |
Table A2.
Aldehydes measured in both biogas and natural gas ICEs exhausts. Listed values are given in mg Nm−3.
Table A2.
Aldehydes measured in both biogas and natural gas ICEs exhausts. Listed values are given in mg Nm−3.
| Substance | IARC | BGP 1 | BGP 2 | BGP 3 | BGP 4 | BGP 5 | BGP 6 | NGP |
|---|---|---|---|---|---|---|---|---|
| Formaldehyde | 1 | 8.8 × 10⁻¹ | 5.0 × 10⁻¹ | <3.0 × 10⁻² | <4.0 × 10⁻² | <3.0 × 10⁻² | 1.1 × 10⁻¹ | 1.1 × 10⁻¹ |
| Acetaldehyde | 2B | <4.0 × 10⁻² | 9.0 × 10⁻² | <3.0 × 10⁻² | <4.0 × 10⁻² | <3.0 × 10⁻² | 7.0 × 10⁻² | <6.0 × 10⁻² |
| Acrolein | 3 | <4.0 × 10⁻² | <4.0 × 10⁻² | <3.0 × 10⁻² | <4.0 × 10⁻² | <3.0 × 10⁻² | <3.0 × 10⁻² | <6.0 × 10⁻² |
| Benzaldehyde | <4.0 × 10⁻² | <4.0 × 10⁻² | <3.0 × 10⁻² | <4.0 × 10⁻² | <3.0 × 10⁻² | <3.0 × 10⁻² | <6.0 × 10⁻² | |
| Butiraldehyde | <4.0 × 10⁻² | <4.0 × 10⁻² | <3.0 × 10⁻² | <4.0 × 10⁻² | <3.0 × 10⁻² | <3.0 × 10⁻² | <6.0 × 10⁻² | |
| Crotonaldehyde | 3 | <4.0 × 10⁻² | <4.0 × 10⁻² | <3.0 × 10⁻² | <4.0 × 10⁻² | <3.0 × 10⁻² | <3.0 × 10⁻² | <6.0 × 10⁻² |
| Hexanal | <4.0 × 10⁻² | <4.0 × 10⁻² | <3.0 × 10⁻² | <4.0 × 10⁻² | <3.0 × 10⁻² | <3.0 × 10⁻² | <6.0 × 10⁻² | |
| Isovaleraldehyde | <3.0 × 10⁻² | <3.0 × 10⁻² | <3.0 × 10⁻² | <4.0 × 10⁻² | <3.0 × 10⁻² | <3.0 × 10⁻² | <6.0 × 10⁻² | |
| n-Butyraldehyde | <4.0 × 10⁻² | <4.0 × 10⁻² | <3.0 × 10⁻² | <4.0 × 10⁻² | <3.0 × 10⁻² | n.d. | n.d. | |
| Propionaldehyde | 3 | <3.0 × 10⁻² | <3.0 × 10⁻² | <3.0 × 10⁻² | <4.0 × 10⁻² | <3.0 × 10⁻² | <3.0 × 10⁻² | <6.0 × 10⁻² |
| Valeraldehyde | <3.0 × 10⁻² | <3.0 × 10⁻² | <3.0 × 10⁻² | <4.0 × 10⁻² | <3.0 × 10⁻² | <3.0 × 10⁻² | <6.0 × 10⁻² |
Table A3.
Dioxins and furans measured in biogas plants and in the case of natural gas engine. Listed values are given in ng Nm−3.
Table A3.
Dioxins and furans measured in biogas plants and in the case of natural gas engine. Listed values are given in ng Nm−3.
| Substance | IARC | BGP 4 | BGP 5 | BGP 6 | NGP |
|---|---|---|---|---|---|
| 2,3,7,8 TCDD | 1 | <2.8 × 10⁻⁴ | <3.8 × 10⁻⁴ | <3.0 × 10⁻⁵ | <3.1 × 10⁻⁵ |
| 1,2,3,7,8 PeCDD | 3 | <2.8 × 10⁻⁴ | <3.8 × 10⁻⁴ | 4.8 × 10⁻⁴ | <2.5 × 10⁻⁵ |
| 1,2,3,4,7,8 HxCDD | <1.1 × 10⁻⁴ | <1.5 × 10⁻⁴ | 1.3 × 10⁻⁴ | <1.3 × 10⁻⁵ | |
| 1,2,3,7,8,9 HxCDD | <1.1 × 10⁻⁴ | <1.5 × 10⁻⁴ | 2.5 × 10⁻⁴ | <2.7 × 10⁻⁵ | |
| 1,2,3,6,7,8 HxCDD | <1.1 × 10⁻⁴ | <1.5 × 10⁻⁴ | 4.1 × 10⁻⁴ | 3.1 × 10⁻⁵ | |
| 1,2,3,4,6,7,8 HpCDD | <1.4 × 10⁻⁴ | <2.0 × 10⁻⁴ | 2.7 × 10⁻⁴ | 9.8 × 10⁻⁶ | |
| OCDD | <2.8 × 10⁻⁵ | <3.8 × 10⁻⁵ | 2.8 × 10⁻⁵ | 1.8 × 10⁻⁶ | |
| 2,3,7,8 TCDF | <1.1 × 10⁻⁴ | 1.7 × 10⁻⁵ | 7.7 × 10⁻⁵ | 1.8 × 10⁻⁵ | |
| 1,2,3,7,8 PeCDF | <2.8 × 10⁻⁵ | 2.1 × 10⁻⁴ | 6.3 × 10⁻⁵ | 1.3 × 10⁻⁵ | |
| 2,3,4,7,8 PeCDF | 1 | 3.5 × 10⁻⁴ | 1.1 × 10⁻³ | 1.3 × 10⁻³ | 1.5 × 10⁻⁴ |
| 1,2,3,4,7,8 HxCDF | <1.1 × 10⁻⁴ | 3.5 × 10⁻⁴ | 2.5 × 10⁻⁴ | 1.7 × 10⁻⁵ | |
| 1,2,3,7,8,9 HxCDF | <1.1 × 10⁻⁴ | <1.5 × 10⁻⁴ | 1.4 × 10⁻⁴ | <2.5 × 10⁻⁵ | |
| 1,2,3,6,7,8 HxCDF | <1.1 × 10⁻⁴ | 4.0 × 10⁻⁴ | 3.2 × 10⁻⁵ | <1.4 × 10⁻⁵ | |
| 2,3,4,6,7,8 HxCDF | <1.1 × 10⁻⁴ | 8.1 × 10⁻⁴ | 4.9 × 10⁻⁴ | 1.4 × 10⁻⁵ | |
| 1,2,3,4,6,7,8 HpCDF | <1.4 × 10⁻⁴ | 2.0 × 10⁻⁴ | 1.5 × 10⁻⁴ | 2.3 × 10⁻⁶ | |
| 1,2,3,4,7,8,9 HpCDF | <1.4 × 10⁻⁴ | <2.0 × 10⁻⁴ | 2.2 × 10⁻⁵ | <1.4 × 10⁻⁶ | |
| OCDF | <2.8 × 10⁻⁵ | <3.8 × 10⁻⁵ | 5.8 × 10⁻⁶ | <4.6 × 10⁻⁷ |
Appendix A.2.2. Unregulated Emissions Comparison with Literature
In this section, the values of unregulated emissions detected during the experimental campaign are compared with the data available in the literature. In particular, in Table A4 and Table A5, detected PAHs and aldehydes are compared with the ones presented by Kristensen et al. [41].
Table A4.
Comparison between the PAHs detected in the present work and those in Kristensen et al. [41]. Listed values are given in mg GJ−1.
Table A4.
Comparison between the PAHs detected in the present work and those in Kristensen et al. [41]. Listed values are given in mg GJ−1.
| Substance | BGP 4 | BGP 5 | BGP 6 | NGP | BG [41] | NG |
|---|---|---|---|---|---|---|
| Acenaphthene | <3.0 × 10⁻³ | 6.0 × 10⁻³ | 2.8 × 10⁻² | 1.0 × 10⁻² | 1.1 × 10⁻¹ | 1.6 × 10⁻¹ |
| Acenaphthylene | <3.0 × 10⁻³ | <4.0 × 10⁻³ | 3.3 × 10⁻² | 2.5 × 10⁻² | 8.0 × 10⁻³ | 1.1 × 10⁻¹ |
| Anthracene | <3.0 × 10⁻³ | 2.2 × 10⁻² | 1.1 × 10⁻² | 2.0 × 10⁻³ | 1.1 × 10⁻² | 9.4 × 10⁻² |
| Benzo(a)anthracene | <3.0 × 10⁻³ | <4.0 × 10⁻³ | <3.0 × 10⁻³ | <2.0 × 10⁻³ | 1.0 × 10⁻³ | 2.3 × 10⁻² |
| Benzo(a)pyrene | <3.0 × 10⁻³ | <4.0 × 10⁻³ | <3.0 × 10⁻³ | <2.0 × 10⁻³ | 3.0 × 10⁻³ | 8.0 × 10⁻³ |
| Benzo(b)fluoranthene | <3.0 × 10⁻³ | 9.0 × 10⁻³ | <3.0 × 10⁻³ | 6.0 × 10⁻³ | 3.0 × 10⁻³ | 1.1 × 10⁻¹ |
| Benzo(e)pyrene | <3.0 × 10⁻³ | 1.1 × 10⁻² | <3.0 × 10⁻³ | 9.0 × 10⁻³ | n.a. | n.a. |
| Benzo(ghi)perylene | <3.0 × 10⁻³ | <4.0 × 10⁻³ | <3.0 × 10⁻³ | 2.5 × 10⁻² | 1.0 × 10⁻³ | 1.6 × 10⁻² |
| Benzo(j)fluoranthene | <3.0 × 10⁻³ | <4.0 × 10⁻³ | <3.0 × 10⁻³ | <2.0 × 10⁻³ | n.a. | n.a. |
| Benzo(k)fluoranthene | <3.0 × 10⁻³ | <4.0 × 10⁻³ | <3.0 × 10⁻³ | <2.0 × 10⁻³ | 1.0 × 10⁻³ | 6.3 × 10⁻² |
| Cyclopenta(c,d)pyrene | <3.0 × 10⁻³ | 4.0 × 10⁻³ | n.d. | n.d. | n.a. | n.a. |
| Coronene | <3.0 × 10⁻³ | <4.0 × 10⁻³ | n.d. | n.d. | n.a. | n.a. |
| Chrysene | <3.0 × 10⁻³ | 9.0 × 10⁻³ | <3.0 × 10⁻³ | <2.0 × 10⁻³ | 3.0 × 10⁻³ | 2.8 × 10⁻¹ |
| Dibenzo(a,e)fluoranthene | <3.0 × 10⁻³ | <4.0 × 10⁻³ | n.d. | n.d. | n.a. | n.a. |
| Dibenzo(a,e)pyrene | <3.0 × 10⁻³ | <4.0 × 10⁻³ | <2.8 × 10⁻² | <1.8 × 10⁻² | n.a. | n.a. |
| Dibenzo(a,h) Anthracene | <3.0 × 10⁻³ | <4.0 × 10⁻³ | <3.0 × 10⁻³ | <2.0 × 10⁻³ | 1.0 × 10⁻³ | 4.0 × 10⁻³ |
| Dibenzo(a,h)pyrene | <3.0 × 10⁻³ | <4.0 × 10⁻³ | <2.8 × 10⁻² | <1.8 × 10⁻² | n.a. | n.a. |
| Dibenzo(a,i)pyrene | <3.0 × 10⁻³ | <4.0 × 10⁻³ | <2.8 × 10⁻² | <1.8 × 10⁻² | n.a. | n.a. |
| Dibenzo(a,l)pyrene | <3.0 × 10⁻³ | <4.0 × 10⁻³ | <2.8 × 10⁻² | <1.8 × 10⁻² | n.a. | n.a. |
| Phenanthrene | <3.0 × 10⁻³ | 1.0 | 1.9 × 10⁻¹ | 4.9 × 10⁻² | 2.0 × 10⁻¹ | 1.1 |
| Fluoranthene | <3.0 × 10⁻³ | 9.2 × 10⁻¹ | 3.3 × 10⁻² | 7.0 × 10⁻³ | 1.7 × 10⁻² | 4.0 × 10⁻¹ |
| Fluorene | <3.0 × 10⁻³ | 1.9 × 10⁻¹ | 7.4 × 10⁻² | 2.5 × 10⁻² | 3.1 × 10⁻² | 1.1 × 10⁻¹ |
| Ideno(1,2,3c,d)pyrene | <3.0 × 10⁻³ | <4.0 × 10⁻³ | <3.0 × 10⁻³ | 1.1 × 10⁻² | 1.0 × 10⁻³ | 1.6 × 10⁻² |
| Naphthalene | <3.0 × 10⁻³ | 1.3 | 3.3 | 5.7 × 10⁻¹ | 9.2 | 20.6 |
| Perylene | <3.0 × 10⁻³ | <4.0 × 10⁻³ | n.d. | n.d. | n.a. | n.a. |
| Pyrene | <3.0 × 10⁻³ | 1.4 | 7.4 × 10⁻² | 8.0 × 10⁻³ | 6.0 × 10⁻³ | 3.2 × 10⁻¹ |
Table A5.
Comparison between the aldehydes detected in the present work and those in Kristensen et al. [41]. Listed values are given in mg GJ−1.
Table A5.
Comparison between the aldehydes detected in the present work and those in Kristensen et al. [41]. Listed values are given in mg GJ−1.
| Substance | BGP 4 | BGP 5 | BGP 6 | NGP | BG [41] | NG [41] |
|---|---|---|---|---|---|---|
| Formaldehyde | <49.3 | <35.9 | 239.6 | 149.7 | 58,750.0 | 62,663.2 |
| Acetaldehyde | <49.3 | <35.9 | 152.4 | <81.7 | 305.6 | 4908.6 |
| Acrolein | <49.3 | <35.9 | <65.3 | <81.7 | 27.8 | 235.0 |
| Benzaldehyde | <49.3 | <35.9 | <65.3 | <81.7 | n.a. | 78.3 |
| Butiraldehyde | <49.3 | <35.9 | <65.3 | <81.7 | n.a. | n.a. |
| Crotonaldehyde | <49.3 | <35.9 | <65.3 | <81.7 | n.a. | n.a. |
| Hexanal | <49.3 | <35.9 | <65.3 | <81.7 | n.a. | 52.2 |
| Isovaleraldehyde | <49.3 | <35.9 | <65.3 | <81.7 | n.a. | n.a. |
| n-Butyraldehyde | <49.3 | <35.9 | n.d. | n.d. | n.a. | n.a. |
| Propionaldehyde | <49.3 | <35.9 | <65.3 | <81.7 | n.a. | n.a. |
| Valeraldehyde | <49.3 | <35.9 | <65.3 | <81.7 | n.a. | n.a. |
Appendix A.2.3. Polycyclic Aromatic Hydrocarbons and Dioxins and Furans Risk Evaluation
This section present the carcinogenic risk evaluation of PAHs and dioxins and furans.
Table A6.
Carcinogenic risk evaluation for PAHs. Values are given in g Nm−3.
| Substance | TEF | BGP 4 | BGP 5 | BGP 6 | NGP |
|---|---|---|---|---|---|
| Acenaphthene | 0.001 | 1.1 × 10⁻⁶ | 5.2 × 10⁻⁶ | 1.3 × 10⁻⁵ | 7.1 × 10⁻⁶ |
| Acenaphthylene | 0.001 | 1.1 × 10⁻⁶ | 1.55 × 10⁻⁶ | 1.5 × 10⁻⁵ | 1.8 × 10⁻⁵ |
| Anthracene | 0.01 | 1.1 × 10⁻⁵ | 1.8 × 10⁻⁴ | 5.0 × 10⁻⁵ | 1.5 × 10⁻⁵ |
| Benzo(a)anthracene | 0.1 | 1.1 × 10⁻⁴ | 1.5 × 10⁻⁴ | 6.5 × 10⁻⁵ | 6.5 × 10⁻⁵ |
| Benzo(a)pyrene | 1 | 1.1 × 10⁻³ | 1.5 × 10⁻³ | 6.5 × 10⁻⁴ | 6.5 × 10⁻⁴ |
| Benzo(b)fluoranthene | 0.1 | 1.1 × 10⁻⁴ | 7.7 × 10⁻⁴ | 6.5 × 10⁻⁵ | 4.6 × 10⁻⁴ |
| Benzo(e)pyrene | 0 | 0 | 0 | 0 | |
| Benzo(ghi)perylene | 0 | 0 | 0 | 0 | |
| Benzo(j)fluoranthene | 0 | 0 | 0 | 0 | |
| Benzo(k)fluoranthene | 0.1 | 1.1 × 10⁻⁴ | 1.5 × 10⁻⁴ | 6.5 × 10⁻⁴ | 6.5 × 10⁻⁴ |
| Cyclopenta(c,d)pyrene | 0 | 0 | 0 | 0 | |
| Coronene | 0 | 0 | 0 | 0 | |
| Chrysene | 0.01 | 1.1 × 10⁻⁵ | 7.8 × 10⁻⁵ | 6.5 × 10⁻⁶ | 6.5 × 10⁻⁶ |
| Dibenzo(a,e)fluoranthene | 0 | 0 | 0 | 0 | |
| Dibenzo(a,e)pyrene | 0 | 0 | 0 | 0 | |
| Dibenzo(a,h)anthracene | 5 | 5.5 × 10⁻³ | 7.7 × 10⁻³ | 3.3 × 10⁻³ | 3.3 × 10⁻³ |
| Dibenzo(a,h)pyrene | 1 | 1.1 × 10⁻³ | 1.5 × 10⁻³ | 6.5 × 10⁻³ | 6.5 × 10⁻³ |
| Dibenzo(a,i)pyrene | 0 | 0 | 0 | 0 | |
| Dibenzo(a,l)pyrene | 1 | 1.1 × 10⁻³ | 1.5 × 10⁻³ | 6.5 × 10⁻³ | 6.5 × 10⁻³ |
| Phenanthrene | 0.001 | 1.1 × 10⁻⁶ | 8.8 × 10⁻⁴ | 8.8 × 10⁻⁵ | 3.6 × 10⁻⁵ |
| Fluoranthene | 0.001 | 1.1 × 10⁻⁶ | 7.7 × 10⁻⁴ | 1.5 × 10⁻⁴ | 5.0 × 10⁻⁶ |
| Fluorene | 0.001 | 1.1 × 10⁻⁶ | 1.6 × 10⁻⁴ | 3.4 × 10⁻⁵ | 1.8 × 10⁻⁵ |
| Ideno(1,2,3c,d)pyrene | 0.1 | 1.1 × 10⁻⁴ | 1.5 × 10⁻⁴ | 6.5 × 10⁻⁵ | 8.4 × 10⁻⁴ |
| Naphthalene | 0.001 | 1.1 × 10⁻⁶ | 1.1 × 10⁻³ | 1.5 × 10⁻³ | 4.2 × 10⁻⁴ |
| Perylene | 0 | 0 | 0 | 0 | |
| Pyrene | 0.001 | 1.1 × 10⁻⁶ | 1.2 × 10⁻³ | 3.4 × 10⁻⁵ | 5.6 × 10⁻⁶ |
| TEQ | 9.3 × 10⁻³ | 1.8 × 10⁻² | 1.9 × 10⁻² | 1.9 × 10⁻² |
Table A7.
Toxic equivalency for dioxins and furans. Values are given in ng Nm−3.
| Substance | TEF | BGP 4 | BGP 5 | BGP 6 | NGP |
|---|---|---|---|---|---|
| 2,3,7,8 TCDD | 1 | 1.4 × 10⁻⁴ | 1.9 × 10⁻⁴ | 1.5 × 10⁻⁵ | 1.6 × 10⁻⁵ |
| 1,2,3,7,8 PeCDD | 1 | 1.4 × 10⁻⁴ | 1.9 × 10⁻⁴ | 4.8 × 10⁻⁴ | 1.3 × 10⁻⁵ |
| 1,2,3,4,7,8 HxCDD | 0.1 | 5.5 × 10⁻⁶ | 7.5 × 10⁻⁶ | 1.3 × 10⁻⁵ | 6.5 × 10⁻⁷ |
| 1,2,3,7,8,9 HxCDD | 0.1 | 5.5 × 10⁻⁶ | 7.5 × 10⁻⁶ | 2.5 × 10⁻⁵ | 1.4 × 10⁻⁶ |
| 1,2,3,6,7,8 HxCDD | 0.1 | 5.5 × 10⁻⁶ | 7.5 × 10⁻⁶ | 4.1 × 10⁻⁵ | 3.1 × 10⁻⁶ |
| 1,2,3,4,6,7,8 HpCDD | 0.01 | 7.0 × 10⁻⁷ | 1.0 × 10⁻⁶ | 2.7 × 10⁻⁶ | 9.8 × 10⁻⁸ |
| OCDD | 0.0003 | 4.2 × 10⁻⁹ | 5.7 × 10⁻⁹ | 8.4 × 10⁻⁹ | 5.4 × 10⁻¹⁰ |
| 2,3,7,8 TCDF | 0.1 | 5.5 × 10⁻⁶ | 1.7 × 10⁻⁶ | 7.7 × 10⁻⁶ | 1.8 × 10⁻⁶ |
| 1,2,3,7,8 PeCDF | 0.03 | 4.2 × 10⁻⁷ | 6.3 × 10⁻⁶ | 1.9 × 10⁻⁶ | 3.9 × 10⁻⁷ |
| 2,3,4,7,8 PeCDF | 0.3 | 1.1 × 10⁻⁴ | 3.3 × 10⁻⁴ | 3.9 × 10⁻⁴ | 4.5 × 10⁻⁵ |
| 1,2,3,4,7,8 HxCDF | 0.1 | 5.5 × 10⁻⁶ | 3.5 × 10⁻⁵ | 2.5 × 10⁻⁵ | 1.7 × 10⁻⁶ |
| 1,2,3,7,8,9 HxCDF | 0.1 | 5.5 × 10⁻⁶ | 7.5 × 10⁻⁶ | 1.4 × 10⁻⁵ | 1.6 × 10⁻⁶ |
| 1,2,3,6,7,8 HxCDF | 0.1 | 5.5 × 10⁻⁶ | 4.0 × 10⁻⁵ | 3.2 × 10⁻⁶ | 7.0 × 10⁻⁷ |
| 2,3,4,6,7,8 HxCDF | 0.1 | 5.5 × 10⁻⁶ | 8.1 × 10⁻⁵ | 4.9 × 10⁻⁵ | 1.4 × 10⁻⁶ |
| 1,2,3,4,6,7,8 HpCDF | 0.01 | 7.0 × 10⁻⁷ | 2.0 × 10⁻⁶ | 1.5 × 10⁻⁶ | 2.3 × 10⁻⁸ |
| 1,2,3,4,7,8,9 HpCDF | 0.01 | 7.0 × 10⁻⁷ | 1.0 × 10⁻⁶ | 2.2 × 10⁻⁷ | 7.0 × 10⁻⁹ |
| OCDF | 0.0003 | 4.2 × 10⁻⁹ | 5.7 × 10⁻⁹ | 1.7 × 10⁻⁹ | 6.9 × 10⁻¹¹ |
| TEQ | 4.3 × 10⁻⁴ | 9.1 × 10⁻⁴ | 1.1 × 10⁻⁴ | 8.6 × 10⁻⁵ |
Appendix A.2.4. Damage Analysis Computations
In this section, the damage analysis for the categories: respiratory inorganics (Table A8), respiratory organics (Table A9), carcinogens (Table A10) and non carcinogens (Table A11) are given. Finally, Table A12 summarises the damage for each category in terms of DALY GJ−1.
Table A8.
Damage analysis for the respiratory inorganics category. Values are given in DALY Nm−3.
| Emission | BGP 1 | BGP 2 | BGP 3 | BGP 4 | BGP 5 | BGP 6 | NGP |
|---|---|---|---|---|---|---|---|
| NH3 | 5.95 × 10⁻¹¹ | 3.14 × 10⁻¹⁰ | 2.12 × 10⁻¹¹ | 2.12 × 10⁻¹¹ | 2.12 × 10⁻¹¹ | 7.22 × 10⁻¹¹ | 2.12 × 10⁻¹¹ |
| CO | 3.46 × 10⁻¹⁰ | 1.74 × 10⁻¹⁰ | 2.60 × 10⁻¹⁰ | 2.97 × 10⁻¹⁰ | 3.40 × 10⁻¹⁰ | 1.19 × 10⁻¹⁰ | 8.92 × 10⁻¹¹ |
| NOx | 3.74 × 10⁻⁸ | 4.05 × 10⁻⁸ | 5.34 × 10⁻⁸ | 4.87 × 10⁻⁸ | 4.33 × 10⁻⁸ | 3.23 × 10⁻⁸ | 1.27 × 10⁻⁸ |
| PM 2,5 | 0 | 0 | 0 | 5.60 × 10⁻¹⁰ | 3.50 × 10⁻¹¹ | 3.50 × 10⁻¹¹ | 1.40 × 10⁻¹⁰ |
| SO2 | 4.04 × 10⁻⁹ | 1.31 × 10⁻⁹ | 9.83 × 10⁻¹⁰ | 7.21 × 10⁻⁹ | 2.62 × 10⁻⁹ | 1.42 × 10⁻⁹ | 1.09 × 10⁻¹¹ |
| DA | 4.19 × 10⁻⁸ | 4.23 × 10⁻⁸ | 5.46 × 10⁻⁸ | 5.68 × 10⁻⁸ | 4.63 × 10⁻⁸ | 3.40 × 10⁻⁸ | 1.30 × 10⁻⁸ |
Table A9.
Damage analysis for the respiratory organics category. Values are given in DALY Nm−3.
| Emission | BGP 1 | BGP 2 | BGP 3 | BGP 4 | BGP 5 | BGP 6 | NGP |
|---|---|---|---|---|---|---|---|
| Formaldehyde | 9.77 × 10⁻¹³ | 5.55 × 10⁻¹³ | 1.67 × 10⁻¹⁴ | 2.22 × 10⁻¹⁴ | 1.67 × 10⁻¹⁴ | 1.22 × 10⁻¹³ | 1.22 × 10⁻¹³ |
| Acetaldehyde | 2.72 × 10⁻¹⁴ | 1.22 × 10⁻¹³ | 2.04 × 10⁻¹⁴ | 2.72 × 10⁻¹⁴ | 2.04 × 10⁻¹⁴ | 9.52 × 10⁻¹⁴ | 4.08 × 10⁻¹⁴ |
| Benzaldehyde | 4.42 × 10⁻¹⁸ | 4.42 × 10⁻¹⁸ | 3.32 × 10⁻¹⁸ | 4.42 × 10⁻¹⁸ | 3.32 × 10⁻¹⁸ | 3.32 × 10⁻¹⁸ | 6.63 × 10⁻¹⁸ |
| VOCs | 1.05 × 10⁻⁹ | 1.37 × 10⁻⁹ | 8.50 × 10⁻¹⁰ | 1.11 × 10⁻⁹ | 7.05 × 10⁻¹⁰ | 1.02 × 10⁻⁹ | 9.35 × 10⁻¹⁰ |
| PAH | 0 | 0 | 0 | 6.01 × 10⁻¹⁷ | 8.75 × 10⁻¹⁵ | 3.65 × 10⁻¹⁵ | 1.21 × 10⁻¹⁵ |
| DA | 1.05 × 10⁻⁹ | 1.37 × 10⁻⁹ | 8.50 × 10⁻¹⁰ | 1.11 × 10⁻⁹ | 7.05 × 10⁻¹⁰ | 1.02 × 10⁻⁹ | 9.36 × 10⁻¹⁰ |
Table A10.
Damage analysis for the carcinogens category. Values are given in DALY Nm−3.
| Emission | BGP 1 | BGP 2 | BGP 3 | BGP 4 | BGP 5 | BGP 6 | NGP |
|---|---|---|---|---|---|---|---|
| Formaldehyde | 2.23 × 10⁻¹² | 1.27 × 10⁻¹² | 3.80 × 10⁻¹⁴ | 5.07 × 10⁻¹⁴ | 3.80 × 10⁻¹⁴ | 2.79 × 10⁻¹³ | 2.79 × 10⁻¹³ |
| Acetaldehyde | 3.80 × 10⁻¹⁵ | 1.71 × 10⁻¹⁴ | 2.85 × 10⁻¹⁵ | 3.80 × 10⁻¹⁵ | 2.85 × 10⁻¹⁵ | 1.33 × 10⁻¹⁴ | 5.70 × 10⁻¹⁵ |
| Benzaldehyde | 5.81 × 10⁻¹⁸ | 5.81 × 10⁻¹⁸ | 4.36 × 10⁻¹⁸ | 5.81 × 10⁻¹⁸ | 4.36 × 10⁻¹⁸ | 4.36 × 10⁻¹⁸ | 8.72 × 10⁻¹⁸ |
| Crotonaldehyde | 3.92 × 10⁻¹⁵ | 3.92 × 10⁻¹⁵ | 2.94 × 10⁻¹⁵ | 3.92 × 10⁻¹⁵ | 2.94 × 10⁻¹⁵ | 2.94 × 10⁻¹⁵ | 5.88 × 10⁻¹⁵ |
| 2,3,7,8 TCDD | 0 | 0 | 0 | 6.75 × 10⁻¹³ | 9.16 × 10⁻¹³ | 7.23 × 10⁻¹⁴ | 7.23 × 10⁻¹⁴ |
| 1,2,3,7,8,9 HxCDD | 0 | 0 | 0 | 1.63 × 10⁻¹⁷ | 2.17 × 10⁻¹⁷ | 6.78 × 10⁻¹⁸ | 3.52 × 10⁻¹⁹ |
| Acenaphtene | 0 | 0 | 0 | 2.77 × 10⁻¹⁶ | 1.31 × 10⁻¹⁵ | 3.28 × 10⁻¹⁵ | 1.79 × 10⁻¹⁵ |
| Benzo(a)pyrene | 0 | 0 | 0 | 1.09 × 10⁻¹³ | 1.58 × 10⁻¹³ | 5.94 × 10⁻¹⁴ | 5.94 × 10⁻¹⁴ |
| Dibenzo(a,h)anthracene | 0 | 0 | 0 | 1.35 × 10⁻¹⁴ | 1.96 × 10⁻¹⁴ | 7.34 × 10⁻¹⁵ | 7.34 × 10⁻¹⁵ |
| Dibenzo(a,h)pyrene | 0 | 0 | 0 | 4.27 × 10⁻¹⁹ | 6.21 × 10⁻¹⁹ | 2.33 × 10⁻¹⁸ | 2.33 × 10⁻¹⁸ |
| Benzo(k)fluoranthene | 0 | 0 | 0 | 1.39 × 10⁻¹⁵ | 2.02 × 10⁻¹⁵ | 7.59 × 10⁻¹⁶ | 7.59 × 10⁻¹⁶ |
| Naphtalene | 0 | 0 | 0 | 1.58 × 10⁻¹⁹ | 1.55 × 10⁻¹⁶ | 2.15 × 10⁻¹⁶ | 6.03 × 10⁻¹⁷ |
| DA | 2.24 × 10⁻¹² | 1.29 × 10⁻¹² | 4.38 × 10⁻¹⁴ | 8.58 × 10⁻¹³ | 1.14 × 10⁻¹² | 4.39 × 10⁻¹³ | 4.32 × 10⁻¹³ |
Table A11.
Damage analysis for the non carcinogens category. Values are given in DALY Nm−3.
| Emission | BGP 1 | BGP 2 | BGP 3 | BGP 4 | BGP 5 | BGP 6 | NGP |
|---|---|---|---|---|---|---|---|
| Formaldehyde | 8.05 × 10⁻¹² | 4.57 × 10⁻¹² | 1.37 × 10⁻¹³ | 1.83 × 10⁻¹³ | 1.37 × 10⁻¹³ | 1.01 × 10⁻¹² | 1.01 × 10⁻¹² |
| Acetaldehyde | 9.02 × 10⁻¹⁶ | 4.06 × 10⁻¹⁵ | 6.76 × 10⁻¹⁶ | 9.02 × 10⁻¹⁶ | 6.76 × 10⁻¹⁶ | 3.16 × 10⁻¹⁵ | 1.35 × 10⁻¹⁵ |
| Acrolein | 1.52 × 10⁻¹² | 1.52 × 10⁻¹² | 1.14 × 10⁻¹² | 1.52 × 10⁻¹² | 1.14 × 10⁻¹² | 1.14 × 10⁻¹² | 2.28 × 10⁻¹² |
| Benzaldehyde | 2.97 × 10⁻¹⁸ | 2.97 × 10⁻¹⁸ | 2.23 × 10⁻¹⁸ | 2.97 × 10⁻¹⁸ | 2.23 × 10⁻¹⁸ | 2.23 × 10⁻¹⁸ | 4.46 × 10⁻¹⁸ |
| 2,3,7,8 TCDD | 0 | 0 | 0 | 3.41 × 10⁻¹² | 4.63 × 10⁻¹² | 3.65 × 10⁻¹³ | 3.65 × 10⁻¹³ |
| Acenaphtene | 0 | 0 | 0 | 1.13 × 10⁻¹⁹ | 5.35 × 10⁻¹⁹ | 1.34 × 10⁻¹⁸ | 7.31 × 10⁻¹⁹ |
| Acenaphtylene | 0 | 0 | 0 | 6.16 × 10⁻²⁰ | 8.96 × 10⁻²⁰ | 8.40 × 10⁻¹⁹ | 1.01 × 10⁻¹⁸ |
| Anthracene | 0 | 0 | 0 | 3.45 × 10⁻²⁰ | 5.64 × 10⁻¹⁹ | 1.57 × 10⁻¹⁹ | 4.70 × 10⁻²⁰ |
| Benzo(a)anthracene | 0 | 0 | 0 | 3.26 × 10⁻¹⁵ | 4.44 × 10⁻¹⁵ | 1.78 × 10⁻¹⁵ | 1.78 × 10⁻¹⁵ |
| Benzo(b)fluorantene | 0 | 0 | 0 | 7.90 × 10⁻¹⁶ | 1.22 × 10⁻¹⁵ | 4.31 × 10⁻¹⁶ | 3.31 × 10⁻¹⁵ |
| Benzo(g,h,i)perilene | 0 | 0 | 0 | 6.82 × 10⁻¹⁷ | 9.30 × 10⁻¹⁷ | 3.72 × 10⁻¹⁷ | 1.12 × 10⁻¹⁵ |
| Crysene | 0 | 0 | 0 | 2.73 × 10⁻¹⁵ | 1.94 × 10⁻¹⁴ | 1.49 × 10⁻¹⁵ | 1.49 × 10⁻¹⁵ |
| Phenantrene | 0 | 0 | 0 | 5.23 × 10⁻¹⁹ | 4.18 × 10⁻¹⁶ | 4.18 × 10⁻¹⁷ | 1.71 × 10⁻¹⁷ |
| Indeno(1,2,3,c,d)pyrene | 0 | 0 | 0 | 5.13 × 10⁻¹⁶ | 7.00 × 10⁻¹⁶ | 2.80 × 10⁻¹⁶ | 3.92 × 10⁻¹⁵ |
| Naphtalene | 0 | 0 | 0 | 1.63 × 10⁻²¹ | 1.60 × 10⁻¹⁸ | 2.22 × 10⁻¹⁸ | 6.22 × 10⁻¹⁹ |
| Pyrene | 0 | 0 | 0 | 1.65 × 10⁻¹⁷ | 1.80 × 10⁻¹⁴ | 5.10 × 10⁻¹⁶ | 8.40 × 10⁻¹⁷ |
| DA | 9.57 × 10⁻¹² | 6.10 × 10⁻¹² | 1.28 × 10⁻¹² | 5.12 × 10⁻¹² | 5.95 × 10⁻¹² | 2.52 × 10⁻¹² | 3.67 × 10⁻¹² |
Table A12.
Damage values ranked by category and expressed as DALY GJ−1.
| Emission | BGP 1 | BGP 2 | BGP 3 | BGP 4 | BGP 5 | BGP 6 | NGP |
|---|---|---|---|---|---|---|---|
| Respiratory inorganics | 5.94 × 10⁻⁵ | 5.71 × 10⁻⁵ | 6.53 × 10⁻⁵ | 7.01 × 10⁻⁵ | 5.54 × 10⁻⁵ | 7.40 × 10⁻⁵ | 1.77 × 10⁻⁵ |
| Respiratory organics | 1.48 × 10⁻⁶ | 1.85 × 10⁻⁶ | 1.02 × 10⁻⁶ | 1.37 × 10⁻⁶ | 8.43 × 10⁻⁷ | 2.22 × 10⁻⁶ | 1.27 × 10⁻⁶ |
| Carcinogens | 3.18 × 10⁻⁹ | 1.74 × 10⁻⁹ | 5.24 × 10⁻¹¹ | 1.06 × 10⁻⁹ | 1.36 × 10⁻⁹ | 9.55 × 10⁻¹⁰ | 5.88 × 10⁻¹⁰ |
| Non carcinogens | 1.36 × 10⁻⁸ | 8.22 × 10⁻⁹ | 1.53 × 10⁻⁹ | 6.32 × 10⁻⁹ | 7.11 × 10⁻⁹ | 5.49 × 10⁻⁹ | 4.99 × 10⁻⁹ |
References
- Jaffrin, A.; Bentounes, N.; Joan, A.M.; Makhlouf, S. Landfill biogas for heating greenhouses and providing carbon dioxide supplement for plant growth. Biosyst. Eng. 2003, 86, 113–123. [Google Scholar] [CrossRef]
- Zhang, T.; Tan, Y.; Zhang, X. Using a hybrid heating system to increase the biogas production of household digesters in cold areas of China: An experimental study. Appl. Therm. Eng. 2016, 103, 1299–1311. [Google Scholar] [CrossRef]
- Colorado, A.; McDonell, V. Emissions and stability performance of a low-swirl burner operated on simulated biogas fuels in a boiler environment. Appl. Therm. Eng. 2018, 130, 1507–1519. [Google Scholar] [CrossRef]
- Amiri, S.; Henning, D.; Karlsson, B.G. Simulation and introduction of a CHP plant in a Swedish biogas system. Renew. Energy 2013, 49, 242–249. [Google Scholar] [CrossRef]
- Yağli, H.; Koç, Y.; Koç, A.; Görgülü, A.; Tandiroğlu, A. Parametric optimization and exergetic analysis comparison of subcritical and supercritical organic Rankine cycle (ORC) for biogas fuelled combined heat and power (CHP) engine exhaust gas waste heat. Energy 2016, 111, 923–932. [Google Scholar] [CrossRef]
- Benato, A.; Macor, A. Biogas engine waste heat recovery using organic Rankine cycle. Energies 2017, 10, 327. [Google Scholar] [CrossRef]
- Tippayawong, N.; Thanompongchart, P. Biogas quality upgrade by simultaneous removal of CO2 and H2S in a packed column reactor. Energy 2010, 35, 4531–4535. [Google Scholar] [CrossRef]
- Kasikamphaiboon, P.; Chungsiriporn, J.; Bunyakan, C.; Wiyaratn, W. Simultaneous removal of CO2 and H2S using MEA solution in a packed column absorber for biogas upgrading. Songklanakarin J. Sci. Technol. 2013, 35, 583–691. [Google Scholar]
- Yang, L.; Ge, X.; Wan, C.; Yu, F.; Li, Y. Progress and perspectives in converting biogas to transportation fuels. Renew. Sustain. Energy Rev. 2014, 40, 1133–1152. [Google Scholar] [CrossRef]
- Sun, Q.; Li, H.; Yan, J.; Liu, L.; Yu, Z.; Yu, X. Selection of appropriate biogas upgrading technology—A review of biogas cleaning, upgrading and utilisation. Renew. Sustain. Energy Rev. 2015, 51, 521–532. [Google Scholar] [CrossRef]
- Atelge, M.R.; Krisa, D.; Kumar, G.; Eskicioglu, C.; Nguyen, D.D.; Chang, S.W.; Atabani, A.E.; Al-Muhtaseb, A.H.; Unalan, S. Biogas production from organic waste: Recent progress and perspectives. Waste Biomass Valorization 2020, 11, 1019–1040. [Google Scholar] [CrossRef]
- Maffezzoni, C. Boiler-turbine dynamics in power-plant control. Control Eng. Pract. 1997, 5, 301–312. [Google Scholar] [CrossRef]
- Stoppato, A.; Benato, A.; Mirandola, A. Assessment of stresses and residual life of plant components in view of life-time extension of power plants. In Proceedings of the ECOS 2012—The 25th International Conference on Efficiency, Cost, Optimization, Simulations and Environmental Impact of Energy Systems, Perugia, Italy, 26–29 June 2012; Volume 4, pp. 104–113. [Google Scholar]
- Benato, A.; Bracco, S.; Stoppato, A.; Mirandola, A. Dynamic simulation of combined cycle power plant cycling in the electricity market. Energy Convers. Manag. 2016, 107, 76–85. [Google Scholar] [CrossRef]
- Benato, A.; Stoppato, A.; Mirandola, A. Dynamic behaviour analysis of a three pressure level heat recovery steam generator during transient operation. Energy 2015, 90, 1595–1605. [Google Scholar] [CrossRef]
- Gonzalez-Salazar, M.A.; Kirsten, T.; Prchlik, L. Review of the operational flexibility and emissions of gas-and coal-fired power plants in a future with growing renewables. Renew. Sustain. Energy Rev. 2018, 82, 1497–1513. [Google Scholar] [CrossRef]
- Benato, A.; Stoppato, A. Pumped thermal electricity storage: A technology overview. Therm. Sci. Eng. Prog. 2018, 6, 301–315. [Google Scholar] [CrossRef]
- Benato, A.; Stoppato, A. Heat transfer fluid and material selection for an innovative pumped thermal electricity storage system. Energy 2018, 147, 155–168. [Google Scholar] [CrossRef]
- Benato, A.; Stoppato, A. Energy and cost analysis of an air cycle used as prime mover of a thermal electricity storage. J. Energy Storage 2018, 17, 29–46. [Google Scholar] [CrossRef]
- Benato, A.; Stoppato, A. Energy and cost analysis of a new packed bed pumped thermal electricity storage unit. J. Energy Resour. Technol. 2017, 140, 020904. [Google Scholar] [CrossRef]
- Sciacovelli, A.; Vecchi, A.; Ding, Y. Liquid air energy storage (LAES) with packed bed cold thermal storage–From component to system level performance through dynamic modelling. Appl. Energy 2017, 190, 84–98. [Google Scholar] [CrossRef] [Green Version]
- Groppi, D.; Garcia, D.A.; Basso, G.L.; Cumo, F.; De Santoli, L. Analysing economic and environmental sustainability related to the use of battery and hydrogen energy storages for increasing the energy independence of small islands. Energy Convers. Manag. 2018, 177, 64–76. [Google Scholar] [CrossRef]
- Tummuru, N.R.; Mishra, M.K.; Srinivas, S. Dynamic Energy Management of Renewable Grid Integrated Hybrid Energy Storage System. IEEE Trans. Ind. Electron. 2015, 62, 7728–7737. [Google Scholar] [CrossRef]
- Sajadi, A.; Strezoski, L.; Strezoski, V.; Prica, M.; Loparo, K.A. Integration of renewable energy systems and challenges for dynamics, control, and automation of electrical power systems. WIRE 2019, 8, 1–14. [Google Scholar] [CrossRef] [Green Version]
- Berglund, M.; Börjesson, P. Assessment of energy performance in the life-cycle of biogas production. Biomass Bioenergy 2006, 30, 256–266. [Google Scholar] [CrossRef]
- Pehnt, M. Dynamic life cycle assessment (LCA) of renewable energy technologies. Renew. Energy 2006, 31, 55–71. [Google Scholar] [CrossRef]
- Amponsah, N.Y.; Troldborg, M.; Kington, B.; Aalders, I.; Hough, R.L. Greenhouse gas emissions from renewable energy sources: A review of lifecycle considerations. Renew. Sustain. Energy Rev. 2014, 39, 461–475. [Google Scholar] [CrossRef]
- Ingrao, C.; Bacenetti, J.; Adamczyk, J.; Ferrante, V.; Messineo, A.; Huisingh, D. Investigating energy and environmental issues of agro-biogas derived energy systems: A comprehensive review of life cycle assessments. Renew. Energy 2019, 136, 296–307. [Google Scholar] [CrossRef]
- Food and Agriculture Organization of the United Nations. Bioenergy and Food Security—The BEFS Analytical Framework; Food and Agriculture Organization: Rome, Italy, 2010. [Google Scholar]
- Tran, N.; Illukpitiya, P.; Yanagida, J.F.; Ogoshi, R. Optimizing biofuel production: An economic analysis for selected biofuel feedstock production in Hawaii. Biomass Bioenergy 2011, 35, 1756–1764. [Google Scholar] [CrossRef]
- Wesseler, J.; Drabik, D. Prices matter: Analysis of food and energy competition relative to land resources in the European Union. NJAS Wagening. J. Life Sci. 2016, 77, 19–24. [Google Scholar] [CrossRef]
- International Renewable Energy Agency. Renewable Energy Capacity Statistics 2018; Technical report; International Renewable Energy Agency: Masdar, UAE, 2018. [Google Scholar]
- Benato, A.; Macor, A.; Rossetti, A. Biogas Engine Emissions: Standards and On-Site Measurements. Energy Procedia 2017, 126, 398–405. [Google Scholar] [CrossRef]
- Benato, A.; Macor, A. Italian Biogas Plants: Trend, Subsidies, Cost, Biogas Composition and Engine Emissions. Energies 2019, 12, 979. [Google Scholar] [CrossRef] [Green Version]
- Macor, A.; Benato, A. Regulated emissions of biogas engines—On site experimental measurements and damage assessment on human health. Energies 2020, 13, 1044. [Google Scholar] [CrossRef] [Green Version]
- Ministero Dell’ambiente e Della Tutela del Territorio e del Mare. Regolamento Recante Aggiornamento Dei Valori Limite Di Emissione in Atmosfera Per Le Emissioni Di Carbonio Organico Totale Degli Impianti Alimentati a Biogas, Ai Sensi Dell’articolo 281, Comma 5, Del Decreto Legislativo N. 152 Del 2006; Italian Parliament: Rome, Italy, 2016. [Google Scholar]
- Bari, S. Effect of carbon dioxide on the performance of biogas/diesel duel-fuel engine. Renew. Energy 1996, 9, 1007–1010. [Google Scholar] [CrossRef]
- Swami Nathan, S.; Mallikarjuna, J.M.; Ramesh, A. An experimental study of the biogas-diesel HCCI mode of engine operation. Energy Convers. Manag. 2010, 51, 1347–1353. [Google Scholar] [CrossRef]
- Kalsi, S.S.; Subramanian, K.A. Effect of simulated biogas on performance, combustion and emissions characteristics of a bio-diesel fueled diesel engine. Renew. Energy 2017, 106, 78–90. [Google Scholar] [CrossRef]
- Hotta, S.K.; Sahoo, N.; Mohanty, K. Comparative assessment of a spark ignition engine fueled with gasoline and raw biogas. Renew. Energy 2019, 134, 1307–1319. [Google Scholar] [CrossRef]
- Kristensen, P.G.; Jensen, J.K.; Nielsen, M.; Illerup, J.B. Emission Factors for Gas Fired CHP units < 25 MW; Technical report; IGRC: Springfield, IL, USA, 2004. [Google Scholar]
- Nielsen, M.; Nielsen, O.K.; Marlene, P. Danish Emission Inventories for Stationary Combustion Plants—Inventories Until 2011; Technical report; Aarhus University, Department of Environmental Science, AARHUS: Roskilde, Denmark, 2014. [Google Scholar]
- Dogliotti, E.; Achene, L.; Beccaloni, E.; Carere, M.; Comba, P.; Crebelli, R.; Lacchetti, I.; Pasetto, R.; Soggiu, M.E.; Testai, E. Guidelines for Health Impact Assessment (Italian Legislative Decree n. 104/2017); Technical report; Istituto superiore di sanità: Rome, Italy, 2019. [Google Scholar]
- Jolliet, O.; Müller-Wenk, R.; Bare, J.; Brent, A.; Goedkoop, M.; Heijungs, R.; Itsubo, N.; Peña, C.; Pennington, D.; Potting, J.; et al. The LCIA midpoint-damage framework of the UNEP/SETAC life cycle initiative. Int. J. Life Cycle Assess. 2004, 9, 394–404. [Google Scholar] [CrossRef] [Green Version]
- US EPA. Guidelines for Carcinogen Risk Assessment. EPA/630/P-03/001F; Federal Register; US EPA: Washington, DC, USA, 2005. [Google Scholar]
- Van den Berg, M.; Birnbaum, L.S.; Denison, M.; De Vito, M.; Farland, W.; Feeley, M.; Fiedler, H.; Hakansson, H.; Hanberg, A.; Haws, L.; et al. The 2005 World Health Organization reevaluation of human and mammalian toxic equivalency factors for dioxins and dioxin-like compounds. Toxicol. Sci. 2006, 93, 223–241. [Google Scholar] [CrossRef] [Green Version]
- Lijó, L.; González-García, S.; Bacenetti, J.; Fiala, M.; Feijoo, G.; Lema, J.M.; Moreira, M.T. Life cycle assessment of electricity production in italy from anaerobic co-digestion of pig slurry and energy crops. Renew. Energy 2014, 68, 625–635. [Google Scholar] [CrossRef] [Green Version]
- Petrov, O.; Bi, X.; Lau, A. Impact assessment of biomass-based district heating systems in densely populated communities. Part I: Dynamic intake fraction methodology. Atmos. Environ. 2015, 115, 70–78. [Google Scholar] [CrossRef]
- Petrov, O.; Bi, X.; Lau, A. Impact assessment of biomass-based district heating systems in densely populated communities. Part II: Would the replacement of fossil fuels improve ambient air quality and human health? Atmos. Environ. 2017, 161, 191–199. [Google Scholar] [CrossRef]
- Fernández-Nava, Y.; Del Río, J.; Rodríguez-Iglesias, J.; Castrillón, L.; Marañón, E. Life cycle assessment of different municipal solid waste management options: A case study of Asturias (Spain). J. Clean. Prod. 2014. [Google Scholar] [CrossRef] [Green Version]
- Fusi, A.; Bacenetti, J.; Fiala, M.; Azapagic, A. Life cycle environmental impacts of electricity from biogas produced by anaerobic digestion. Front. Bioeng. Biotechnol. 2016. [Google Scholar] [CrossRef] [PubMed] [Green Version]
- Paolini, V.; Petracchini, F.; Segreto, M.; Tomassetti, L.; Naja, N.; Cecinato, A. Environmental impact of biogas: A short review of current knowledge. J. Environ. Sci. Heal. A 2018. [Google Scholar] [CrossRef] [Green Version]
- GE. GE Power Generation. 2016. Available online: https://powergen.gepower.com/applications/biogas.html (accessed on 30 September 2020).
- Gestore dei Servizi Energetici GSE S.p.A. Teleriscaldamento e teleraffrescamento in Italia—Anno 2017. Available online: https://www.gse.it/documenti_site/Documenti%20GSE/Rapporti%20statistici/Nota%20TLR%202019.pdf (accessed on 30 September 2020).
- Italian Parliament. Decreto Legislativo 3 Aprile 2006, n. 152. Norme in Materia Ambientale. 2006. Available online: http://www.gazzettaufficiale.it/atto/serie_generale/caricaDettaglioAtto/originario?atto.dataPubblicazioneGazzetta=2006-04-14&atto.codiceRedazionale=006G0171 (accessed on 30 September 2020).
- Menichini, E.; Viviano, G. Treatment of data below the detection limit in the calculation of analytical results (Trattamento dei dati inferiori al limite di rivelabilita nel calcolo dei risultati analitici). Working group Istituto Superiore di Sanita Metodiche per il rilevamento. Rapp. ISTISAN 2004, 4, 15. [Google Scholar]
- IARC. List of Classifications by Cancer Sites with Sufficient or Limited Evidence in Humans, Volumes 1 to 124; IARC Monographs; IARC: Lyon CEDEX, France, 2019. [Google Scholar]
- WHO. Selected Non-Heterocyclic Polycyclic Aromatic Hydrocarbons. Environmental Health Criteria. 1998. Available online: https://apps.who.int/iris/handle/10665/41958 (accessed on 30 September 2020).
- Frischknecht, R.; Jungbluth, N.; Althaus, H.J.; Bauer, C.; Doka, G.; Dones, R.; Hischier, R.; Hellweg, S.; Köllner, T.; Loerincik, Y.; et al. Implementation of Life Cycle Impact Assessment Methods. Am. Midl. Nat. 2007; ISSN 00030031. [Google Scholar]
- Nisbet, I.C.; LaGoy, P.K. Toxic equivalency factors (TEFs) for polycyclic aromatic hydrocarbons (PAHs). Regul. Toxicol. Pharmacol. 1992, 16, 290–300. [Google Scholar] [CrossRef]
- Jolliet, O.; Margni, M.; Charles, R.; Humbert, S.; Payet, J.; Rebitzer, G.; Rosenbaum, R. IMPACT 2002+: A New Life Cycle Impact Assessment Methodology. Int. J. Life Cycle Assess. 2003, 8, 324. [Google Scholar] [CrossRef] [Green Version]
- GMBl (Gemeinsames Ministerialblatt). Technische Anleitung zur Reinhaltung der Luft—TA Luft; GMBl: Berlin, Germany, 2002; Volume 25–29. [Google Scholar]
- Bundesministerium für Wirtschaft und Enrgie. Das Erneuerbare-Energien-Gesetz. Available online: https://www.erneuerbare-energien.de/EE/Redaktion/DE/Dossier/eeg.html?cms_docId=71110 (accessed on 31 January 2020).
Figure 1.
Biogas plants diet and emissions limits.

Figure 2.
Schematic overview of the investigation procedure.

Figure 3.
Standards used to measure exhaust gases composition.

Figure 4.
Carcinogenic risk evaluation for (a) PAHs, (b) dioxins and furans.

Figure 5.
The life cycle impact assessment structure.

Figure 6.
Damage analysis for the categories (a) respiratory inorganics, (b) respiratory organics, (c) carcinogens and (d) non-carcinogens.
Figure 6.
Damage analysis for the categories (a) respiratory inorganics, (b) respiratory organics, (c) carcinogens and (d) non-carcinogens.

Table 1.
Exhaust gases physical characteristics.
| Substance | Unit | BGP 1 | BGP 2 | BGP 3 | BGP 4 | BGP 5 | BGP 6 | NG |
|---|---|---|---|---|---|---|---|---|
| CH4 | % vol. | 53 | 53 | 51 | 53 | 55 | 47 | - |
| CO2 | % vol. | 44 | 44 | 48 | 45 | 44 | 41 | - |
| N2 | % vol. | 1.9 | 1.9 | 0.7 | 1.7 | 1.1 | 9 | - |
| O2 | % vol. | 0.4 | 0.4 | 0.1 | 0.4 | 0.1 | 2.4 | - |
| Flow rate (wet) | Nm3 h−1 | 5100 | 4850 | 4000 | 4130 | 4300 | 4900 | 4900 |
| Flow rate (dry) | Nm3 h−1 | 4200 | 4030 | 3500 | 3350 | 3700 | 4300 | 4250 |
| Temperature | C | 503 | 505 | 470 | 171 | 267 | 227 | 149 |
Table 2.
Content of regulated emissions in both biogas and natural gas engines exhausts. Values are given in mg Nm−3.
Table 2.
Content of regulated emissions in both biogas and natural gas engines exhausts. Values are given in mg Nm−3.
| Substance | BGP 1 | BGP 2 | BGP 3 | BGP 4 | BGP 5 | BGP 6 | NG |
|---|---|---|---|---|---|---|---|
| NOx | 420 | 455 | 599 | 547 | 486 | 363 | 143 |
| CO | 474 | 238 | 356 | 406 | 465 | 163 | 122 |
| HCl | <0.1 | <0.1 | <0.2 | 1.4 | <0.2 | <0.1 | 0.2 |
| VOCs | 809 | 1060 | 658 | 862 | 546 | 789 | 724 |
| SO2 | 74 | 24 | 18 | 132 | 48 | 26 | 0.2 |
| PM | - | - | - | 1.1 | <0.1 | 0.1 | 0.8 |
Table 3.
Average regulated emissions in the present work and in Kristensen et al. [41]. The emissions are referred to the electrical energy unit and given as g .
Table 3.
Average regulated emissions in the present work and in Kristensen et al. [41]. The emissions are referred to the electrical energy unit and given as g .
| Authors | Kristensen et al. [41] | |||
|---|---|---|---|---|
| Substance | Biogas | Natural Gas | Biogas | Natural Gas |
| NO | 626.00 | 195.00 | 1500.00 | 439.00 |
| CO | 494.00 | 166.00 | 758.00 | 457.00 |
| PM 2.5 | 0.05 | 0.27 | 0.57 | 0.42 |
| SO | 61.00 | 0.27 | 52.80 | / |
| COV | 1087.00 | 985.00 | 706.00 | 1266.00 |
Table 4.
Summary table of damage values ranked by category and expressed as percentage of the total.
Table 4.
Summary table of damage values ranked by category and expressed as percentage of the total.
| Category | BGP 1 | BGP 2 | BGP 3 | BGP 4 | BGP 5 | BGP 6 | NGP |
|---|---|---|---|---|---|---|---|
| Respiratory inorganics | 97.54 | 96.85 | 98.47 | 98.07 | 98.48 | 97.08 | 93.26 |
| Respiratory organics | 2.44 | 3.13 | 1.53 | 1.92 | 1.50 | 2.91 | 6.71 |
| Carcinogens | 0.01 | 0.00 | 0.00 | 0.00 | 0.00 | 0.00 | 0.00 |
| Non carginogens | 0.02 | 0.01 | 0.00 | 0.01 | 0.01 | 0.01 | 0.03 |
| TOTAL | 100.00 | 100.00 | 100.00 | 100.00 | 100.00 | 100.00 | 100.00 |
Table 5.
Ranking of the most damaging emissions for the examined fuels.
| Biogas | Natural Gas | |||
|---|---|---|---|---|
| [DALY GJ−1] | [%] | [DALY GJ−1] | [%] | |
| NOx | 5.11 × 10⁻⁵ | 91.51 | 1.73 × 10⁻⁵ | 93.06 |
| SO2 | 3.52 × 10⁻⁶ | 6.29 | 1.48 × 10⁻⁸ | 0.08 |
| VOCs | 1.22 × 10⁻⁶ | 2.18 | 1.27 × 10⁻⁶ | 6.83 |
| Formaldehyde | 3.60 × 10⁻⁹ | 0.01 | 1.76 × 10⁻⁹ | 0.01 |
| Acrolein | 1.37 × 10⁻⁹ | 0.00 | 3.10 × 10⁻⁹ | 0.02 |
| 2,3,7,8 TCDD | 4.03 × 10⁻⁹ | 0.01 | 5.95 × 10⁻¹⁰ | 0.00 |
Table 6.
Total damage computations. Values are given in DALY GJ−1.
| Considered Substances | Biogas | Natural Gas |
|---|---|---|
| Biogas regulated emissions: NOx, CO, HCl, VOCs | 6.08 × 10⁻⁵ | 1.87 × 10⁻⁵ |
| Natural gas regulated emissions: NOx, PM, SO2 | 6.31 × 10⁻⁵ | 1.75 × 10⁻⁵ |
| Combined regulated emissions: NOx, CO, HCl, VOCs, PM, SO2 | 6.49 × 10⁻⁵ | 1.89 × 10⁻⁵ |
| All measured emissions | 6.50 × 10⁻⁵ | 1.90 × 10⁻⁵ |
© 2020 by the authors. Licensee MDPI, Basel, Switzerland. This article is an open access article distributed under the terms and conditions of the Creative Commons Attribution (CC BY) license (http://creativecommons.org/licenses/by/4.0/).
Share and Cite
MDPI and ACS Style
Macor, A.; Benato, A. A Human Health Toxicity Assessment of Biogas Engines Regulated and Unregulated Emissions. Appl. Sci. 2020, 10, 7048. https://0-doi-org.brum.beds.ac.uk/10.3390/app10207048
AMA Style
Macor A, Benato A. A Human Health Toxicity Assessment of Biogas Engines Regulated and Unregulated Emissions. Applied Sciences. 2020; 10(20):7048. https://0-doi-org.brum.beds.ac.uk/10.3390/app10207048
Chicago/Turabian StyleMacor, Alarico, and Alberto Benato. 2020. "A Human Health Toxicity Assessment of Biogas Engines Regulated and Unregulated Emissions" Applied Sciences 10, no. 20: 7048. https://0-doi-org.brum.beds.ac.uk/10.3390/app10207048
Note that from the first issue of 2016, this journal uses article numbers instead of page numbers. See further details here.