Screen-Cam Robust Image Watermarking with Feature-Based Synchronization
by
 ,
,
Weitong Chen
1,2,3, 
Na Ren
1,2,3,*,
Changqing Zhu
1,2,3,
Qifei Zhou
1,2,3,
Tapio Seppänen
4 and
Anja Keskinarkaus
4 1
Key Laboratory of Virtual Geographic Environment (Nanjing Normal University), Ministry of Education, Nanjing 210023, China
2
State Key Laboratory Cultivation Base of Geographical Environment Evolution, Nanjing 210023, China
3
Jiangsu Center for Collaborative Innovation in Geographical Information Resource Development and Application, Nanjing 210023, China
4
Physiological Signal Analysis Team, Center for Machine Vision and Signal Analysis, University of Oulu, 90014 Oulu, Finland
*
Author to whom correspondence should be addressed.
Appl. Sci. 2020, 10(21), 7494; https://0-doi-org.brum.beds.ac.uk/10.3390/app10217494
Submission received: 23 September 2020
/
Revised: 20 October 2020
/
Accepted: 22 October 2020
/
Published: 25 October 2020
(This article belongs to the Special Issue Data Hiding and Its Applications: Digital Watermarking and Steganography)
Abstract
:The screen-cam process, which is taking pictures of the content displayed on a screen with mobile phones or cameras, is one of the main ways that image information is leaked. However, traditional image watermarking methods are not resilient to screen-cam processes with severe distortion. In this paper, a screen-cam robust watermarking scheme with a feature-based synchronization method is proposed. First, the distortions caused by the screen-cam process are investigated. These distortions can be summarized into the five categories of linear distortion, gamma tweaking, geometric distortion, noise attack, and low-pass filtering attack. Then, a local square feature region (LSFR) construction method based on a Gaussian function, modified Harris–Laplace detector, and speeded-up robust feature (SURF) orientation descriptor is developed for watermark synchronization. Next, the message is repeatedly embedded in each selected LSFR by an improved embedding algorithm, which employs a non-rotating embedding method and a preprocessing method, to modulate the discrete Fourier transform (DFT) coefficients. In the process of watermark detection, we fully utilize the captured information and extract the message based on a local statistical feature. Finally, the experimental results are presented to illustrate the effectiveness of the method against common attacks and screen-cam attacks. Compared to the previous schemes, our scheme has not only good robustness against screen-cam attack, but is also effective against screen-cam with additional common desynchronization attacks.
1. Introduction
Currently, the ubiquity of the computer office and the development of communication technology render digital image storage, copying, and transmission convenient and fast. Security problems involving digital images, such as leakage, malicious theft, and illegal dissemination, still frequently occur. In order to protect the data on the computer side, data encryption [1,2,3,4,5,6] and software watermarking [7,8] schemes are proposed. Similarly, some scholars have also investigated access control technology [9,10,11] to prevent illegal copying and transmission of data by restricting internal operations. Although these methods can effectively prevent the illegal acquisition of digital data directly from a computer, they cannot prohibit using a camera to take a photo of sensitive information displayed on the screen. In particular, the popularization of smartphones has made data leakage by capturing on-screen content much easier and common. However, verifying the copyright of a camera-captured image that is published without permission is still challenging. Digital image watermarking technology has been widely used for copyright protection and leakage tracking [12,13,14,15,16]. To hold someone accountable for the behavior of sneak shots, an invisible screen-cam robust watermark can be embedded in images. In this circumstance, the embedded watermark will survive in a camera-captured image.
To design a screen-cam robust watermarking scheme that can extract watermark information from a single screen-captured photo, we need to analyze the screen-cam process first. The screen-cam process can be considered a compound attack containing moiré noise, luminance distortion, and geometric distortion. Consequently, most traditional watermarking methods are not applicable to the screen-cam process. The process of generating a new image by camera capture is referred to as a cross-media information transfer process that contains analog-to-digital and digital-to-analog conversion attacks. Thus, the print-scan and print-cam processes have certain similarities with the screen-cam process.
Many researchers have focused on extracting watermark information from printed images. Based on embedding domains, these methods can be divided into spatial domain-based and frequency domain-based methods. The spatial domain-based algorithms primarily employed watermark patterns as watermark information. Nakamura et al. [17] proposed a sinusoidal watermark pattern-based adaptive additive embedding algorithm. The pattern-based method was continuously improved with a frame detection method [18] to achieve autocorrection during extraction, a new pattern design [19,20,21] to achieve better imperceptibility and robustness, or a combination with computational photography technology [22,23] to solve the lens focusing problem.
However, these pattern-based watermark methods are weak to cropping attacks, and the performance of watermark detection will decrease if an image is zoomed-out before it is printed. The frequency domain-based algorithms include Fourier domain-based methods and wavelet domain-based methods. The Fourier domain-based algorithms can be subdivided into two categories. The first category is transform-invariant domain-based methods [24,25], which employed log-polar mapping (LPM) and discrete Fourier transform (DFT) to achieve robustness to rotation, scaling, and translation (RST) distortions. The second category uses the selected magnitude coefficients of the DFT domain as the message carrier [26,27,28,29]. Researchers have improved the method by choosing the optimal radius of the implementation to minimize quality degradation [28] or by color correction to enhance the extraction accuracy [29]. For the wavelet domain-based algorithms, messages are embedded by modulating the coefficients of the wavelet transform. These algorithms commonly combine with another domain-based watermark to achieve robustness to affine distortion attacks [30], to rotation and scale attacks [31], or implement fragile watermarking [32]. Similarly, because the frequency domain-based methods are global watermarks, they are also weak to cropping attacks. Furthermore, the experiments in [33] show that these print-scan and print-cam robust watermarking methods have a relatively higher bit error rate that cannot be directly applied to the screen-cam process.
Considering the particularity of the screen-cam process, Fang et al. [33] proposed an effective screen-cam robust image watermark algorithm with an intensity-based scale-invariant feature transform (I-SIFT)-based synchronization. The message is embedded in the discrete cosine transform (DCT) domain of each feature region. However, this method needs to record the four vertices of the image in advance, which means it cannot cope with the situations where the image’s original size is unknown. Besides, this method cannot address orientation or scale desynchronization attacks.
However, normal user operations may cause watermark desynchronization inevitably. For example, the image displayed on the screen is blocked by other application windows or the image has been zoomed, rotated, and cropped for usage. Because the spy may just capture the content displayed on the screen, if we do not know the original information of the captured image, we may not be able to restore the image to its original orientation and scale. Therefore, to address possible desynchronization attacks besides screen-cam attack, a screen-cam, RST, and cropping invariant watermark synchronization method need to be further investigated.
To solve these issues, a feature and Fourier-based screen-cam robust watermarking scheme is proposed in this paper. The main contributions are as follows:
- We analyze the performance of commonly used feature operators and the variation rules of DFT magnitude coefficients during the screen-cam process.
- We designed an orientation and scale invariant local square feature region (LSFR) construction method, which can achieve watermark synchronization against screen-cam attack and also common desynchronization attacks.
- We employ a non-rotating embedding algorithm based on the properties of the DFT coefficients, which can avoid further distortions that may be caused by orientation normalization.
- We present a preprocessing method for message embedding. By working in combination with the proposed local statistical feature-based message extraction method, it can improve the extraction accuracy.
The remainder of the paper is organized as follows: Section 2 summarizes different distortions in the screen-cam process. Section 3 describes the implementation details of the proposed method. The selection of parameters and experiment results are presented in Section 4 and Section 5. Finally, Section 6 concludes the paper.
2. Screen-Cam Process Analysis
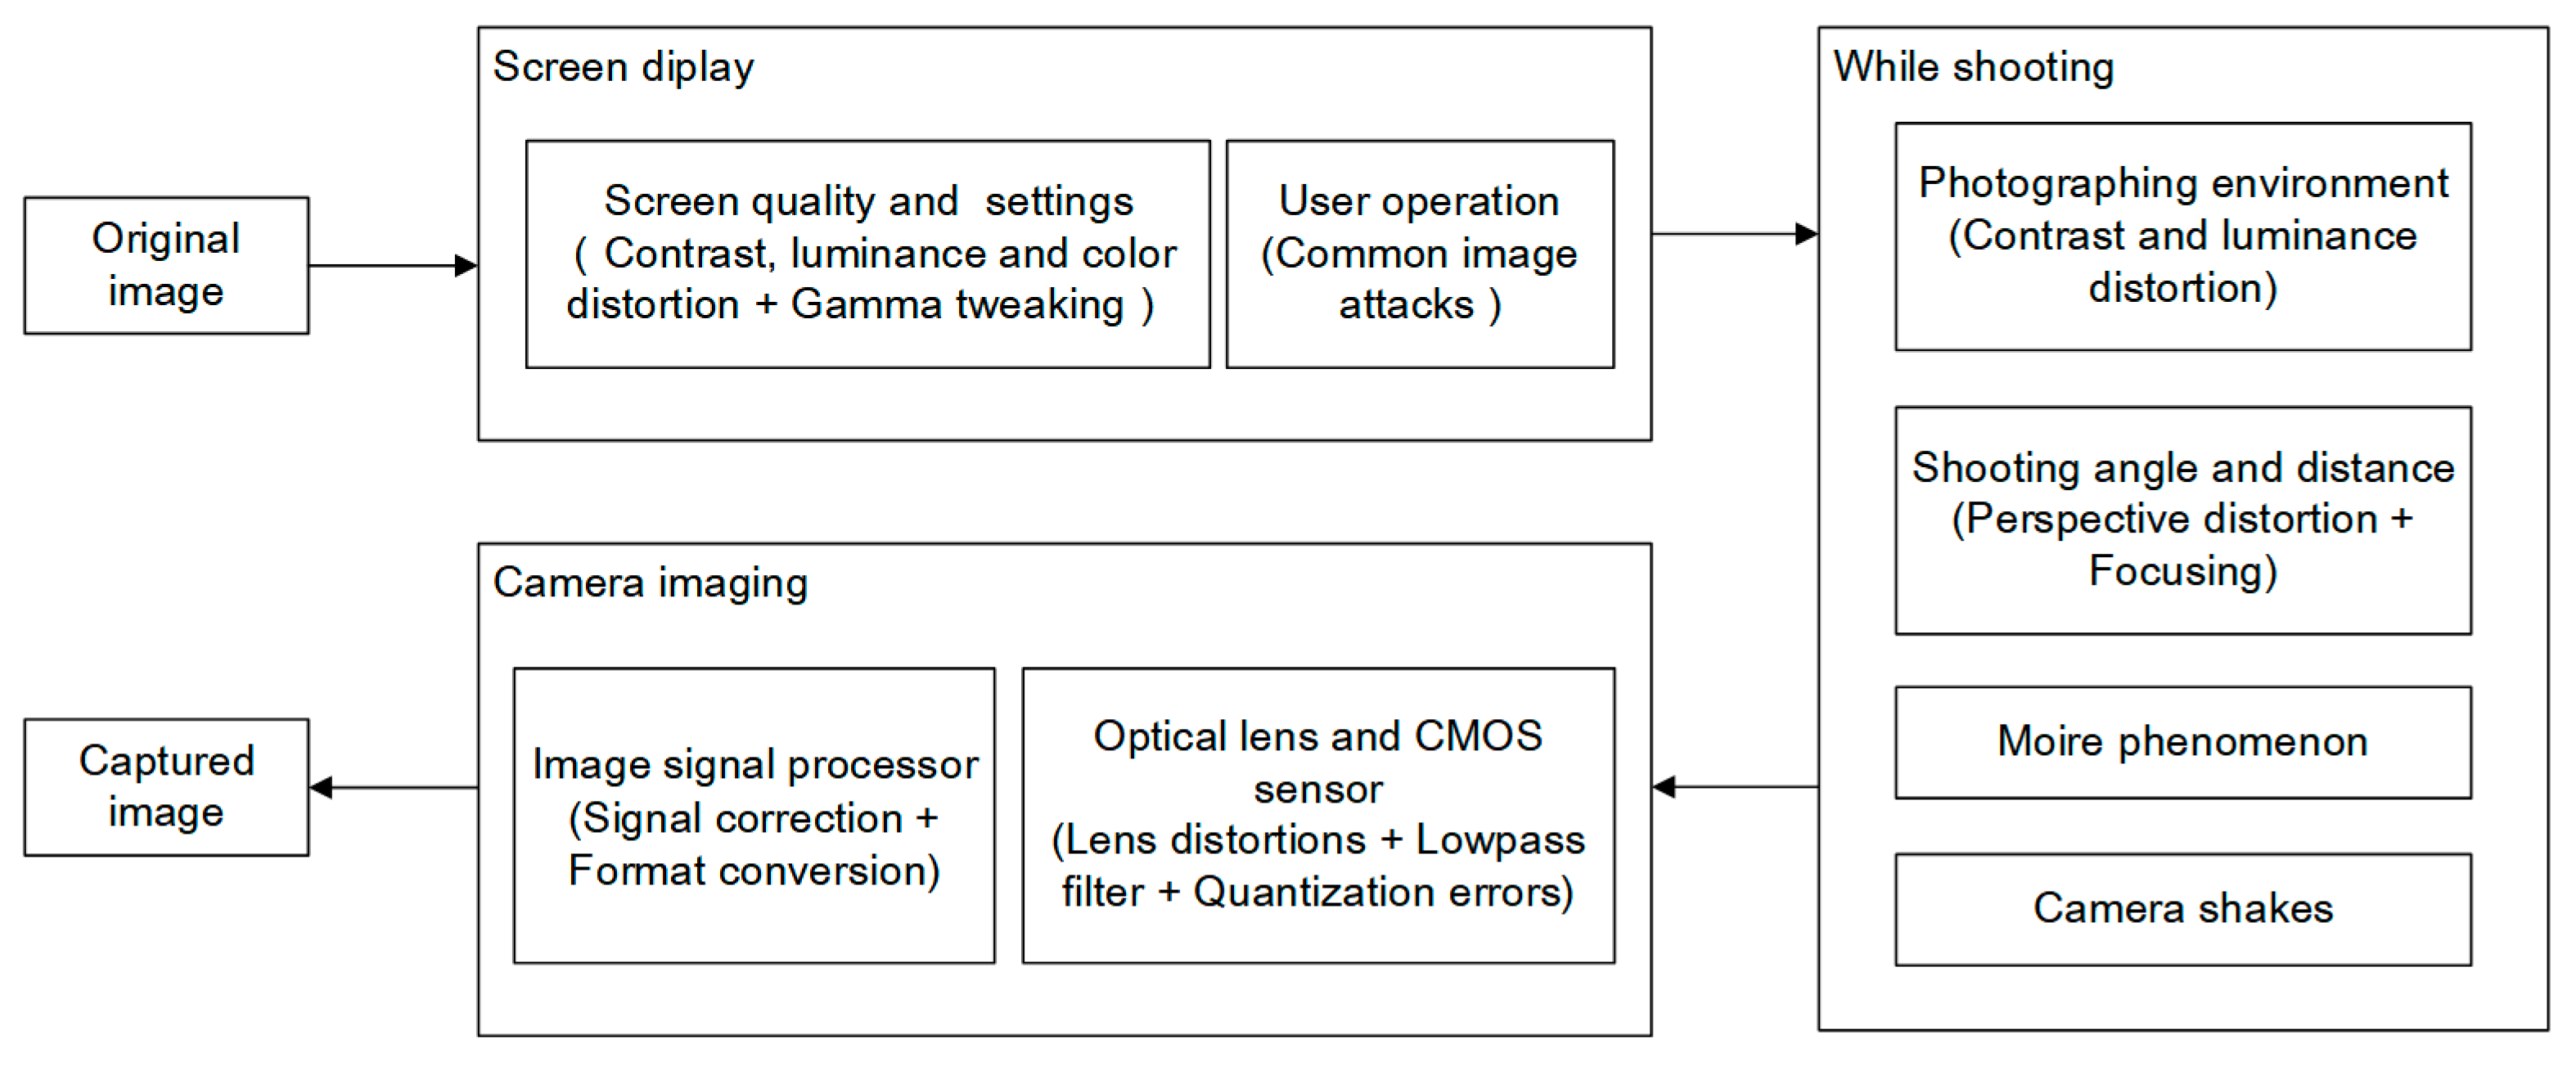
The screen-cam process contains various distortions [34]. The subprocesses of the screen-cam process produce different types of distortions, as shown in Figure 1, and cause severe image quality degradation. This section aims to provide a basis for the design of screen-cam robust watermarking schemes by analyzing the different types of distortions generated in each step of the screen-cam process.
The screen-cam process can be divided into three subprocesses: screen display, while shooting, and camera imaging.
In the screen display process, the main factors that affect image signal are the quality of different monitors and their settings. Regular user operations will also cause distortions.
With regard to the while shooting process, the main factors are the shooting environment, the relative position of screen and camera, and the moiré phenomenon. If shooting at a large angle, the focusing problem cannot be disregarded [23]. Besides, camera shake may occur when pressing the shutter.
The camera imaging process of a mobile phone is the process of converting optical signals to digital image signals and processing them. The main types of equipment in the process are the optical lens, the CMOS sensor [35], and the digital signal processor (DSP). With regard to CMOS sensors, the most important components are the photoelectric sensor and analog-to-digital sensor in receiving and processing signals. Therefore, the factors can be divided into hardware parts and software parts. The hardware part is related to the quality of the cameras’ hardware devices. The software part is related to the image processing algorithm performed by the image signal processor (ISP). This part contains signal correction and format conversion before storage.
Assuming an original image is displayed on a screen, and it is well captured by a camera, the distortions created during this screen-cam process can be divided into five categories.
Linear distortion: The luminance, contrast, and color distortions caused by the quality and settings of the monitor can be approximated as a linear change. Linear distortion can also occur through linear correction of the image by the ISP.
Gamma tweaking: To fit the human vision, the monitor performs gamma correction on the digital image, which is a nonlinear distortion. The ISP of the mobile phone performs a gamma compensation according to the algorithms on the digital image. The effect of gamma compensation may be amplified by other previous attacks.
Geometric distortion: (1) Different degrees of perspective distortion are caused by the distance and angle of capturing, which will generate an uneven scaling attack on the digital image. (2) Another perspective distortion, such as pincushion distortion and barrel distortion, is caused by lens distortion of the optical lens. By controlling the photographer, the effects of these attacks can be reduced to a certain extent.
Noise attack: Noise attacks are important factors that cause a sharp reduction in image quality during the screen-cam process. Noise attacks can be divided into four categories: moiré noise, noise caused by the external environment, hardware, and software. (1) In physics, moiré noise is a phenomenon of beat noise, which is the wave interference that occurs between two different objects [36]. During the screen-cam process, the light-sensitive elements in a camera emit high-frequency electromagnetic waves and the object being photographed, such as a liquid crystal display (LCD), emits some electromagnetic interference. When the two electromagnetic waves intersect, the waveforms are superimposed and cause electronic fluctuations of the acquiring device. The original waveforms are changed to form a new waveform that is moiré. Generally, the moiré phenomenon is most severe when the two wave frequencies are similar or in a multiple relationship. (2) External noise is caused by unstable external light interference and screen reflections while shooting. (3) Hardware devices such as sensor material properties, electronic components, and circuit structures can cause different noise. The most typical is the quantization error noise caused in the process of digitizing the captured signal by the CMOS processor, where the actual continuous signal is quantized to the pixel values of the digital image signal. (4) The ISP corrects the captured signal, which is independent of the original image to some extent, so the noise reduction correction process also produces new noise.
Low-pass filtering attack: Although a camera has a high resolution and the number of pixels in the captured image is commonly larger than that of the original image, during the process of capturing an optical signal, the signal acquisition does not record each pixel of an image independently. Interference that occurs between the lights causes blurring of the adjacent pixels, which approximates a low-pass filtering attack. Blurring caused by unfocused pixels is similar.
3. Proposed Watermarking Scheme
This section is dedicated to present the watermark embedding and detection procedures of the proposed watermarking scheme, and it explains the reasons for doing so. In the process of watermark embedding, we first construct LSFRs as message embedding regions. After that, a watermark message is embedded in each LSFR repeatedly with the proposed algorithm. In the process of watermark detection, we first perform perspective correction on the captured image. Then, we find out all the candidate regions and perform message extraction on these candidate regions one by one. Therefore, this section is organized as follows: In Section 3.1, we analyze the selection of feature operators and present the detailed procedures of the proposed LSFR construction method. In Section 3.2, we analyze the embedding operations and present the detailed procedures of the proposed embedding method. The corresponding watermark detection method is given in Section 3.3.
3.1. Local Square Feature Region Construction
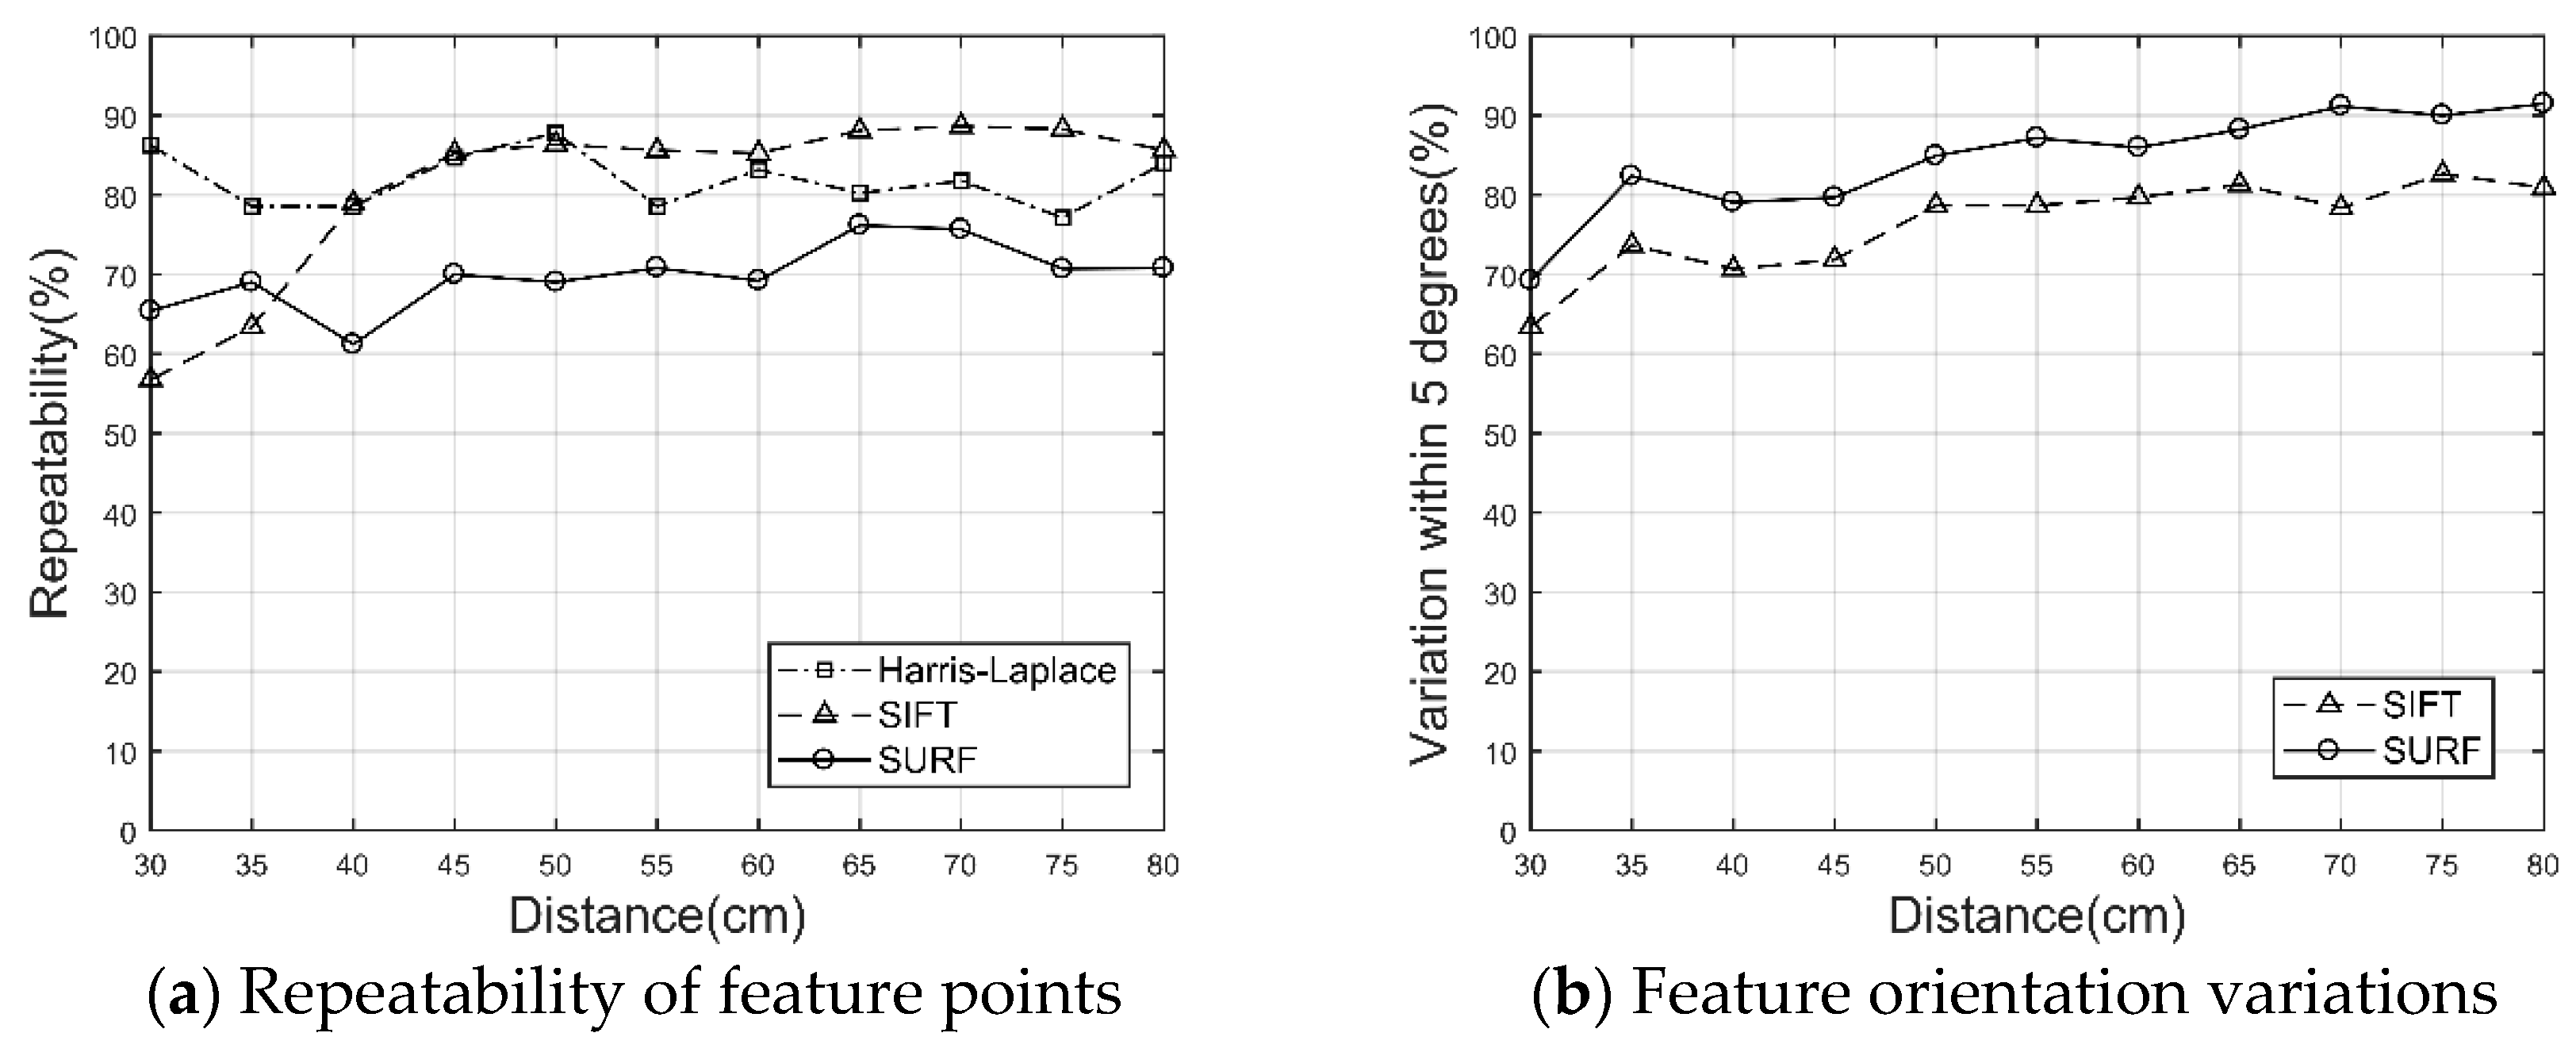
Due to the desynchronization attacks caused by the screen-cam process and user operations, we need to develop an appropriate synchronization method to locate the watermark. We test the feasibility of the Harris–Laplace, SIFT, and SURF operators, which are extensively employed to construct local scale-invariant feature regions (LFRs) as message embedding areas [37,38,39,40,41,42,43,44,45], in the screen-cam process. To select the most suitable operators for LFRs construction, the variations of feature point coordinates, feature scale, and feature direction are quantitatively analyzed under different shooting distances. The images we used here are shown in Figure 2. All host images are 1024 × 1024 pixels. Because of the blurring of the image edges caused by the low-pass filtering attack and the lens distortion, it is difficult to restore the captured image to exactly correspond to the original image. Inevitably, there will be a displacement between the coordinates of the corresponding pixels. Therefore, the feature points are considered to be repeated when the offsets of their coordinates are smaller than five pixels. Besides, considering the requirements of watermark synchronization, the feature scale variation should be below 10% at the same time. Furthermore, the feature points at the edge of the image are excluded. In order to reduce the impact of noise, we perform a Gaussian filter on both the original images and the captured images. As shown in Figure 3a, after a Gaussian function, we discover that the middle- and high-scale, which means the feature scale is greater than 15, feature points of the Harris–Laplace or SIFT operators can achieve high repeatability. The repeatability here refers to the ratio of the number of feature points extracted after a screen-cam attack and satisfying the above-mentioned pixel offset and scale variation criteria, compared to the original number of feature points. We also note that although the SIFT operator has a better performance at a long shooting distance, it does not work well at a close shooting distance, which indicates that it is more sensitive to moiré noise. Comparatively, the Harris–Laplace operator is more stable at different shooting distances, which is more suitable for watermark synchronization. Regarding the feature orientation descriptors, we note that the SURF orientation descriptor is more robust than the SIFT to the screen-cam process, where the orientation variations of repeated SURF feature points are predominantly less than five degrees, as shown in Figure 3b. We considered that the integral image and Haar wavelet-based SURF orientation descriptor is more robust to the blurring and luminance change in the screen-cam process than a Gaussian image and histogram-based SIFT orientation descriptor.
Therefore, in our method, a modified Harris–Laplace detector and SURF orientation descriptor are integrated to construct the RST invariant LFRs. To increase the detection rate of feature points during the screen-cam process, we also employ a Gaussian function.
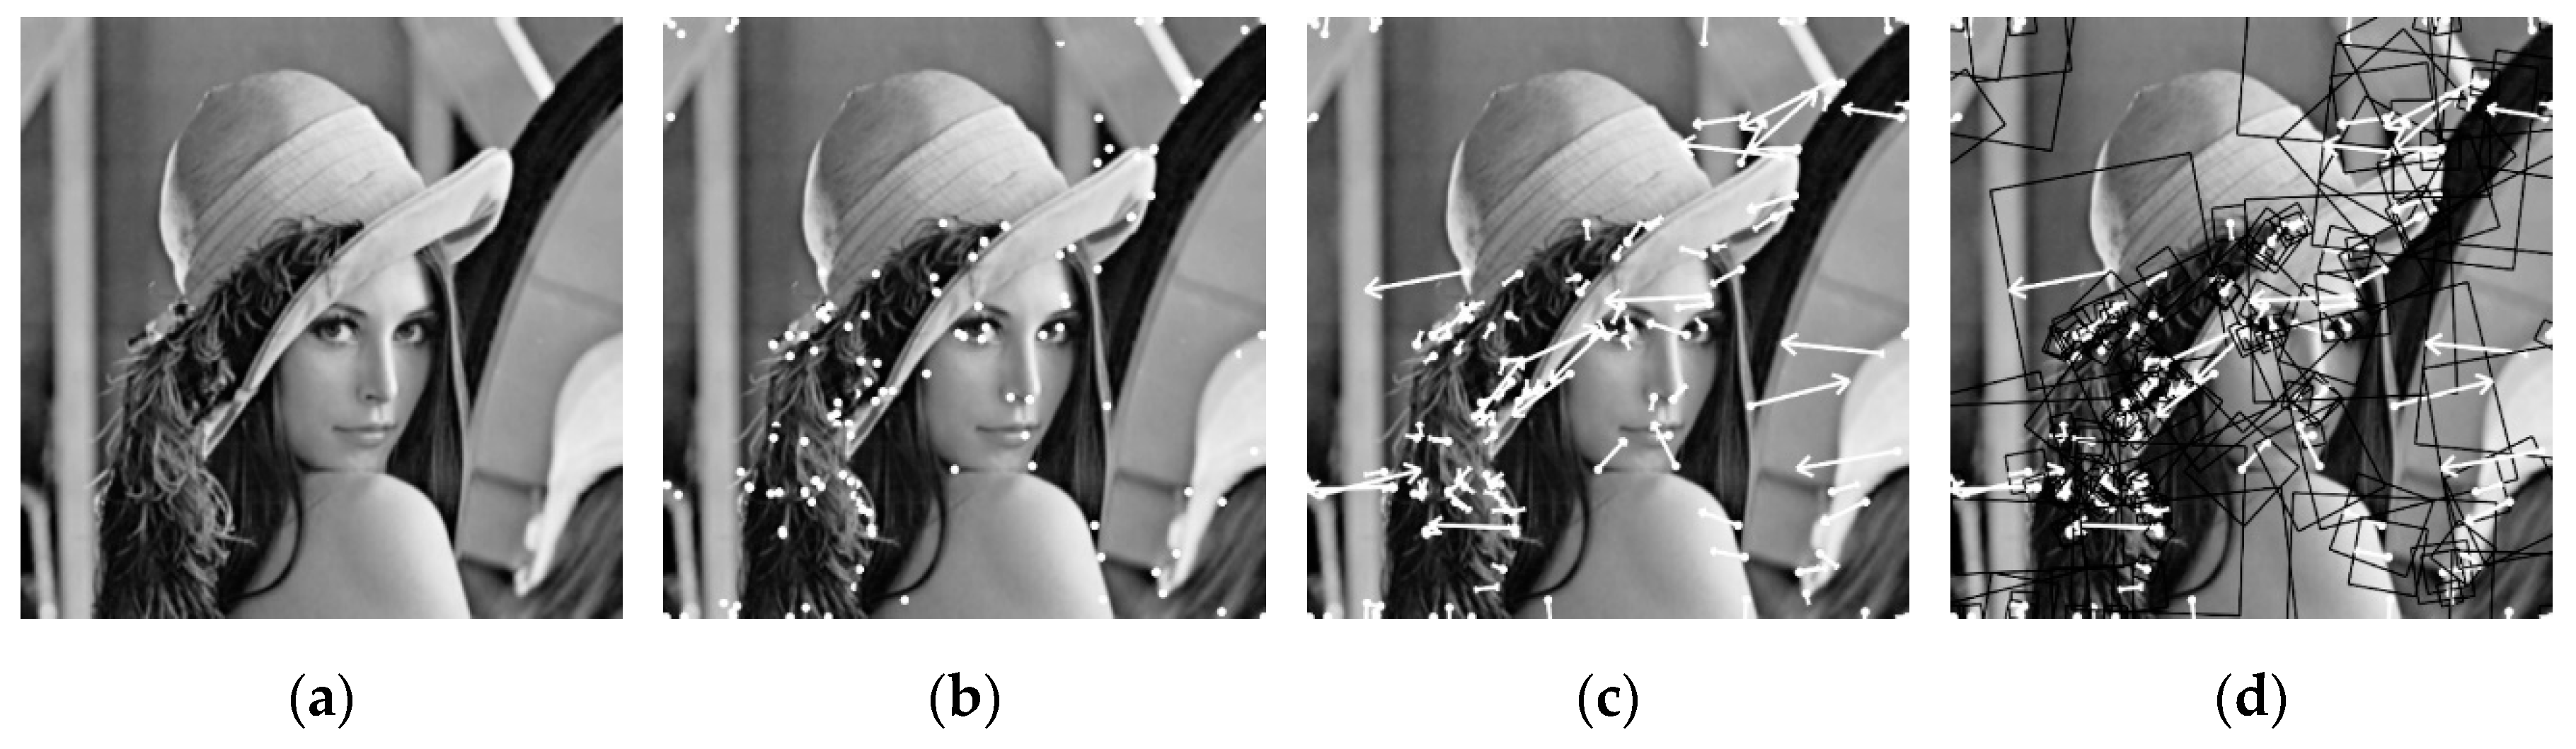
In previous LFR-based methods, circular feature regions are commonly constructed. These regions will involve zero-padding [43] or rearrangement [46] to a square region before message embedding, which will cause further distortions [47]. Therefore, we directly construct LSFRs. Figure 4 illustrates the subprocesses. The details are as follows.
3.1.1. Gaussian Function Preprocess
In the embedding and extraction processes, the detection of feature points will be performed on the Gaussian filtered images. A two-dimensional Gaussian function is obtained by the product of two one-dimensional Gaussian functions and can be defined as:
where is the standard deviation. The Gaussian kernel , whose sigma is set to 2 and window size to 7, is employed here. The image convolution process is defined as:
where is the input image and is the convolution result. denotes the convolution operator.
3.1.2. Modified Harris–Laplace Detector
The Harris–Laplace detector proposed by Mikolajczyk and Schmid [48,49] has been extensively employed in different watermarking schemes. Therefore, here we give a brief description of it, and the modified part will be explained in detail.
First, Harris points are detected in the scale space. To obtain the invariance to scale variation, we built a scale-space representation with the Harris function for preselected scales. The Harris detector is based on a specific image descriptor, which is referred to as the second moment matrix, and reflects the local distribution of gradient directions in the image [50]. To make the matrix independent of the image resolution, the scale-adapted second moment matrix is defined by:
where and are the integration scale and local scale, respectively, and is the derivative computed in an associated direction by a Gaussian. Given , the uniform Gaussian multiscale space representation is defined by:
where is the associated uniform Gaussian kernel with a standard deviation and a mean of zero.
Given and , the scale-adapted Harris corner strength used to quantitatively describe the stability under variations in imaging conditions can be computed. The original measure function needs an empirical parameter, which may float for different images. Therefore, in this paper, we will adopt another measure function, that is, the Alison Noble measure [51]:
where and denote computation of the determinant of the matrix and the trace of the matrix, respectively. is the smallest integer to ensure that the denominator is nonzero. The feature points obtained by this method are more robust under variations in imaging conditions [51].
At each level of the scale space, the candidate points are extracted as follows:
where represents the points within the radius neighborhood, and is the threshold, which is .
The automatic scale selection of the feature points is performed. To select the characteristic scale of the local structure, a scale-normalized derivative operator is defined as:
where and are second partial derivatives with respect to and , respectively.
For each candidate point, we apply an iterative method to determine the location and scale of the feature points. Given the initial point with the scale , the iteration steps are presented as follows.
- Step (1)
- Find the local extremum over the scale of for the point ; otherwise, reject the point. The investigated range of scales is limited to with .
- Step (2)
- Detect the spatial point of a maximum of the SHCS closest to for the selected .
- Step (3)
- Go to step 1 if or .
3.1.3. SURF Orientation Descriptor
To obtain the invariance to the rotation, each feature point will be assigned a direction based on the SURF orientation descriptor. We calculate the Haar wavelet response on the selected circle region of the integral image, which is centered at the feature points and is six times the feature scale as the radius. The Gaussian weighting function, for which is two times the feature scale, is used to Gaussian weight the response of the Haar wavelet.
To obtain the dominant orientation, we calculate the sum of all responses within a sliding orientation window of size . By summing the horizontal and vertical responses within the window, the vector can be obtained, which is defined as:
where is the summarized responses, and is the associated orientation. The dominant orientation is defined as:
3.1.4. LSFRs for Watermarking
Considering the severe distortion during the screen-cam process, the constructed LSFRs should have a sufficient range to ensure that information can survive. Thus, the feature points with appropriate scale and location are selected, and the side length of LSFR is designed as:
where is a constant coefficient, and is the feature scale value.
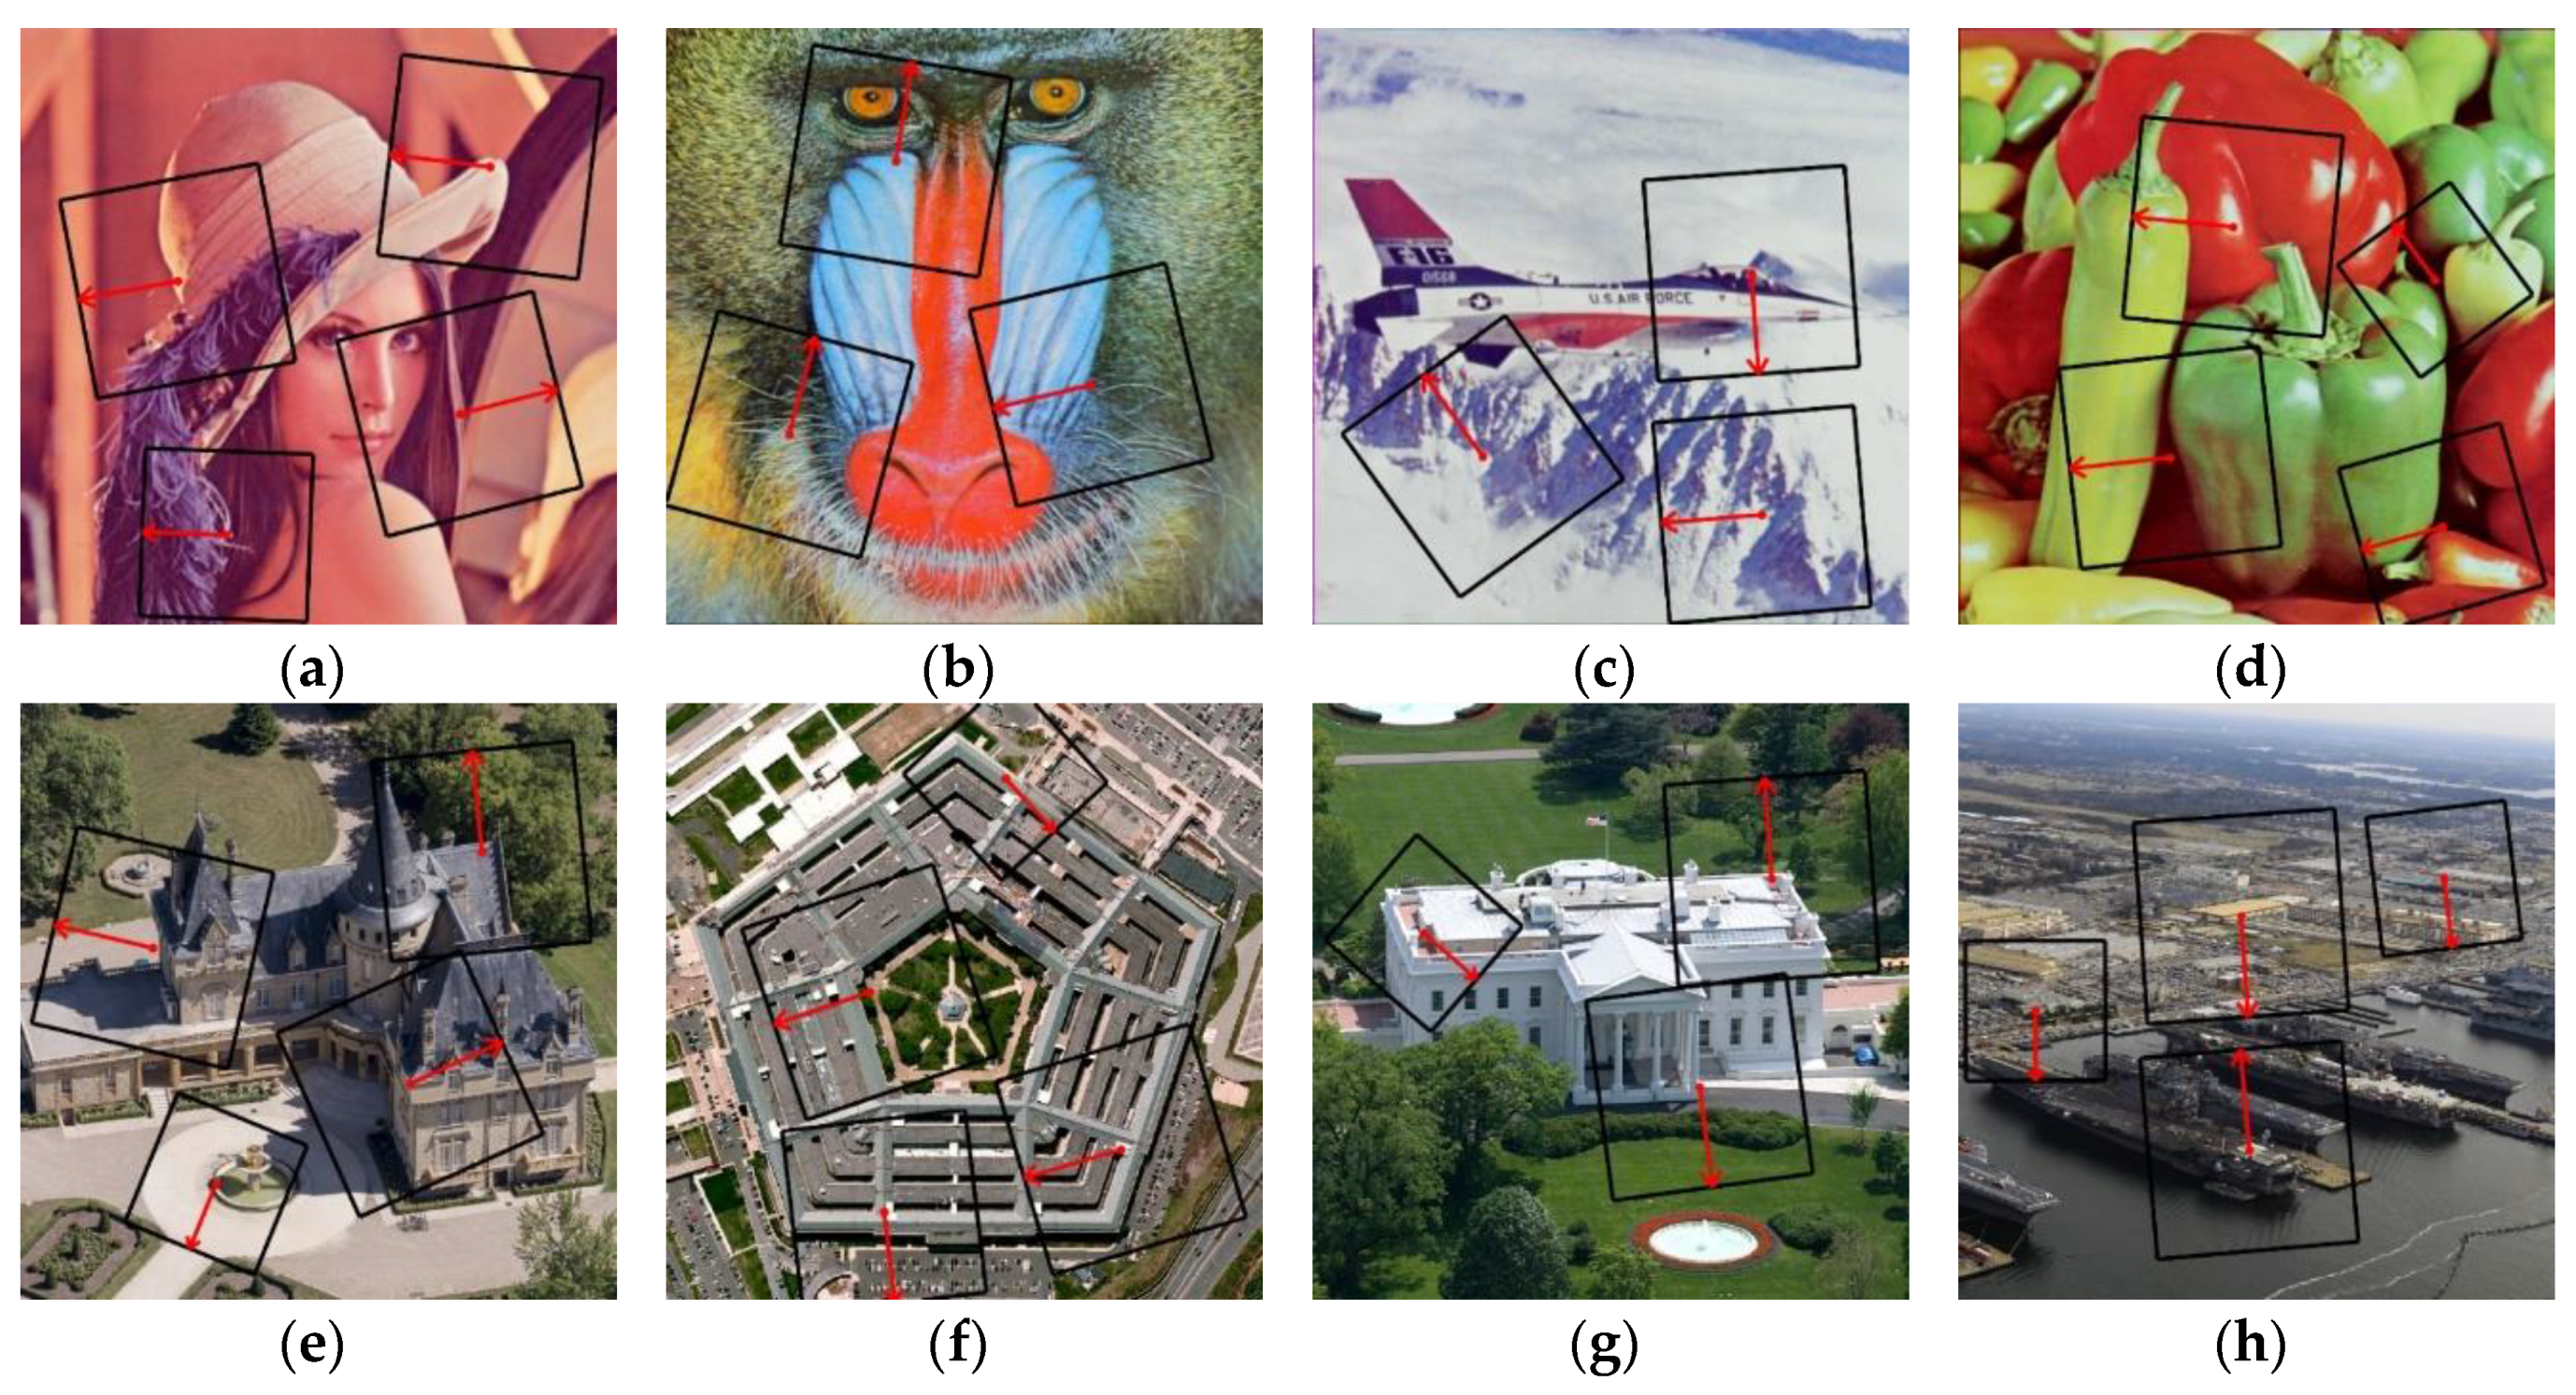
In Figure 5, are shown the LSFRs for the 8-image test set. Because the watermark information will be embedded in the DFT coefficients, according to its characteristics, the following two situations are also feasible. When a small part of the candidate LSFR exists outside the image, shown in Figure 5f, or when a small part of the two LSFRs overlapped, shown in Figure 5g, these LSFRs can also be utilized as embedding areas.
3.2. Watermark Embedding
3.2.1. Selection of Embedding Operations
As discussed in Section 3.1, there is an inevitable shift in the corresponding positions between the corrected image and the original image. Fortunately, due to the nature of DFT coefficients in image translation, the coefficients of captured images can be corrected to correspond to the original image, if the four corners are carefully selected to avoid too much rotation and scaling distortions after perspective rectification. Therefore, it is advantageous to select the DFT domain for embedding a watermark message.
In order to use DFT coefficients as a watermark carrier, we need to analyze their variation rules in the screen-cam process first. The variations of the DFT magnitude coefficients with different shooting conditions were analyzed in detail. As mid-frequency coefficients are commonly employed as watermark carriers, we take the mid-frequency spectrum of 512 × 512 sized Lena image and the variation after screen-cam as an example to illustrate the details of their variation rules, as shown in Figure 6. The axis scale value is the coordinate in the spectrum of the original image.
We find that most of the magnitude coefficients with high values are well preserved. For example, (301, 299), (301, 300), (302, 304), and other points of deep warm color in Figure 6. Furthermore, the magnitude coefficients with low values commonly vary to become higher values. In general, the more blurred the image is, the higher the magnitude coefficients with low values will increase. Examples of this are the points (297, 305), (300, 296), and (302, 303) in Figure 6.
The changes can be summarized as blew. In the mid-frequency bands, the magnitude coefficients with high values are well preserved during the screen-cam process, while those with low values commonly become higher values to approximate their adjacent magnitude values. Therefore, we choose mid-frequency bands and embed the message by modifying the selected magnitude coefficients to higher values.
3.2.2. Message Embedding
Figure 7 illustrates the embedding process. Each selected LSFR is treated as an independent communication channel, and the same watermark message will be embedded in every LSFR. Compared with the DCT-based method in [33], which embeds the message in the sub-blocks of feature regions, the proposed DFT-based method takes each LSFR as a whole, it has better robustness against cropping attacks.
To avoid the LSFR from being further distorted during the rotation process of orientation normalization, we designed a non-rotating embedding method based on the properties of the DFT coefficients. Furthermore, to improve extraction accuracy, a preprocessing method of DFT magnitude coefficients is proposed. Specific steps are as follows.
First, the minimum square regions that contain the LSFRs to be embedded are extracted in order. The luminance band of this area is converted to the DFT domain.
Second, for the watermark information, the pseudorandom sequence is generated by the secret key, where is the size of the sequence. In order to achieve blind detection that can cope with the situation where the original size is unknown, the embedding radius of is set to a fixed value. Correspondingly, the embedding radius of is defined as:
where is the embedded radius of the square region and is the side length of the square region. According to the characteristics of the DFT coefficients, which is centrosymmetric, we can have 180 degrees as embedding region. The coordinates of the message embedding position in the square region are defined as:
where is the j-th element of . Therefore, the elements of the message are equally spaced around the center of the embedding region. defines the angle between the feature orientation of the LSFR and the normalized orientation.
Third, to obtain a better detection rate, the magnitudes need to be preprocessed before the signal embedding. In theory, the more obvious the difference between the magnitudes, where the watermark embedded information is “1” and “−1”, the better the message extraction results. Considering the various rules of the magnitudes during the screen-cam process, we need to avoid high magnitude values at the positions that represent the watermark information “−1”. Therefore, some extreme high magnitude values of these positions and their neighborhoods need to be reduced. For a normal distribution, nearly 84% of the values are less than the sum of the mean and one standard deviation. Hence, the preprocess is defined as follows:
where defines all magnitudes of the positions that represent the watermark information “-1” and their eight neighbor magnitudes, and and define the mean value and the standard deviation of these magnitudes, respectively.
The watermark signal is embedded in preprocessed magnitudes using the following equation:
where define the watermarked magnitudes and the embedding strength. We provide an initial value , which is set based on experience and adjust the value by the calculated peak signal to noise ratio (PSNR) index. If the PSNR value is less than 42 dB, the will be reduced by 0.2. Iterate this process until the PSNR value is higher than 42 dB.
Last, is combined with , which is converted to the watermarked luminance band of the square region and then transformed to the spatial domain. Only the pixel values within the LSFR are replaced. The result is a watermarked LSFR.
After all selected LSFRs are embedded, the embedding process is completed.
3.3. Watermark Detection
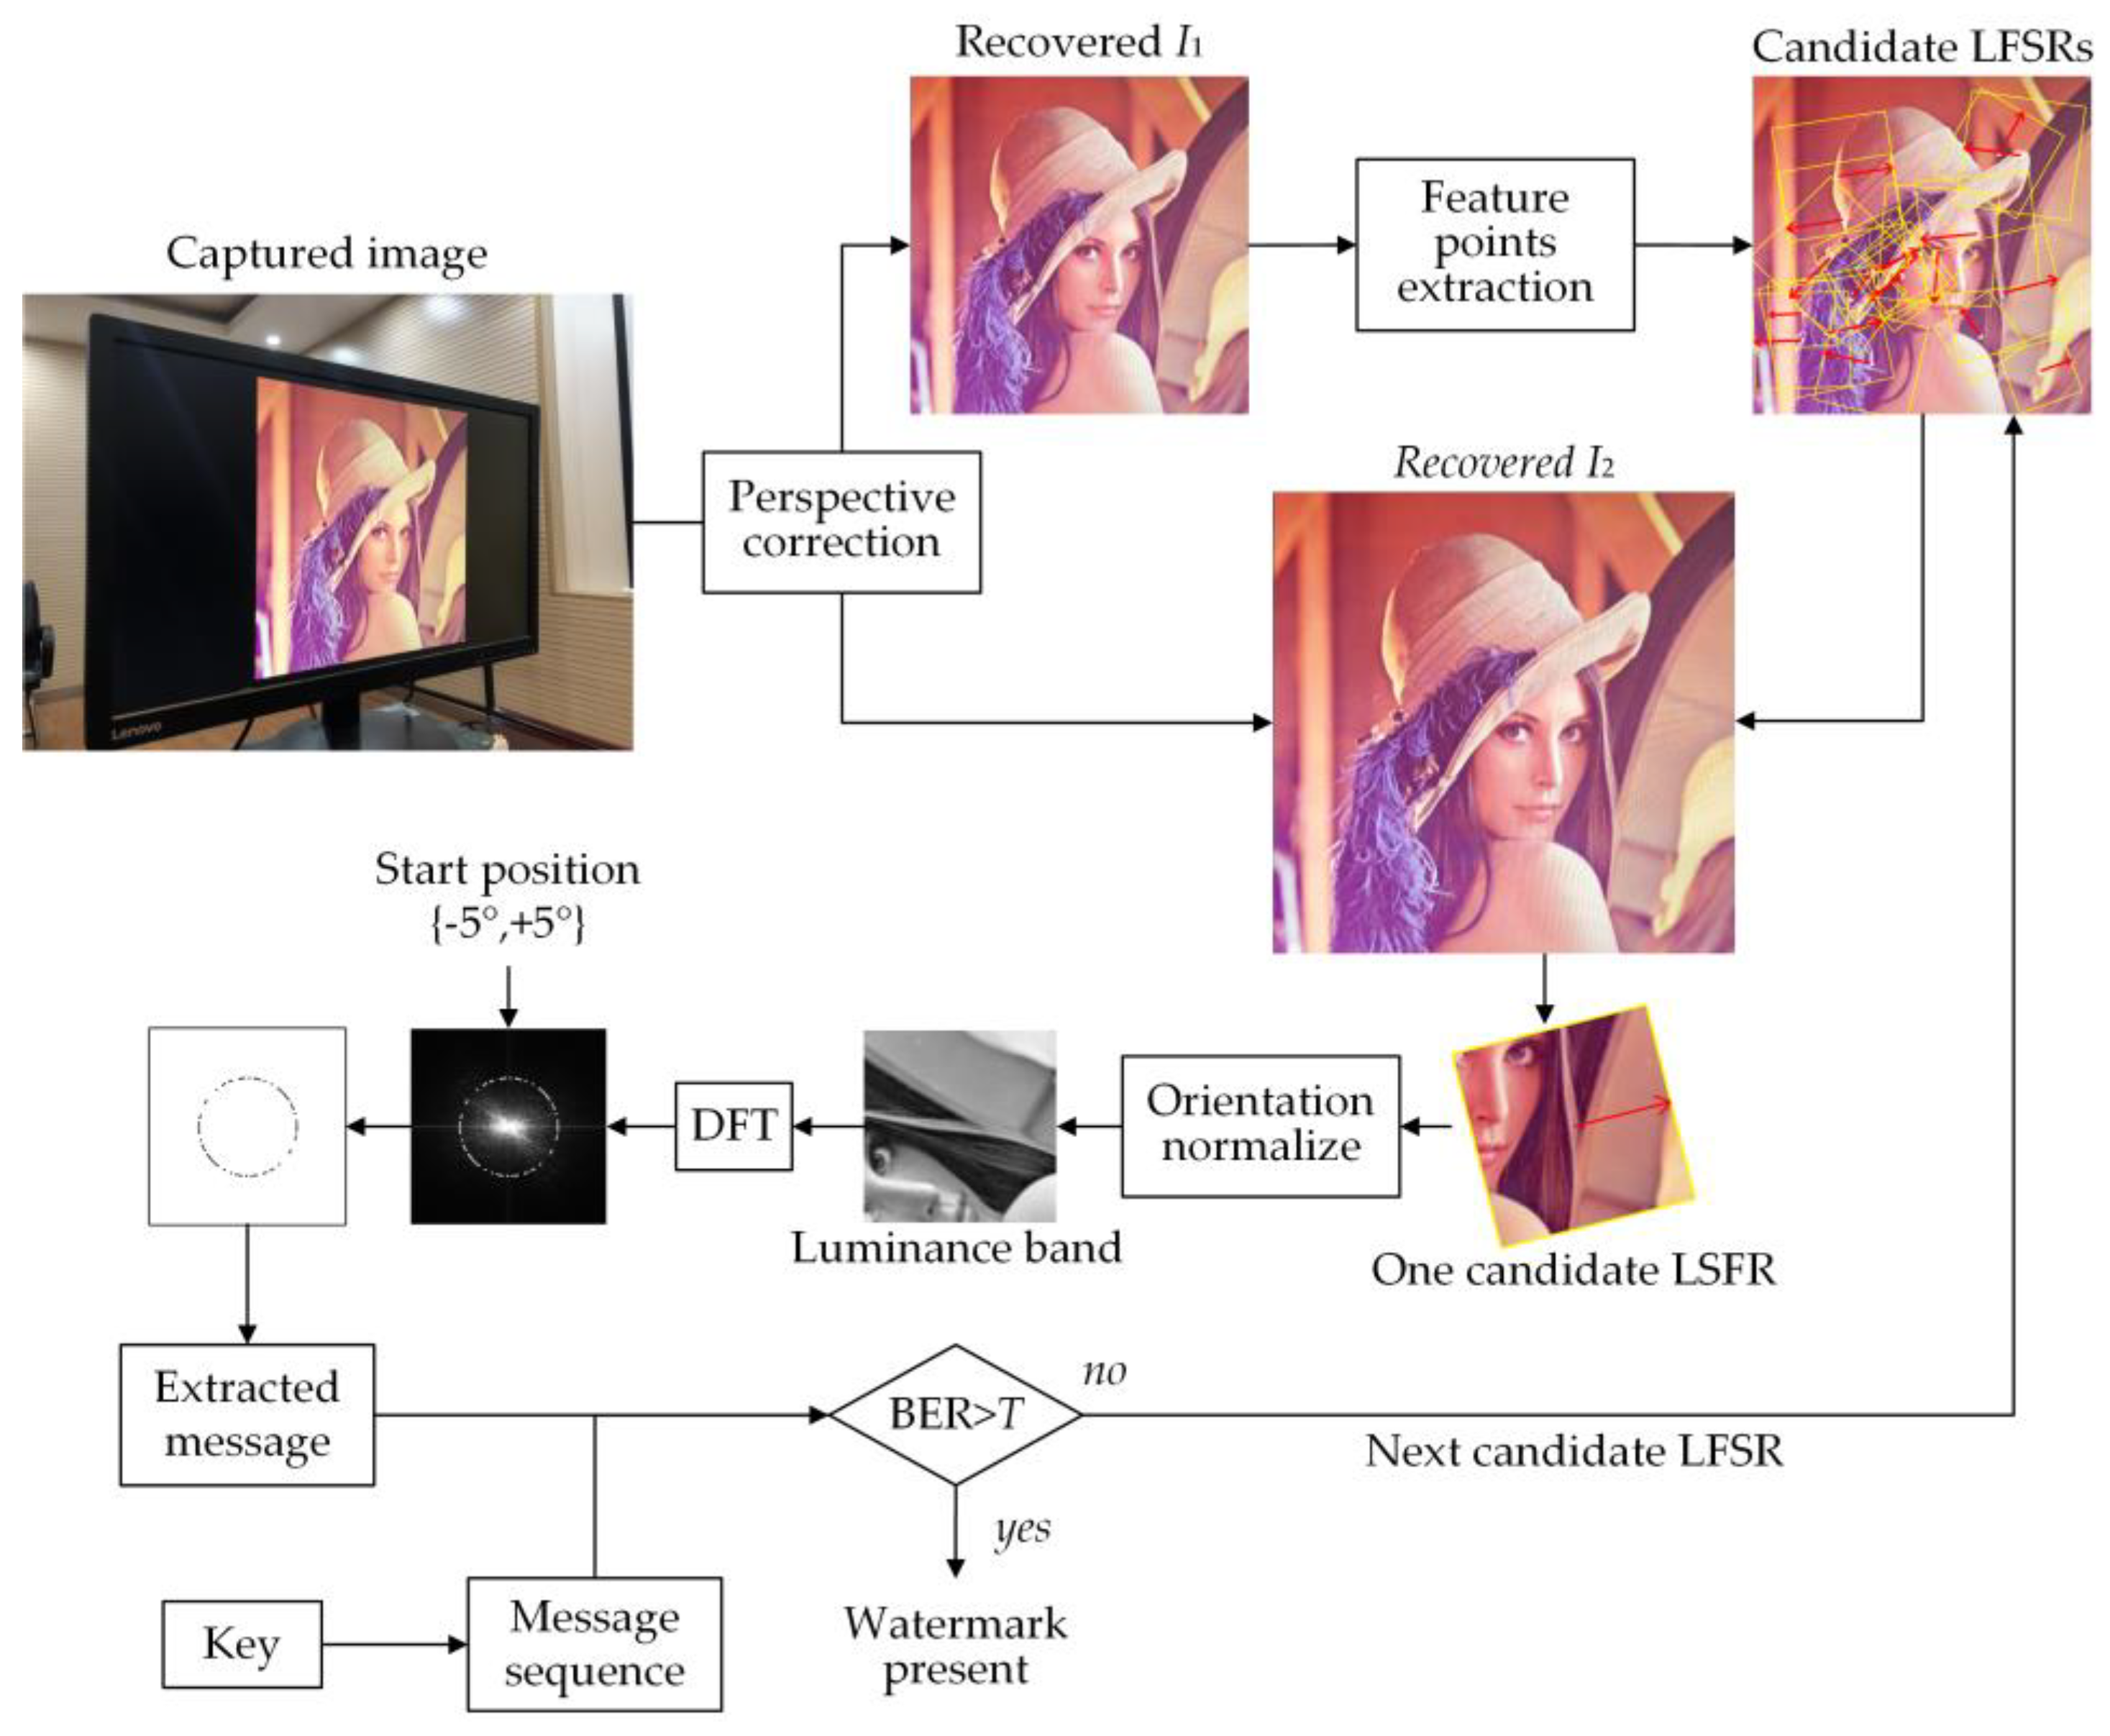
Figure 8 illustrates the watermark detection process, which can be divided into the following three steps: perspective correction, candidate regions locating, and message extraction.
3.3.1. Perspective Correction
Because different shooting angles and distances will cause perspective distortion, we need to correct it and extract the needed portion from the captured images. The perspective correction function can be written as:
where and define the homogeneous point coordinates of the corrected image and the photo, respectively. defines a nonsingular 3 × 3 homogeneous matrix. According to the formula, the matrix has eight degrees of freedom (DOF). Therefore, at least four sets of points are required to calculate .
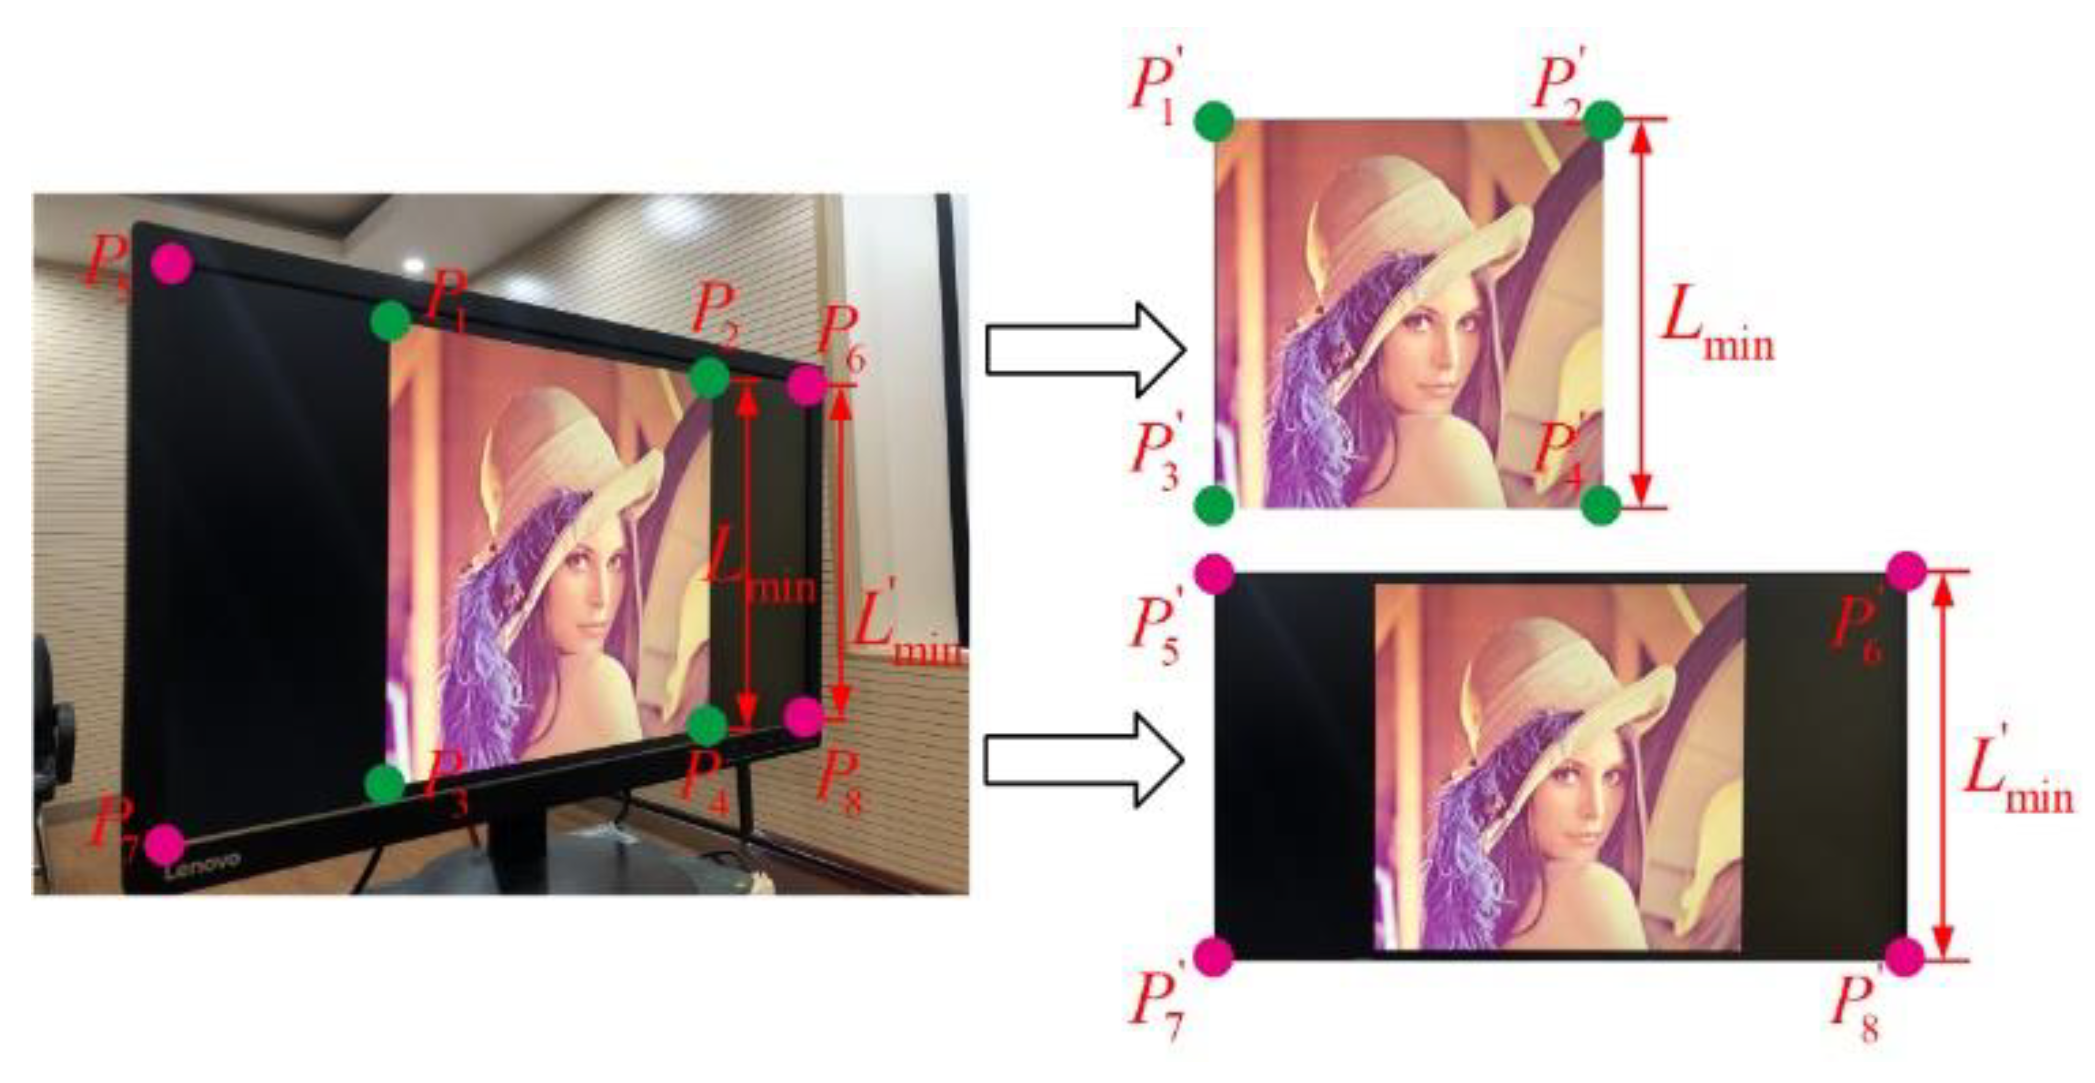
We manually select the four needed vertices from the captured image. As the proposed watermarking scheme is designed for leak tracking, manual selection is acceptable. Since the watermark synchronization method is robust to scaling, the images do not have to be recovered to the original pixel size. In theory, without knowing the original size of the image or if the image has been cropped, we can also choose to use the four vertices of the screen to help with perspective correction, as shown in Figure 9. We at least need to know the size or aspect ratio of the screen, or the aspect ratio of the image if it has not been cropped.
Because smartphones have high-megapixel cameras, the pixels of the captured image are commonly substantially larger than the original image. To fully utilize the captured information, a judgment based on the shortest distance between the four points is made before the correction. If it is larger than 1500 pixels, the image will be recovered to two different sizes. By recovering to the original size, if known, or a relatively minor size, the recovered image is used to calculate the candidate LSFRs, which also accelerates the calculation. The image is recovered based on the shortest distance between two of the four vertices, as shown in Figure 9. The recovered image is used for message extraction. Otherwise, only one image will be recovered.
3.3.2. Candidate Regions Locating
The calculation process of the candidate LSFRs is the same as the embedding process, which will be performed on . The Gaussian function is performed first to reduce the impact of a noise attack. The feature points and associated orientation are calculated. To avoid missing detection, all feature points that may be used for watermark synchronization are selected based on scale and spatial location. We obtain the candidate LSFR set of . The corresponding regions are extracted from for message extraction.
3.3.3. Message Extraction
Watermark detection is an iterative search for candidate LSFRs. As long as watermark information is detected in one LSFR, the watermark detection of the captured image is completed. Each time, one candidate LFSR is orientation normalized and discrete Fourier transformed. According to the nature of the DFT coefficients, although we do not know the original size, the radius of watermark locations will not vary as long as the area corresponding to the feature scale has not varied. However, the feature scale and its corresponding area will vary slightly, resulting in a slight variation in the radius of watermark locations. Therefore, the searching area will be between at a step of 1 pixel. Besides, we also need to consider the variation in the feature orientation. As we have investigated in Section 3.1, the orientation variation is primarily less than five degrees. Therefore, the starting position is between of the initial position at each radius at a step of one degree.
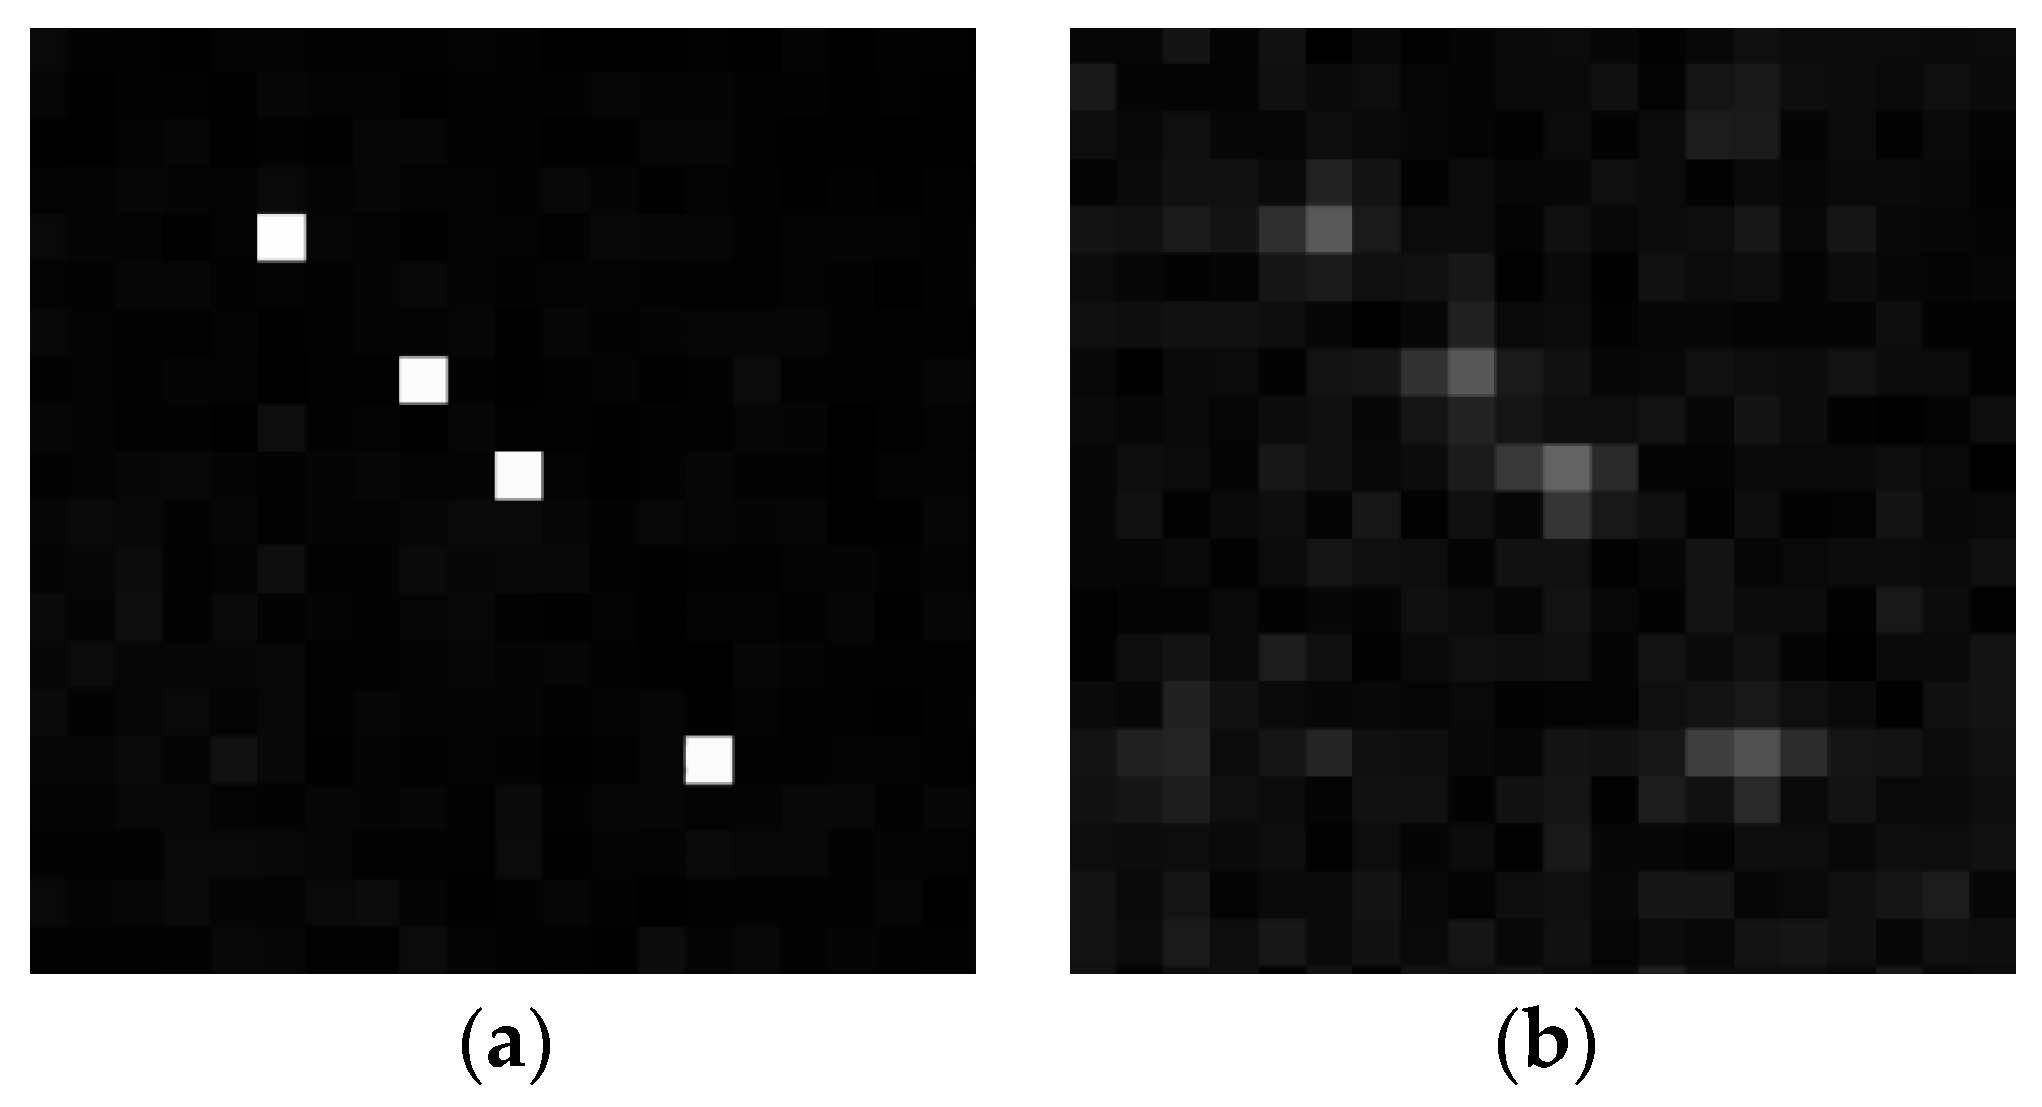
The correction of perspective distortion will inevitably cause some shift of the coefficients and imperfections in resampling. This results in a variation in the coefficient of the adjacent point. An example is shown in Figure 10. In addition, because the feature orientation will vary, the starting position cannot be located directly. Therefore, each time, the maximum magnitude value of the candidate positions and their neighborhoods are extracted to obtain the message .
Based on local statistical feature, the extracted message is defined as:
where and define the mean value and the standard deviation of all the magnitudes in the range of . is the extracted maximum value within 3 × 3 magnitudes, is a parameter used to determine the threshold for message extraction.
The extracted is compared with the pseudorandom sequence generated by the secret key to calculate the number of erroneous bits. The watermark detection is positive if the number of erroneous bits is below the predefined threshold . If the detection is negative, the iterative process continues.
4. Parameter Settings
For demonstration and experimental purposes, the watermark length is set to 60, which can be considered a reasonable message length for real use cases. Based on this, we designed a series of experiments to select the most appropriate values for the parameters mentioned above.
4.1. The Selection of Embedding Radius
The magnitudes at different embedding radii have different variation rules which affect the robustness of the algorithm. Considering the imperceptibility of the algorithm, the embedding strength can vary according to different embedding radii.
To select the most suitable embedding radius for the algorithm, we designed an experiment. The eight host images are resized to 241 × 241, which can be treated as an LSFR. We generate the watermark information with the key , where totality of 32 watermark bits is “1”.
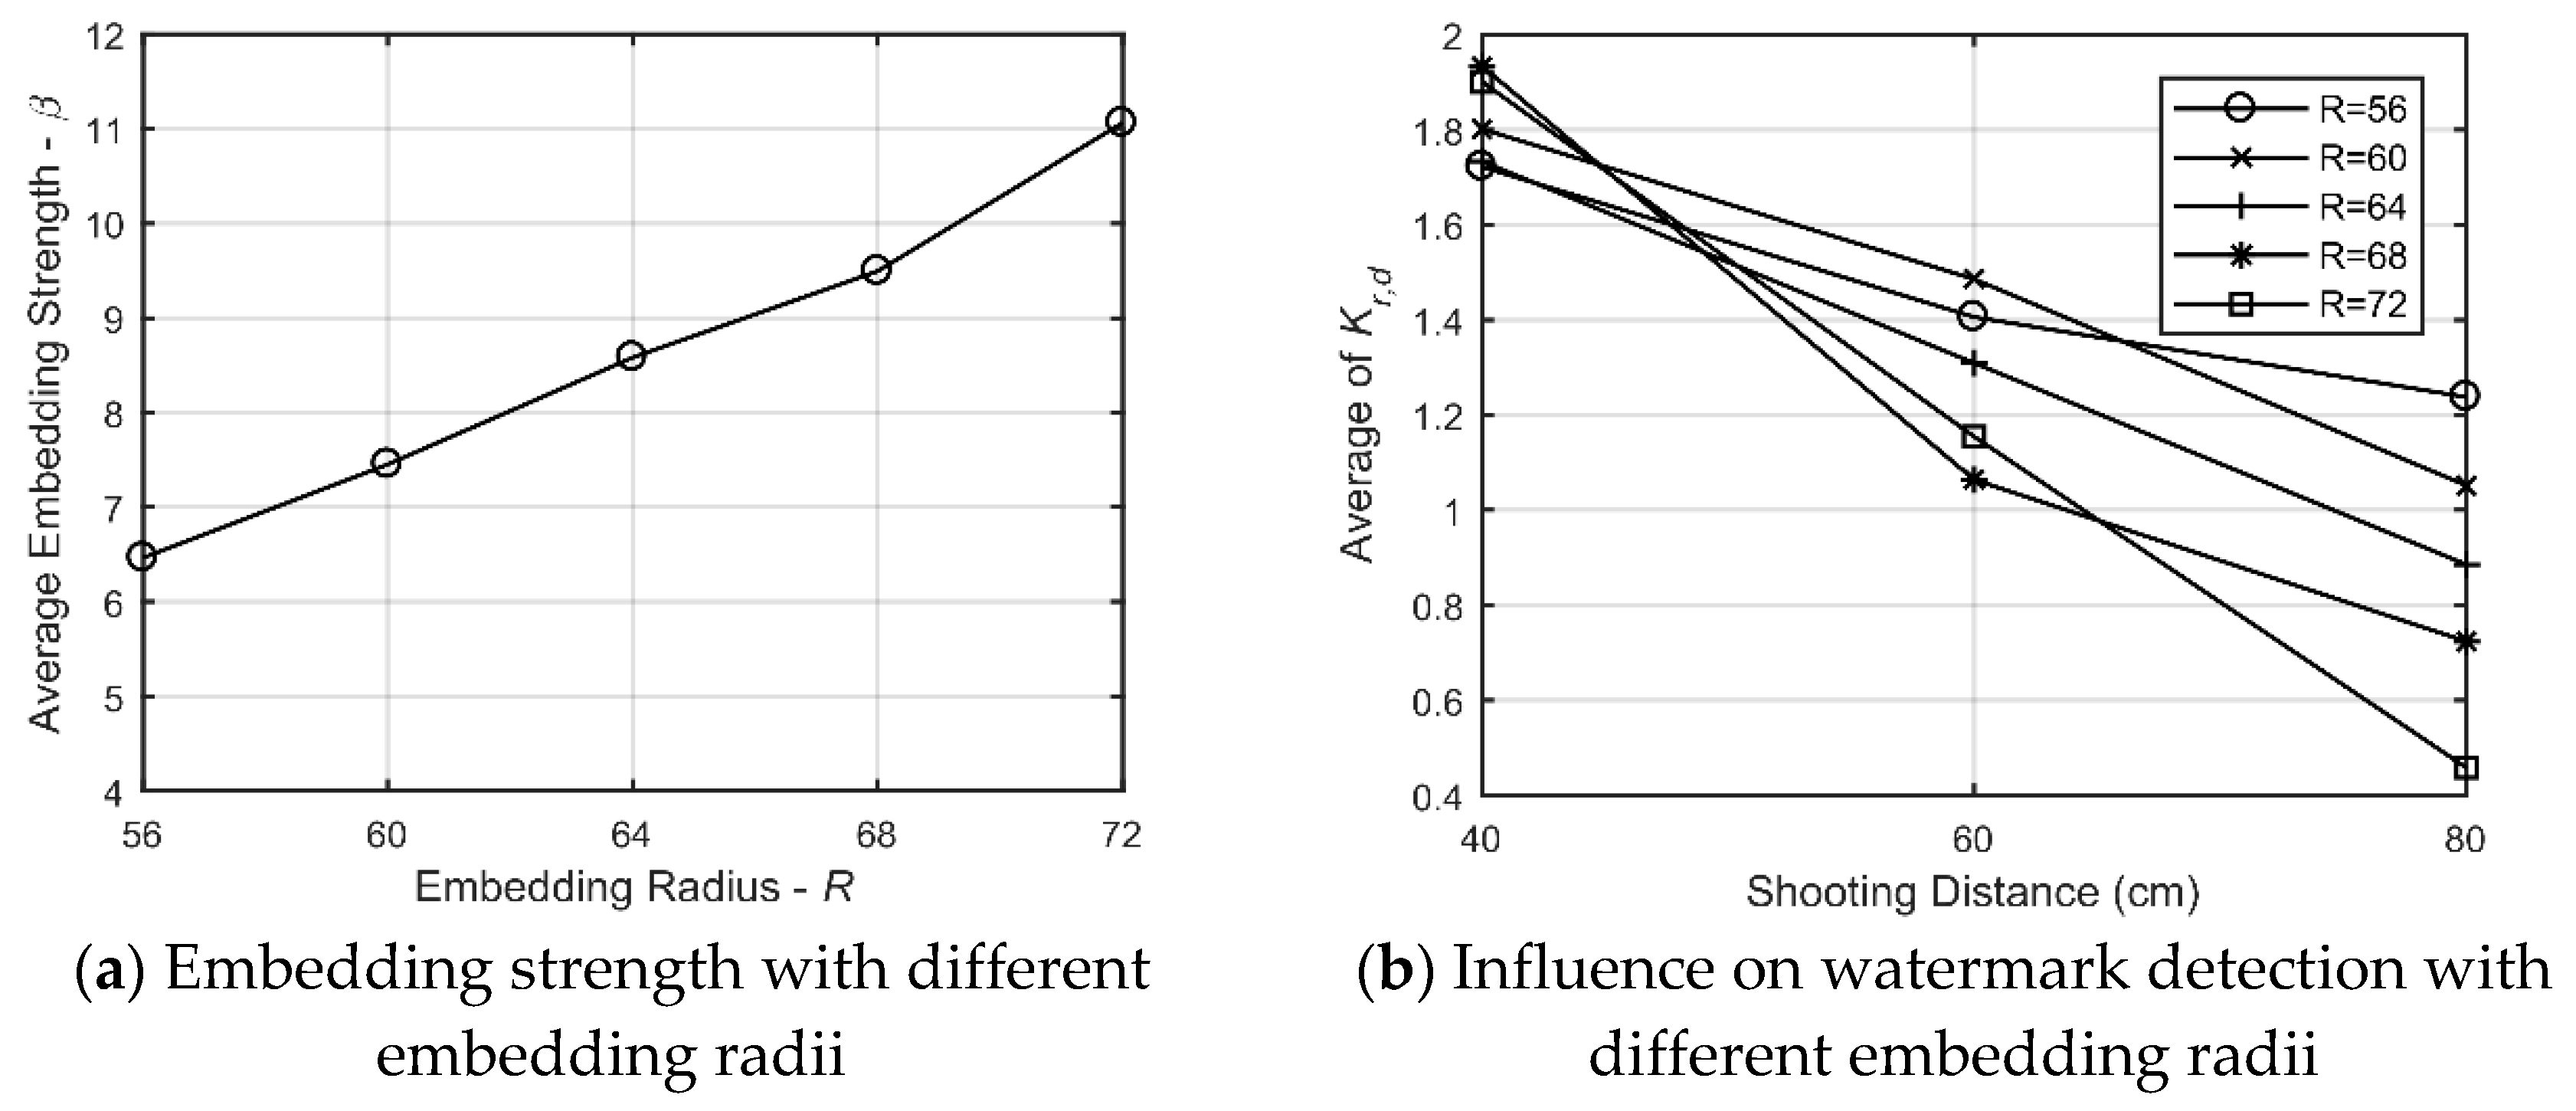
Based on the discussion in Section 3.3.3, the embedding radius should be no less than 55 to avoid the watermark bits being too close affecting each other. According to the method in Section 3.2.2, the DFT magnitudes of the experiment images are preprocessed first. Then, watermark information is embedded at different radii for all images based on Equation 15. The PSNR value of the watermarked images is controlled to be around 42 dB by adjusting the embedding strength. The relationship between embedding radius and the average embedding strength is shown in Figure 11a. With the increase in the embedding radius, the embedding strength can be increased.
In order to compare the variation of the watermarked magnitudes in different radii and at different shooting distances, we designed an index as an evaluation indicator to describe the significance of watermark information. Because only the magnitudes of the positions where watermark bit is “1” are modified, only need to consider the modified magnitudes. According to Equation (17), it is defined as:
where defines the index of the image captured at the distance of with embedding radius . defines the magnitude in i-th position where watermark bit is “1” in the captured image with embedding radius .
The relationship between the average of calculated and different shooting distances with different embedding radii is shown in Figure 11b. When the shooting distance is close to the screen, the watermark information with a larger embedding radius is more significant due to the higher embedding strength. However, the captured details of the watermark will be less and less as the shooting distance increases, so the higher frequency band coefficients will be poorly preserved. When the embedding radius is 56 and 60, the watermark information can be better preserved at different shooting distances. Considering the real scene, in order to better capture the image displayed on the screen, we usually shoot at 40 to 60 cm. At these distances, results with an embedding radius of 60 are better. Therefore, is set to 60 in our experiment.
4.2. The Selection of the Size and Number of LSFRs
The size and number of LSFRs determine the robustness of the proposed algorithm. Besides, the size of the constructed LSFRs determines the number of them. According to Equation (11), the size and number of constructed LSFRs in our experiment are determined by .
The 60 images from the database [52] are resized to 1024 × 1024 as experiment images here. We statistically analyzed the average number of constructed LSFRs with different . In theory, the larger and the greater the number of LSFRs, the better the robustness of the algorithm. Therefore, we also count the number of constructed LSFRs with side lengths of 240–300 and the number of constructed LSFRs with side lengths greater than 300, as shown in Table 1. When is set to 6 and 6.5, the most LSFRs with side lengths greater than 300 can be constructed, and the total number can also satisfy the requirements. Therefore, is set to 6.5 in our experiment.
4.3. The Selection of the Threshold for Message Extraction
According to Equation (17), determines the threshold for message extraction, which will affect the success rate and validity of watermark information extraction. We performed a statistical analysis of the extraction results of the 29 LSFRs constructed from the eight host images with and without watermarks to select the most appropriate threshold. The experiment was set at a shooting angle of 0, 15, and 30 degrees and a shooting distance from 40 to 110 cm at intervals of 10 cm. Therefore, each LSFR was captured 24 times with different shooting conditions.
Based on the extraction method in Section 3.3.3, a total of 696 results of watermarked LSFRs and 648 results of unwatermarked LSFRs were obtained. The average erroneous bits with a different is shown in Figure 12a. The extraction results of watermarked LSFRs achieve the minimum erroneous bits when is set to 1. The distributions of erroneous bits with are shown in Figure 12b. The average of detected erroneous bits of unwatermarked LSFRs is around nineteen which is independent of .
Therefore, is set to 1 in our experiment.
4.4. The Selection of the Threshold for Watermark Detection
The selection of the threshold determines the false-positive rate and the true-positive rate. needs to be set low enough to ensure that the watermark can be detected from watermarked LSFRs and high enough to ensure that the watermark cannot be detected from unwatermarked LSFRs.
Messages extracted from an unwatermarked image can be considered as independent random variables [43]. Therefore, the probability that a single bit match is 0.5. The relationship between the false-positive rate of single detection and the threshold is:
As mentioned in Section 3.3.3, each LSFR will be iteratively detected at different radii and angles. The maximum number of iterations is 231 times. Suppose we complete all iterative detection, the false-positive rate of the detection of one LSFR is:
The false-positive rate curve with different thresholds is shown in Figure 13a. In order to choose an appropriate threshold, we further analyzed the influence of different secret keys and different host images on the positive detection rate. The eight host images were all embedded with other three different keys: , , . Each watermarked image was captured 24 times with different shooting conditions. The experimental setting is the same as in Section 4.3.
Based on the 768 detection results of watermarked images with four different keys, eight different host images, and 24 different shooting conditions, we can calculate the true-positive rate with different thresholds. The true-positive rate curves between different keys and different host images are shown in Figure 13b,c. The true-positive rate can be seen to be stable for different embedding messages. However, different images have different variations during screen-cam, so the true-positive rate is also different when is below 10.
According to the result, we set threshold to 8, which means when the number of erroneous bits is below 8, the detection is successful. According to Formula 20, the false-positive rate of the detection of one LSFR is 8.86 × 10⁻⁸. The true-positive rate with , , and is 98.44%, 96.88%, 97.40%, and 96.35%, respectively. Furthermore, the true-positive rate of the eight host images is 100%, 92.71%, 97.92%, 100%, 94.79%, 100%, 93.75%, and 98.96%, respectively.
5. Experimental Results and Analysis
We conducted a series of experiments to verify the robustness of the algorithm. Robustness refers to the ability to detect the watermark after the designated class of transformations [53]. Bit Error Ratio (BER) is a commonly used metrics to measure the robustness of watermarking methods. BER is defined as:
where is the number of erroneous bits. A lower BER indicates the extracted results are closer to the original watermark information, which means the better robustness. Since the threshold for watermark detection is set to 8, and the watermark length is set to 60 in our method, this means that watermark detection is successful when BER is below 0.1333.
In Section 5.1, the robustness to common image attacks is discussed. In Section 5.2, the proposed scheme is compared with two state-of-the-art schemes and the performance against screen-cam attack is analyzed in detail. In Section 5.3, considering real-life scenarios, some hypothetical scenarios were designed to verify the robustness of the algorithm.
The experimental instruments are as follows: The display device in this scenario is a 23-inch monitor with 1920 × 1080 pixels. Since the ordinary users’ monitors are not accurately corrected, to mimic a real-world scenario, the monitors are not explicitly calibrated. An iPhone X with dual 12 MP pixels is used as the photography equipment. The lens is well focused while shooting, and shooting quality is controlled as much as possible.
The host images are the eight images in Figure 2. The PSNR values of each square region that contains an LSFR are controlled to be no less than 39 dB in our experiment. Figure 14 shows the corresponding watermarked images generated by the proposed method.
5.1. Robustness against Common Image Attacks
To prove that the algorithm also has excellent robustness against common image attacks without screen-cam attack, we performed corresponding experiments. The results are shown in Table 2, and the PSNR and mean structural similarity index (MSSIM) [54] values are also listed.
The robustness primarily depends on whether feature points and watermarking information can be simultaneously detected. As shown in Table 2, the algorithm is robust to JPEG attacks, which can mostly survive at a JPEG of 20%. Because scale attacks cause the frame to shrink, we restore the scaled images before detection. The algorithm works when under a scaling 0.5 attack and basically works when under a scaling 0.4 attack. For cropping-off attacks, which refer to a continuous crop from the right in this section, assuming more than one relatively complete embedded LSFR exists, the detection can be successful in theory. Due to the fact that the watermark is repeatedly embedded in each LSFR, we can detect the watermark information at a cropping-off 50% attack in the experiments. The rotation attack may cause the loss of feature points since we only need at least one successful detection, and the algorithm is also effective. The algorithm also works at a median filter 3 × 3 attack. Thus, our watermarking scheme has excellent robustness to common image attacks.
5.2. Robustness against Screen-Cam
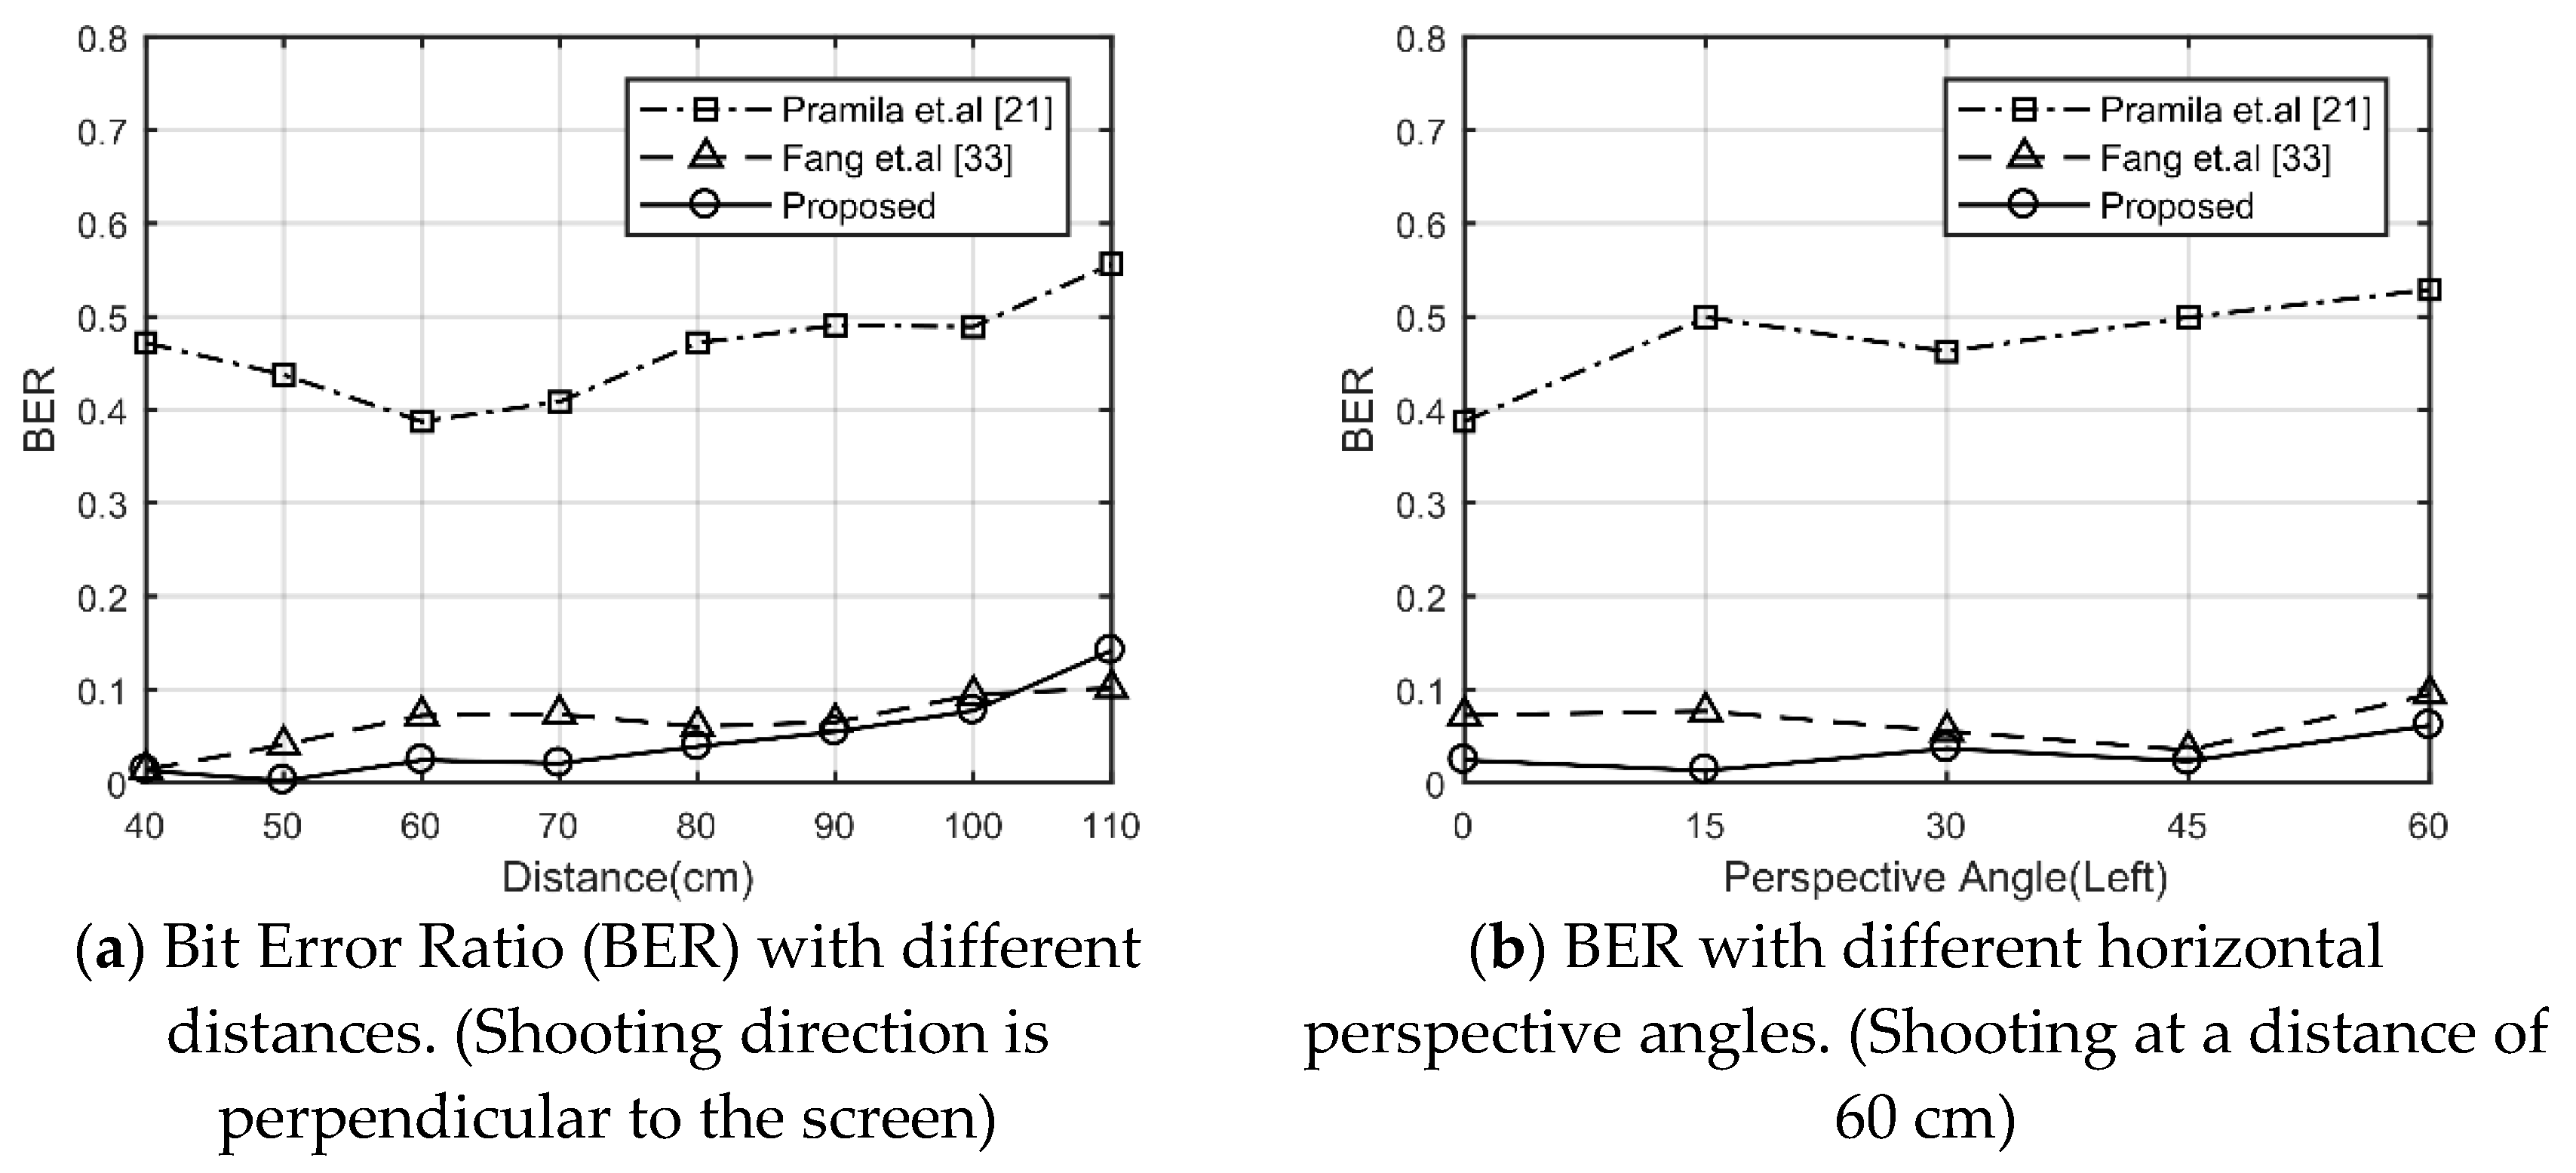
In this section, we verify the robustness against a screen-cam attack. First, we compare the proposed method with two existing algorithms [21,33]. Since the size of the host images used in their articles is different from this one, we use the same host images here. In order to improve the independence of the experimental results to the host images, we use additional twelve images from the database [52] to verify the performance. The PSNR values of the images generated by the proposed method are controlled to be not lower than by other methods, which are at around 42 dB. An example of Lena embedded with different methods is shown in Table 3. All the watermarked images are displayed on the screen at the original resolution. The comparison of BER for different shooting conditions is shown in Figure 15. The result shows method [21] designed for print-cam is not applicable for screen-cam process, and the proposed method and method [33] both have good robustness against screen-cam attack.
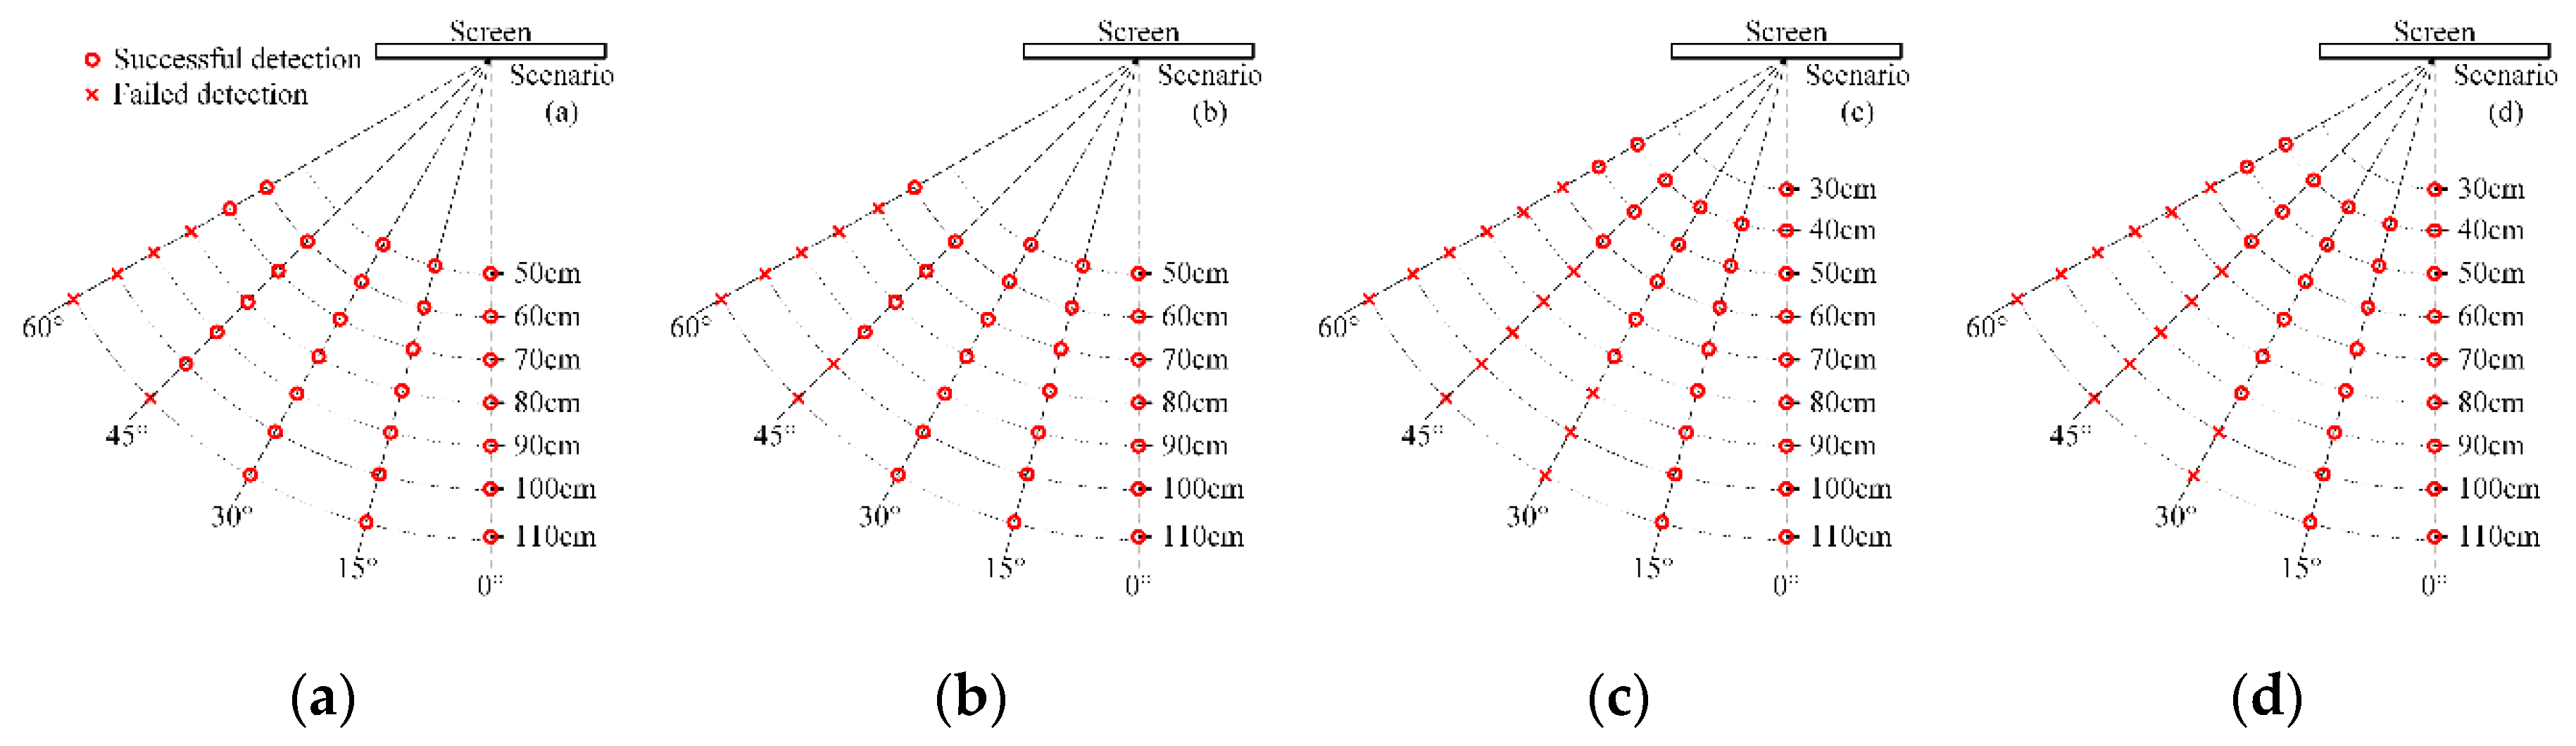
In theory, without considering external interference, the distortion caused by shooting from the horizontal left and horizontal right is similar. Shooting at different vertical angles is also similar to shooting at different horizontal angles with a 90-degree rotation of the image. Therefore, as shown in Figure 16, the shooting angle is set from being perpendicular to the screen up to 60 degrees of horizontal left at intervals of fifteen degrees. The shooting distance is set from 40 to 110 cm at intervals of 10 cm. When the shooting angle is 45 or 60, the shooting distance of 40 cm is too small to capture the entire image. Therefore, the distance is selected to be over 50 cm.
The example of Lena images recovered from captured images with different angles and distances and their detected BER by the secret key are shown in Table 4. The detection results of eight images are shown in Figure 16, where the red mark indicates the camera position relative to the screen and the dotted straight line indicates the shooting direction.
As shown in Figure 16, when the horizontal shooting angle is lower than 30 degrees, watermarks are mostly detected successfully. When the horizontal shooting angle is 45 degrees, the watermark can be detected within a shooting distance of 90 or 100 cm. For a large shooting angle of 60 degrees, the image cannot be well focused. Thus, the watermark information can commonly be detected within a closer shooting distance, which is approximately 70 or 80 cm.
We also tested the performance at other tilt shooting angles with a handhold shooting, as shown in Table 5; it also has excellent performance. Therefore, the proposed algorithm is robust to a screen-cam attack.
5.3. Robustness against Screen-Cam with Additional Common Attacks
The scheme in [33] needs to record the four vertices, which means it needs to know the original size. Furthermore, the scheme in [21] cannot deal with the cropping attack. However, in a real-life scenario, images may under common image processing attacks caused by normal user operations. Therefore, we experimented with several hypothetical scenarios to verify the effectiveness of the proposed algorithm for screen-cam with additional common attacks. We designed four realistic application scenarios where method [21,33] are not applicable: (a) the Lena image is blocked by the window at 20 percent, which is equal to being cropped; (b) the Peppers image is rotated five degrees and cropped; (c) the Building image is scaled by 80%; (d) the Pentagon image is scaled by 80% and rotated 90 degrees counterclockwise. An example of the four scenarios is shown in Table 6. When doing the watermark detection, assume that we do not know the specifics of the attacks, which means we do not correct the image to its original scale or original orientation manually. The coordinate points that are used for perspective correction are denoted in Table 6 as red dots.
Figure 17 shows the detection results of the four scenarios. The construction of Figure 17 is the same as Figure 16. Furthermore, due to the different sizes of the experimental images, the shooting distance was adjusted accordingly. Because Scenario (a) and Scenario (b) use the four corner points of the screen for perspective correction, the experiment shooting distance starts from 50 cm. In these two scenarios, the performance of watermark detection is the same as the detection results of the same host images in Section 5.2. In Scenario (c) and Scenario (d), because the images are scaled, the test starting shooting distance can be shortened, and the effective detection distance is also shortened. When the shooting angle is 15 and 30 degrees, the watermark information can be detected at all shooting distances in the experiments. As the shooting angle increases, the detectable shooting distance is substantially reduced. Watermark information can be detected within a shooting distance of 50 cm when the horizontal shooting angle is 60 degrees. Thus, the scaling of the images has a considerable influence on the watermark detection of the large angle captured image, but it can still meet the actual needs. These results verified the fact that the proposed scheme can handle screen-cam with common attacks.
5.4. Applicability and Limitations Analysis
The proposed scheme works well for most types of images, but it inevitably has limitations. Feature point-based algorithms are limited by the feature point operator itself. For images with simple texture, the feature points are often unstable when under a severe image quality degradation. Therefore, for images with simple texture, the proposed method may not achieve accurate watermark synchronization, which will probably cause watermark detection to fail.
Another limitation is that the proposed scheme is not applicable to this situation, where the image displayed on the screen is greatly zoomed out before we capture it with a camera. Because in this case, the image displayed on the screen is resampled, which will cause a massive loss of image details. Unfortunately, the screen-cam process will amplify this distortion. Especially for high-resolution images, the users are most likely to zoom out to view the entire image. Therefore, the proposed scheme could be used with access control systems or other specific applications to avoid this situation.
Furthermore, because the motivation of this method is to hold accountability for leakage behavior, the time complexity of algorithm is not a very important consideration. However, in other words, time complexity is also one of our limitations. The computation time of watermark embedding includes two parts: LSFRs construction and message embedding. Based on a personal computer, which CPU is Intel Core i7–9700 CPU and RAM is 32 GB, the average computation time of LSFRs construction and message embedding for the host images are 7.041 s and 0.106 s, respectively. The Harris–Laplace operation involves multiscale and iterative calculations, which cost most of the computation time. Based on the algorithm, the time complexity of embedding algorithm is , where and define the length and width of the image, respectively. Hence, for high-resolution images, the computation time will vary according to their size. With respect to watermark detection, the process of finding candidate LSFRs is similar to the process of constructing LSFRs. Although the message extraction process iterates the message extraction algorithm within our defined detection range, the computation time is still insignificant compared with the process of finding candidate LSFRs. Hence, after the manual perspective correction process, the time complexity of watermark detection is similar to watermark embedding. Therefore, considering the user experience, the algorithm is not recommended for real-time applications for now.
6. Conclusions
In this paper, a novel feature and Fourier-based screen-cam robust watermarking scheme is proposed. The distortions during the screen-cam process are analyzed. To resist possible desynchronization attacks caused by user operations and the screen-cam process, an LSFR construction method, based on the modified Harris–Laplace detector and SURF orientation descriptor, is designed to achieve watermark synchronization. In the proposed message embedding scheme, we repeatedly embed the message sequence in the DFT domain of each selected LSFR to achieve robustness against the screen-cam process. To decrease the quality degradation after embedding and improve the extraction accuracy, we employ a non-rotating embedding method and a preprocessing method to modulate the DFT magnitude coefficients. On the extraction side, we restore the captured image based on the size of the image itself to help improve the detection accuracy. The experiment shows that the proposed scheme has high robustness for common image attacks and screen-cam attacks. Compared with existing methods, the proposed scheme can further achieve robustness against screen-cam with additional common attacks.
In future research, we aim to investigate automatic detection methods, which is a more practical application foreground. To achieve this goal, screen-cam robust invariants should be further investigated to help design novel local feature-based watermark synchronization methods or develop novel synchronization watermark message embedding and automatic detection methods.
Author Contributions
Conceptualization, W.C. and N.R.; methodology, W.C., N.R. and C.Z.; software, W.C. and Q.Z.; data curation, W.C., T.S. and A.K.; writing—original draft preparation, W.C. and N.R.; writing—review and editing, Q.Z., T.S. and A.K.; funding acquisition, C.Z. All authors have read and agreed to the published version of the manuscript.
Funding
This research was funded by the National Natural Science Foundation of China, grant number 42071362 and 41971338, the Natural Science Foundation of Jiangsu Province, grant number BK20191373.
Conflicts of Interest
The authors declare no conflict of interest.
References
- Abd El-Latif, A.A.; Abd-El-Atty, B.; Talha, M. Robust Encryption of Quantum Medical Images. IEEE Access 2018, 6, 1073–1081. [Google Scholar] [CrossRef]
- Abd El-Latif, A.A.; Li, L.; Wang, N.; Han, Q.; Niu, X. A new approach to chaotic image encryption based on quantum chaotic system, exploiting color spaces. Signal Process. 2013, 93, 2986–3000. [Google Scholar] [CrossRef]
- Abd El-Latif, A.A.; Yan, X.; Li, L.; Wang, N.; Peng, J.-L.; Niu, X. A new meaningful secret sharing scheme based on random grids, error diffusion and chaotic encryption. Opt. Laser Technol. 2013, 54, 389–400. [Google Scholar] [CrossRef]
- Belazi, A.; Abd El-Latif, A.A.; Belghith, S. A novel image encryption scheme based on substitution-permutation network and chaos. Signal Process. 2016, 128, 155–170. [Google Scholar] [CrossRef]
- Belazi, A.; Abd El-Latif, A.A.; Diaconu, A.-V.; Rhouma, R.; Belghith, S. Chaos-based partial image encryption scheme based on linear fractional and lifting wavelet transforms. Opt. Lasers Eng. 2017, 88, 37–50. [Google Scholar] [CrossRef]
- Abd El-Latif, A.A.; Li, L.; Niu, X. A new image encryption scheme based on cyclic elliptic curve and chaotic system. Multimed. Tools Appl. 2012, 70, 1559–1584. [Google Scholar] [CrossRef]
- Alrehily, A.; Thayananthan, V. Computer Security and Software Watermarking Based on Return-oriented Programming. Int. J. Comput. Netw. Inf. Secur. 2018, 10, 28–36. [Google Scholar] [CrossRef]
- Wang, Y.; Gong, D.; Lu, B.; Xiang, F.; Liu, F. Exception Handling-Based Dynamic Software Watermarking. IEEE Access 2018, 6, 8882–8889. [Google Scholar] [CrossRef]
- Jha, S.; Sural, S.; Atluri, V.; Vaidya, J. Specification and Verification of Separation of Duty Constraints in Attribute-Based Access Control. IEEE Trans. Inf. Forensics Secur. 2018, 13, 897–911. [Google Scholar] [CrossRef]
- Xu, G.; Li, H.; Dai, Y.; Yang, K.; Lin, X. Enabling Efficient and Geometric Range Query With Access Control Over Encrypted Spatial Data. IEEE Trans. Inf. Forensics Secur. 2019, 14, 870–885. [Google Scholar] [CrossRef]
- Castiglione, A.; De Santis, A.; Masucci, B.; Palmieri, F.; Castiglione, A.; Huang, X. Cryptographic Hierarchical Access Control for Dynamic Structures. IEEE Trans. Inf. Forensics Secur. 2016, 11, 2349–2364. [Google Scholar] [CrossRef]
- Carpentieri, B.; Castiglione, A.; De Santis, A.; Palmieri, F.; Pizzolante, R. One-pass lossless data hiding and compression of remote sensing data. Future Gener. Comput. Syst. 2019, 90, 222–239. [Google Scholar] [CrossRef]
- Liu, X.; Lou, J.; Fang, H.; Chen, Y.; Ouyang, P.; Wang, Y.; Zou, B.; Wang, L. A novel robust reversible watermarking scheme for protecting authenticity and integrity of medical images. IEEE Access 2019, 7, 76580–76598. [Google Scholar] [CrossRef]
- Yu, X.; Wang, C.; Zhou, X. A Robust Color Image Watermarking Algorithm Based on APDCBT and SSVD. Symmetry 2019, 11, 1227. [Google Scholar] [CrossRef] [Green Version]
- Zhou, K.; Zhang, Y.; Li, J.; Zhan, Y.; Wan, W. Spatial-Perceptual Embedding with Robust Just Noticeable Difference Model for Color Image Watermarking. Mathematics 2020, 8, 1506. [Google Scholar] [CrossRef]
- Lee, J.-E.; Seo, Y.-H.; Kim, D.-W. Convolutional Neural Network-Based Digital Image Watermarking Adaptive to the Resolution of Image and Watermark. Appl. Sci. 2020, 10, 6854. [Google Scholar] [CrossRef]
- Nakamura, T.; Katayama, A.; Yamamuro, M.; Sonehara, N. Fast watermark detection scheme for camera-equipped cellular phone. In Proceedings of the 3rd International Conference on Mobile and Ubiquitous Multimedia; Association for Computing Machinery: New York, NY, USA, 2004; pp. 101–108. [Google Scholar]
- Katayama, A.; Nakamura, T.; Yamamuro, M.; Sonehara, N. New high-speed frame detection method: Side Trace Algorithm (STA) for i-appli on cellular phones to detect watermarks. In Proceedings of the 3rd International Conference on Mobile and Ubiquitous Multimedia; Association for Computing Machinery: New York, NY, USA, 2004; pp. 109–116. [Google Scholar]
- Keskinarkaus, A.; Pramila, A.; Seppänen, T. Image watermarking with feature point based synchronization robust to print–scan attack. J. Vis. Commun. Image Represent. 2012, 23, 507–515. [Google Scholar] [CrossRef]
- Kim, W.-G.; Lee, S.H.; Seo, Y.-S. Image fingerprinting scheme for print-and-capture model. In Proceedings of Pacific-Rim Conference on Multimedia; Springer: Berlin/Heidelberg, Germany, 2006; pp. 106–113. [Google Scholar]
- Pramila, A.; Keskinarkaus, A.; Seppänen, T. Toward an interactive poster using digital watermarking and a mobile phone camera. Signal Image Video Process. 2011, 6, 211–222. [Google Scholar] [CrossRef]
- Pramila, A.; Keskinarkaus, A.; Takala, V.; Seppänen, T. Extracting watermarks from printouts captured with wide angles using computational photography. Multimed. Tools Appl. 2016, 76, 16063–16084. [Google Scholar] [CrossRef] [Green Version]
- Pramila, A.; Keskinarkaus, A.; Seppänen, T. Increasing the capturing angle in print-cam robust watermarking. J. Syst. Softw. 2018, 135, 205–215. [Google Scholar] [CrossRef] [Green Version]
- Kang, X.; Huang, J.; Zeng, W. Efficient general print-scanning resilient data hiding based on uniform log-polar mapping. IEEE Trans. Inf. Forensics Secur. 2010, 5, 1–12. [Google Scholar] [CrossRef]
- Lin, C.-Y.; Wu, M.; Bloom, J.A.; Cox, I.J.; Miller, M.L.; Lui, Y.M. Rotation, scale, and translation resilient watermarking for images. IEEE Trans. Image Process. 2001, 10, 767–782. [Google Scholar] [CrossRef] [PubMed]
- Gourrame, K.; Douzi, H.; Harba, R.; Ros, F.; El Hajji, M.; Riad, R.; Amar, M. Robust Print-cam Image Watermarking in Fourier Domain. In Proceedings of International Conference on Image and Signal Processing; Springer International Publishing: Cham, Switzerland, 2016; pp. 356–365. [Google Scholar]
- Gourrame, K.; Douzi, H.; Harba, R.; Riad, R.; Ros, F.; Amar, M.; Elhajji, M. A zero-bit Fourier image watermarking for print-cam process. Multimed. Tools Appl. 2019, 78, 2621–2638. [Google Scholar] [CrossRef]
- Poljicak, A.; Mandic, L.; Agic, D. Discrete Fourier transform-based watermarking method with an optimal implementation radius. J. Electron. Imaging 2011, 20, 033008. [Google Scholar] [CrossRef]
- Riad, R.; Harba, R.; Douzi, H.; Ros, F.; Elhajji, M. Robust fourier watermarking for id images on smart card plastic supports. Adv. Electr. Comput. Eng. 2016, 16, 23–30. [Google Scholar] [CrossRef]
- Keskinarkaus, A.; Pramila, A.; Seppänen, T.; Sauvola, J. Wavelet domain print-scan and JPEG resilient data hiding method. In Proceedings of International Workshop on Digital Watermarking; Springer: Berlin/Heidelberg, Germany, 2006; pp. 82–95. [Google Scholar]
- Pramila, A.; Keskinarkaus, A.; Seppänen, T. Multiple domain watermarking for print-scan and JPEG resilient data hiding. In Proceedings of International Workshop on Digital Watermarking; Springer: Berlin/Heidelberg, Germany, 2008; pp. 279–293. [Google Scholar]
- Jassim, T.; Abd-Alhameed, R.; Al-Ahmad, H. A new robust and fragile watermarking scheme for images captured by mobile phone cameras. In Proceedings of the 1st International Conference on Communications, Signal Processing, and Their Applications ICCSPA 2013, Sharjah, UAE, 12–14 February 2013; pp. 1–5. [Google Scholar]
- Fang, H.; Zhang, W.; Zhou, H.; Cui, H.; Yu, N. Screen-shooting resilient watermarking. IEEE Trans. Inf. Forensics Secur. 2018, 14, 1403–1418. [Google Scholar] [CrossRef]
- Schaber, P.; Kopf, S.; Wetzel, S.; Ballast, T.; Wesch, C.; Effelsberg, W. CamMark: Analyzing, modeling, and simulating artifacts in camcorder copies. ACM Trans. Multimed. Comput. Commun. Appl. Tomm 2015, 11, 1–23. [Google Scholar] [CrossRef]
- Bigas, M.; Cabruja, E.; Forest, J.; Salvi, J. Review of CMOS image sensors. Microelectron. J. 2006, 37, 433–451. [Google Scholar] [CrossRef] [Green Version]
- Kong, L.; Cai, S.; Li, Z.; Jin, G.; Huang, S.; Xu, K.; Wang, T. Interpretation of moiré phenomenon in the image domain. Opt. Express 2011, 19, 18399–18409. [Google Scholar] [CrossRef]
- Niu, P.-P.; Wang, X.-Y.; Liu, Y.-N.; Yang, H.-Y. A robust color image watermarking using local invariant significant bitplane histogram. Multimed. Tools Appl. 2017, 76, 3403–3433. [Google Scholar]
- Seo, J.S.; Yoo, C.D. Image watermarking based on invariant regions of scale-space representation. IEEE Trans. Signal Process. 2006, 54, 1537–1549. [Google Scholar] [CrossRef]
- Su, P.-C.; Chang, Y.-C.; Wu, C.-Y. Geometrically resilient digital image watermarking by using interest point extraction and extended pilot signals. IEEE Trans. Inf. Forensics Secur. 2013, 8, 1897–1908. [Google Scholar] [CrossRef]
- Thanh, T.M.; Tanaka, K.; Dung, L.H.; Tai, N.T.; Nam, H.N. Performance analysis of robust watermarking using linear and nonlinear feature matching. Multimed. Tools Appl. 2018, 77, 2901–2920. [Google Scholar] [CrossRef]
- Tsai, J.-S.; Huang, W.-B.; Kuo, Y.-H. On the selection of optimal feature region set for robust digital image watermarking. IEEE Trans. Image Process. 2010, 20, 735–743. [Google Scholar] [CrossRef] [PubMed]
- Wang, C.; Zhang, Y.; Zhou, X. Robust image watermarking algorithm based on ASIFT against geometric attacks. Appl. Sci. 2018, 8, 410. [Google Scholar] [CrossRef] [Green Version]
- Wang, X.; Wu, J.; Niu, P. A new digital image watermarking algorithm resilient to desynchronization attacks. IEEE Trans. Inf. Forensics Secur. 2007, 2, 655–663. [Google Scholar] [CrossRef]
- Wang, X.-Y.; Hou, L.-M.; Wu, J. A feature-based robust digital image watermarking against geometric attacks. Image Vis. Comput. 2008, 26, 980–989. [Google Scholar] [CrossRef]
- Wang, X.-Y.; Niu, P.-P.; Yang, H.-Y.; Chen, L.-L. Affine invariant image watermarking using intensity probability density-based Harris Laplace detector. J. Vis. Commun. Image Represent. 2012, 23, 892–907. [Google Scholar] [CrossRef]
- Hsu, P.H.; Chen, C.C. A robust digital watermarking algorithm for copyright protection of aerial photogrammetric images. Photogramm. Rec. 2016, 31, 51–70. [Google Scholar] [CrossRef]
- Solanki, K.; Madhow, U.; Manjunath, B.; Chandrasekaran, S.; El-Khalil, I. Print and scan‘resilient data hiding in images. IEEE Trans. Inf. Forensics Secur. 2006, 1, 464–478. [Google Scholar] [CrossRef]
- Mikolajczyk, K.; Schmid, C. An affine invariant interest point detector. In Proceedings of European Conference on Computer Vision; Springer: Berlin/Heidelberg, Germany, 2002; pp. 128–142. [Google Scholar]
- Mikolajczyk, K.; Schmid, C. Scale & affine invariant interest point detectors. Int. J. Comput. Vis. 2004, 60, 63–86. [Google Scholar]
- Harris, C.G.; Stephens, M. A combined corner and edge detector. In Proceedings of the Alvey Vision Conference, Manchester, UK, 31 August–2 September 1988; pp. 147–151. [Google Scholar]
- Noble, J.A. Finding corners. Image Vis. Comput. 1988, 6, 121–128. [Google Scholar] [CrossRef]
- Related Images of the Experiments. Available online: http://decsai.ugr.es/cvg/dbimagenes/c512.php (accessed on 6 September 2020).
- Kumar, C.; Singh, A.K.; Kumar, P. A recent survey on image watermarking techniques and its application in e-governance. Multimed. Tools Appl. 2018, 77, 3597–3622. [Google Scholar] [CrossRef]
- Wang, Z.; Bovik, A.C.; Sheikh, H.R.; Simoncelli, E.P. Image quality assessment: From error visibility to structural similarity. IEEE Trans. Image Process. 2004, 13, 600–612. [Google Scholar] [CrossRef] [PubMed] [Green Version]
Figure 1.
Various processes and corresponding distortions in screen-cam process.

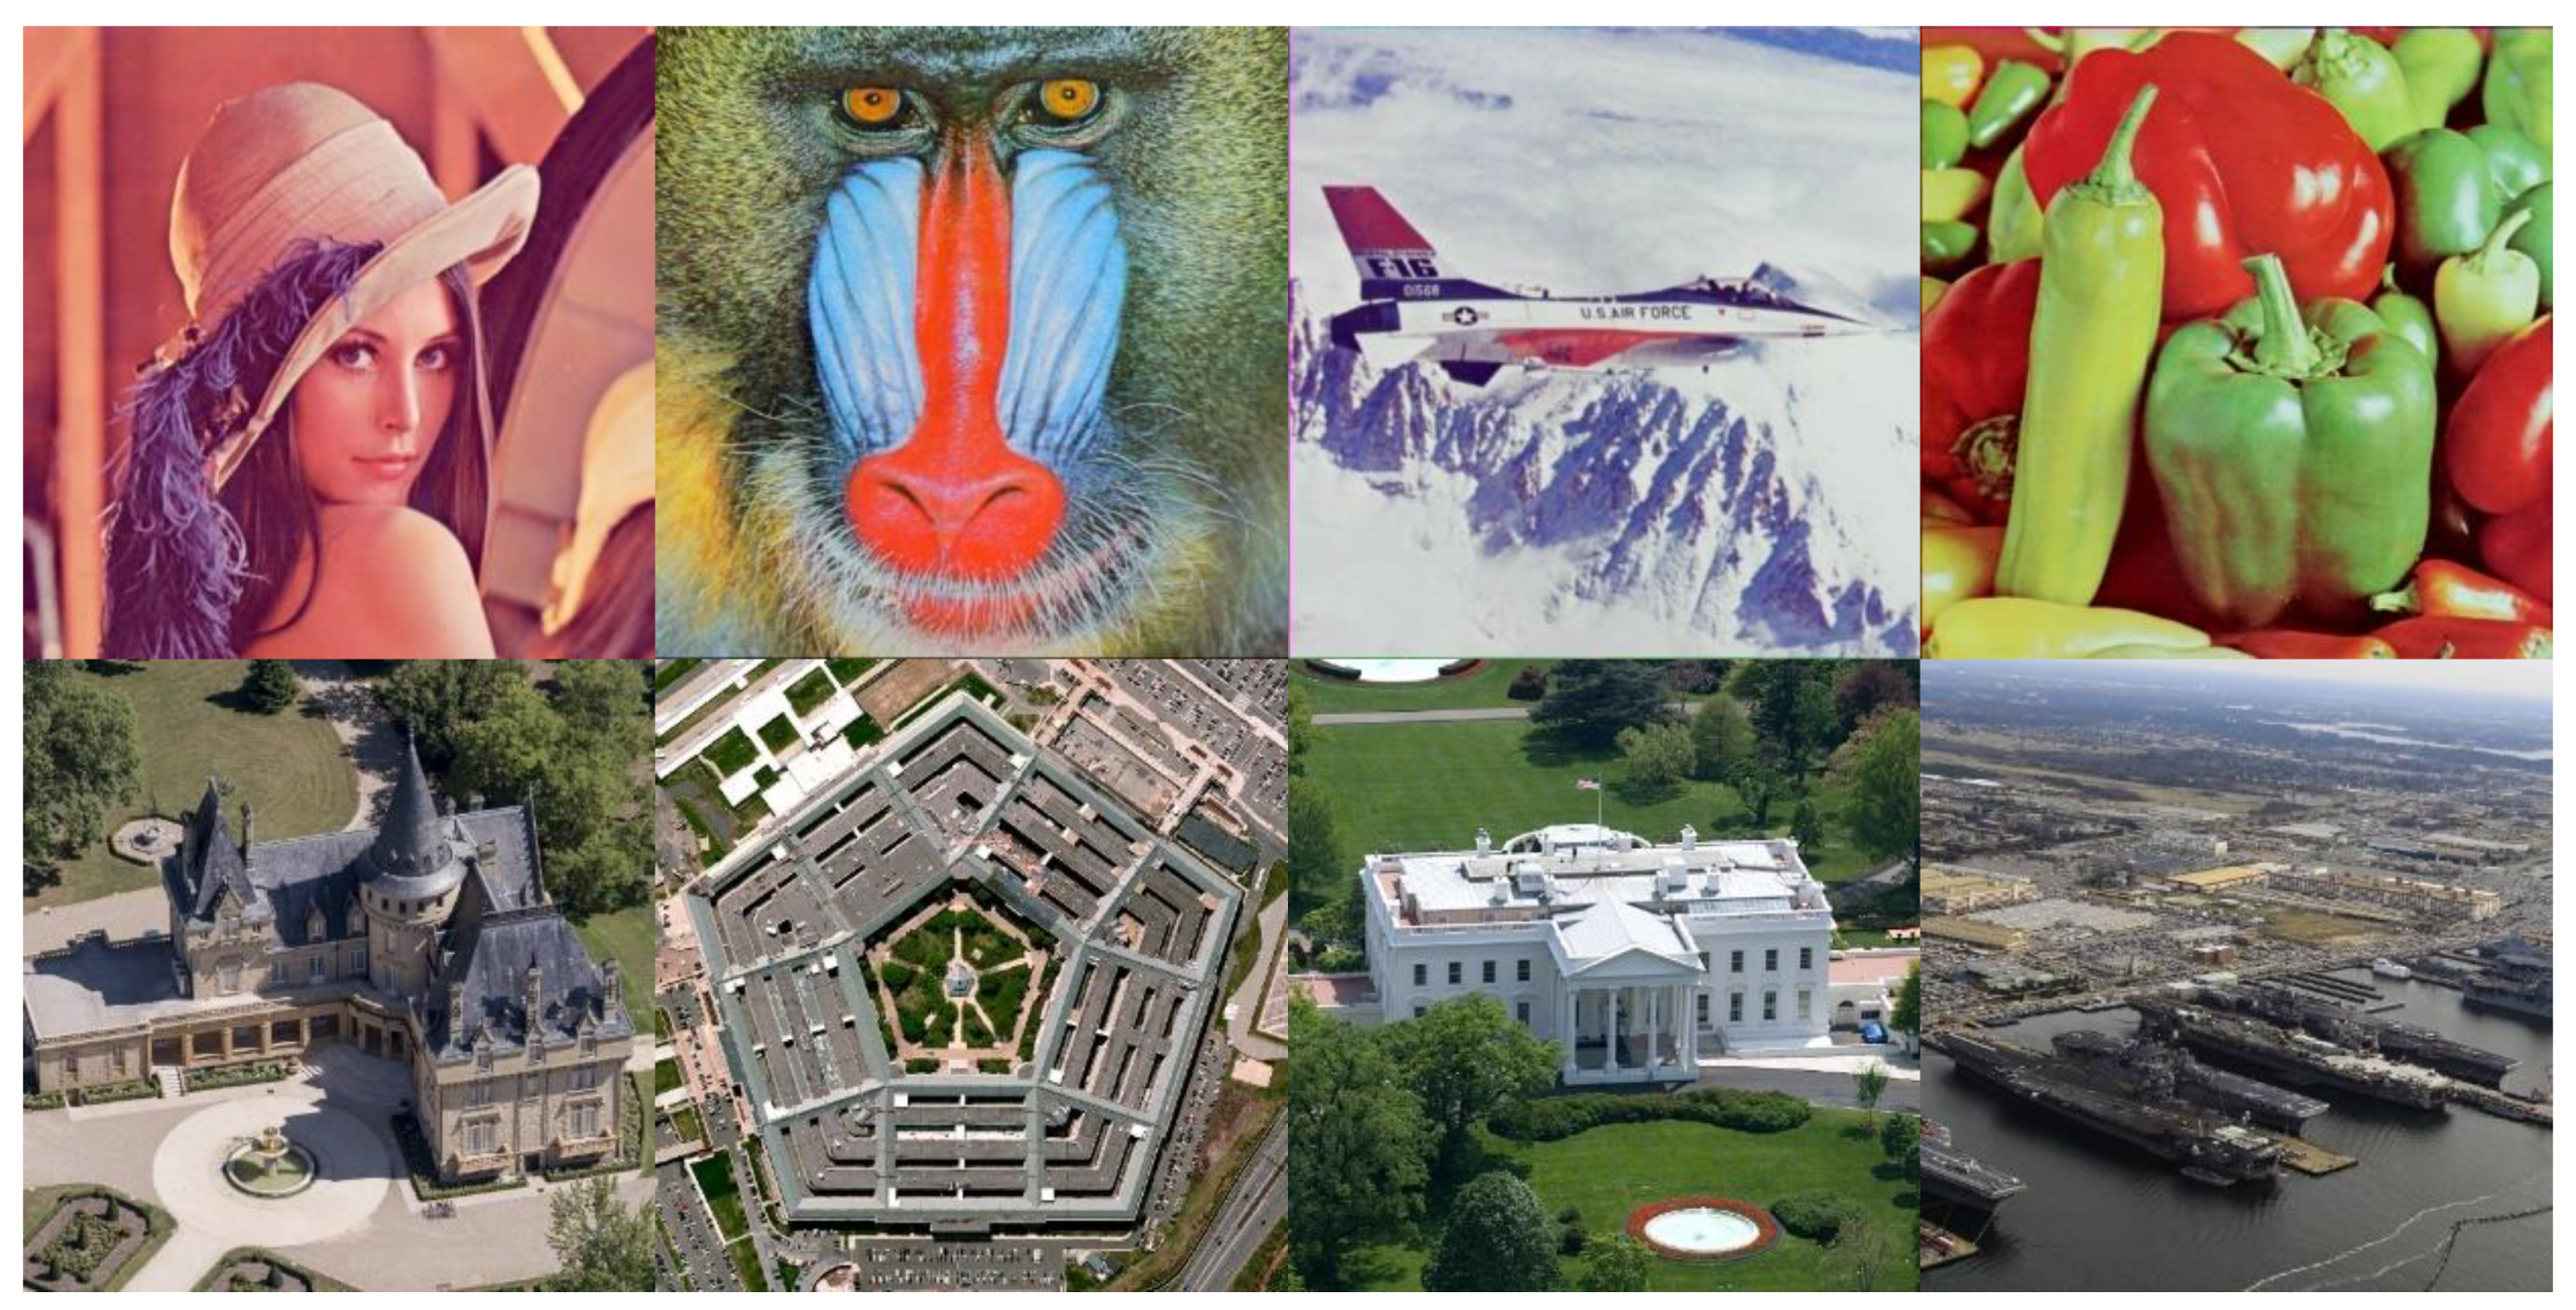
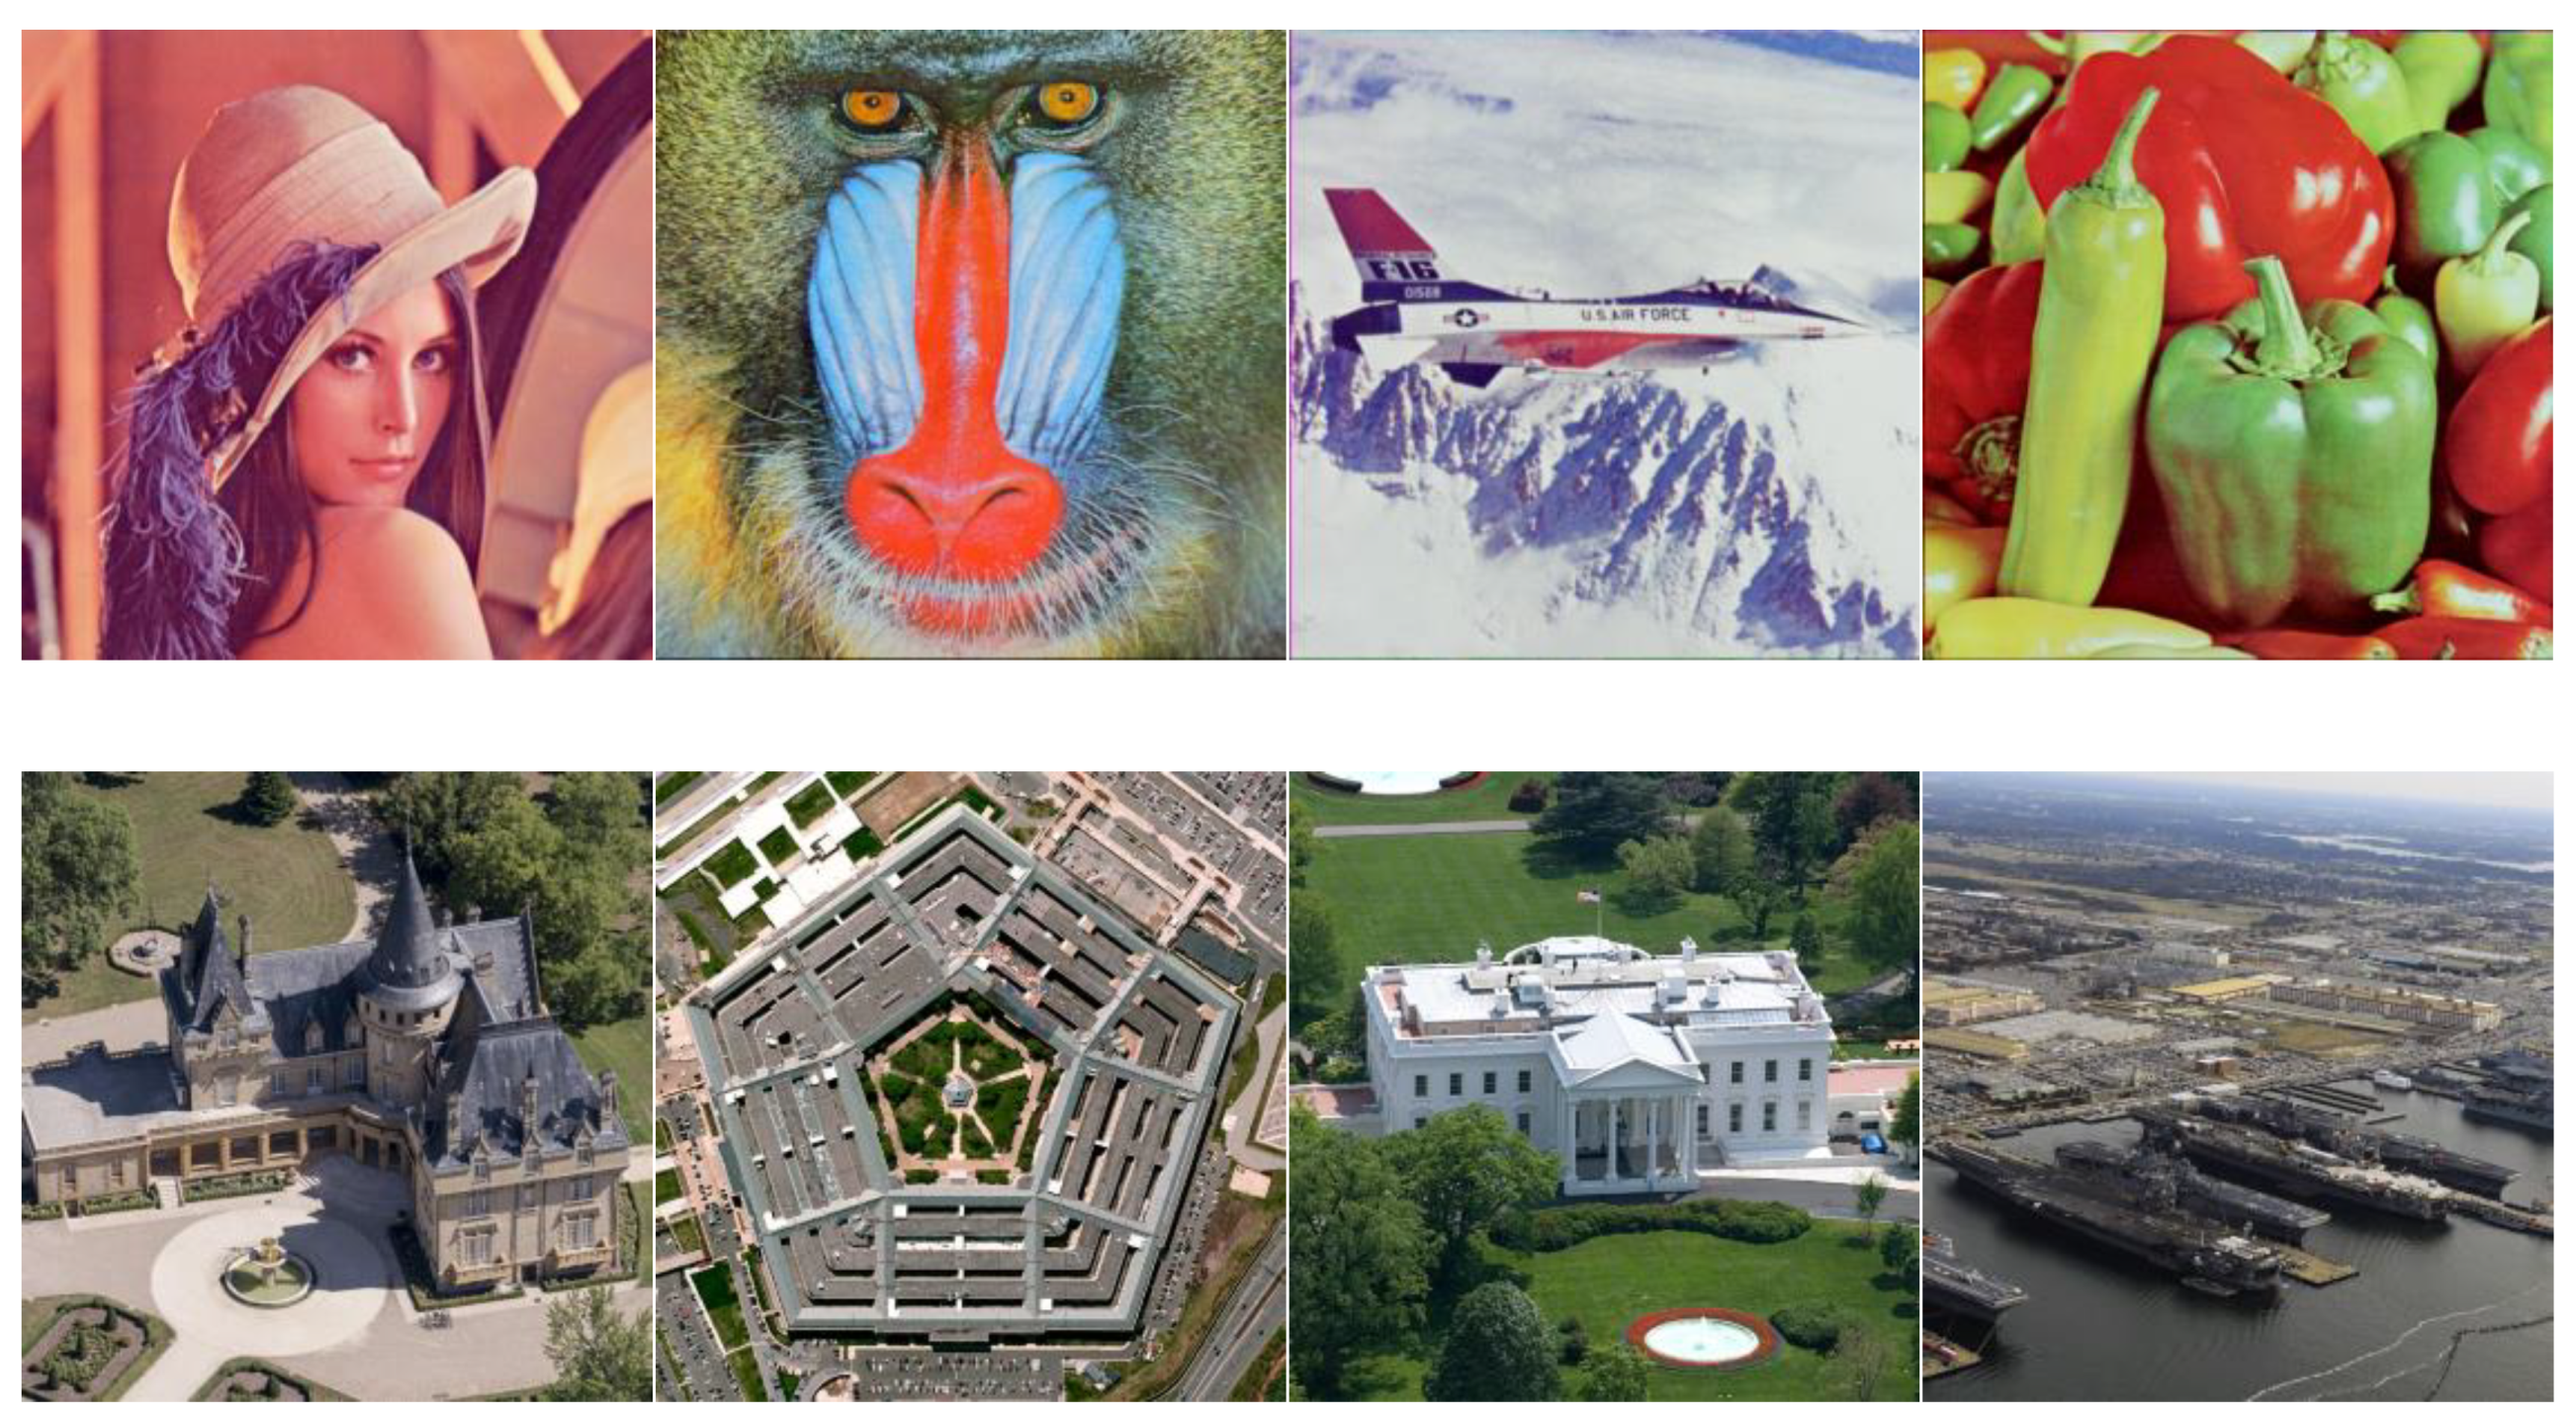
Figure 2.
Host images: Lena, Baboon, Airplane, Peppers, Building, Pentagon, White House, and Naval Base.
Figure 2.
Host images: Lena, Baboon, Airplane, Peppers, Building, Pentagon, White House, and Naval Base.

Figure 3.
The variations of feature points in screen-cam process.

Figure 4.
The construction process of local square feature regions in 1024 × 1024 Lena image. (a) Luminance image of Lena after a Gaussian function. (b) The extracted feature points by modified Harris–Laplace. (c) The associated orientation. (d) The associated LSFRs.
Figure 4.
The construction process of local square feature regions in 1024 × 1024 Lena image. (a) Luminance image of Lena after a Gaussian function. (b) The extracted feature points by modified Harris–Laplace. (c) The associated orientation. (d) The associated LSFRs.

Figure 5.
The selected local square feature regions (LSFRs) for watermark embedding of eight host images.
Figure 5.
The selected local square feature regions (LSFRs) for watermark embedding of eight host images.

Figure 6.
Detailed variations of discrete Fourier transform (DFT) coefficient magnitudes during screen-cam process. (a): Original image spectrum in the log domain. (b,c): Difference in log DFT magnitudes of original image and captured image at a vertical distance of 30 and 50 cm.
Figure 6.
Detailed variations of discrete Fourier transform (DFT) coefficient magnitudes during screen-cam process. (a): Original image spectrum in the log domain. (b,c): Difference in log DFT magnitudes of original image and captured image at a vertical distance of 30 and 50 cm.

Figure 7.
Framework of watermark embedding process.

Figure 8.
Framework of watermark detection process.

Figure 9.
Schematic diagram of correction process.

Figure 10.
Magnitude coefficients before (a) and after (b) screen-cam.

Figure 11.
Influence of different embedding radii.

Figure 12.
Erroneous bits corresponding to different message extraction thresholds.

Figure 13.
Influence of different thresholds on (a) false-positive rate of one LSFR and on true-positive rate between different (b) keys and (c) images.
Figure 13.
Influence of different thresholds on (a) false-positive rate of one LSFR and on true-positive rate between different (b) keys and (c) images.

Figure 14.
Watermarked images.

Figure 15.
Comparison of different methods for different shooting conditions.

Figure 16.
Watermark detection results against screen-cam attack. (a) Lena. (b) Baboon. (c) Airplane (d) Peppers. (e) Building. (f) Pentagon. (g) White House. (h) Naval base.
Figure 16.
Watermark detection results against screen-cam attack. (a) Lena. (b) Baboon. (c) Airplane (d) Peppers. (e) Building. (f) Pentagon. (g) White House. (h) Naval base.

Figure 17.
Watermark detection results against screen-cam with common attacks. (a–d) represent scenarios (a–d), respectively.
Figure 17.
Watermark detection results against screen-cam with common attacks. (a–d) represent scenarios (a–d), respectively.


Table 1.
Average number of constructed LSFRs with a different k1.
| k1 | 4.5 | 5 | 5.5 | 6 | 6.5 | 7 | 7.5 | 8 | 8.5 | 9 |
|---|---|---|---|---|---|---|---|---|---|---|
| Side length between 240 and 300 | 3.78 | 3.62 | 3.53 | 0.88 | 0.88 | 1.32 | 1.77 | 1.77 | 0.88 | 0.88 |
| Side length over 300 | 0.00 | 0.00 | 0.00 | 2.65 | 2.65 | 2.20 | 1.77 | 1.77 | 1.77 | 1.77 |
| Total | 3.78 | 3.62 | 3.53 | 3.53 | 3.53 | 3.52 | 3.53 | 3.53 | 2.65 | 2.65 |
Table 2.
Performance of image quality and robustness against common attacks.
| Host Image | Lena | Baboon | Airplane | Peppers | Building | Pentagon | White House | Naval Base | |
|---|---|---|---|---|---|---|---|---|---|
| PSNR (dB) | 42.3166 | 44.0559 | 43.7674 | 43.0367 | 42.4984 | 43.4840 | 44.1091 | 42.7127 | |
| MSSIM | 0.9544 | 0.9831 | 0.9659 | 0.9564 | 0.9733 | 0.9890 | 0.9839 | 0.9894 | |
| BER | JPEG 40% | 0 | 0.0667 | 0 | 0.0833 | 0.0667 | 0.0333 | 0.0333 | 0.1000 |
| JPEG 30% | 0 | 0.0833 | 0 | 0.1167 | 0.0833 | 0.0500 | 0.0500 | 0.0833 | |
| JPEG 20% | 0 | 0.0667 | 0 | 0.2833 | 0.0500 | 0.0333 | 0.1167 | 0.1167 | |
| JPEG 10% | 0.0667 | 0.2333 | 0.1500 | 0.4167 | 0.1333 | 0.1000 | 0.2500 | 0.2167 | |
| Scaling 0.6 | 0 | 0.0500 | 0 | 0.0333 | 0.0833 | 0.0500 | 0.0333 | 0.0333 | |
| Scaling 0.5 | 0 | 0.0500 | 0 | 0.0500 | 0.0500 | 0.0667 | 0.0333 | 0.0500 | |
| Scaling 0.4 | 0 | 0.0333 | 0 | 0.2167 | 0.1167 | 0.0500 | 0.0333 | 0.0833 | |
| Scaling 0.3 | 0.1667 | 0.4000 | 0.3500 | 0.4500 | 0.4500 | 0.4667 | 0.4667 | 0.3500 | |
| Cropping-off 20% | 0 | 0 | 0 | 0 | 0 | 0 | 0 | 0 | |
| Cropping-off 30% | 0 | 0 | 0 | 0 | 0 | 0 | 0 | 0 | |
| Cropping-off 40% | 0 | 0 | 0 | 0 | 0 | 0 | 0 | 0 | |
| Cropping-off 50% | 0 | 0 | 0 | 0 | 0 | 0 | 0 | 0 | |
| Rotation 15° | 0 | 0 | 0 | 0 | 0 | 0 | 0 | 0 | |
| Rotation 30° | 0 | 0 | 0 | 0 | 0 | 0 | 0 | 0 | |
| Rotation 45° | 0 | 0 | 0 | 0 | 0 | 0 | 0 | 0 | |
| Rotation 90° | 0 | 0 | 0 | 0 | 0 | 0 | 0 | 0 | |
| Median filter 3 × 3 | 0 | 0.0667 | 0 | 0.0333 | 0.0333 | 0.0333 | 0.0333 | 0.0667 | |
| Median filter 5 × 5 | 0.0667 | 0.1500 | 0.0500 | 0.4500 | 0.2667 | 0.3000 | 0.4000 | 0.2833 | |
Note: The underlined coefficient represents failed detection.
Table 3.
Images generated by different methods.
| Methods | Pramila et al. [21] | Fang et al. [33] | Proposed |
|---|---|---|---|
| Watermarked images |  |  |  |
| PSNR (dB) | 40.0784 | 42.0148 | 42.3166 |
Table 4.
Examples of Lena recovered from different captured images.
| Horizontal Angle (Left) | Distance | |||||||
|---|---|---|---|---|---|---|---|---|
| 40 cm | 50 cm | 60 cm | 70 cm | 80 cm | 90 cm | 100 cm | 110 cm | |
| 0° |  |  |  |  |  |  |  |  |
| BER | 0 | 0 | 0 | 0 | 0.0333 | 0.0500 | 0.0500 | 0.1167 |
| 15° |  |  |  |  |  |  |  |  |
| BER | 0.0167 | 0 | 0 | 0 | 0.0333 | 0.0167 | 0.0167 | 0.0500 |
| 30° |  |  |  |  |  |  |  |  |
| BER | 0.0167 | 0 | 0 | 0.0167 | 0 | 0.0167 | 0.0167 | 0.0667 |
| 45° |  |  |  |  |  |  |  | |
| BER | 0 | 0 | 0 | 0.1000 | 0.1167 | 0.1167 | 0.1833 | |
| 60° |  |  |  |  |  |  |  | |
| BER | 0.1000 | 0.0500 | 0.0667 | 0.2000 | 0.1667 | 0.3333 | 0.2833 | |
Table 5.
Examples of Handhold Shooting.
| Handhold Scenarios | Example 1 | Example 2 | Example 3 | Example 4 |
|---|---|---|---|---|
| Captured image |  |  |  |  |
| Recovered image |  |  |  |  |
| BER | 0.0167 | 0 | 0.0667 | 0.0833 |
Table 6.
Examples of Four Hypothetical Scenarios.
| Hypothetical Scenario | Scenario (a) | Scenario (b) | Scenario (c) | Scenario (d) |
|---|---|---|---|---|
| Captured image |  |  |  |  |
| Recovered image |  |  |  |  |
Publisher’s Note: MDPI stays neutral with regard to jurisdictional claims in published maps and institutional affiliations. |
© 2020 by the authors. Licensee MDPI, Basel, Switzerland. This article is an open access article distributed under the terms and conditions of the Creative Commons Attribution (CC BY) license (http://creativecommons.org/licenses/by/4.0/).
Share and Cite
MDPI and ACS Style
Chen, W.; Ren, N.; Zhu, C.; Zhou, Q.; Seppänen, T.; Keskinarkaus, A. Screen-Cam Robust Image Watermarking with Feature-Based Synchronization. Appl. Sci. 2020, 10, 7494. https://0-doi-org.brum.beds.ac.uk/10.3390/app10217494
AMA Style
Chen W, Ren N, Zhu C, Zhou Q, Seppänen T, Keskinarkaus A. Screen-Cam Robust Image Watermarking with Feature-Based Synchronization. Applied Sciences. 2020; 10(21):7494. https://0-doi-org.brum.beds.ac.uk/10.3390/app10217494
Chicago/Turabian StyleChen, Weitong, Na Ren, Changqing Zhu, Qifei Zhou, Tapio Seppänen, and Anja Keskinarkaus. 2020. "Screen-Cam Robust Image Watermarking with Feature-Based Synchronization" Applied Sciences 10, no. 21: 7494. https://0-doi-org.brum.beds.ac.uk/10.3390/app10217494
Note that from the first issue of 2016, this journal uses article numbers instead of page numbers. See further details here.