Article

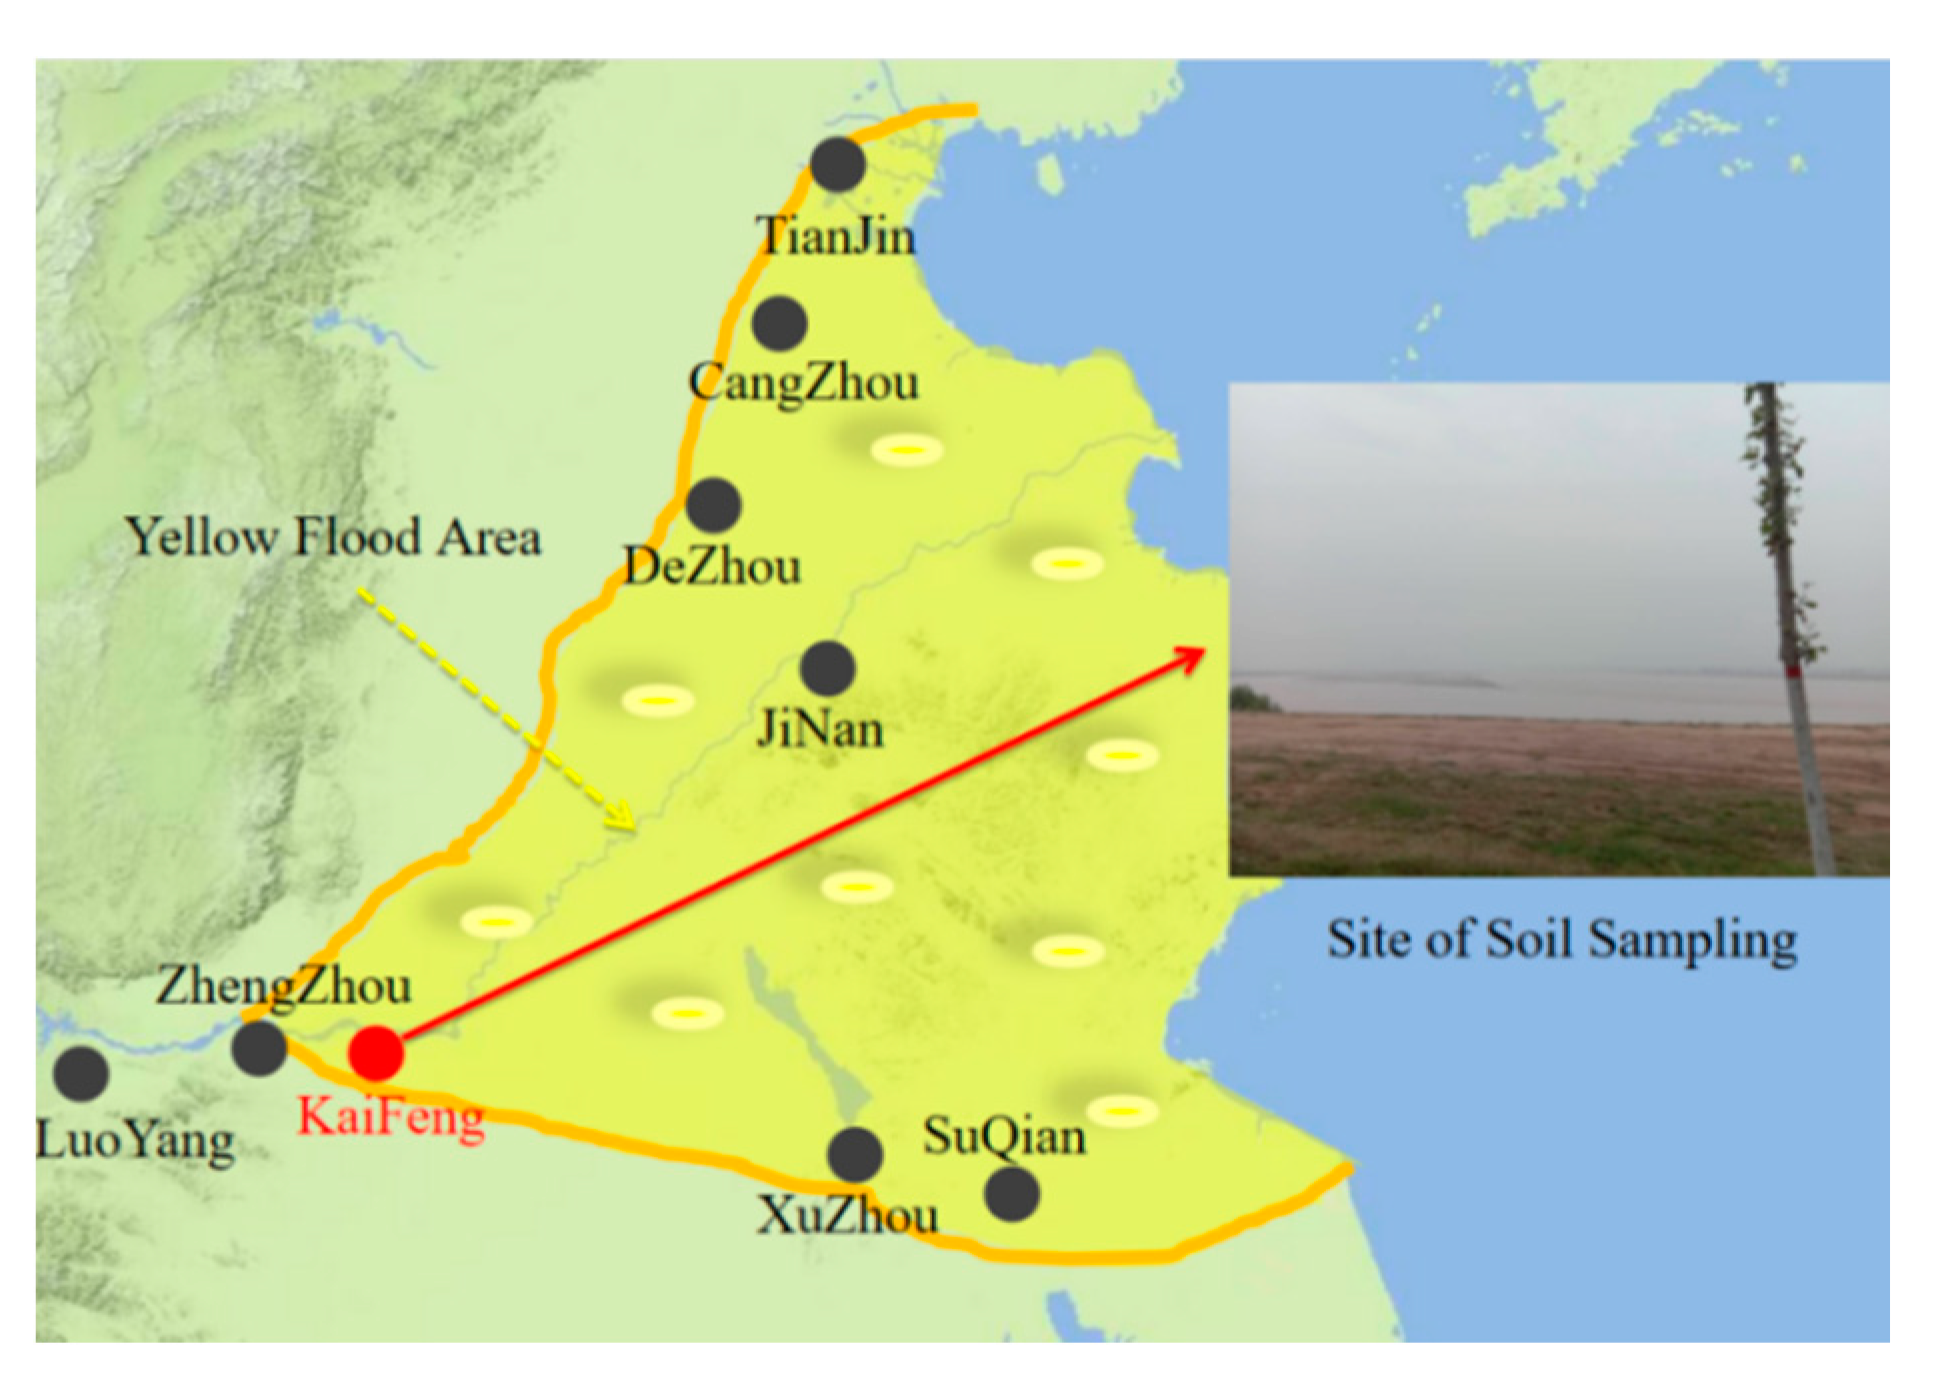
Experimental Study of EICP Combined with Organic Materials for Silt Improvement in the Yellow River Flood Area

1
School of Civil Engineering and Architecture, Henan University, Kaifeng 475004, China
2
Henan Rail Transit Intelligent Construction Engineering Research Center, Kaifeng 475004, China
3
Institute of Geotechnical and Rail Transport Engineering, Henan University, Kaifeng 475004, China
4
Central Plains Development Research Institute, Henan University, Kaifeng 475004, China
*
Authors to whom correspondence should be addressed.
Submission received: 25 September 2020 / Revised: 23 October 2020 / Accepted: 27 October 2020 / Published: 30 October 2020
(This article belongs to the Section Civil Engineering)

Abstract

:
Enzyme-induced carbonate precipitation (EICP) is an emerging biogeotechnical technique that uses free urease to improve soil. Despite its advantages of eliminating complex microbial cultures and reducing reaction byproducts, its efficiency is considered lower than that of microbial induced calcite precipitation (MICP) due to the lack of nucleation sites that induce calcium carbonate deposition. To enhance the strengthening efficiency of EICP for fine-grained soils, an improved EICP method that involves adding an appropriate mass concentration of organic materials (skim milk powder, glutinous rice powder, and brown sugar) into urease solution was proposed and applied to reinforce silt in the Yellow River flood area of China. The preferred concentration and ratio of cementation solution and the optimum concentration of each of the organic materials were determined. Then, the reinforcement effect of the improved EICP at the optimum concentration was compared with the control group, and the reinforcement mechanism for this method was discussed. The results show that after the organic material inclusions, soil strength can be enhanced by 33% compared with EICP-treated soil and is nearly four times higher than that of untreated soil. The superiority of this method over traditional EICP and MICP mainly stems from its ability to provide templates and nucleation sites for calcium carbonate deposition and to improve the size, morphology, and structure of calcium carbonate crystals.

1. Introduction

The mineralization of microorganisms is widespread in nature, and microbial-induced calcite precipitation (MICP) is a new biogeotechnical soil improvement technology based on this idea [1,2,3,4,5,6]. Because of its environmental friendliness and the availability of resources, it has been widely used in soil reinforcement [4,7,8], seepage control [9], anti-liquefaction [10], slope protection [11,12], coastal erosion inhibition [13], fugitive dust prevention [14,15], underground cultural relic repair, metal stability in contaminated soil [16], etc. However, due to the complex cultivation of high-producing urease microorganisms in MICP and the uncontrollability of enzyme activity, scholars are trying to induce calcium carbonate precipitation directly with enzyme-induced carbonate precipitation (EICP), especially urease [17,18] that comes from plant seeds [19,20] such as soybeans [21] and watermelon [22] seeds by means of the urea decomposition method [23,24]. Compared to MICP, urease is the size of a nanometer and the solution is more water soluble, which makes EICP more suitable for fine soil. Free urease can be degraded to avoid negative impacts on the environment [8,23].
However, urease in EICP is in a free state and lacks nucleation sites provided by microbial macromolecules [7,8,9,10,11]. The formed calcium carbonate crystal structure is smaller, which is not conducive to the promotion of strength. The actual effect of soil reinforcement directly with urease is unsatisfactory [25]. To improve the reinforcement effect, many materials have been added to EICP, such as xanthan gum, guar gum, polymers, polyol-cellulose hydrogels [26,27], biopolymers [28], chitosan [29], and milk [30,31]. It was found that EICP with an appropriate amount of skim milk powder can enhance the unconfined compression strength (UCS) of soil by approximately 10 times [30]. Li et al. [31] pointed out that the phosphate group in casein and the carboxyl group on the N-terminus of β-casein are both SerP-SerP-SerP-X-SerP sequences, and calcium ions combine with casein and are salted out, resulting in aggregated casein precipitation that can be used as a center for calcium carbonate nucleation. In addition, scholars analyzed the influence of soil type [32,33,34,35], reaction environment [36,37], and reinforcement method [38] on the reinforcement effect [39,40,41,42] and established theoretical [43] or numerical models [44] to calculate the calcium carbonate precipitation mass during EICP reinforcement.
In this paper, to increase the efficiency of calcium carbonate production during the EICP process and expand its applicable soil type, an improved EICP was produced by adding organic material such as glutinous rice powder, brown sugar, and skim milk powder as a reinforcement for silt in the Yellow River flood area—referred to as China hereafter. A comparative study between silt columns using the improved EICP, traditional EICP, the addition of organic material only, and original untreated soil was conducted to verify the effectiveness of the improved EICP. Scanning electron microscopy (SEM) images and X-ray diffraction (XRD) results were examined to reveal the microscopic mechanics of the improved EICP proposed in this paper.

2. Materials and Methods
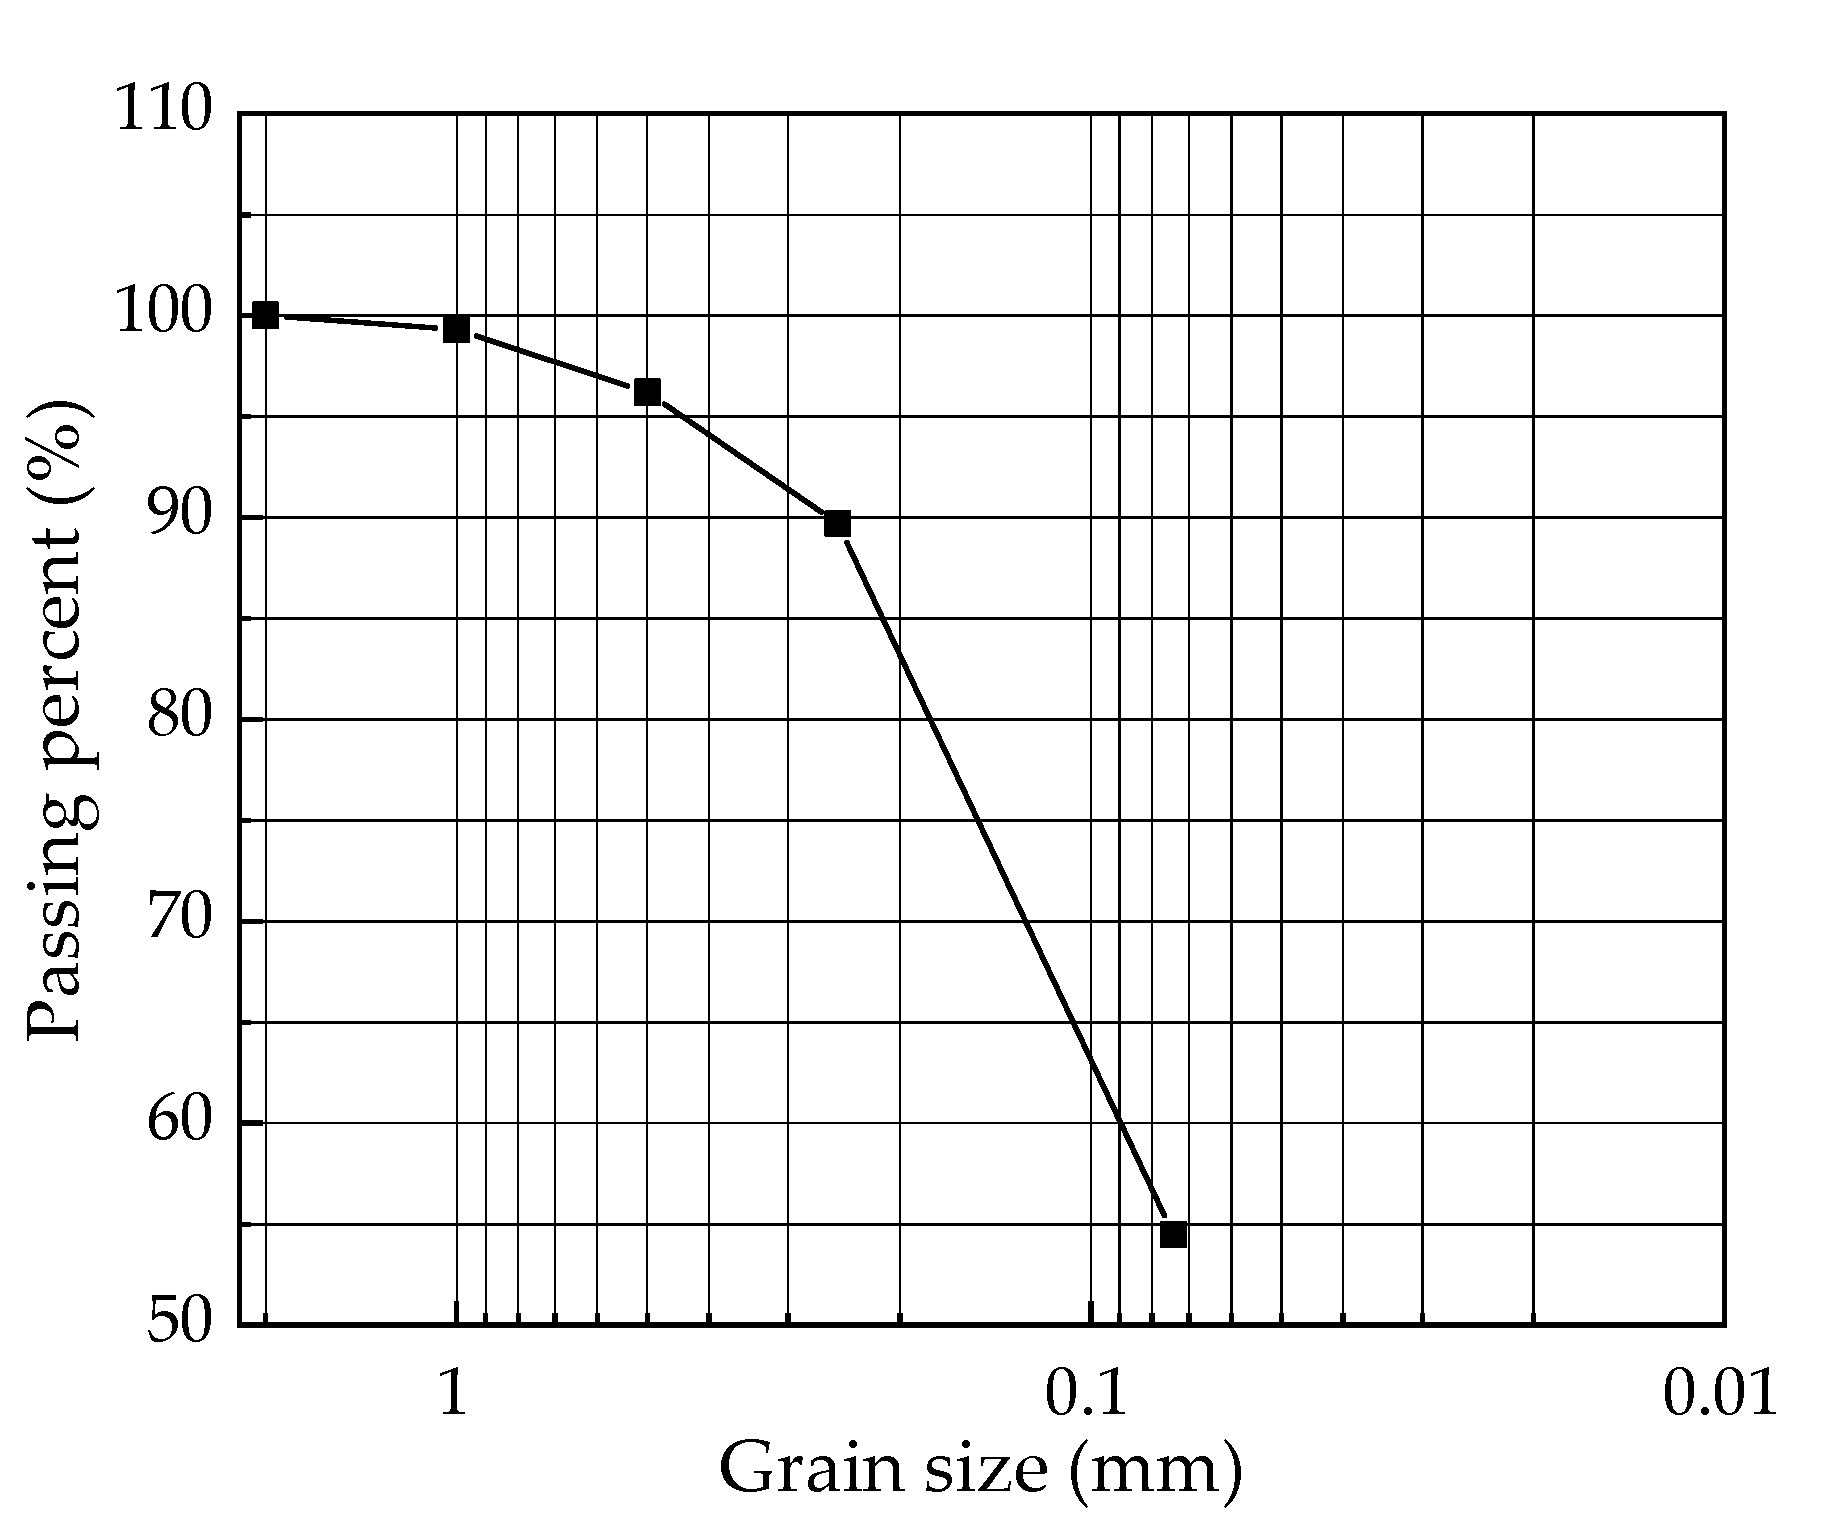
2.1. Materials

When the Yellow River flows through the Loess Plateau, a large amount of sediment is brought about by scour. The silt accumulates in the lower reaches of the Yellow River year after year and the riverbed rises, causing the Yellow River to flood many times throughout history. This led to the formation of a very large alluvial fan silted in the North China Plain. The Yellow River flood area in eastern Henan Province belongs to the Quaternary sedimentary plain landform. The surface layer is new alluvium silty soil from the Quaternary. The soil particles in this area are loose, with high compressibility, poor adhesion between particles, and low strength, and the optimal water content is difficult to control. The test samples were taken from the silt of Yellow River Beach in northern Kaifeng, China. Figure 1 shows the location of the Yellow River flood area and the sampling site.
The basic physical parameters of the soil are shown in Table 1, and the soil particle size distribution is shown in Figure 2. The uniformity coefficient Cu = 7.48 and the curvature coefficient Cc = 1.20 were calculated by the interpolation method, which conforms to Cu > 5 and Cc = 1 ~ 3 and suggests that the soil particle grade is good. The mass of particles with particle sizes greater than 0.075 mm accounted for 45.5% of the total mass, and the plasticity index Ip was 9.96, indicating that the soil is a type of silty soil.
The extraction method for soybean urease used in the experiment was based on the method described by Wang et al. [2]. The soybeans were placed in an oven and baked at 40 °C for 6 h. Then they were crushed with a crusher and passed through a No. 6 sieve (0.15 mm). Finally, the soybean powder and deionized water were added to a conical flask at a mass concentration of 100 g/L and mixed in an electromagnetic mixer for 30 min. After being centrifuged at 3000 r/min for 30 min, the soybean dregs were removed by filtration. The remaining liquid was left in the refrigerator overnight, and the supernatant was urease solution. The treatment solution comprised a mixture of urease and cementation solution, which is made up of calcium chloride and urea at a required ratio.
Three representative organic materials, glutinous rice powder, brown sugar, and skim milk powder, were employed in the treatment solution [30,45]. The glutinous rice powder contained 7.6% protein, 1% fat, 77% carbohydrates, and 0.22% minerals. The brown sugar contained 0.53% protein, 93.6% carbohydrates, and 1.45% minerals. The skim milk powder included 31.8% protein, 1.5% fat, 48% carbohydrates, and 8.4% minerals.

2.2. Tube Tests

2.2.1. Effect of Constituent Concentrations and Ratios of Cementation Solution

To optimize the constituent concentrations of the cementation solution and enhance the carbonate precipitation mass, a series of 15 precipitation tests was performed in 50 mL test tubes containing 36 mL of cementation solution and 4 mL of enzyme solution without any soil. The CaCl2 concentration varied from 0.5 to 1.5 M, and the ratio of CaCl2:urea varied from 1:0.75 to 1:1.75, according to previous studies [6,32,40,41,46]. The initial pH was adjusted to 7 [36]. The test tubes were incubated in an environment of 16 ± 2 °C for 3 days. According to the standard water-quality determination of calcium-ethylene diamine tetraacetic acid (EDTA) titrimetric method (GB/T 7476-1987), the calcium ion concentration was directly determined by the aqueous solution in vitro. All tube tests were conducted in triplicate. The average value of calcium ion concentration measured in each test (three samples) was taken and the precipitation mass was calculated according to the difference in the calcium ion concentration before and after the tests.

2.2.2. Effect of Cementation Solution Concentration on the Reaction

It is very important to control the reaction time between the urease and cementation solution when EICP is used to strengthen soil during practical engineering projects. To study the influence of cementation solution concentrations on the amount of carbonate precipitation and reaction rate, 4 precipitation tests with a cementation solution (CaCl2:urea = 1:1.5) concentration of 0.8 M, 1.6 M, 2.4 M, and 3.2 M were performed. A total of 12 samples was prepared in 500 mL beakers including 400 mL of the treatment solution (urease:cementation solution = 1:1). The reaction was carried out for 7 days. EDTA titration was used to measure the calcium ion concentration at different times in the reaction, which is convenient for real-time measurement in the solution and is widely used in water-quality detection. For the first day, the calcium ion concentration was measured every 2 h, 4 h, 8, h and 12 h, and for the next day, it was measured every 12 h, for a total of 2 measurements. Then it was measured every 24 h. The precipitation ratio, which was defined as the ratio of the precipitation mass to the theoretical maximum amount of calcium precipitation, was obtained.

2.3. Soil Reinforcement Tests

2.3.1. Sample Preparation

To seek the optimum concentration of each organic material, 19 different EICP treatment solutions composed of 2.8 M calcium chloride, 4.2 M urea, and 100 g/L urease were applied for soil treatment. These concentrations were selected based on tube tests. In 18 of the 19 cases, one kind of organic material—skim milk powder, glutinous rice powder, or brown sugar, with mass concentrations of 2 g/L, 4 g/L, 6 g/L, 8 g/L, 16 g/L, and 32 g/L—were added to the treatment solution separately on the basis of the skim milk powder concentration used by Almajed et al. [30], and the remaining one had no addition. Another three solutions were prepared with deionized water, each containing one kind of organic material alone. A total of 23 kinds of treatment methods were researched. The untreated soil, EICP-treated soil, and soil reinforced by one kind of organic material alone were used for the comparative test (Table 2).
Samples were prepared by the mixing method according to the standard for the geotechnical testing method (GB/T 50123-2019). The amount of treatment solution required was calculated to guarantee consistency in the parameters between the prepared soil and natural soil (Table 1). The untreated soil sample was mixed with deionized water and the other samples were mixed with solutions corresponding to their treatment methods. As urease could react quickly with the cementation solution, it was necessary to mix them separately. After being mixed and compacted, the wet soil was put in the corresponding molds in batches and sealed in a curing box with constant temperature (25 °C) and constant humidity (90%) for 7 d.

2.3.2. Tests and Methods

After the samples were dried in an oven at 105 °C, the UCS test at a loading rate of 0.5 mm/min and Brazilian tensile strength (BTS) test at a shear displacement rate of 0.2 mm/min were conducted separately according to GB/T 50123-2019 and ASTM C496/C496M-2017. The cylinder mold used in the UCS test was 39.1 mm in diameter and 80 mm in height and the cylinder mold used for the BTS test was 61.5 mm in diameter and 20 mm in height.
After the strength tests, 30 g of material were taken from the top, middle, and bottom parts of each sample and used for the measurement of calcium carbonate content (CCC). The test materials were placed into the vacuum filter. First, deionized water was added to filter out the undeposited calcium ions. Then diluted hydrochloric acid was added and reacted until no bubbles were generated. The soluble salt in the sample was thoroughly filtered by stirring and washing with deionized water several times. EDTA experiments were performed on the filtrated solution of hydrochloric acid to obtain the CCC according to the measured calcium ion concentration.
Microscopic images of some samples before and after the tests were observed using optical microscopy, universal serial bus (USB) handheld digital microscopy, and SEM at magnifications of 1000 and 5000 times, and XRD tests were performed to analyze the constituents, internal structures, and morphology of soils treated by different methods.
The strength and CCC measurement tests were conducted in triplicate to guarantee the reliability of the tests. In total, 123 samples were prepared and 148 different tests were performed.

3. Results and Discussions

3.1. Tube Tests

3.1.1. Effect of Constituent Concentrations and Ratios of Cementation Solution

Table 3 shows the precipitation mass for different constituent concentrations and ratios obtained from the tube tests. With a variation of CaCl2:urea from 1:0.75 to 1:1.75, the precipitation mass at the same calcium chloride concentration increased in varying degrees, but the increasing rate decreased with a rise in the urea ratio [46]. This may be due to the small ionic strength of the low-concentration calcium chloride solution and the limit reached for the amount of urea required to minimize the calcium ion mobility by forming hydration shells around the calcium ions. Then, as the ratio increased, the high-concentration solution gradually reached its limit. The precipitation mass of calcium carbonate for the 1:0.75 ratio was much less than that for the 1:1, 1:1.25, 1:1.5, and 1:1.75 ratios. The precipitation masses under the latter four proportions were relatively close, indicating that when the urea ratio was greater than that of calcium chloride, the precipitation mass of calcium carbonate mainly depended on the amount of calcium chloride. Overall, for the lower concentration of the cementation solution when the ratio of CaCl2:urea reached 1:1, the calcium ion strength was inhibited. It is not economical to increase the urea proportion. When the cementation solution concentration was high, the efficiency of calcium carbonate formation with CaCl2:urea maintained at 1:1.5 was the best.

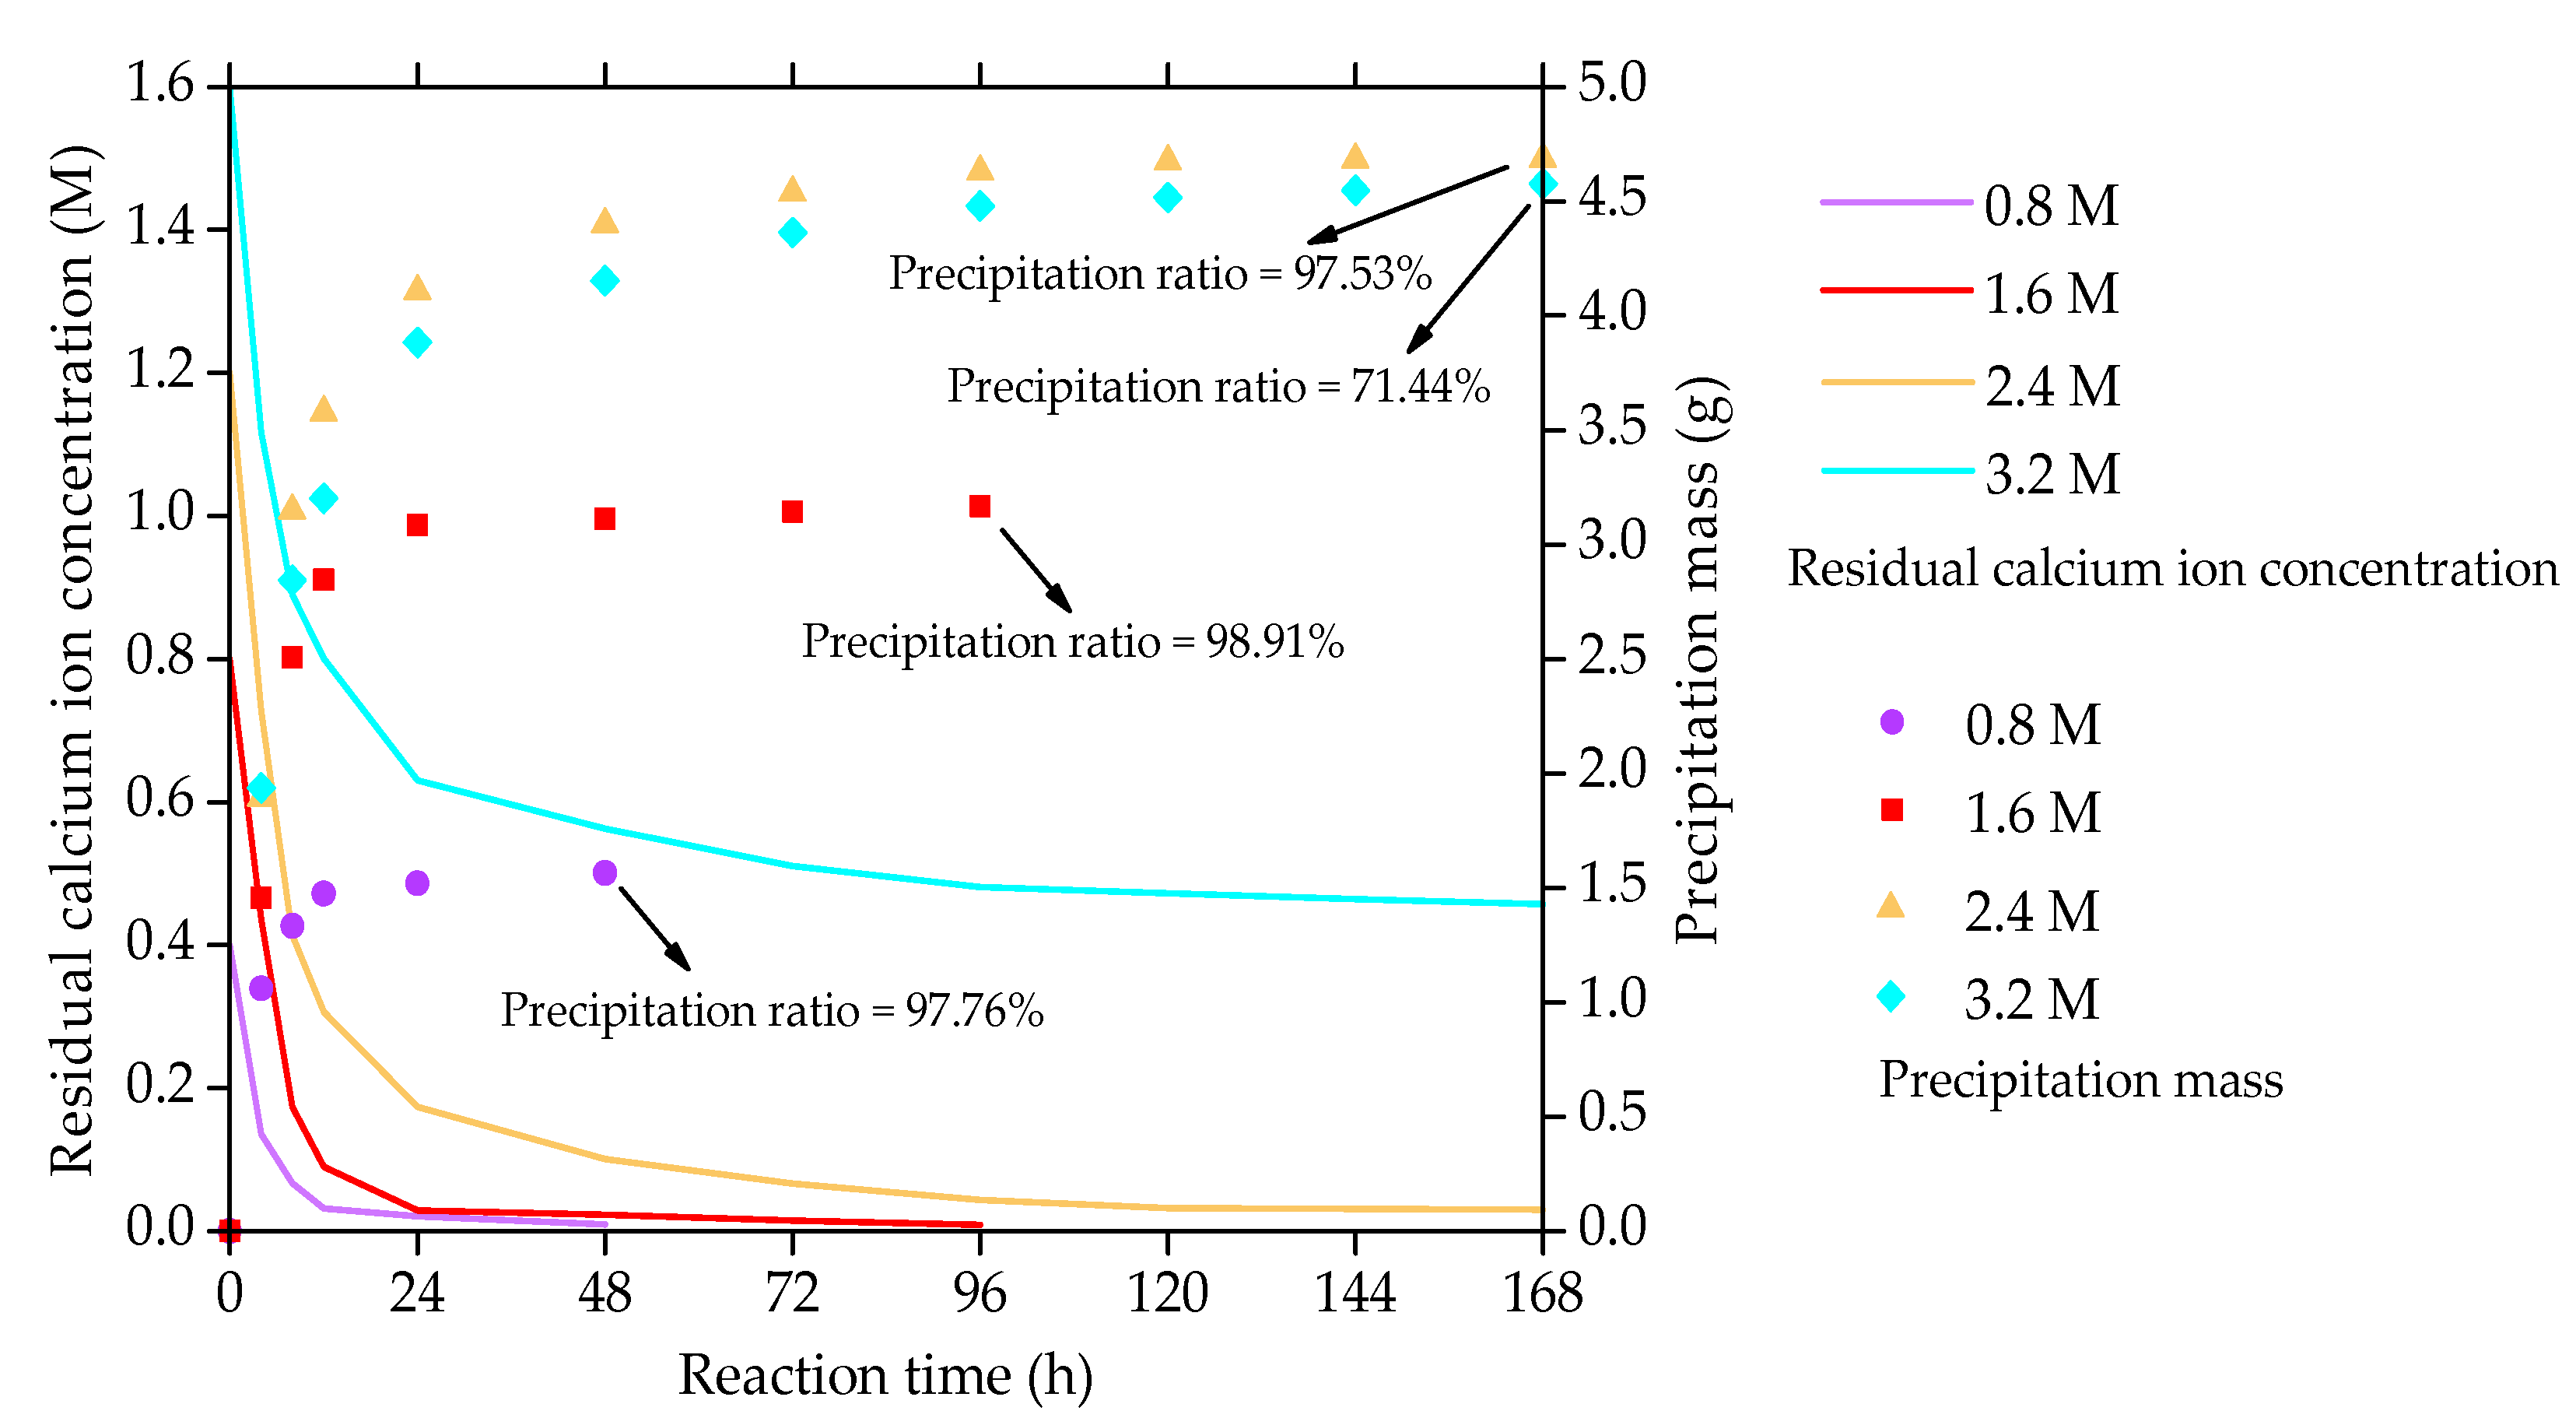
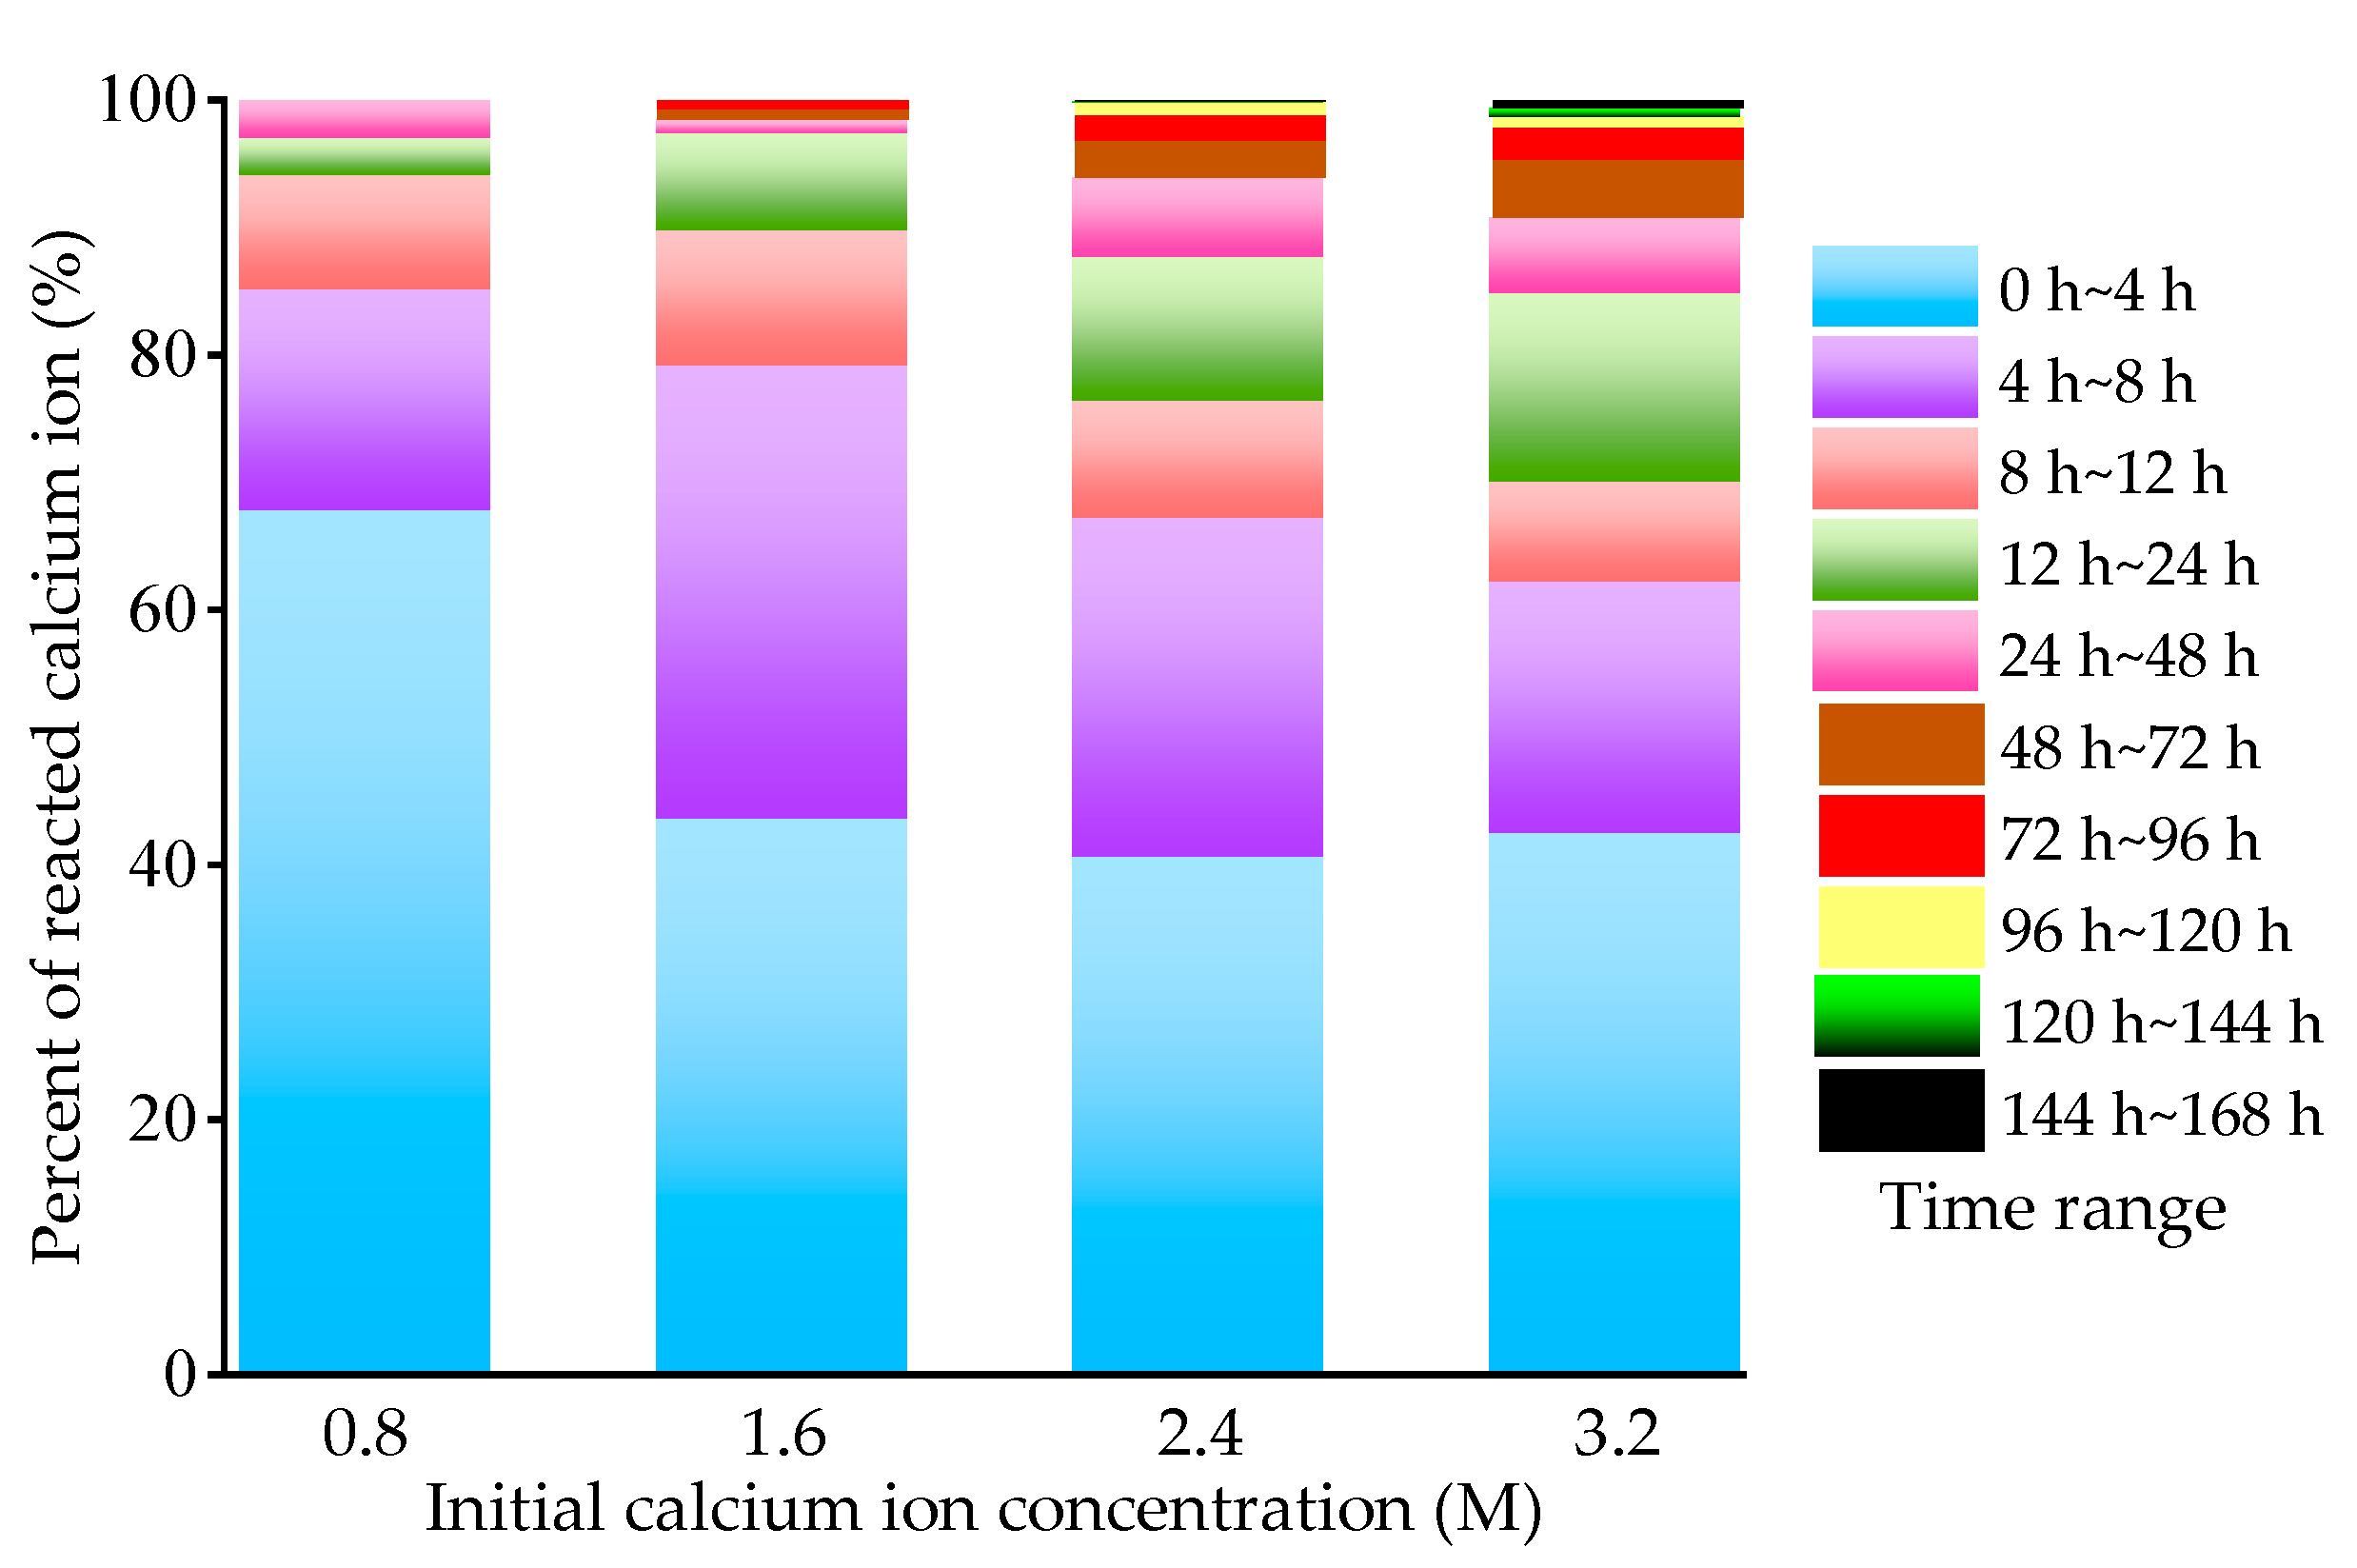
3.1.2. Effect of Cementation Solution Concentration on the Reaction

Figure 3 shows the variation of the residual calcium ion concentration and calcium carbonate precipitation mass as a function of the reaction time. Considering the residual calcium ion concentration of the treatment solution being less than 0.01 M as the end standard of the reaction, the proportion of calcium ions that reacted in each group at different time periods can be plotted to illustrate the precipitation speed of the calcium carbonate (Figure 4). From the change in calcium ion concentration in the solution (Figure 3), the calcium ion concentration in each solution decreased continuously with the reaction of urease and the cementation solution in the aqueous solution. Finally, the reaction stopped. The curve can be roughly divided into three stages: a rapid reaction period, a weak period, and a stable stage. During the first stage, the calcium ion concentration decreased sharply with increasing time, the urease content was sufficient, its activity was the highest, and the calcium ions in solution were also sufficient. In the second stage, the rate of calcium ion concentration continued to decrease. During the third stage, the calcium ion concentration tended to be stable, and the reaction gradually stopped. The reduced reaction rate may be because the extraction of soybean urease required the lysis of the soybean intracellular cells. During the rapid reaction stage, the improved EICP with organic material added could provide a higher initial activity than MICP, but it could be easily inhibited due to the lack of cell structure protection. As the reaction progressed, the urease activity decreased continuously after being oxidized, and the effective calcium source in the solution also decreased gradually, weakening the precipitation efficiency.
As the cementation solution concentration increased from 0.8 M to 2.4 M, the precipitation mass of calcium carbonate continued to increase, but the precipitation mass with a cementation solution concentration of 3.2 M was less than that of 2.4 M. The precipitation ratio of calcium carbonate at a concentration of 1.6 M remained the highest as a result of the relatively high concentration of urease in the low concentration cementation solution and the inhibition action on calcium carbonate precipitation. If the cementation solution concentration was appropriately increased, the calcium carbonate yield improved. When the optimal concentration was exceeded, the urease was inhibited by excessive calcium chloride concentration, which reduced the ability of the urease to hydrolyze the urea and decreased the calcium carbonate yield. Data in Figure 3 and Figure 4 illustrate that the lower the cementation solution concentration was, the shorter the duration of the first stage of reaction and the earlier it entered into the weak and stationary stages. This is because the reaction rate of the low cementation solution concentration was too fast, and the reaction ended sooner.
The proportion of the calcium ion reaction was the largest from 0~4 h under different initial calcium ion concentrations, accounting for 41~68% of the whole reaction (Figure 4). A total of 65~86% of the reaction was completed within 8 h of the start of the reaction, 70~95% of the reaction was accomplished in 12 h, and 87~98% in 24 h. The end time of each solution was different. The reaction stopped at 48 h and 96 h when the cementation solution concentration was 0.8 M and 1.6 M, respectively. The reaction still proceeded slowly after 168 h at a concentration of 2.4 M and 3.2 M. This indicated that the reaction time increased with increasing initial calcium ion concentration. This may be because the low concentration of initial calcium ions did not inhibit the urease activity, and the precipitation process was completed first. When the concentration of calcium ions was high, the urease activity gradually decreased over time, though there was still a sufficient calcium source, and the calcium ion conversion efficiency continued to decrease, thereby delaying the reaction stop time.

3.2. Soil Reinforcement Tests

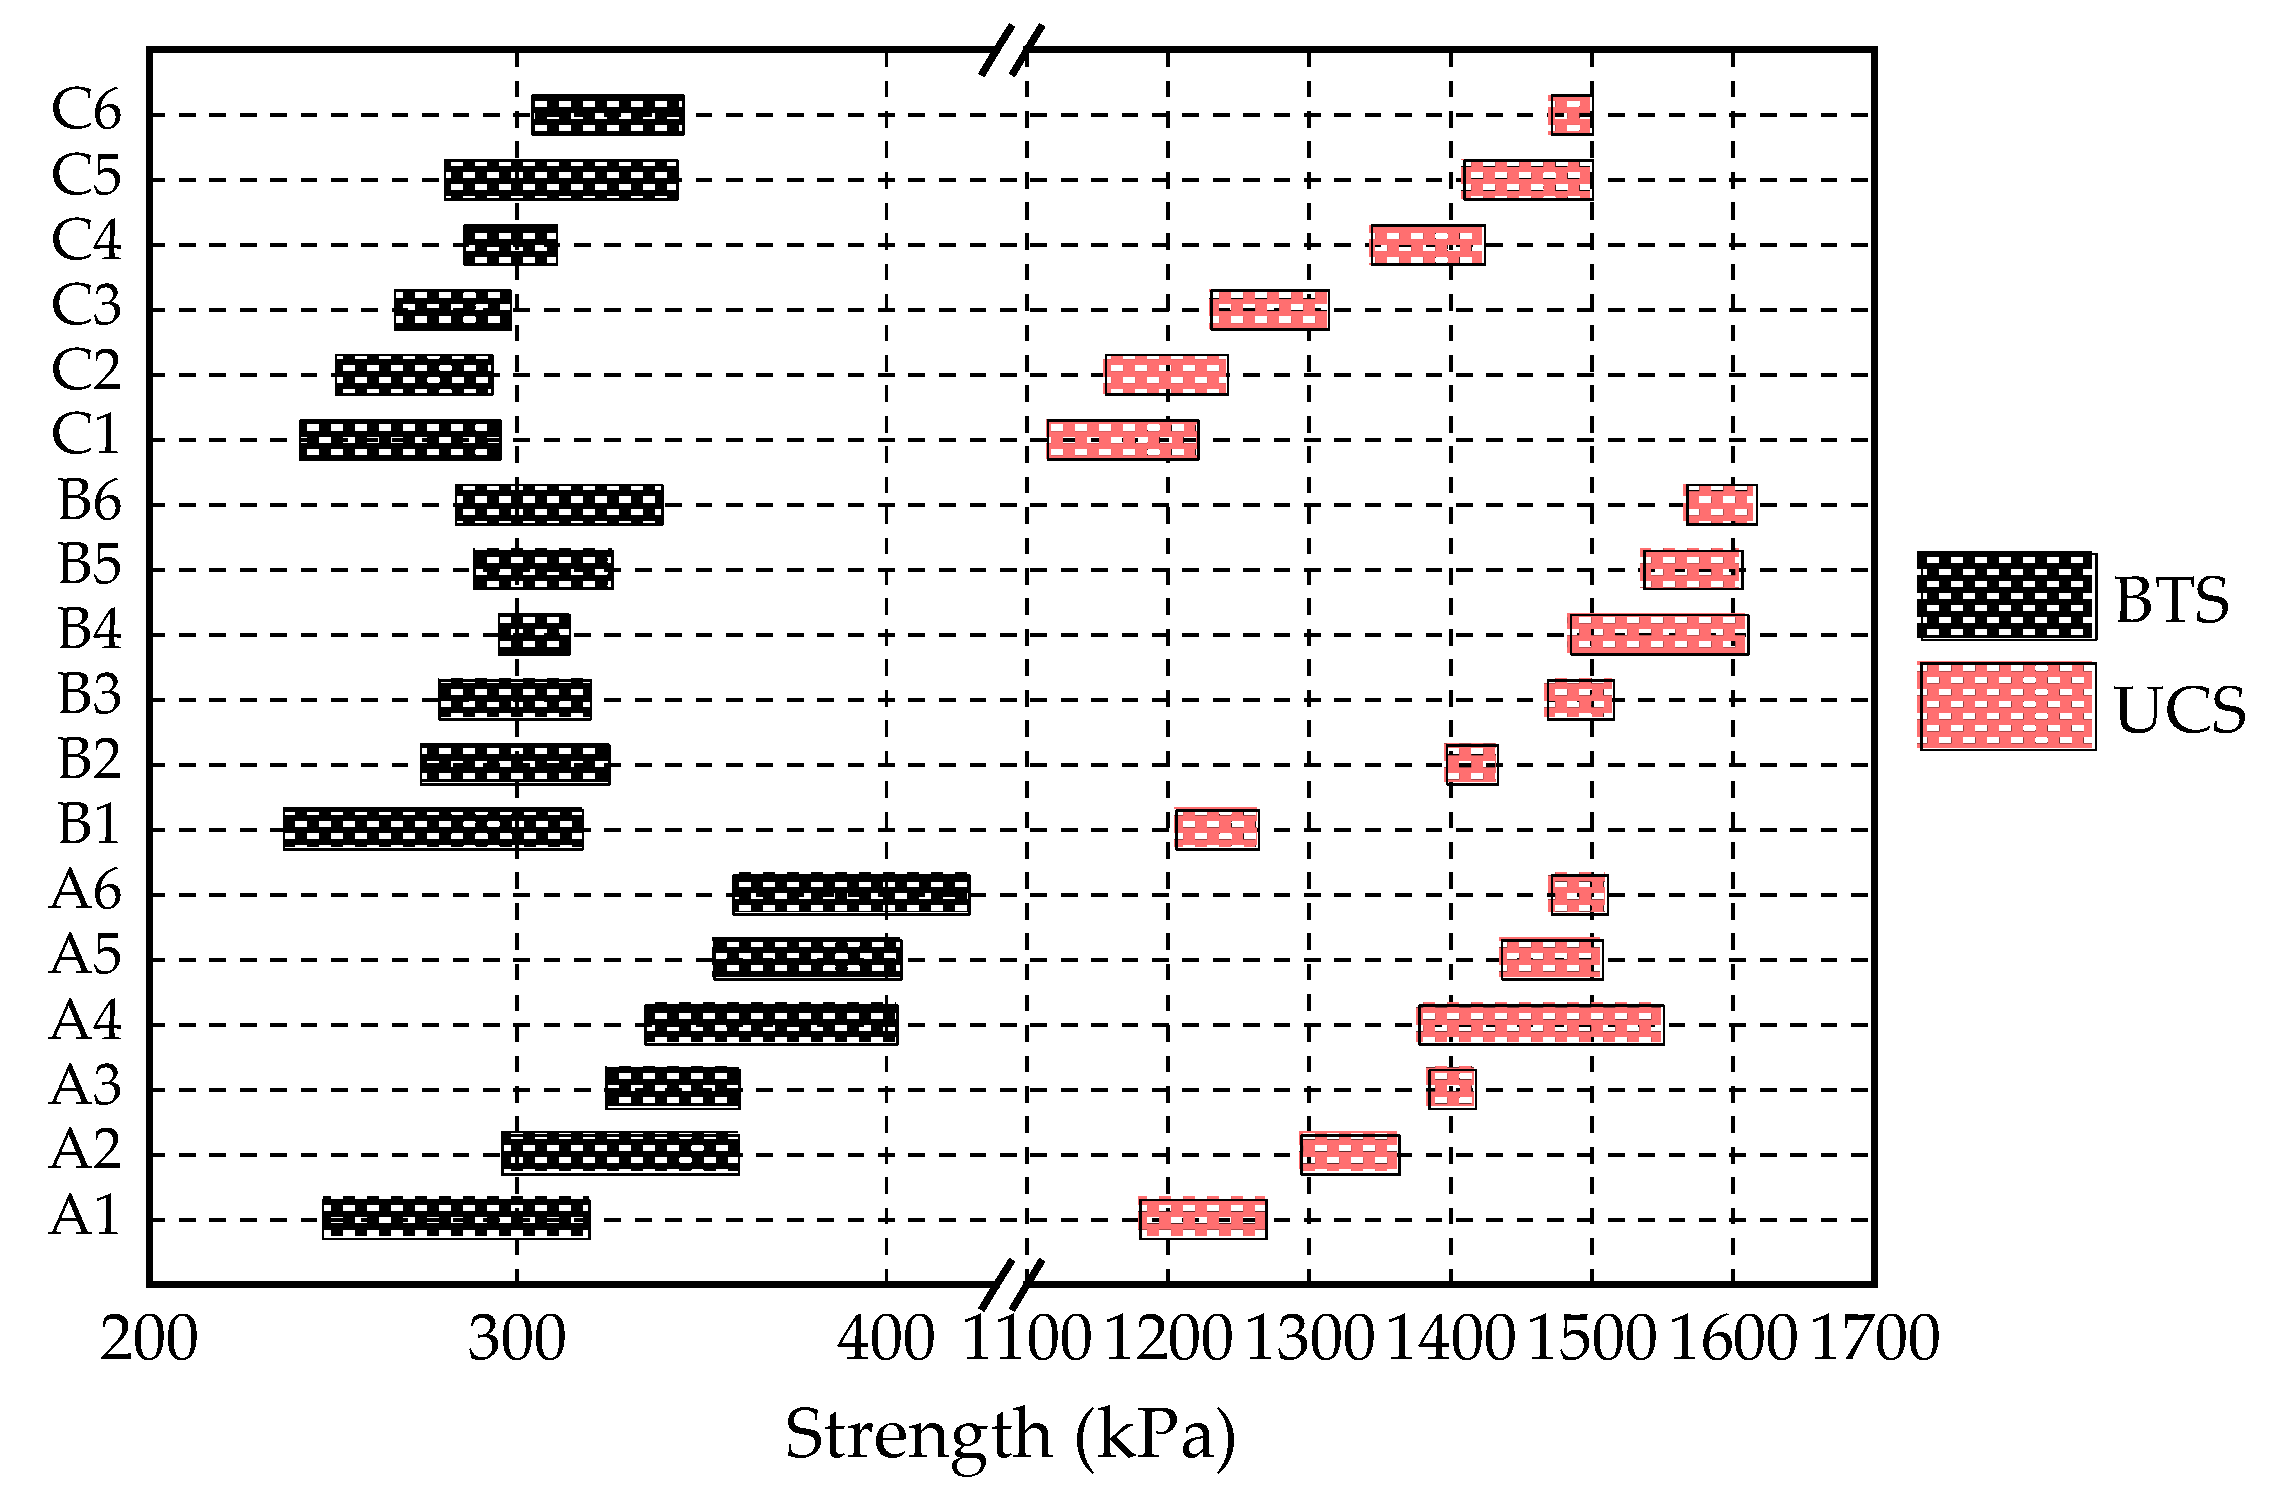
3.2.1. Optimum Concentration of Organic Materials

Figure 5 shows the distribution of the UCS and BTS for soil treated by the improved EICP with organic materials added. With an increase in the concentration of each admixture, the UCS and BTS of the samples increased continuously, which was positively correlated with the added concentration, but the growth was different. The UCS and BTS with skim milk powder were generally the largest herein, followed by glutinous rice powder and brown sugar. When the concentration of skim milk powder increased from 2 g/L to 8 g/L, the UCS and BTS increased by 25.32% and 30.18%, respectively. Beyond this range, the increase rate decreased, indicating that the strength improvement limit was being approached. When the concentration of glutinous rice powder increased from 2 g/L to 8 g/L, the UCS increased by 19.53%, and the increase in the UCS was minimal as it continued to increase. The BTS stopped increasing when the concentration exceeded 4 g/L. When 2 g/L brown sugar was added, both BTS and UCS were low, and the strength increment was larger if the content exceeded 8 g/L. In short, when the concentration of glutinous rice powder and skim milk powder was higher than 16 g/L, the increase in the strength was small and not economical. If brown sugar was added, the effect of brown sugar at a low concentration was not obvious, which may be because brown sugar provided a decreased amount of base mass for templating and nucleation sites. The optimum concentrations for skim milk powder, glutinous rice powder, and brown sugar (α1, α2, and α3) were 8 g/L, 8 g/L, and 16 g/L, corresponding to treatment numbers A4, B4, and C5, respectively.

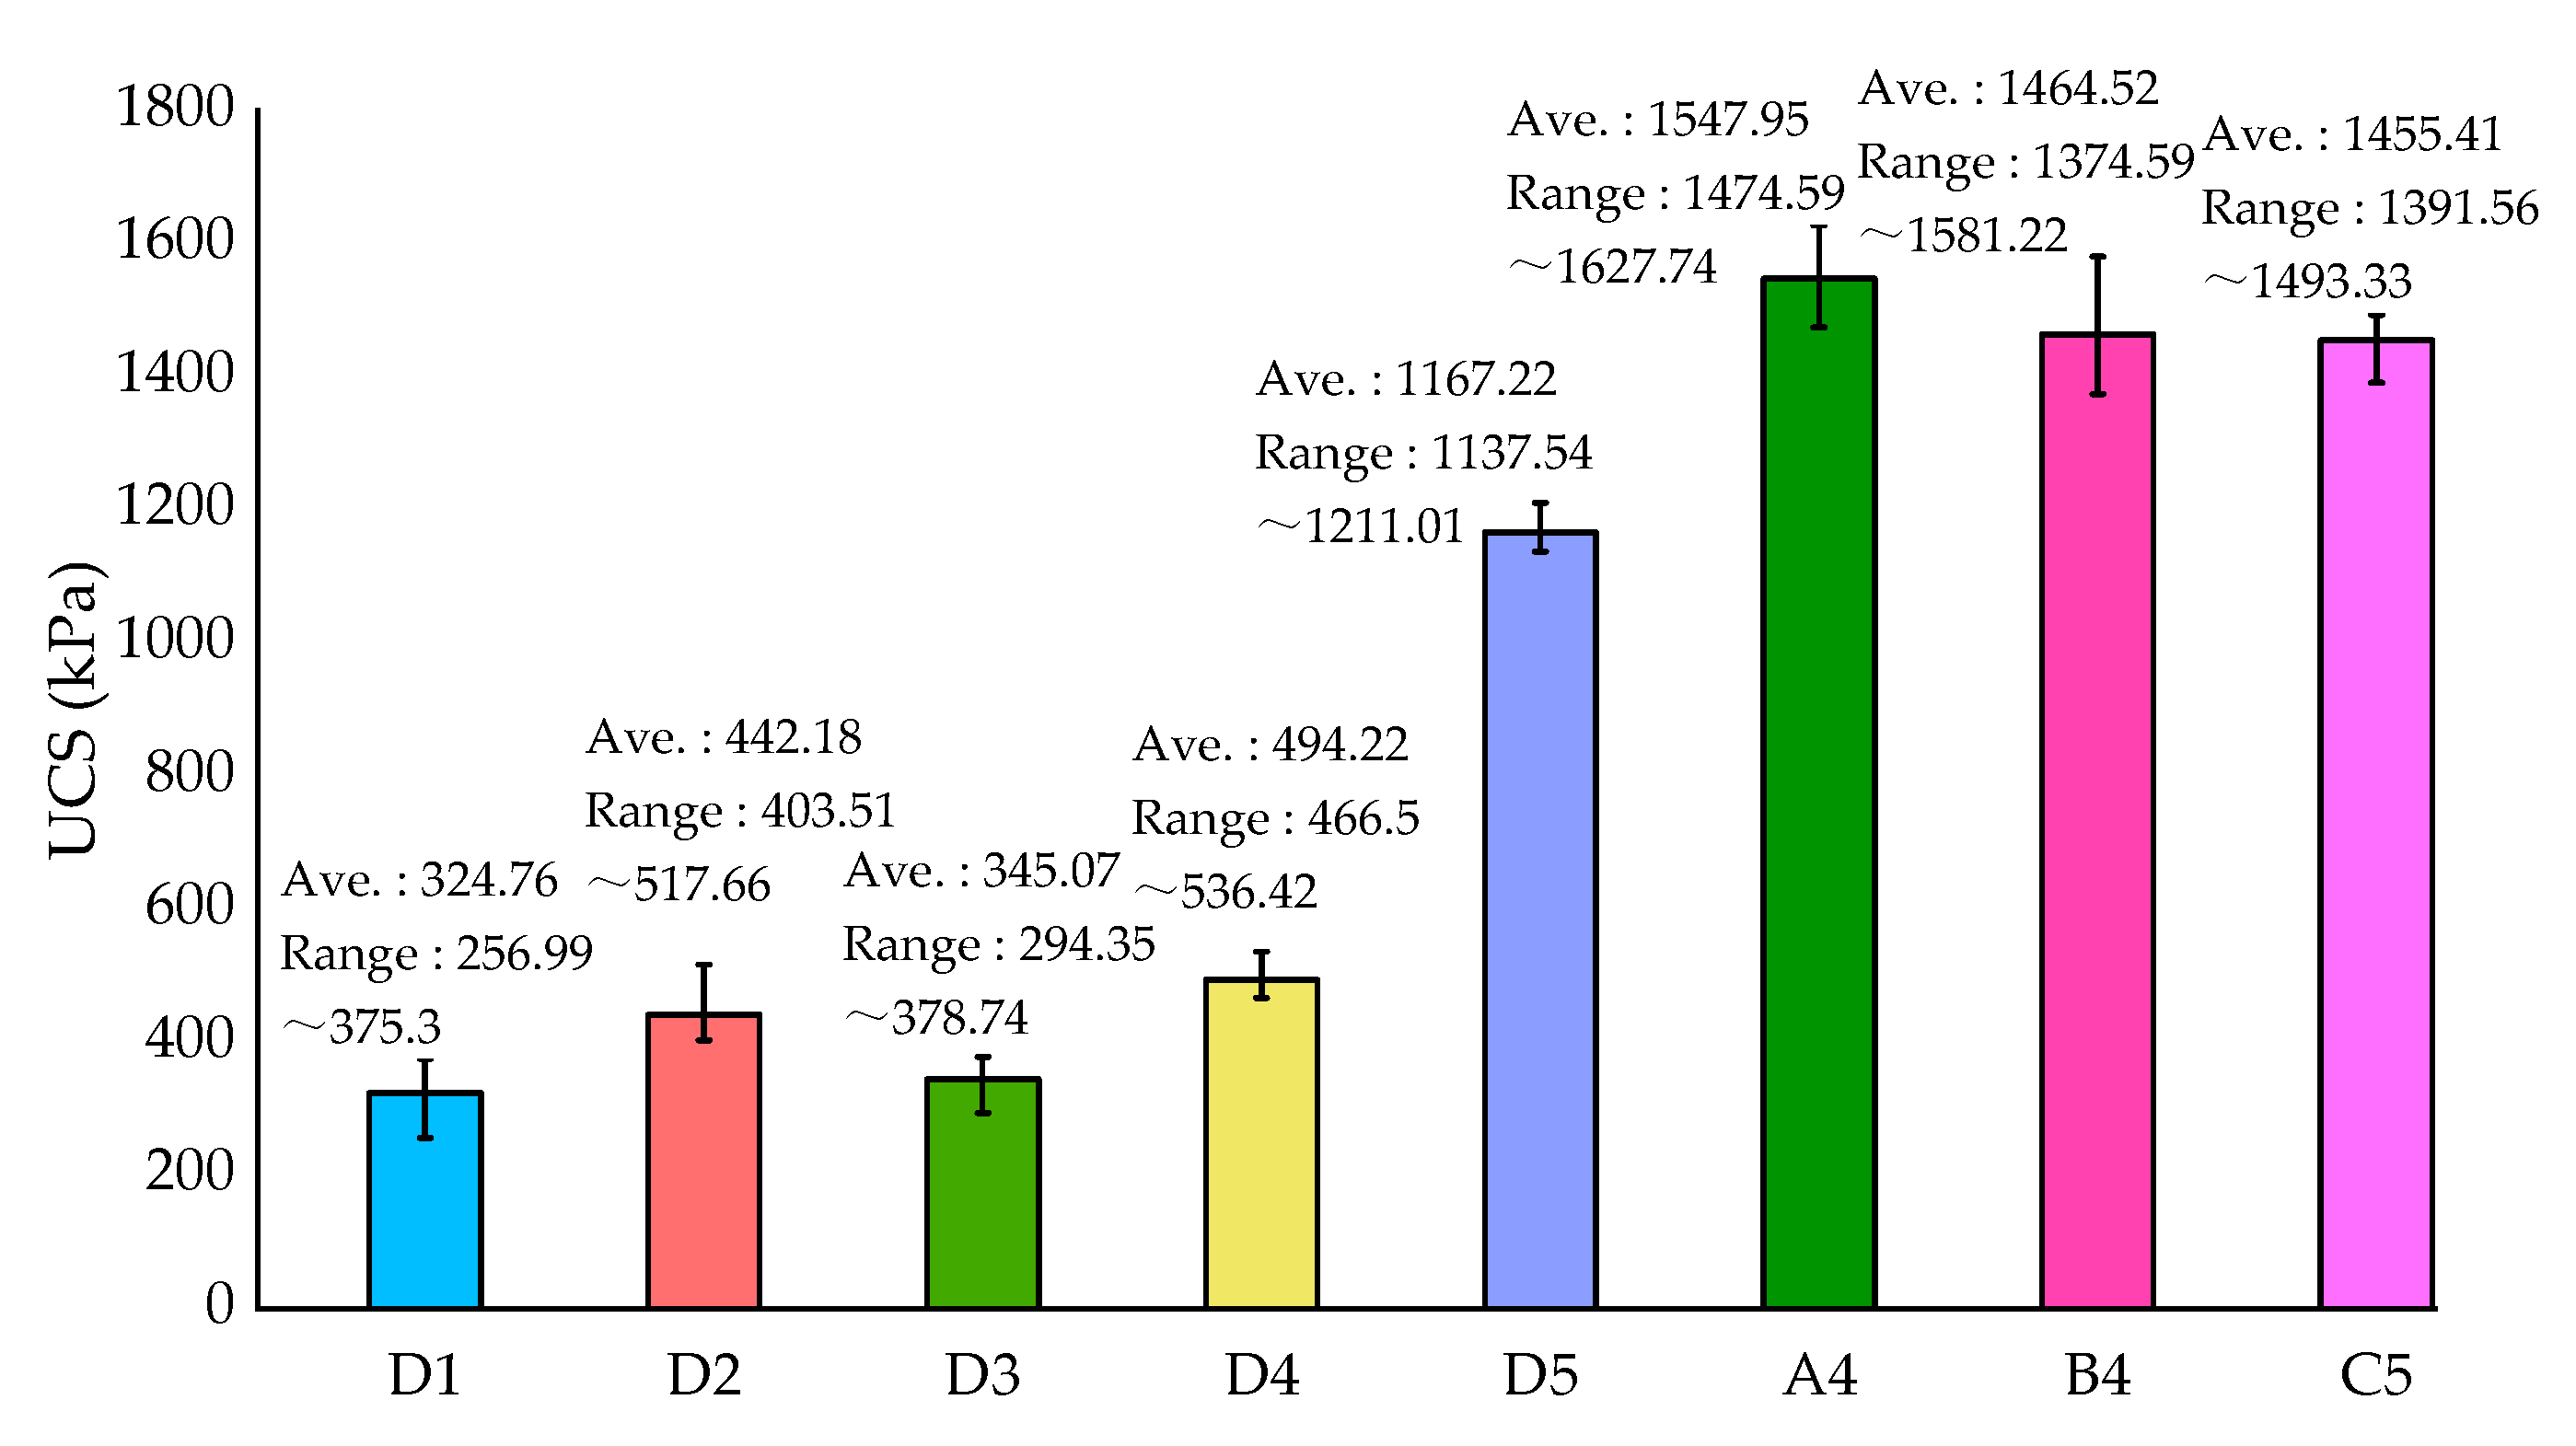
3.2.2. UCS Comparisons among Different Treatment Methods

Figure 6 compares the UCS of the soils reinforced by the improved EICP containing the optimal concentration of organic material with that of the control group. The mean UCS and the strength increasing rates are summarized in Table 4. The reinforcement effect was generally weak when any one of the three organic materials was added alone. The average strength increased by 169.46 kPa (52.18%) compared with that of the untreated soil, most likely due to the high viscosity of brown sugar, whose reinforcement effect was the best herein. The second was skim milk powder, which had a mean strength of 117.42 kPa (36.16%) higher than the original soil. When only glutinous rice powder was mixed, the strength did not increase substantially (6.25%). The mean UCS of specimens treated with EICP could be enhanced by 259.41%, which was higher than the untreated soil. However, when 8 g/L glutinous rice powder, 8 g/L skim milk powder or 16 g/L brown sugar was added into the treatment solution separately, the soil mean strength increased by 380.72 kPa, 297.29 kPa, and 288.18 kPa, which is 32.62%, 25.47%, and 24.69% higher than that of soil treated by EICP and 376.64%, 350.95%, and 348.15% higher than that of the original soil, respectively. Ri, REICP, and REICP+i were defined respectively as the strength increasing rate of soil treated with only organic material EICP, as well as the improved EICP containing organic material compared to untreated soil. Through the calculation of data in Table 4, it is not difficult to find the existence of formula (1), indicating that the strength increasing rate of EICP combined with organic materials is not the simple arithmetic superposition of the two alone, and EICP with added organic materials is really a highly efficient reinforcement method.
REICP+i > REICP + Ri

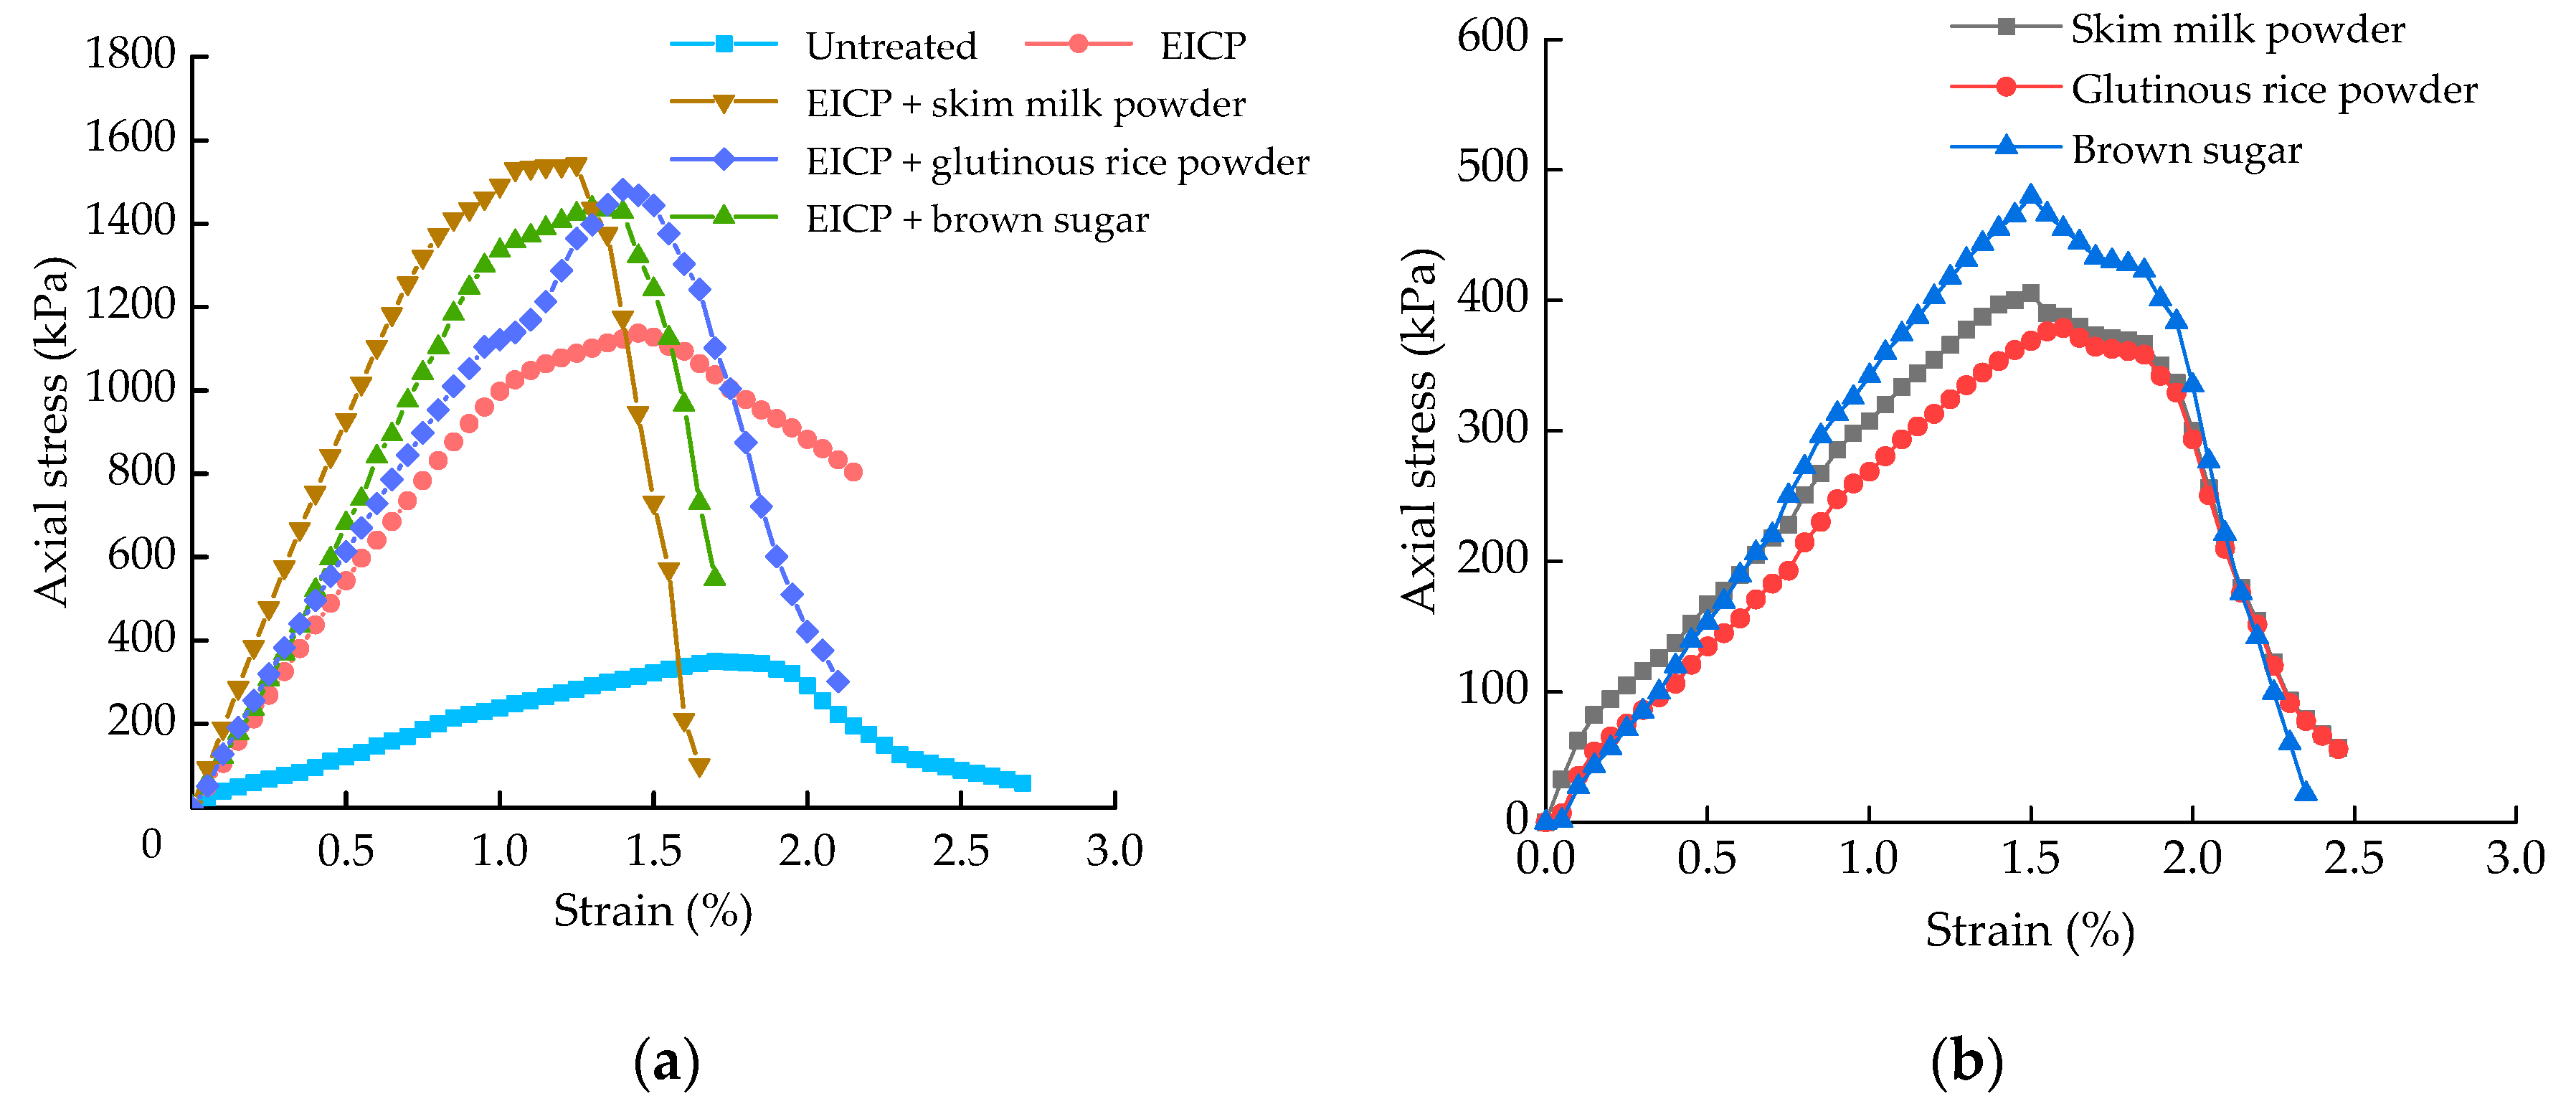
3.2.3. Stress-Strain Curves

Figure 7 presents the stress-strain curves obtained from the UCS tests on samples treated by different methods. For comparison, the stress-strain curve of untreated soil was also displayed in Figure 7. The stress-strain curve of the untreated soil displayed a response characterized by linear elastic behavior followed by a slow decrease in strength after peak strength, showing plastic failure characteristics. After solidification by both EICP and the improved EICP with organic material added, the stress-strain curves can be roughly divided into three stages. In the first stage, the stress increased rapidly with the strain in a linear relationship, indicating that the pores of the samples were gradually compacted. In the second stage, the stress increased slowly with the strain and the relationship curved downward in a convex manner until the stress reached a maximum. In the third stage, the stress decreased sharply with the strain after reaching peak strength. In addition, the stress-strain curves of soil reinforced only by one kind of organic material also underwent three stages: a linear increasing stage, a slow decreasing stage, and a rapid declining stage. Basically none of the reinforced specimens maintained a certain residual strength after failure, which is a typical brittle failure [47].
Some stress and strain parameters acquired from the UCS tests were calculated and are listed in Table 5. The compressive elastic modulus of EICP-treated soil with organic material added was nearly 30~53% higher than that without organic material and was five-fold higher than that of untreated soil. The failure strain and peak strain for soil treated by the improved EICP was 60~80% of that for untreated soil. Compared with untreated soil, both the failure strain and peak strain for soil treated only by organic material showed little change. The peak strength of the soil reinforced by the improved EICP with skim milk powder at the optimum concentration was the largest, with brittle failure characteristics being the most significant, followed by glutinous rice powder and brown sugar at their optimum concentrations. The greater the increase in the compressive strength was, the more significant the characteristics of brittle failure.

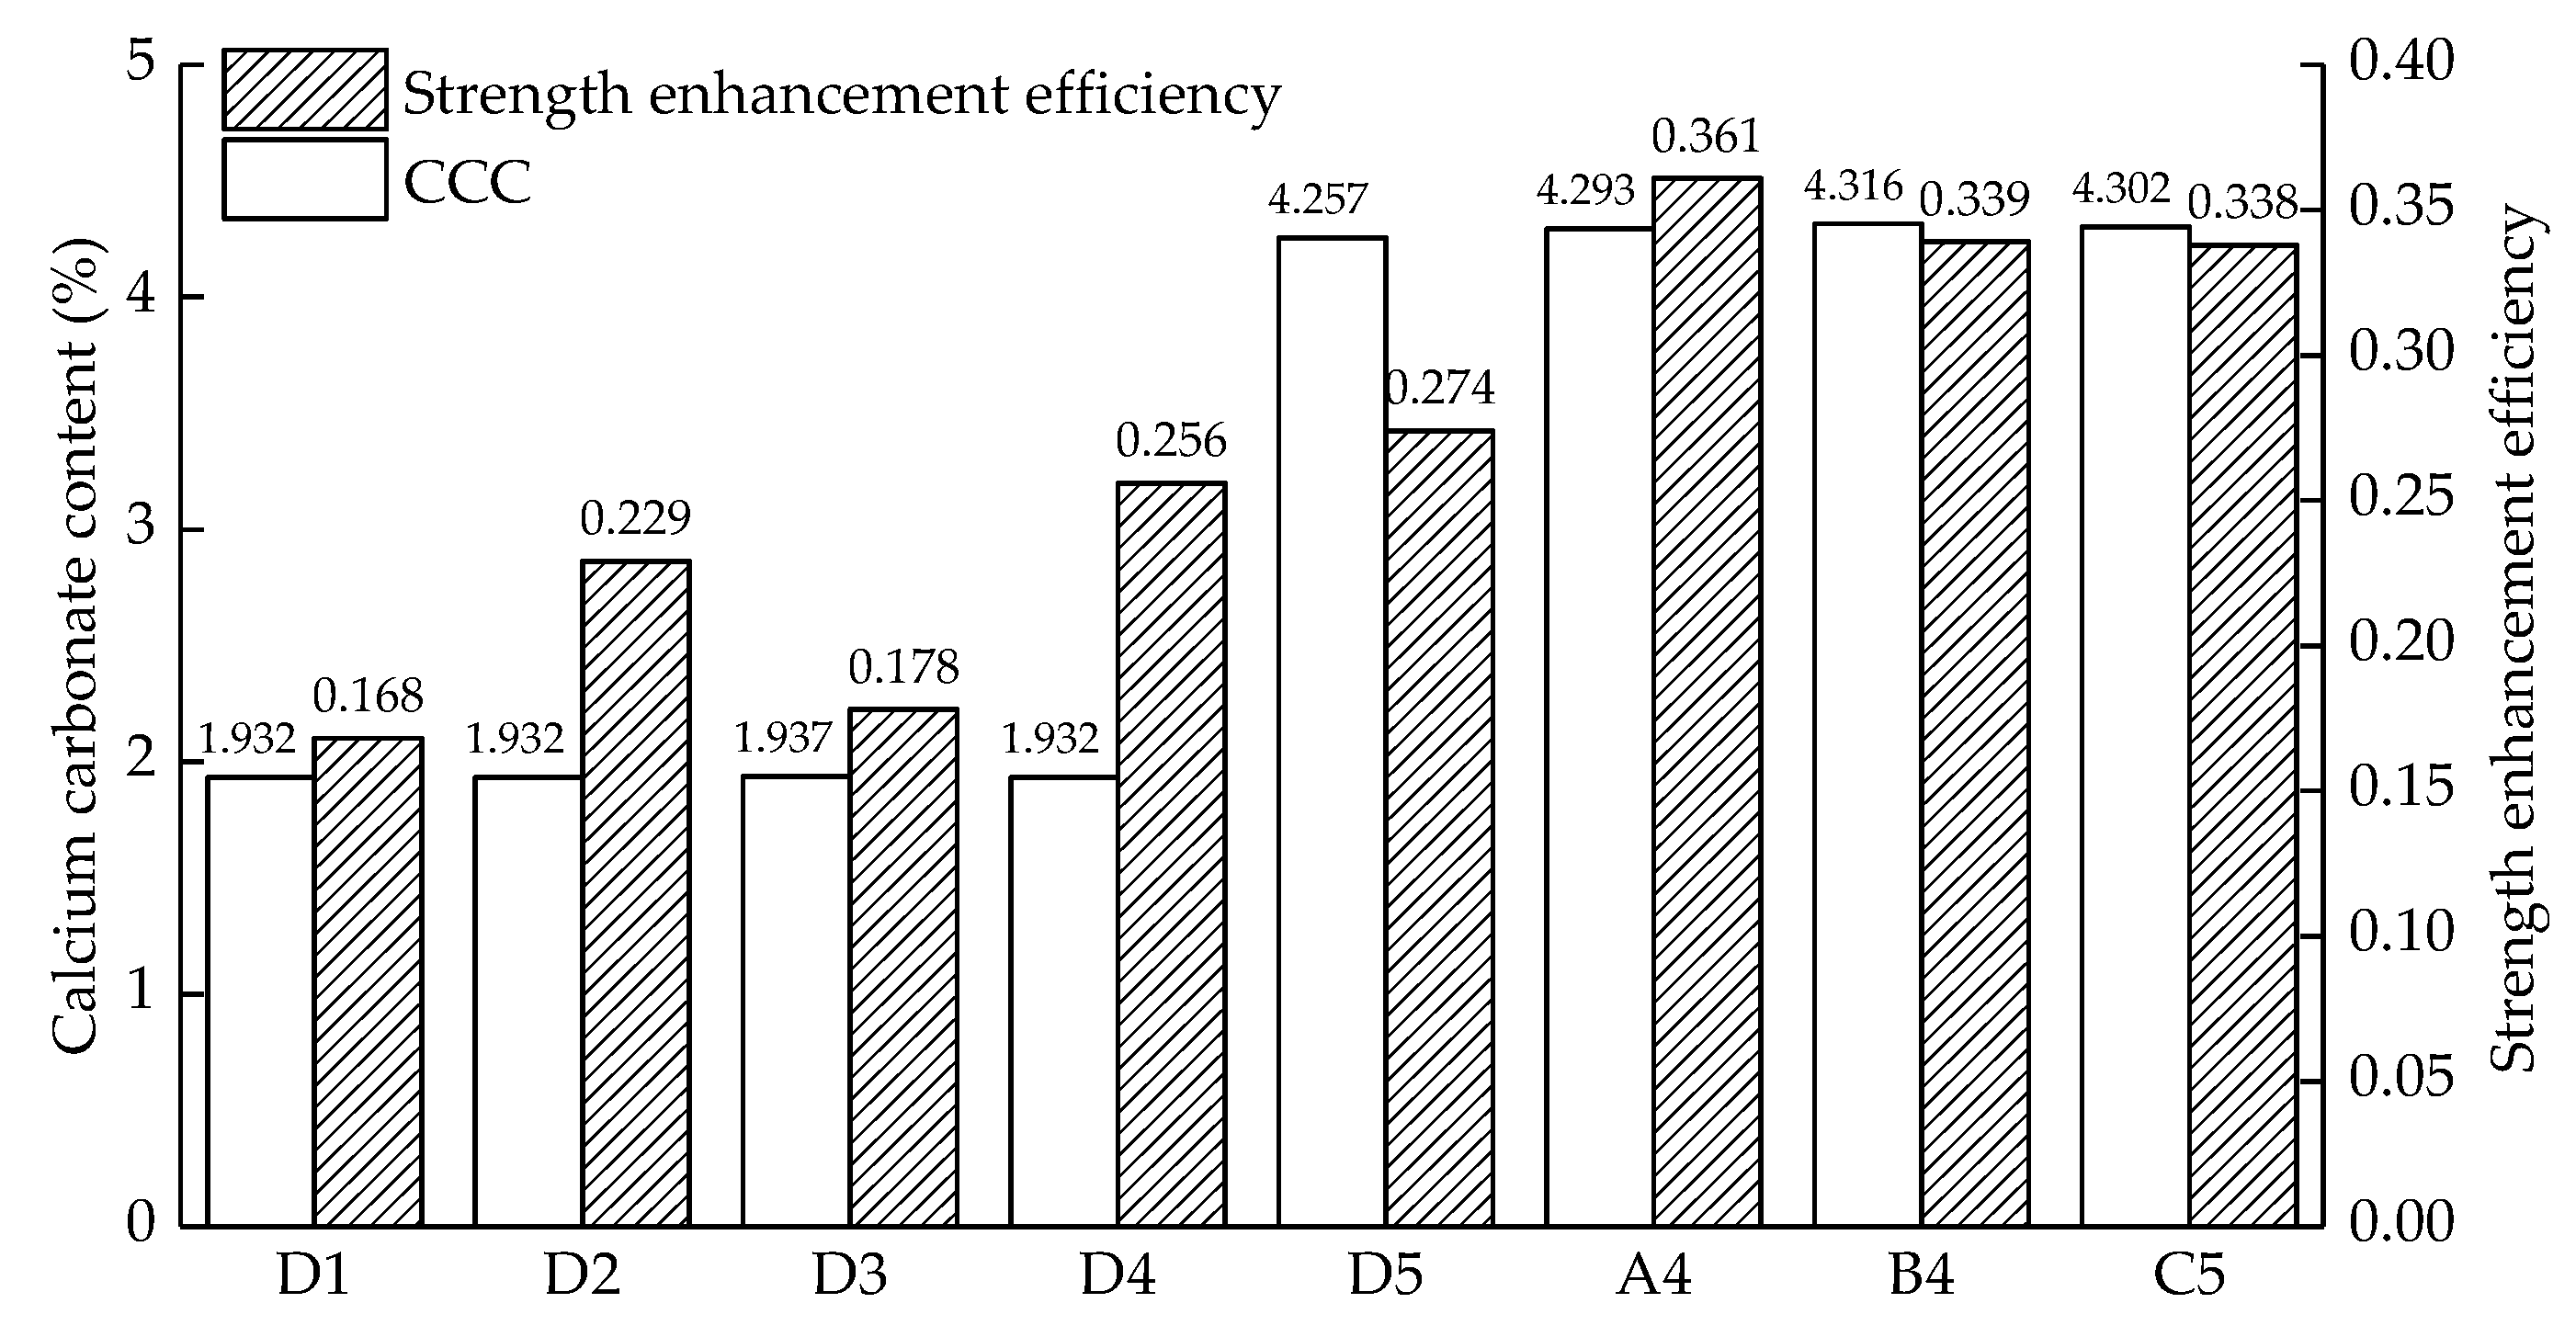
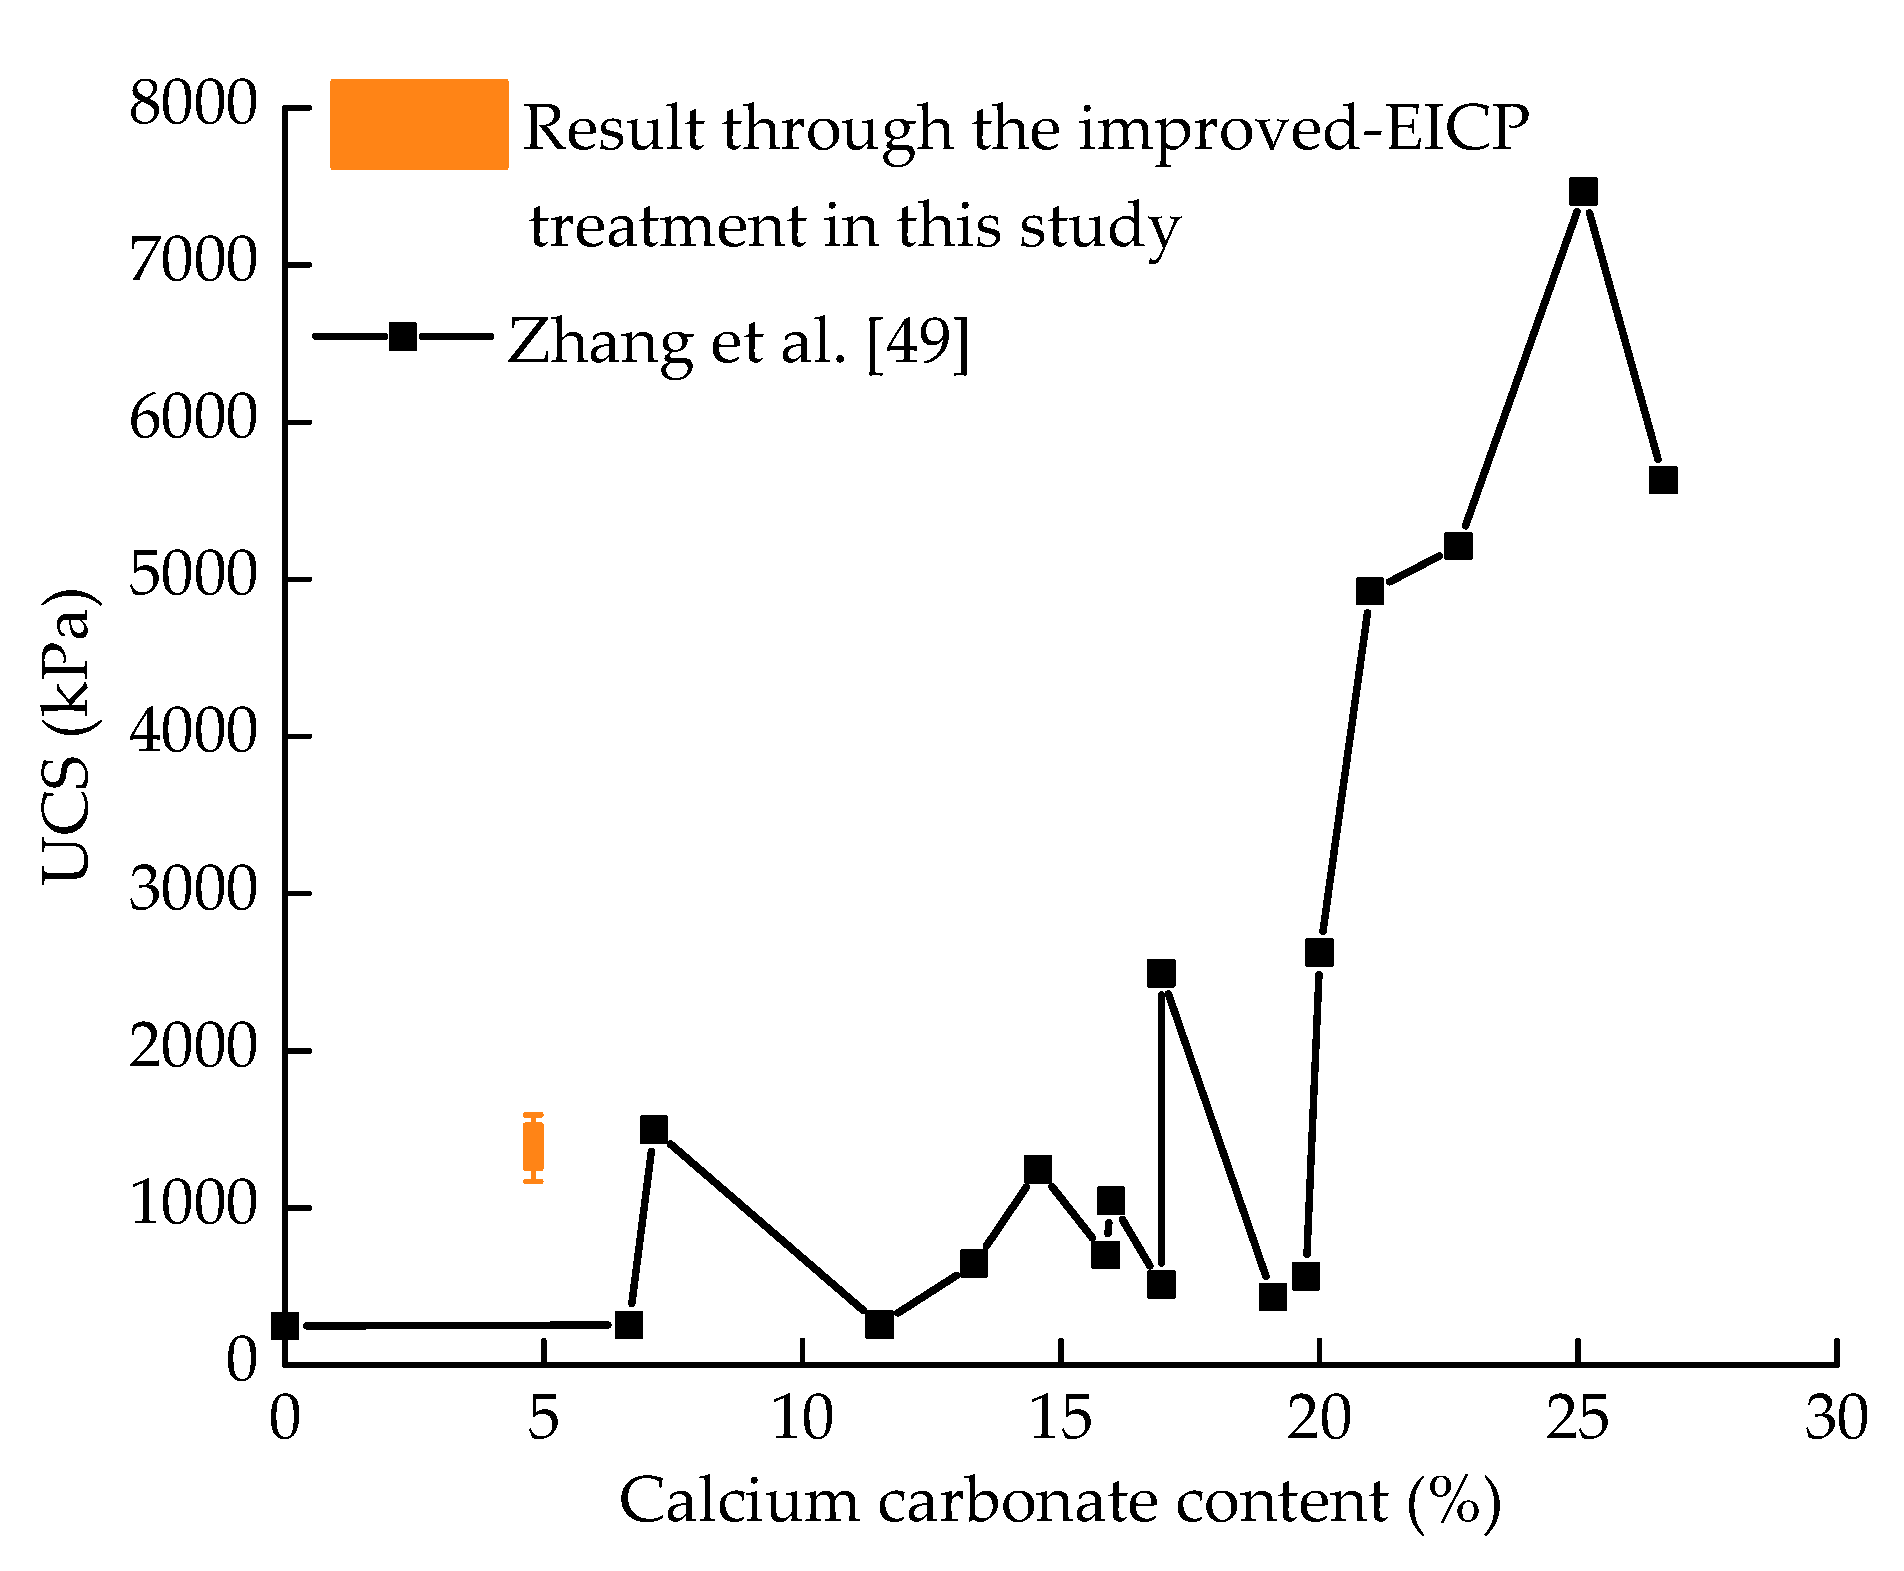
3.2.4. CCC and Efficiency of Strength Enhancement

Previous studies have shown that strength improvement is closely related to higher precipitation of calcium carbonate [6,48]. The efficiency of strength enhancement could be defined as the UCS per mass of precipitated calcium carbonate. Figure 8 compares the CCC and strength reinforcement efficiency among different treatment methods. Compared with the original soil, the CCC of soil reinforced only with one kind of organic material was basically unchanged due to the absence of new calcium ions, and the CCC for soil treated with EICP and the modified EICP containing organic material increased nearly by 1.2-fold to about 4.3%. Compared with EICP-treated soil, the CCC of soil treated with the modified EICP changed very little regardless of which organic material was added, but the strength enhancement efficiency substantially increased by 32%, showing that the large enhancement in strength may be attributed to the improvement in the calcium carbonate crystal structure. The improvement effect of CCC is consistent with that obtained by Almajed et al. through the sand bio-improvement test with the addition of skim milk powder [30]. This was probably because both Almajed et al. [30] and our study used a lower concentration of calcium ions, which in turn led to a higher mineralization rate, and organic substrates with a higher concentration of calcium ions are more likely to improve the precipitation yield.
The reinforcement effect was more pronounced for the improved EICP with skim milk powder added. Nevertheless, the strength enhancement efficiency for the improved EICP with skim milk powder added in this study was far from that in reference [30]. This was mainly due to the fine particles of the treated soil, the smaller total mixing amount of reaction solution in the mixing method used in this paper, and thereby a scarcity of nucleation sites provided by organic materials. The drip irrigation technology of EICP combined with organic materials can be further studied to promote the popularization and engineering application of the improved EICP technology in the reinforcement of fine-grained soils.
Figure 9 shows the compiled data of the UCS versus CCC from other researchers. Compared with the results obtained by Zhang et al. [49] through MICP drip irrigation, the UCS under the same CCC in this study is higher. The strength of the soil with a 2% CCC was equivalent to that with a 6~17% CCC in the study by Zhang et al. [49]. This shows that the distribution of calcium carbonate during mixing was more even, and the soil integrity was better than that in the grouting method. The improvement effect of the modified EICP with organic materials added was better than that of MICP.

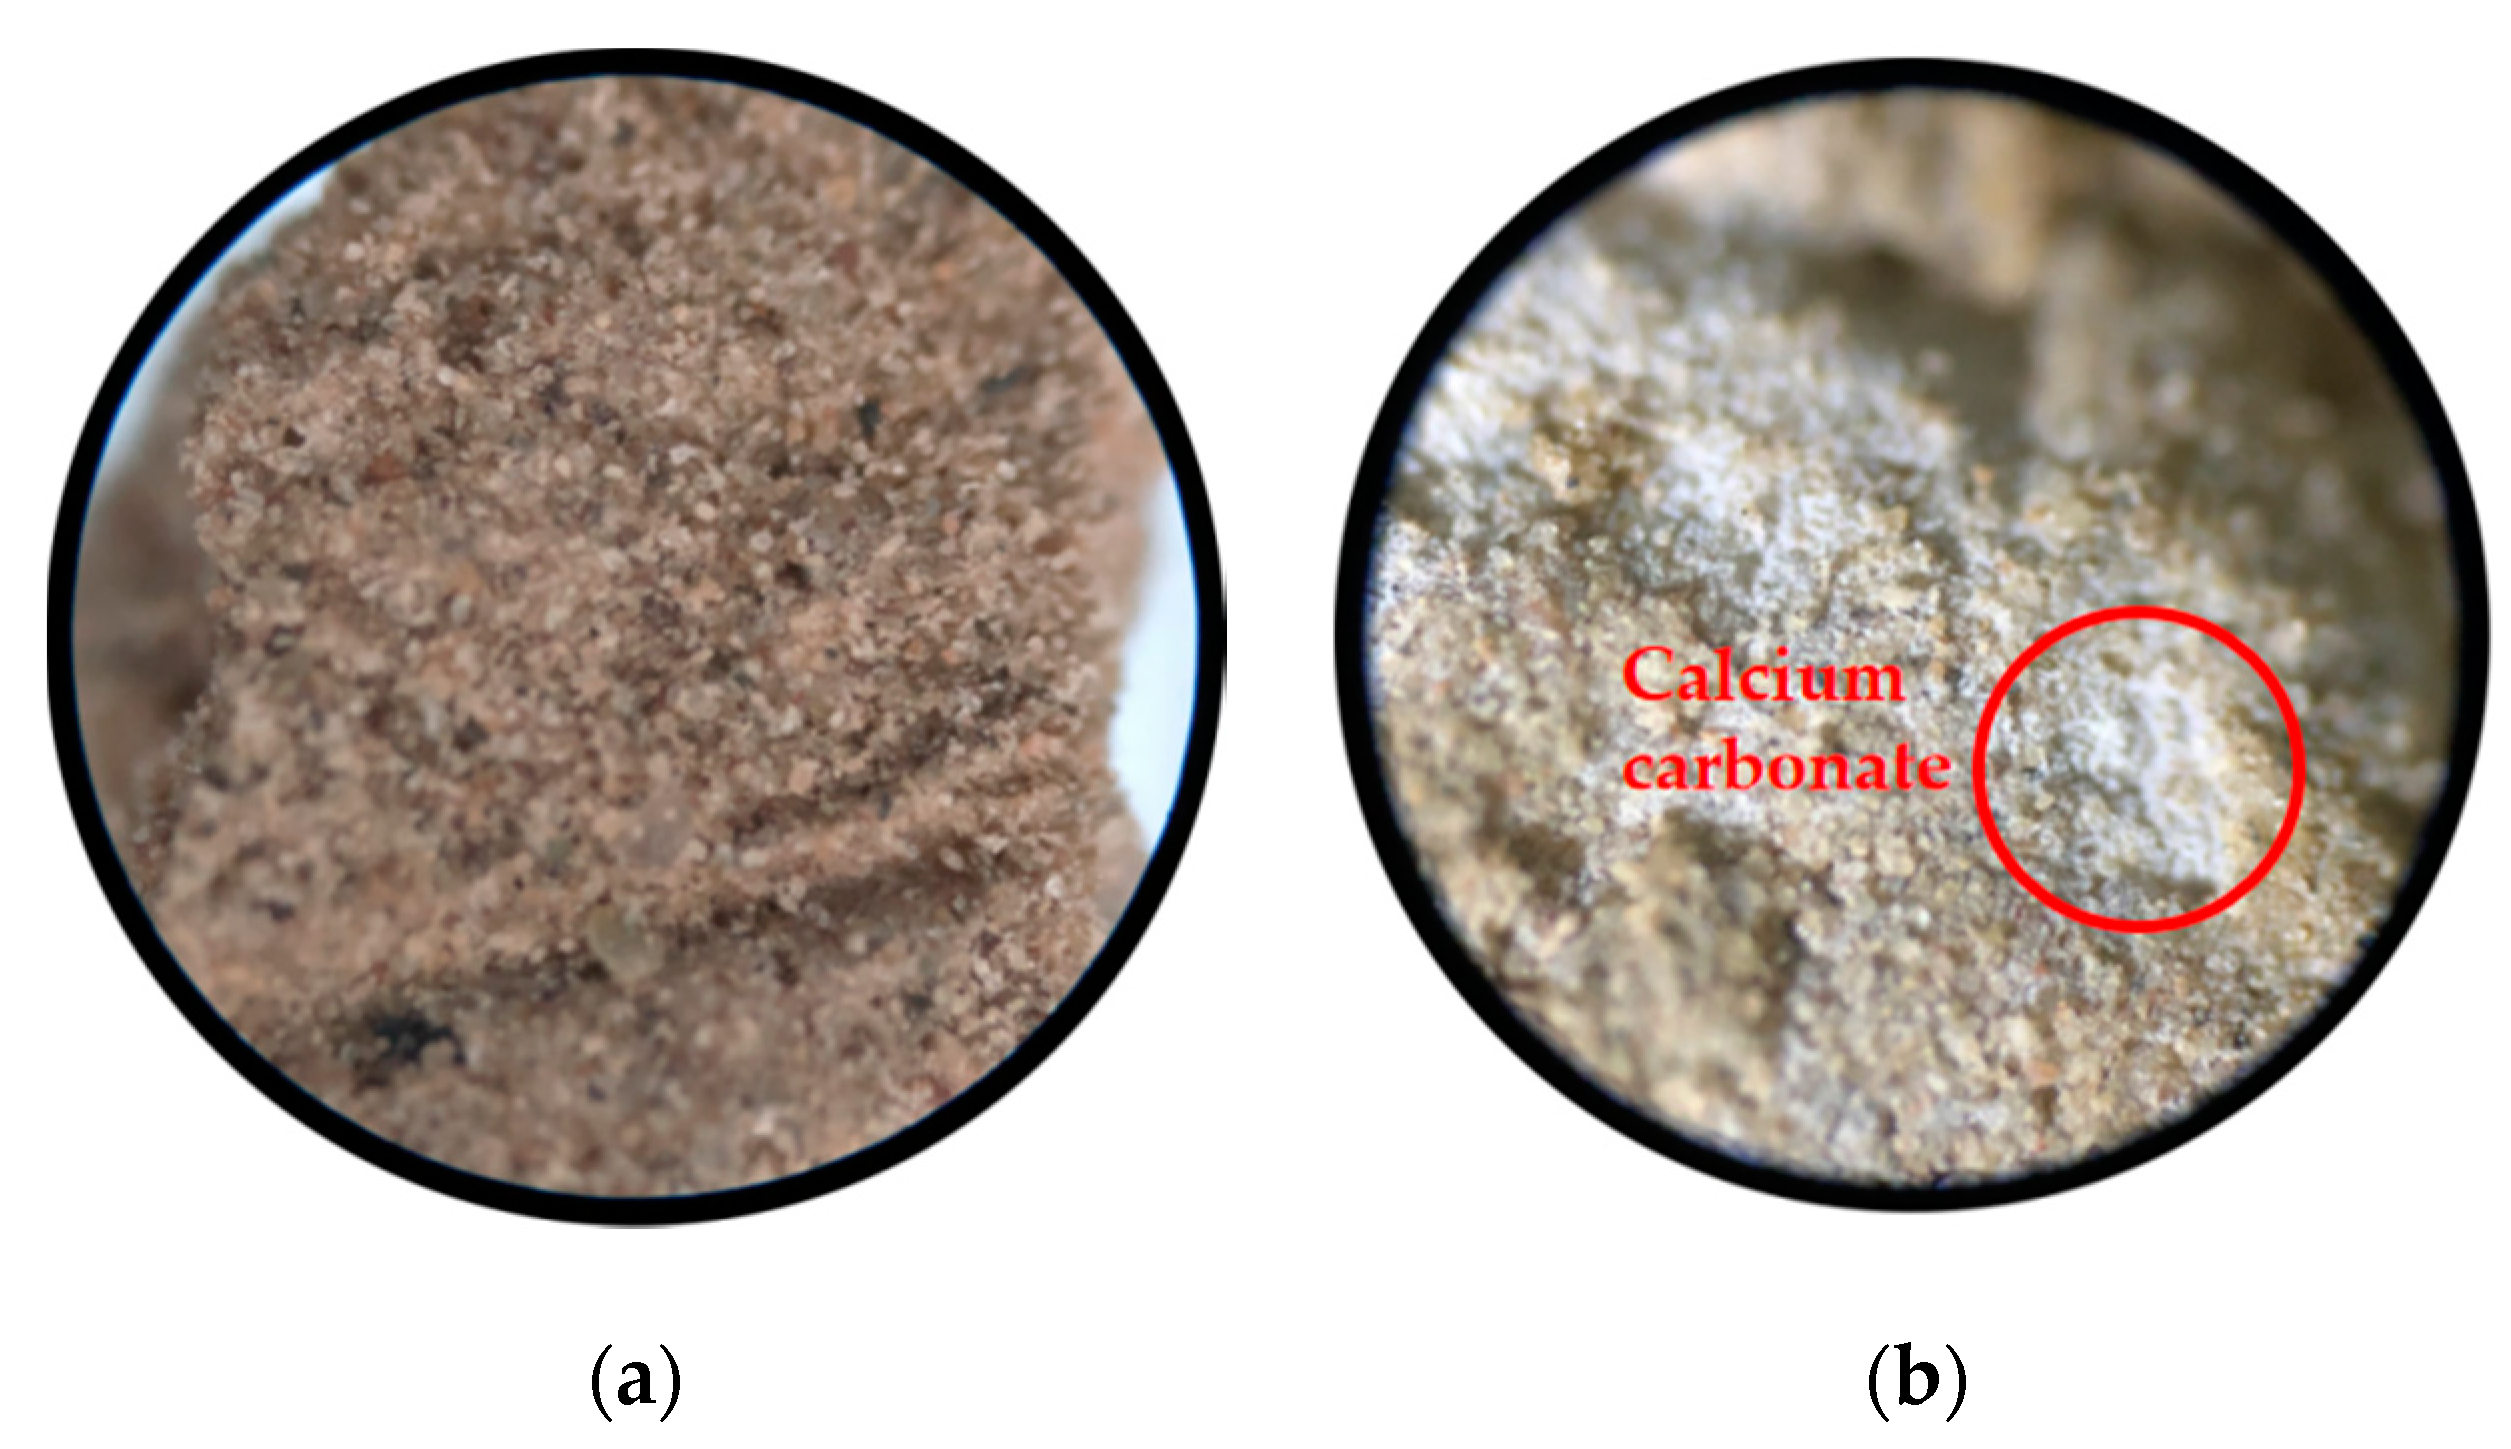
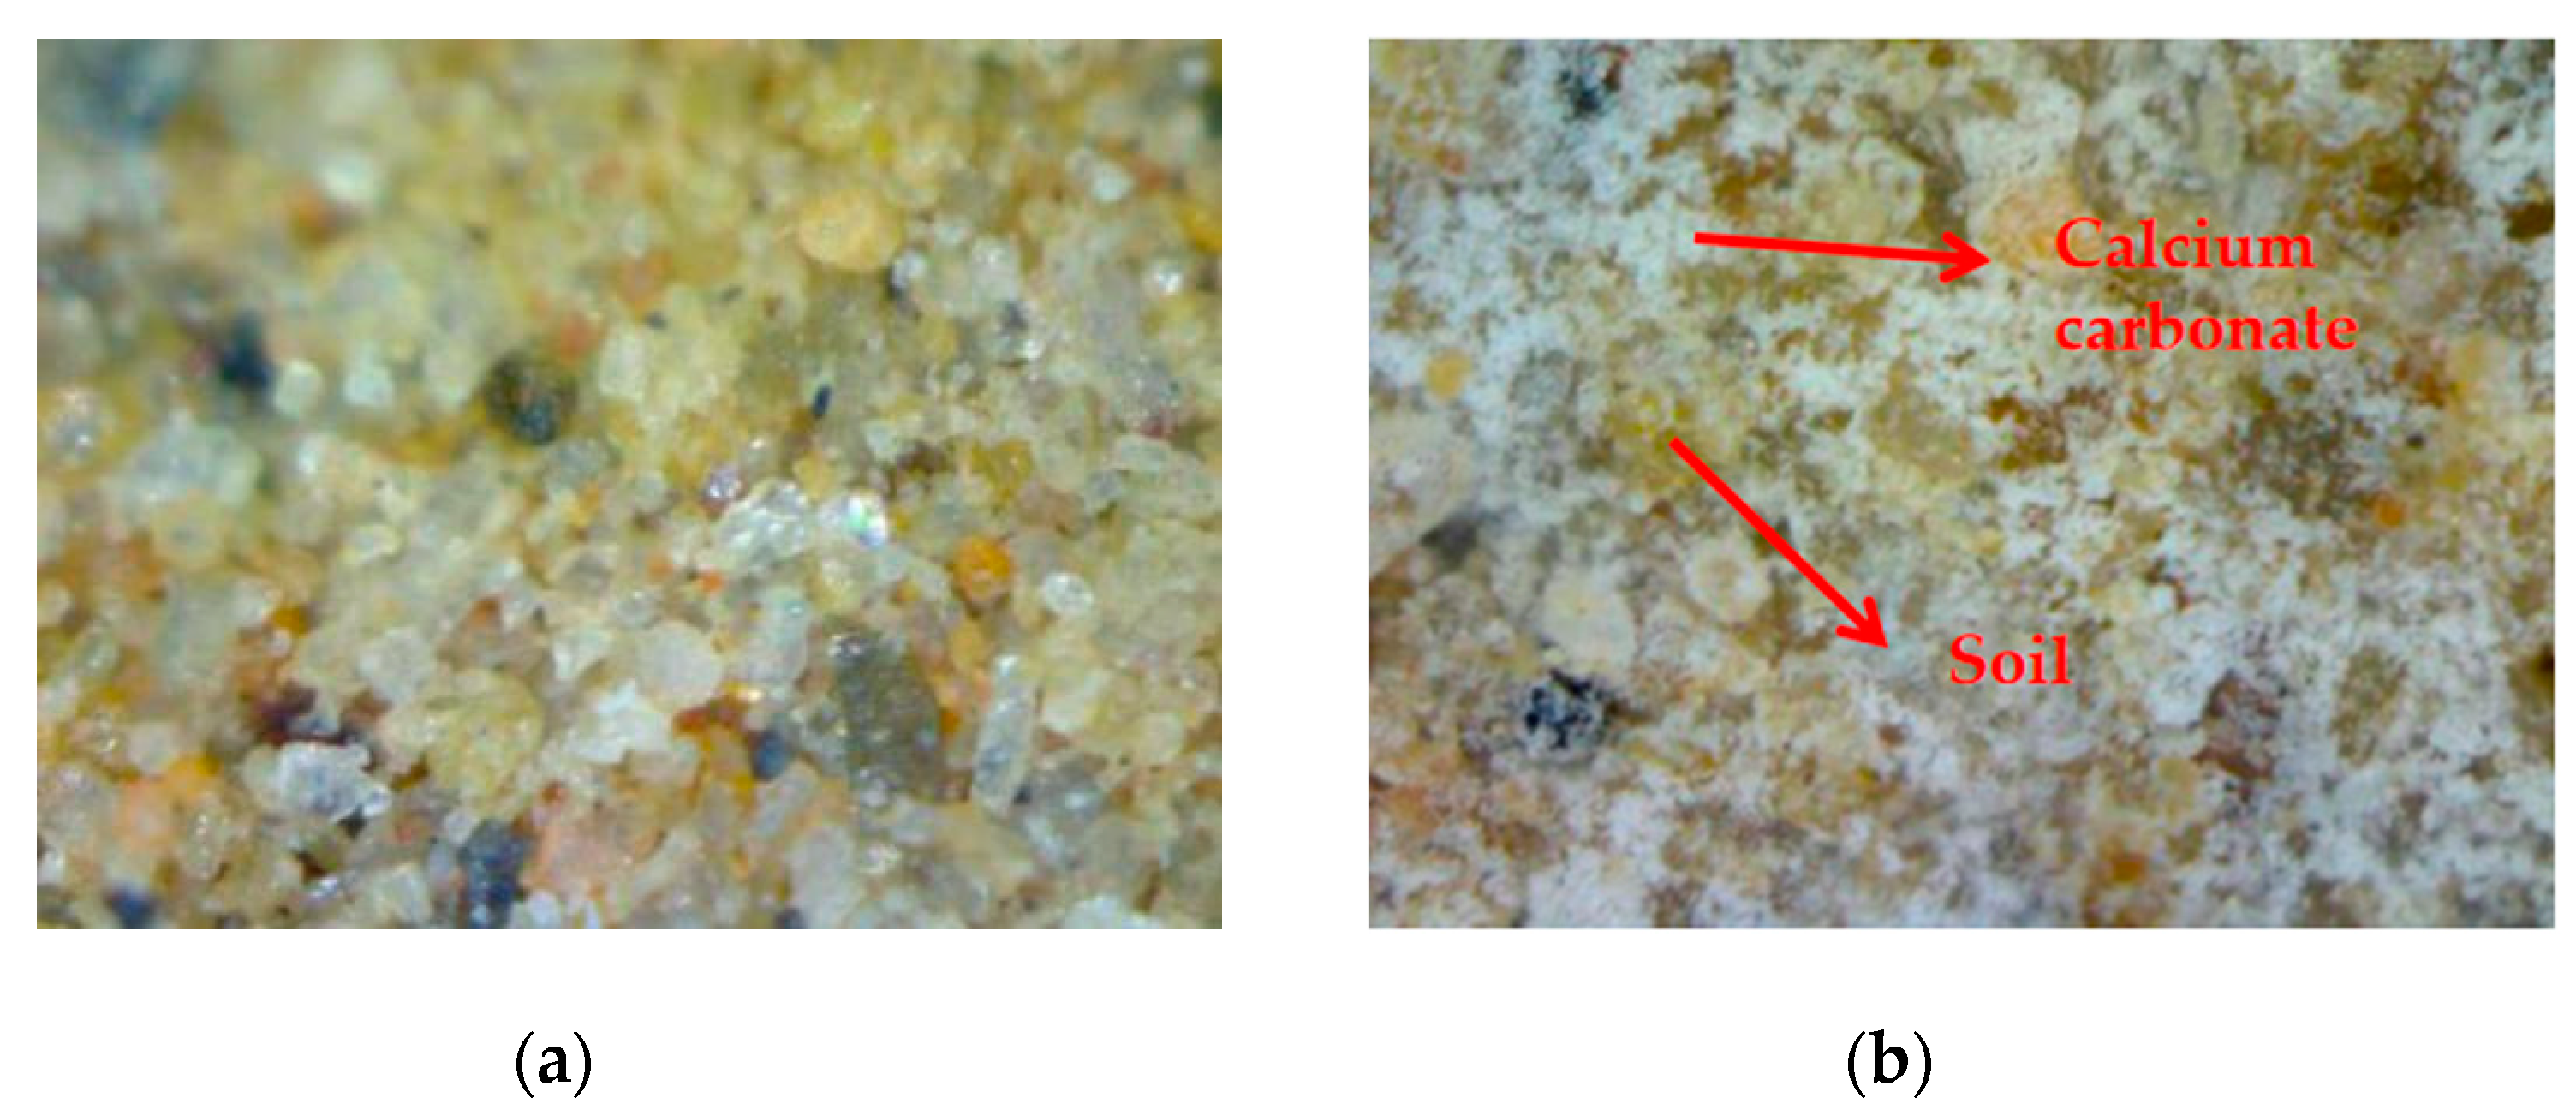
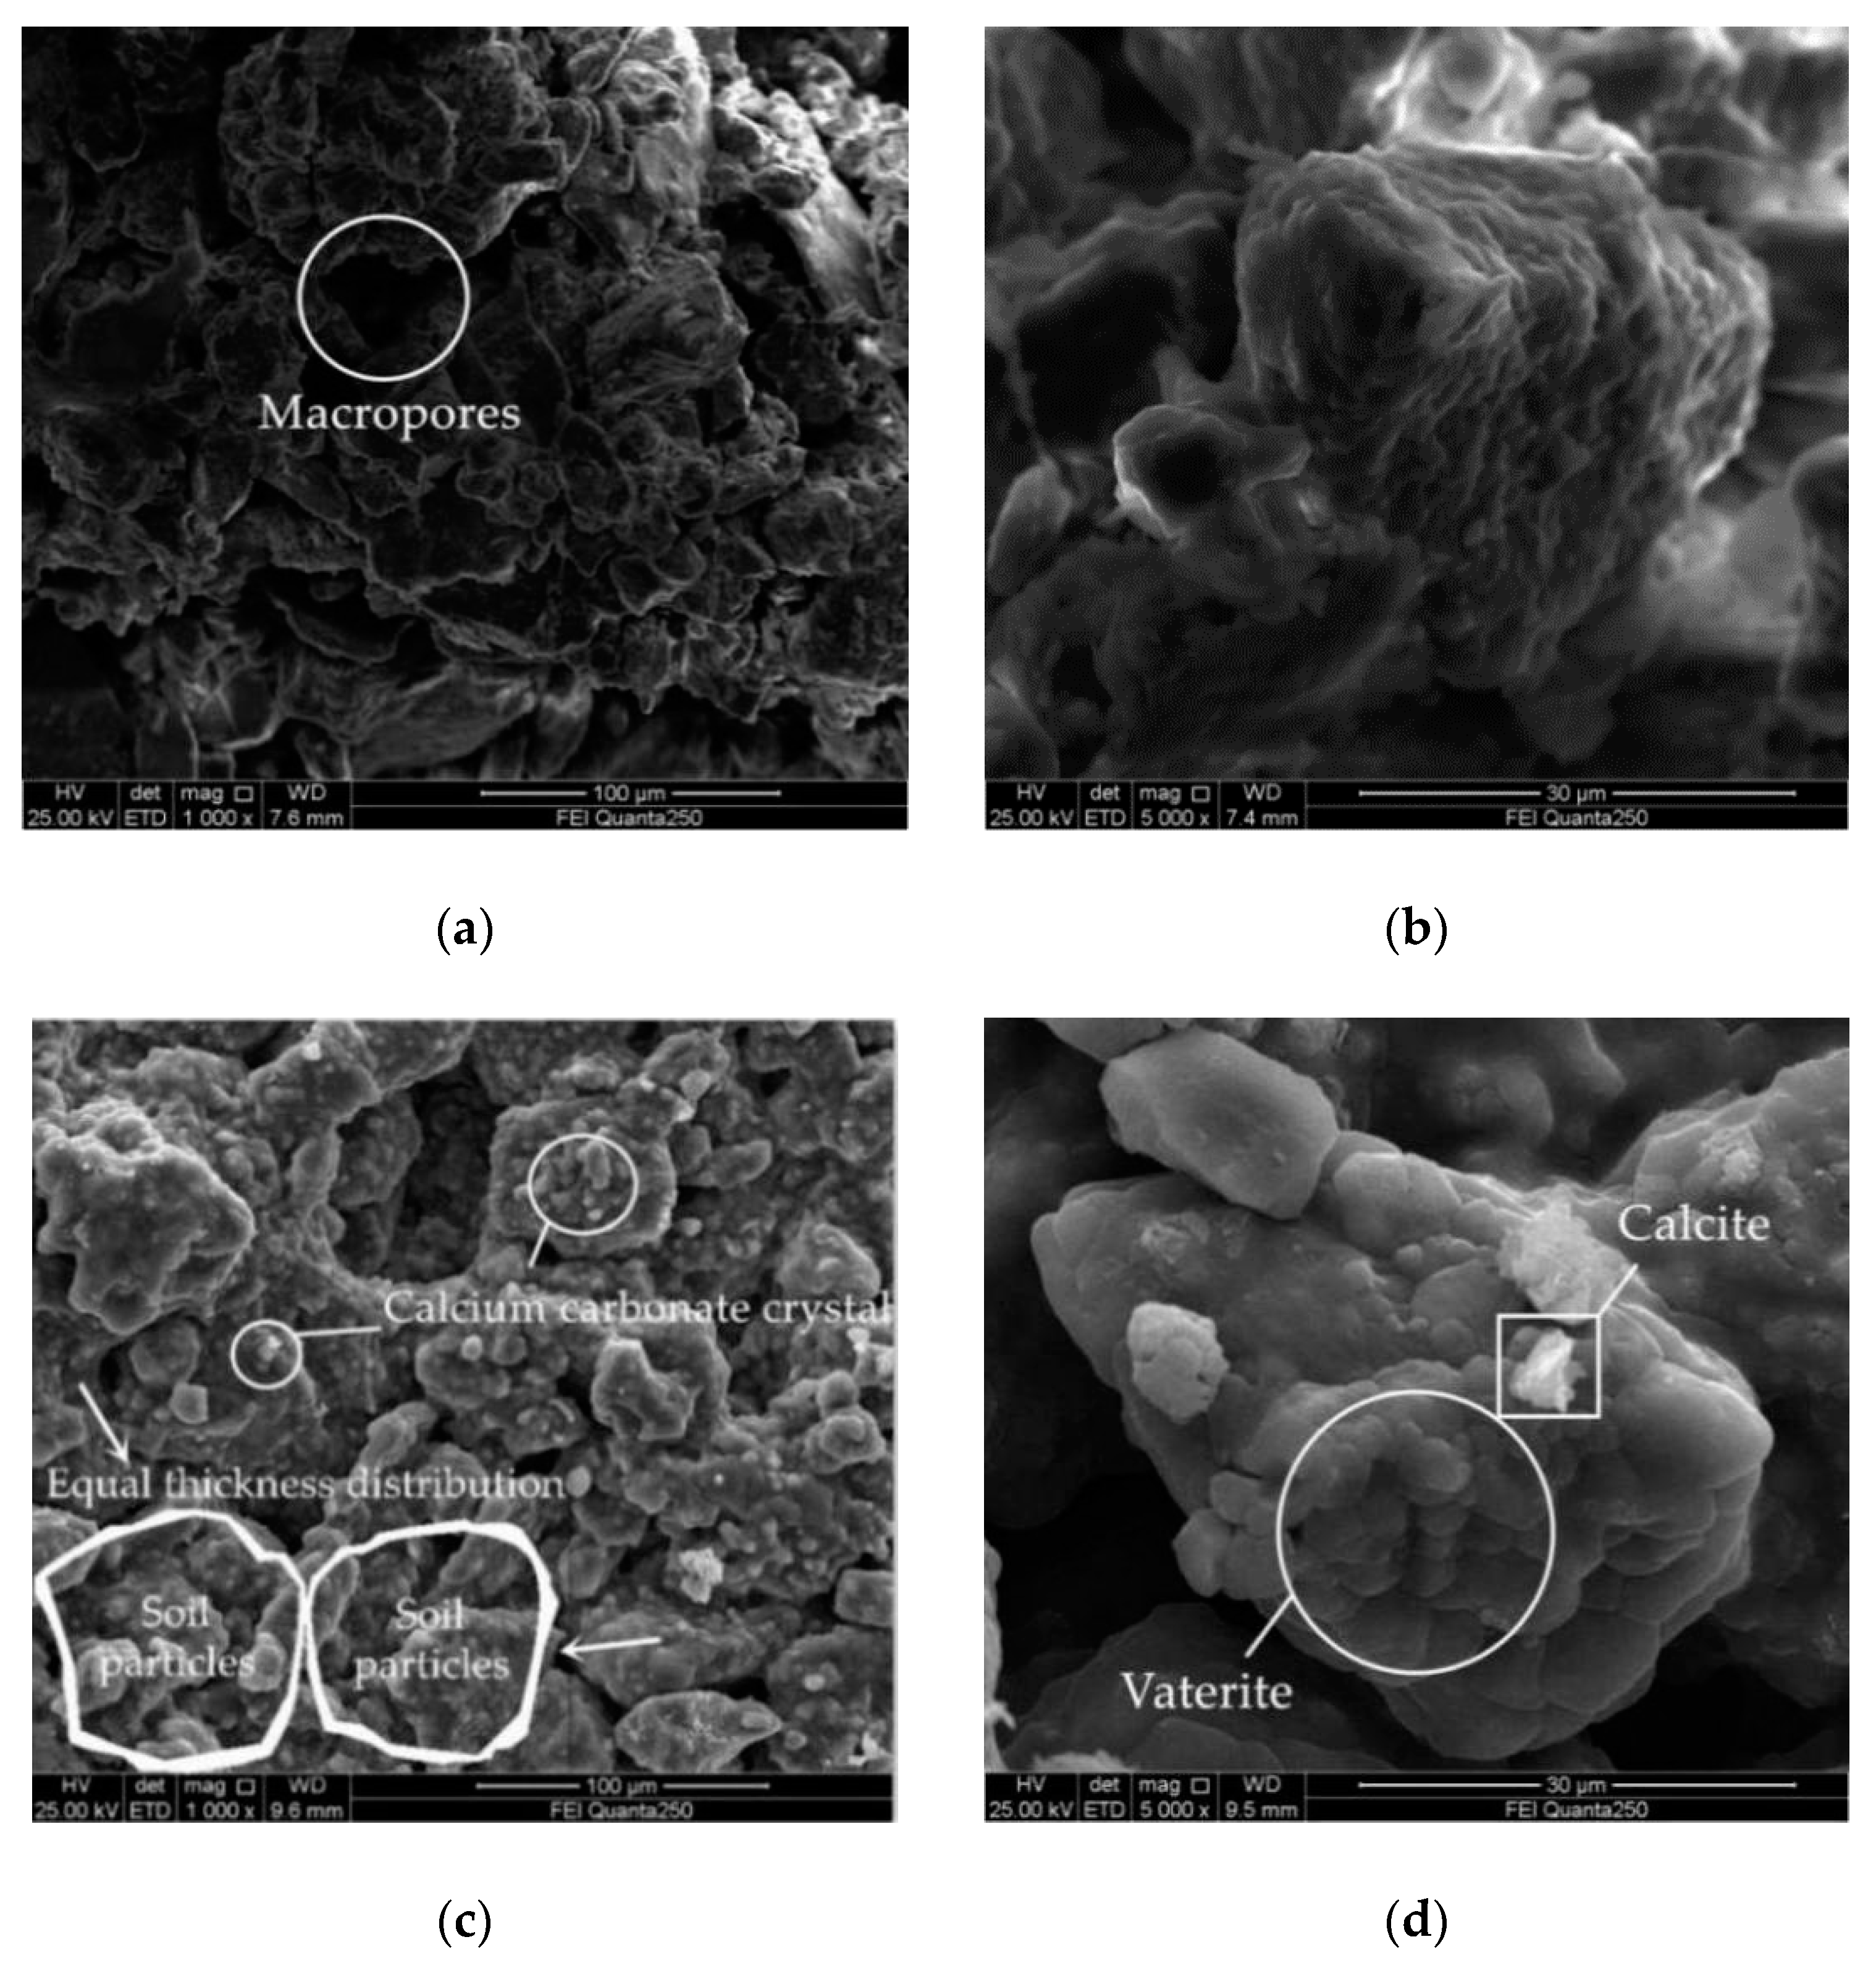
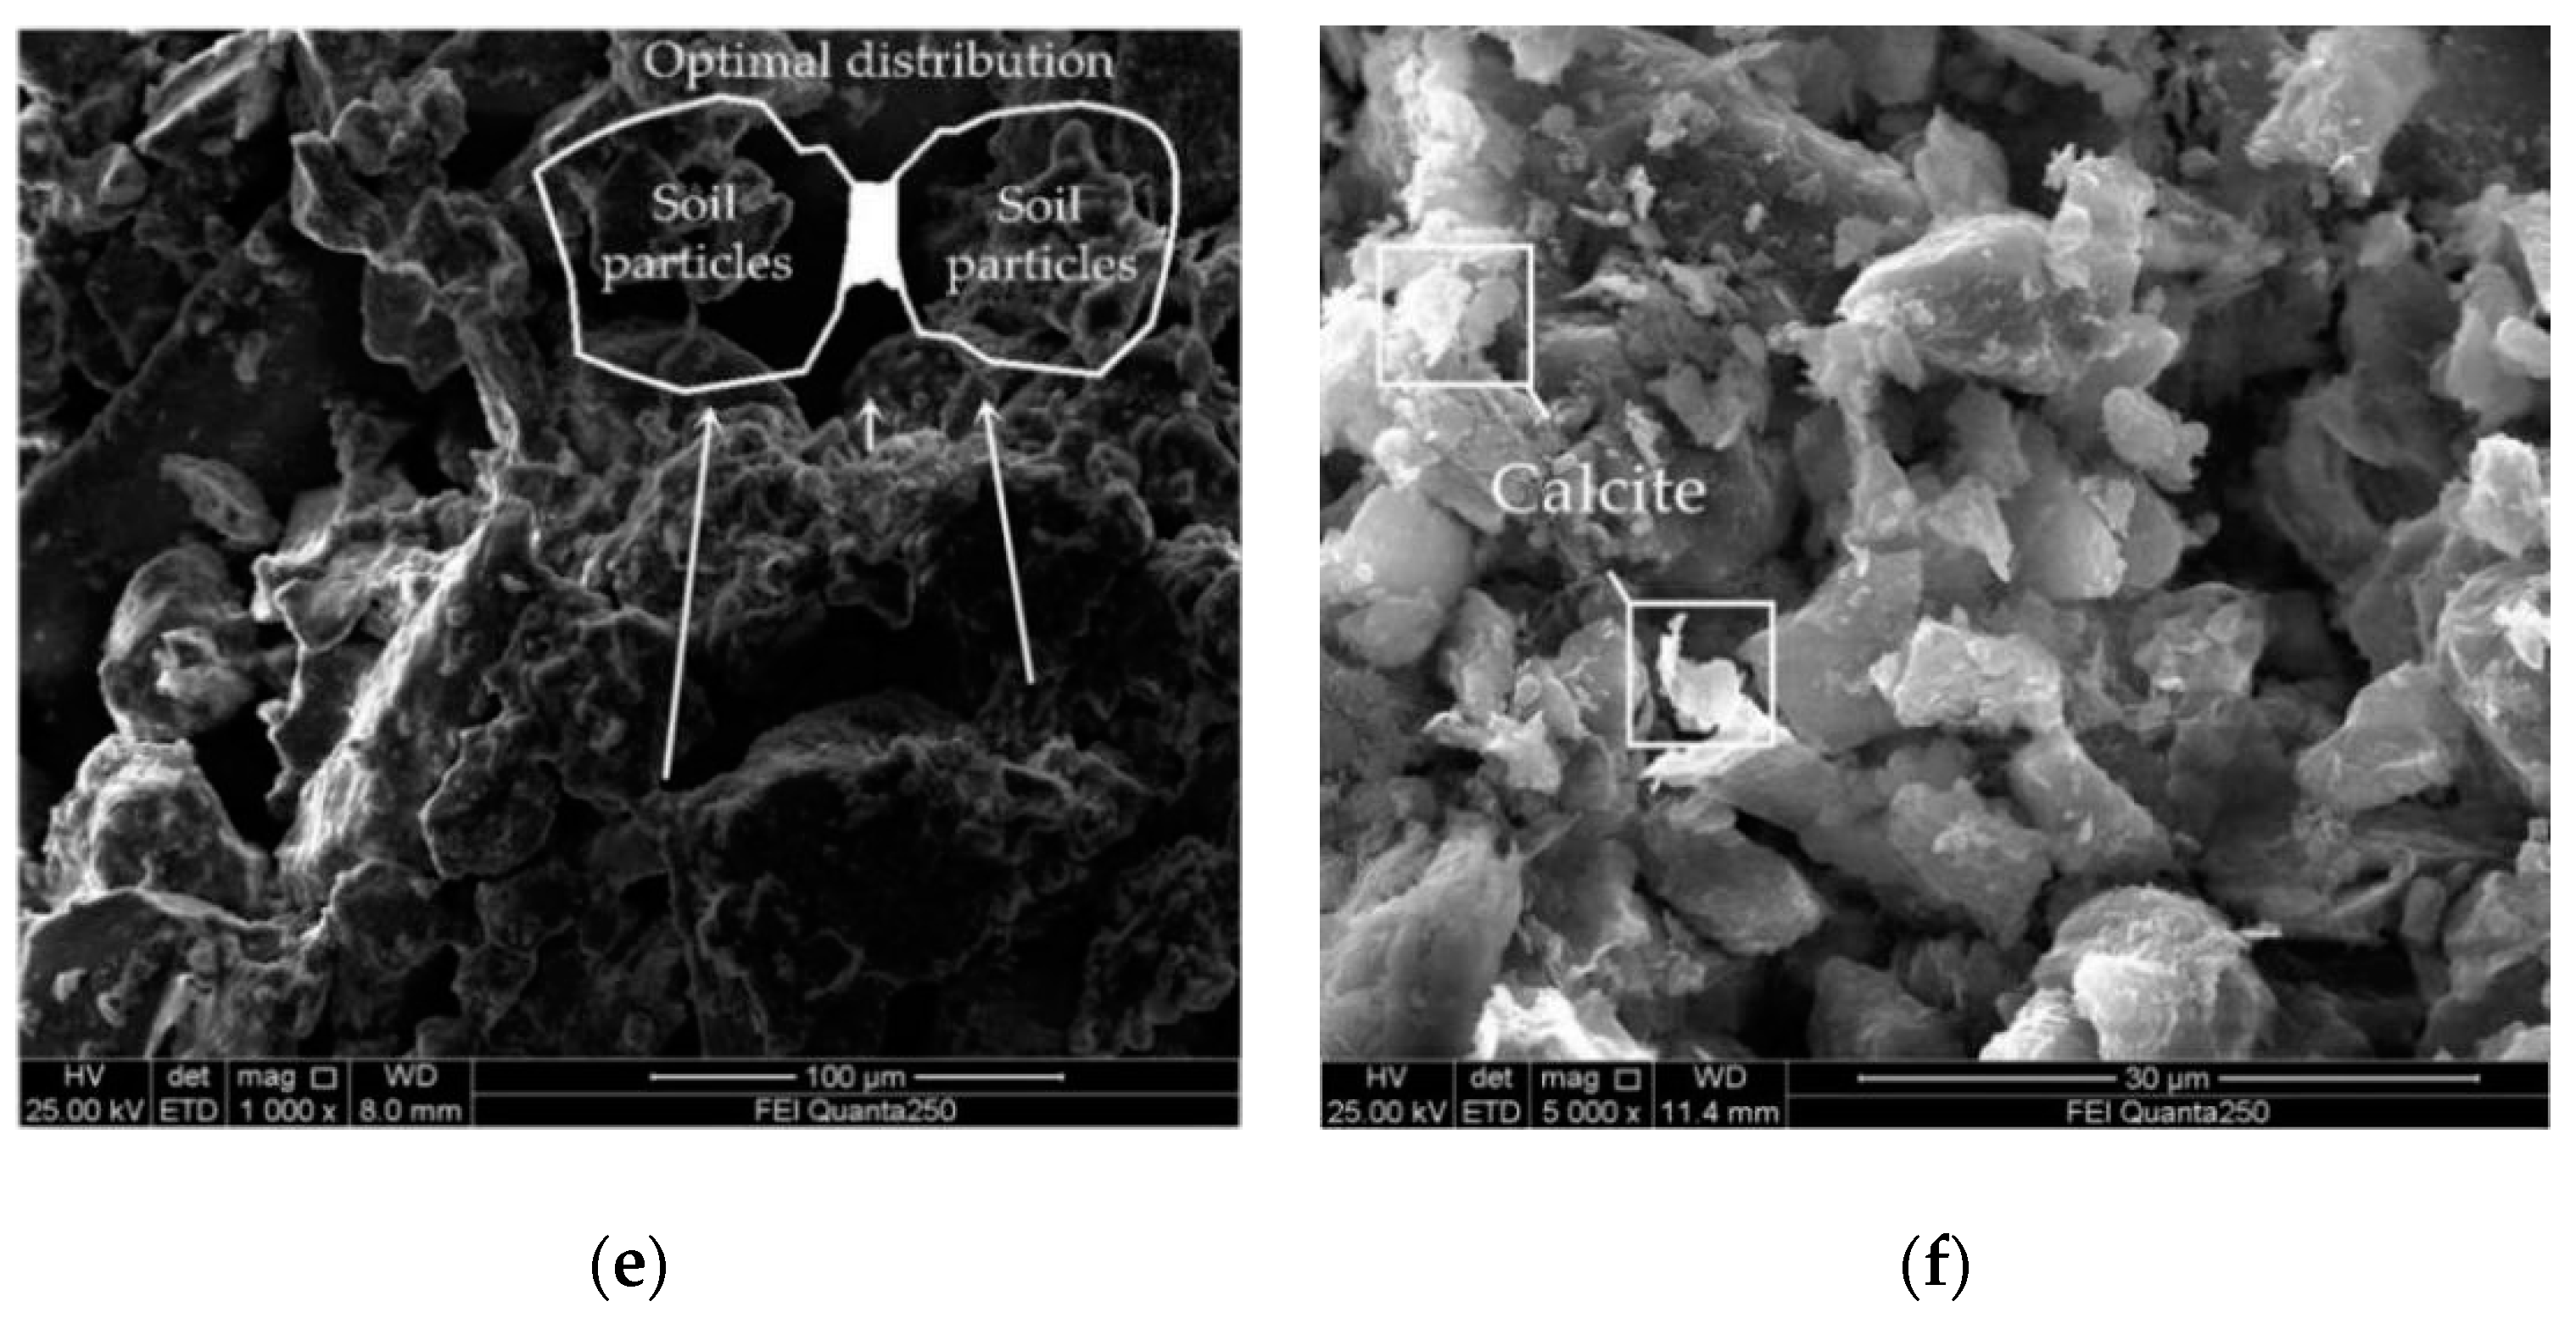
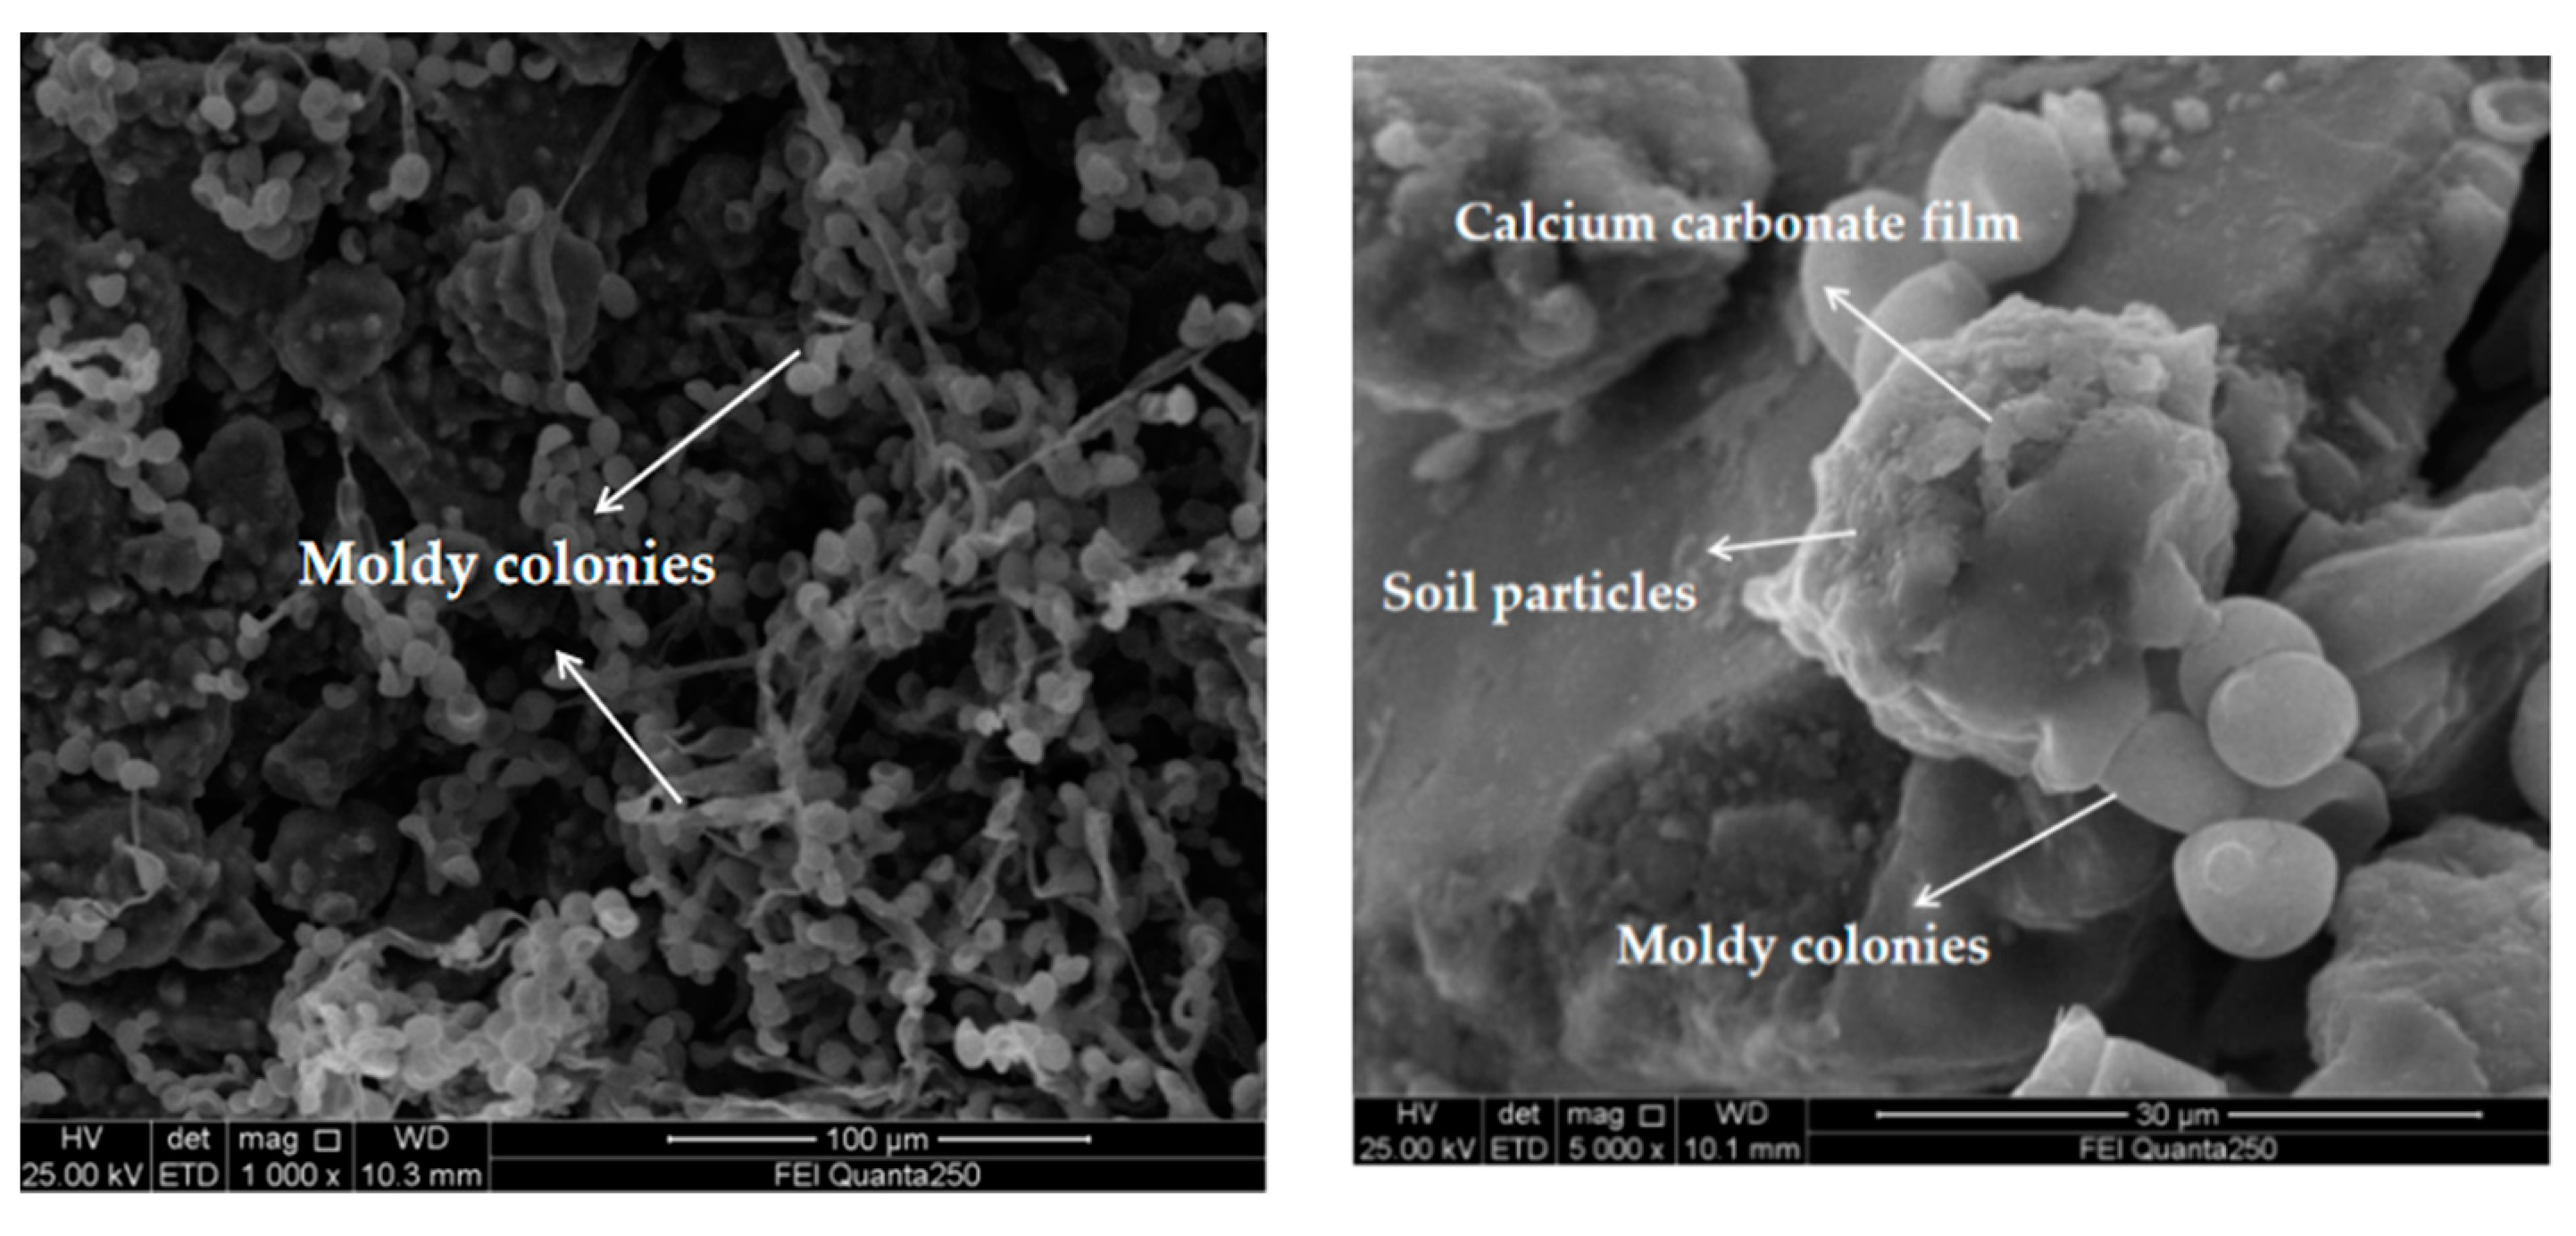
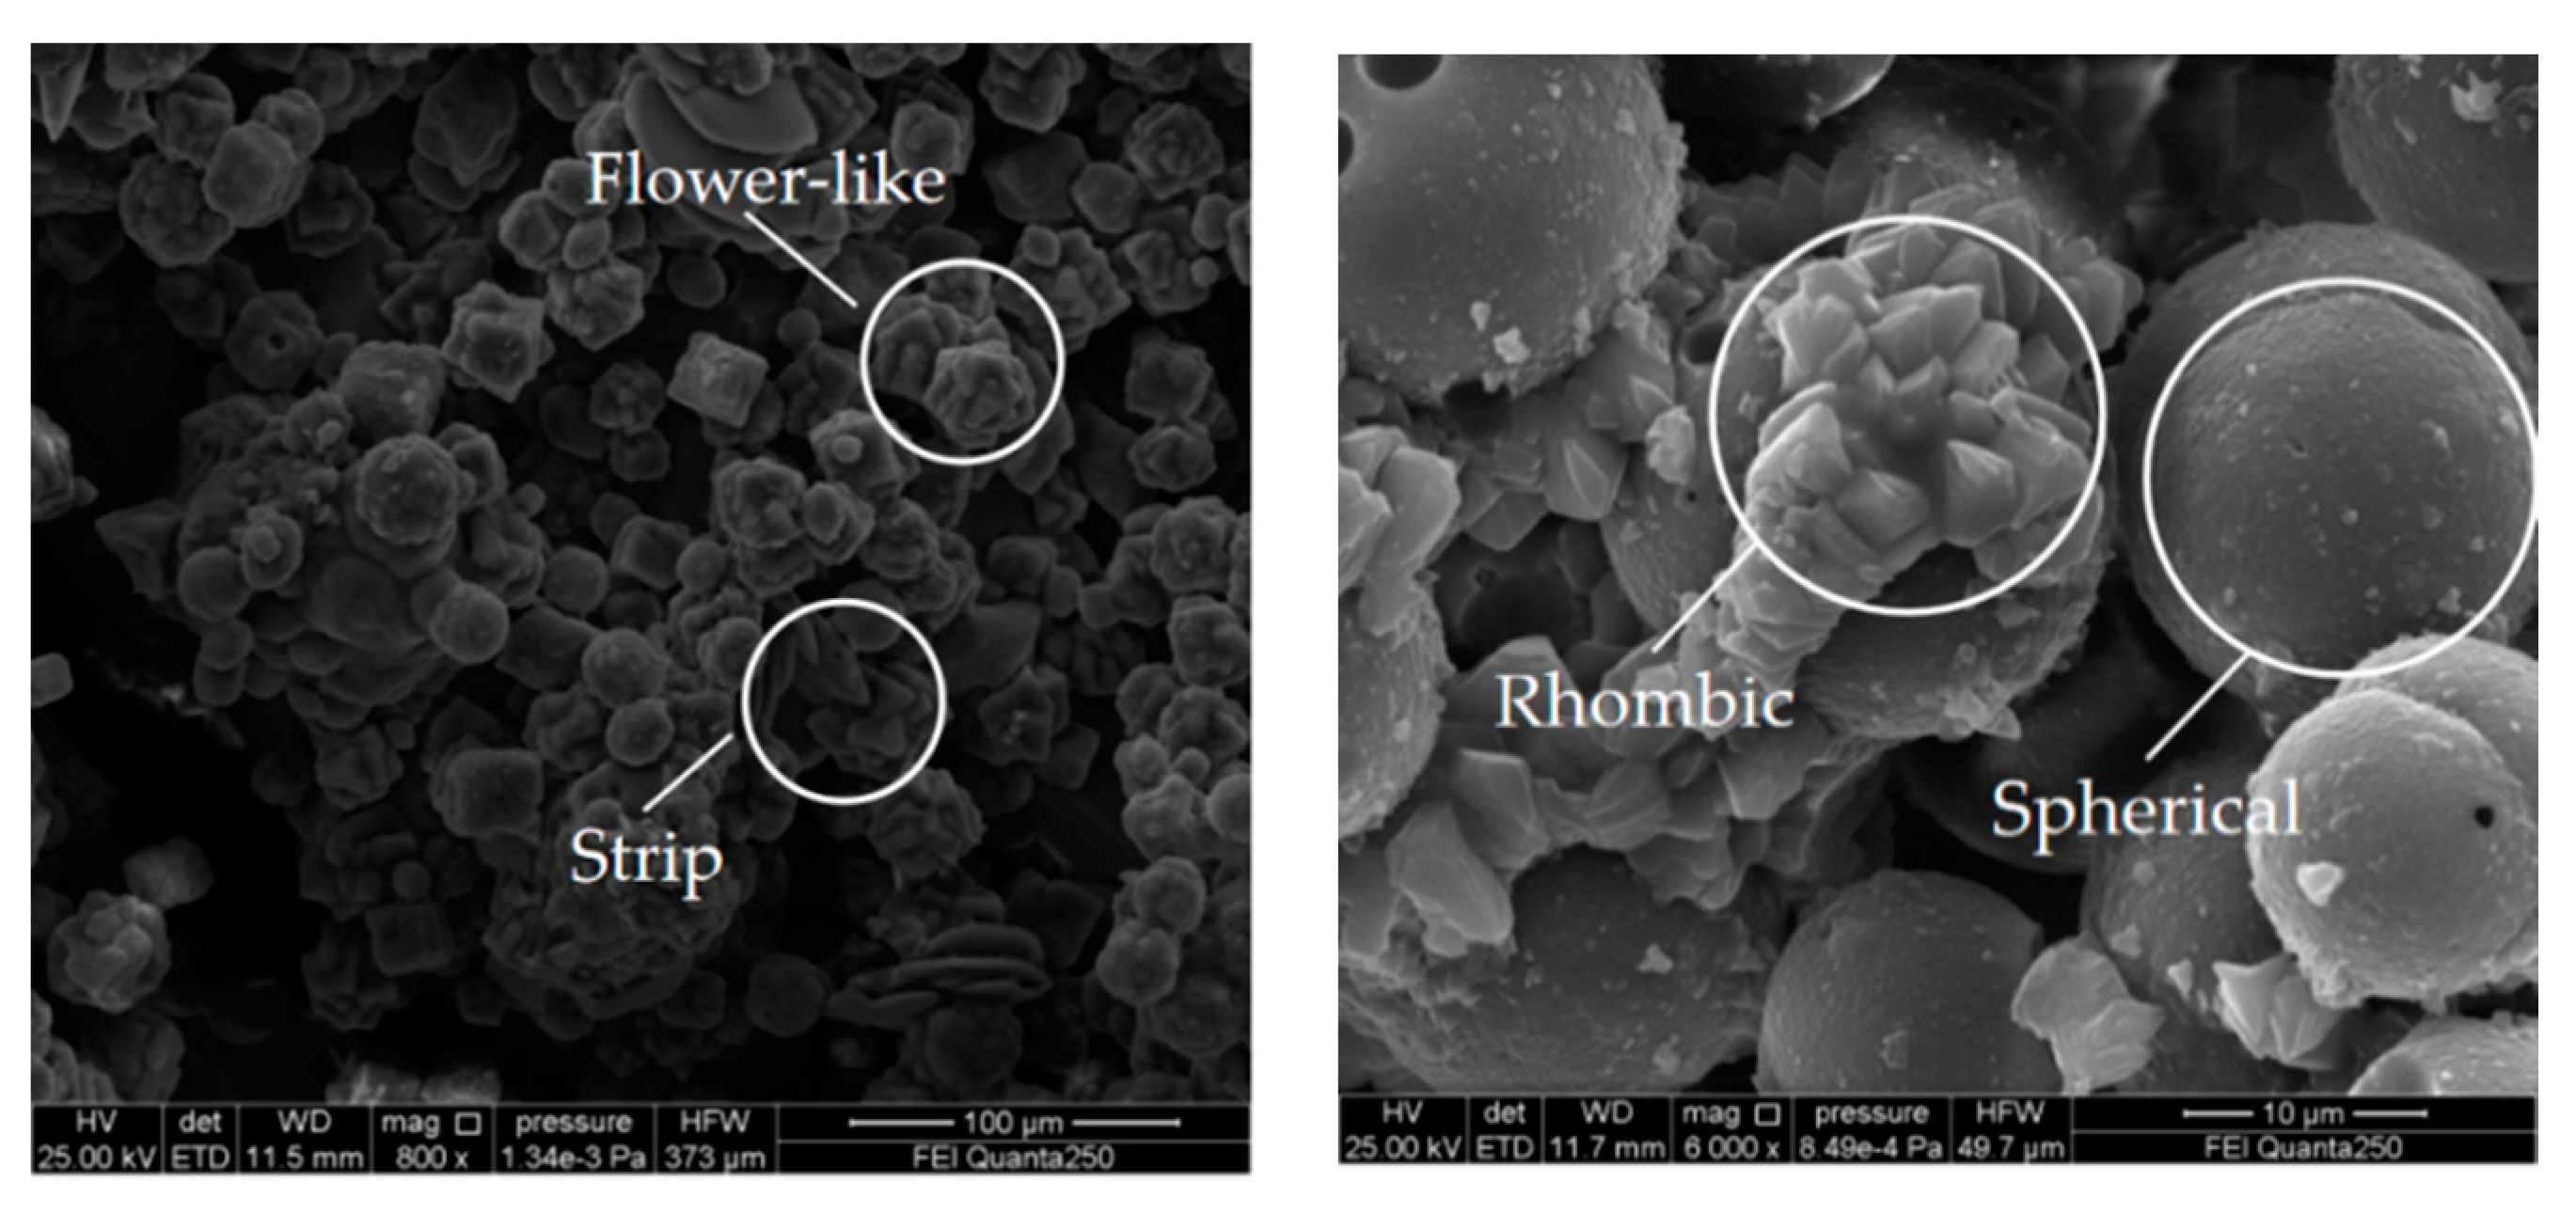
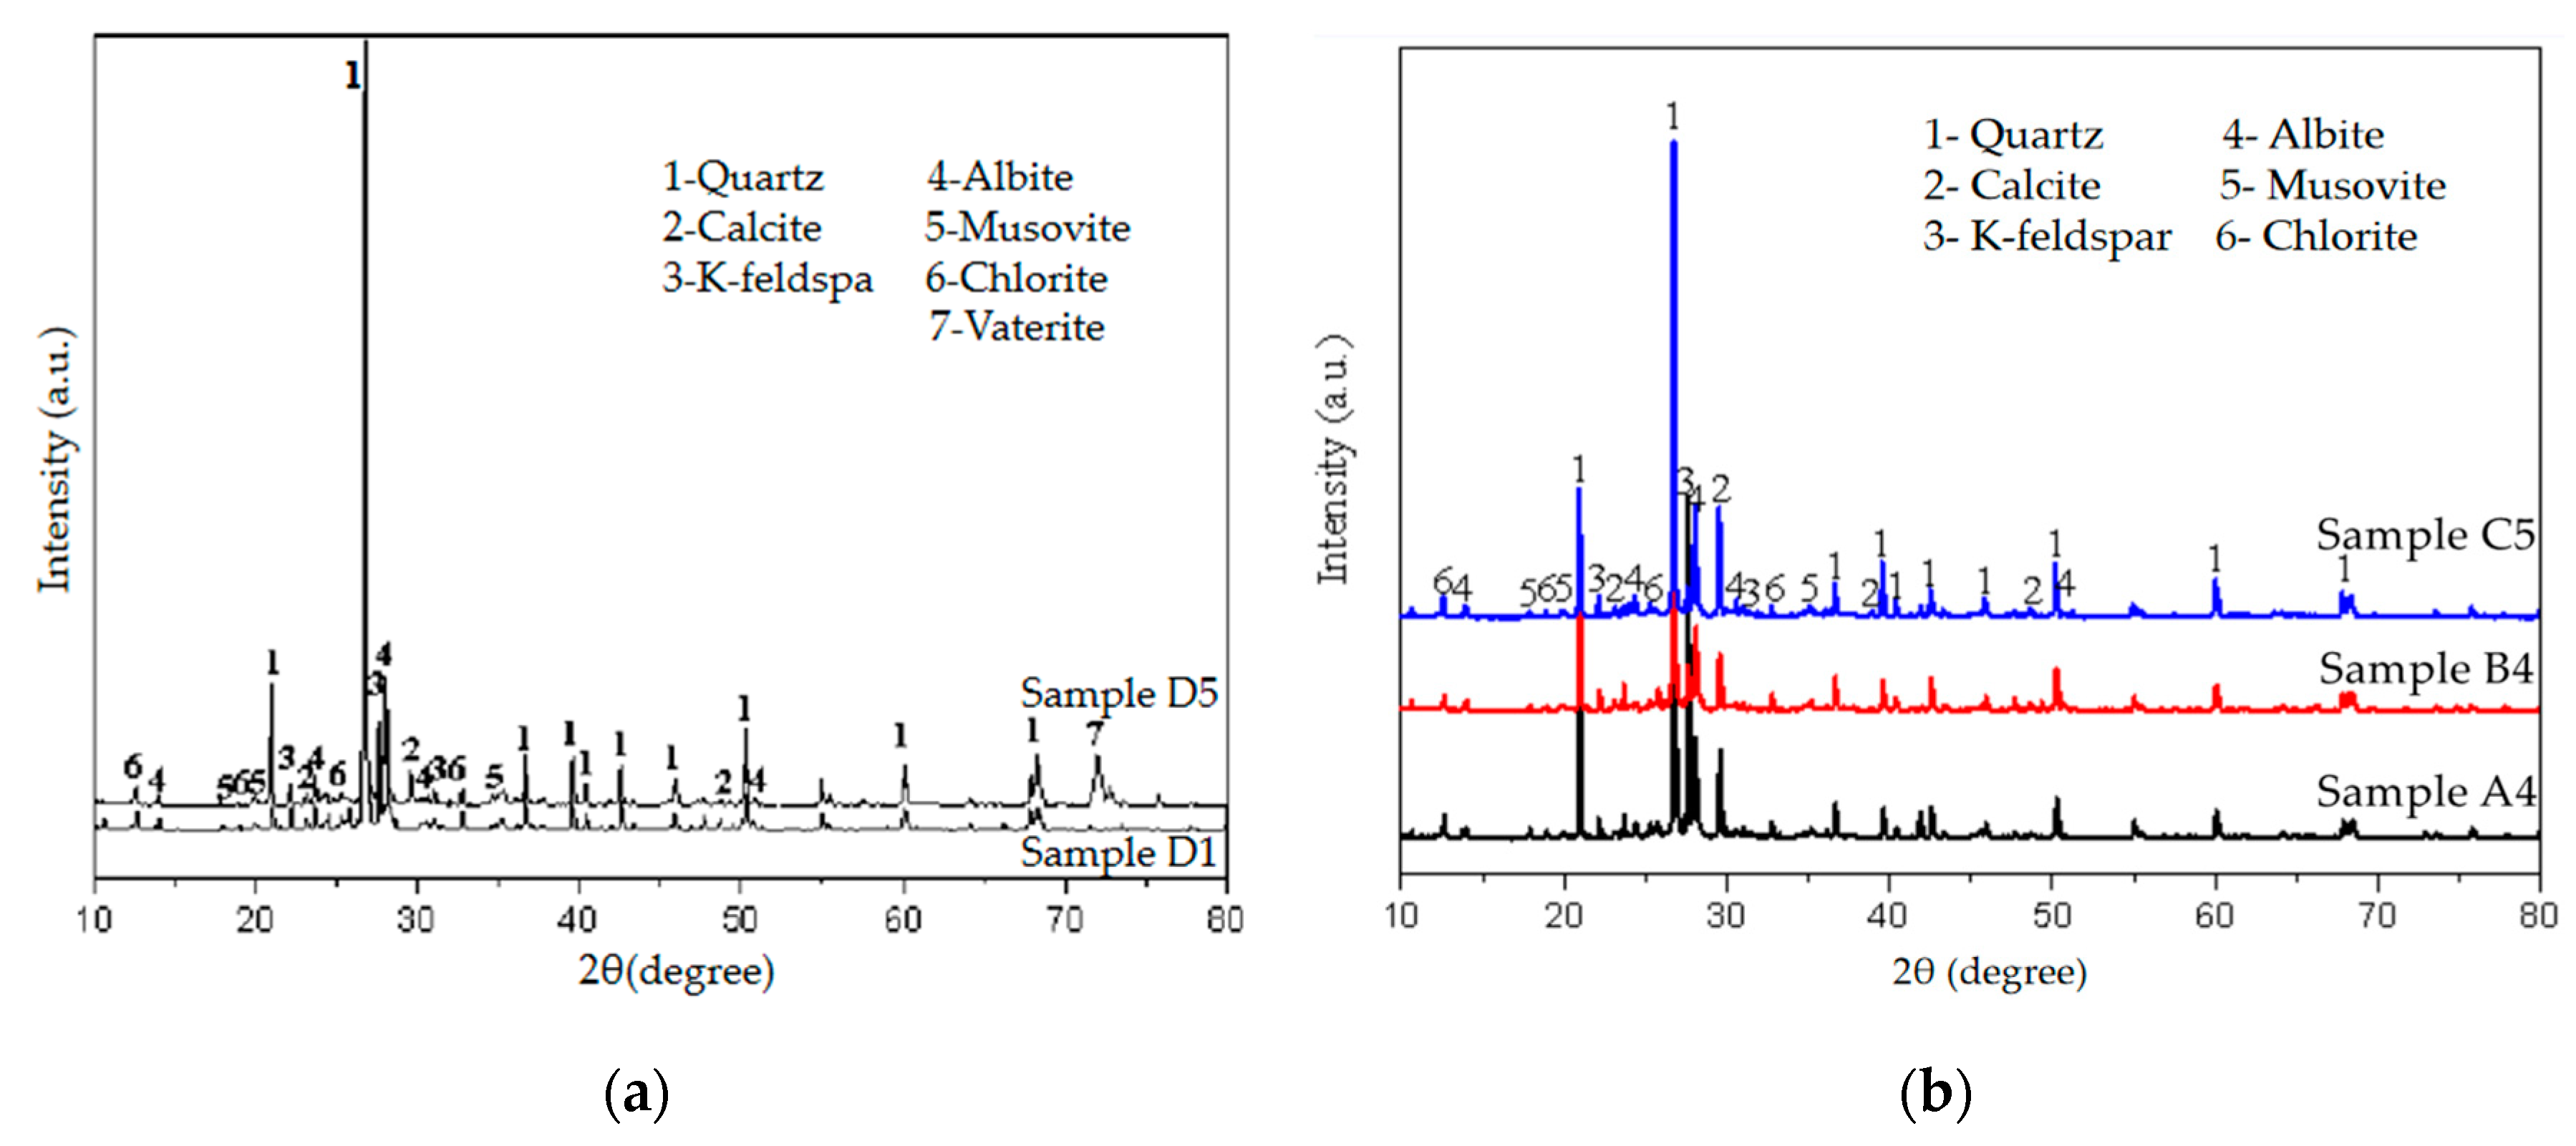
3.2.5. Microscopic Morphology

Figure 10 and Figure 11 compare the appearance characteristics of the soil before and after reinforcement observed by optical microscopy and USB hand-held digital microscopy, respectively. After treatment by the method proposed in this paper, areas of the surface of the soil obviously turned white, and the soil particles were filled and cemented by a large number of small white particles.
Figure 12 shows the SEM images of representative samples. The SEM images of the soil improved by EICP with different kinds of organic materials added are similar, taking A4 (Table 2, EICP with skim milk powder) as an example. It is obvious that the intergranular pores of the untreated silt in the Yellow River flood area were large and many noncontact areas existed between the particles (Figure 12a,b). Although some areas formed relatively concentrated calcium carbonate crystals after strengthening by EICP, which filled in the pores in the soil particles and cemented the particles well, most of the calcium carbonate crystals were still single particles dispersed on the surface of the soil particles with equal thickness distributions (Figure 12c). The calcium carbonate mostly comprised unstable vaterite, with only a small part of calcite [1] (Figure 12d). There were still many pores between the particles. This was because the urease [18,19] used in EICP is a free type and lacks nucleation sites, which had a negative impact on the continuous stacking, bonding, and formation of large calcium carbonate crystals. From Figure 12e,f, there were fewer calcium carbonate crystals in the single particle distribution, more calcium carbonate crystals in concentrated clusters, and the generated calcium carbonate mostly existed in the form of calcite with a size in the range of 5~10 μm compared with those from traditional EICP. A large amount of calcium carbonate crystals were produced on the surface of the unearthed particles and between the particles of the adjacent soil particles, similar to the behavior of MICP technology, although the urease used in the improved EICP was also free type. It shows that the incorporation of organic material can compensate for the lack of nucleation sites during traditional EICP.
During the test, a few samples exhibited a mildew phenomenon (Figure 13) due to the long curing time (approximately 30 d), which may decrease the strength of reinforced soil. The calcium carbonate crystals formed in this study were mostly spherical and square [50], and flower-like, striped, and rhombic calcium carbonate crystals also appeared under different conditions, such as different temperatures, pH values, and concentrations, in subsequent experiments (Figure 14). The durability of soil treated by EICP containing organic materials and the influence of experimental conditions on the crystal morphology of calcium carbonate still need further investigation.
The untreated silt in the Yellow River flood area contains quartz, sodium feldspar, calcite, muscovite, potassium feldspar, and chlorite. The calcite diffraction peak appeared in the XRD spectrum, and its intensity was relatively low (Figure 15a). After treatment with EICP, the calcium carbonate mostly comprised vaterite, with a small amount of calcite, which is consistent with the results of the SEM observations. When the soil solidified with EICP containing organic material, the calcium carbonate in the soil comprised calcite, and vaterite diffraction peaks were not present (Figure 15b). This shows that the incorporation of organic materials contributed to the transformation of calcium carbonate crystals from vaterite to calcite and guided the formation of calcium carbonate crystals [30].

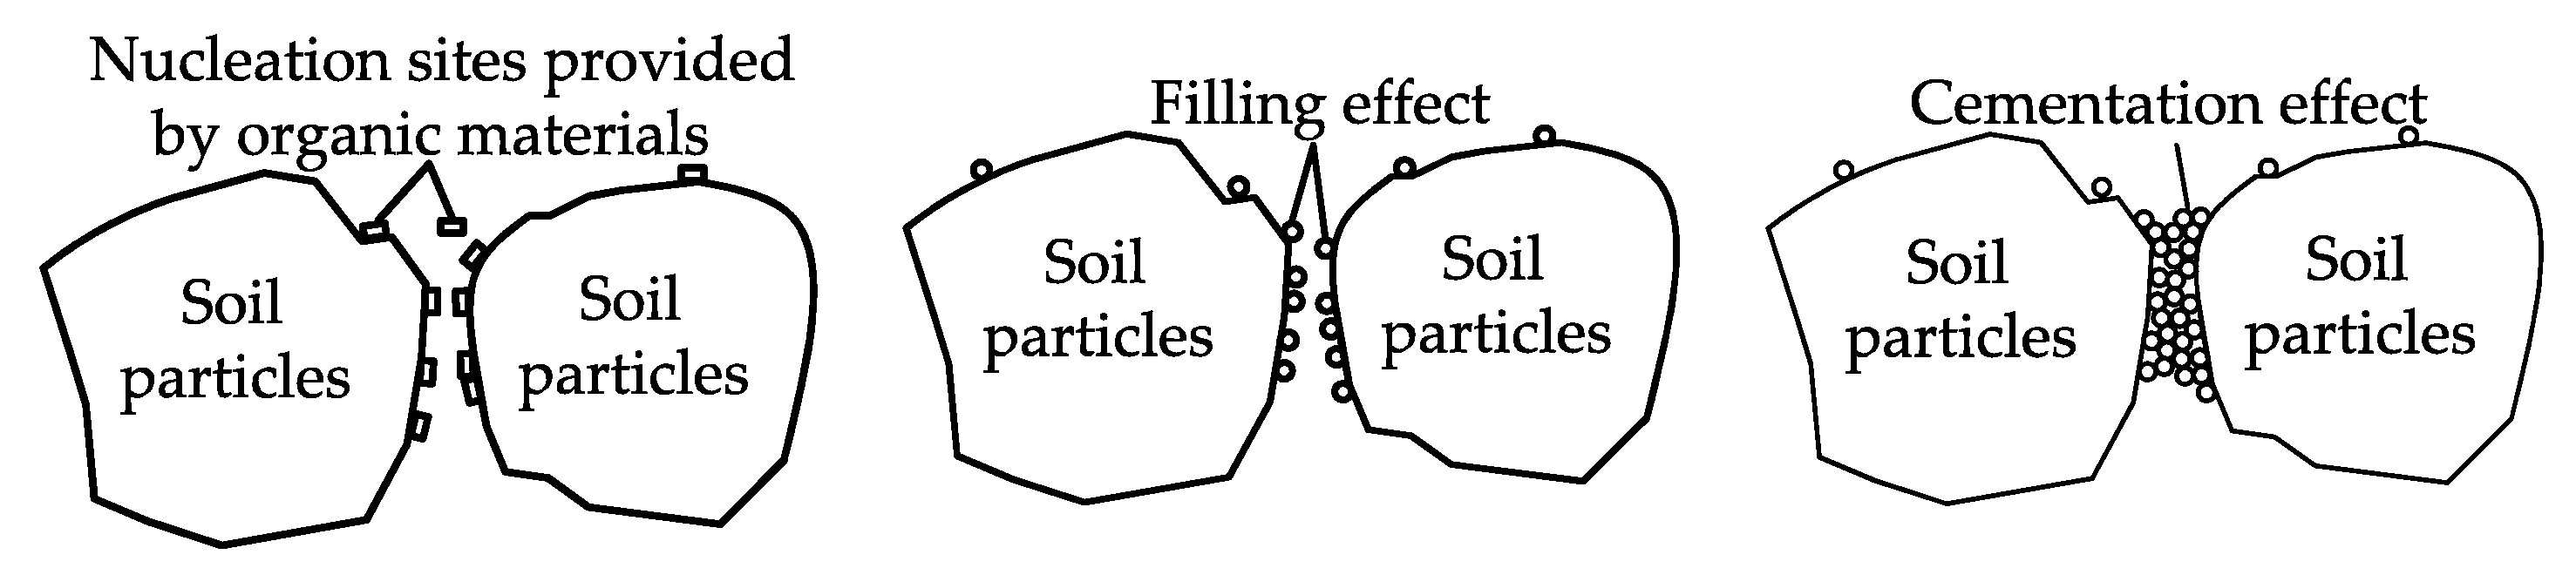
3.3. Reinforcement Mechanism

The effects of adding organic material can be predicted based on its chemistry. Amylopectin in glutinous rice flour may provide coordination sites for calcium ion, and calcium ions would be more regular and denser. When sucrose molecules in brown sugar encounter calcium ions, they form a complex, and the highly active alcohol hydroxyl groups participate in the formation of calcium carbonate. Casein proteins in skimmed milk powder bind to the calcium ion and salt out, resulting in the aggregation of casein precipitation, which can be used as the nucleation center of calcium carbonate; casein also has an obvious ability to chelate calcium ions [30,31,45].
The soil consolidation mechanism of EICP combined with organic materials is described in Figure 16. There were many noncontact areas between the particles of untreated soil. The incorporation of organic materials provided nucleation sites for the precipitation of calcium carbonate so that the newly generated calcium carbonate crystals accumulated continuously, and the adjacent crystals merged due to volume enlargement, finally producing multiparticle cluster crystals with concentrated morphologies. These large calcium carbonate crystals were produced between soil particles (optimal distribution), which bonded the soil particles and improved the integrity of the soil. However, the specific chemical reaction process after mixing organic materials needs to be further analyzed with the help of other experiments and knowledge of environment, biology, chemistry, and other disciplines.

4. Conclusions

  • At low cementation solution concentrations, when CaCl2:urea reaches 1:1, the amount of urea basically reaches the inhibition limit, and it is not economical to boost the ratio of urea. At high concentrations of cementation solution, the suitable ratio of CaCl2:urea should be 1:1.5 for economic reasons. The process of EICP can be divided into three stages: an express reaction period, a weak period, and a stable period. The first stage of EICP can provide a higher urease activity than MICP, but it is easy to inhibit because of the lack of cell structure protection, and the calcium carbonate precipitation efficiency is reduced. The lower the cementation solution concentration is, the shorter the duration of the rapid reaction period and the earlier the reaction ends. An total of 41~68% of the whole reaction can be completed within the first 4 h of the reaction, and 87~98% can be accomplished in 24 h. When the cementation solution concentration is 1.6 M, the calcium carbonate precipitation ratio is the highest.
  • The optimal concentrations of skim milk powder, glutinous rice powder, and brown sugar are 8 g/L, 8 g/L, and 16 g/L, respectively. The strengthening effect of adding any one of the three organic materials alone is generally poor, and the strength is only increased from 6~52% compared to that of the untreated soil. The strength through the improved EICP method containing organic material is nearly 4 times higher than that of the original soil and 25~33% higher than that of traditional EICP. The improvement from skim milk powder is the best herein, followed by glutinous rice powder, and that with the brown sugar was the weakest. The modification effect difference is mainly due to the different template and matrix amounts of nucleation sites for calcium carbonate crystal formation.
  • The improvement effect of EICP combined with organic materials is not the simple superposition of the two alone. The incorporation of organic materials can promote calcium carbonate to continuously accumulate and stack to form new crystals with the constituents of organic materials as templates and nucleation sites, producing multiparticle cluster-shaped crystals, which can facilitate the transition of calcium carbonate crystals from vaterite to calcite and compensate for the lack of nucleation sites and low strengthening efficiency of fine-grained soil in traditional EICP.
  • Considering the difficulty of injecting the treatment solution into fine-grained soil, multiple injection cycles were not adopted. The treatment solution containing organic materials was mixed with silt in this study, and the total amount of reaction liquid was less. Compared with EICP, the CCC changes little (approximately 1%), the strength is increased by approximately 33%, and the strength enhancement efficiency is raised by 32% through modified-EICP treatment, which shows that the improvement of modified EICP is mainly attributed to an optimization in the calcium carbonate crystal structure. Soil reinforced by both EICP and improved EICP shows brittle failure. The greater the strength increases, the more obvious its brittle failure characteristics.

Author Contributions

Conceptualization, H.Y. and Z.Z.; methodology, G.R. and Z.Z.; software, W.Z.; validation, G.R., K.L., and W.Z.; formal analysis, H.Y. and G.R.; investigation, H.Y.; resources, Z.Z.; data curation, G.R. and K.L.; writing—original draft preparation, G.R.; writing—review and editing, H.Y. and Z.Z.; visualization, G.R.; supervision Z.Z.; project administration, Z.Z.; funding acquisition, Y.H. All authors have read and agreed to the published version of the manuscript.

Funding

This research was funded by the Key Research and Development Project of Henan Province (Science and Technology Research Project) (Grant No. 202102310247).

Acknowledgments

All authors thank the anonymous reviewers and the editor for the constructive comments on the earlier version of the manuscript.

Conflicts of Interest

The authors declare no conflict of interest.

References

  1. Khodadadi, H.T.; Edward, K.; Leon, V.P. Bio-grout materials: A review. In Grouting 2017: Grouting, Drilling, and Verification, Proceedings of the Fifth International Conference on Grouting, Honolulu, HI, USA, 9–12 July 2017; Byle, M.J., Johnsen, L.F., Eds.; ASCE: Reston, VA, USA, 2017. [Google Scholar] [CrossRef]
  2. Wang, H.M.; Wu, X.P.; Qiu, X.; Liu, D. Microbially induced carbonate precipitation: A review. Microbiol. China 2013, 40, 180–189. [Google Scholar]
  3. Whifftn, V.S. Microbial CaCO3 Precipitation for the Production of Biocement. Ph.D. Thesis, Murdoch University, Perth, WA, Australia, 2004. [Google Scholar]
  4. Dejong, J.T.; Fritzges, M.B.; Nusslein, K. Microbially induced cementation to control sand response to undrained shear. J. Geotech. Geoenviron. 2006, 132, 1381–1392. [Google Scholar] [CrossRef]
  5. Zhao, Y.; Ge, F.; Yang, Y.X. Factors affecting bio-cemented typical silt from middle and lower reaches of Yellow River. In IOP Conf. Ser.: Earth Environ. Sci., 2019 International Conference on Civil and Hydraulic Engineering; St. F.X. University: Antigonish, NS, Canada, 2019; Volume 304, p. 022061. [Google Scholar] [CrossRef]
  6. Choi, S.G.; Wu, S.; Chu, J. Biocementation for sand using an eggshell as calcium source. J. Geotech. Geoenviron. Eng. 2016, 142, 06016010. [Google Scholar] [CrossRef]
  7. Qian, C.X.; Luo, M.; Pan, Q.F.; Li, R.Y. Mechanism of microbially induced calcite precipitation in self-healing concrete. J. Chin. Ceram. Soc. 2013, 41, 620–626. [Google Scholar]
  8. Ashkan, N.; Shahin, S.; Brina, M. Influence of microbe and enzyme-induced treatments on cemented sand shear response. J. Geotech. Geoenviron. 2019, 145, 06019008. [Google Scholar] [CrossRef]
  9. Cheng, L.; Shahin, M.A.; Cord-ruwisch, R. Bio-cementation of sandy soil using microbially induced carbonate precipitation for marine environments. Geotechnique 2014, 64, 1010–1013. [Google Scholar] [CrossRef]
  10. Simatupang, M.; Okamura, M. Liquefaction resistance of sand remediated with carbonate precipitation at different degrees of saturation during curing. Soils Found. 2017, 57, 619–631. [Google Scholar] [CrossRef]
  11. Wang, X.R.; Tao, J.L.; Bao, R.T.; Tran, T.; Tucker-Kulesza, S. Surficial soil stabilization against water-induced erosion using polymer-modified microbially induced carbonate precipitation. J. Mater. Civ. Eng. 2018, 30, 04018267. [Google Scholar] [CrossRef]
  12. Liu, K.W.; Jiang, N.J.; Qin, J.D.; Wang, Y.J.; Tang, C.S.; Han, X.L. An experimental study of mitigating coastal sand dune erosion by microbial- and enzymatic-induced carbonate precipitation. Acta Geotech. 2020. [Google Scholar] [CrossRef]
  13. Daryono, L.R.; Nakashima, K.; Kawasaki, S.; Titisari, A.D.; Barianto, D.H. Sediment characteristics of beachrock: A baseline investigation based on microbial induced carbonate precipitation at krakal-sadranan beach, yogyakarta, indonesia. Appl. Sci. 2020, 10, 520520. [Google Scholar] [CrossRef] [Green Version]
  14. Miao, L.C.; Wu, L.Y.; Sun, X.H.; Li, X.; Zhang, J.Z. Method for solidifying desert sands with enzyme-catalysed mineralization. Land Degrad. Dev. 2020, 31, 1317–1324. [Google Scholar] [CrossRef]
  15. Hamdan, N.; Kavazanjian, E. Enzyme-induced carbonate mineral precipitation for fugitive dust control. Geotechnique 2016, 66, 546–555. [Google Scholar] [CrossRef]
  16. Dong, F.Q. Research progress of biomineralization in the treatment of heavy metal contamination. Res. Environ. Sci. 2018, 31, 1182–1192. [Google Scholar] [CrossRef]
  17. Ossai, R.; Rivera, L.; Bandini, P. Experimental study to determine an EICP application method feasible for field treatment for soil erosion control. In Geo-Congress on Biogeotechnics, Minneapolis, MN, 25–28 February 2020; Kavazanjian, E., Hambleton, J.P., Eds.; ASCE: Reston, VA, USA, 2020; Volume 320, pp. 205–213. [Google Scholar] [CrossRef]
  18. Kavazanjian, E.; Hamdan, N. Enzyme induced carbonate precipitation (EICP) columns for ground improvement. In IFCEE 2015, Proceedings of the International Foundations Congress and Equipment Expo 2015, San Antonio, TX, 17–21 March 2015; Magued, I., Muhannad, T.S., Eds.; ASCE: Reston, VA, USA, 2015; Volume 256, pp. 2252–2261. [Google Scholar] [CrossRef]
  19. Dilrukshi, R.A.; Watanabe, J.; Kawasakis, N. Sand cementation test using plant-derived urease and calcium phosphate compound. Mater. Trans. 2015, 56, 1565–1572. [Google Scholar] [CrossRef] [Green Version]
  20. Wu, L.Y.; Miu, L.C.; Sun, X.H.; Chen, R.F.; Wang, C.C. Experimental study on sand solidification using plant-derived urease-induced calcium carbonate precipitation. Chin. J. Geotech. Eng. 2020, 42, 714–720. [Google Scholar] [CrossRef]
  21. Gao, Y.F.; He, J.; Tang, X.Y.; Chu, J. Calcium carbonate precipitation catalyzed by soybean urease as an improvement method for fine-grained soil. Soils Found. 2019, 59, 1631–1637. [Google Scholar] [CrossRef]
  22. Dilrukshi, R.A.N.; Nakashima, K.; Kawasaki, S. Soil improvement using plant-derived urease-induced calcium carbonate precipitation. Soils Found. 2018, 58, 894–910. [Google Scholar] [CrossRef]
  23. Kavazanjian, E.; Almajed, A.; Hamdan, N. Bio-inspired soil improvement using EICP soil columns and soil nails. In Grouting 2017: Grouting, Drilling, and Verification, Proceedings of the Fifth International Conference on Grouting, Honolulu, HI, USA, 9–12 July 2017; Byle, M.J., Johnsen, L.F., Eds.; ASCE: Reston, VA, USA, 2017; Volume 288, pp. 13–22. [Google Scholar] [CrossRef]
  24. Yuan, P.B.; Dai, P.F.; Chen, W.W. Enzyme induced calcite precipitation (EICP) to strengthen the ability of anti-wind erosion of earthen archaeological sites. In Ancient Underground Opening and Preservation: Proceedings of the International Symposium on Scientific Problems and Long-Term Preservation of Large-scale Ancient Underground Engineering, Longyou, China, 23–26 October 2015; Yang, Z., Tanimoto, C., Eds.; CRC Press: Hangzhou, Zhejiang, China, 2015; pp. 327–336. [Google Scholar]
  25. Zhao, Q. Experimental Study on Soil Improvement Using Microbial Induced Calcite Precipitation (MICP). Ph.D. Thesis, China University of Geosciences, Beijing, China, 2014. [Google Scholar]
  26. Hamdan, N.; Zhao, Z.; Mujica, M.; Kavazanjian, E., Jr.; He, X.M. Hydrogel-assisted enzyme-induced carbonate mineral precipitation. J. Mater. Civ. Eng. 2016, 28, 04016089. [Google Scholar] [CrossRef]
  27. Putra, H.; Yasuhara, H.; Erizal; Sutoyo; Fauzan, M. Review of enzyme-induced calcite precipitation as a ground-improvement technique. Infrastructures 2020, 5. [Google Scholar] [CrossRef]
  28. Refaei, M.; Arab, M.G.; Omar, M. Sandy soil improvement through biopolymer assisted EICP. In Geotechnical Special Publication, 1st Session on Foundations, Soil Improvement, And Erosion at Geo-Congress on Vision, Insight, Outlook: Minneapolis, MN, 25–28 February 2020; Hambleton, J.P., Makhnenko, R., Eds.; ASCE: Reston, VA, USA, 2020; Volume 315, pp. 612–619. [Google Scholar] [CrossRef]
  29. Nawarathna, T.H.K.; Nakashima, K.; Kawasaki, S. Chitosan enhances calcium carbonate precipitation and solidification mediated by bacteria. Int. J. Biol. Macromol. 2019, 133, 867–874. [Google Scholar] [CrossRef]
  30. Almajed, A.; Tirkolaei, H.K.; Kavazanjian, E.; Hamdan, N. Enzyme induced biocementated sand with high strength at low carbonate content. Sci. Rep. 2019, 9, 1135. [Google Scholar] [CrossRef] [PubMed] [Green Version]
  31. Li, X.Y.; Zhao, D.; Qin, Y.S. Recent progress in understanding the mechanism of the interaction between calcium and milk proteins and its influence on functional properties of milk proteins. Food Sci. 2019, 40, 340–345. [Google Scholar] [CrossRef]
  32. Rebata-Landa, V. Microbial Activity in Sediments: Effects on Soil Behavior. Ph.D. Thesis, Georgia Institute of Technology, Atlanta, GA, USA, 2007. [Google Scholar]
  33. Oliveira, P.J.V.; Freitas, L.D.; Carmona, J.P.S.F. Effect of soil type on the enzymatic calcium carbonate precipitation process used for soil improvement. J. Mater. Civ. Eng. 2016, 29, 04016263. [Google Scholar] [CrossRef]
  34. Hoang, T.P. Sand and Silty-Sand Soil Stabilization Using Bacterial Enzyme Induced Carbonate Precipitation (BEICP). Master’s Thesis, Iowa State University, Ames, IA, USA, 2018. [Google Scholar] [CrossRef]
  35. Almajed, A.; Abbas, H.; Arab, M.; Alsabhan, A.; Hamid, W.; Al-Salloum, Y. Enzyme-induced carbonate precipitation (EICP)-based methods for ecofriendly stabilization of different types of natural sands. J. Clean. Prod. 2020, 274, 122627. [Google Scholar] [CrossRef]
  36. Ferris, F.G.; Phoenix, V.; Fujita, Y.; Smith, R.W. Kinetics of calcite precipitation induced by ureolytic bacteria at 10 to 20 °C in artificial groundwater. Geochim. Cosmochim. 2004, 68, 1701–1710. [Google Scholar] [CrossRef]
  37. Li, C.J.; Wei, T.Y.; Ji, B.; Lei, X.W.; Wang, X. Study on MICP affected by different calcium sources and Ca2+ concentrations. Environ. Sci. Technol. 2018, 41, 30–34. [Google Scholar]
  38. Cui, M.J.; Lai, H.J.; Hoang, T.; Chu, J. One-phase-low-pH enzyme induced carbonate precipitation (EICP) method for soil improvement. Acta Geotech. 2020. [Google Scholar] [CrossRef]
  39. Duan, Y.; Xu, G.B.; Yang, D.F.; Yan, Y. Influencing factors of calcium ion utilization in MICP mineralized products and analysis of microscopic image. Chem. Ind. Eng. Prog. 2019, 38, 2306–2313. [Google Scholar]
  40. Ai Qabany, A.; Soga, K.; Santamarina, C. Factors affecting efficiency of microbially induced calcite precipitation. J. Geotech. Geoenviron. Eng. 2012, 138, 992–1001. [Google Scholar] [CrossRef]
  41. Cheng, L.; Shahin, M.A.; Mujah, D. Influence of key environmental conditions on microbially induced cementation for soil stabilization. J. Ceotech. Geoenviron. Eng. 2017, 143, 0001586. [Google Scholar] [CrossRef] [Green Version]
  42. Yin, L.Y.; Tang, C.S.; Xie, Y.H.; Lu, C.; Jiang, N.J.; Shi, B. Factors affecting improvement in engineering properties of geomaterials by microbial-induced calcite precipitation. Chin. J. Rock Mech. 2019, 40, 2525–2546. [Google Scholar] [CrossRef]
  43. Sun, X.H.; Miao, L.C.; Wu, L.Y. Applicability and theoretical calculation of enzymatic calcium carbonate precipitation for sand improvement. Geomicrobiol. J. 2020, 37, 389–399. [Google Scholar] [CrossRef]
  44. Hommel, J.; Akyel, A.; Frieling, Z.; Phillips, A.J.; Gerlach, R.; Cunningham, A.B.; Class, H. A numerical model for enzymatically induced calcium carbonate precipitation. Appl. Sci. 2020, 10, 4538. [Google Scholar] [CrossRef]
  45. Liu, H. Effect of Natural and Synthetic Macromolecular Organic Compounds on Calcium Carbonate Crystallization in Triangles. Master’s Thesis, Ocean University of China, Qingdao, China, 2014. [Google Scholar]
  46. Carmona, J.P.S.F.; Venda Oliveira, P.J.; Lemos, L.J.L.; Pedro, A.M.G. Improvement of a sandy soil by enzymatic calcium carbonate precipitation. Proc. Inst. Civ. Eng. Geotech. Eng. 2018, 171, 3–15. [Google Scholar] [CrossRef]
  47. Montoya, B.; DeJong, J. Stress-strain behavior of sands cemented by microbially induced calcite precipitation. J. Geotech. Geoenviron. Eng. 2015, 141, 04015019. [Google Scholar] [CrossRef]
  48. Choi, S.G.; Chu, J.; Kwon, T.H. Effect of chemical concentrations on strength and crystal size of biocemented sand. Geomech. Eng. 2019, 17, 465–473. [Google Scholar] [CrossRef]
  49. Zhang, Y.; Guo, H.; Cheng, X. Influences of calcium sources on microbially induced carbonate precipitation in porous media. Mater. Res. Innovat. 2014, 18, 79–84. [Google Scholar] [CrossRef]
  50. Ahenkorah, I.; Rahman, M.M.; Karim, M.R.; Teasdale, P.R. Optimization of enzyme induced carbonate precipitation (EICP) as a ground improvement technique. In Geotechnical Special Publication, 1st Session on Foundations, Soil Improvement, And Erosion at Geo-Congress on Vision, Insight, Outlook: Minneapolis, MN, 25–28 February 2020; Hambleton, J.P., Makhnenko, R., Eds.; ASCE: Reston, VA, USA, 2020; Volume 315, pp. 552–561. [Google Scholar] [CrossRef]
Figure 1. Site of soil sampling.
Applsci 10 07678 g001
Figure 2. Particle size distribution in silty soil from the Yellow River flood area in Henan, China.
Applsci 10 07678 g002
Figure 3. Change in residual calcium ion concentration and precipitation mass in different concentrations of cementation solutions.
Applsci 10 07678 g003
Figure 4. Calcium ion ratio that reacted in each sample at different times.
Applsci 10 07678 g004
Figure 5. Strength for soil modified by the improved EICP containing organic material.
Applsci 10 07678 g005
Figure 6. Unconfined compression strength for soil treated by different methods.
Applsci 10 07678 g006
Figure 7. Axial stress-strain curves of representative samples treated by (a) EICP and improved EICP with organic material added; and (b) one kind of organic material.
Applsci 10 07678 g007
Figure 8. CCC and strength enhancement efficiency of soil treated by different methods.
Applsci 10 07678 g008
Figure 9. Relationships between UCS and CCC.
Applsci 10 07678 g009
Figure 10. Images of the soil under an optical microscope: (a) untreated and (b) EICP + glutinous rice powder.
Applsci 10 07678 g010
Figure 11. Images of soil under a USB hand-held digital microscope: (a) untreated and (b) EICP + glutinous rice powder.
Applsci 10 07678 g011
Figure 12. SEM images for untreated soil at (a) 1000× magnification and (b) 5000× magnification, for EICP-treated soil at (c) 1000× magnification and (d) 5000× magnification, and for soil treated by EICP with skim milk powder added at (e) 1000× magnification and (f) 5000× magnification.
Applsci 10 07678 g012aApplsci 10 07678 g012b
Figure 13. Moldy sample.
Applsci 10 07678 g013
Figure 14. Crystal morphology of calcium carbonate in subsequent tests.
Applsci 10 07678 g014
Figure 15. XRD results for (a) D1 and D5 and (b) A4, B4, and C5.
Applsci 10 07678 g015
Figure 16. Mechanism of soil solidification by EICP combined with organic materials.
Applsci 10 07678 g016
Table 1. Properties of silty soil.
Liquid Limit (%)Plastic Limit (%)Plasticity IndexNatural Water Content (%)Natural Density (g·cm−3)Dry Density (g·cm−3)
26.0716.119.9615.151.941.68
Table 2. Scheme of soil reinforcement tests.
Treatment NumberTreatment MethodOrganic Material Concentration (g·L−1)Number of TestsObjective
UCSBTSCCCSEMXRD
A1EICP + skim milk powder233---Determine the optimum concentration of skim milk powder α1
A2433---
A3633---
A4833311
A51633---
A63233---
B1EICP + glutinous rice powder233---Determine the optimum concentration of glutinous rice powder α2
B2433---
B3633---
B4833311
B51633---
B63233---
C1EICP + brown sugar233---Determine the optimum concentration of brown sugar α3
C2433---
C3633---
C4833---
C51633311
C63233---
D1Untreated03-311Control group
D2Skim milk powderα13----
D3Glutinous rice powderα23----
D4Brown sugarα33----
D5EICP03-311
Note: Soil used in calcium carbonate content (CCC), SEM, and XRD tests were collected from samples after strength tests.
Table 3. Precipitation mass for different constituent concentrations and proportions.
Test NumberCaCl2 (M)Urea (M)CaCl2:UreaPrecipitation Mass (g), 1Precipitation Mass (g), 2Precipitation Mass (g), 3Precipitation Mass (g), Average
10.50.3751:0.750.87120.93920.91620.9089
210.751:0.750.94210.96610.89720.9351
31.51.1251:0.750.41360.38950.38410.3957
40.50.51:11.31081.38221.35291.3486
5111:11.44191.38421.39141.4058
61.51.51:10.66360.62680.67210.6542
70.50.6251:1.251.4211.41711.3711.4030
811.251:1.251.45881.47371.46951.4673
91.51.8751:1.250.77980.76520.78550.7768
100.50.751:1.51.46111.42091.47681.4529
1111.51:1.51.50141.54231.51821.5206
121.52.251:1.50.84630.87130.88980.8691
130.50.8751:1.751.461.49121.43211.4611
1411.751:1.751.52311.54071.50091.5216
151.52.6251:1.750.91830.92240.90170.9141
Table 4. Mean UCS and the strength increasing rate of the proposed methods.
Treatment NumberTreatment MethodMean UCS (kPa)Rate Higher Than Untreated Soil (%)Rate Higher Than EICP-Treated Soil (%)
D1Untreated324.76--
D2Skim milk powder442.1836.16-
D3Glutinous rice powder345.076.25-
D4Brown sugar494.2252.18-
D5EICP1167.23259.41-
A4EICP + skim milk powder1547.95376.6432.62
B4EICP + glutinous rice powder1464.52350.9525.47
C5EICP + brown sugar1455.41348.1524.69
Table 5. Parameters obtained from the UCS tests.
Treatment MethodElastic Modulus (MPa)Failure Strain εmax (%)Peak Strength (kPa)Peak Strain (%)
Untreated19.12.7324.761.7
Skim milk powder27.022.5442.181.5
Glutinous rice powder23.672.45345.071.6
Brown sugar31.982.35494.221.5
EICP80.52.151167.231.45
EICP + skim milk powder123.841.651547.951.25
EICP + glutinous rice powder112.661.71464.521.3
EICP + brown sugar103.962.11455.411.4
Publisher’s Note: MDPI stays neutral with regard to jurisdictional claims in published maps and institutional affiliations.

