Probabilistic Analysis of a Hospital Building Slab Foundation

Department of Structural Mechanics, Slovak University of Technology, 810 05 Bratislava, Slovakia
*
Author to whom correspondence should be addressed.
Appl. Sci. 2020, 10(21), 7887; https://0-doi-org.brum.beds.ac.uk/10.3390/app10217887
Submission received: 23 September 2020
/
Revised: 3 November 2020
/
Accepted: 4 November 2020
/
Published: 6 November 2020
(This article belongs to the Special Issue Reliability Techniques in Industrial Design)
Abstract
:This paper deals with the design of a five-storey hospital building, in which we focus on the deterministic and probabilistic analysis of its slab foundation. The hospital building bearing structure was modeled as a reinforced concrete skeleton. The Boussinesque model was selected for the subsoil under the plate foundation, which was a model of the elastic half-space, where properties of individual layers of the subsoil were entered according to the geological survey. The geological topology consisted of clay gravel and also included a layer of clay sand. In the stochastic solution, the variance of values was considered for individual mechanical properties of different types of soil. We analyzed the influence of the variance of input values on the resulting deflections, strain, and stress state of the plate foundation. Two variants of the solution were considered on the given numerical example. Probability calculations confirmed the probability of failure, which was allowed for the second limit state.
1. Introduction
This paper deals with the base plate under a hospital building. It is a reinforced concrete slab that is 500 mm thick, which lies on a layered subsoil. The contact between the base plate and the subsoil only considers the transmission of normal stress, without considering the shear in the foundation joint. The paper is divided into two main parts. The slab is solved by a deterministic and probabilistic approach. We focus on foundation slabs rested on an elastic foundation. From a number of mathematical and material models of the elastic foundation, the model of an elastic half-space (Boussinesque’s) was selected. Relationships for stress and strain of an elastic half-space have been described in the literature [1,2,3,4,5,6,7]. From the point of view of the use of computer technology, these are more demanding tasks. The mathematical formulation of the contact problem of the slab and the subsoil, elastic half-space, was described by differential equations. The solution of equations was done by the finite element method (FEM). Because three-dimensional (3D) finite elements are needed to describe an elastic half-space using FEM, we chose the ANSYS system to solve the examples of subsoil slabs. In this solution, where we modeled the elastic half-space as a block of sufficiently large dimensions, the height of a block had an effect in the solution of the problem. This was the depth at which the block, representing the earth body, was supported and was prevented from the vertical displacement. After solving the classical static problem, a case study of the probabilistic calculation followed to assess the reliability of the structure. It is well known that it is not always possible to guarantee the exact properties of the material, geometric arrangement, load, and adherence to the production process. The theory of statistics and probability is always the background of any reliability assessment. Many software programs can evaluate the safety of a structure or its failure, based on probabilistic analysis using the Monte Carlo method, the Latin hypercube sampling (LHS), or the response surface method (RSM). Input parameters are listed as stochastic and are characterized by different types of distribution. Software performs multiple analysis loops to calculate random output parameters as a function of a set of random input variables during probabilistic analysis. Uncertainties in the input variables (load, material properties, and geometrical dimensions) are reflected in the RSM based on the approximation of Monte Carlo simulations [8,9,10,11,12]. The base plate was, thus, assessed on the serviceability limit state (SLS) and the control function was deflection. Such calculations can contribute to the safety of structures. The aim of the article is to point out the need to use probabilistic methods in the field of interaction of foundation structures with subsoil. Subsoil, which is a material whose properties are highly variable, is suitable for demonstrating the use of probability theories. The article should be an example of the need and use of probabilistic theories in the contact field of building structures with a flexible subsoil.
2. Elastic Foundation
Within the static analysis of the whole structure, it is necessary to pay attention to the solution of foundation structures. In this paper, we deal with the calculation of foundation slabs. From a theoretical point of view, the analysis of the base plate was the solution of the contact problem between the plate and the elastic subsoil. When creating a static model, we had to determine which mathematical model we would use to describe the elastic subsoil. At present, we can opt for the following three subsoil models:
- single parametric (Winkler’s) model of elastic subsoil;
- two parametric (Pasternak´s) model of elastic subsoil;
- model of elastic half-space (Boussinesque´s).
In practice, the first two models, also called surface models, are used quite often. The elastic properties of the subsoil are described by spring constants on the subsoil surface. In this paper, we chose the most exact third subsoil model, i.e., the elastic half-space model. After selecting the subsoil model, we proceeded to solve the problem.
We solved the slab in contact with the elastic half-space considering Kirchoff’s assumptions for the slab. In the contact of the slab with the subsoil, we considered the vertical contact stress only. We did not consider the shear stress between the slab and the subsoil. The slab was characterized by the material constants of the concrete Ec (modulus of elasticity of the slab) and μc (Poisson’s number of the slab). The half-space was characterized by the constants Edef (deformation modulus of elasticity of the subsoil) and μ (Poisson’s number of the subsoil).
The deflection function of the slab is defined by the partial differential Equation (1). On the right side of the equation is the load acting on the plate, the external load q(x, y) and the subsoil resistance p(x, y).
The equation of the plate has the shape:
where D is the stiffness of the slab Equation (2):
where h is the depth of the slab.
According to the assumption of equality of deflection of the plate and the subsoil, we can substitute the resistance of the subsoil p(x,y) into the relation (1) and we get the integro-differential equation of the plate rested on the elastic half-space. Its solution using approximate numerical methods are presented in well-known works dealing with these problems.
At present, the problem of the slab rested on elastic foundation is solved in most cases by numerical methods, for example, by FEM, in which we start from the minimum potential energy of the system π:
where the energy of the slab is defined:
energy of external forces (load) is:
energy of the subsoil is:
When modeling the slab and the elastic subsoil in the FEM using the ANSYS system, we proceeded from the following assumptions. To create the body-block of the elastic half-space, 3D finite elements of the brick type were used (3 degrees of freedom in 8 nodes), the slab was modeled by planar shell elements with slab-wall assumptions (6 degrees of freedom in 4 nodes). The size of the earth body-blocks was based on experience. In horizontal plan, the model was extended to each side by twice the width of the board. In the vertical direction, the size was limited by the depth of the deformation zone.
Boundary conditions were introduced so that horizontal displacements in directions of the wall normal lines were captured on all four vertical walls of the block. Vertical displacements were captured at the bottom of the block. The connection between the slab and the subsoil was made by means of a contact finite element, which transferred the compressive contact stress and neglected shear stress in the foundation joint.
The option of the deformation zone and the place where this zone ends were taken from several authors. The end of the deformation zone is the active depth, beyond which the subsoil is no longer compressed, and the vertical displacements of the elastic half-space are equal to zero.
- The first way to obtain the required value of the active depth is to follow the geotechnical standards. The active depth is the place where the condition that the vertical stress from the loading of the structure σz is equal to the geostatic initial stress σor.m is fulfilled:Here we used the procedure described in standard and literature [3].
- The second way of obtaining active depth was according to the relations published by Kuklík in [1], where a formula for calculating the active depth was derived. In the literature, formulas for a circular load area, for a square area, for a rectangle, and for an endless belt of constant width are given. With the help of nomograms and simple formulas, it is possible to obtain the value of the active depth. All the above findings were used in the example, presented in the last part of the paper.
3. Reliability of Structures and Probability of Failure
Structural reliability is the ability of a structure to meet special requirements, including the design life for which the structure is designed. Reliability includes the safety, usability, and durability of a structure and it is expressed through probabilistic terms [10,11,12,13,14,15].
The structure must be designed and constructed in such a way as to serve the intended purpose and withstand, during the expected service life, with an appropriate degree of reliability and economy, all the loads and influences which may occur during operation and use of the structure.
The Eurocode also allows determination of individual coefficients, for example, the coefficients ψ based on the theory of statistical evaluation of experimental data according to the theory of reliability. For the ultimate limit states, the individual partial factors of the different materials and loads are calibrated so that the confidence levels for typical structures are as close as possible to the guide value of the reliability index β. In the analysis, the accepted or assumed statistical variability of the effects of loads, resistances, and model uncertainties are considered.
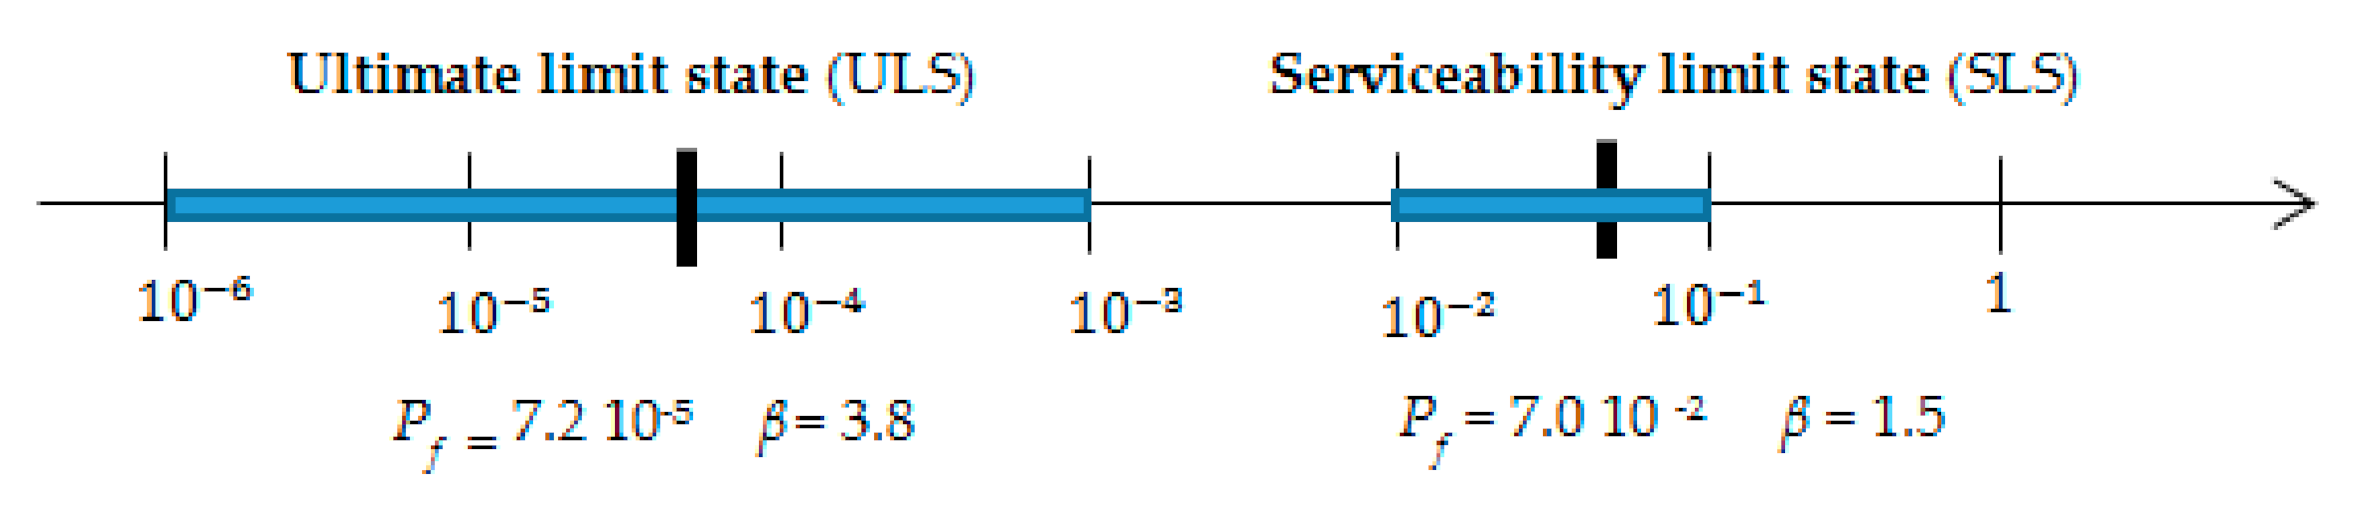
Reliability classes (RC) can be defined based on the reliability index β. Classes RC1, RC2, and RC3 are related to consequence classes CC1—CC3.
The reliability index on the numerical axis are shown in Figure 1.
It is generally assumed that according to EN 1990–1999, the structure has a reliability index higher than 1.5 for a 50-year reference period.
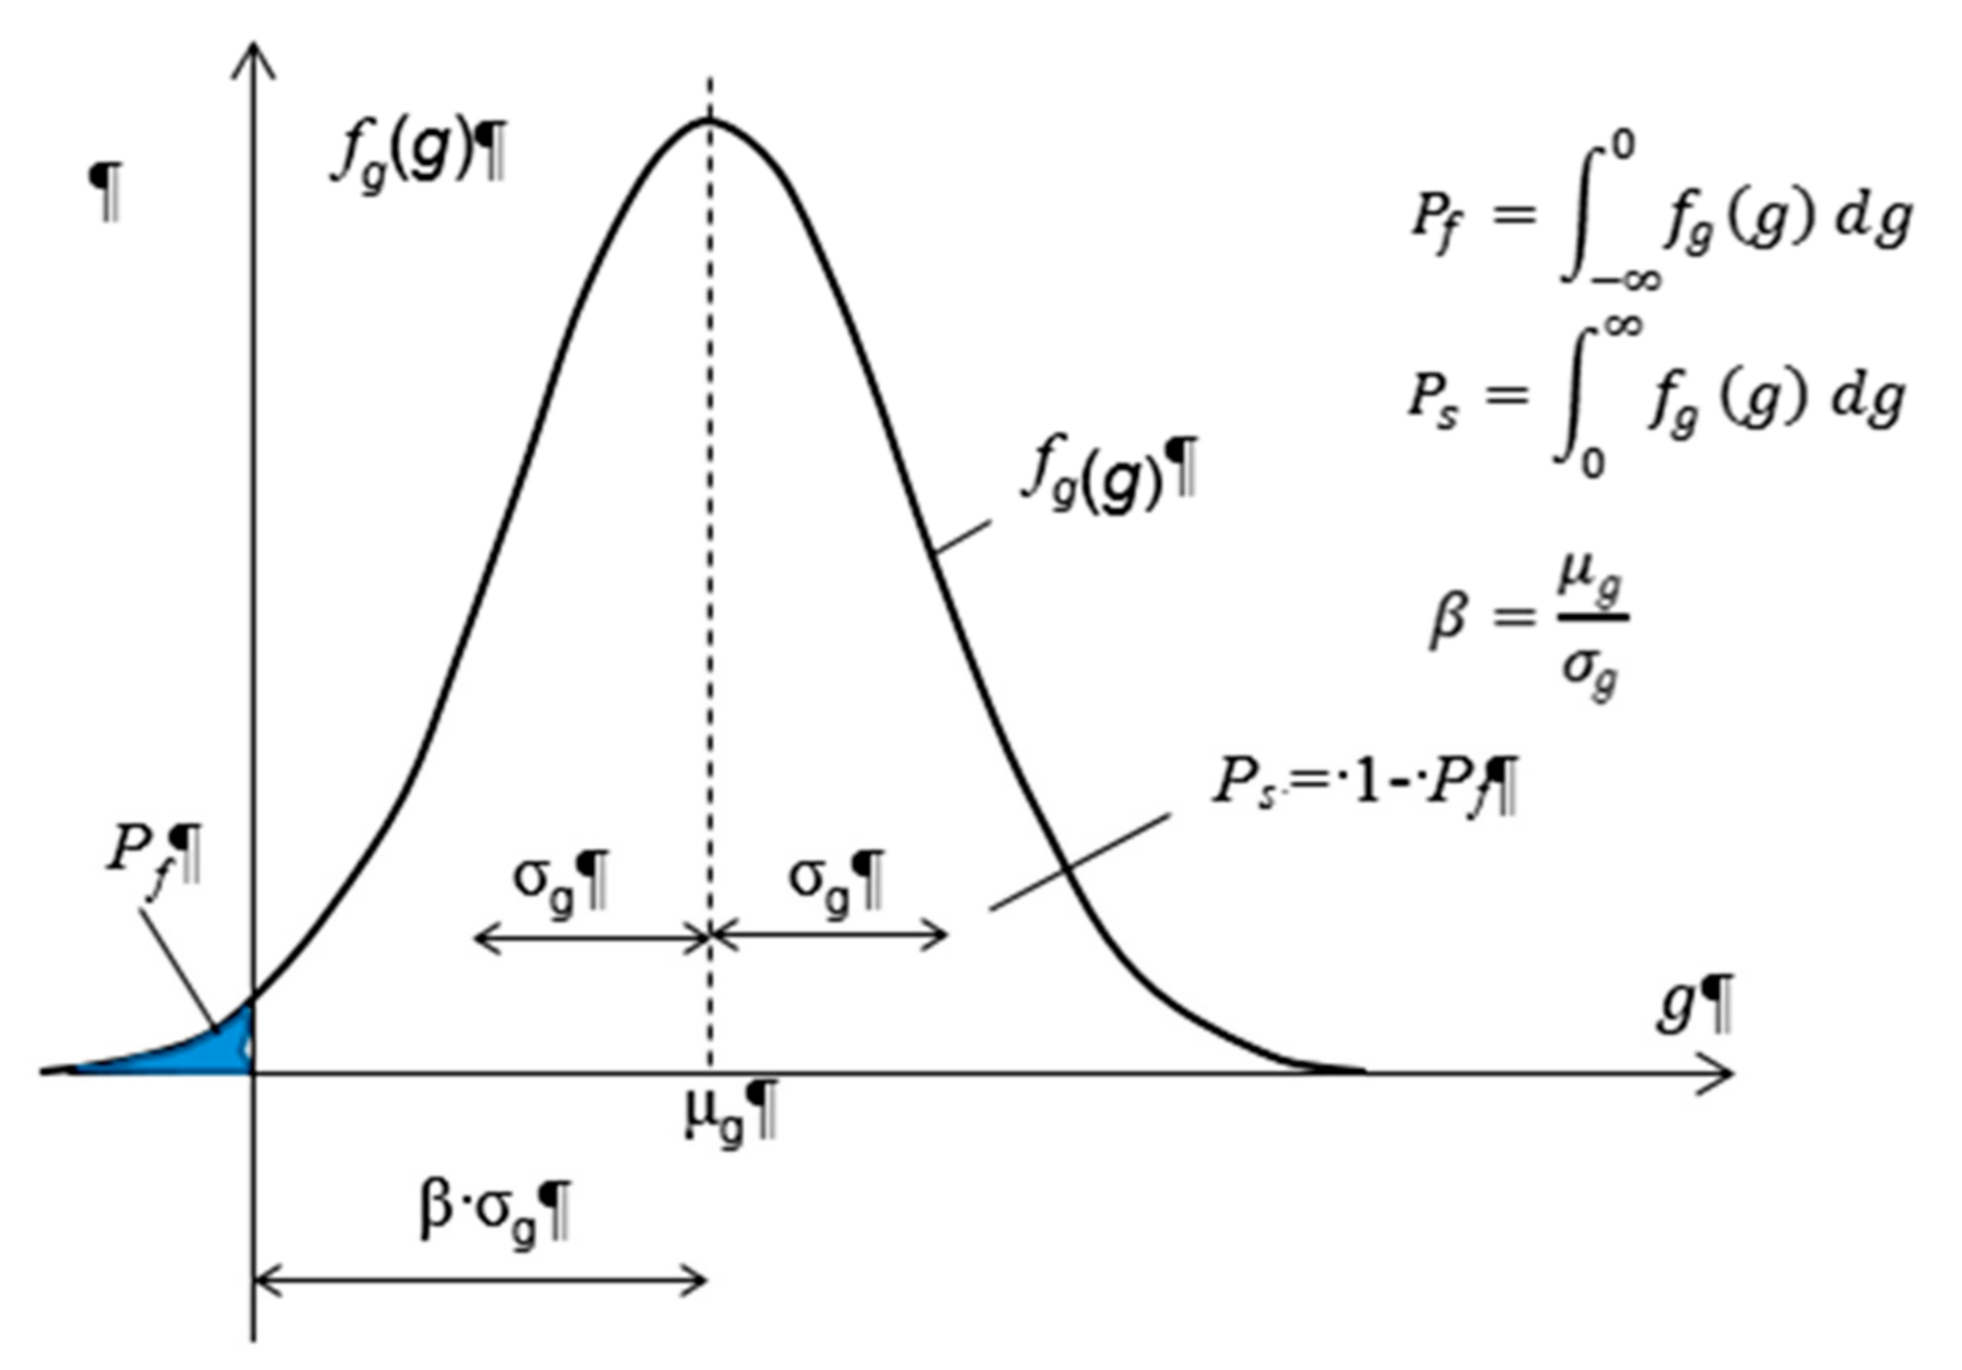
The probability of failure, , can be expressed by the limit state function , in which it is assumed that for g > 0 the structure will not fail and for g ≤ 0 the structure will fail:
If R is the resistance and E is the load effect, then the limit state function or structural margin g is:
where R is the strength of the structure as a function of random variables of input parameters and E is the load response as a function of the random variables of the input parameters.
If the function g has a normal distribution, then, the β confidence index is equal to:
where
- is a mean value of
- is the standard deviation (Figure 2).
Then,
For other types of distribution , β is only a formal measure of confidence Ps = (1—Pf).
Probabilistic reliability assessment methods can be both analytical and simulation methods. Simulation methods include Monte Carlo (MC), Latin hypercube sampling (LHS), and stratified sampling (SC). Advanced simulation methods also exist such as adaptive sampling (AS), directional sampling (DS), importance sampling (IS), line Sampling (LS), and response surface method (RSM). The Monte Carlo method can be classified as a simulation method with direct simulation.
The RSM method is based on the assumption that it is possible to define the dependence between input and output parameters using the following approximation function:
where is the coefficient of the constant member of the polynomial, is the coefficient of the linear member, and is the coefficient of the quadratic member.
The polynomial coefficients are based on the minimum error condition, usually the Central Composite Design (CCD) sampling method or the Box Behnken Matrix (BBM) sampling method.
The CCD consists of a center point, axis points, and corner points, so-called factor points. Using a large number of random input variables produces a disproportionate number of factor points, therefore, ANSYS automatically reduces the number of factor points by switching to the partial plan that is part of the calculation.
For probabilistic performance of material property values, they should normally be determined from standardized tests under special conditions. If there is a lack of statistical distribution of properties, a nominal value may be used or the mean value may be taken as a characteristic value, where the limit state equation is not significantly sensitive to its volatility. Unless otherwise stated in EN 1992–1999, the characteristic values should be defined as the 5% quantile for the strength parameters and as the mean values for the stiffness parameters.
4. Problem
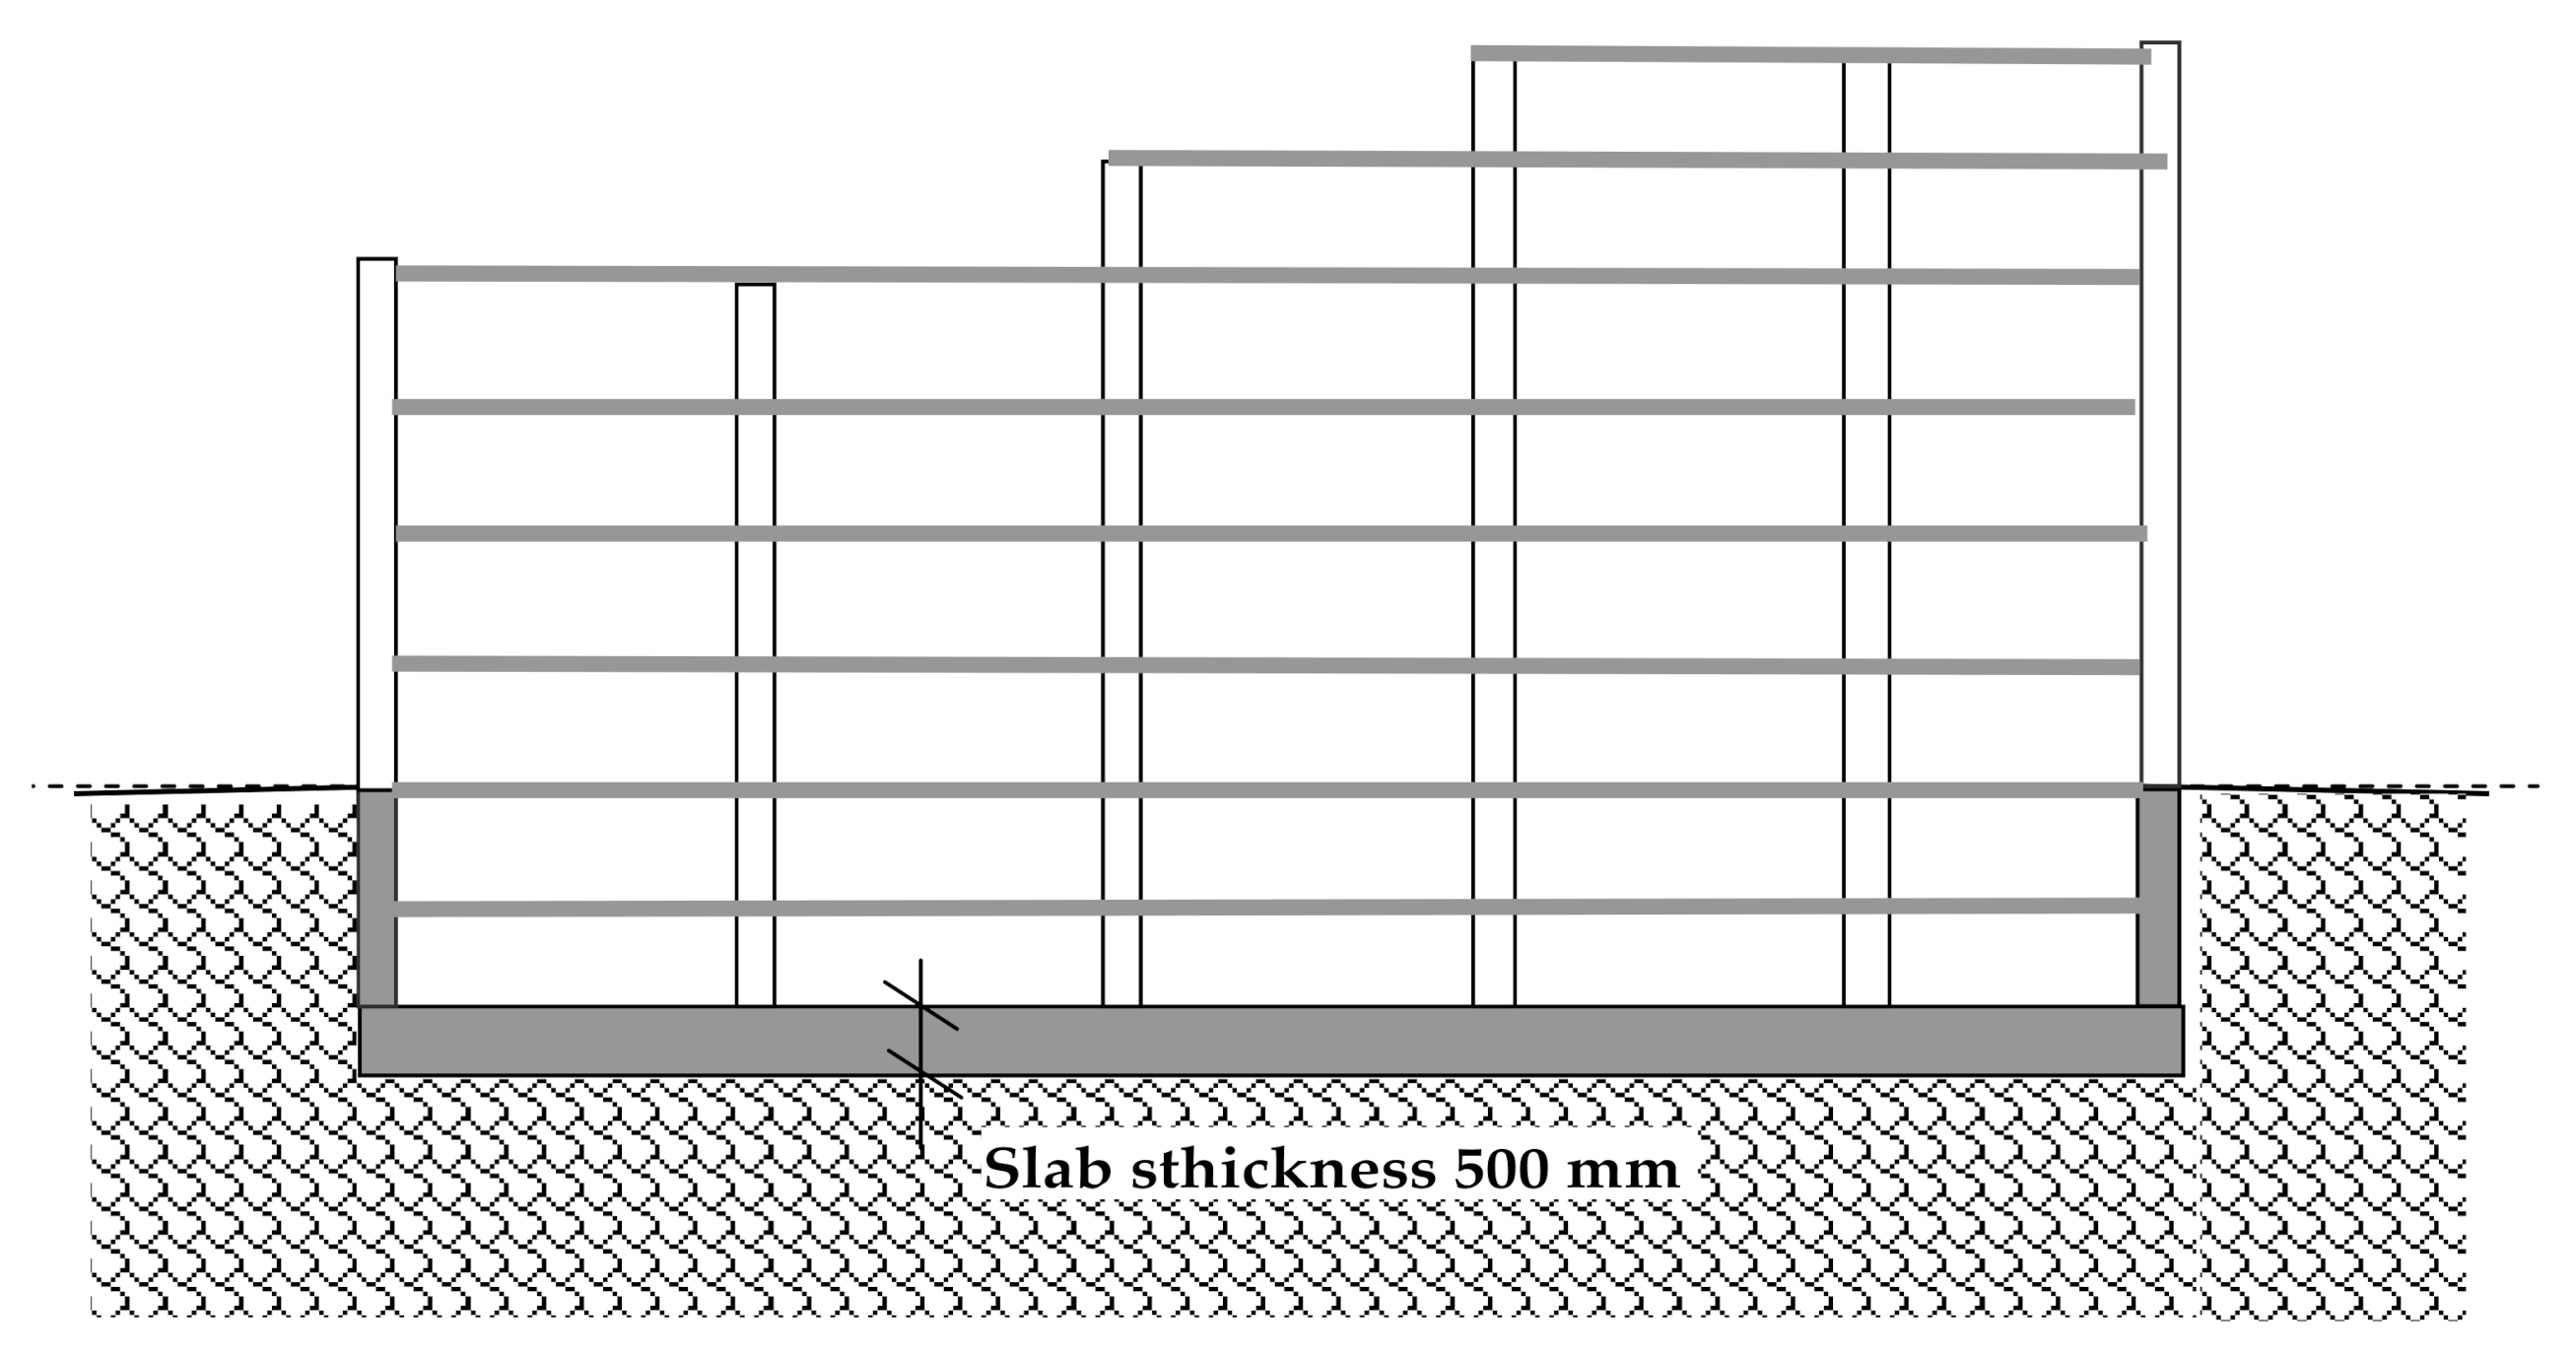
As an example of the above theory, the analysis of a hospital building is presented. The building measurements are 18 × 30 m. The distance of the module axes is 6.0 × 6.0 m. In the transverse direction, there are three fields 3 × 6.0 m. In the longitudinal direction, there are five modules of 6.0 m each, in which the structure recedes in height. A longitudinal section of the building is shown in Figure 3.
For the sake of interest, the axial forces in the middle columns, due to the receding floors of the building, were in the range of 2380 by 3820 kN. According to the engineering geological survey, the groundwater level is located at a depth of 12.5 m below the ground and its impact on the solved problem is negligible. The layer of clay sand is horizontal with a thickness of approximately 2.8 to 3.3 m. After generalizations we present the characteristics of the soil under the base plate as follows:
| 0.0–5.0 m | gravel GM | (Es1 = 70 MPa, μs1 = 0.25, γs1 = 19.0 kN/m3), |
| 5.0–8.0 m | clay sand SC | (Es2 = 10 MPa, μs2 = 0.35, γs2 = 18.5 kN/m3), |
| 8.0–50.0 m | gravel GM | (Es1 = 70 MPa, μs1 = 0.25, γs1 = 19.0 kN/m3). |
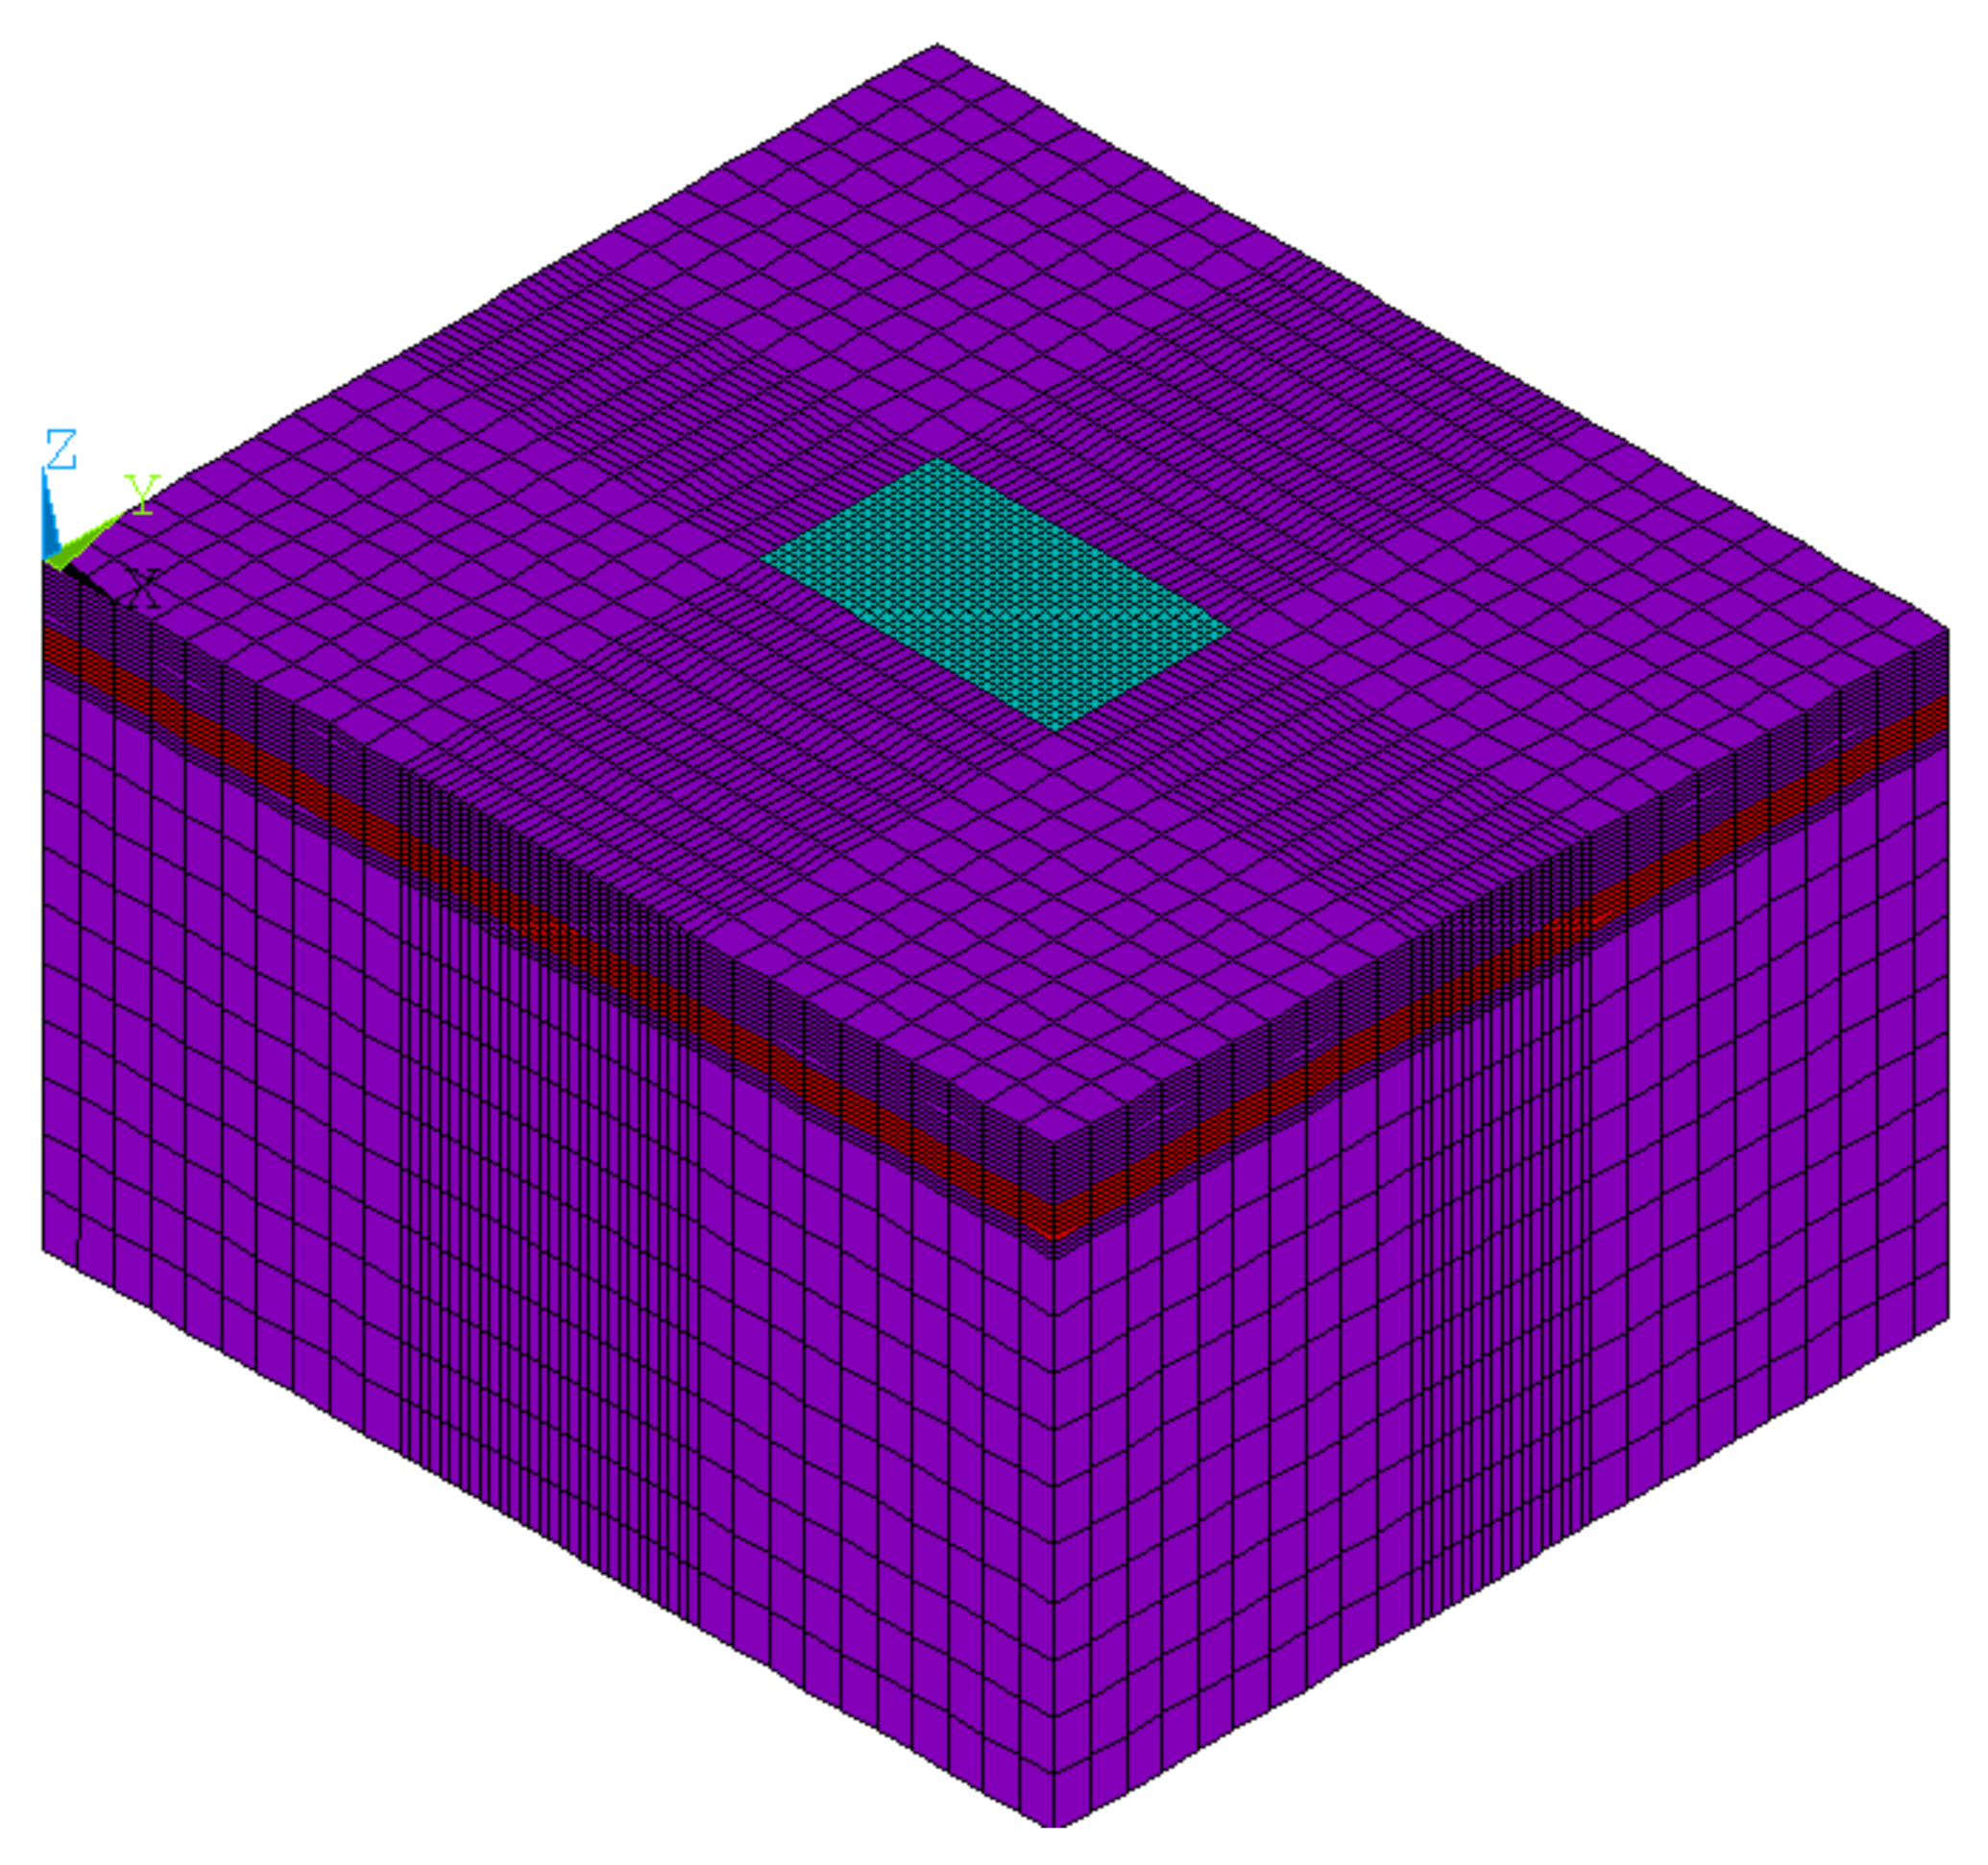
In our problem, the base plate had dimensions 18 × 30 m. This corresponded to the modular grid of the building 3 × 6.0 m width and 5 × 6.0 m length. The slab was 500 mm thick, and it was connected with the subsoil by contact elements which did not transmit shear between the base plate and the subsoil, and in the vertical direction they transmitted only compressive contact stresses. The dimensions of the block were derived from the dimensions of the plate. In the floor plan, we widened the block to the sides by a value of 2× the width of the board, the resulting dimensions were 90.0 × 102.0 m and to the depth of 50 m (Figure 4). In this figure there is a finite element model where it is possible to see the distribution of the finite elements at the upper edge of the elastic body. In the floor plan there is a compaction of the elements in the vicinity and under the base plate. The size of elements at the edge of model is increasing. At a level of 5.0 to 8.0 m, a layer of clay sand can be seen.
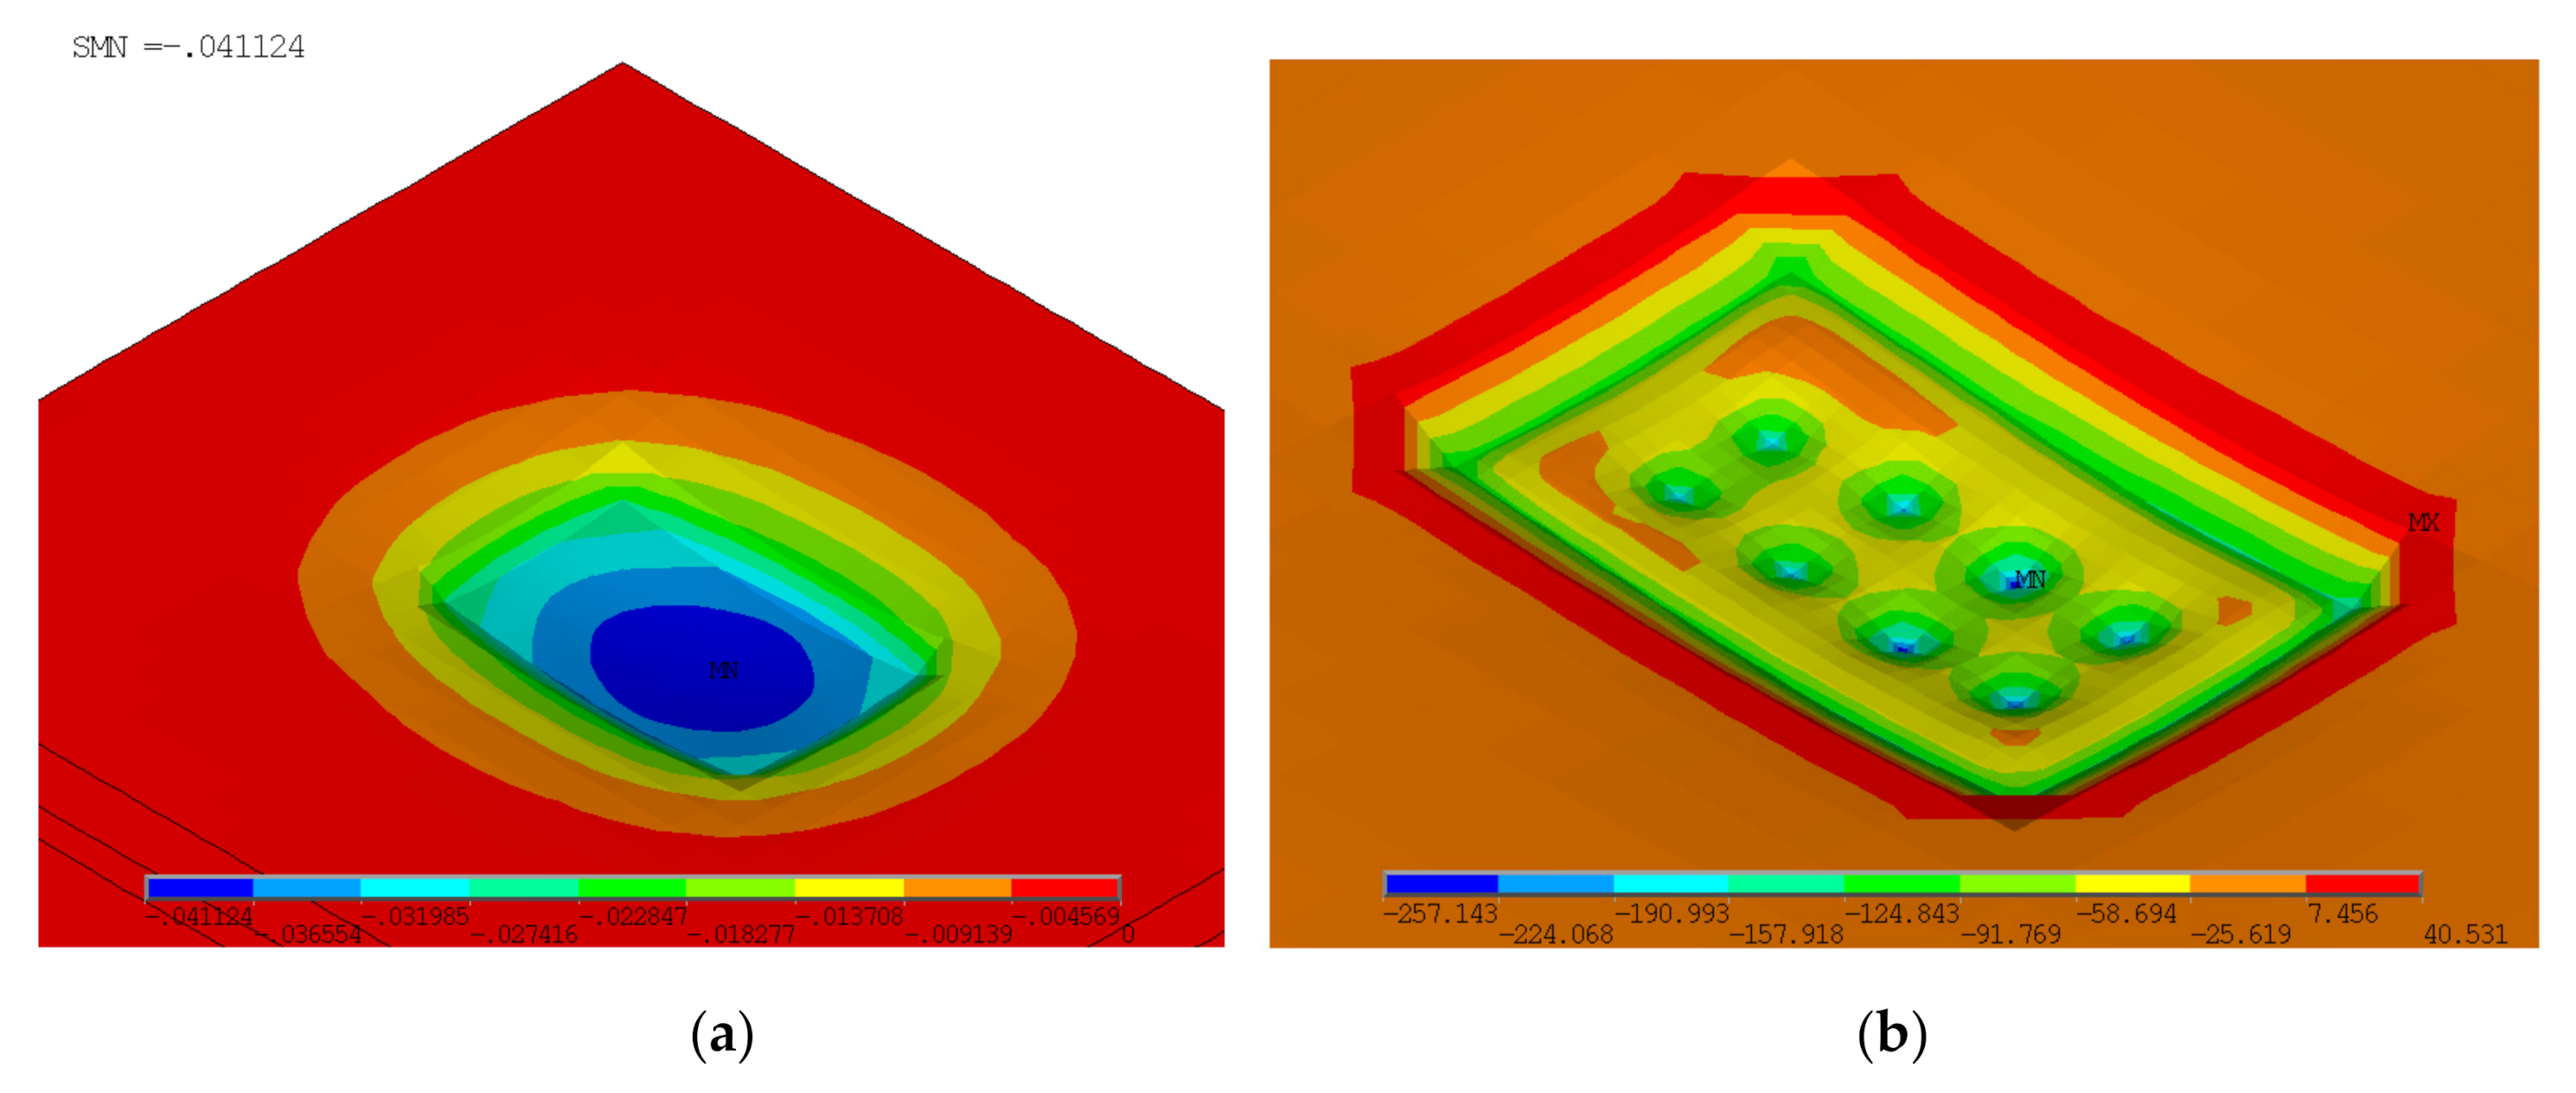
In the following section, we present the results of the static analysis of the base plate under the hospital building. The internal forces in the base plate, the vertical deformations, and the contact stresses in the base joint were calculated. They are shown in Figure 5 and Figure 6.
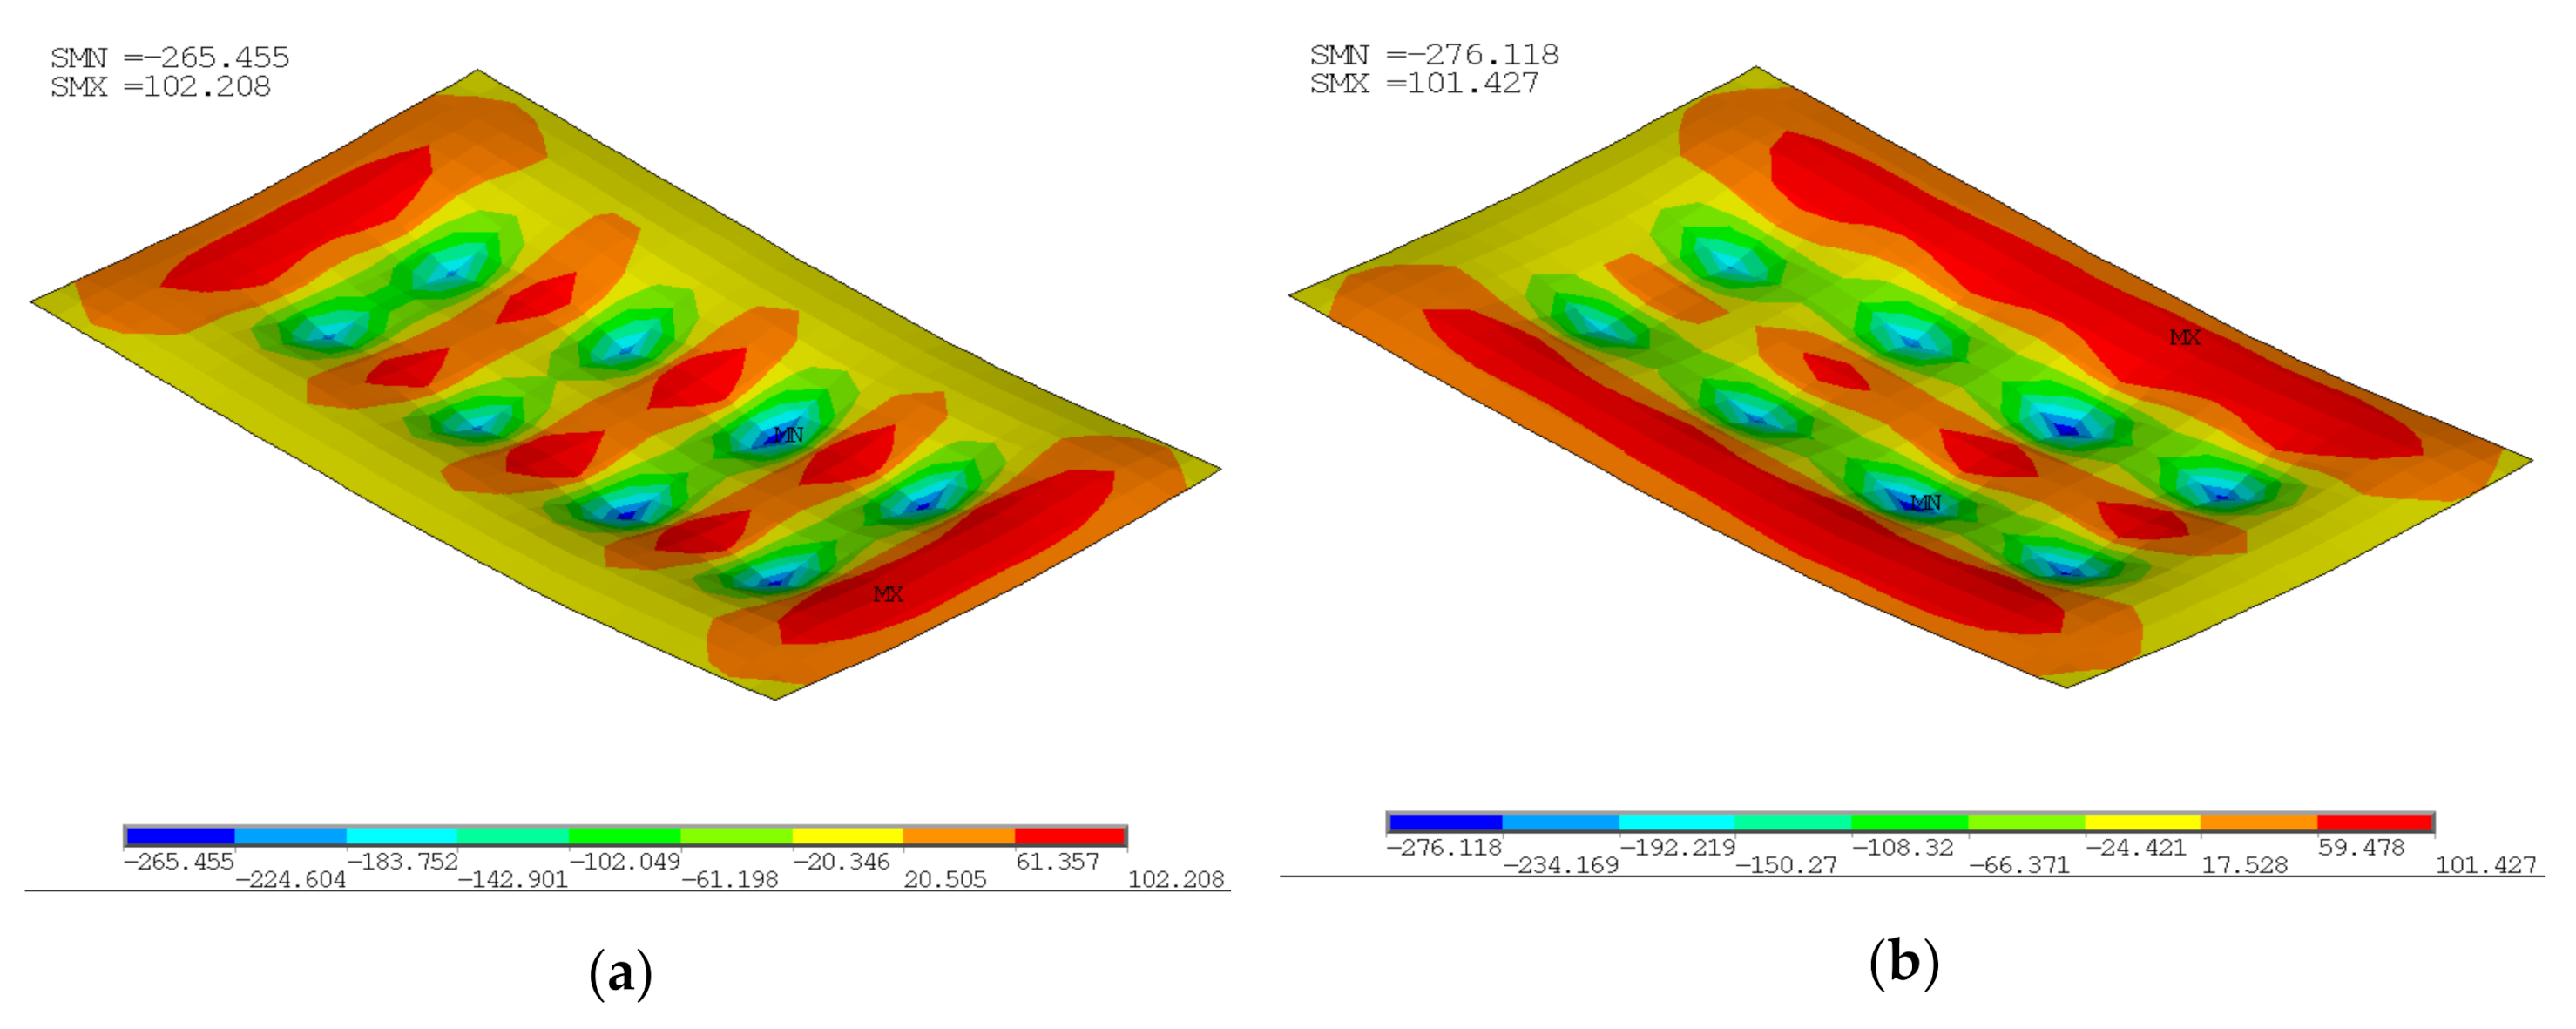
Separating the foundation plate from the entire FEM model, we present the specific bending moments in two directions (mx and my).
5. Reliability Analysis
One of the relevant analyses of structures is also the assessment of the reliability of structures. In this paper, we deal with static and probabilistic analysis of the base plate. The probabilistic analysis, in this case, was calculated using FEM in the ANSYS program, where the RSM method (response surface method) was used as an optimization method, which, unlike the Monte Carlo method, requires fewer simulations. In our case, we had 500 iterations set.
The individual input parameters to the probabilistic analysis vary according to the Gaussian distribution.
In this case, one output parameter was set, which changed depending on two or four input parameters.
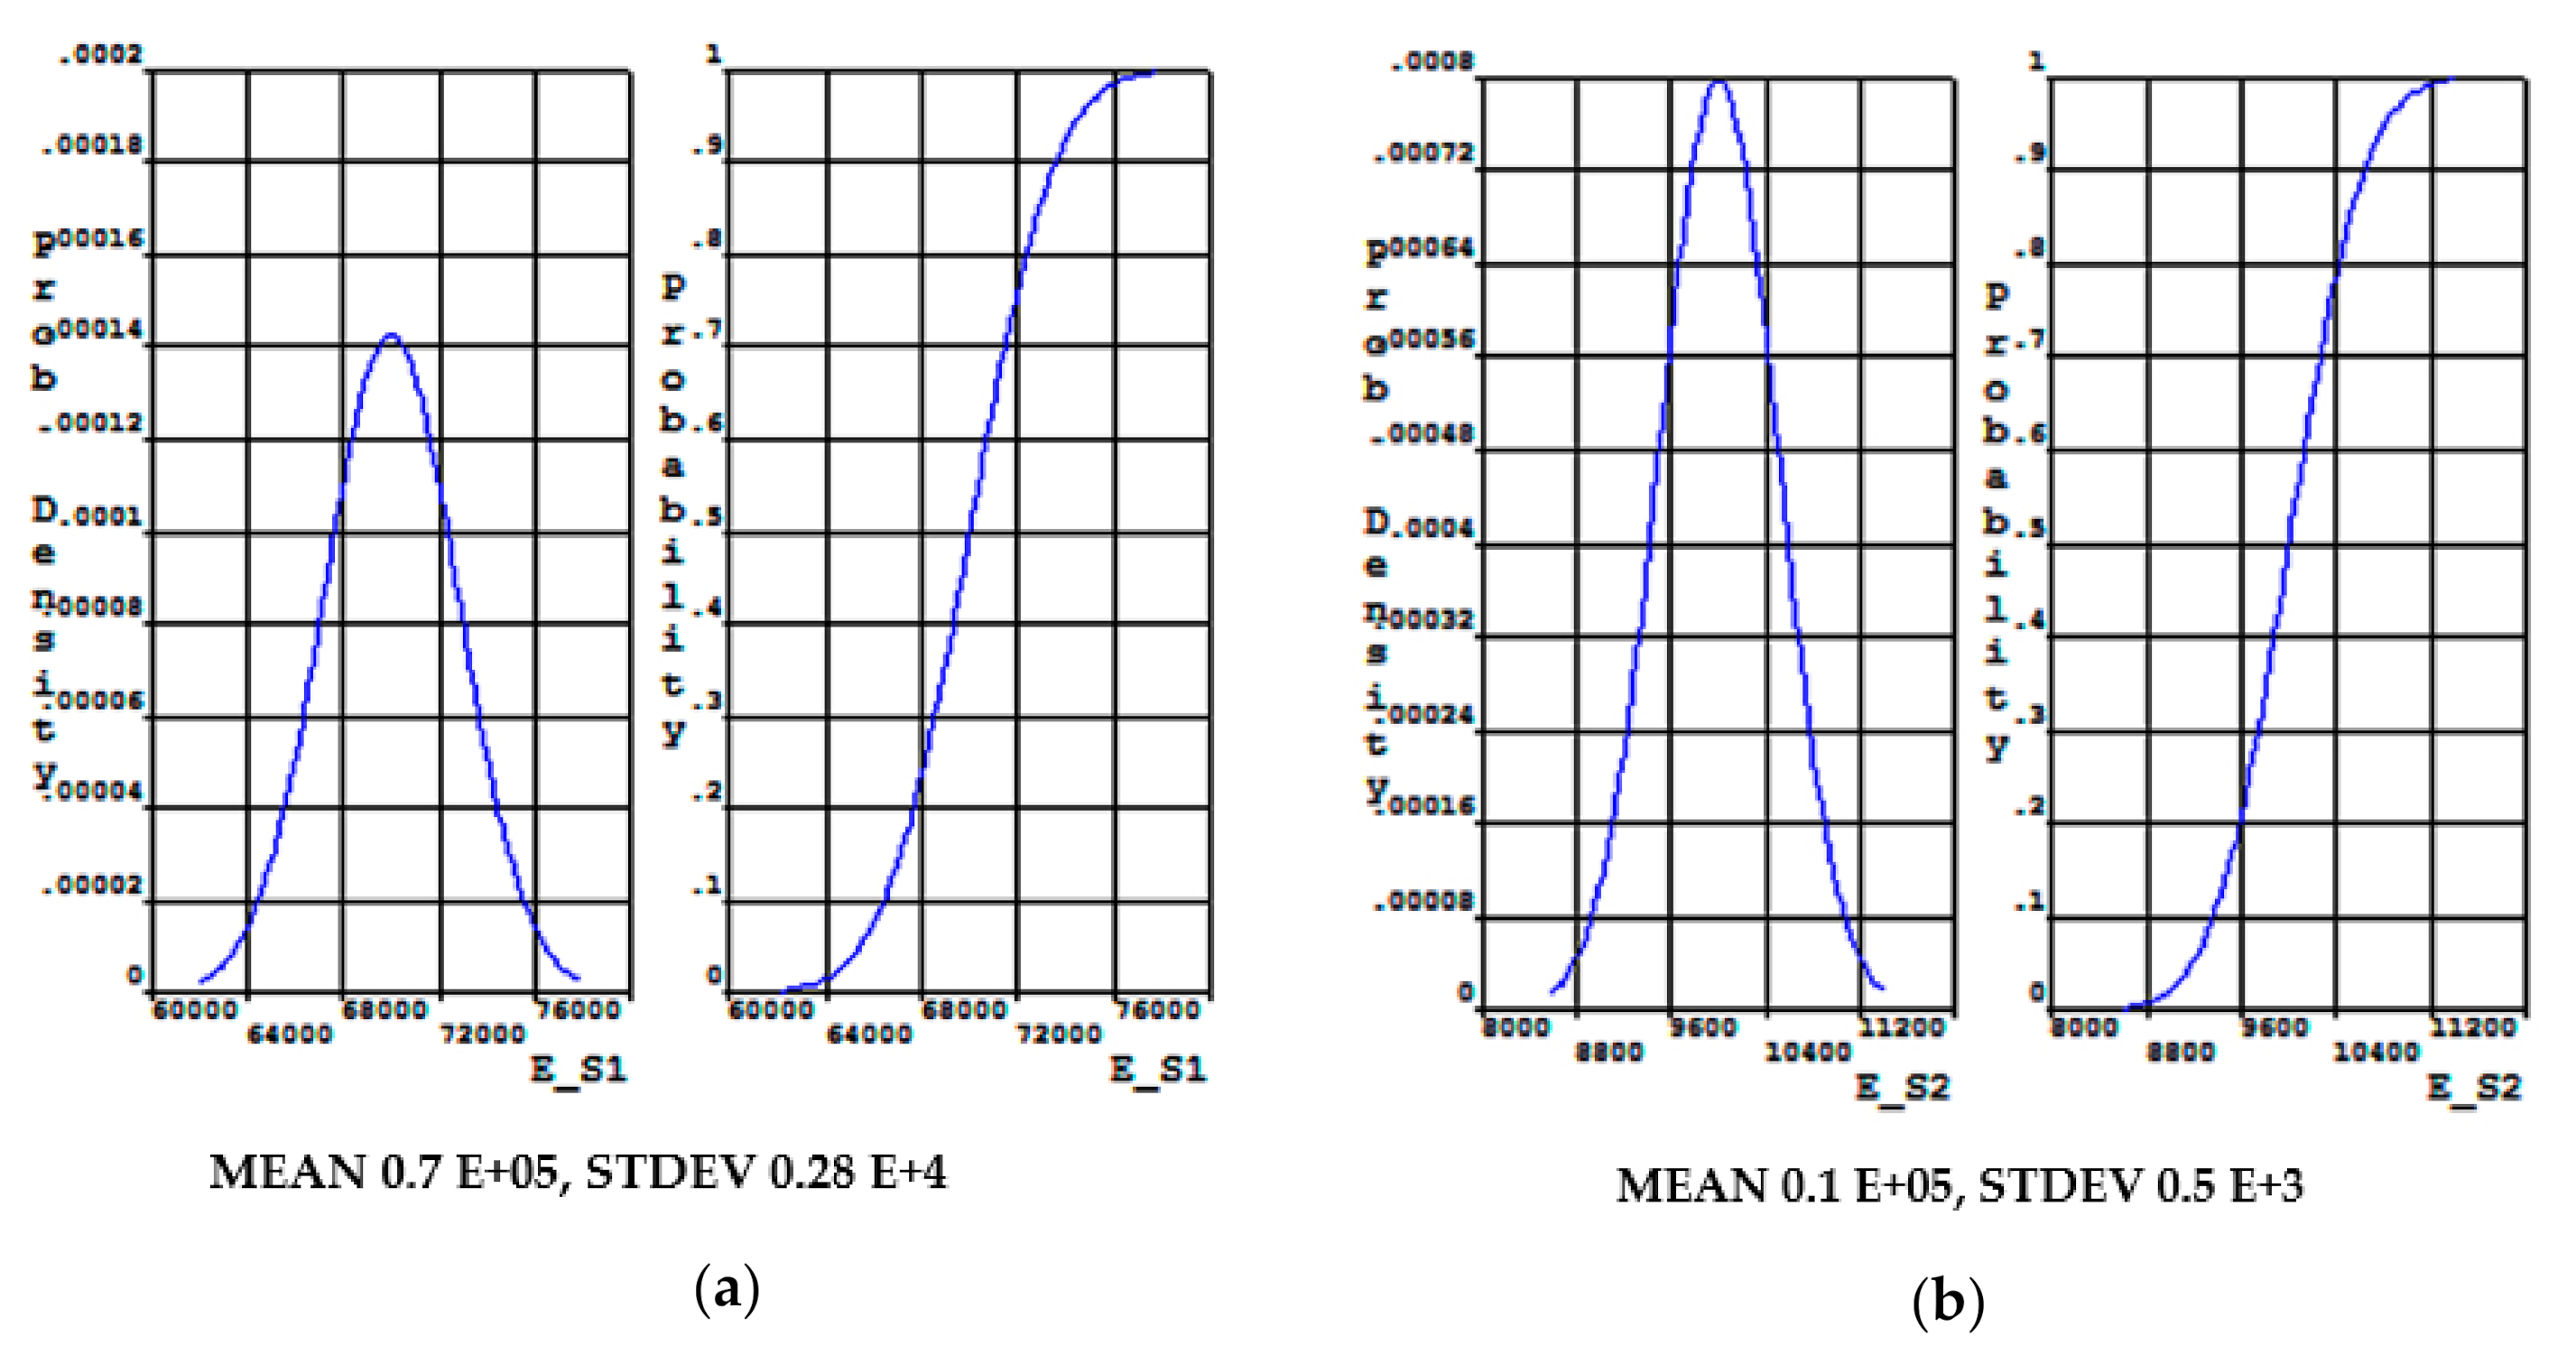
The two input parameters entered were soil elastic modulus E_s1 and E_s2. Quantities were characterized by probability density (PDF), distribution function (CDF), and a histogram.
Both types and distributions of individual input and output parameters are given in Table 1, and shown in Figure 7. It can be seen from Figure 7 that the moduli of elasticity of the soils E_s1 and E_s2 have a Gaussian distribution.
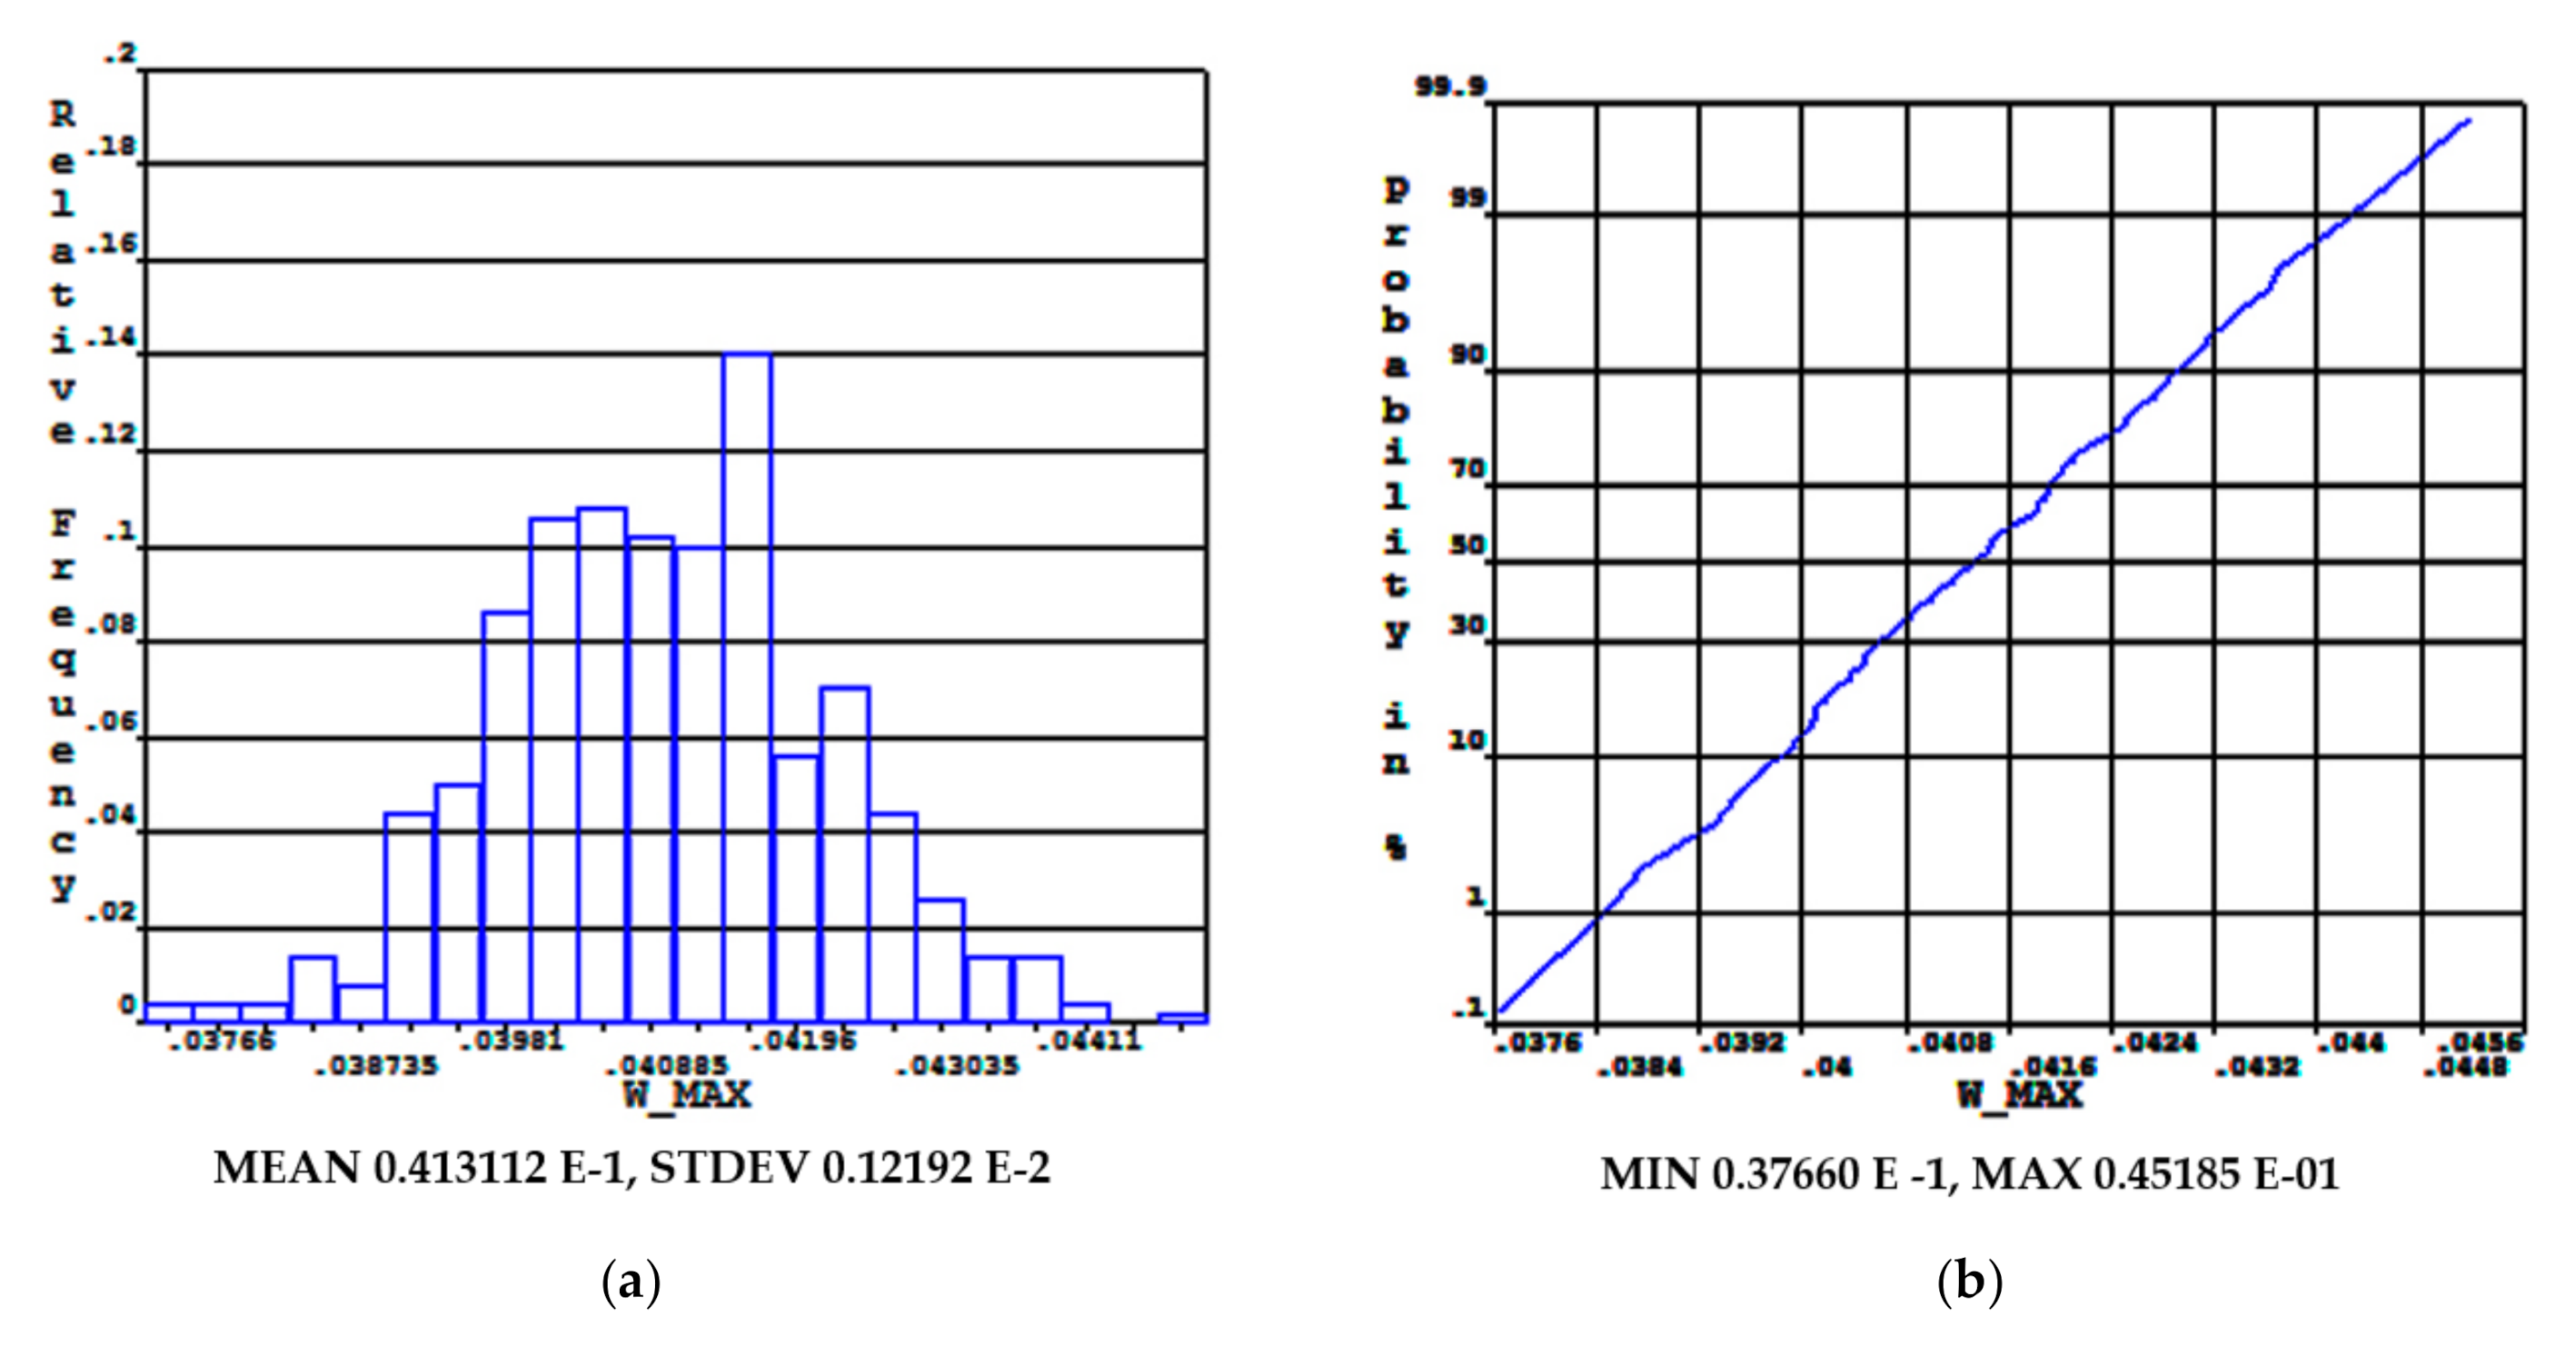
The distribution is characterized by probability density (PDF), distribution function (CDF), and described by the histogram in Figure 7. According to the CDF (cumulative distribution function, Figure 8 on the right) we can determine the probability of the corresponding parameter W_MAX (maximum deformation value).
The probability, that the maximum deflection is greater than 43 mm, indicates that the design is unreliable at 8.48 × 10⁻².
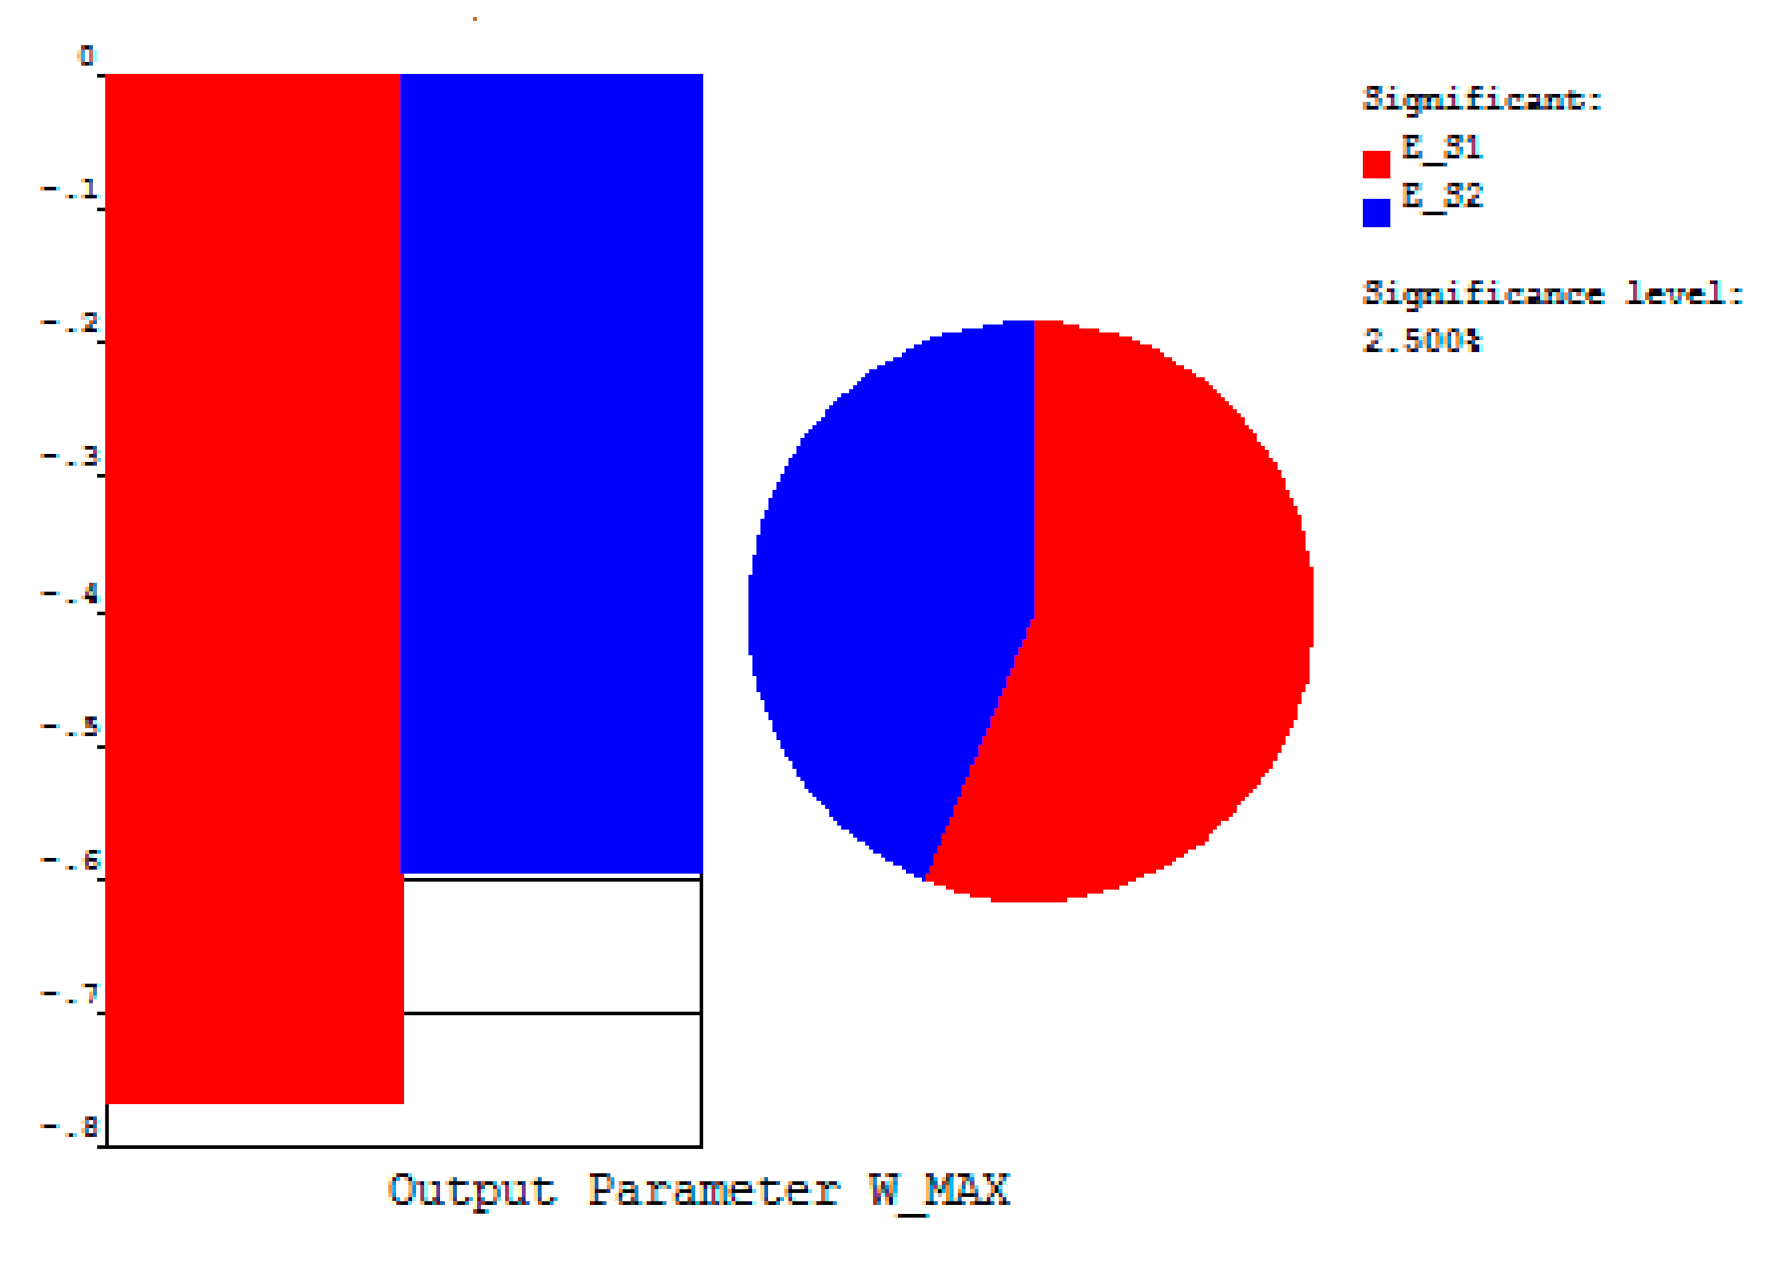
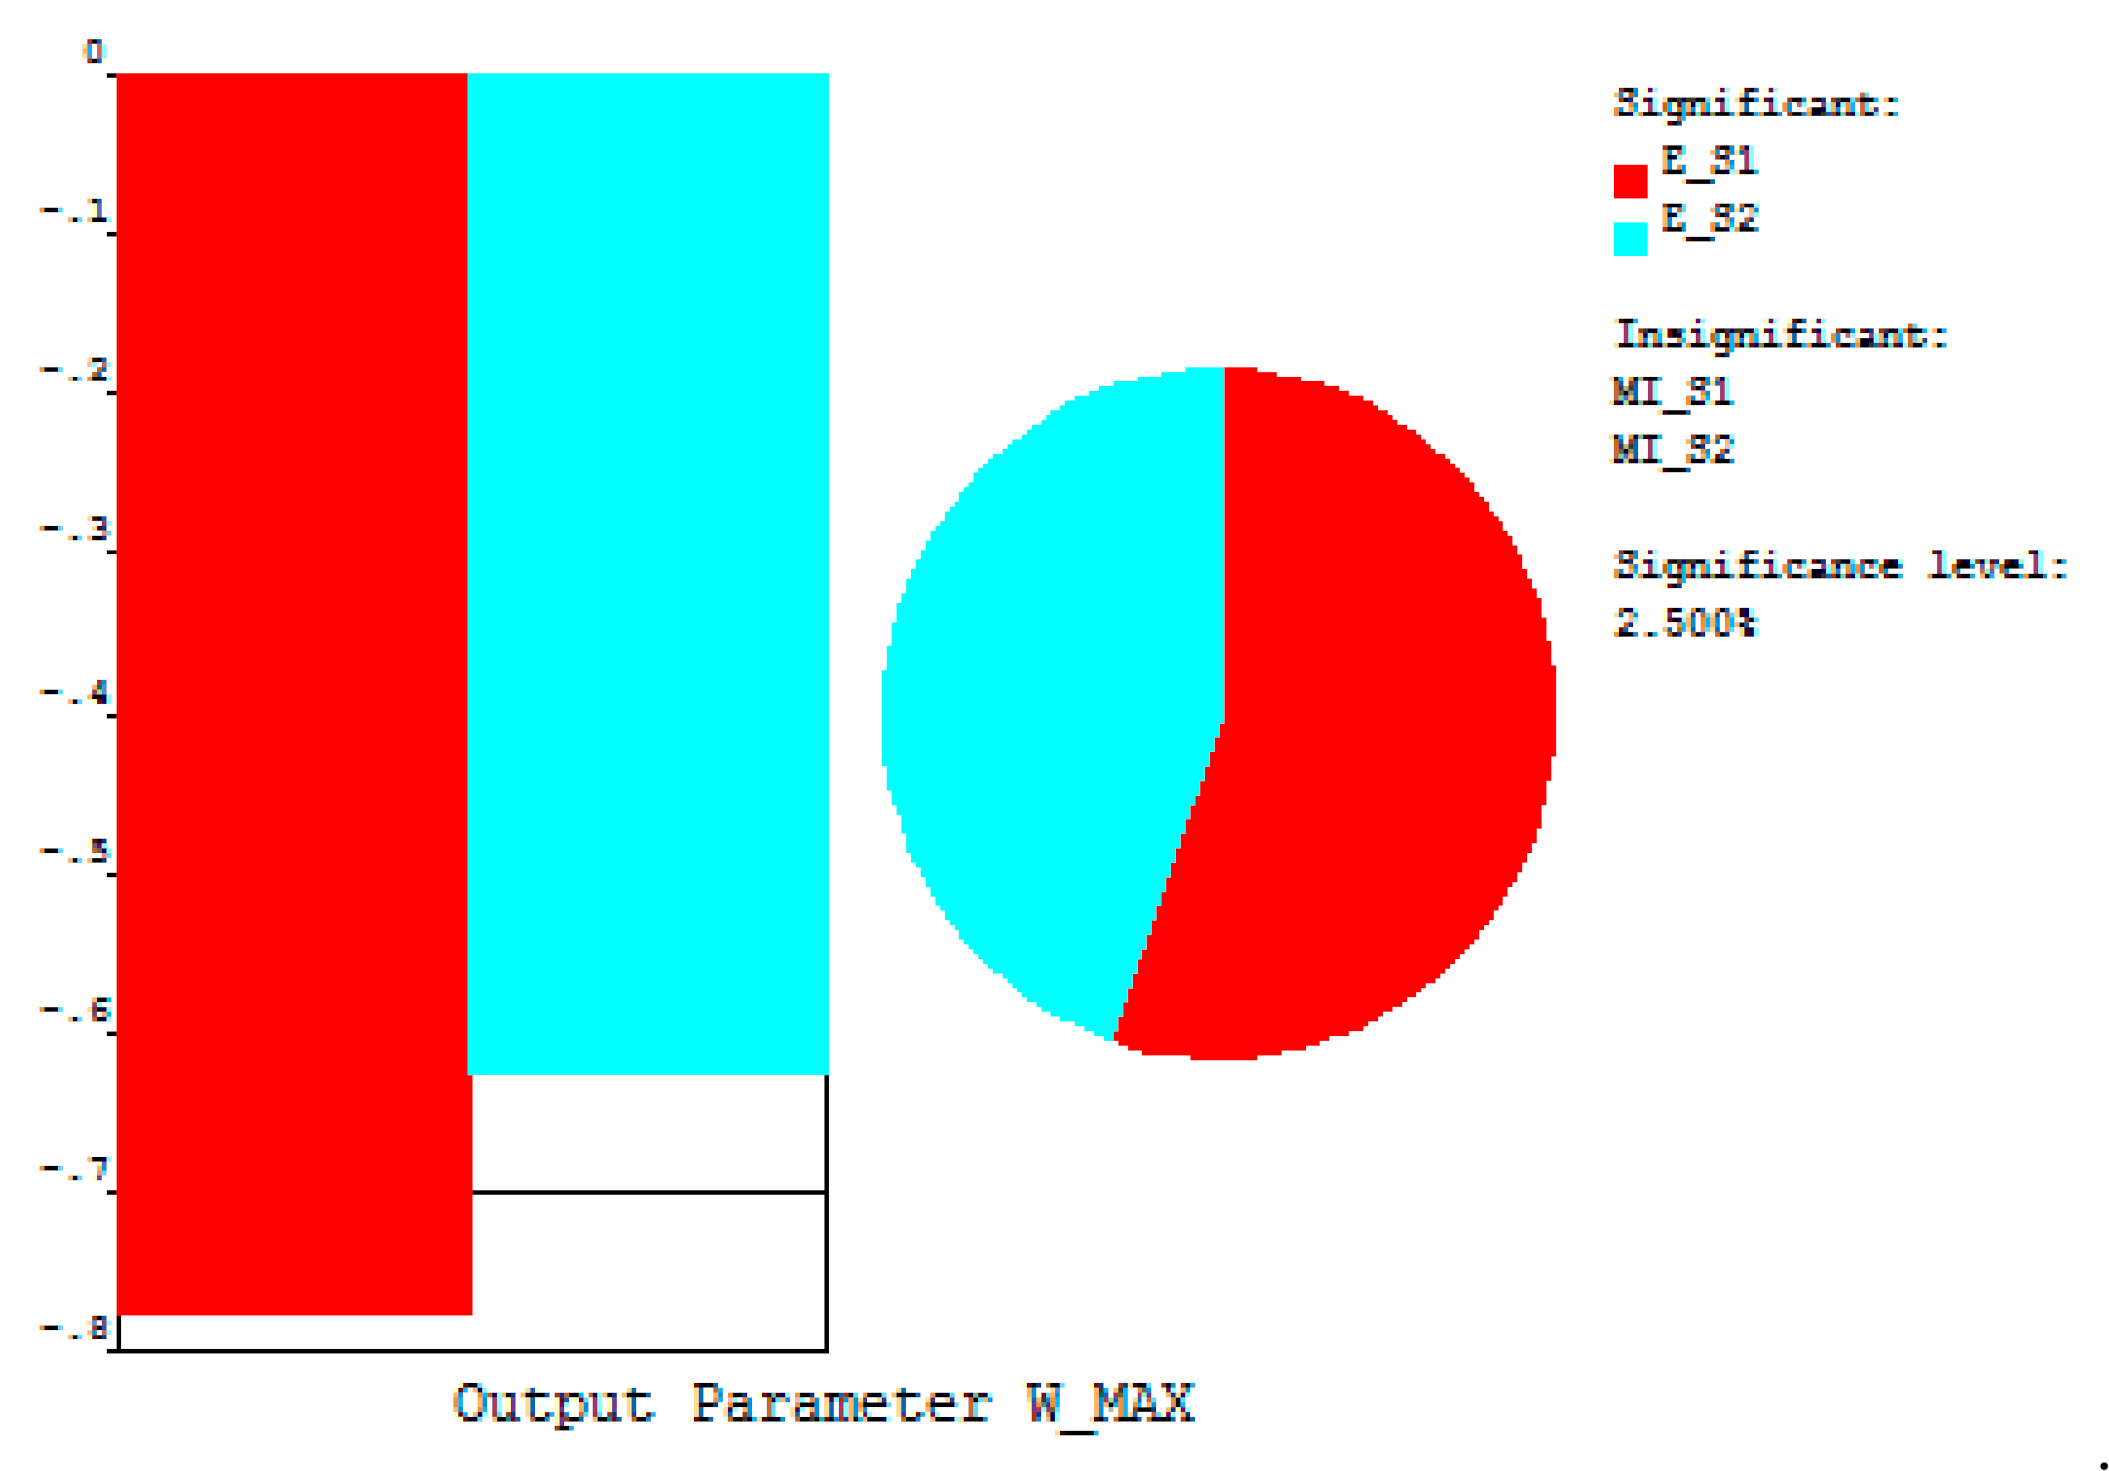
The evaluation of the probability sensitivity is based on the evaluation of the mutual relations between all random input parameters and any output parameter. According to the user’s specification, Spearman’s degree, correlation coefficient, or Pearson linear correlation coefficient can be used. To plot the sensitivity of a given particular random output parameter, the random input variables are divided into two groups, i.e., those that are significant (important) and those that are insignificant (not important) for that output parameter. Plotting the sensitivity graphs of a given output parameter will contain only significant random input parameters (Figure 9).
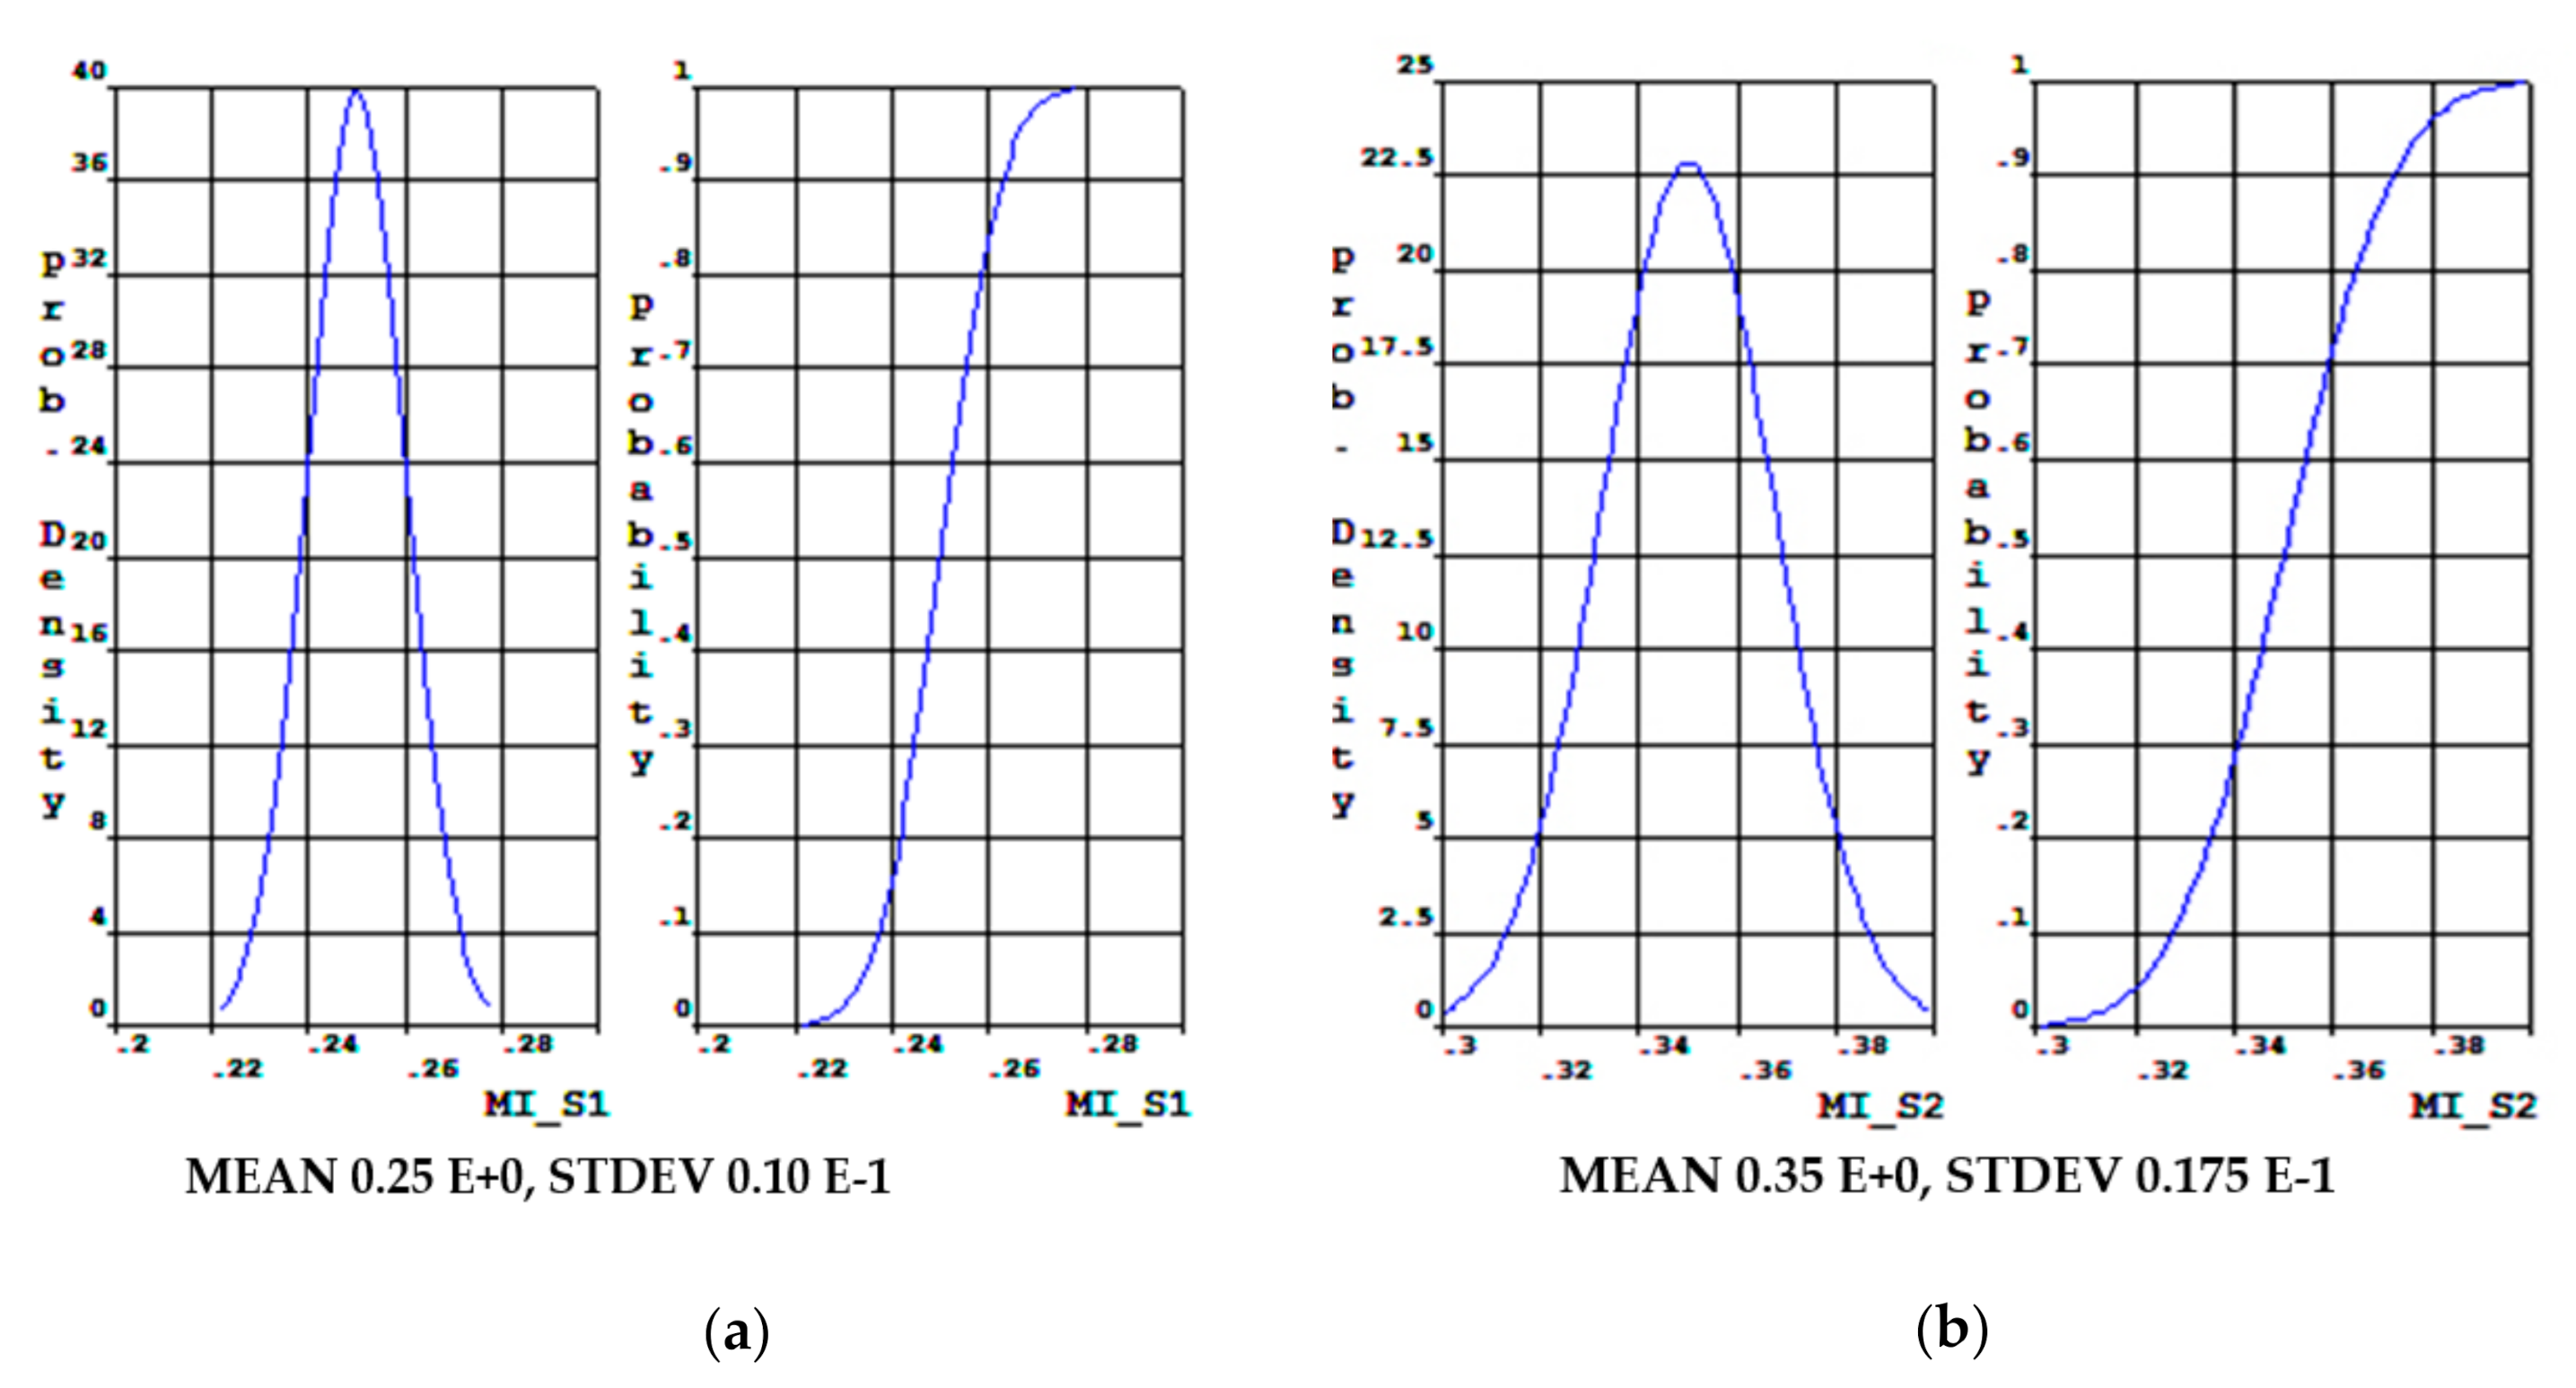
The four input parameters entered were soil elastic moduli E_s1 and E_s2 and Poisson soil numbers mi_s1 and mi_s2. Quantities were characterized by probability density (PDF), distribution function (CDF) and a histogram. The division of E_s1 and E_s2 was according to Figure 7, mi_s1 and mi_s2 are shown in Figure 10.
Types and distributions of individual input parameters are given in Table 2 and the output parameters are shown in Figure 7 and Figure 10. In Figure 10 we can see that the Poisson constants of the soils have a Gaussian distribution.
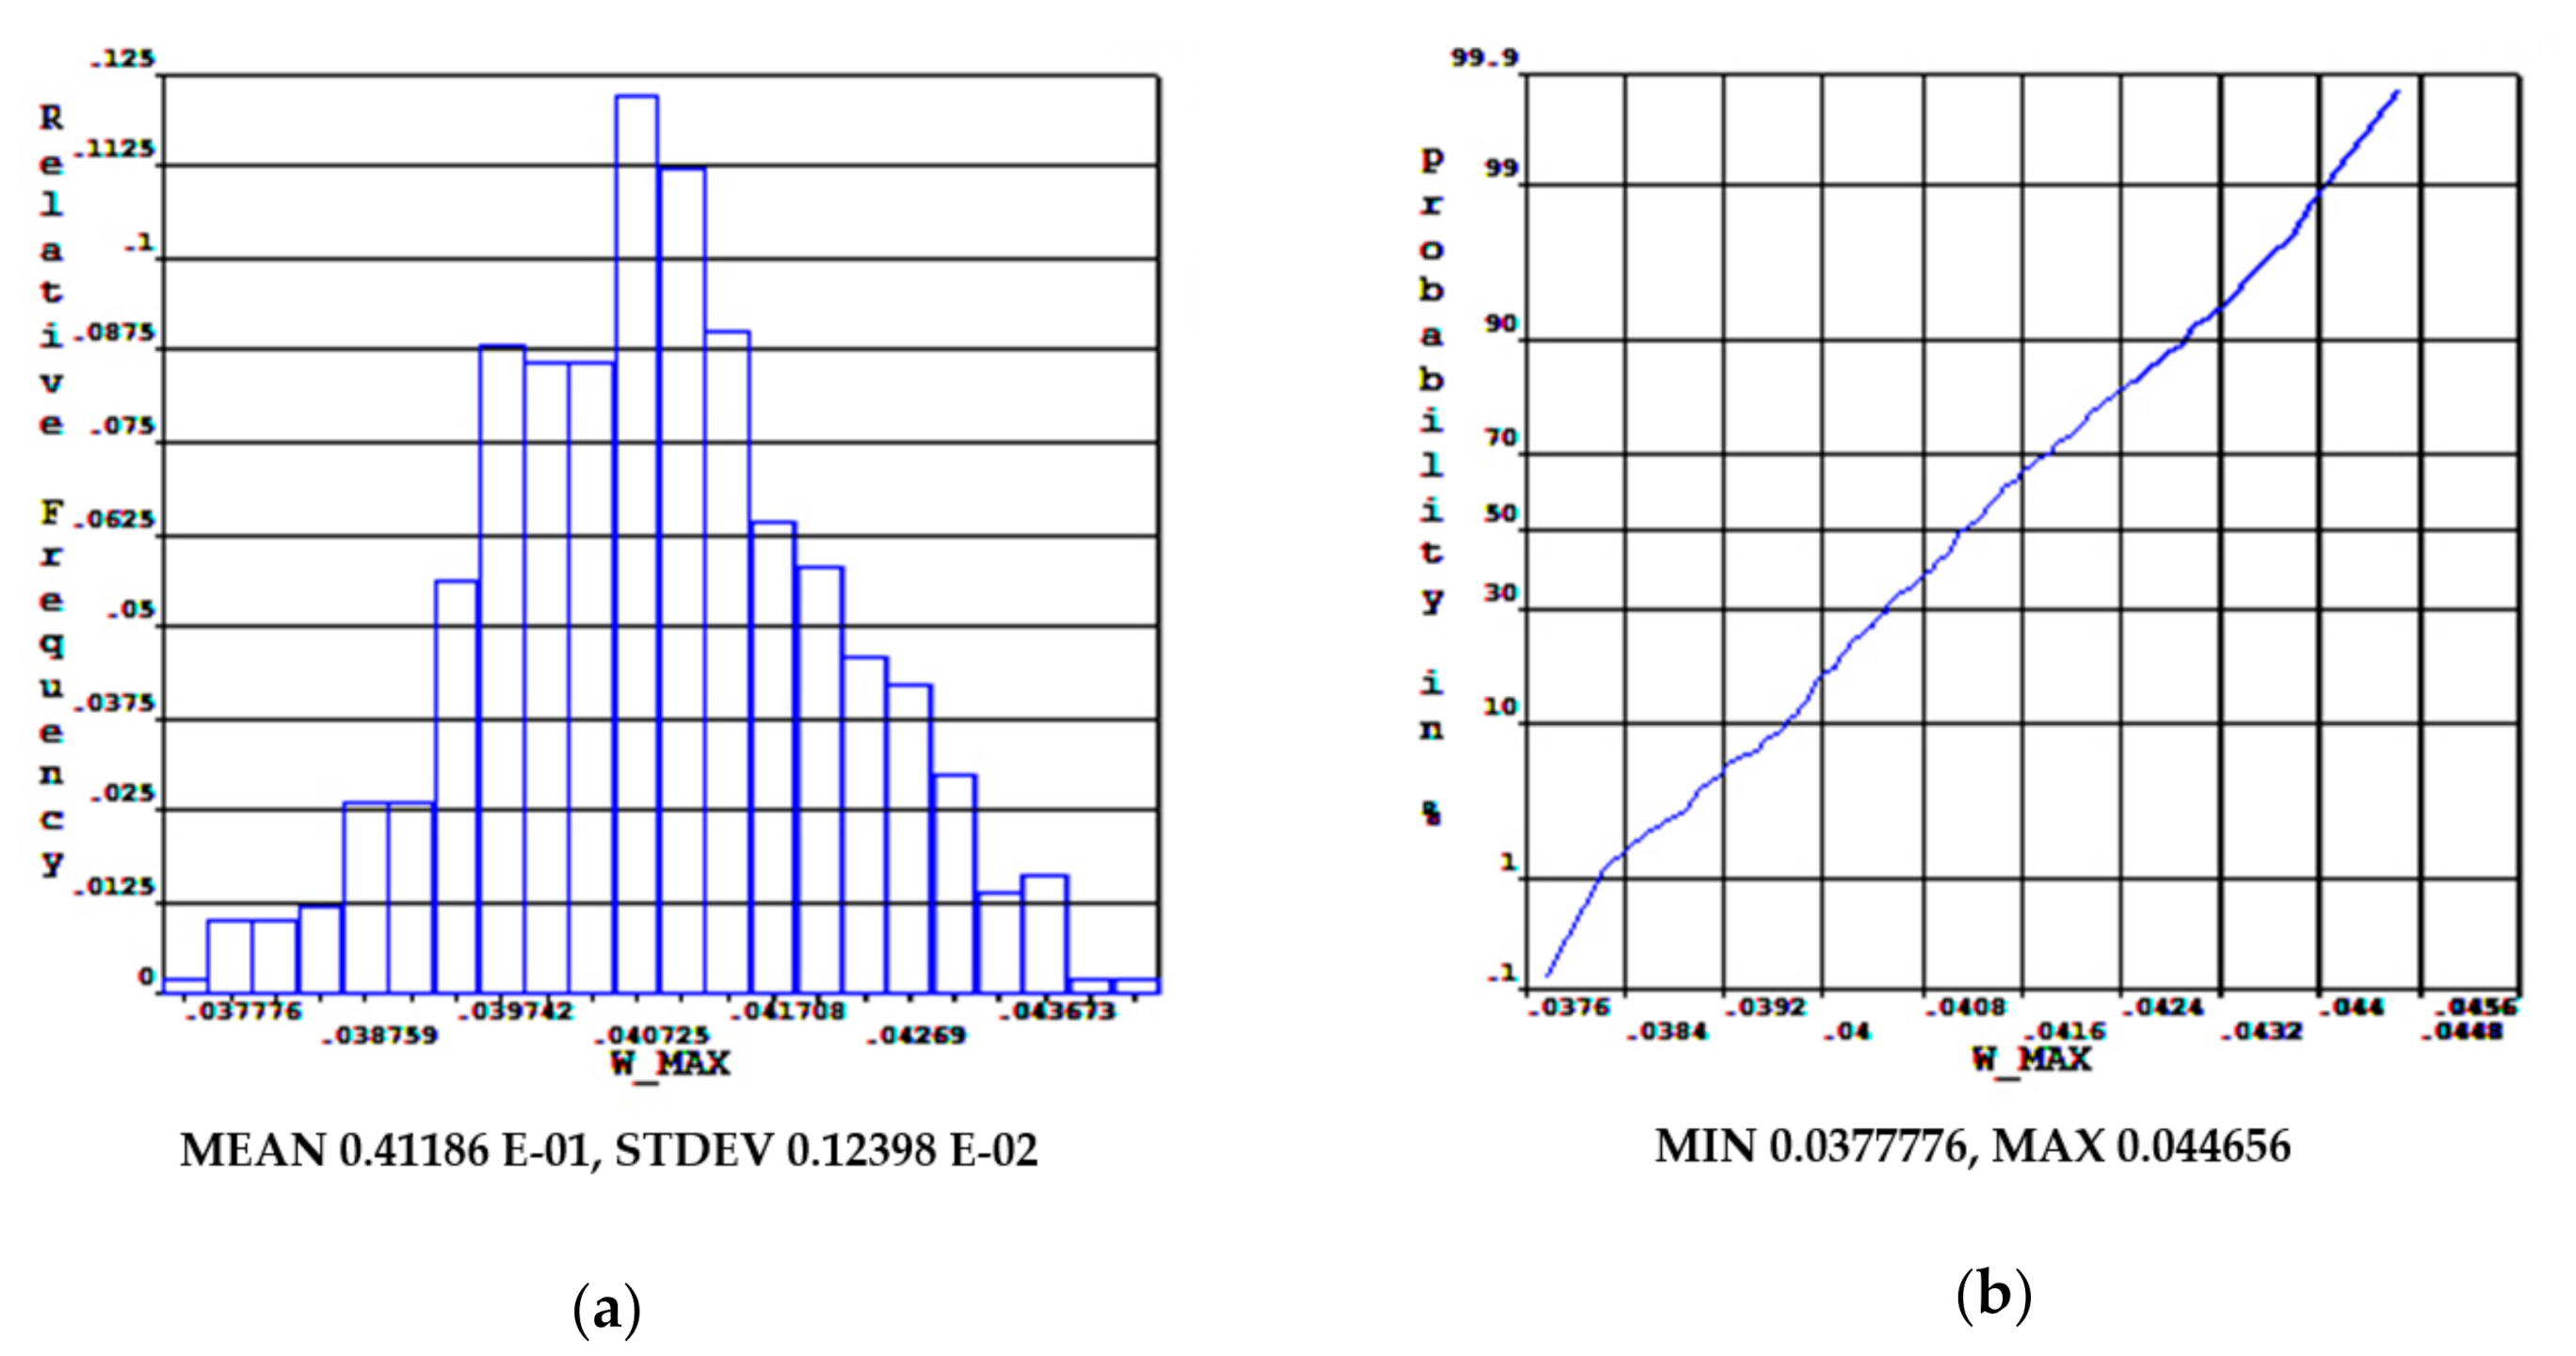
The probability of the corresponding output parameter W_MAX can also be determined according to the CDF (cumulative distribution function, Figure 11b). In this case, if four input parameters are entered into the calculation, the design probability is 7.83 × 10⁻² unreliable, for the output parameter the maximum deflection is greater than 43 mm.
Figure 12 shows a graph obtained from the sensitivity analysis for four input parameters. It can be seen from the plotted sensitivity graph for the output parameter that only the moduli of elasticity of both soils are significant parameters.
6. Results
When considering a deterministic procedure, the input parameters are considered to be constant quantities. These are the material properties of the plate, its dimensions, as well as the material properties of the soil. Slab deflections and specific bending moments were obtained from the deterministic solution. The maximum deflection was 41.124 mm (specific bending moments, used in dimensioning the reinforcement, were also calculated).
In the case of a probabilistic approach, the material properties of the plate were entered into the calculation as constants, the variance of the input values were considered only for the material characteristics of the soils. Two variants were considered. In the first variant, random parameters of soil elastic modulus were considered, namely gravel E_s1 and clay E_s2. The aim of the probabilistic calculation was to assess the structure for the second limit state. When considering maximum allowable deflection of 43 mm (according to the requirements of the investor), the probability of failure was 8.48 × 10⁻². In the second variant, four random parameters were considered, where, in addition to the modulus of elasticity of the soil, the scattering of the Poisson constants of the soils mi_s1 and mi_s2 were also considered. In this case, the design probability of 7.83 × 10⁻² was unreliable. In both cases, a sensitivity analysis was also given, which showed that the resulting deflection was significantly affected only by the modulus of elasticity of the soils, while their Possion´s numbers were less significant.
7. Discussion
The analyzed foundation structure provided us with new knowledge for further improvements, which we can apply in this stochastic analysis of contact tasks of foundation structures and elastic subsoil. If the variability of the input parameters is low, the results of the probabilistic analysis provide results similar to the deterministic approach. In our case, the variability of the input parameters was considered according to the requirements of the Eurocode. In the case that a geological survey would add the properties of individual geological probes from a given area, it is possible to consider the real variability of the input parameters. Therefore, it is most advantageous to make a number of experimental measurements and on their basis simulate the variability of the physical properties of the subsoils.
It would be worth considering a horizontally uniform distribution of individual layers of the subsoil, and alternatively, an uneven distribution, when the individual layers are inclined with a variable thickness, to examine the impact of caverns in subsoil on results, or to consider nonlinear models of subsoil.
Author Contributions
Conceptualization, N.J. and K.T.; methodology, N.J.; validation, K.T.; formal analysis, K.T.; investigation, K.T.; data analysis, N.J. and K.T.; writing—original draft preparation, K.T.; writing—review and editing, N.J.; supervision, N.J.; project administration, N.J. All authors have read and agreed to the published version of the manuscript.
Funding
This research received no external funding.
Acknowledgments
This paper was supported by VEGA Grant Agency, project no. 1/0412/18 and VEGA Grant Agency, project no. 1/0453/20.
Conflicts of Interest
The authors declare no conflict of interest.
References
- Kuklík, P.; Kopáčiková, M.; Brouček, M. Fast Estimation of the Influence Zone Depth inside the Subsoil in Relation to the Various Shapes of Footing. In Proceedings of the 12th International Conference of IACMAG, Goa, India, 1–6 October 2008. [Google Scholar]
- Ramesh, M.; Kuklik, P.; Valek, M. Several Comments on Numerical Modeling of Shallow Foundations. Procedia Eng. 2017, 195, 73–80. [Google Scholar] [CrossRef]
- Koktan, J.; Cajka, R.; Brozovsky, J. Finite Element Analysis of Foundation Slabs Using Numerical Integration of Boussinesq Solution. In Proceedings of the International Conference of Numerical Analysis and Applied Mathematics (ICNAAM 2017), Thessaloniki, Greece, 10 July 2018. [Google Scholar]
- Kotrasova, K.; Hegedusova, I.; Harabinova, S.; Panulinova, E.; Kormanikova, E. The possible causes of damage to concrete tanks, numerical experiment of fluid-structure-soil interaction. Key Eng. Mater. 2017, 738, 227–237. [Google Scholar] [CrossRef]
- Cajka, R.; Mynarcik, P.; Labudkova, J. Numerical solution of soil-foundation interaction and comparison of results with experimental measurements. Int. J. Geomate 2016, 11, 2116–2122. [Google Scholar]
- Čukanović, D.; Radaković, A.; Bogdanović, G.; Milanović, M.; Redžović, H.; Dragović, D. New Shape Function for the Bending Analysis of Functionally Graded Plate. Materials 2018, 11, 2381. [Google Scholar] [CrossRef] [PubMed] [Green Version]
- Niu, X.; Yao, Y.; Sun, Y.; He, Y.; Zhang, H. 3D Numerical Analysis of Synergetic Interaction between High-Rise Building Basement and CFG Piles Foundation. Appl. Sci. 2018, 8, 2040. [Google Scholar] [CrossRef] [Green Version]
- Ferreira, S.L.C.; Bruns, R.E.; Ferreira, H.S.; Matos, G.D.; David, J.M.; Brandao, G.C.; Dos Santos, W.N.L. Box-Behnken design: An alternative for the optimization of analytical methods. Anal. Chim. Acta 2007, 597, 179–186. [Google Scholar] [CrossRef] [PubMed]
- Janas, P.; Krejsa, M.; Sejnoha, J.; Krejsa, V. DOProC-based reliability analysis of structures. Struct. Eng. Mech. 2017, 64, 413–426. [Google Scholar]
- Jena, S.K.; Chakraverty, S.; Malikan, M. Implementation of non-probabilistic methods for stability analysis of nonlocal beam with structural uncertainties. Eng. Comput. 2020. [Google Scholar] [CrossRef]
- Alon, N.; Spencer, J.H. The Probabilistic Method; John Wiley & Sons: New York, NY, USA, 2000. [Google Scholar] [CrossRef]
- Akpan, U.O.; Koko, T.S.; Orisamolu, I.R.; Gallant, B.K. Fuzzy finite-element analysis of smart structures. Smart Mater. Struct. 2000, 10, 273. [Google Scholar] [CrossRef]
- Abdulkareem, M.; Bakhary, A.; Vafaei, M.; Noor, N.M.; Padil, K.H. Non-probabilistic wavelet method to consider uncertainties in structural damage detection. J. Sound Vib. 2018, 433, 77–98. [Google Scholar] [CrossRef]
- Jeong, H.K.; Shenoi, R.A. Probabilistic strength analysis of rectangular FRP plates using Monte Carlo simulation. Comput. Struct. 2000, 76, 219–235. [Google Scholar] [CrossRef]
- Chryssanthopoulos, M.K. Probabilistic buckling analysis of plates and shells. Thin-Walled Struct. 1998, 30, 135–157. [Google Scholar] [CrossRef]
Figure 1.
Reliability index β on the numerical axis for load-bearing elements of reliability class RC2.
Figure 1.
Reliability index β on the numerical axis for load-bearing elements of reliability class RC2.

Figure 2.
Confidence index.

Figure 3.
Longitudinal section of the structure.

Figure 4.
Subsoil geometry with base plate and finite element mesh. The clay layer is marked in red, the gravel in purple, and the foundation slab in blue.
Figure 4.
Subsoil geometry with base plate and finite element mesh. The clay layer is marked in red, the gravel in purple, and the foundation slab in blue.

Figure 5.
(a) Deformation (m) of the surface of the elastic half-space; (b) Contact stress (kPa) under the base plate.
Figure 5.
(a) Deformation (m) of the surface of the elastic half-space; (b) Contact stress (kPa) under the base plate.

Figure 6.
(a) Specific bending moment mx (kNm/m); (b) Specific bending moment my (kNm/m).

Figure 7.
(a) Probability density (PDF) and distribution function (CDF) divisions of input variable E_s1; (b) PDF and CDF divisions of input variable E_s2.
Figure 7.
(a) Probability density (PDF) and distribution function (CDF) divisions of input variable E_s1; (b) PDF and CDF divisions of input variable E_s2.

Figure 8.
(a) Histogram of the output parameter W_MAX; (b) CDF function of the output parameter W_MAX.
Figure 8.
(a) Histogram of the output parameter W_MAX; (b) CDF function of the output parameter W_MAX.

Figure 9.
Sensitivity analysis graph for output parameter maximum deflection W_MAX.

Figure 10.
(a) PDF and CDF division of input variable mi_s1; (b) PDF and CDF division of input variable mi_s2.
Figure 10.
(a) PDF and CDF division of input variable mi_s1; (b) PDF and CDF division of input variable mi_s2.

Figure 11.
(a) Histogram of the output parameter W_MAX; (b) CDF of maximum deflection W_MAX.

Figure 12.
Sensitivity analysis for output parameter maximum deflection W_MAX.


Table 1.
Characteristics of input variables for probability analysis.
| Input Variable | Deterministic | Distribution | Variable Range |
|---|---|---|---|
| E_s1 (GM) | 70,000 | GAU | 0.04 × 70,000 |
| E_s2 (SC) | 10,000 | GAU | 0.05 × 10,000 |
Table 2.
Characteristic of input parameters for reliability analysis.
| Input Variable | Deterministic | Distribution | Variable Range |
|---|---|---|---|
| E_s1 (GM) | 70,000 | GAU | 0.04 × 70,000 |
| μ_s1 (GM) | 0.25 | GAU | 0.04 × 0.25 |
| E_s2 (SC) | 10,000 | GAU | 0.05 × 10,000 |
| μ_s2 (SC) | 0.35 | GAU | 0.04 × 0.35 |
Publisher’s Note: MDPI stays neutral with regard to jurisdictional claims in published maps and institutional affiliations. |
© 2020 by the authors. Licensee MDPI, Basel, Switzerland. This article is an open access article distributed under the terms and conditions of the Creative Commons Attribution (CC BY) license (http://creativecommons.org/licenses/by/4.0/).
Share and Cite
MDPI and ACS Style
Jendzelovsky, N.; Tvrda, K. Probabilistic Analysis of a Hospital Building Slab Foundation. Appl. Sci. 2020, 10, 7887. https://0-doi-org.brum.beds.ac.uk/10.3390/app10217887
AMA Style
Jendzelovsky N, Tvrda K. Probabilistic Analysis of a Hospital Building Slab Foundation. Applied Sciences. 2020; 10(21):7887. https://0-doi-org.brum.beds.ac.uk/10.3390/app10217887
Chicago/Turabian StyleJendzelovsky, Norbert, and Katarina Tvrda. 2020. "Probabilistic Analysis of a Hospital Building Slab Foundation" Applied Sciences 10, no. 21: 7887. https://0-doi-org.brum.beds.ac.uk/10.3390/app10217887
Note that from the first issue of 2016, this journal uses article numbers instead of page numbers. See further details here.