On the Use of Importance Measures in the Reliability of Inventory Systems, Considering the Cost

1
School of Electrical Engineering, Zhengzhou University, Zhengzhou 450001, Henan, China
2
Beijing Institute of Astronautical System Engineering, Beijing 100076, China
*
Authors to whom correspondence should be addressed.
Appl. Sci. 2020, 10(21), 7942; https://0-doi-org.brum.beds.ac.uk/10.3390/app10217942
Submission received: 25 August 2020
/
Revised: 23 October 2020
/
Accepted: 26 October 2020
/
Published: 9 November 2020
(This article belongs to the Special Issue Systems Engineering: Availability and Reliability)
Abstract
:In order to maximize inventory benefits or minimize costs, reliability and cost of inventory control models need to be identified and analyzed. These importance measures are one important approach to recognize and evaluate system weaknesses. However, importance measures have fewer applications in inventory systems’ reliability. Considering the cost, this paper mainly discusses the reliability change of performance parameters with the importance measures in inventory systems. The calculation methods of differential importance and Birnbaum importance are studied in the inventory control model with shortages. By comparing the importance values of various parameters in the model, the optimization analysis of the inventory model can be used to identify the key parameters, so as to effectively reduce the total inventory cost. The importance order and the identification of key parameters are helpful to increase the operational efficiency of the inventory control and provide effective methods for improving the inventory management. Lastly, a case study with a shortage and limited inventory capacity is used to demonstrate the proposed model.
1. Introduction
Importance measures refer to the influence on system reliability when a single or multiple components of a system fail or change state, which is a function of component reliability parameters and system structure. As one of the important branches and basic theories of reliability, importance measures penetrate all stages of products, including design, production, inspection, sale, maintenance, and so on. Identifying the factors influencing system reliability is most important [1,2]. In the phase of design, importance measures are used to identify weaknesses and support the improvement and optimization of system. During the system operation, importance measures can allocate enterprise resources reasonably to constituent part of a system to ensure that it is operating properly. By identifying and evaluating system weaknesses, importance measures have been widely applied in system reliability, decision making and risk analysis [3,4,5,6,7].
Since Birnbaum [8] firstly proposed the concept of importance analysis, importance measures have wide applications in the domains of fault analysis, model simulation, and network planning. Borgonovo and Apostolakis [9] introduced a new importance measure, the differential importance measure, for probabilistic safety assessment. Considering the transition rates of component states, Dui et al. [10,11,12,13] discussed the influence of importance measures on system performance and its applications in aviation and other fields. Kim and Song [14] proposed a generalized reliability importance measure that can deal with multiple critical failure regions, large curvatures of limit-state surfaces and the correlation between the input random variables. Li et al. [15] proposed a power flow element importance measure, which can improve cascading failure prevention, system backup setting, and overall resilience. Dui et al. [16] analyzed the applications of importance measures in the reliability of inventory systems and extended the importance measure to the three-echelon inventory systems. Dui et al. [17] studied the cascading failure in an inventory network from the perspective of the payoffs of nodes in a multi-strategy evolutionary game. Nguyen et al. [18] proposed opportunistic maintenance decision rules based on the criticality level of components and the availability of spare parts. Adak and Mahapatra [19] developed a cost-effective ordering inventory model where the increase in reliability of the item lead to a rise in demand and decreases the rate of deterioration. Maji et al. [20] found the optimal number of transportation cycles and components, which can maximize the total business profit and system reliability with volume, weight, and cost of the system as constraints. Huang [21] studied the system reliability of a stochastic delivery-flow distribution network with an inventory. Manna et al. [22] studied an imperfect production inventory model with production system reliability under two-layer supply chain management. Abdel-Aleem et al. [23] proposed an optimal solution of the reliability model by a generalized reduced gradient algorithm.
Currently, the competitive environment is drastically changing, which will lead to the adaptation of system resilience design and maintenance in dynamic environments [24,25]. There are too many uncertainty factors involved in inventory models. With the interference of various uncertainties, the problem of stock shortage occurs frequently. In situations where enterprises operate normally and minimize inventory, how to realize the optimization of inventory models out of stock, has become a hot topic for scholars from all circles [26]. Cárdenas-Barrón and Sana [27] proposed an economic order quantity inventory model of multi-items in a two-layer supply chain where demand was sensitive to promotional effort, and they compared collaborative and non-collaborative systems in terms of their average profits. Shekarian et al. [28] developed a reverse inventory model where the recoverable manufacturing process was affected by the learning theory. Chao et al. [29] characterized the optimal policies that simultaneously determine the optimal ordering and pricing decisions in each period over a finite planning horizon. Meanwhile, the impacts of supply source diversification and supplier reliability on the firm and on its customers are studied. Yu et al. [30] considered the optimal production, pricing, and substitution policies of a continuous-review production–inventory system with two products: a high-end product and a low-end product. Lee et al. [31] examined vendor-managed inventory systems with stockout-cost sharing between a supplier and a customer with shortages allowed under limited storage capacity, where a stockout penalty was charged to the supplier when stockouts occurred with the customer. Jia and Cui [32] analyzed the reliability of supply chain systems by using copulas. Flynn et al. [33] developed a theoretical conceptualization of supply chain uncertainty and reliability. He et al. [34] built a logistics service supply chain model under the stochastic demand to consider the feature of non-storage and reliability. Chen et al. [35] evaluated the supply chain reliability and resilience for the complexity of supply chain structures.
The inventory models provide an effective means for companies to carry out inventory management and reduce inventory costs. Scholars have continuously improved and optimized the models from various perspectives and fields, however, have neglected the application of importance measures to effectively identify and optimize systems in this field. Different parameters in the inventory system have different effects on the inventory system. Issues which have become the focus of research are: How to use the system reliability and importance measure to study the influence of the parameters in the inventory system on the inventory system? How to calculate the importance of different parameters and determine the parameters that have the greatest impact on the system? Therefore, this paper analyzes the reliability of the inventory system. According to the reliability of the inventory system, a cost-based inventory system importance model is proposed to study the importance of different parameters, which provides some support and reference for enriching importance measures and optimizing inventory models.
The rest of the paper is as follows. Section 2 analyses the reliability of inventory systems. The cost of inventory systems reliability is briefly described in Section 3. Section 3 also derives the computational methods of importance measures about various parameters of cost function. A numerical example is presented to illustrate importance values and changes in cost parameters in Section 4. Section 5 gives the conclusions and future work of this paper.
2. Reliability Analysis in Inventory Systems
Many logistics units constitute the logistics system organically according to a certain link mode. The premise of analyzing the reliability of the whole logistics system is to determine the calculation method of the reliability of a single logistics unit.
The reliability of a logistics unit refers to the probability that the service provided by logistics units remains within the specified error limit under certain conditions and time. In the service capacity curve of the logistics unit in Figure 1, the curve represents the standard service curve that the logistics unit is expected to achieve, the curve represents the error limit of the logistics service specified for the logistics unit, and the curve represents the real logistics service curve provided by the logistics unit.
In Figure 1, is the level of the service capacity of the logistics unit. In the intervals ,, , the logistics service provided by the logistics unit exceeds the specified error limit. Therefore, it is considered that the work of the logistics unit in this situation is unreliable. In the intervals , , the logistics service provided by the logistics unit does not exceed the specified error limit. Therefore, it is considered that the operation of the logistics unit is reliable here. Assuming that the reliability of the logistics unit is , then
where , are the starting and ending time, respectively, of the kth observation that the logistics service provided by the logistics unit exceeds the allowable deviation range, . is the total observation time, and is the number of times that the logistics service provided by the logistics unit exceeds the allowable deviation range.
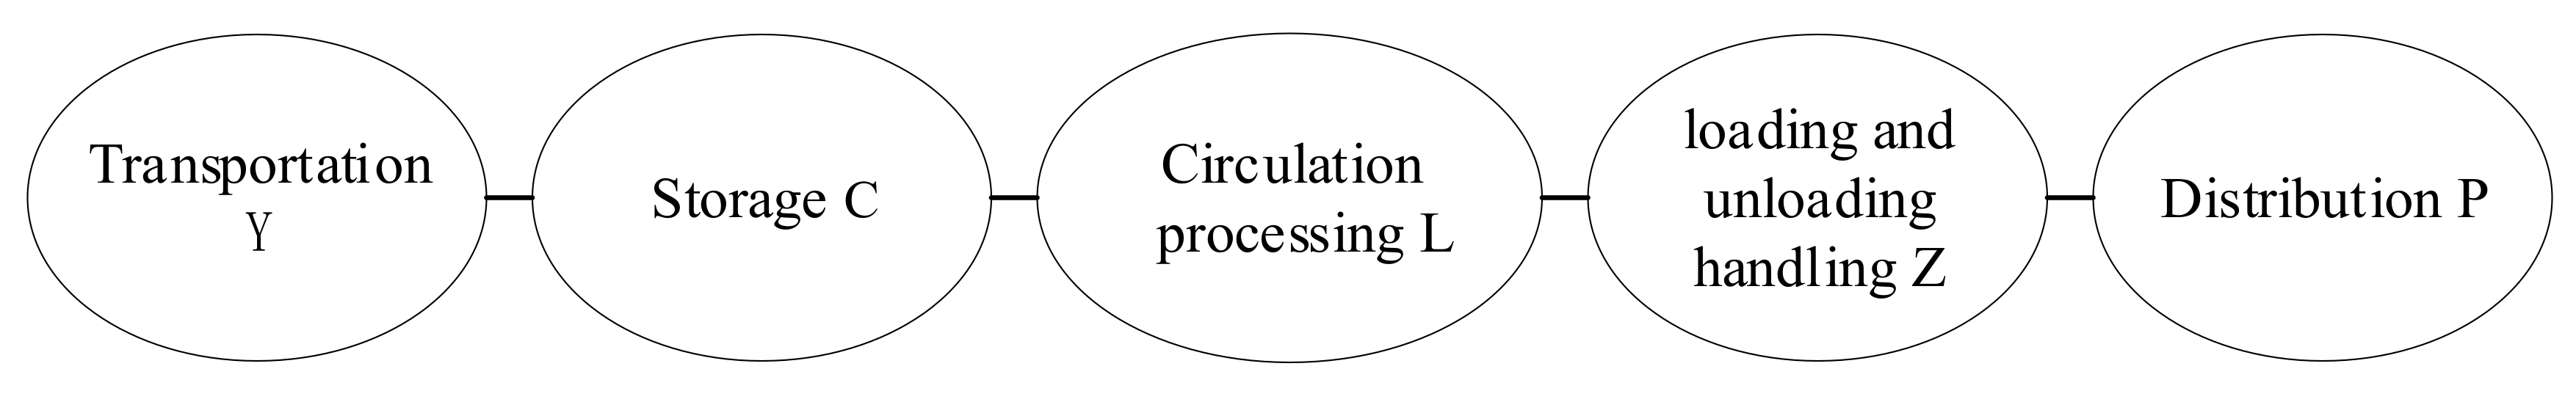
In a typical tandem logistics system, such as the one shown in Figure 2, the reliability of the five logistics units of transportation, storage, circulation processing, loading and unloading handling, and distribution are , , , and , respectively.
This logistics system is composed of five logistics units in series. According to the mathematical reliability model of series system, the reliability of typical series logistics system is
The logistics system cannot be fully paralleled; therefore the reliability calculation can only be carried out for one parallel subsystem. The reliability of circulation processing, , and circulation processing, , are and , respectively, as shown in Figure 3.
Taking the parallel subsystem of circulation processing as an example, according to the mathematical reliability model of the parallel system, the reliability of the parallel subsystem is
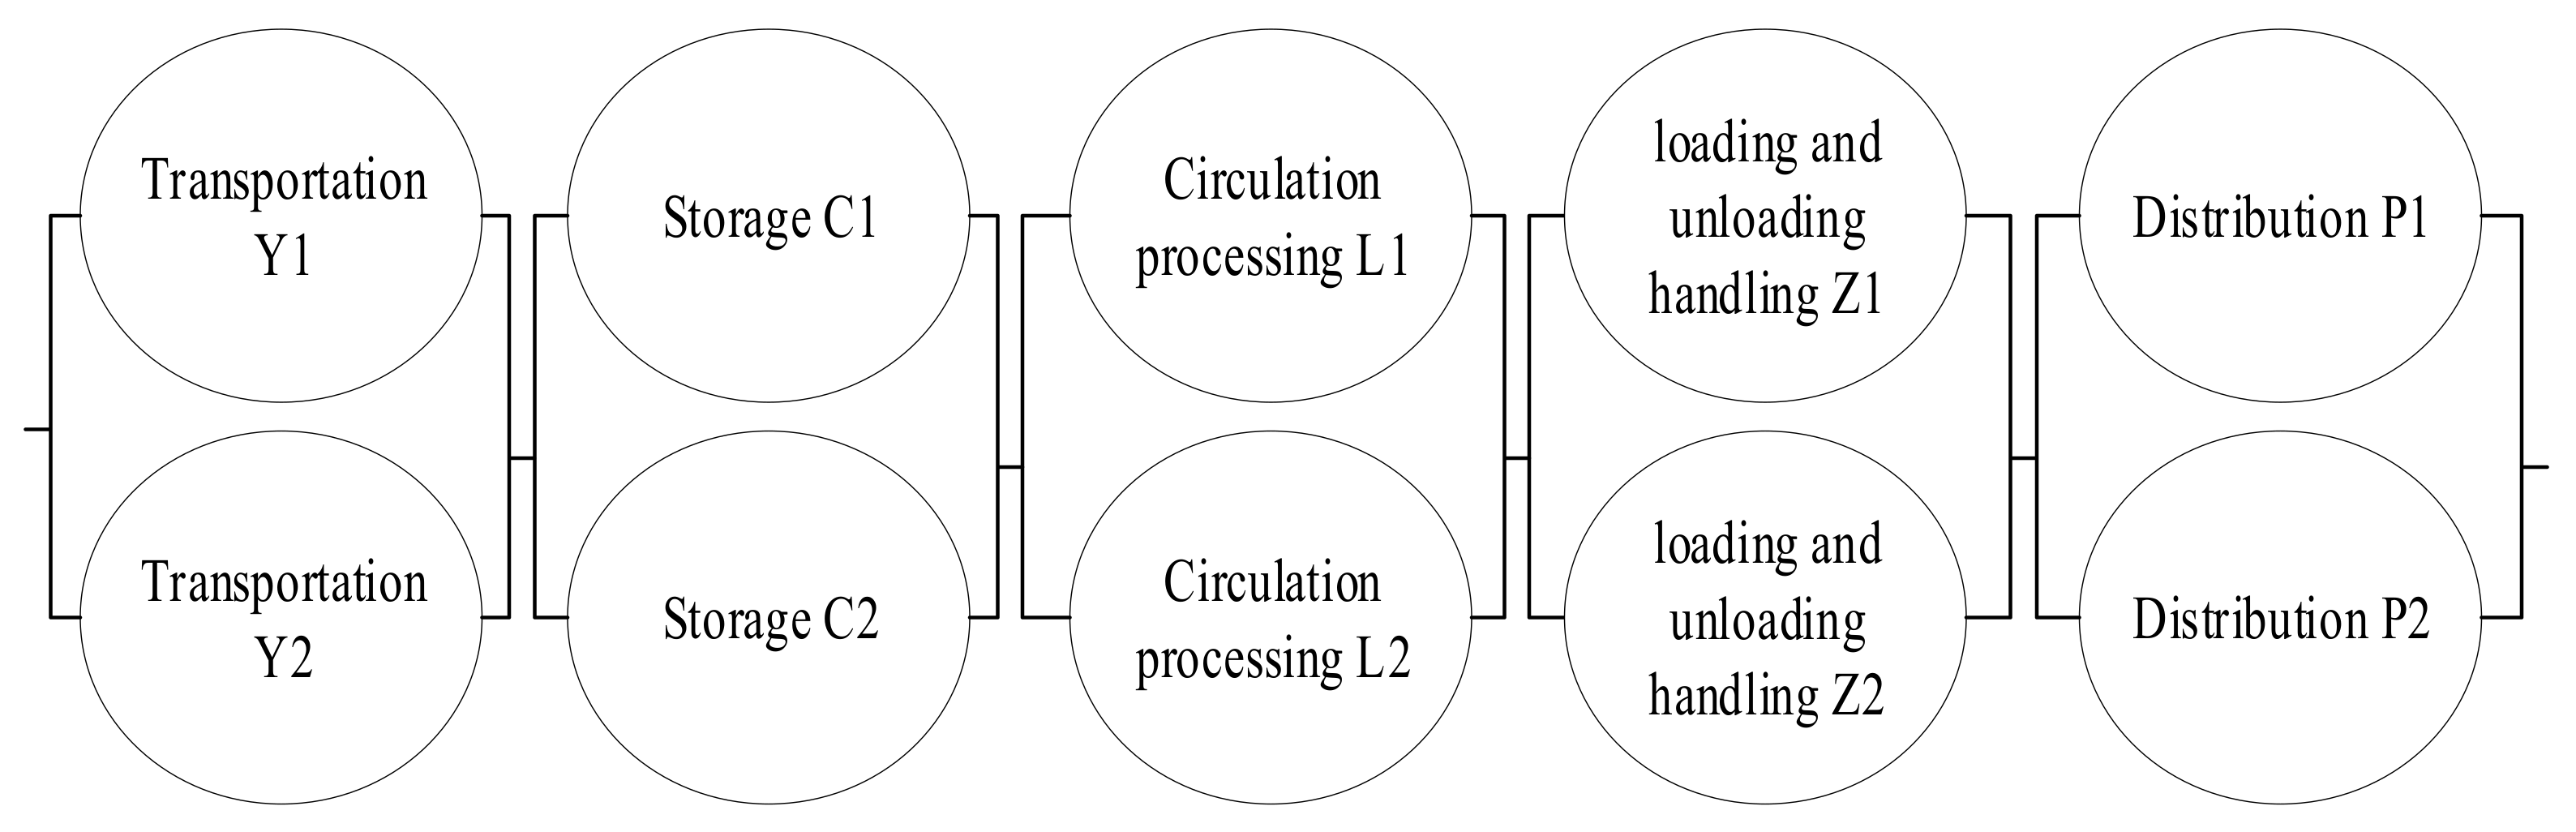
In a typical series parallel logistics system, as shown in Figure 4, the reliability of transportation , transportation , storage , storage , circulation processing , circulation processing , loading and unloading handling , loading and unloading handling , distribution and distribution are , , , , , , , , , and , respectively.
The first group series system consists of five logistics units: transportation , storage , circulation processing , loading and unloading handling , and distribution . According to the mathematical reliability model of series systems, the reliability of the first series system is
The second group of series systems consists of five logistics units: transportation , storage , circulation processing , loading and unloading handling and distribution . Therefore, according to the mathematical reliability model of series system, the reliability of the second series system is
The reliability of two series systems in parallel is
In a typical series parallel logistics system, as shown in Figure 5, the reliability of transportation , transportation , storage , storage , circulation processing , circulation processing , loading and unloading handling , loading and unloading handling , distribution and distribution are , , , , , , , , , and , respectively.
The first group of parallel subsystems is composed of transportation and transportation in parallel. According to the mathematical reliability model of the parallel system, the reliability of the first group of parallel subsystems is
Similarly, the reliability of the second group of parallel subsystems is
The reliability of the third group of parallel subsystems is
The reliability of the fourth group of parallel subsystems is
The reliability of the fifth group of parallel subsystems is
The reliability of a typical parallel series logistics system is the reliability of the five parallel subsystems in series.
3. Cost-Based Importance Measures of Inventory Systems Reliability
3.1. Birnbaum Importance Measure
From a mathematical perspective, Birnbaum importance [8] analyzes the influence of changes in variables on the whole function as , where means a function consisting of n variables .
For various systems, and have different meanings. For example, represents the reliability of component , and shows the reliability of whole system.
3.2. Differential Importance Measure
The differential importance measure [9] is , in which, represents the risk metrics associated with various parameters, and means the parameters.
In inventory management, means the total cost of the inventory control system, and shows each parameter in inventory control, such as the order quantity, demand quantity, storage cost, shortage cost and so on.
3.3. Discussions on Importance Measures Based on the Inventory Systems Cost
In the inventory control model, the optimal lot size, , is obtained by minimizing the total cost. The function expression of the total cost is as follows.
where is the selection variable, is a parameter variable, is the unit price of the goods in stock, is the unit holding cost, is the demand speed, is the order cost, and is the capital cost.
Among them, an increase in , , and will cause an increase in the total cost. An increase in will cause a decrease in total cost.
The total cost function takes the first-order derivative of and sets the result to 0, then
For the importance of several parameter variables with respect to function , the implicit importance can be applied to the optimization problem of the model. The final results are shown in Table 1. Assuming that = 10 (yuan/piece), = 1 (yuan/piece), = 8000 (piece), = 30 (yuan/time), and = 8%, the comparative static (CS) can be used to analyze the results as follows.
From Table 1, the results can be obtained as follows.
- (1)
- The increase in , and leads to a decrease in in the EOQ model.
- (2)
- The increase in and will cause an increase in in the EOQ model.
- (3)
- It can be seen from the table that is the most influential parameter in the EOQ results, and its influence degree is far greater than other parameters.
On the other hand, the partial derivatives of each parameter have different units of measurement, so they cannot be compared with each other. Similarly, because there are different measurement standards between parameters, assumption 1 of differential importance is not tenable in the application of differential importance. Even if the parameters have the same unit of measurement, but the direction of change is different, and the results of static analysis technology cannot be used as the standard of measurement.
According to the relationship between comparative static analysis technology and differential importance, the expression of differential importance measures in implicit models is proposed, and expressed as follows.
is a matrix, and the elements in the matrix represent the differential importance of the parameter with respect to . According to the relationship between comparative static analysis technology and the expression of differential importance in the implicit model, the expression of Birnbaum importance is
In an implicit multivariate function, the change of the whole function is caused by the change of one of the independent variables. The importance degree is used to rank the parameters, and the problems caused by different measurement units of each parameter are considered.
The change of the related variables needs to be calculated. According to the result of , the optimal order quantity can be taken as the selection variable, and five parameters can be selected at the same time. In this case, . The results of the two importance analyses are presented in Table 2 and Table 3. Columns 5 and 6 in Table 2 and Table 3 represent the importance of the parameter and the resultant ranking, respectively.
It can be seen from Table 2 that the proportional increase in parameters , or has almost the same effect on the results. At the same time, the importance of is only slightly lower than , and , while is almost an unimportant parameter relative to the other parameters. Although the results of Birnbaum importance obtained in Table 3 are different from those in Table 2, the relationship between the values is roughly the same in both tables, that is, the ranking results of differential importance and Birnbaum importance are the same. That is to say, compared with the influence of other parameters on the EOQ considering financing, the change of EOQ considering financing caused by is almost negligible.
4. Numerical Example
In this section, a shortage and limited inventory capacity is used to demonstrate the proposed model. The inventory models are assumed, and displayed in Table 4.
Assuming that is a time cycle, and when , the instant purchase is , the inventory capacity is , so the capacity of leased warehouses is . is the allowable shortage quantity, is the demand rate, and it is decreasing constantly during .
Therefore, the change of inventory volume during is shown in Figure 6.
Assuming the total cost of an inventory is C, then
where R means the demand speed, Q is the order quantity, and and represent the total inventory volume, so the inventory capacity of leased warehouses is . is the shortage quantity, so . is the order cost, is the inventory cost of unit goods per unit time when using their own warehouses, means the inventory cost of unit goods per unit time when using leased warehouses, and represents the shortage cost of unit goods.
In order to obtain the optimal solution of total cost, that is the minimal cost C* and the optimal ordering quantity , taking the partial derivatives of separately, then , , and can be obtained as follows:
Birnbaum importance can be used to analyze the importance of parameters in this model. The expressions are as follows:
The parameters can be selected for analysis in the inventory models with stockout. There are different metrics among the parameters, therefore differential importance measures can be applied to identify the importance of each parameter in this model. The expressions are as follows:
Assuming that = 30, = 1, = 2, = 3, = 500, and = 8000, when combining the inventory models with shortage and the formula of each parameter above in the model, the results of Birnbaum importance and the differential importance measures of various parameters are as shown in Table 5.
From Table 5, firstly, although the Birnbaum importance and differential importance measure of parameters have a certain difference in values, the sorting results are identical. Secondly, the values of importance are positive or negative, but the parameters are sorted by their absolute value. When the value is positive, it indicates that the optimal order quantity increases when the parameter is increasing, otherwise, it decreases with the increase in the parameter. Thirdly, according to the magnitude of values, the order of decreases in sequence. In other words, when these parameters change proportionally, the optimal order quantity has the largest change caused by , and is the least important among these variables. Therefore, the changes of and are most important. The demand speed and inventory capacity are the key parameters for reducing the total cost and optimizing the inventory model.
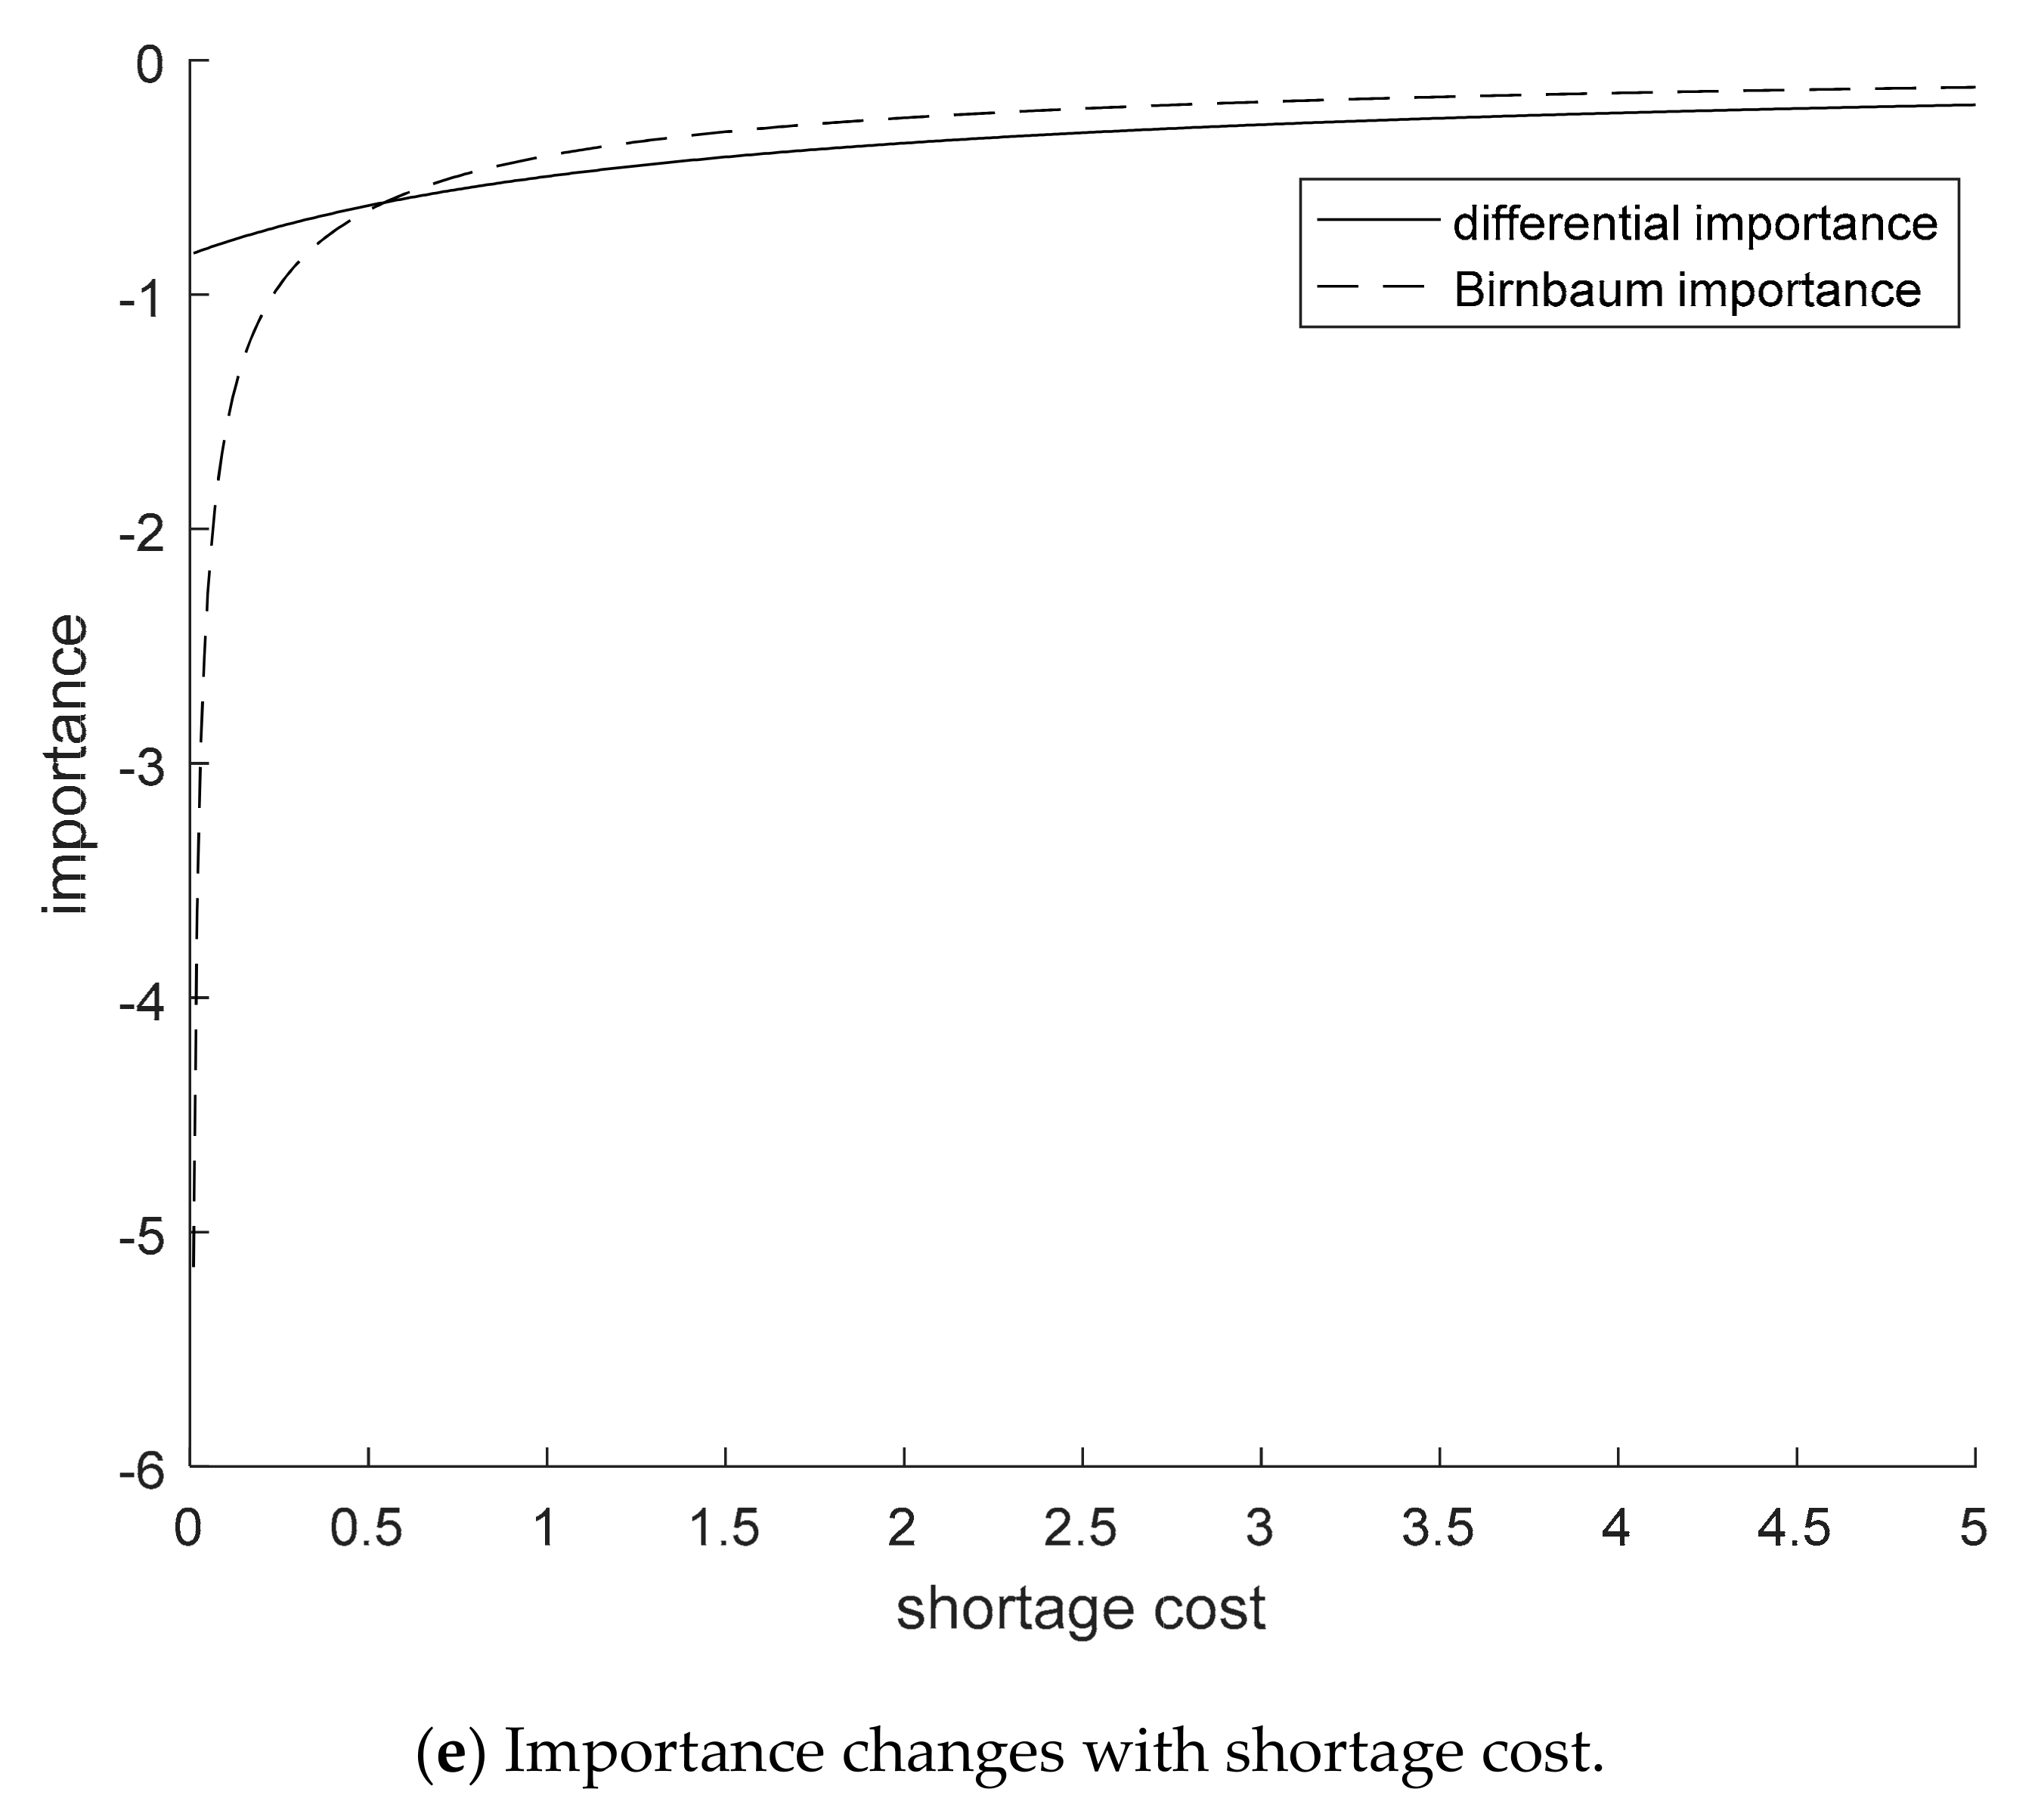
In order to improve analysis of the dynamic effects caused by various parameters on Birnbaum importance and differential importance measure, each parameter can be set for the changes of Birnbaum importance and the differential importance measure, as parameters change within the intervals. For each parameter, the variation of Birnbaum importance and the differential importance measure are shown in Figure 7.
Figure 7 shows that Birnbaum importance and differential importance measures have similarities in the variation law. The plus-minus and direction of curves are consistent, but the slopes are not the same. In Figure 7e, when the shortage cost is less than 0.5, Birnbaum importance changes almost linearly, otherwise its change is quite slow and tends to be stable. However, the curve of the differential importance measure keeps a steady change rate within the interval. In Figure 7a,e, the two curves even appear to be intersected. At the intersection, the values of Birnbaum importance and the differential importance measure are equivalent. In addition, the differential importance measure is above the Birnbaum importance in Figure 7b, while the exact reverse is the case in Figure 7c,d; the Birnbaum importance of the parameter lies above the differential importance measure. The two importance measures show different changes with the varying parameters, which suggests that there are certain differences between the two importance measures in practice. Meanwhile, when applying the additivity of the differential importance measure, let , then
Based on the analysis above, in the optimization analysis of inventory models with stockout, Birnbaum importance and the differential importance measure are different in calculation method and values, but the orders of importance are ultimately identical. This hints that Birnbaum importance and differential importance measures can effectively identify the importance of each parameter in a model, however, due to their own advantages and disadvantages, it is better to combine them together to provide a better solution for decision-makers in practice.
5. Conclusions and Future Work
Based on the theory of importance measures and inventory models, this paper mainly discusses the diagnosis and recognition of performance parameters in inventory control models with stockout. After a brief introduction about the inventory models that allows stockout, the concepts and calculation method of importance measures were applied into the models to analyze the application of Birnbaum importance and the differential importance measure. By comparing and analyzing the calculations and results of the two importance measures, the importance order was obtained, and the key parameters were identified to optimize the inventory control and management from the view of system reliability. The main contributions of this article are as follows.
- (1)
- Based on the research of inventory systems, it was found that there was almost no literature on the reliability of an inventory system. Combining the concept of reliability with the inventory system, an inventory system reliability model was proposed in this paper. It could enrich the research in the field of inventory system reliability.
- (2)
- Based on the inventory system reliability model, cost-based importance measures of inventory systems’ reliability were proposed. The purpose was to study the impact of the changes of different parameters in the inventory system on the inventory system.
- (3)
- Based on the analysis of numerical examples, it was concluded that Birnbaum importance and differential importance measures can effectively determine the importance of each parameter in the inventory system. According to the calculation result, the order of parameter importance is .
In future work, we will consider the impact of the relationship between different parameters on the inventory system.
Author Contributions
Conceptualization, L.C. and S.W.; methodology, L.C.; software, S.W.; writing—original draft preparation, L.C. and M.K.; writing—review and editing, L.C. and S.W.; supervision, L.C. and S.W.; funding acquisition, L.C. All authors have read and agreed to the published version of the manuscript.
Funding
This research was funded by the financial supports for this research from the National Natural Science Foundation of China (No. 61807031), Key Science and Technology Program of Henan Province, China (Nos. 132102210560, 162102210004).
Conflicts of Interest
The authors declare no conflict of interest. The funders had no role in the design of the study; in the collection, analysis, or interpretation of data; in the writing of the manuscript, or in the decision to publish the results.
References
- Kozłowski, E.; Kowalska, B.; Kowalski, D.; Mazurkiewicz, D. Survival Function in the Analysis of the Factors Influencing the Reliability of Water Wells Operation. Water Res. Manag. 2019, 33, 4909–4921. [Google Scholar] [CrossRef]
- Kozłowski, E.; Mazurkiewicz, D.; Kowalska, B.; Kowalski, D. Application of a multidimensional scaling method to identify the factors influencing on reliability of deep wells. In Advances in Intelligent Systems and Computing, Proceedings of the Intelligent Systems in Production Engineering and Maintenance, ISPEM 2018, Wrocław, Poland, 17–18 September 2018; Burduk, A., Chlebus, E., Nowakowski, T., Tubis, A., Eds.; Springer: Cham, Switzerland, 2018; Volume 835, pp. 56–65. [Google Scholar] [CrossRef]
- Zhang, C.; Zhang, Y. Common cause and load-sharing failures-based reliability analysis for parallel systems. Eksploatacja i Niezawodnosc Maint. Reliab. 2019, 22, 26–34. [Google Scholar] [CrossRef]
- Cai, B.; Liu, Y.-H.; Fan, Q.; Zhang, Y.; Liu, Z.; Yu, S.; Ji, R. Multi-source information fusion based fault diagnosis of ground-source heat pump using Bayesian network. Appl. Energy 2014, 114, 1–9. [Google Scholar] [CrossRef]
- Cui, J.; Ren, Y.; Xu, B.; Yang, D.; Zeng, S. Reliability analysis of a multi-eso based control strategy for level adjustment control system of quadruped robot under disturbances and failures. Eksploatacja i Niezawodnosc Maint. Reliab. 2019, 22, 42–51. [Google Scholar] [CrossRef]
- Sun, B.; Li, Y.; Wang, Z.; Li, Z.; Xia, Q.; Ren, Y.; Feng, Q.; Yang, D.; Qian, C. Physics-of-failure and computer-aided simulation fusion approach with a software system for electronics reliability analysis. Eksploatacja i Niezawodnosc Maint. Reliab. 2020, 22, 340–351. [Google Scholar] [CrossRef]
- Liu, D.; Wang, S.; Tomovic, M. Degradation modeling method for rotary lip seal based on failure mechanism analysis and stochastic process. Eksploatacja i Niezawodnosc Maint. Reliab. 2020, 22, 381–390. [Google Scholar] [CrossRef]
- Birnbaum, Z.W. On the Importance of Different Components in a Multi-Component System; Academic Press: New York, NY, USA, 1969. [Google Scholar]
- Borgonovo, E.; Apostolakis, G. A new importance measure for risk-informed decision making. Reliab. Eng. Syst. Saf. 2001, 72, 193–212. [Google Scholar] [CrossRef]
- Dui, H.; Li, S.; Xing, L.; Liu, H. System performance-based joint importance analysis guided maintenance for repairable systems. Reliab. Eng. Syst. Saf. 2019, 186, 162–175. [Google Scholar] [CrossRef]
- Dui, H.; Si, S.; Zuo, M.J.; Sun, S. Semi-Markov Process-Based Integrated Importance Measure for Multi-State Systems. IEEE Trans. Reliab. 2015, 64, 1–12. [Google Scholar] [CrossRef]
- Dui, H.; Si, S.; Wu, S.; Yam, R.C. An importance measure for multistate systems with external factors. Reliab. Eng. Syst. Saf. 2017, 167, 49–57. [Google Scholar] [CrossRef] [Green Version]
- Dui, H.; Si, S.; Yam, R.C. Importance measures for optimal structure in linear consecutive-k-out-of-n systems. Reliab. Eng. Syst. Saf. 2018, 169, 339–350. [Google Scholar] [CrossRef]
- Kim, T.; Song, J. Generalized Reliability Importance Measure (GRIM) using Gaussian mixture. Reliab. Eng. Syst. Saf. 2018, 173, 105–115. [Google Scholar] [CrossRef]
- Li, J.; Dueñas-Osorio, L.; Chen, C.; Shi, C.-L. AC power flow importance measures considering multi-element failures. Reliab. Eng. Syst. Saf. 2017, 160, 89–97. [Google Scholar] [CrossRef] [Green Version]
- Dui, H.; Li, C.; Chen, L. Reliability-oriented extended importance measures in uncertain inventory systems for mechanical products. Adv. Mech. Eng. 2019, 11, 1687814019828438. [Google Scholar] [CrossRef] [Green Version]
- Dui, H.; Meng, X.; Xiao, H.; Guo, J. Analysis of the cascading failure for scale-free networks based on a multi-strategy evolutionary game. Reliab. Eng. Syst. Saf. 2020, 199, 106919. [Google Scholar] [CrossRef]
- Nguyen, K.-A.; Do, P.; Grall, A. Joint predictive maintenance and inventory strategy for multi-component systems using Birnbaum’s structural importance. Reliab. Eng. Syst. Saf. 2017, 168, 249–261. [Google Scholar] [CrossRef]
- Adak, S.; Rani, P. Effect of reliability on multi-item inventory system with shortages and partial backlog incorporating time dependent demand and deterioration. Ann. Oper. Res. 2020, 1–21. [Google Scholar] [CrossRef]
- Maji, A.; Bhunia, A.K.; Mondal, S.K. Exploring a production-inventory model with optimal reliability of the production in a parallel-series system. J. Ind. Prod. Eng. 2020, 37, 71–86. [Google Scholar] [CrossRef]
- Huang, C.-F. Evaluation of system reliability for a stochastic delivery-flow distribution network with inventory. Ann. Oper. Res. 2017, 277, 33–45. [Google Scholar] [CrossRef]
- Manna, A.K.; Dey, J.K.; Mondal, S.K. Two layers supply chain in an imperfect production inventory model with two storage facilities under reliability consideration. J. Ind. Prod. Eng. 2017, 35, 57–73. [Google Scholar] [CrossRef]
- Abdel-Aleem, A.; El-Sharief, M.A.; Hassan, M.A.; El-Sebaie, M.G. Optimization of reliability based model for production inventory system. Int. J. Manag. Sci. Eng. Manag. 2017, 13, 54–64. [Google Scholar] [CrossRef]
- Daniewski, K.; Kosicka, E.; Mazurkiewicz, D. Analysis of the correctness of determination of the effectiveness of maintenance service actions. Manag. Prod. Eng. Rev. 2018, 9, 20–25. [Google Scholar] [CrossRef]
- Feng, Q.; Zhao, X.; Fan, D.; Cai, B.; Liu, Y.; Ren, Y. Resilience design method based on meta-structure: A case study of offshore wind farm. Reliab. Eng. Syst. Saf. 2019, 186, 232–244. [Google Scholar] [CrossRef]
- Zhao, X.; Chen, M.; Nakagawa, T. Periodic replacement policies with shortage and excess costs. Ann. Oper. Res. 2020, 1–19. [Google Scholar] [CrossRef]
- Cárdenas-Barrón, L.E.; Sana, S.S. Multi-item EOQ inventory model in a two-layer supply chain while demand varies with promotional effort. Appl. Math. Model. 2015, 39, 6725–6737. [Google Scholar] [CrossRef]
- Shekarian, E.; Olugu, E.U.; Abdul-Rashid, S.H.; Bottani, E. A Fuzzy Reverse Logistics Inventory System Integrating Economic Order/Production Quantity Models. Int. J. Fuzzy Syst. 2016, 18, 1141–1161. [Google Scholar] [CrossRef]
- Chao, X.; Gong, X.; Zheng, S. Optimal pricing and inventory policies with reliable and random-yield suppliers: Characterization and comparison. Ann. Oper. Res. 2014, 241, 35–51. [Google Scholar] [CrossRef]
- Yu, Y.; Shou, B.; Ni, Y.; Chen, L. Optimal production, pricing, and substitution policies in continuous review production-inventory systems. Eur. J. Oper. Res. 2017, 260, 631–649. [Google Scholar] [CrossRef]
- Lee, J.-Y.; Cho, R.K.; Paik, S.-K. Supply chain coordination in vendor-managed inventory systems with stockout-cost sharing under limited storage capacity. Eur. J. Oper. Res. 2016, 248, 95–106. [Google Scholar] [CrossRef]
- Jia, X.; Cui, L. Reliability Research of k-out-of-n: G Supply Chain System Based on Copula. Commun. Stat. Theory Methods 2012, 41, 4023–4033. [Google Scholar] [CrossRef]
- Flynn, B.B.; Koufteros, X.; Lu, G. On Theory in Supply Chain Uncertainty and its Implications for Supply Chain Integration. J. Supply Chain Manag. 2016, 52, 3–27. [Google Scholar] [CrossRef] [Green Version]
- He, M.; Xie, J.; Wu, X.; Hu, Q.; Dai, Y. Capability Coordination in Automobile Logistics Service Supply Chain Based on Reliability. Procedia Eng. 2016, 137, 325–333. [Google Scholar] [CrossRef] [Green Version]
- Chen, X.; Xi, Z.; Jing, P. A Unified Framework for Evaluating Supply Chain Reliability and Resilience. IEEE Trans. Reliab. 2017, 66, 1144–1156. [Google Scholar] [CrossRef]
Figure 1.
Service capacity curve of a logistics unit.

Figure 2.
Structural diagram of a typical tandem logistics system.

Figure 3.
Structural diagram of a typical parallel logistics system.

Figure 4.
Structural diagram of a typical series parallel logistics system.

Figure 5.
Structural diagram of a typical parallel series logistics system.

Figure 6.
The storage volume changes over time.

Figure 7.
Importance changes with various parameters.


Table 1.
Results analysis of comparative static.
| Parameter | CS | Expression | Mark | Value |
|---|---|---|---|---|
| − | 36 | |||
| − | 18 | |||
| + | 0.047 | |||
| + | 13 | |||
| − | 4725 |
Table 2.
Analysis results of differential importance measure.
| Parameter | Importance | Expression | Mark | Value | Order |
|---|---|---|---|---|---|
| + | 4 | ||||
| + | 5 | ||||
| − | 2 | ||||
| − | 3 | ||||
| + | 1 |
Table 3.
Analysis results of Birnbaum importance measure.
| Parameter | Importance | Expression | Mark | Value | Order |
|---|---|---|---|---|---|
| + | 4 | ||||
| + | 5 | ||||
| − | 2 | ||||
| − | 3 | ||||
| + | 1 |
Table 4.
Case assumptions of the inventory models.
| Case Assumptions | Case Assumption Contents |
|---|---|
| Assumption 1 | A small amount of stockout will not cause much damage to customers and companies. The loss of unit goods per unit time is . |
| Assumption 2 | Companies can store products in their own warehouses or leased warehouses. is the storage fee of unit goods per unit time stored in their own warehouses, is the storage fee in leased warehouses, and . |
| Assumption 3 | The capacity of their own warehouses is . |
| Assumption 4 | When storing, companies firstly store products in their own warehouses until they are full, and then in leased warehouses. |
| Assumption 5 | When selling, companies will firstly sell the products in leased warehouses until they are empty, and then from their own warehouses. |
Table 5.
The results of importance measures.
| Parameter | Birnbaum Importance | Order | Differential Importance | Order |
|---|---|---|---|---|
| 0.2940 | 2 | 0.4545 | 2 | |
| 0.3528 | 1 | 0.5455 | 1 | |
| −0.1103 | 4 | −0.1705 | 4 | |
| −0.0647 | 5 | −0.1000 | 5 | |
| −0.1779 | 3 | −0.2750 | 3 |
Publisher’s Note: MDPI stays neutral with regard to jurisdictional claims in published maps and institutional affiliations. |
© 2020 by the authors. Licensee MDPI, Basel, Switzerland. This article is an open access article distributed under the terms and conditions of the Creative Commons Attribution (CC BY) license (http://creativecommons.org/licenses/by/4.0/).
Share and Cite
MDPI and ACS Style
Chen, L.; Kou, M.; Wang, S. On the Use of Importance Measures in the Reliability of Inventory Systems, Considering the Cost. Appl. Sci. 2020, 10, 7942. https://0-doi-org.brum.beds.ac.uk/10.3390/app10217942
AMA Style
Chen L, Kou M, Wang S. On the Use of Importance Measures in the Reliability of Inventory Systems, Considering the Cost. Applied Sciences. 2020; 10(21):7942. https://0-doi-org.brum.beds.ac.uk/10.3390/app10217942
Chicago/Turabian StyleChen, Liwei, Meng Kou, and Songwei Wang. 2020. "On the Use of Importance Measures in the Reliability of Inventory Systems, Considering the Cost" Applied Sciences 10, no. 21: 7942. https://0-doi-org.brum.beds.ac.uk/10.3390/app10217942
Note that from the first issue of 2016, this journal uses article numbers instead of page numbers. See further details here.