Removal Rates of NOx, SOx, and Fine Dust Particles in Textile Fabrics Coated with Zeolite and Coconut Shell Activated Carbon


Abstract
:1. Introduction
2. Materials and Methods
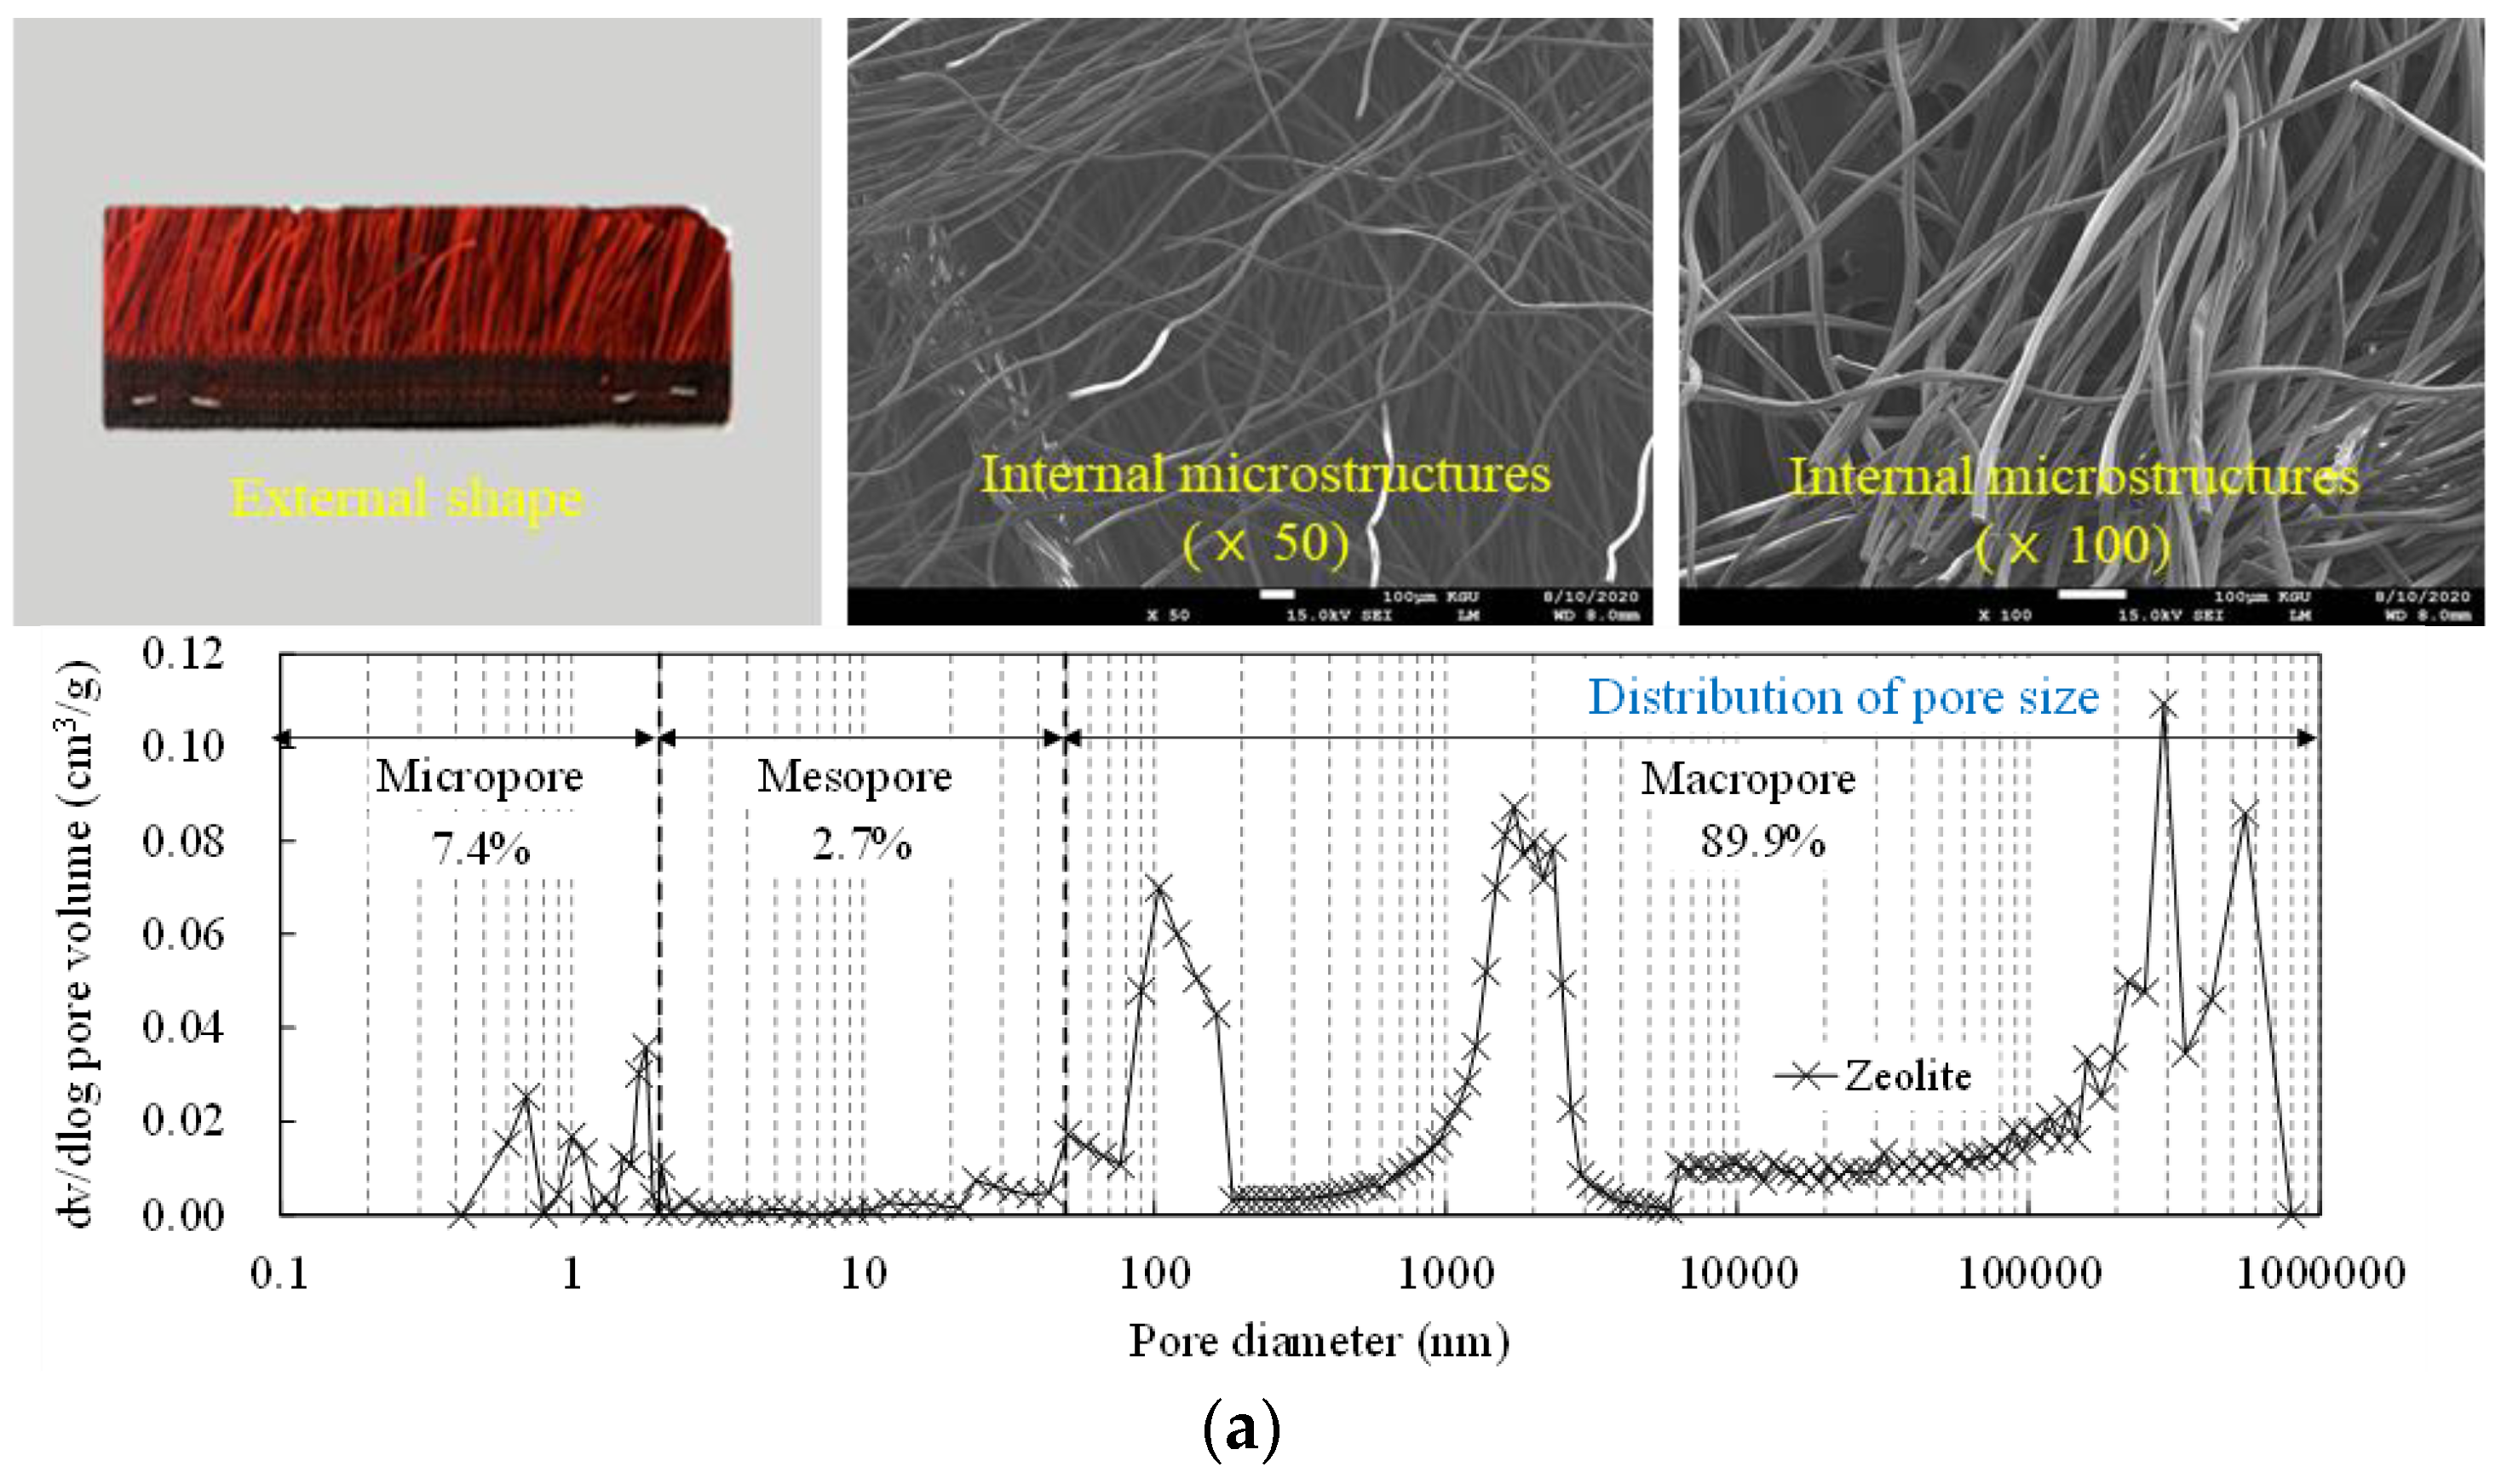
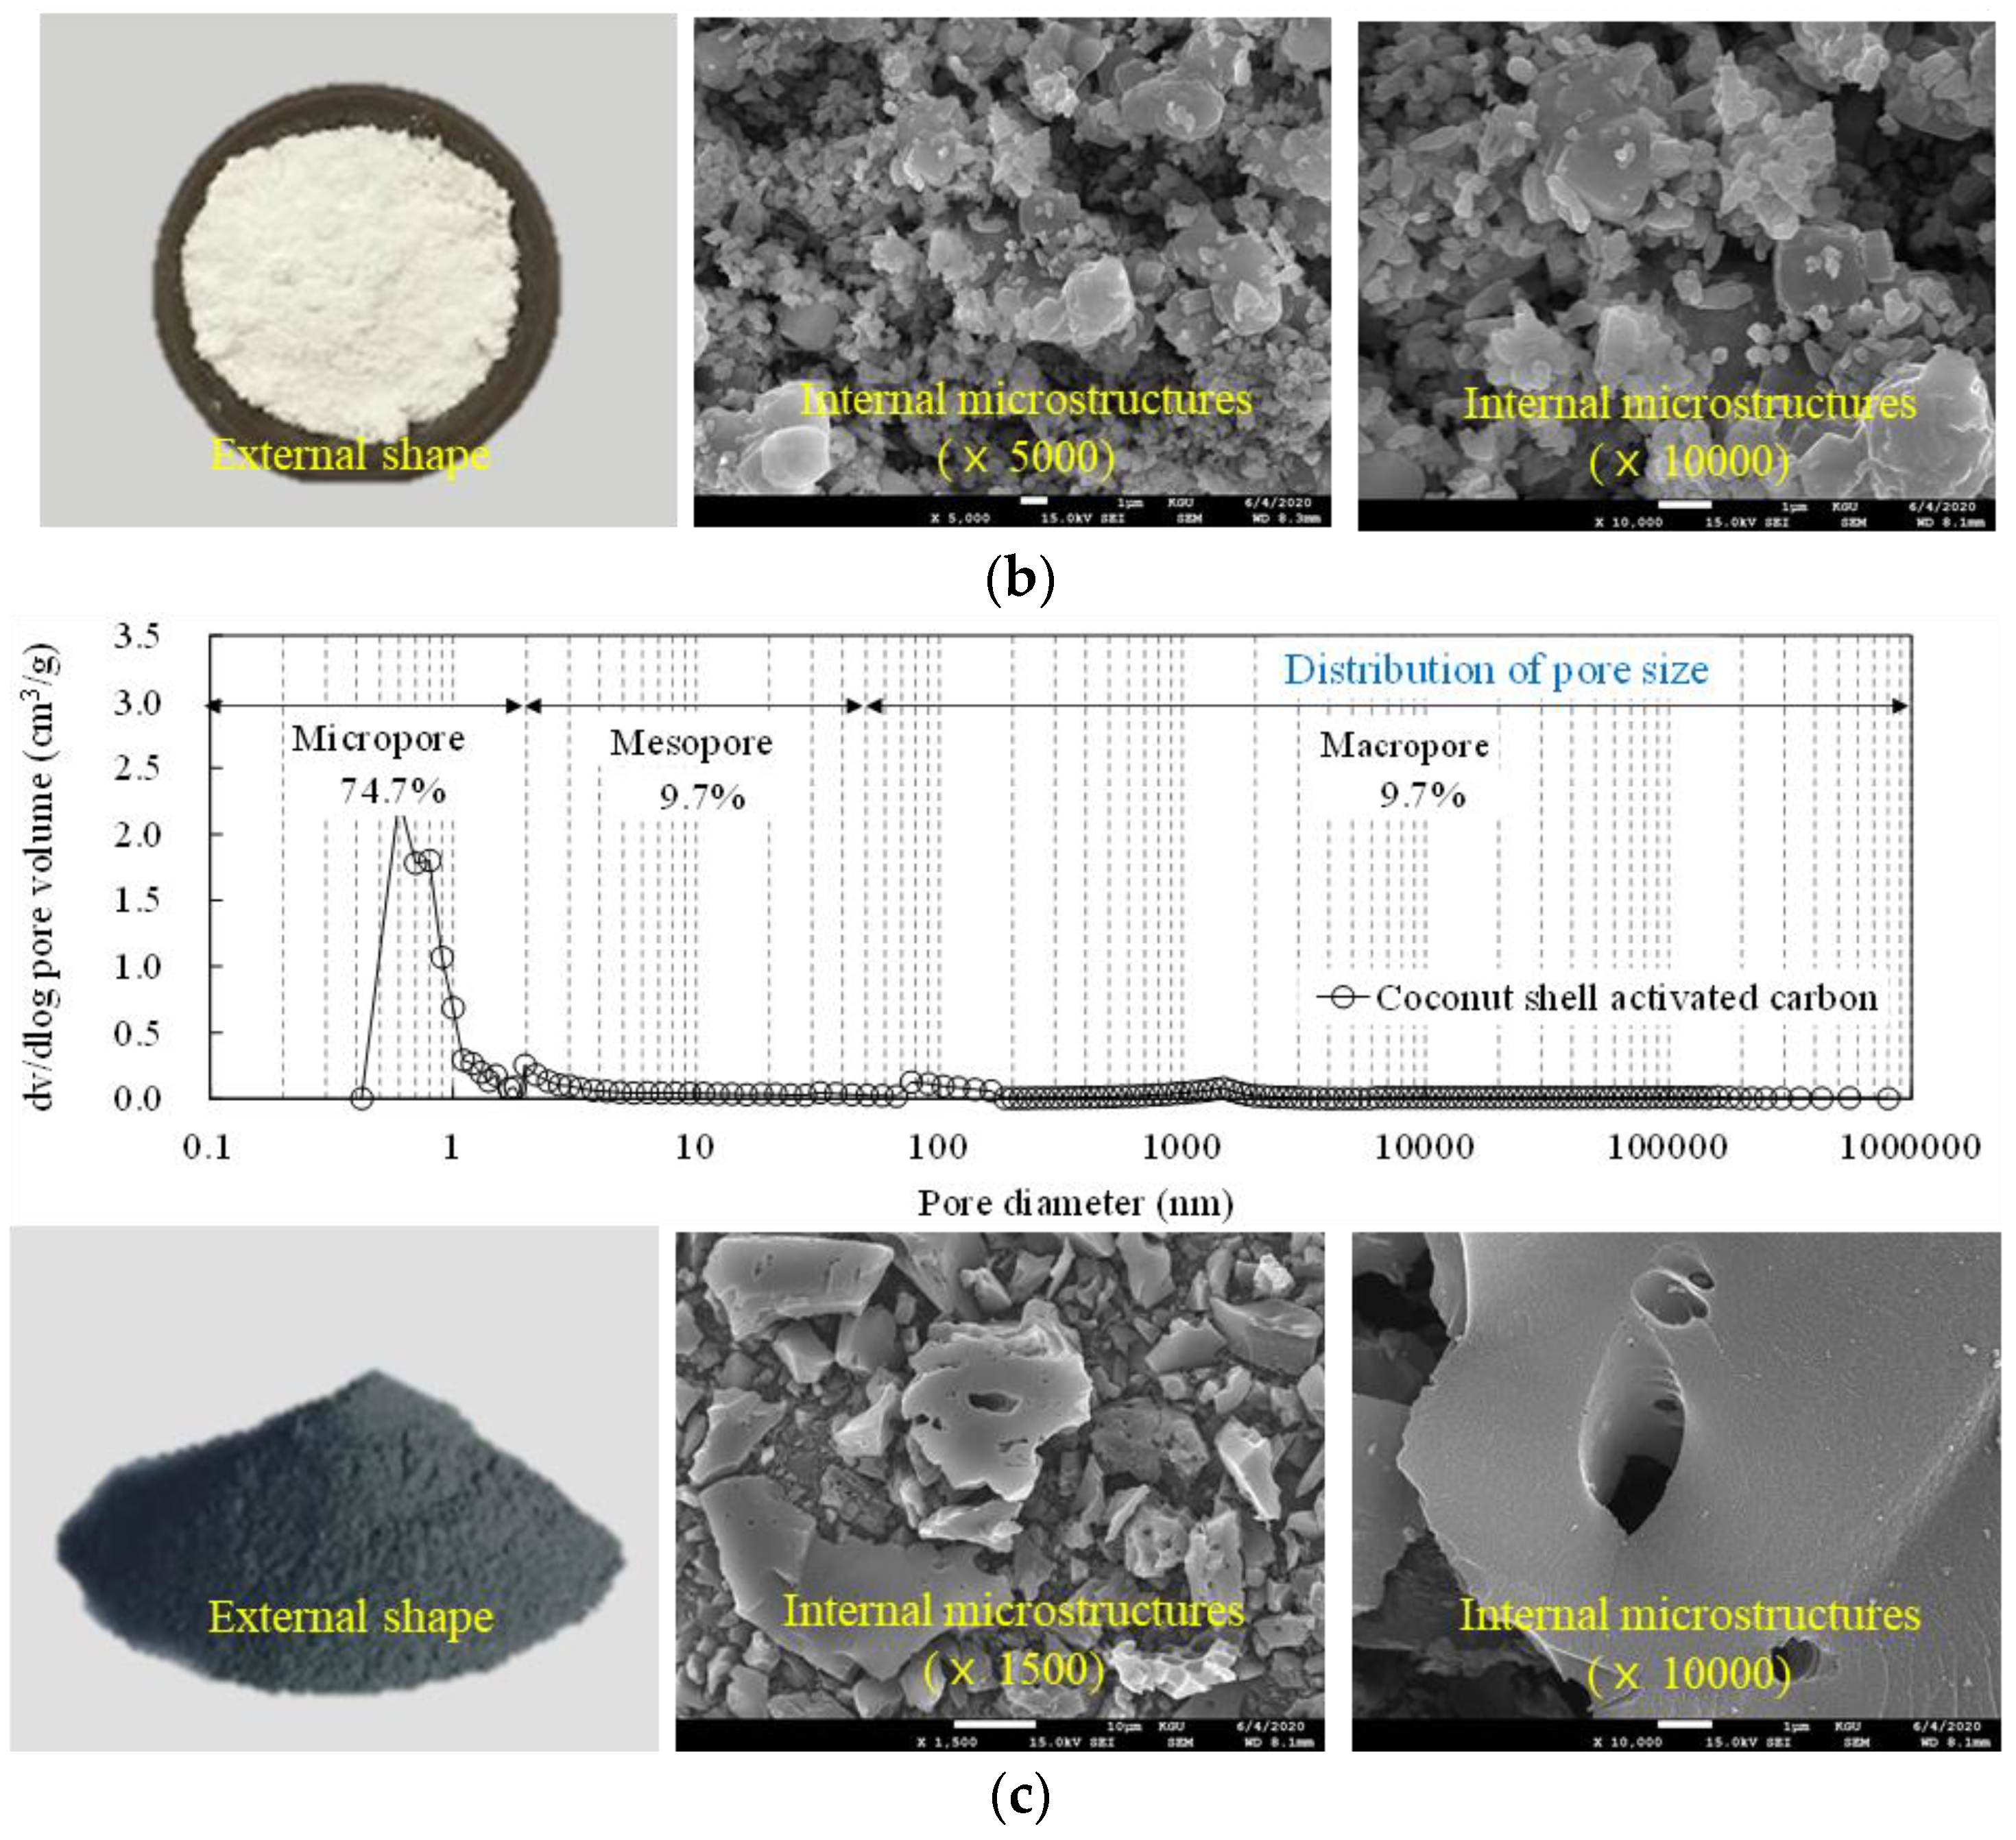
2.1. Material
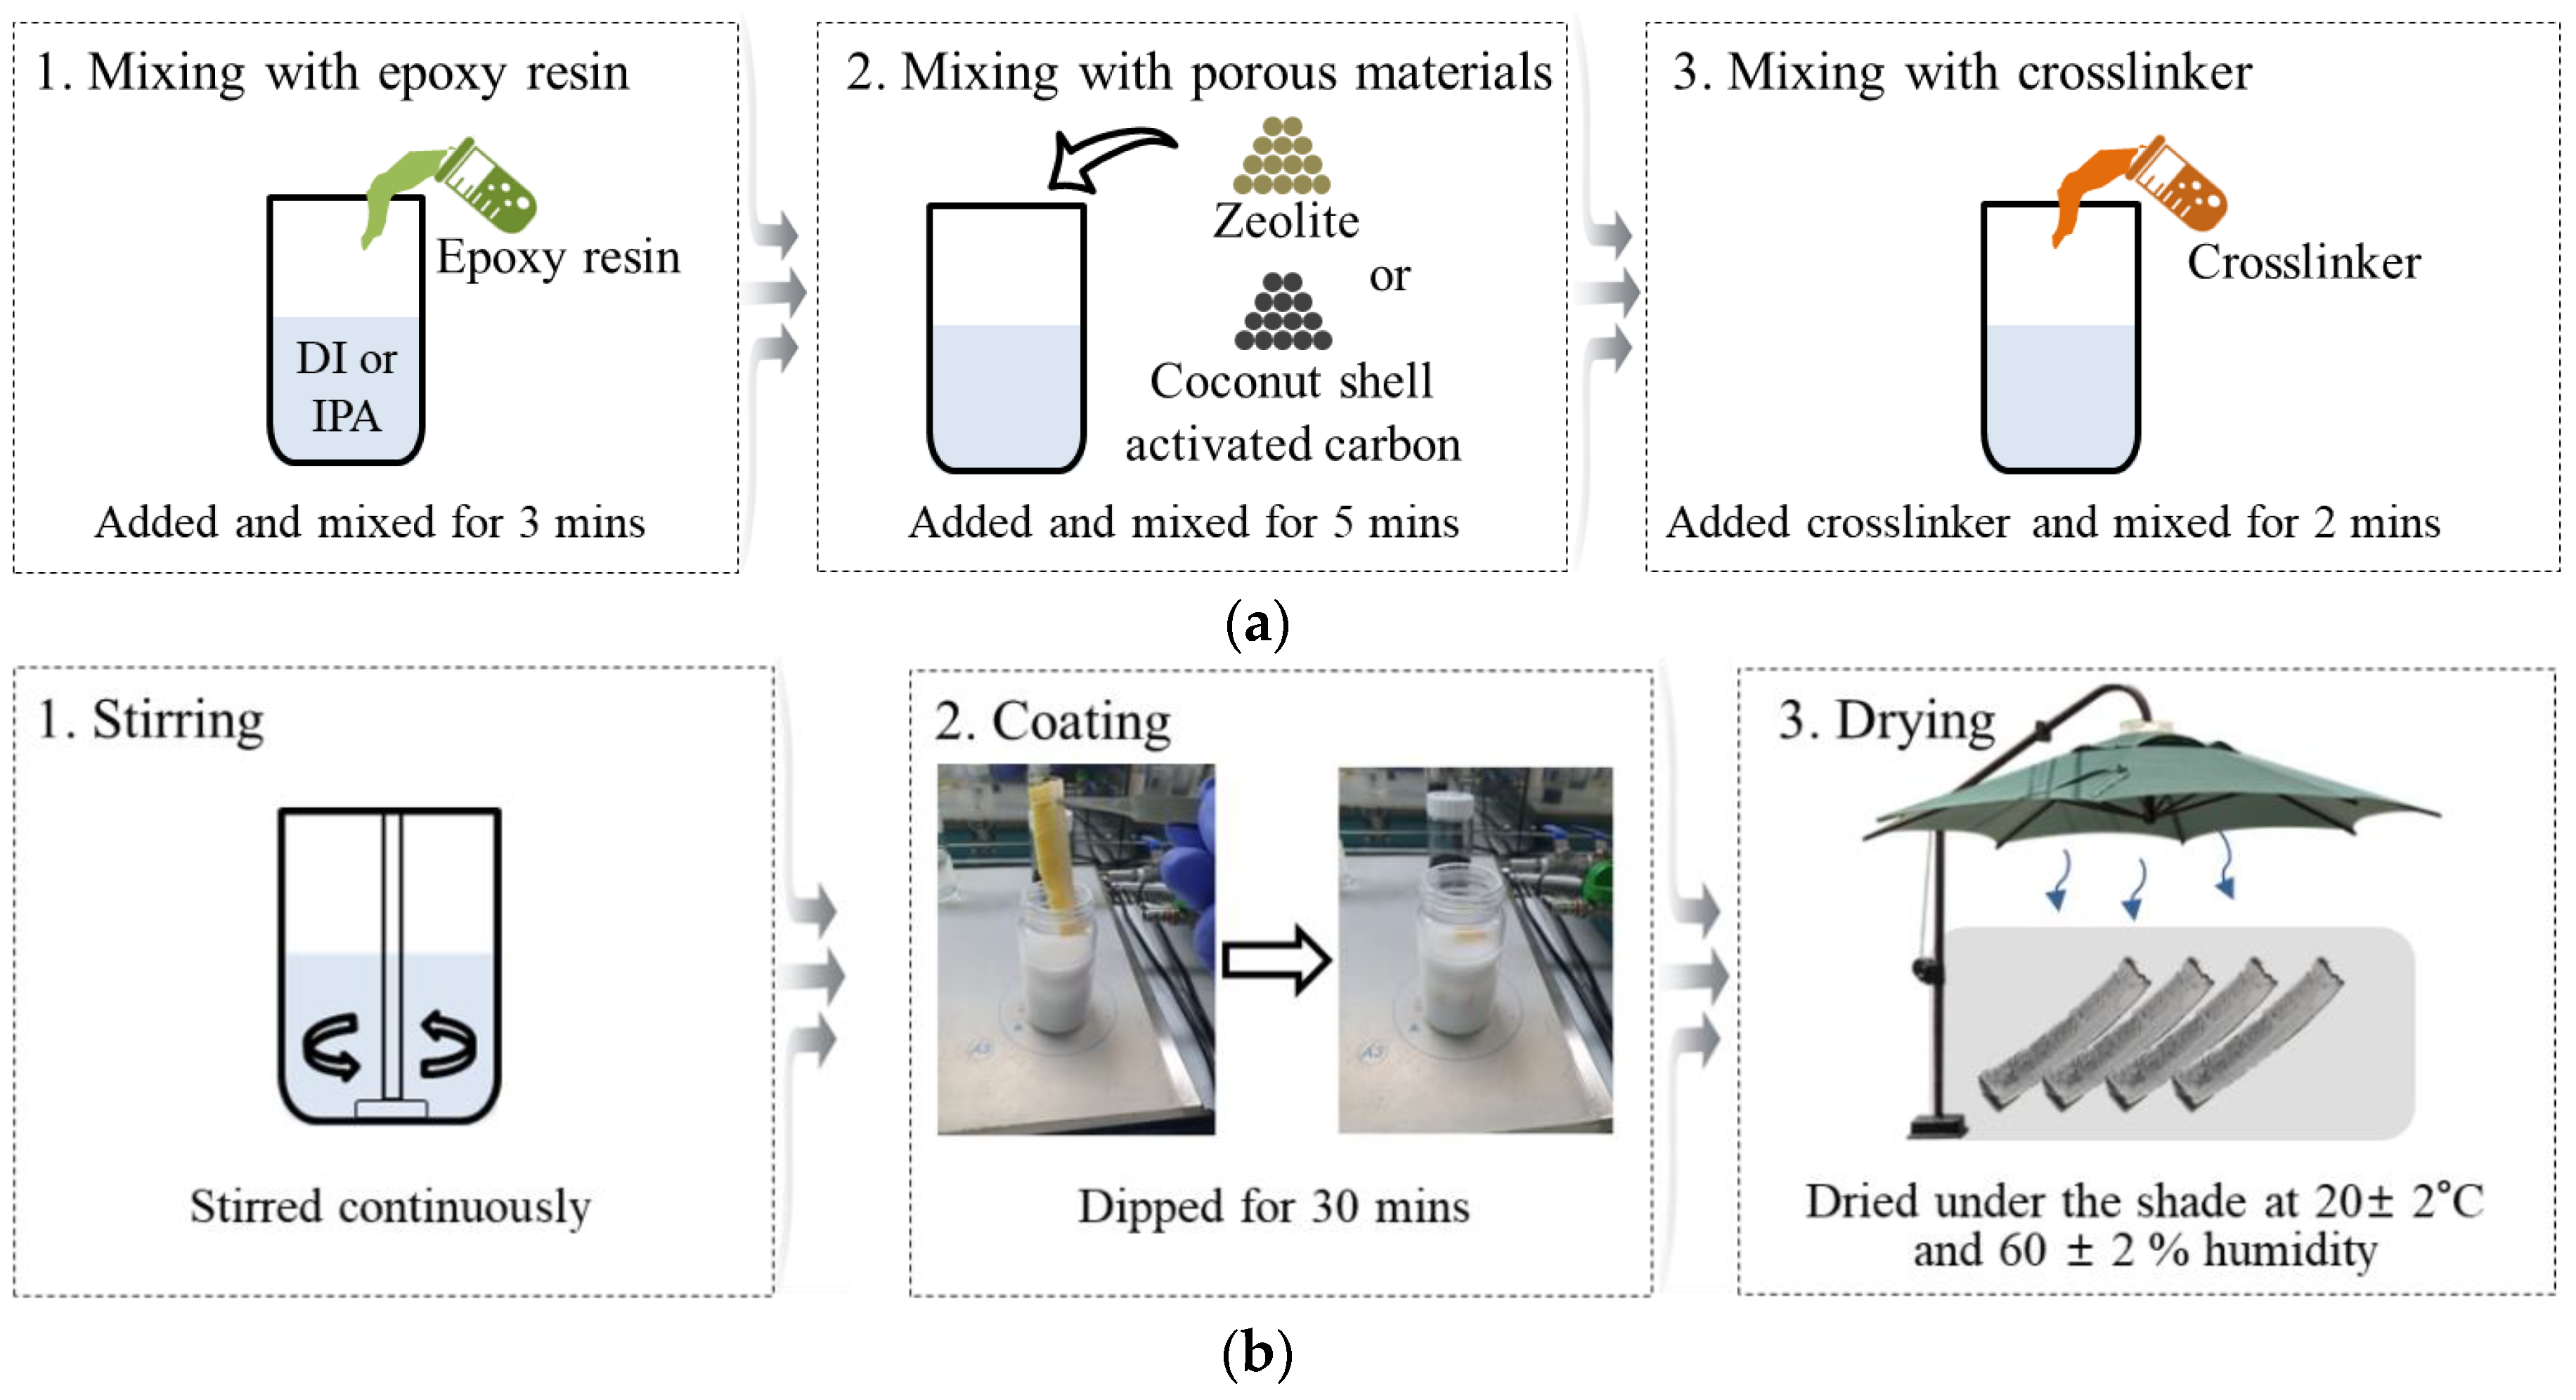
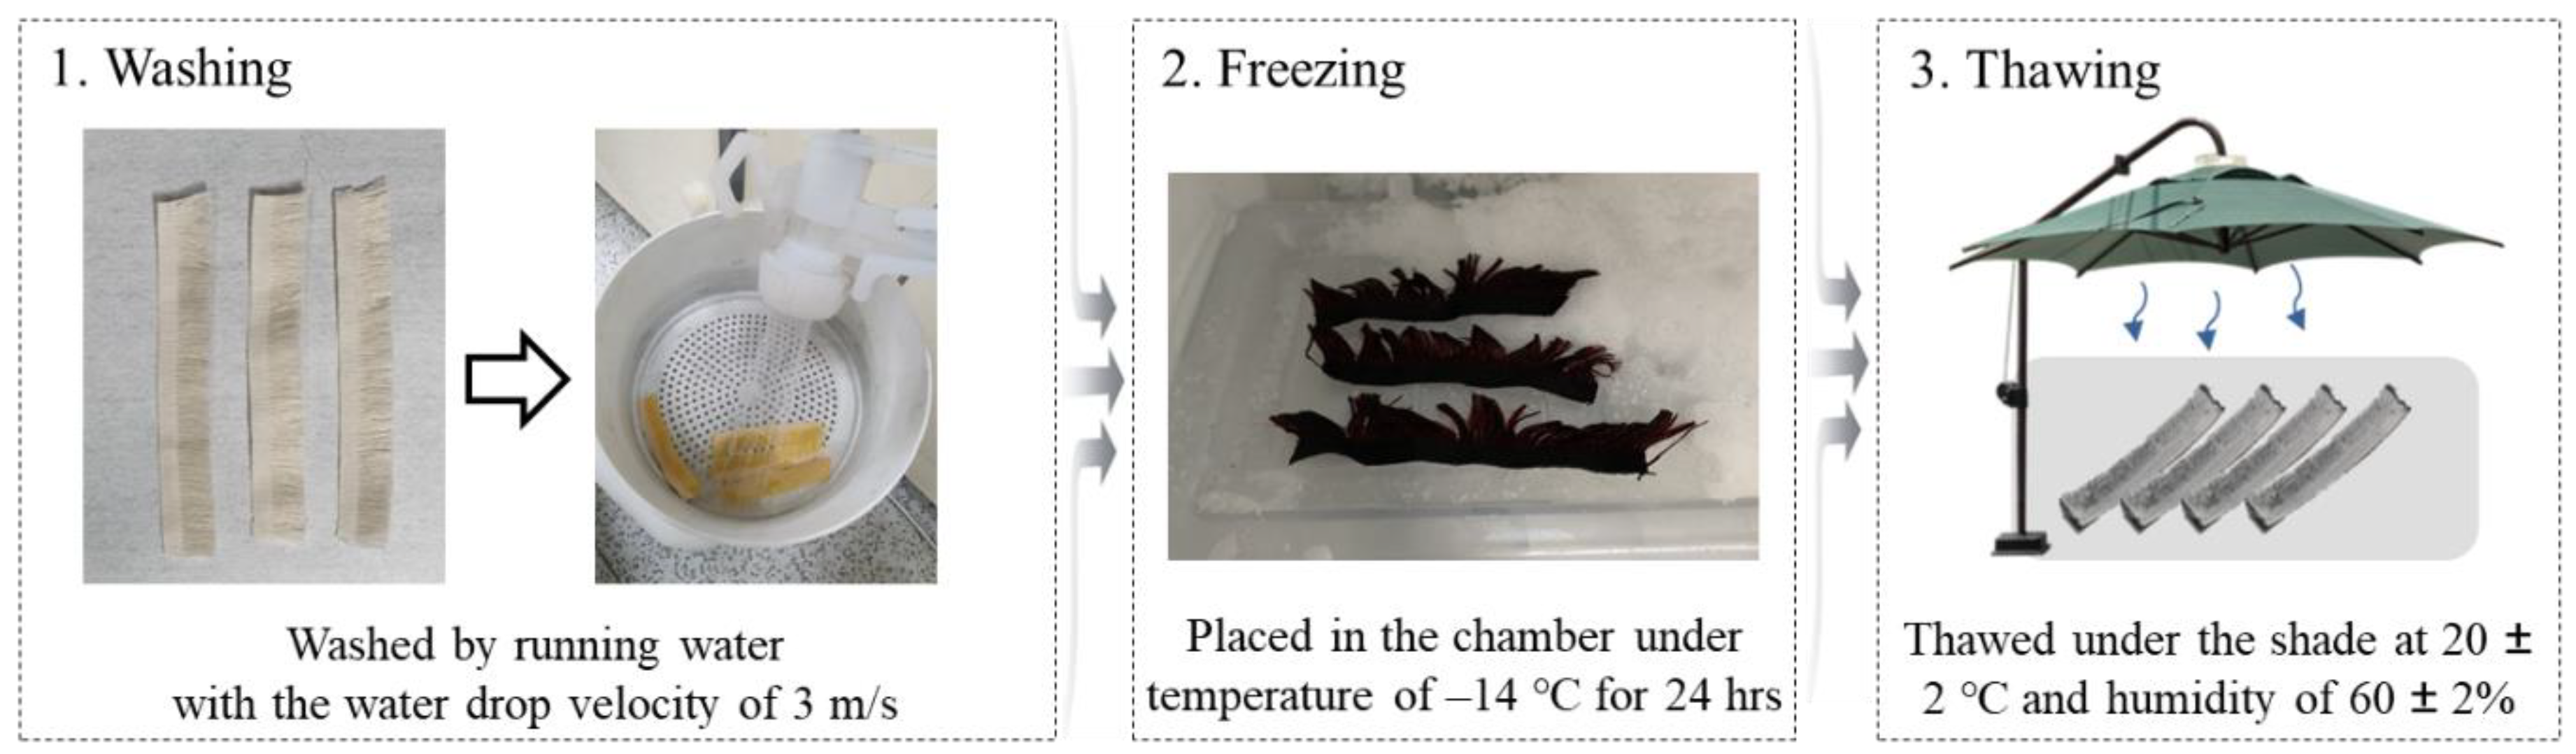
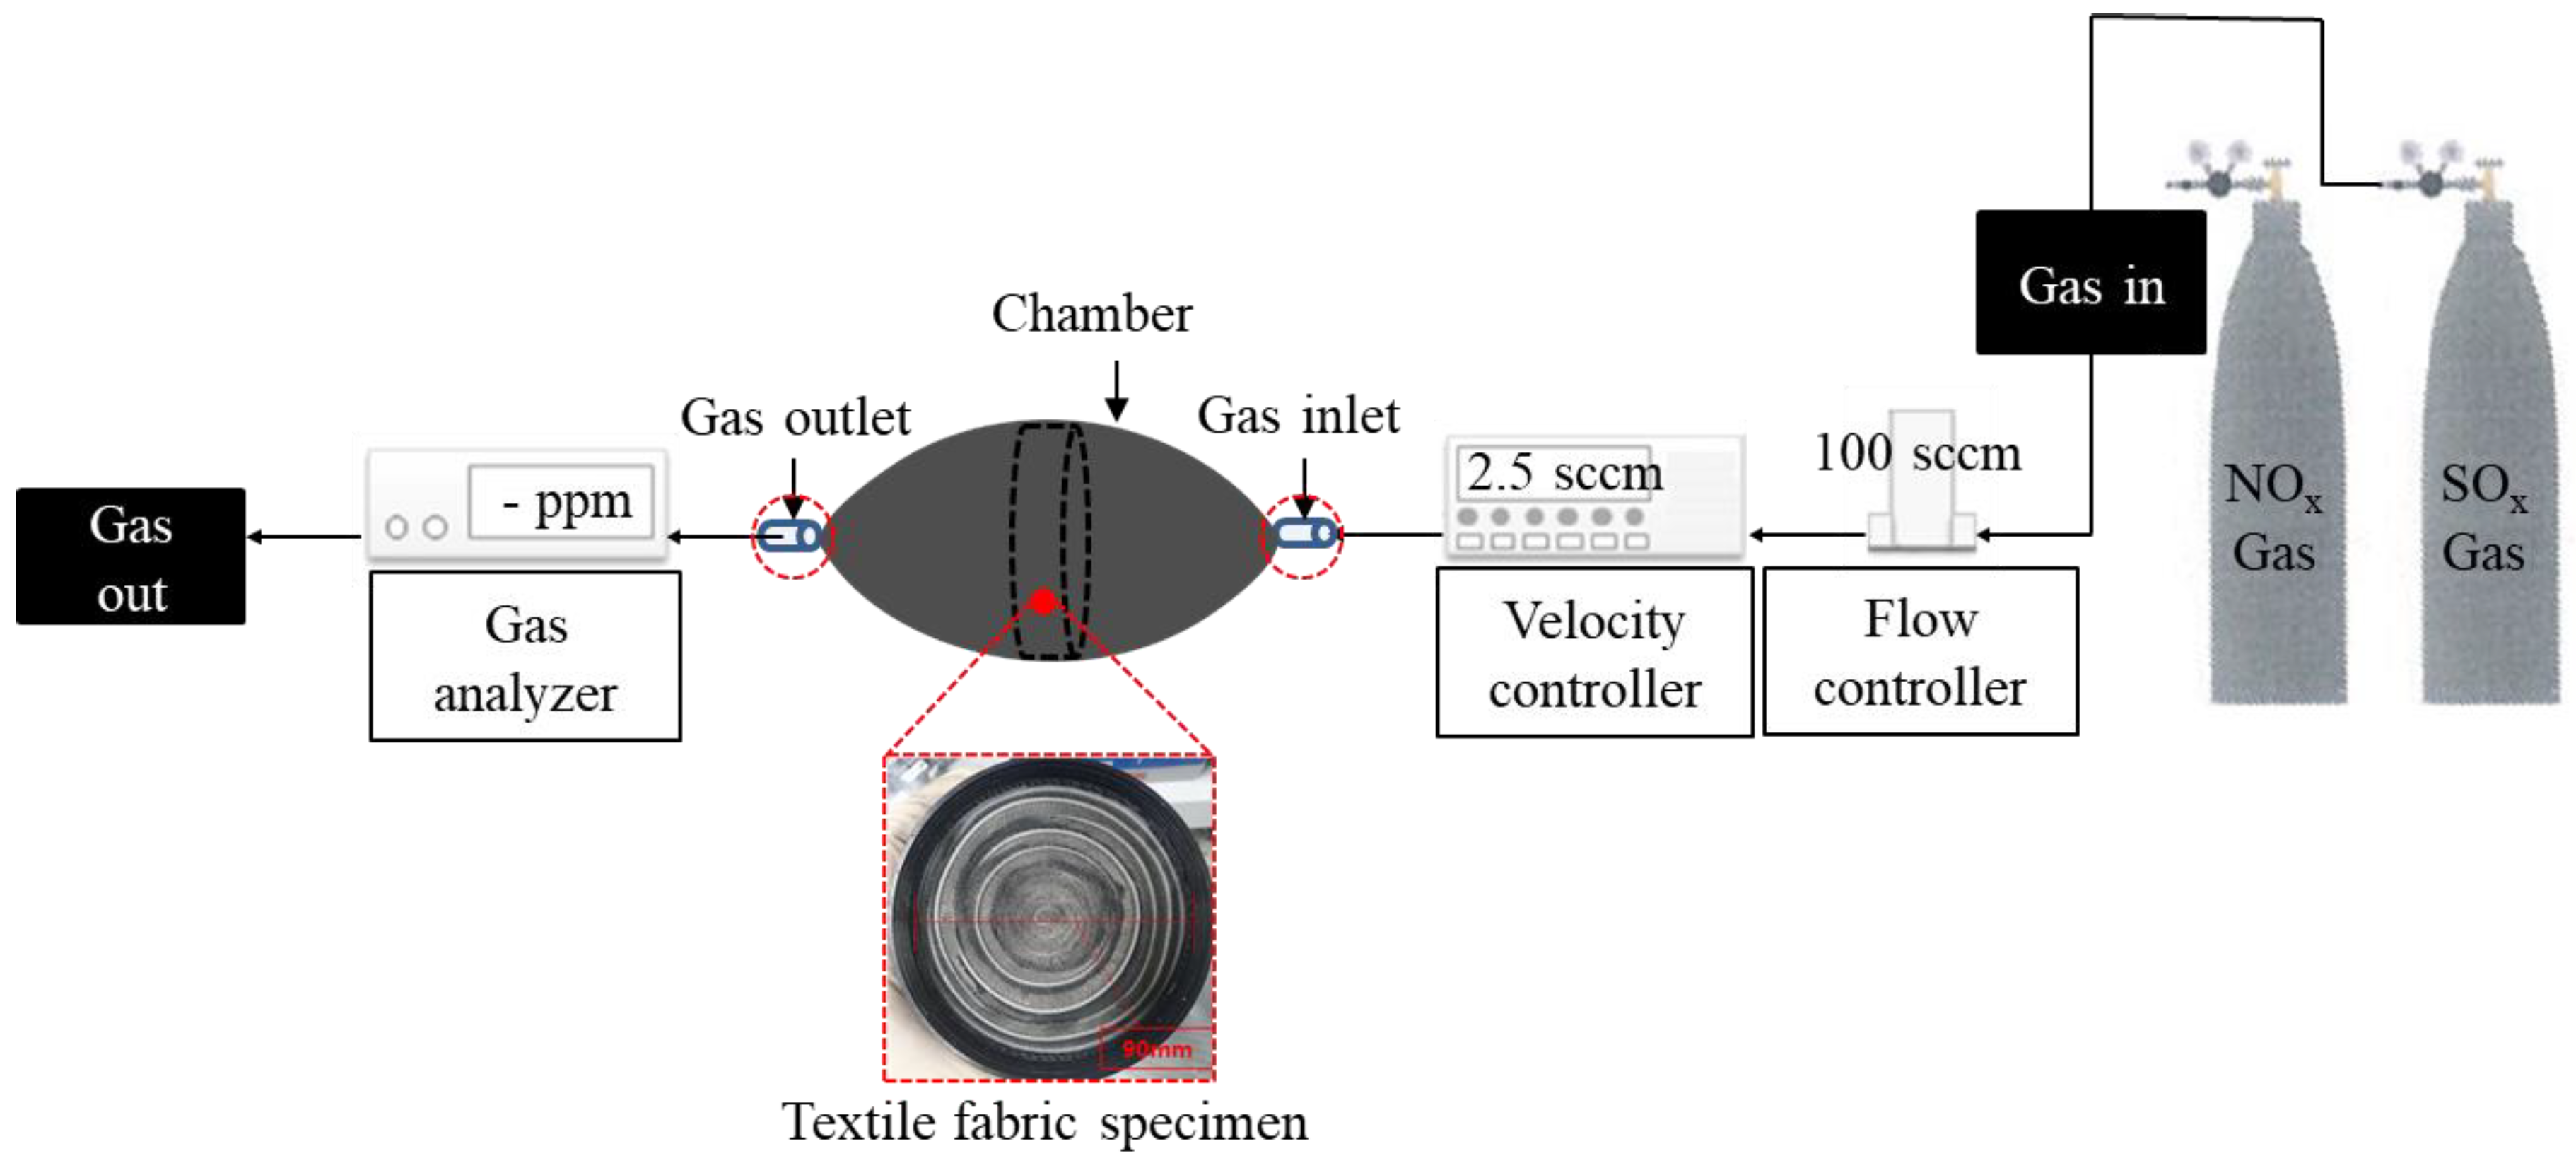
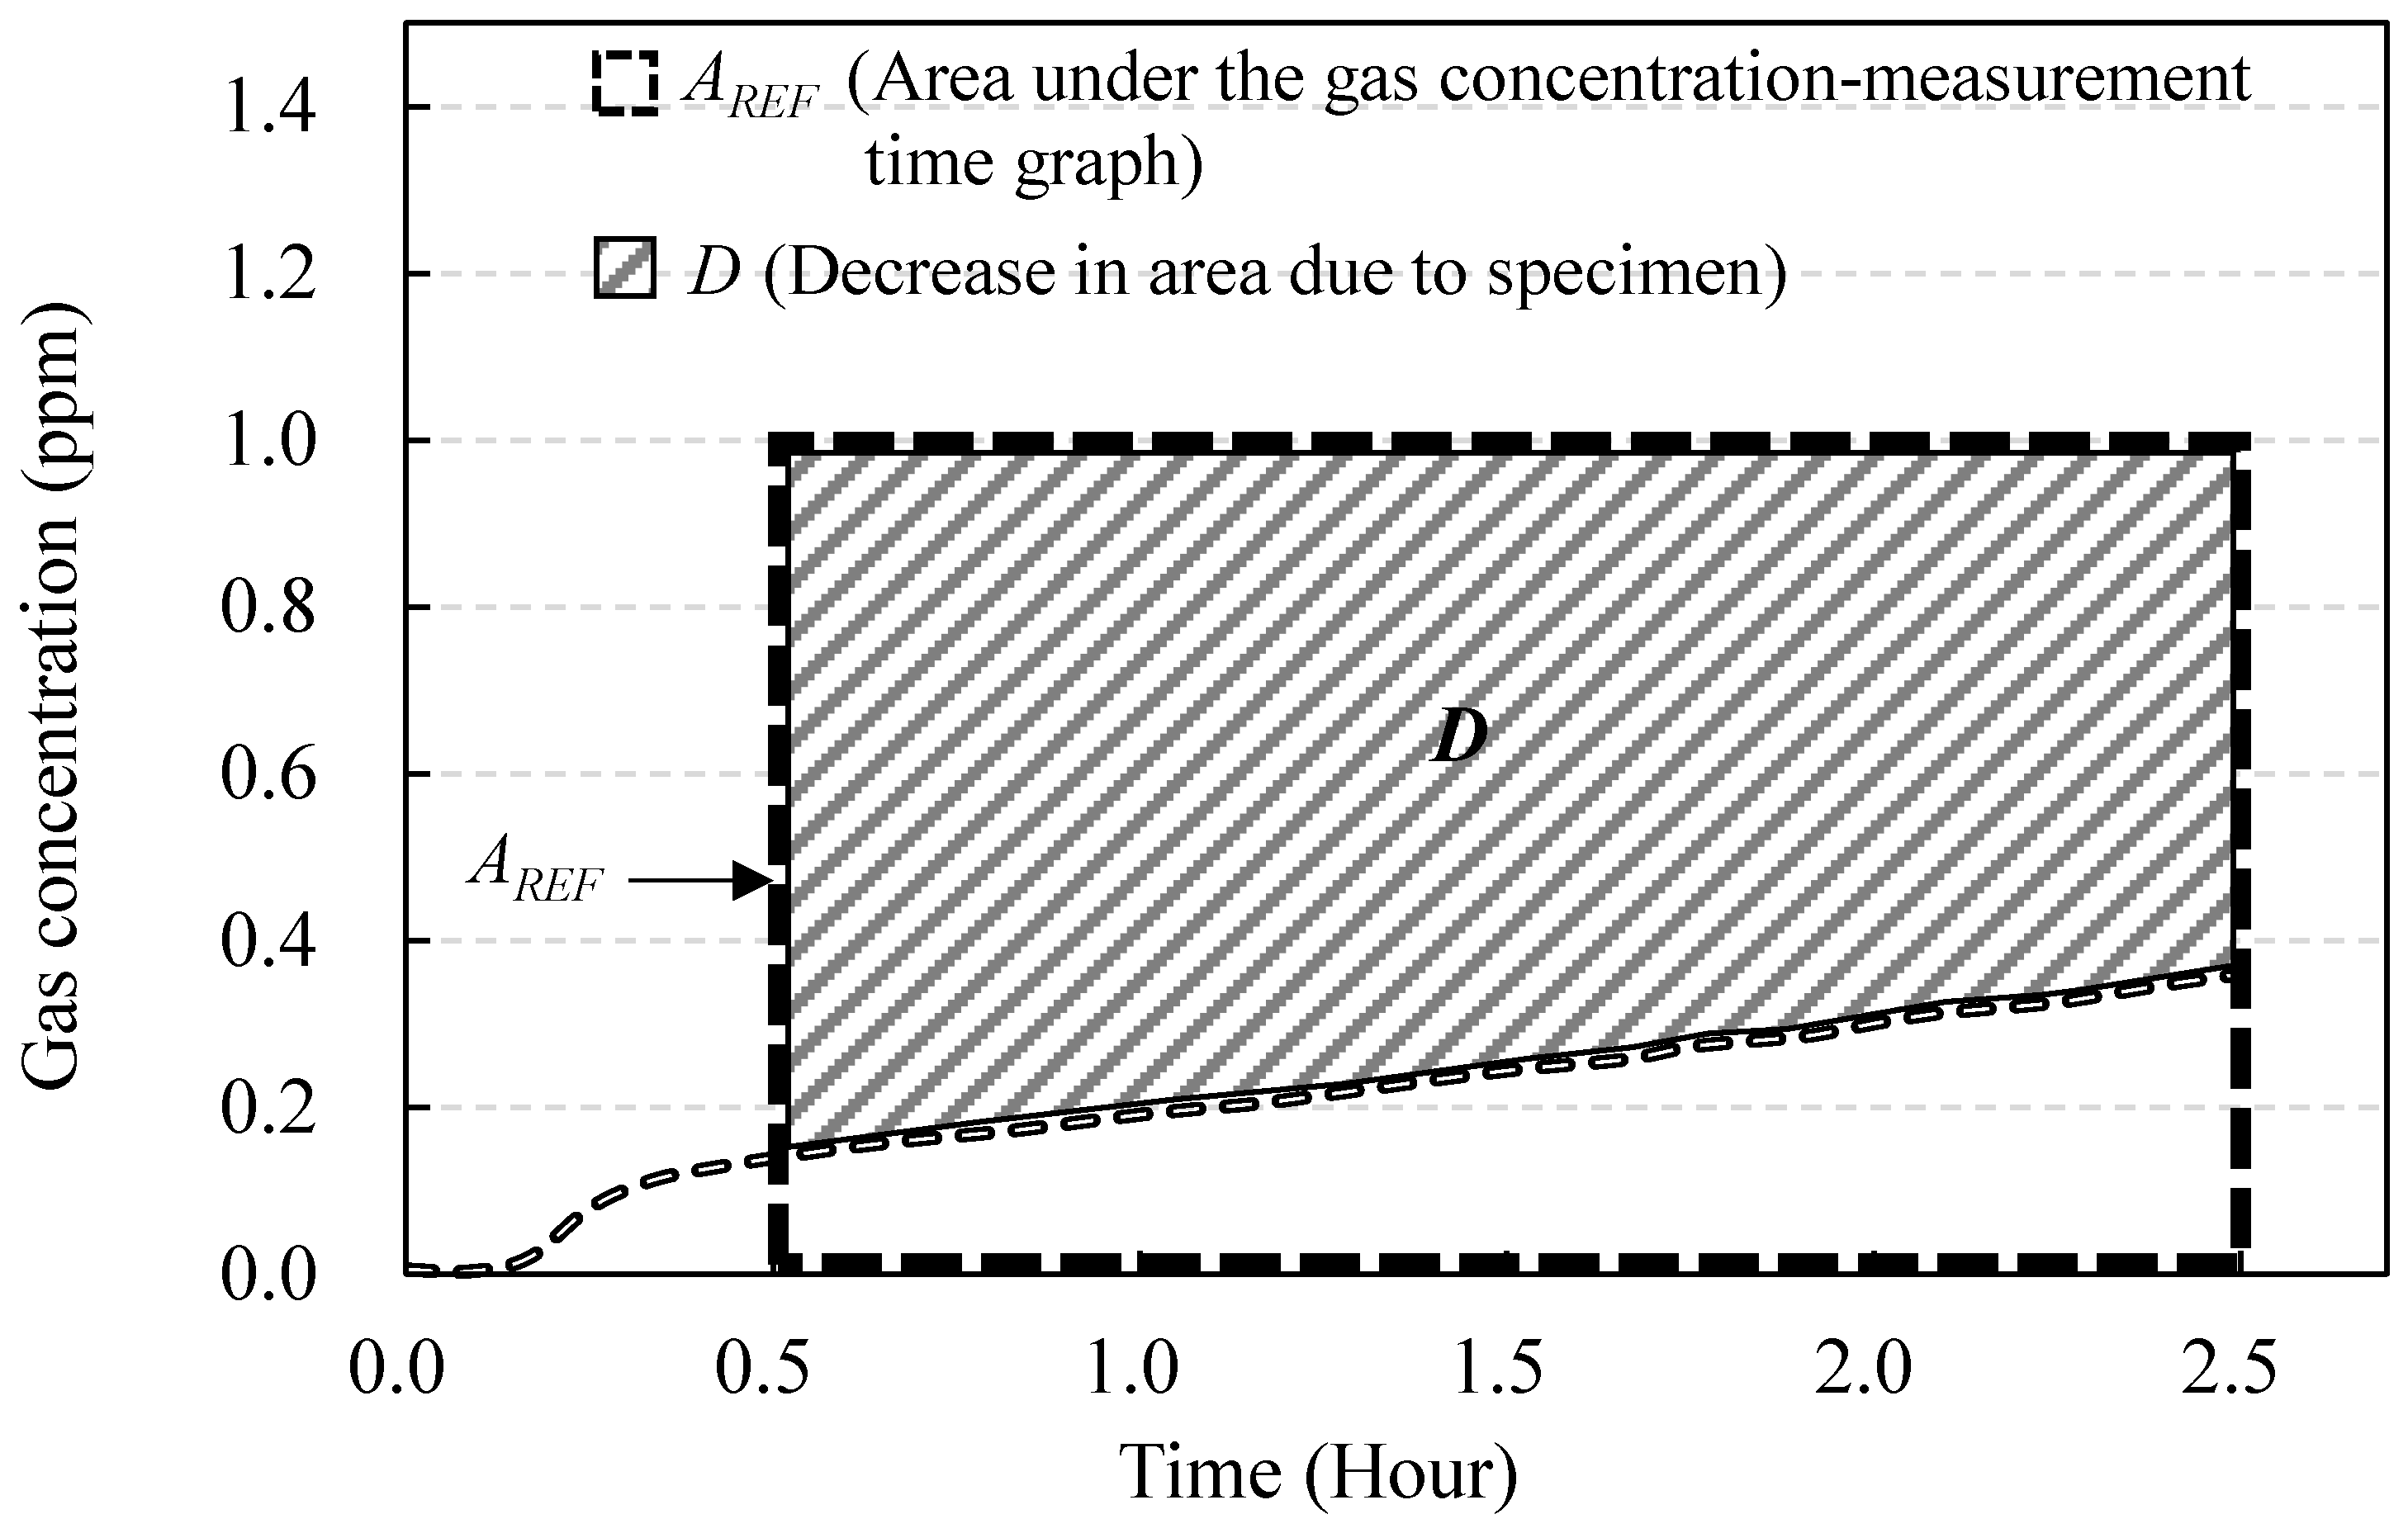
2.2. Methods
3. Results and Discussion
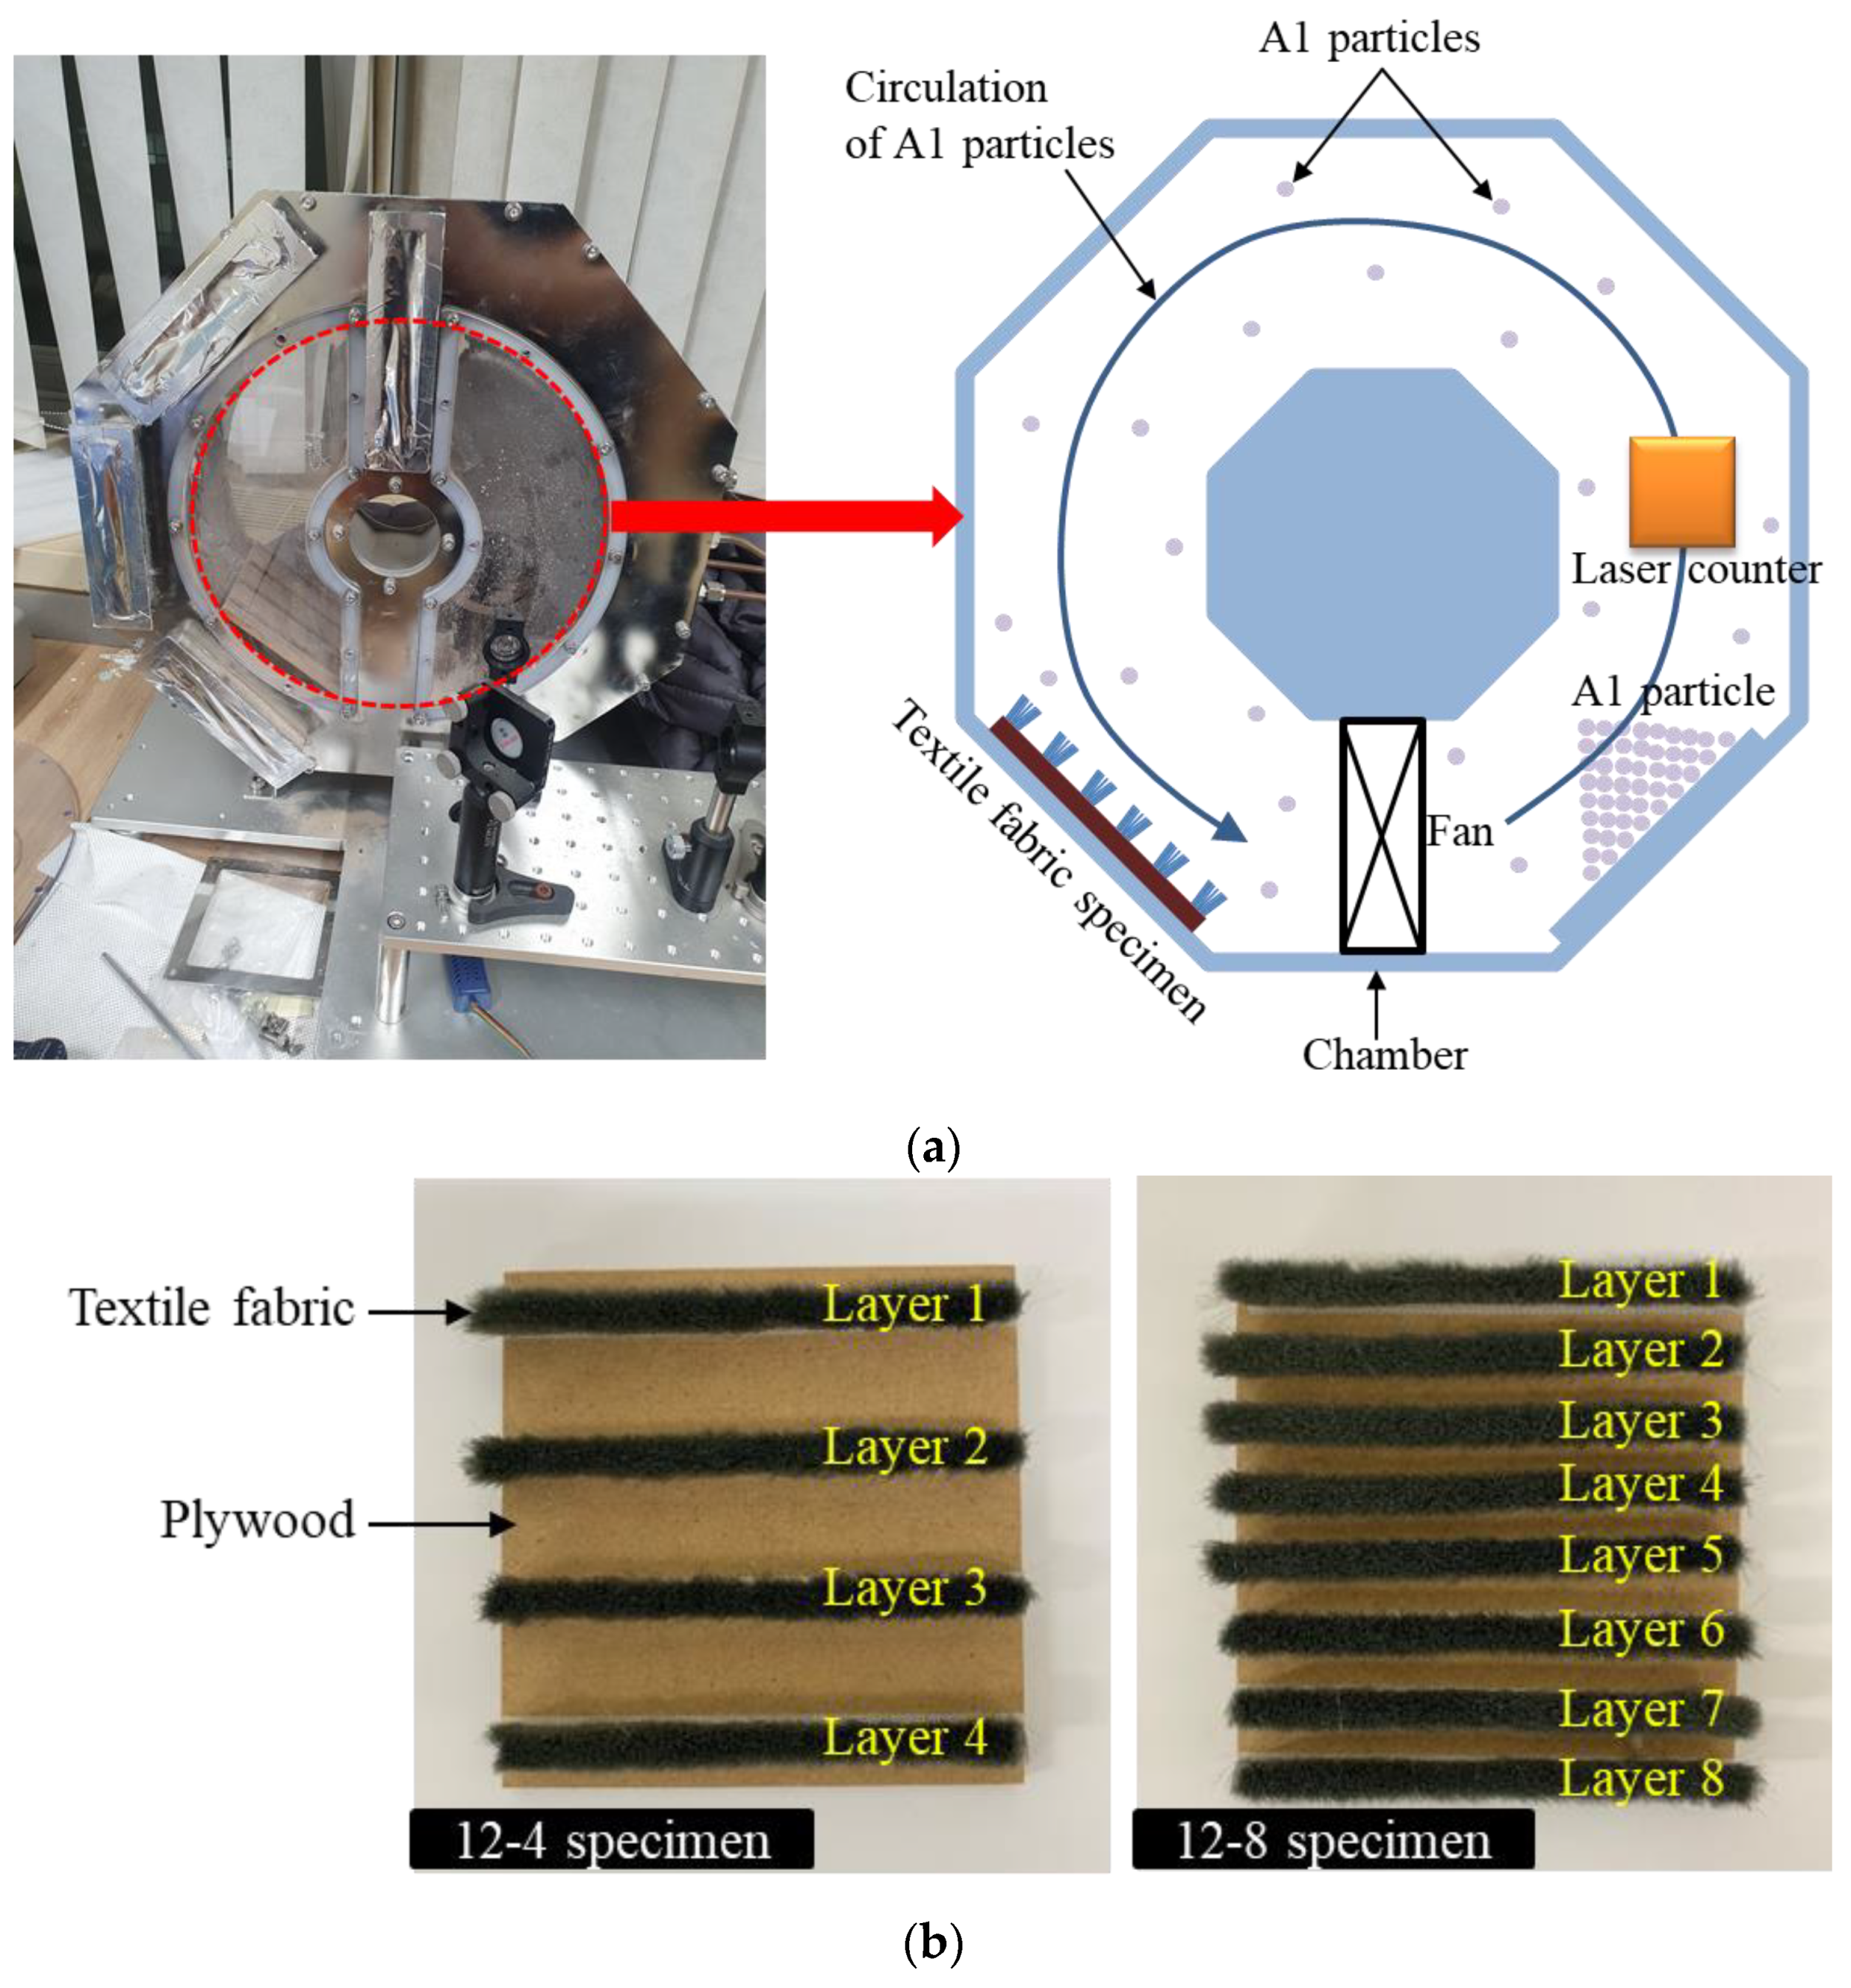
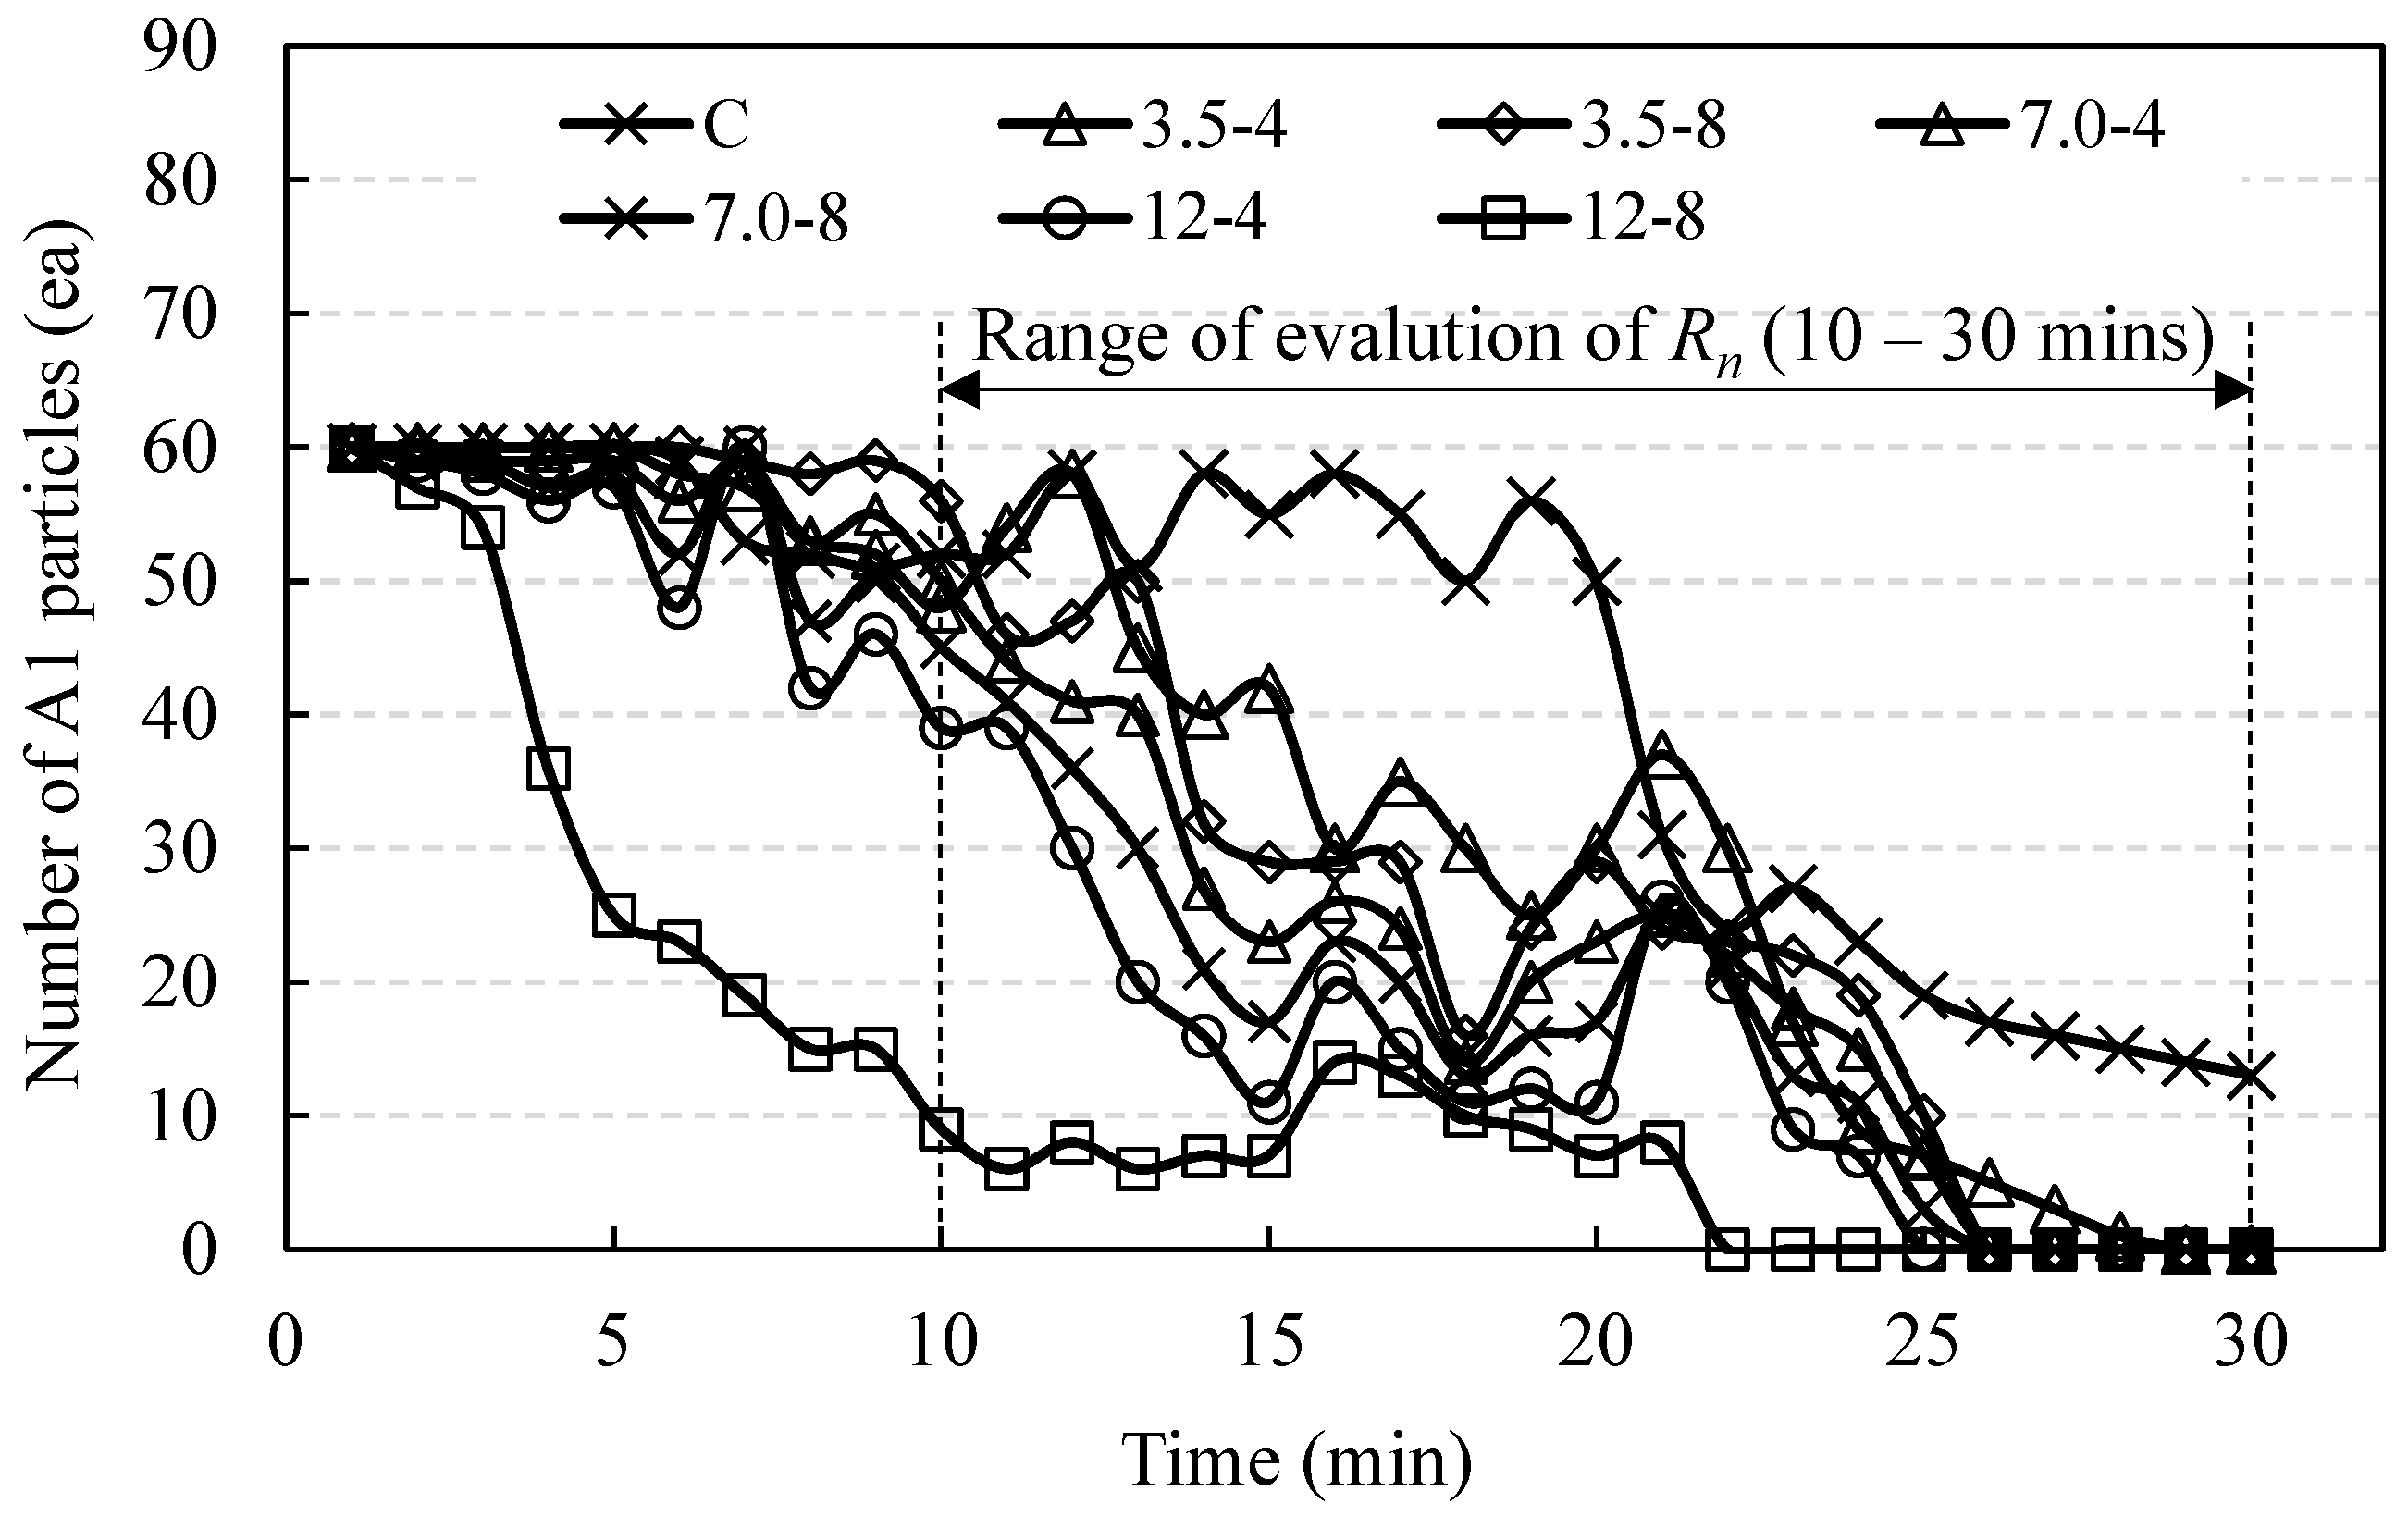
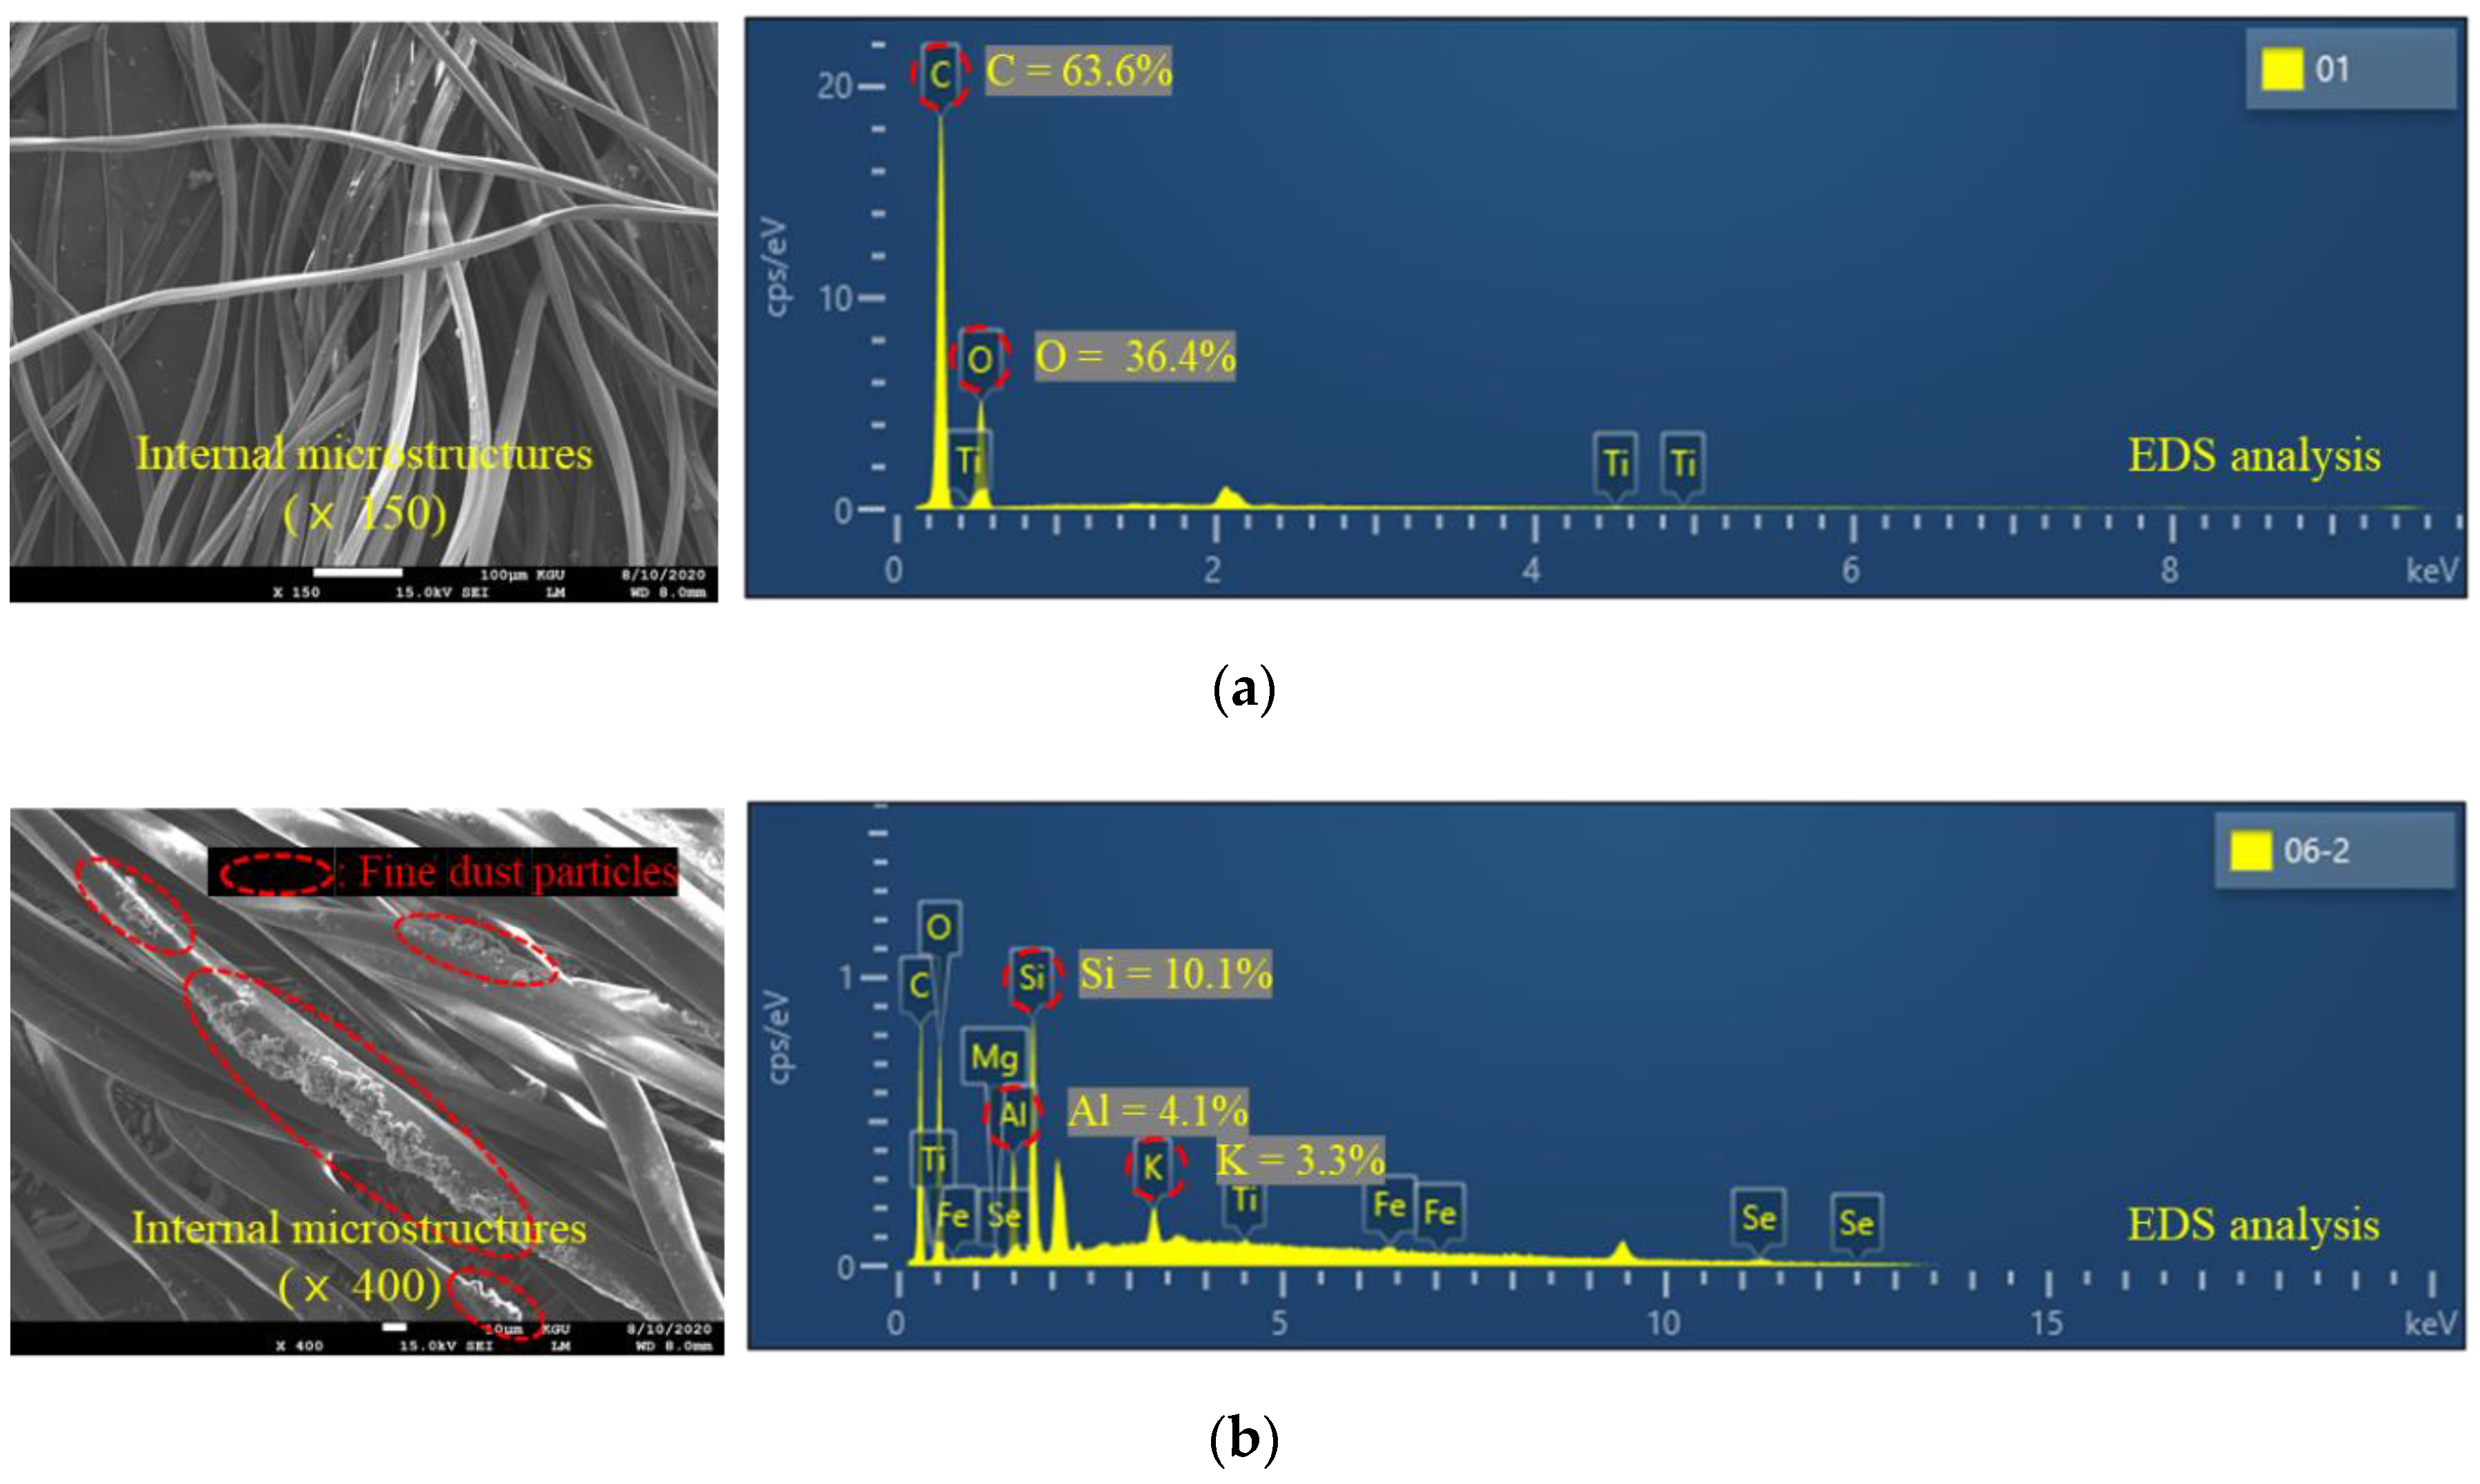
3.1. Effect of Length and Density of Textile Fabrics
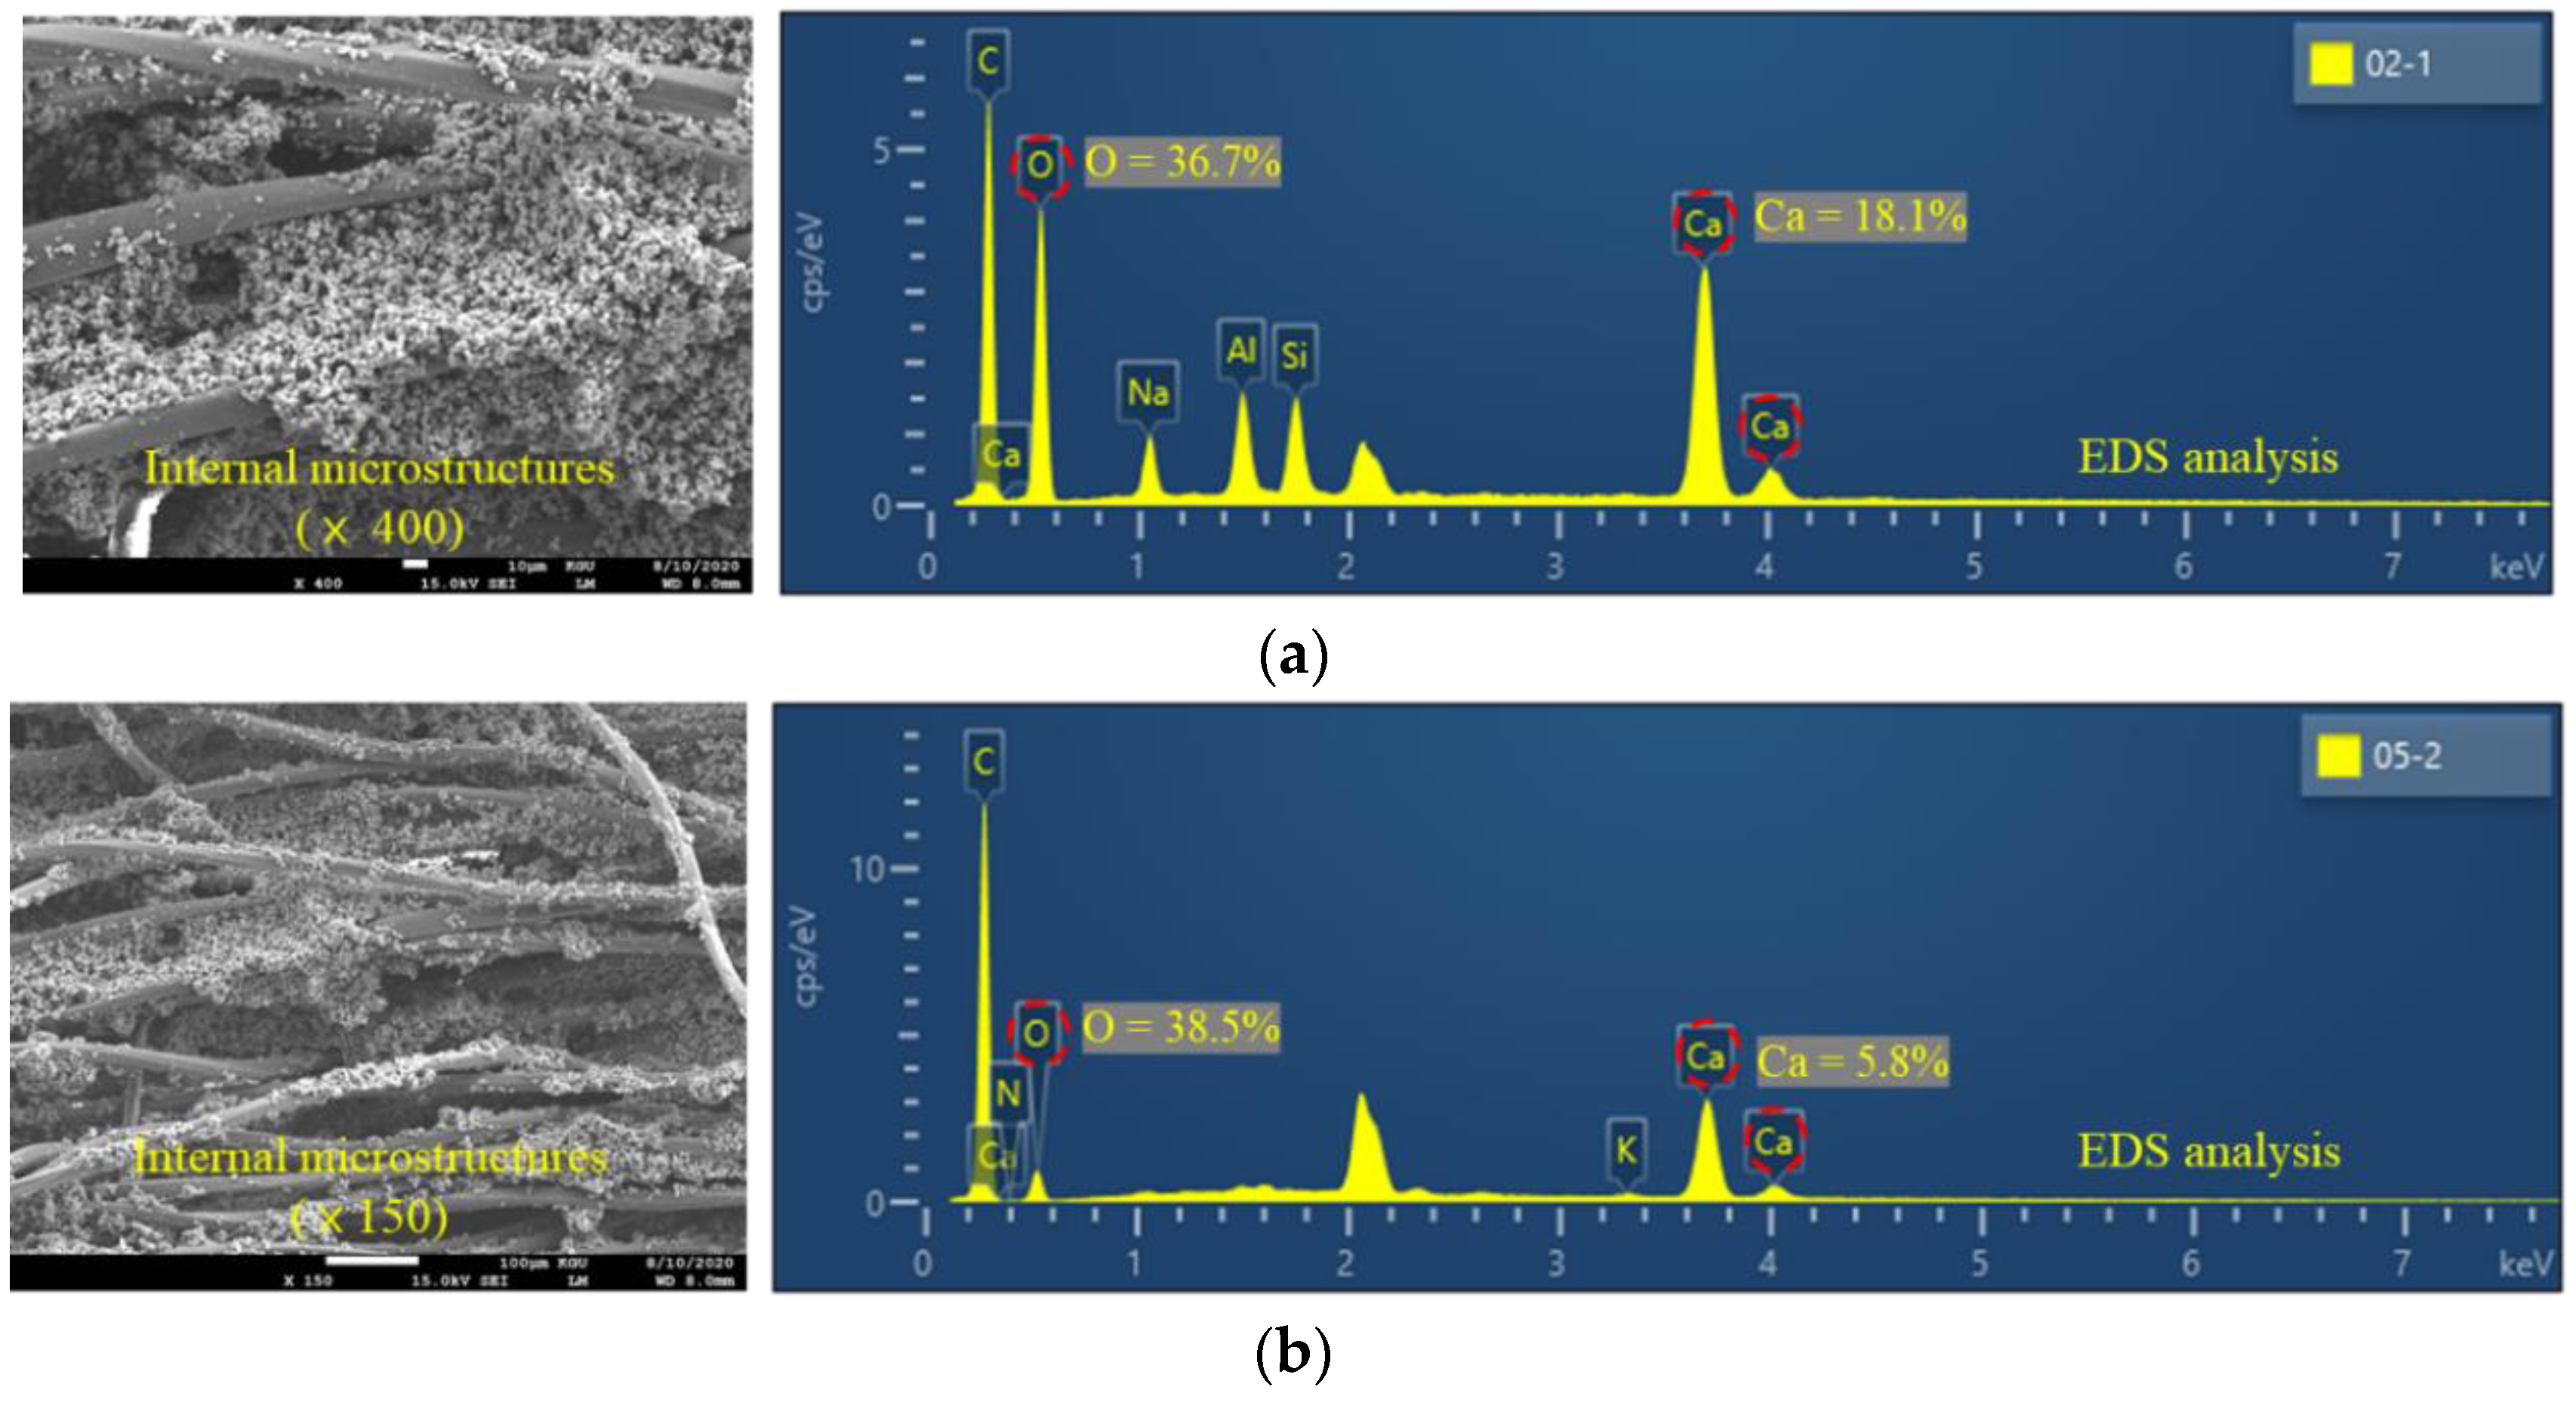
3.2. Effect of Epoxy Content and Dilution Solution on SOx Removal Rate
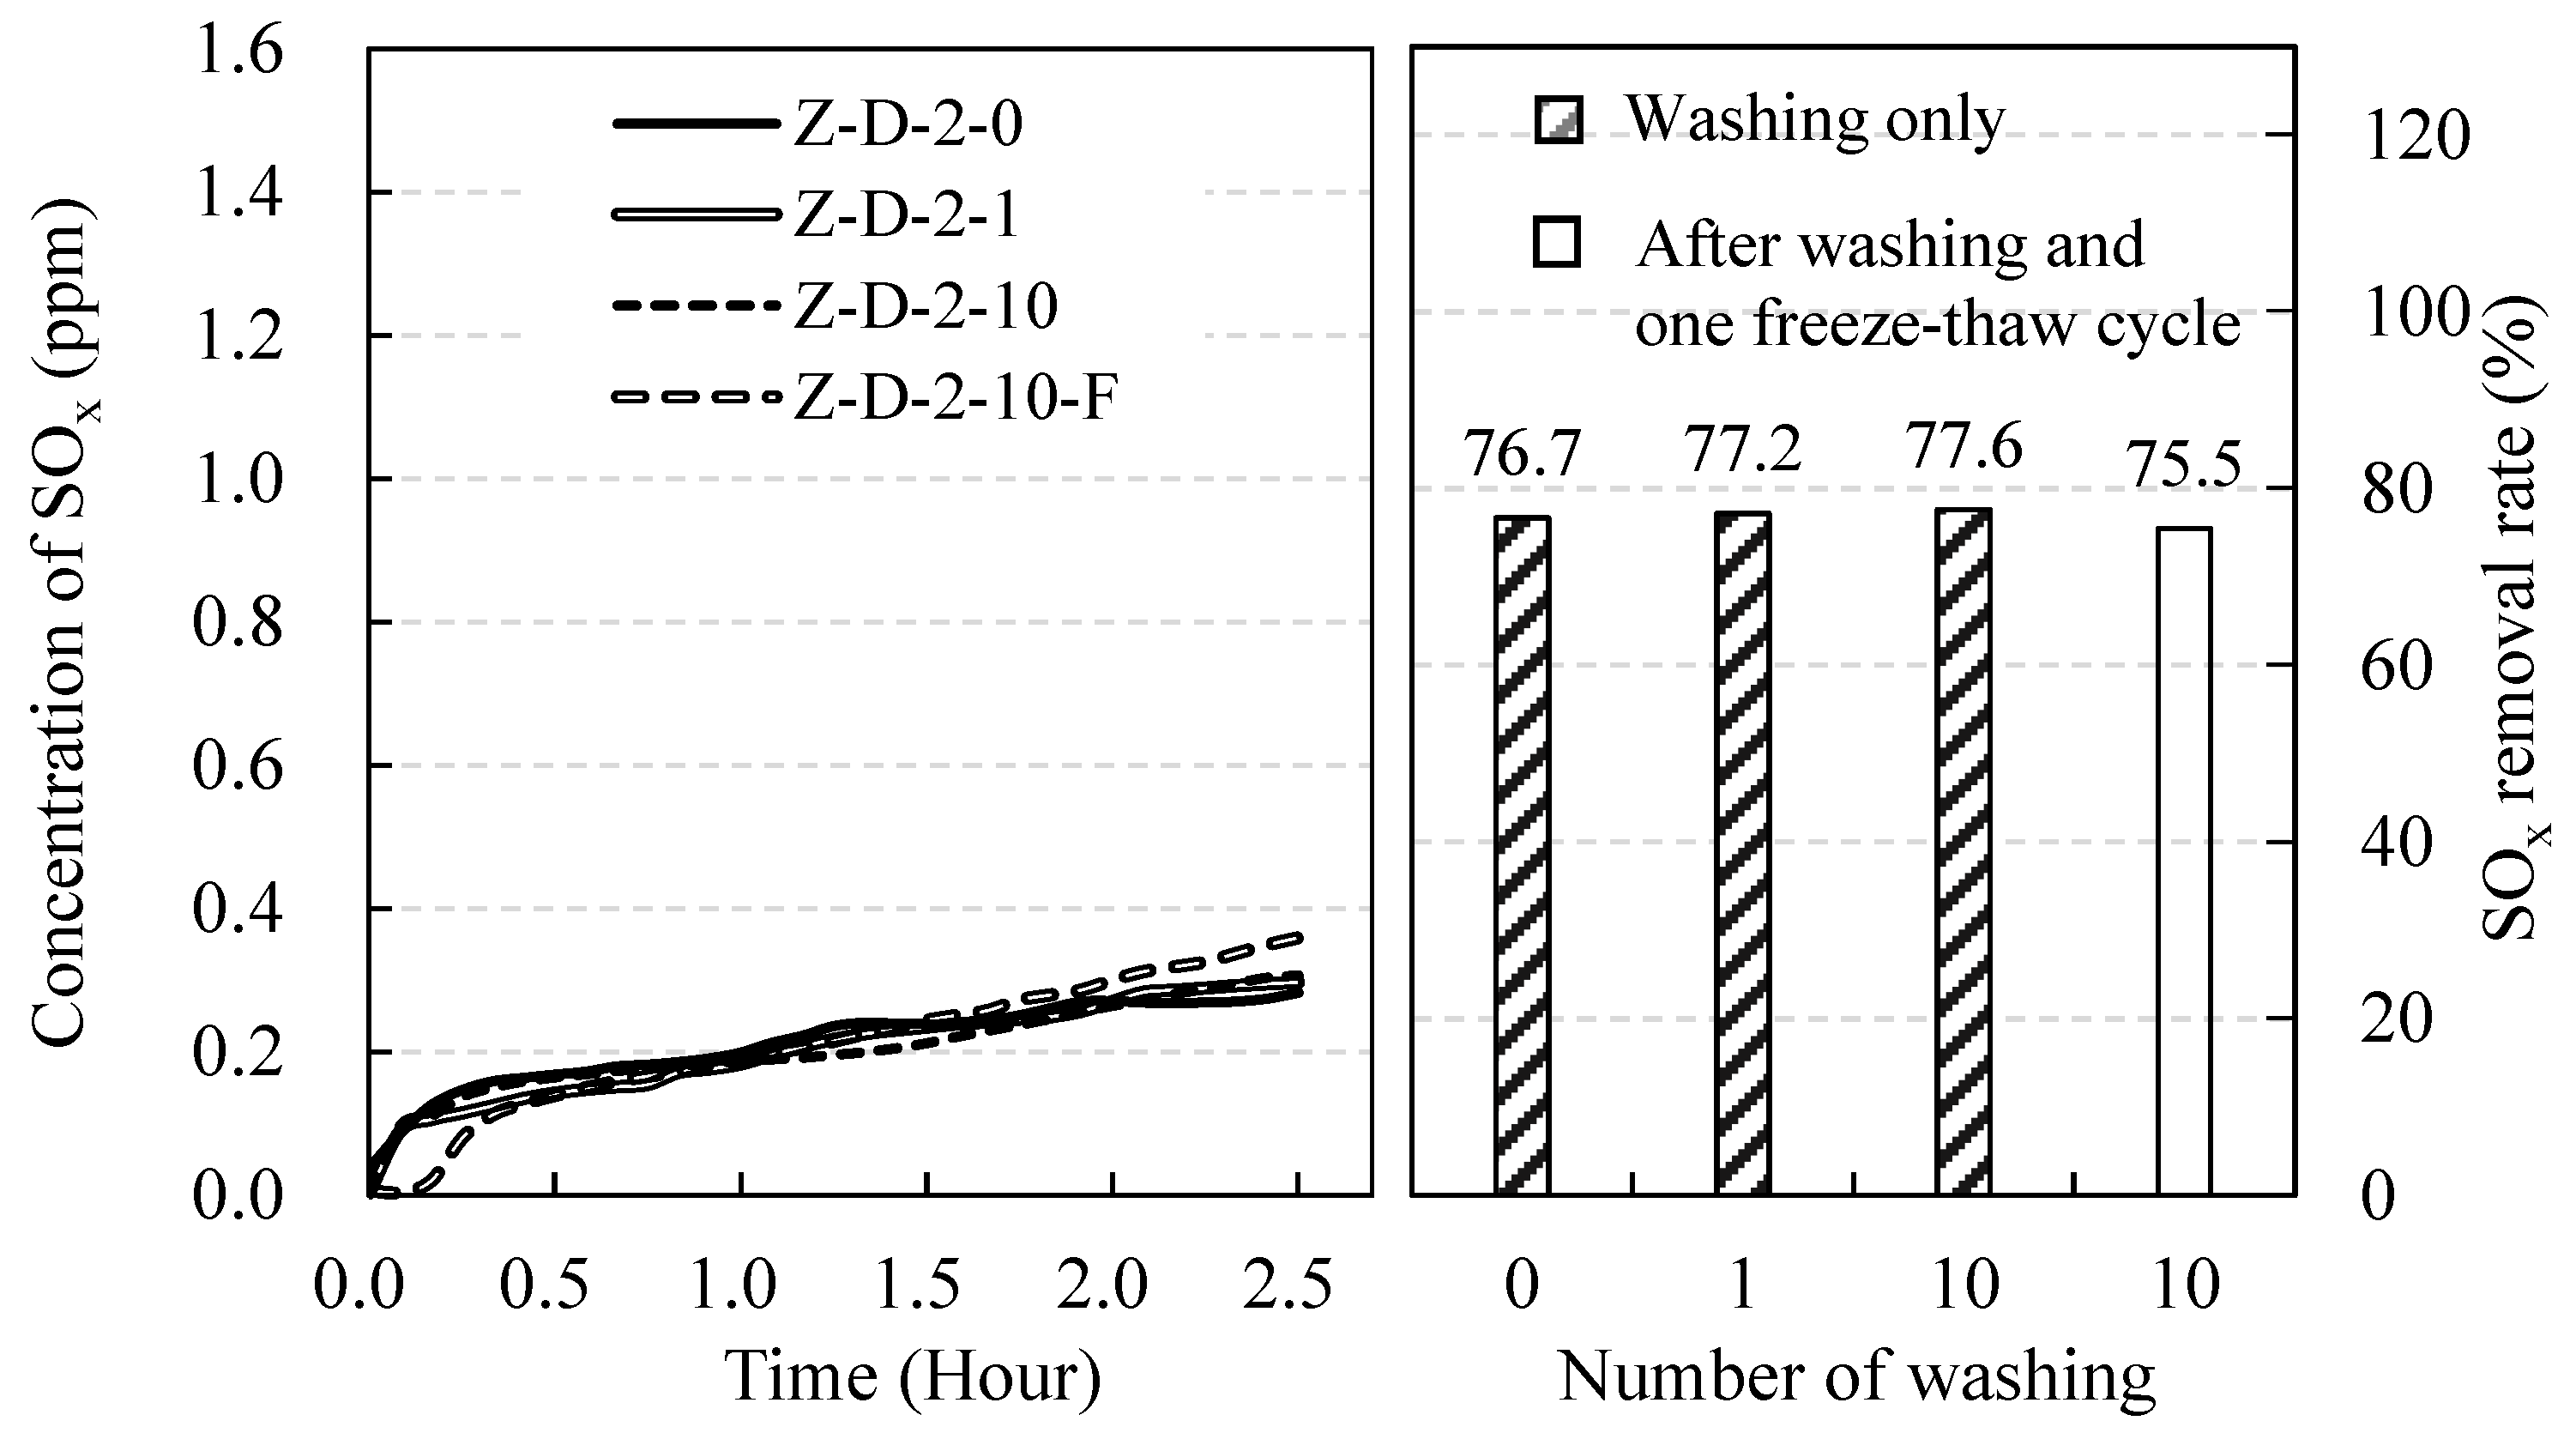
3.3. Effect of the External Environment on SOx Removal Rate
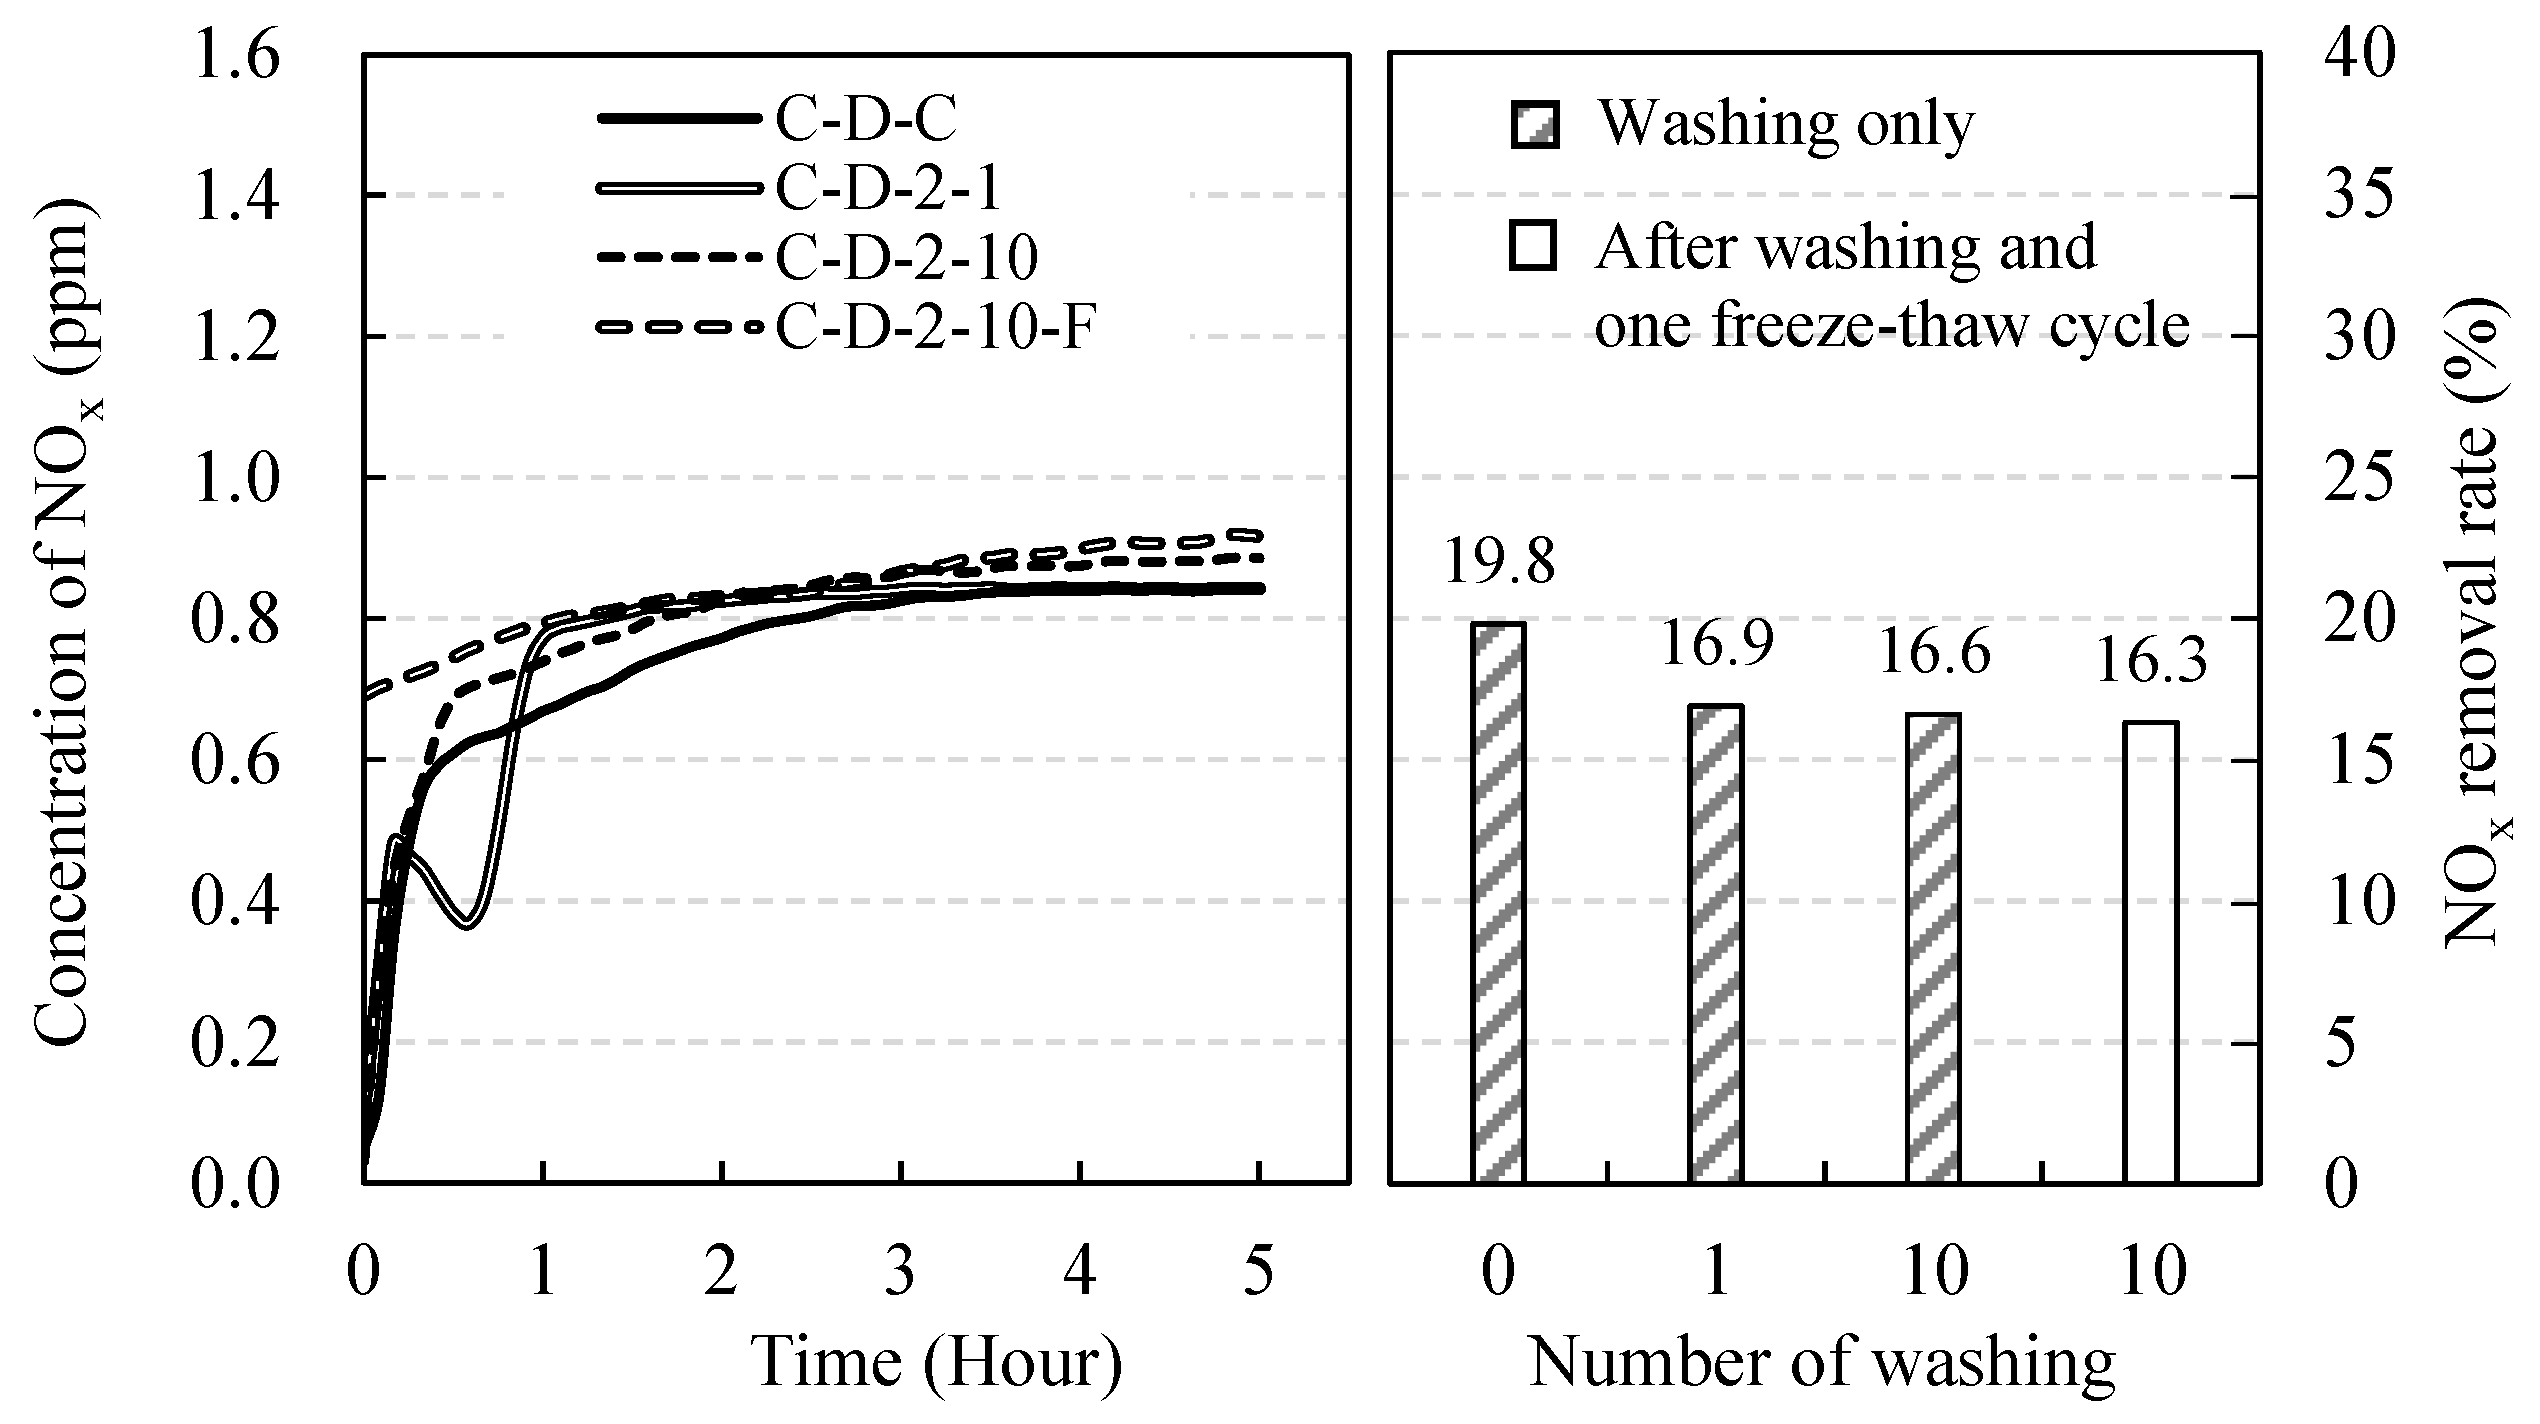
3.4. Effect of External Environment Condition on the NOx Removal Rate
4. Conclusions
Author Contributions
Funding
Acknowledgments
Conflicts of Interest
References
- Jiang, K.; Yu, H.; Chen, L.; Fang, M.; Azzi, M. An advanced, ammonia-based combined NOx/SOx/CO2 emission control process towards a low-cost, clean coal technology. Appl. Energy 2020, 260, 114316. [Google Scholar] [CrossRef]
- Yu, H.; Morgan, S.; Allport, A.; Do, T.; Cottrell, A.; McGregor, J. Update on aqueous ammonia based post combustion capture pilot plant at Munmorah. Distill. Absorpt. 2010, NL, 115–120. [Google Scholar]
- Trapalis, A.; Todorova, N.; Giannakopoulou, T.; Boukos, N.; Speliotis, T.; Dimotikali, D.; Yu, J. TiO2/graphene composite photocatalysts for NOx removal: A comparison of surfactant-stabilized graphene and reduced graphene oxide. Appl. Catal. B Environ. 2016, 180, 637–647. [Google Scholar] [CrossRef]
- Guo, M.Z.; Ling, T.C.; Poon, C.S. Photocatalytic NOx degradation of concrete surface layers intermixed and spray-coated with nano-TiO2: Influence of experimental factors. Cem. Concr. Compos. 2017, 83, 279–289. [Google Scholar] [CrossRef]
- Dylla, H.; Hassan, M.M.; Schmitt, M.; Rupnow, T.; Mohammad, L.M. Laboratory investigation of the effect of mixed nitrogen dioxide and nitrogen oxide gases on titanium dioxide photocatalytic efficiency in concrete pavements. J. Mater. Civ. Eng. 2010, 23, 1087–1093. [Google Scholar] [CrossRef]
- Yoon, I.H.; Lee, K.B.; Kim, J.S.; Kim, S.D. A study on the estimation of NOx reduction in ambient by photocatalyst (TiO2) block. J. Korean Soc. Urban Environ. 2017, 17, 433–443. [Google Scholar]
- An, E.J. A study of dyeing polyester fiber using alkali treatment. J. Basic Des. Art 2014, 15, 185–194. [Google Scholar]
- Kim, K.T.; Ahn, Y.C.; Lee, J.K. Characteristic analysis of electret filters made by electrospinning. Korean J. Air Cond. Refrig. Eng. 2008, 20, 820–824. [Google Scholar]
- Wang, Z.; Guo, M.; Mu, X.; Sen, S.; Insley, T.; Mason, A.J.; Král, P.; Zeng, X. Highly sensitive capacitive gas sensing at ionic liquid−electrode. Anal. Chem. 2016, 88, 1959–1964. [Google Scholar] [CrossRef] [PubMed]
- Kopaq, T.; Kaymakgi, E.; Kopac, M. Dynamic adsorption of SO2 on zeolite molecular sieves. Chem. Eng. Commun. 1998, 164, 99–109. [Google Scholar] [CrossRef]
- Lee, S.J.; Shin, C.S.; Lee, T.H. Removal and regeneration of SO2 by cupric oxide supported on zeolite. J. Korean Soc. Atmos. Environ. 1990, 6, 161–167. [Google Scholar]
- KopaÇ, T.; Kocabaş, S. Sulfur dioxide adsorption isotherms and breakthrough analysis on molecular sieve 5A zeolite. Chem. Eng. Commun. 2010, 190, 1041–1054. [Google Scholar] [CrossRef]
- Chiang, Y.C.; Chiang, P.C.; Chang, E.E. Effects of surface characteristics of activated carbons on VOC adsorption. J. Environ. Eng. 2001, 127, 54–62. [Google Scholar] [CrossRef]
- Al-Rahbi, A.S.; Williams, P.T. Production of activated carbons from waste tyres for low temperature NOx control. Waste Manag. 2016, 49, 188–195. [Google Scholar] [CrossRef] [PubMed]
- Park, S.J.; Kim, B.J.; Kawasaki, J. NO removal of electrolessly copper-plated activated carbons. Hwahak Konghak 2003, 41, 795–801. [Google Scholar]
- Lee, S.W.; Bae, S.K.; Kwon, J.H.; Na, Y.S.; An, C.D.; Yoon, Y.S.; Song, S.K. Correlations between pore structure of activated carbon and adsorption characteristics of acetone vapor. Korean Soc. Environ. Eng. 2005, 27, 620–625. [Google Scholar]
- Lim, T.K.; Lee, J.H.; Mun, J.H.; Yang, K.H.; Ju, S.H.; Jeong, S.M. Enhancing functionality of epoxy-TiO2-embedded high-strength lightweight aggregates. Polymers 2020, 12, 2384. [Google Scholar] [CrossRef] [PubMed]
- Zhang, D.; Jia, D. Toughness and strength improvement of diglycidyl ether of bisphenol-A by low viscosity liquid hyperbranched epoxy resin. J. Appl. Polym. Sci. 2006, 101, 2504–2511. [Google Scholar] [CrossRef]
- Varley, R.J. Toughening of epoxy resin systems using low-viscosity additives. Polym. Int. 2004, 53, 78–84. [Google Scholar] [CrossRef]
- Bong, C.K.; Kim, Y.G.; Lee, J.H.; Bong, H.K.; Kim, D.S. Mutual comparison between two the real-time optical particle counter for measuring fine particles. J. Korean Soc. Urban Environ. 2015, 15, 219–226. [Google Scholar]
- ISO 12103-1. Road Vehicles-Test Dust for Filter Evaluation—Part 1: Arizona Test Dust; International Organization for Standardization: Geneva, Switzerland, 1997. [Google Scholar]
- ISO 22197-1. Fine Ceramics (Advanced Ceramics, Advanced Technical Ceramics)–Test Method for Air-Purification Performance of Semiconducting Photocatalytic Materials—Part 1: Removal of Nitric Oxide; International Organization for Standardization: Geneva, Switzerland, 2007. [Google Scholar]


| Type | Particle Size (µm) | Density (g/cm3) | Fineness (m2/g) |
|---|---|---|---|
| Zeolite | 3–10 | 2.37 | 2.3 |
| Coconut shell activated carbon | 5–10 | 1.56 | 1130.1 |
| Specimen | Length (mm) | Layers | Density (g/cm2) | Details |
|---|---|---|---|---|
| C (Control) | - | - | - |  |
| 3.5–4 | 3.5 | 4 | 0.08 |  |
| 3.5–8 | 3.5 | 8 | 0.08 |  |
| 7.0–4 | 7 | 4 | 0.13 |  |
| 7.0–8 | 7 | 8 | 0.13 |  |
| 12–4 | 12 | 4 | 0.22 |  |
| 12–8 | 12 | 8 | 0.22 |  |
| Specimens | Porous Material Type | Dilution Solution Type | Epoxy Contents (%) | Number of Washings | Number of Freezing–Thaw Cycles |
|---|---|---|---|---|---|
| Z-D-C (Control) | Zeolite | Deionized water | 0 | 0 | 0 |
| Z-D-0-1 | 1 | 0 | |||
| Z-D-1-0 | 1 | 0 | 0 | ||
| Z-D-1-1 | 1 | 0 | |||
| Z-D-1.5-0 | 1.5 | 0 | 0 | ||
| Z-D-1.5-1 | 1 | 0 | |||
| Z-D-2-0 | 2 | 0 | 0 | ||
| Z-D-2-1 | 1 | 0 | |||
| Z-D-2-10 | 10 | 0 | |||
| Z-D-2-10-F | 10 | 1 | |||
| Z-I-C (Control) | Zeolite | Isopropyl alcohol | 0 | 0 | 0 |
| Z-A-0-1 | 1 | 0 | |||
| Z-A-1-0 | 1 | 0 | 0 | ||
| Z-A-1-1 | 1 | 0 | |||
| Z-A-2-0 | 2 | 0 | 0 | ||
| Z-A-2-1 | 1 | 0 | |||
| Z-DA-1-0 | Zeolite | 90% deionized water and 10% isopropyl alcohol | 1 | 0 | 0 |
| Z-DA-1-1 | 1 | 0 | |||
| Z-DA-2-0 | 2 | 0 | 0 | ||
| Z-DA-2-1 | 1 | 0 | |||
| C-D-C (Control) | Coconut shell activated carbon | Deionized water | 2 | 0 | 0 |
| C-D-2-1 | 1 | 0 | |||
| C-D-2-10 | 10 | 0 | |||
| C-D-2-10-F | 10 | 1 |
| Specimens | Removal Rate of A1 Particles at Termination of Test (%) | Time which the Number of A1 Particles Reached Zero (min) | |
|---|---|---|---|
| C | 77.5 | - | - |
| 3.5–4 | 100 | 29 | 20 |
| 3.5–8 | 100 | 26 | 21 |
| 7.0–4 | 100 | 26 | 23 |
| 7.0–8 | 100 | 25 | 33 |
| 12–4 | 100 | 25 | 36 |
| 12–8 | 100 | 22 | 52 |
| Specimens | Porous Material Type | Dilution Solution Type | Epoxy Contents (%) | Number of Washings | Number of Freezing-Thaw Cycles | Removal Rate (%) | |
|---|---|---|---|---|---|---|---|
| SOx | NOx | ||||||
| Z-D-C (Control) | Zeolite | Deionized water | 0 | 0 | 0 | 83.4 | - |
| Z-D-0-1 | 1 | 0 | 34.9 | - | |||
| Z-D-1-0 | 1 | 0 | 0 | 74.7 | - | ||
| Z-D-1-1 | 1 | 0 | 66.2 | - | |||
| Z-D-1.5-0 | 1.5 | 0 | 0 | 68.3 | - | ||
| Z-D-1.5-1 | 1 | 0 | 60.8 | - | |||
| Z-D-2-0 | 2 | 0 | 0 | 76.7 | - | ||
| Z-D-2-1 | 1 | 0 | 77.2 | - | |||
| Z-D-2-10 | 10 | 0 | 77.6 | - | |||
| Z-D-2-10-F | 10 | 1 | 75.5 | - | |||
| Z-I-C (Control) | Zeolite | Isopropyl alcohol | 0 | 0 | 0 | 86.3 | - |
| Z-A-0-1 | 1 | 0 | 26.6 | - | |||
| Z-A-1-0 | 1 | 0 | 0 | 84.7 | - | ||
| Z-A-1-1 | 1 | 0 | 58.8 | - | |||
| Z-A-2-0 | 2 | 0 | 0 | 66.1 | - | ||
| Z-A-2-1 | 1 | 0 | 62.4 | - | |||
| Z-DA-1-0 | Zeolite | 90% deionized water and 10% isopropyl alcohol | 1 | 0 | 0 | 90.6 | - |
| Z-DA-1-1 | 1 | 0 | 73.4 | - | |||
| Z-DA-2-0 | 2 | 0 | 0 | 81.7 | - | ||
| Z-DA-2-1 | 1 | 0 | 74.8 | - | |||
| C-D-C (Control) | Coconut shell activated carbon | Deionized water | 2 | 0 | 0 | - | 19.8 |
| C-D-2-1 | 1 | 0 | - | 16.9 | |||
| C-D-2-10 | 10 | 0 | - | 16.6 | |||
| C-D-2-10-F | 10 | 1 | - | 16.3 | |||
Publisher’s Note: MDPI stays neutral with regard to jurisdictional claims in published maps and institutional affiliations. |
© 2020 by the authors. Licensee MDPI, Basel, Switzerland. This article is an open access article distributed under the terms and conditions of the Creative Commons Attribution (CC BY) license (http://creativecommons.org/licenses/by/4.0/).
Share and Cite
Yang, K.-H.; Mun, J.-H.; Lee, J.-U. Removal Rates of NOx, SOx, and Fine Dust Particles in Textile Fabrics Coated with Zeolite and Coconut Shell Activated Carbon. Appl. Sci. 2020, 10, 8010. https://0-doi-org.brum.beds.ac.uk/10.3390/app10228010
Yang K-H, Mun J-H, Lee J-U. Removal Rates of NOx, SOx, and Fine Dust Particles in Textile Fabrics Coated with Zeolite and Coconut Shell Activated Carbon. Applied Sciences. 2020; 10(22):8010. https://0-doi-org.brum.beds.ac.uk/10.3390/app10228010
Chicago/Turabian StyleYang, Keun-Hyeok, Ju-Hyun Mun, and Jae-Uk Lee. 2020. "Removal Rates of NOx, SOx, and Fine Dust Particles in Textile Fabrics Coated with Zeolite and Coconut Shell Activated Carbon" Applied Sciences 10, no. 22: 8010. https://0-doi-org.brum.beds.ac.uk/10.3390/app10228010