A Sensitivity Analysis of the Damage Behavior of a Leading-Edge Subject to Bird Strike
by
 , , , and
Francesco Di Caprio
1,* ,
,
Andrea Sellitto
2,
Salvatore Saputo
2,
Michele Guida
3 and
and
Aniello Riccio
2 1
CIRA—Italian Aerospace Research Centre, via Maiorise snc, 81043 Capua, Italy
2
Department of Engineering, University of Campania “Luigi Vanvitelli”, via Roma 29, 81031 Aversa, Italy
3
Department of Industrial Engineering, University of Naples Federico II, Via Claudio 21, 80125 Naples, Italy
*
Author to whom correspondence should be addressed.
Appl. Sci. 2020, 10(22), 8187; https://0-doi-org.brum.beds.ac.uk/10.3390/app10228187
Submission received: 23 September 2020
/
Revised: 8 November 2020
/
Accepted: 18 November 2020
/
Published: 19 November 2020
(This article belongs to the Special Issue Advanced Materials and Technologies for Aerospace Applications)
Abstract
:This paper aims to investigate the crashworthiness capability of a commercial aircraft metallic sandwich leading edge, subjected to bird strike events. A sensitivity analysis is presented, aimed to assess the influence of the skin parameters (inner and outer faces and core thicknesses) on the leading-edge crashworthiness and to determine, among the configurations able to withstand a bird strike event, the best compromise in terms of weight and structural performances. In order to easily manage the design parameters and the output data, the ModeFrontier code was used in conjunction with the FE code Abaqus/Explicit. A dedicated python routine was developed to define a fully parametric simplified leading-edge model. To fulfill the aerodynamic requirements, the external surfaces were considered fixed during the sensitivity analysis, and, thus, only the internal leading edge’s components were modified to study their influence on the structural response. The total mass of the model, the maximum deformation and the energy dissipated due to material failure and the plastic deformations were monitored and used to compare and assess the behavior of each configuration.
1. Introduction
Damages resulting from bird strikes can seriously compromise the structural integrity of the aircraft. Therefore, large research studies can be found in the literature, focused on reducing human and air losses, developing new materials and design configurations of the parts most exposed to bird strike risks and developing bird control programs at airports to reduce the frequency of bird strikes. Therefore, stringent requirements have been selected and continuously updated by aviation safety agencies like the Federal Aviation Administration (FAA) and the European Union Aviation Safety Agency (EASA) [1] in the certification procedures of each aircraft component.
Recently, the EASA [2] proposed certification protocols providing guidance on certification aspects to be considered when using modeling and simulation techniques based on finite computational methods, and it clarifies that general compliance with structural certification specifications can be demonstrated by testing or by analyses supported by tests in case of similarities.
Over the past decade, authors have studied several examples of aircraft structure topics and associated major certification specifications in the form of computational finite method techniques. Attention was paid to the certification process of some structural components of airplanes, for which a vast campaign of experimental tests was useful for the validation of the numerical models representing the structure and the impactor [3,4,5]. Among the extensive literature research, different works focusing on the bird impact behavior on the windshield [6,7], wing flap [8] and leading edge [9,10,11]; these results made it possible to implement different material configurations, such as composite incorporated with shape memory alloy material [12,13] or laminated material [14,15], by evaluating the behavior of the dynamic impact even at full scale [16], and in an attempt to improve components crashworthiness with respect to mass saving [17]. Moreover, several investigations were carried out by varying the characteristics of the volatile mass by using different projectile formulations, as smooth particle hydrodynamic (SPH) [18,19] and Lagrangian [20,21,22].
In recent years, many authors have analyzed and simulated the bird-strike event against a specific part of the aircraft. Georgiadis et al. [23] provided a validated simulation methodology to support bird-strike certification of the Boeing 787 Dreamliner carbon fiber epoxy composite mobile trailing edge. Anghileri et al. (2004) [24] performed a numerical simulation of the impact of birds against the turbofan engine intake and discussed the advantages and disadvantages of using different bird modeling techniques. Hanssen et al. [25] investigated the impact of birds against the aluminum foam sandwich panel using the arbitrary Lagrangian–Eulerian (ALE) approach.
To go beyond the state of the art, this work identifies the best compromise between weight and crashworthy design among the configurations capable of withstanding the bird strike phenomenon. This objective is achieved by using the ModeFrontier [26] code in conjunction with the FE Abaqus Explicit code [27] with a dedicated Python routine. Experimental tests have been used to verify and validate the model in order to guarantee the credibility and the acceptance of the results. Indeed, defining and creating test configurations and test articles, as well as actually running tests, can be expensive and time-consuming. Furthermore, even the test can be cumbersome; in particular, the difficulties of bird-strike tests can be related to their repeatability, to the management, and also to all the design cases to be examined and that can be manufactured. For these and other reasons, the use of numerical analyses is becoming increasingly widespread, particularly in the form of modeling and simulation techniques. This trend is further supported by the increase in computational capabilities, as well as the increased accuracy and ease of use of commercially available numerical tools. The possibility of optimizing and identifying a configuration capable of resisting highly transient dynamic impact, such as that of the bird-strike, and of being functional to the overall sizing of the structure is an advantage and a requirement for aeronautical manufacturers.
The attention of the research study focused on the leading edge of the metal sandwich subject to bird-strike, which is installed on the 17,000 kg Spartan C27J military airplane, while SPH was used to numerically simulate the bird and its interaction with the structure. Subsequently, a sensitivity analysis was performed in order to find, among the configurations capable of withstanding a bird strike phenomenon, the best compromise between weight and structural performances in terms of crashworthiness capabilities.
2. Experimental Test Article and Numerical Implementation
The investigated subcomponent is representative of the vertical tail leading edge of a general aviation aircraft. In order to assess the crashworthiness of the subcomponent, the numerical model was preliminarily validated with respect to experimental results taken from the literature [17]. Therefore, the first step of the work aims to validate the adopted numerical models, simulating the bird strike event on a defined leading-edge configuration, and then correlating the obtained numerical results with respect to the literature data.
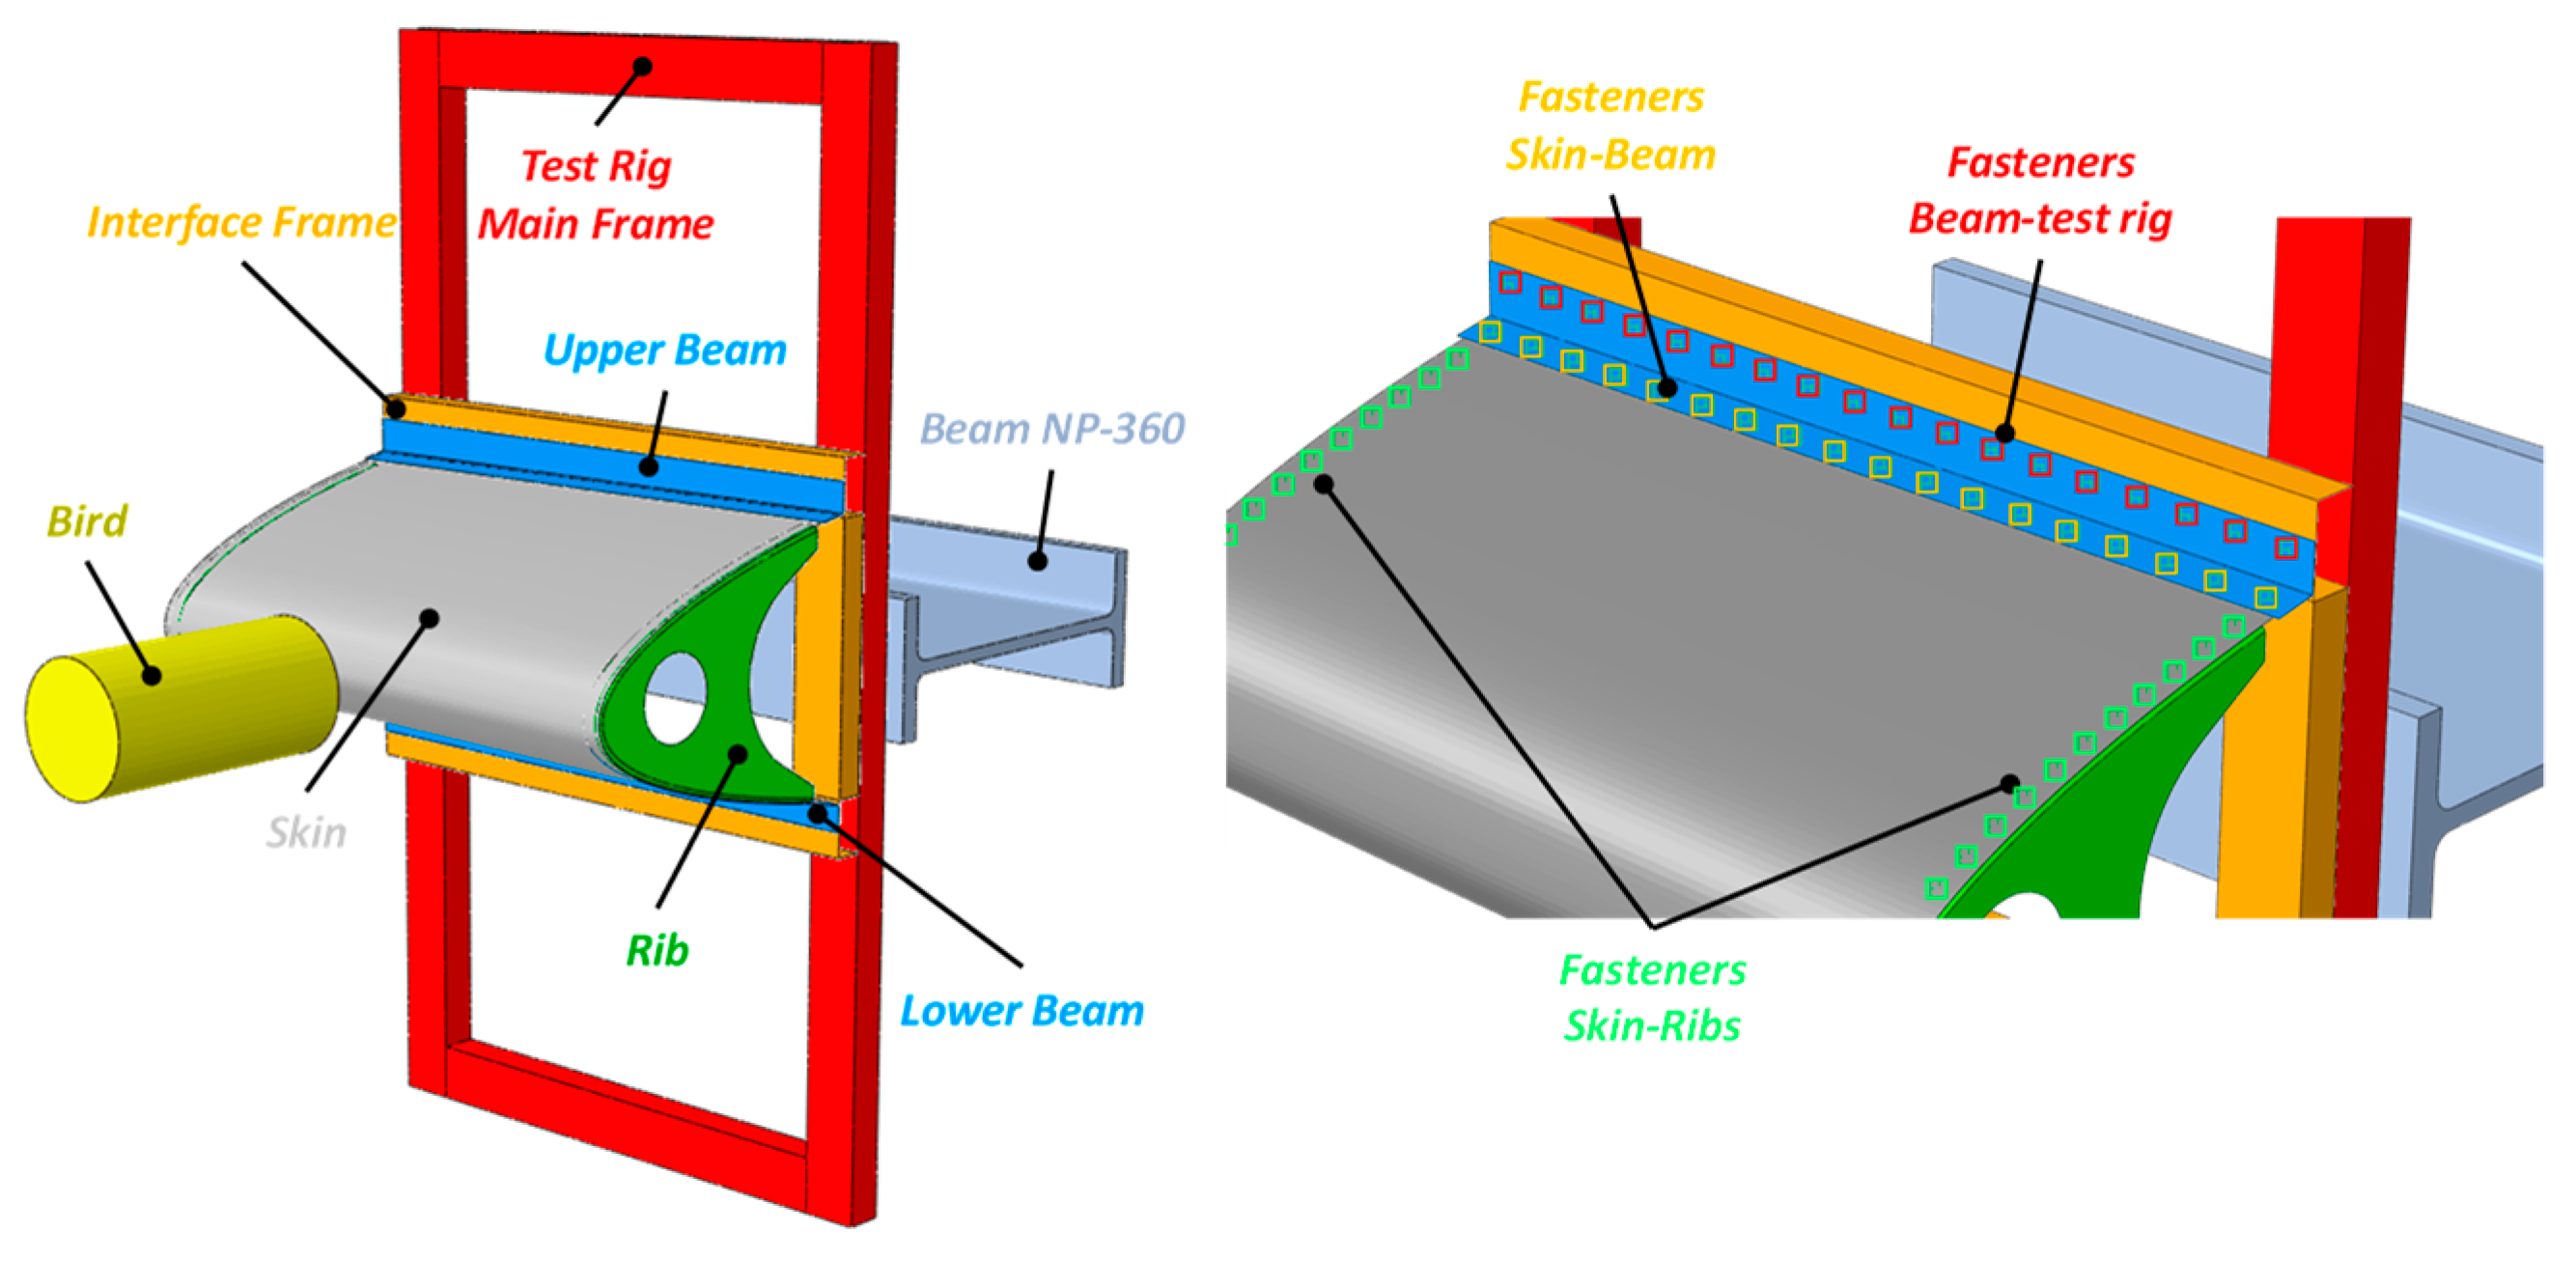
During the experiments, the leading-edge section was installed on a metallic beam structure, which is not perfectly rigid. Hence, also the metallic support structure absorbs a not negligible amount of energy. In order to reproduce the experimental test accurately, the entire test rig structure was considered in the numerical simulation as well. Figure 1 shows the test article (leading-edge) and the surrounding structure (test rig), providing a visual comparison between the experimental and numerical cases. The experimental test rig is fixed on three load cells, which were used to record the reaction force during the impact. In the same figure, the main dimensions are reported too.
The test article is composed of an external skin and two ribs. Moreover, to connect the test article on the test rig, two metallic aluminum L-beams were used. The two beams are bolted on a steel frame, which is welded on the primary test rig frame. In the rear zone (behind the test-rig structure), a steel NP-360 beam was placed in order to stop the bird if the penetration occurred, preventing several damages to the test rig and to the equipment. Titanium alloy fasteners, characterized by a diameter equal to 4 mm, were used to connect the skin to the support structure. In particular, the upper and lower beams of the structure are fastened to the skin and to the interface frame by means of eighteen rivets per side, while the frame and the skin are fastened each other considering an inter-rivet distance equal to 25.4 mm. Figure 2 shows details of the adopted numerical model, which includes both the test article and the main component of the test rig.
The numerical models of the structure and of the bird were discretized by using, respectively, 4-node shell elements with a reduced integration scheme (S4R) and SPH elements. In particular, the skin was modeled by means of layered shell elements in order to simulate the sandwich structure; therefore, the core was modeled as a layer. This approach allows to reduce the computational cost and to allow the generation of the model in an automatic fashion. Elasto-plastic properties with failure option and strain-rate dependency were associated with all the layers of the leading edge. Only the afterward NP-360 beam (see Figure 2) was modeled as a discrete rigid body to reduce the computational cost. This choice is motivated by the fact that the component is subject to a very small deformation state under the considered impact loading conditions. Therefore, its main effect on the test is to limit the bending of the metallic frame and so to concentrate the deformation on the interface zones.
The skin is a curved sandwich panel with the external and internal face made of AL2024-T3 [28] (Table 1) and 1.4 and 0.4 mm-thick, respectively. The core is a hexweb aluminum flexcore (Table 2) with a cell size equal to 9.35 mm and 6.35 mm-thick [20]. A wing leading edge formed from honeycomb material bonded to the aluminum spar/ribs structure is very common; it possesses unique characteristics depending on the materials, dimensions and employed manufacturing techniques. The main components of the sandwich structure are the core, faces and adhesive. The faces can be metallic or composite prepreg. The latter ones (fiberglass, Kevlar and CFRP) or can be precured and then bonded to honeycomb core with adhesive or can be cured with a honeycomb core, and thus, the resin can replace the adhesive layer. The common methods of bonding panels are with the help of autoclaves, vacuum bagging and presses. Autoclaves and vacuum bagging are generally used for curved parts and presses for flat panels. Generally, the pressure helps to have a perfect adhesion; however, the amount of pressure to be applied depends on the compressive strength of the core. Table 2 reports the main material properties; the other ones were set according to standard numerical procedures (≈0). The left and right webs are made of 2 mm-thick AL20204-T3. The lower and upper L-beam used to connect the skin to the interface frame are 2 mm-thick AL2020-T3. The test rig is made of steel, and it is 1200 mm high and 650 mm wide. The height of the interface frame is 405 mm. The beams of the mainframe have a 60 × 40 mm2 rectangular cross-section, while the ones on the interface frame are 60 × 30 mm2 C-sections. Both of them are 5 mm thick.
Isotropic elastic–plastic material model was associated with the aluminum skin layers, assuming bilinear yield behavior and isotropic hardening that uses the Von Mises yield criterion with a plasticity algorithm with strain rate effects. Cowper–Symonds law was used as the elastic–plastic formulation to consider strain rate dependency at medium rate regime and in particular, the related parameters D and p were, respectively, set to s−1 and 4.0 [20].
The impact occurs in the center of the leading edge (at the apex), with an impact trajectory normal to the leading edge (0° impact angle). The impact velocity is equal to 129 m/s, and the bird mass is 3.68 kg, resulting in a total starting kinetic energy of about 30.6 kJ. The projectile, i.e., the bird, was discretized as a 268 mm long cylinder with a diameter equal to 134 mm.
The duration of the analyses was set to 30 ms. No friction was considered. The choice to use the small component of the leading edge is useful above all to validate the numerical models, whereas a full-scale test must be considered for the certification. The bay offers different constraint conditions with respect to the entire leading-edge component: in fact, the behavior of the ribs, which are arranged laterally, is very different as they are free to flex and follow the deformation of the panel, opposed to the full-scale leading edge where they are constrained by contiguous samples.
3. Starting Configuration Results
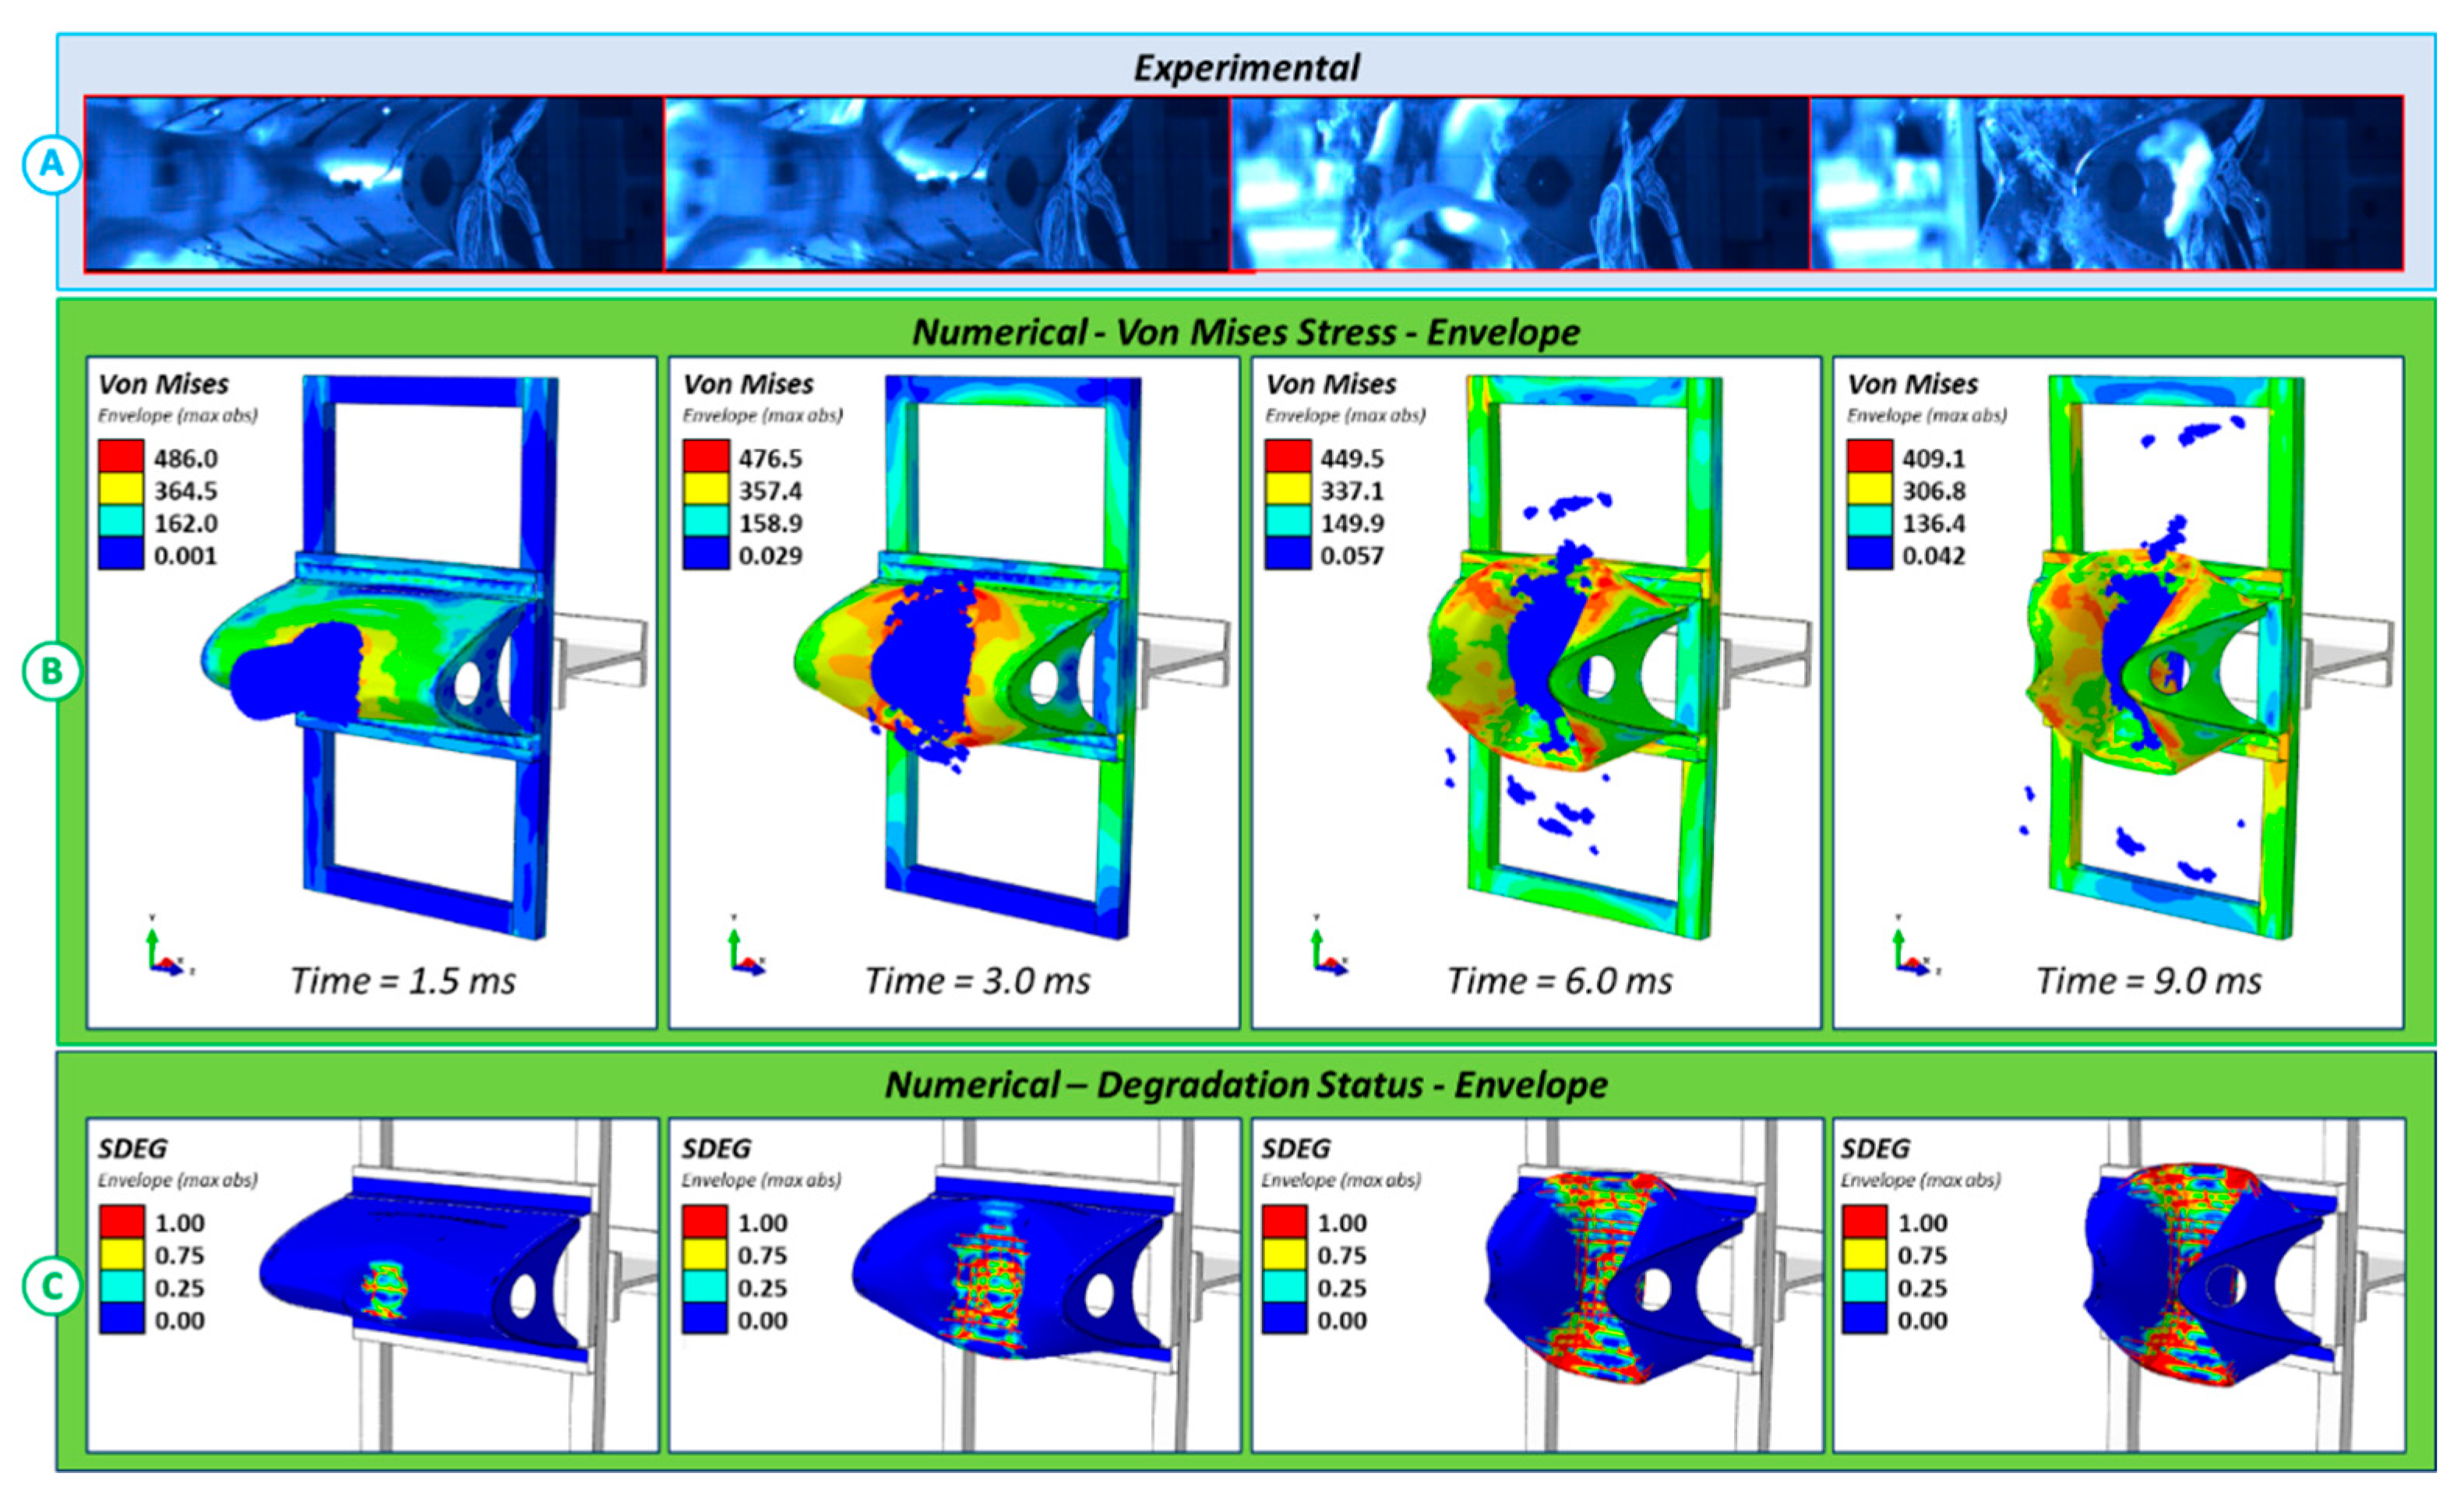
In this section, the numerical results of the investigated phenomenon are reported and compared with respect to the experimental ones in order to highlight the model accuracy. These results are deeply discussed in [17]; however, hereafter, the most relevant aspects are proposed to serve as a basis for the sensitivity analysis, which is the focus of this work. Figure 3 shows the stress distribution and the damage status generated by the impact event. The last frame (right side of Figure 3) shows the time step corresponding to the maximum deformation state. In order to better appreciate the damage status, the bird was removed from the visualization. Regarding the damage status, the element painted in red are the ones where at least one layer is fully damaged (inner face, outer face or core). The elements which experienced the failure in all layers were removed from the analysis. According to the numerical results, no element is subject to a total failure (all layers failed). This result is confirmed by the experimental test, where no total failure can be appreciated, and only failures in one or at least two components can be observed in the same zone [20] (Figure 4).
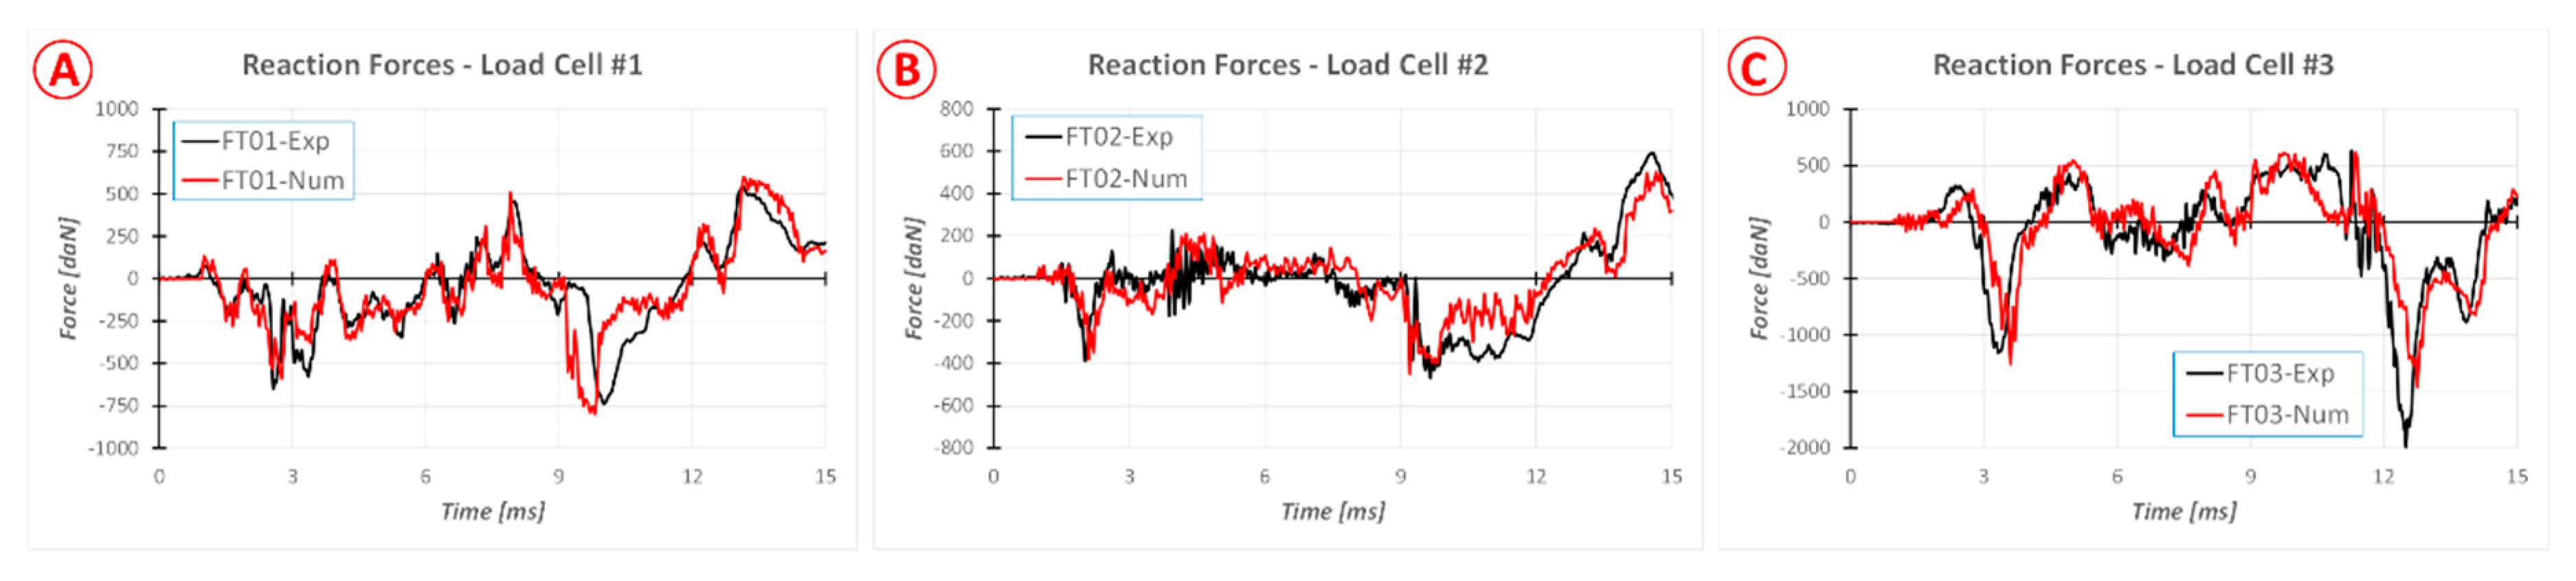
Figure 5 shows the experimental-numerical comparison of the reaction forces recorded by the three installed load cells (Figure 1). The force’s component reported is parallel to the impact direction, therefore normal to the plane of the mainframe. The experimental curves were offset over time in order to synchronize them with the numerical ones (the contact starts at about 1 ms). The main phenomenon lasts about 12 ms, in fact, the maximum deformation level, and therefore the maximum crushing is reached at about 9 ms. After this time step, the projectile starts to rebound and, consequently, the structure recovers elastically part of its deformation, and the reaction forces decrease. At about 12 ms, the reaction forces go to zero, and then they grow up again, all of which indicates that the first rebound is terminated. For this reason, only the first 15 ms are reported in the graphs. After this time step, the reaction forces exhibit several oscillations, which are influenced a lot by the dynamic behavior of the entire test rig, and so they are no too relevant for comparative scope. The graphs shown in Figure 5 highlight that the numerical model is able to capture the main structure response on the entire test article (the leading edge with test rig) with a good accuracy level; it is possible to note only a slight time shift. The errors related to maximum and minimum farces are smaller than 10%, that can be considered very satisfactory considering the complexity of the simulated test.
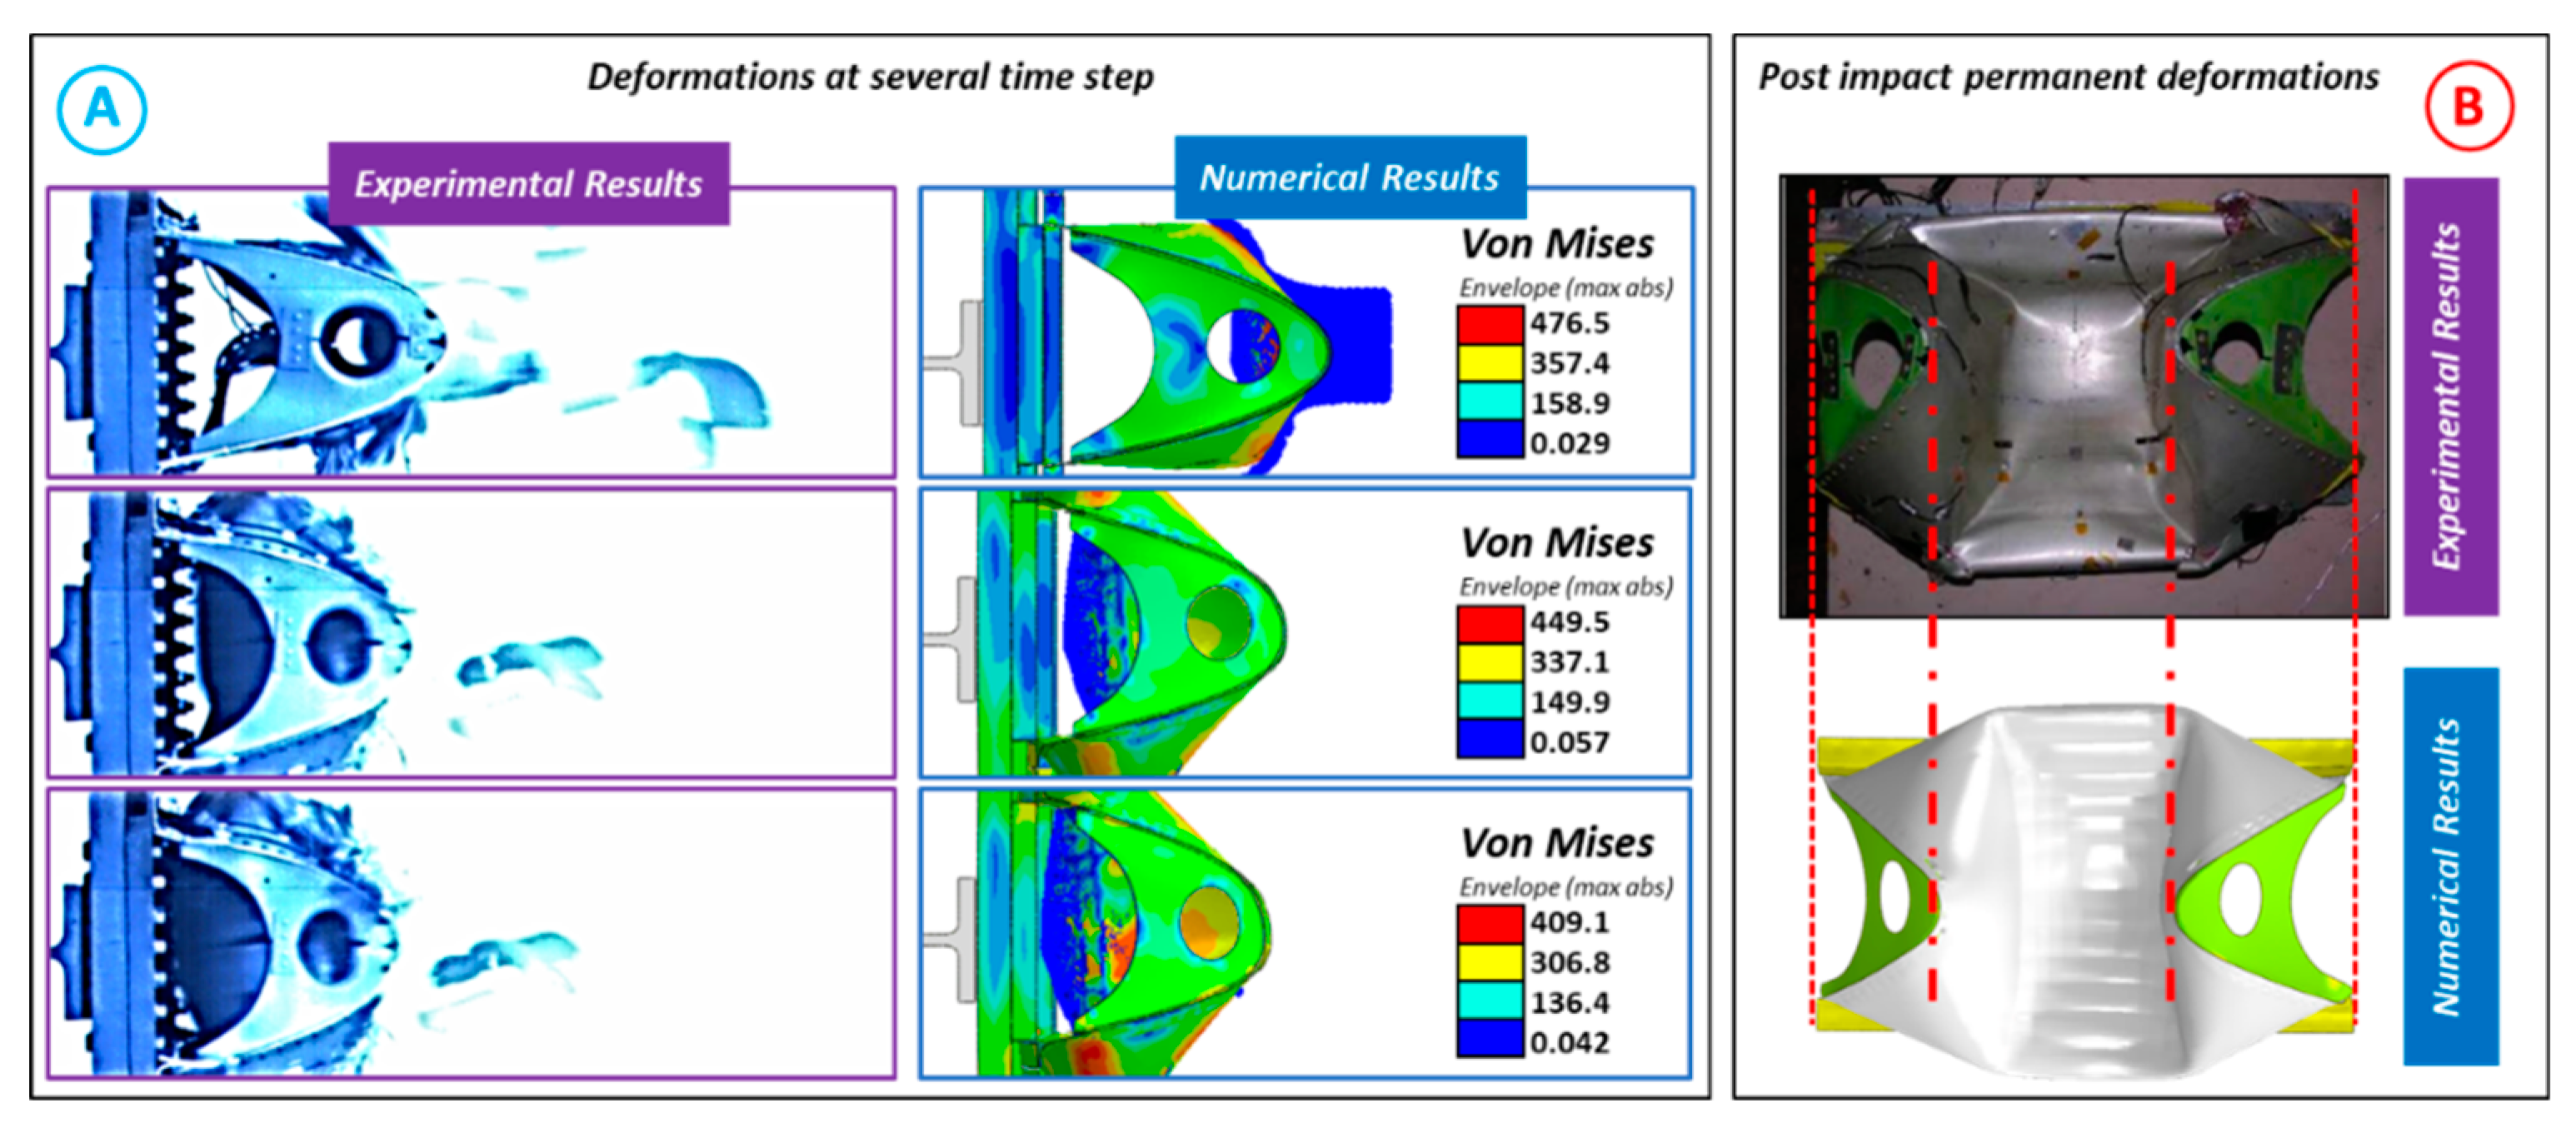
The numerical model was proven to correctly describe the mechanical behavior of the leading edge, according to the good agreement between the experimental and the numerical model in terms of the global deformations experienced during the phenomenon, shown in Figure 4A. Comparisons were conducted in terms of post-impact permanent deformation, reported in Figure 4B and reaction forces (Figure 5) as well. Indeed, a good correlation can be found both in terms of deformed shape and dimension: the distance between the two tips of the ribs, in particular, gives information on the plastic deformation and of the failure of the structure.
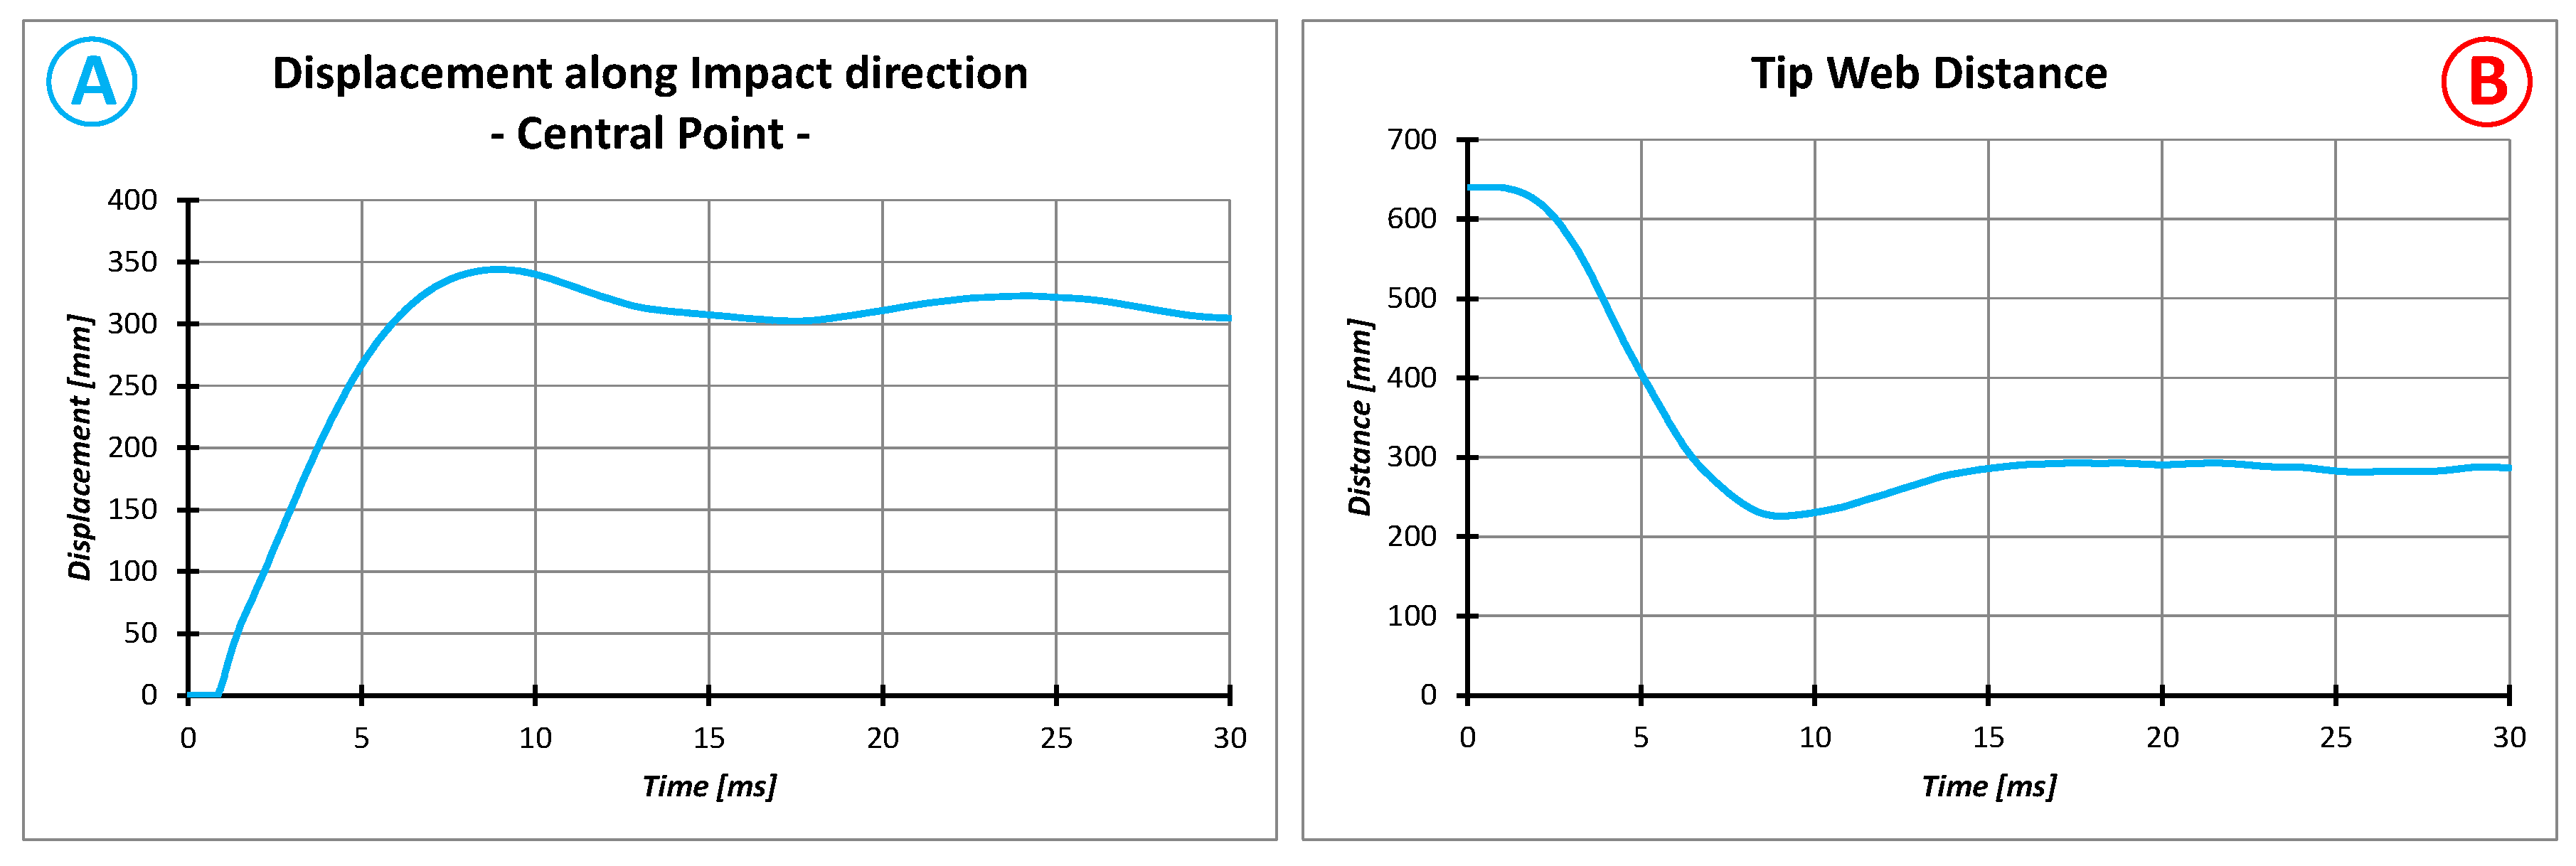
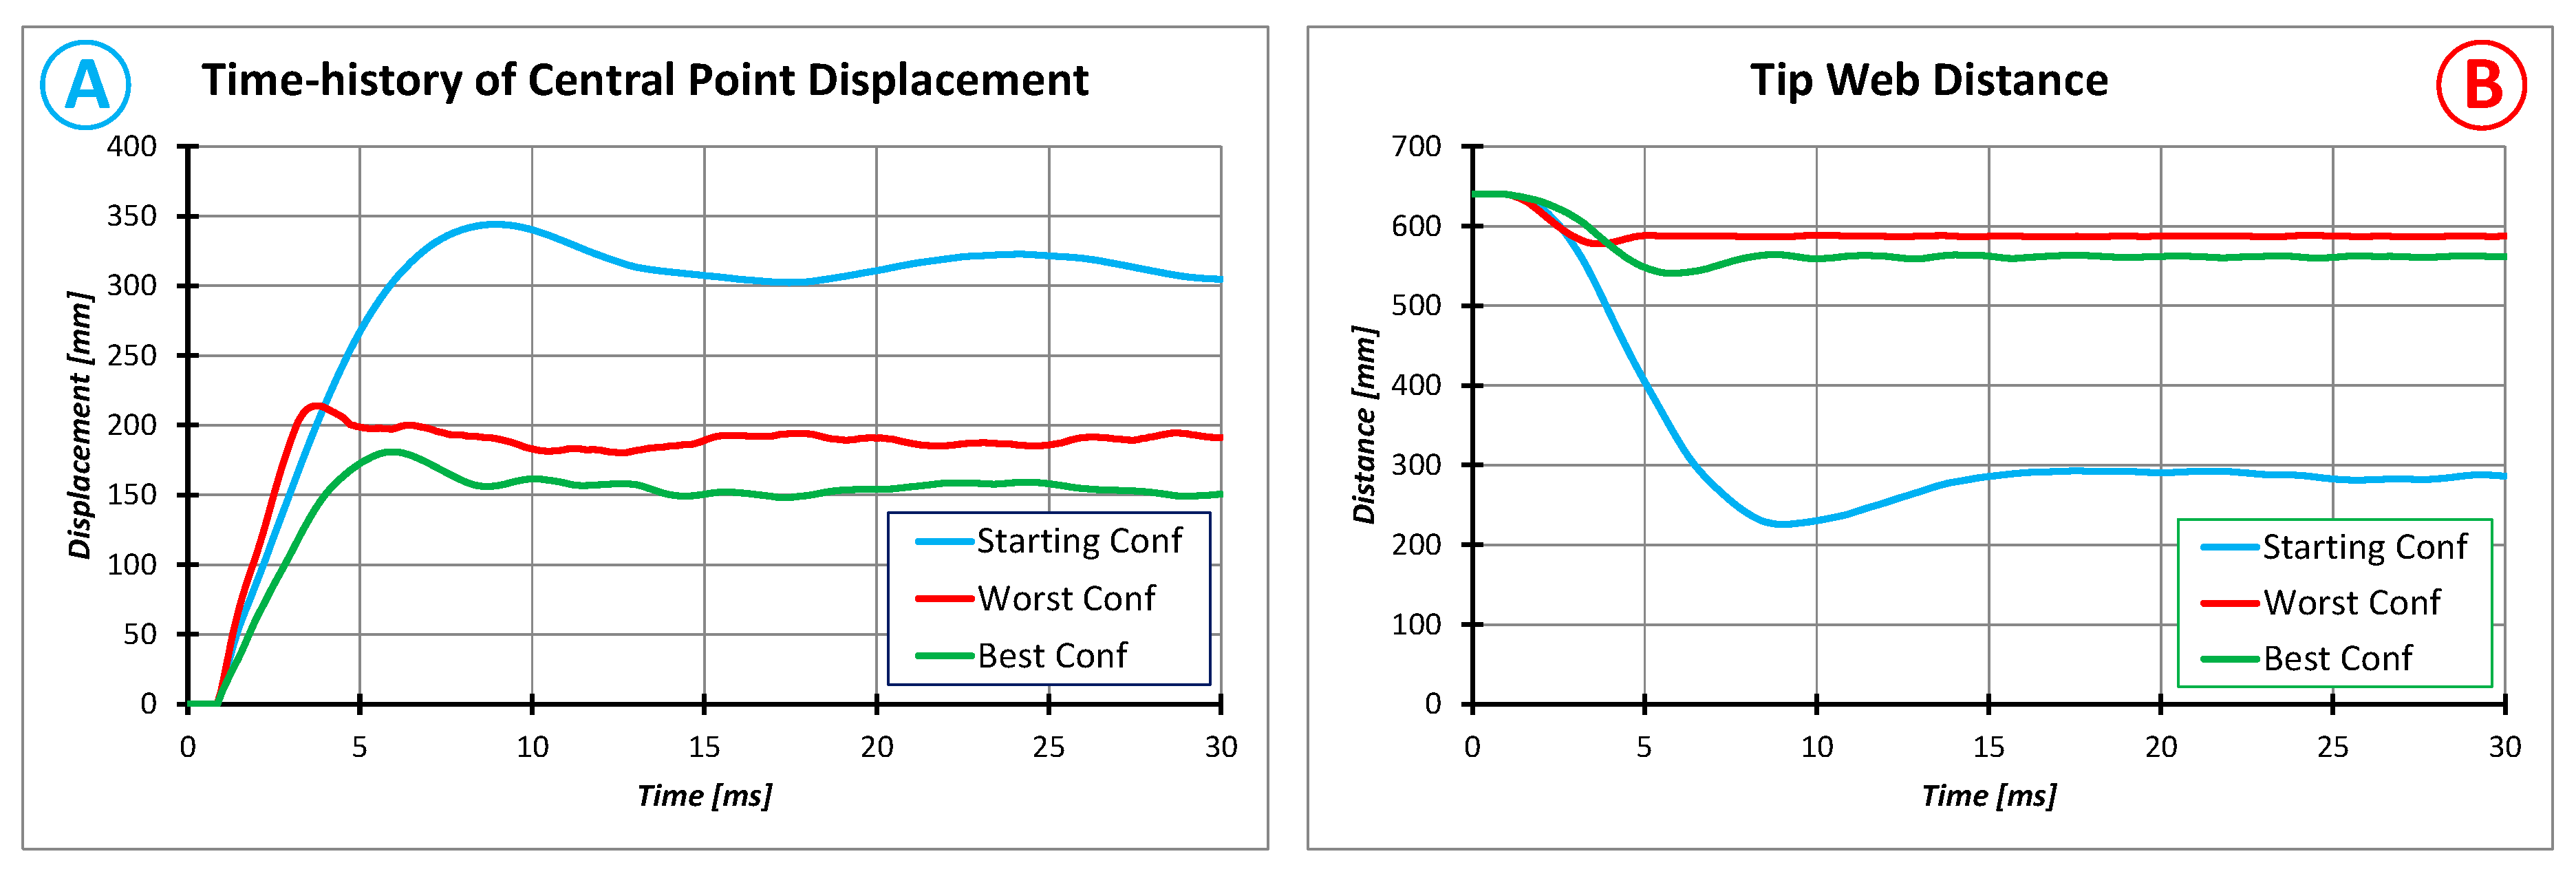
Figure 6 reports the numerical time-history of the principal data related to structural response, i.e., the skin apex displacement and the tip-web distance. Obviously, the distance between the two frame tips can be obtained by subtracting the displacement of each tip from the initial distance (640 mm).
The maximum displacement along the impact direction is about 345 mm and, therefore, less than the maximum distance between the apex of the skin and the hypothetical position of the front spar (370 mm). After the maximum deformation time, the displacement is slightly reduced due to the spring back effect due to the structural elastic recovery. The final value, equal to about 300 mm, is related to the end of the numerical analysis, and therefore it could be slightly different from the value measured on the real test article after the impact. The distance between the two ribs, instead, starts from the maximum value of 640 mm, reaches the value of about 225 mm near the maximum deformation time and then it settles at about 290 mm.
It is worth to notice that failures strongly depend on (and are influenced by) both the deformation and stress states. The accuracy of the latter can be deduced by the good correlation between the measured and predicted reaction forces. For these reasons, the authors assumed that the model could predict the failure with good accuracy.
4. Sensitivity Analysis
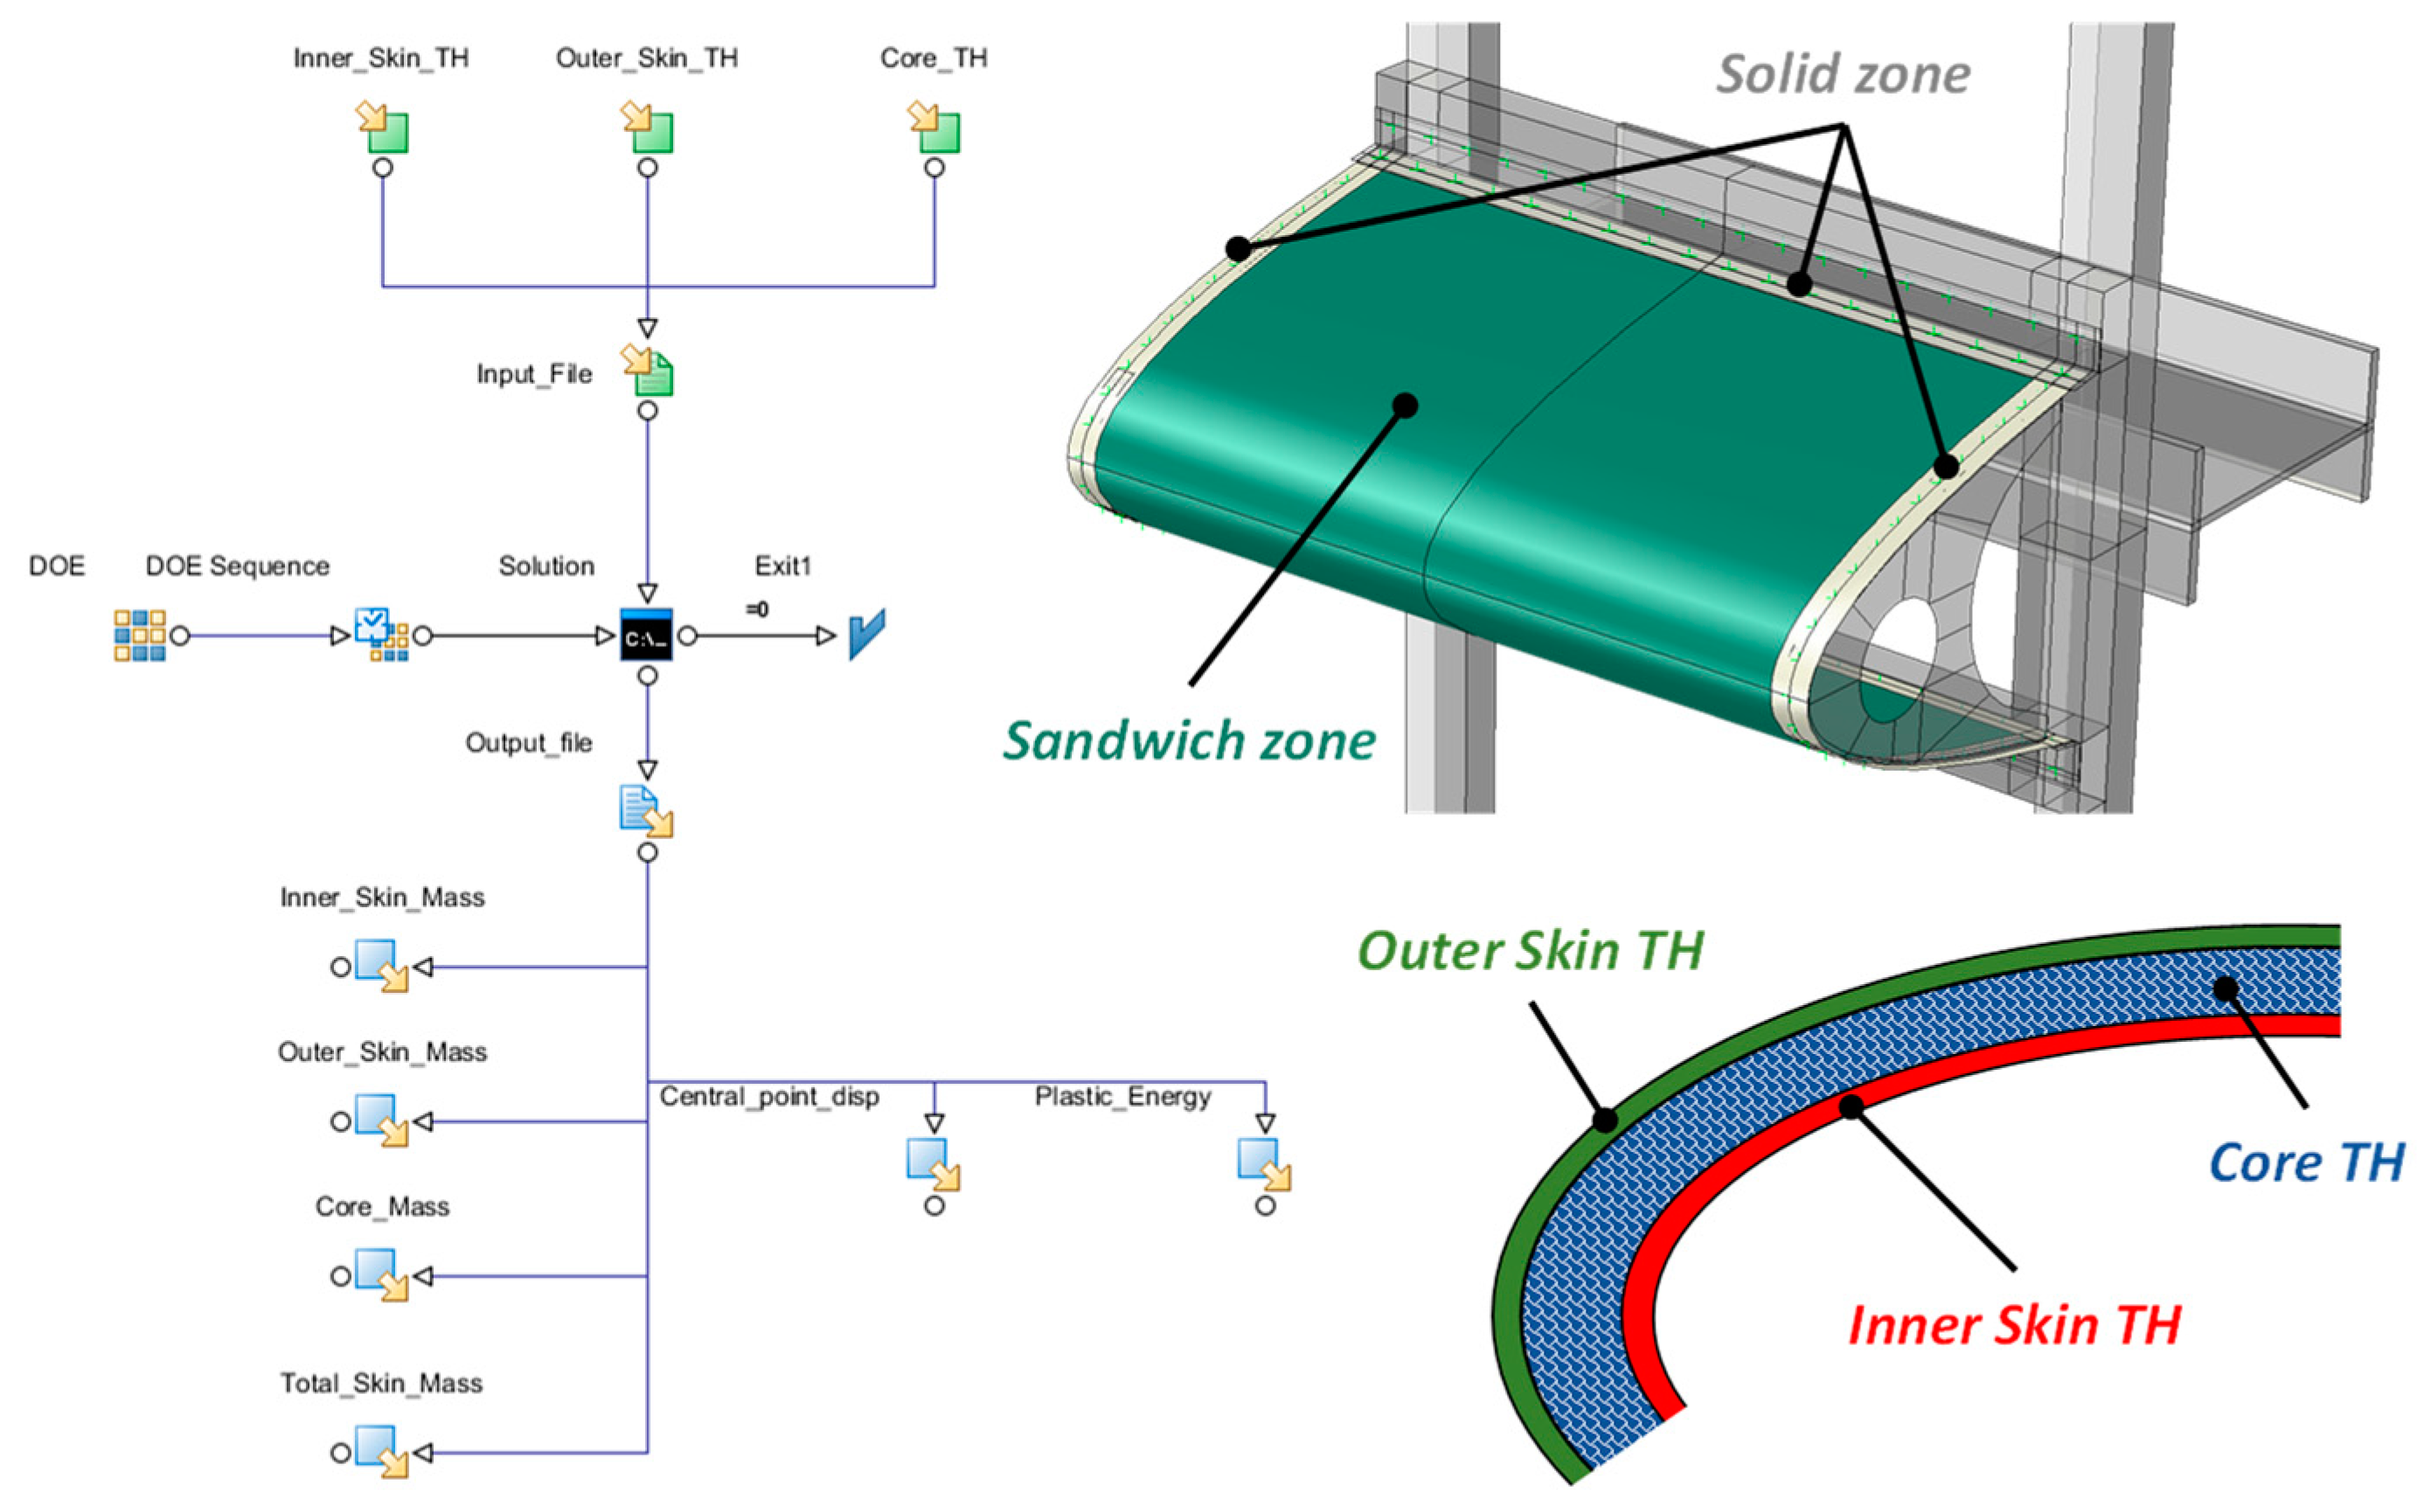
Once the numerical model was validated, a sensitivity analysis was performed in order to assess the influence of the design parameters on the deformation and on the total mass of the structure. A python script was developed to generate, automatically, all geometrical and FE models need for the analysis. Further, in order to efficiently manage all input and output data, the entire process was implemented in the ModeFrontier code. Using the python script allows to rebuild a new model each time and therefore to modify the frame geometry in order to avoid gap or overclosure in the contact zone between the skin and frames that are generated by the skin thickness variations (the outer and inner faces extend themselves into fastened zone too). The workflow of the sensitivity analysis is shown in Figure 7. From the workflow, it is possible to note that no constraint and objective functions were defined since no optimization analysis is required. The high computational cost of such simulations makes it difficult to run a full optimization process, but fruitful considerations can be derived by a cheaper sensitivity analysis that aims to define the trendline and allows to estimate the performance improvement in the function of the same geometrical parameters. It is clear that the boundary conditions applied, derived from the experimental test used as a reference, are quite different with respect to the real ones (e.g., the neighboring parts are missing). Nevertheless, the results reported hereafter can be generalized, applied and scaled to similar structures.
The design parameters of the parametric procedure are the thicknesses of the inner face, of the outer face and of the core of the leading edge, as reported in Table 3. The starting values of the design parameters are shown in bold style. In order to evaluate the influence of each parameter, the last ones were changed one by one, keeping the others constant. Therefore, no full factorial design space was evaluated, but a representative subset that includes the more interesting configurations. The recorded output data were the inner, the outer and the core mass (and thus, the total skin mass), the plastic and the damage energy (for the entire model) and the displacement of the central point of the skin. A configuration is considered acceptable if the crashworthy requirements, defined for the test article, are satisfied, i.e., the maximum displacement (along the impact direction) of the central point of the skin is lower than 370 mm (which is the distance between the inner skin and the front spar) and, obviously, no penetration must occur. The plastic and the damage energies provide global information regarding the capability of the structure to dissipate impact energy both in a no catastrophic and in a catastrophic mode.
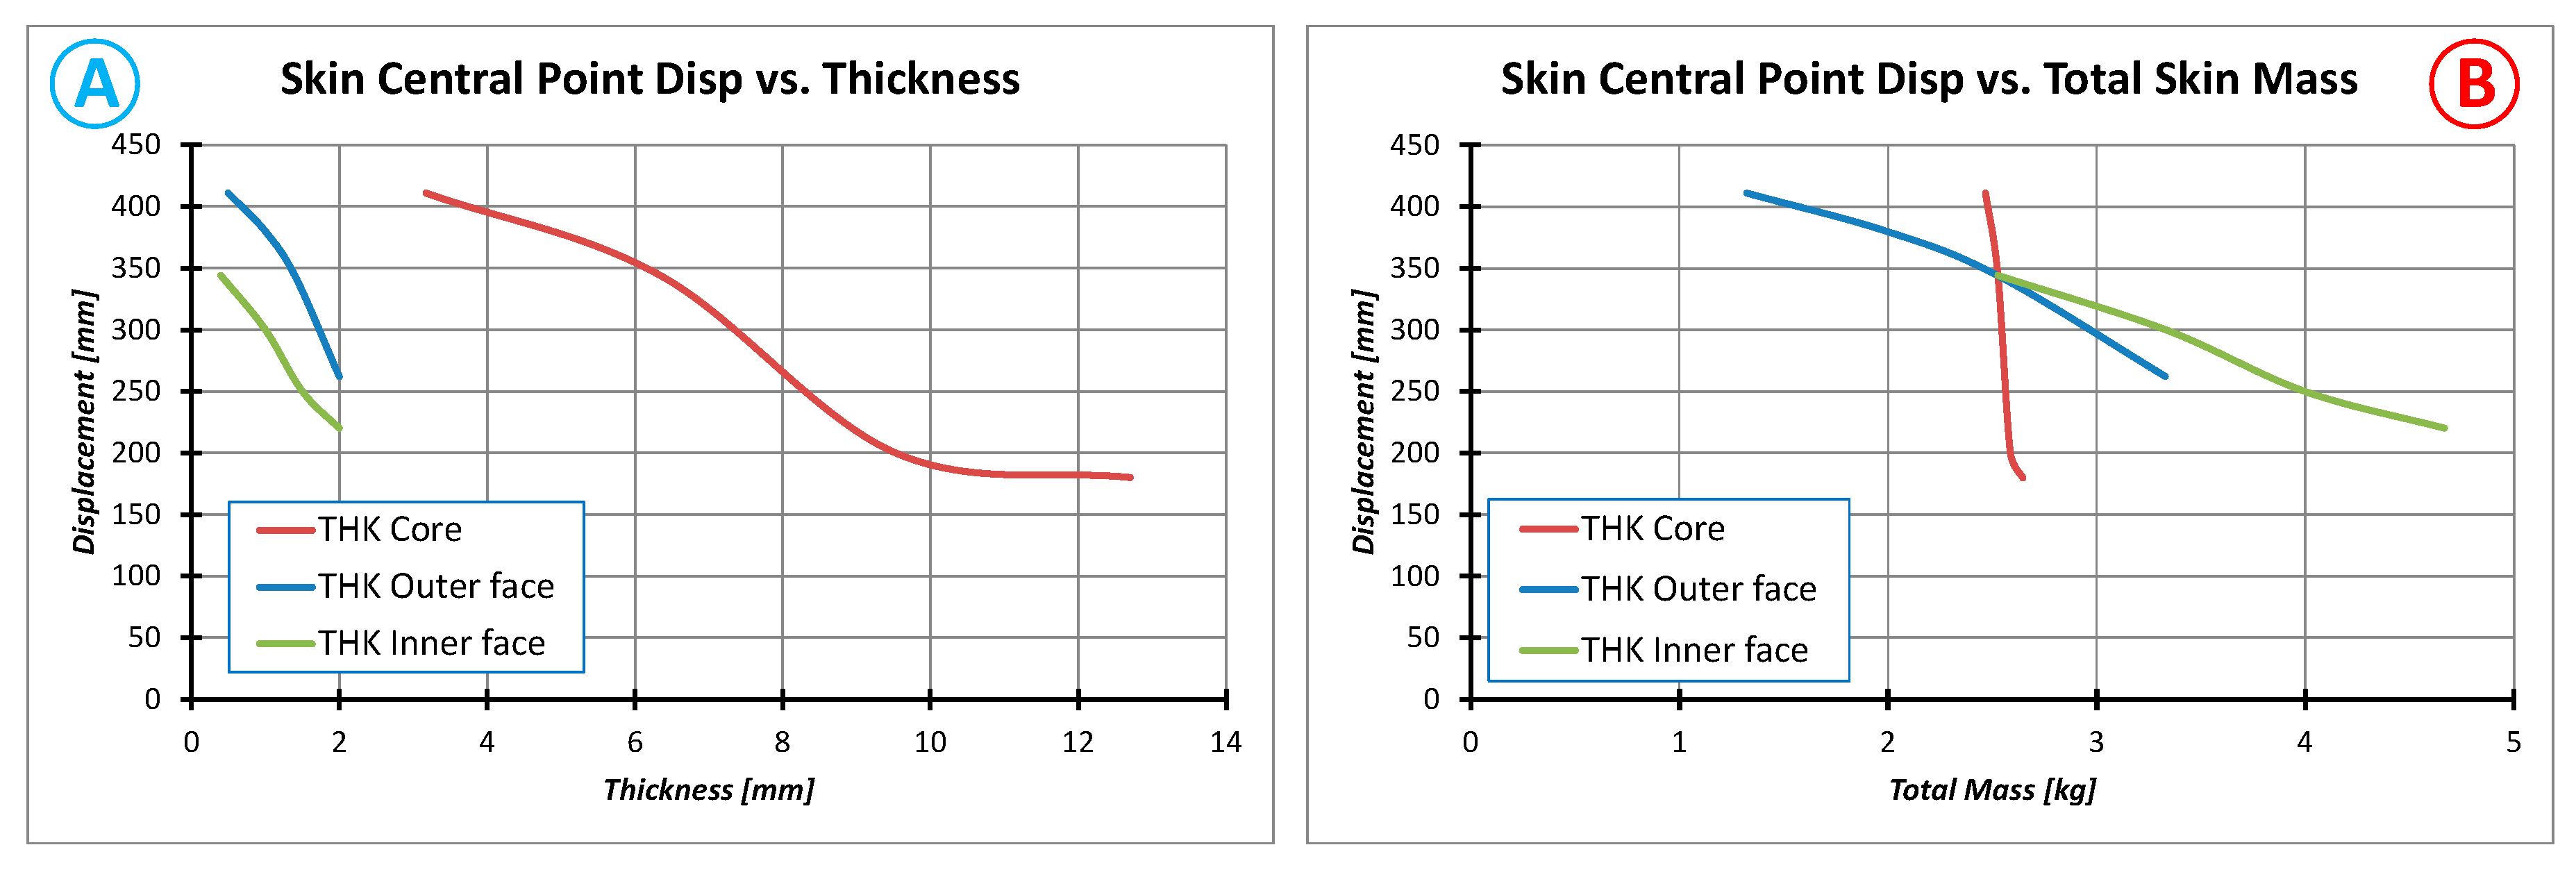
The analyses have demonstrated that an increase of the outer and inner sandwich face thicknesses results in a decrease in the maximum displacement while increasing the total mass. Moreover, it was observed that similar effects are obtained also increasing the honeycomb core thickness; however, the effects in terms of the total mass increase are less relevant with respect to the outer and inner face variation, as shown in Figure 8.
For the sake of clarity, Figure 8 does not report all the obtained results: in particular, the central point displacement as a function of the component thickness and the total mass is reported. For each curve, only one parameter varies, while the other ones are set to their starting values.
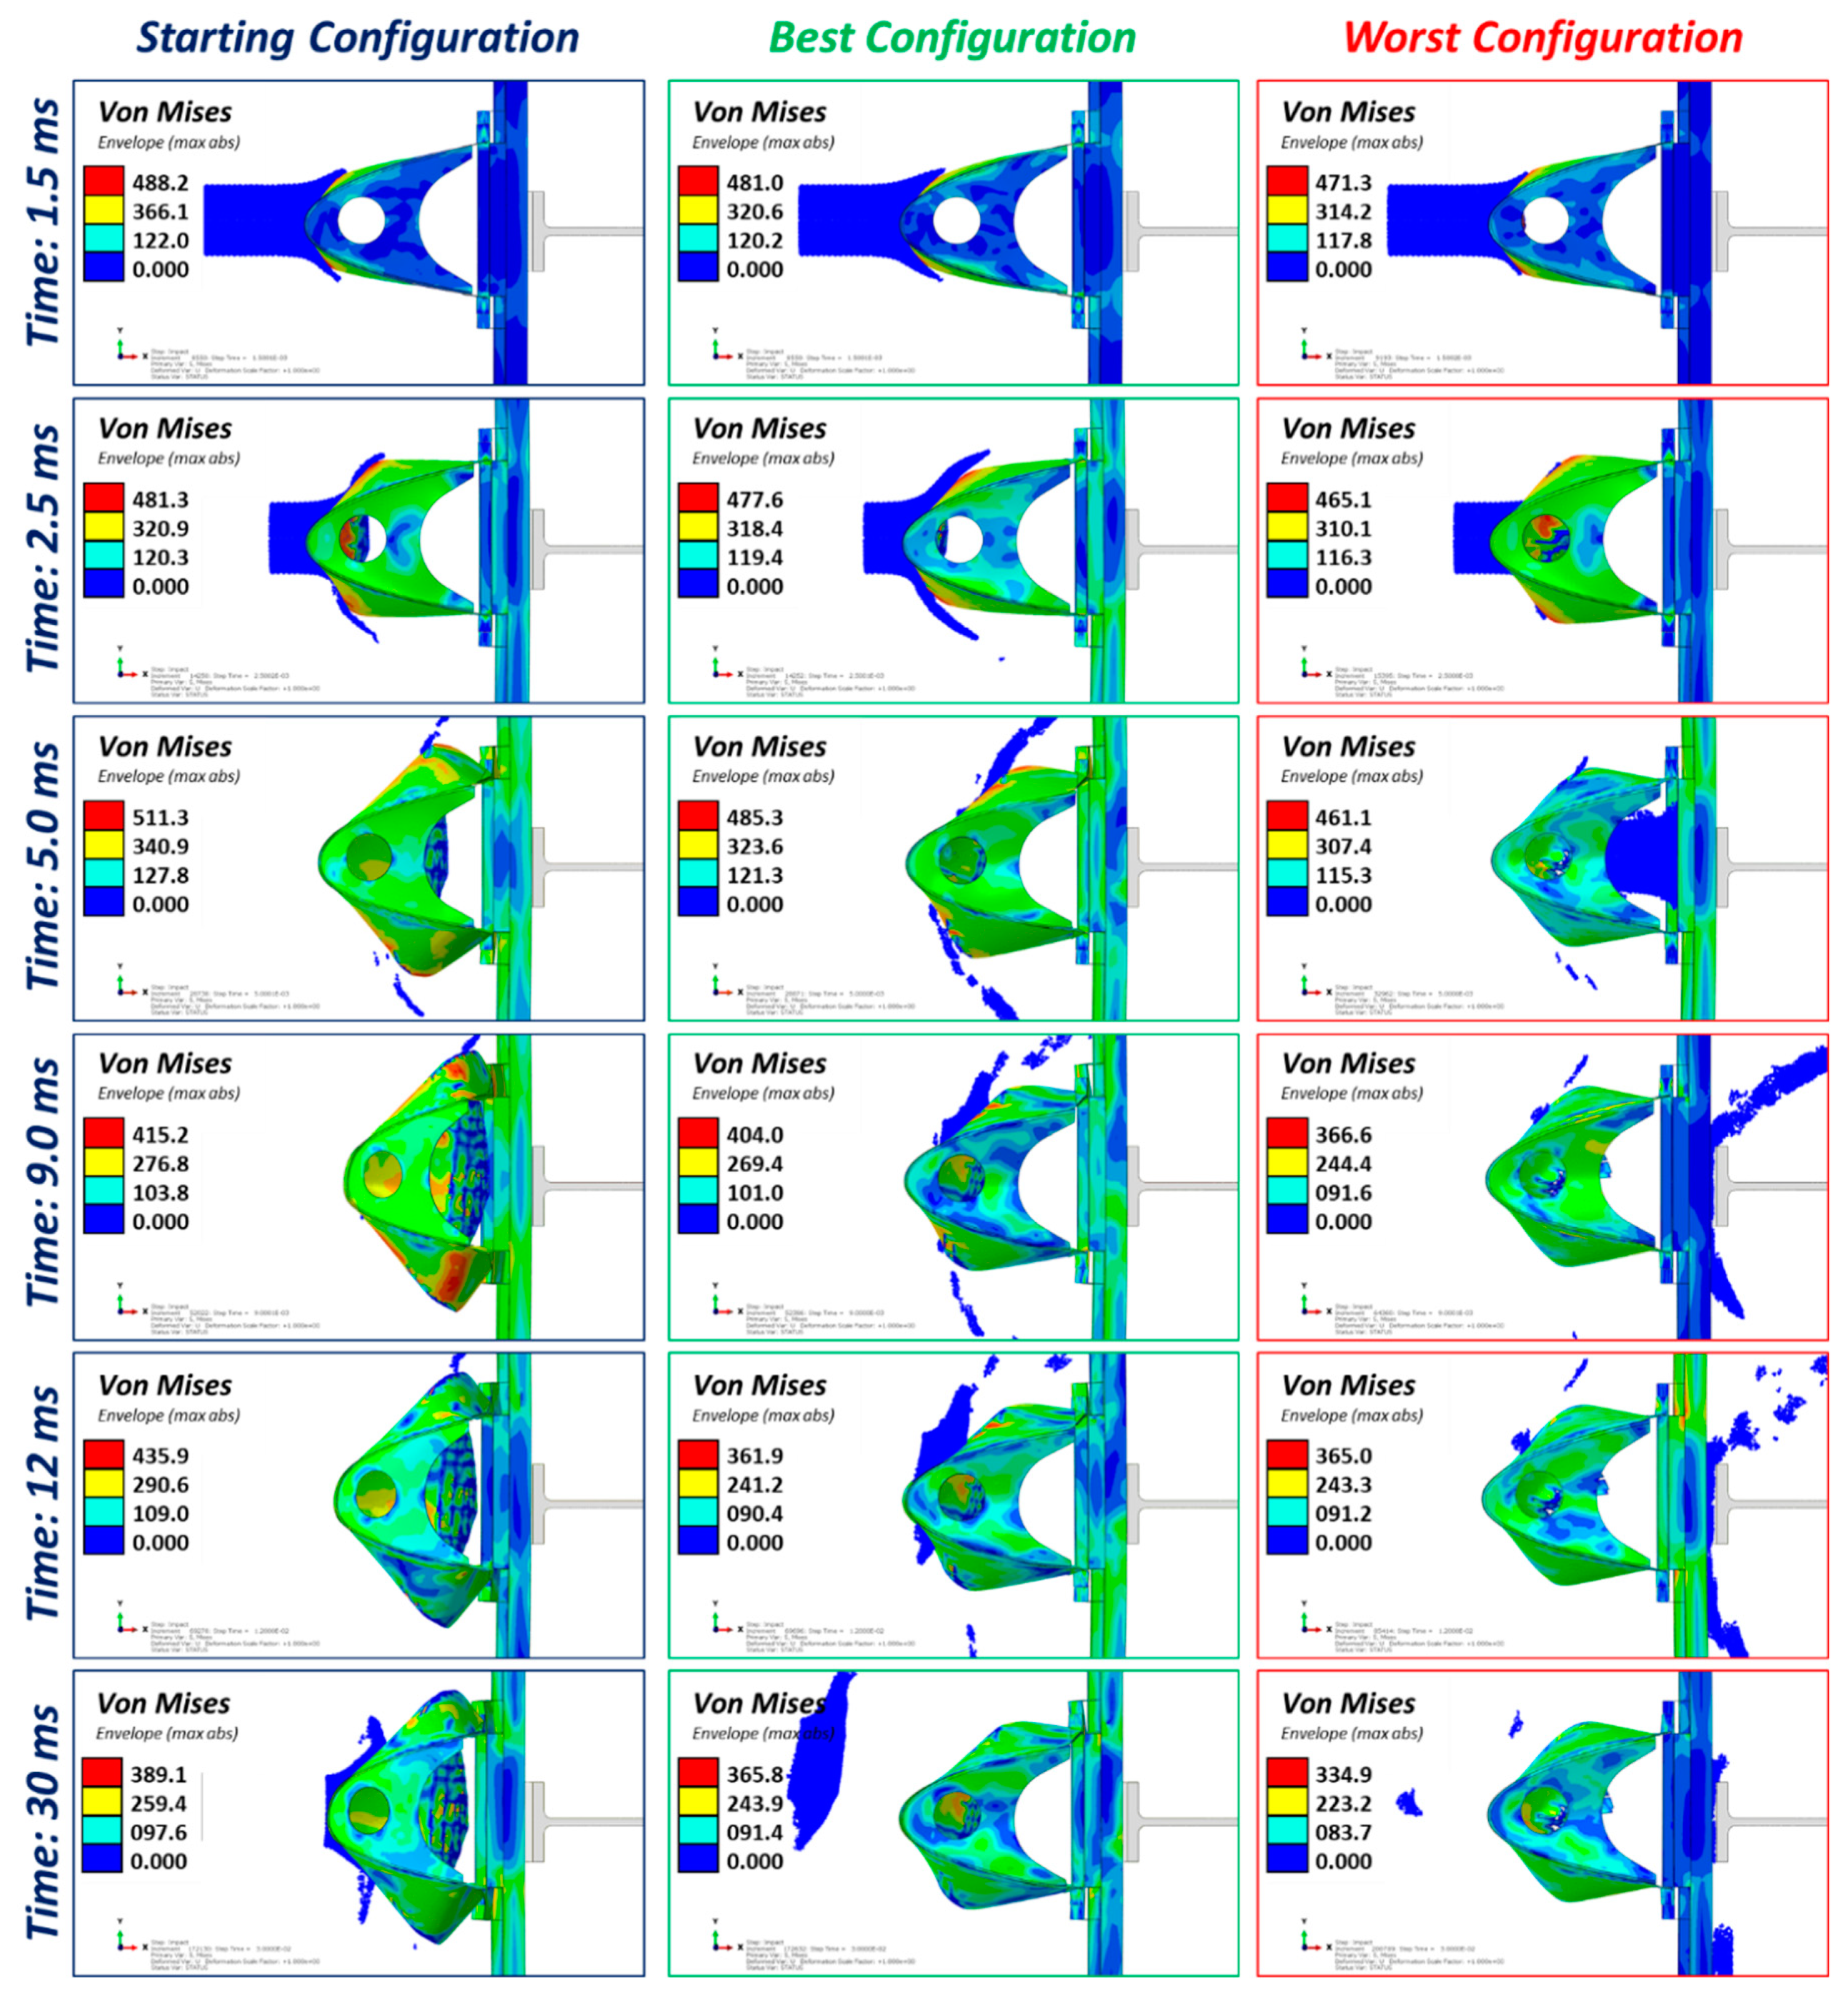
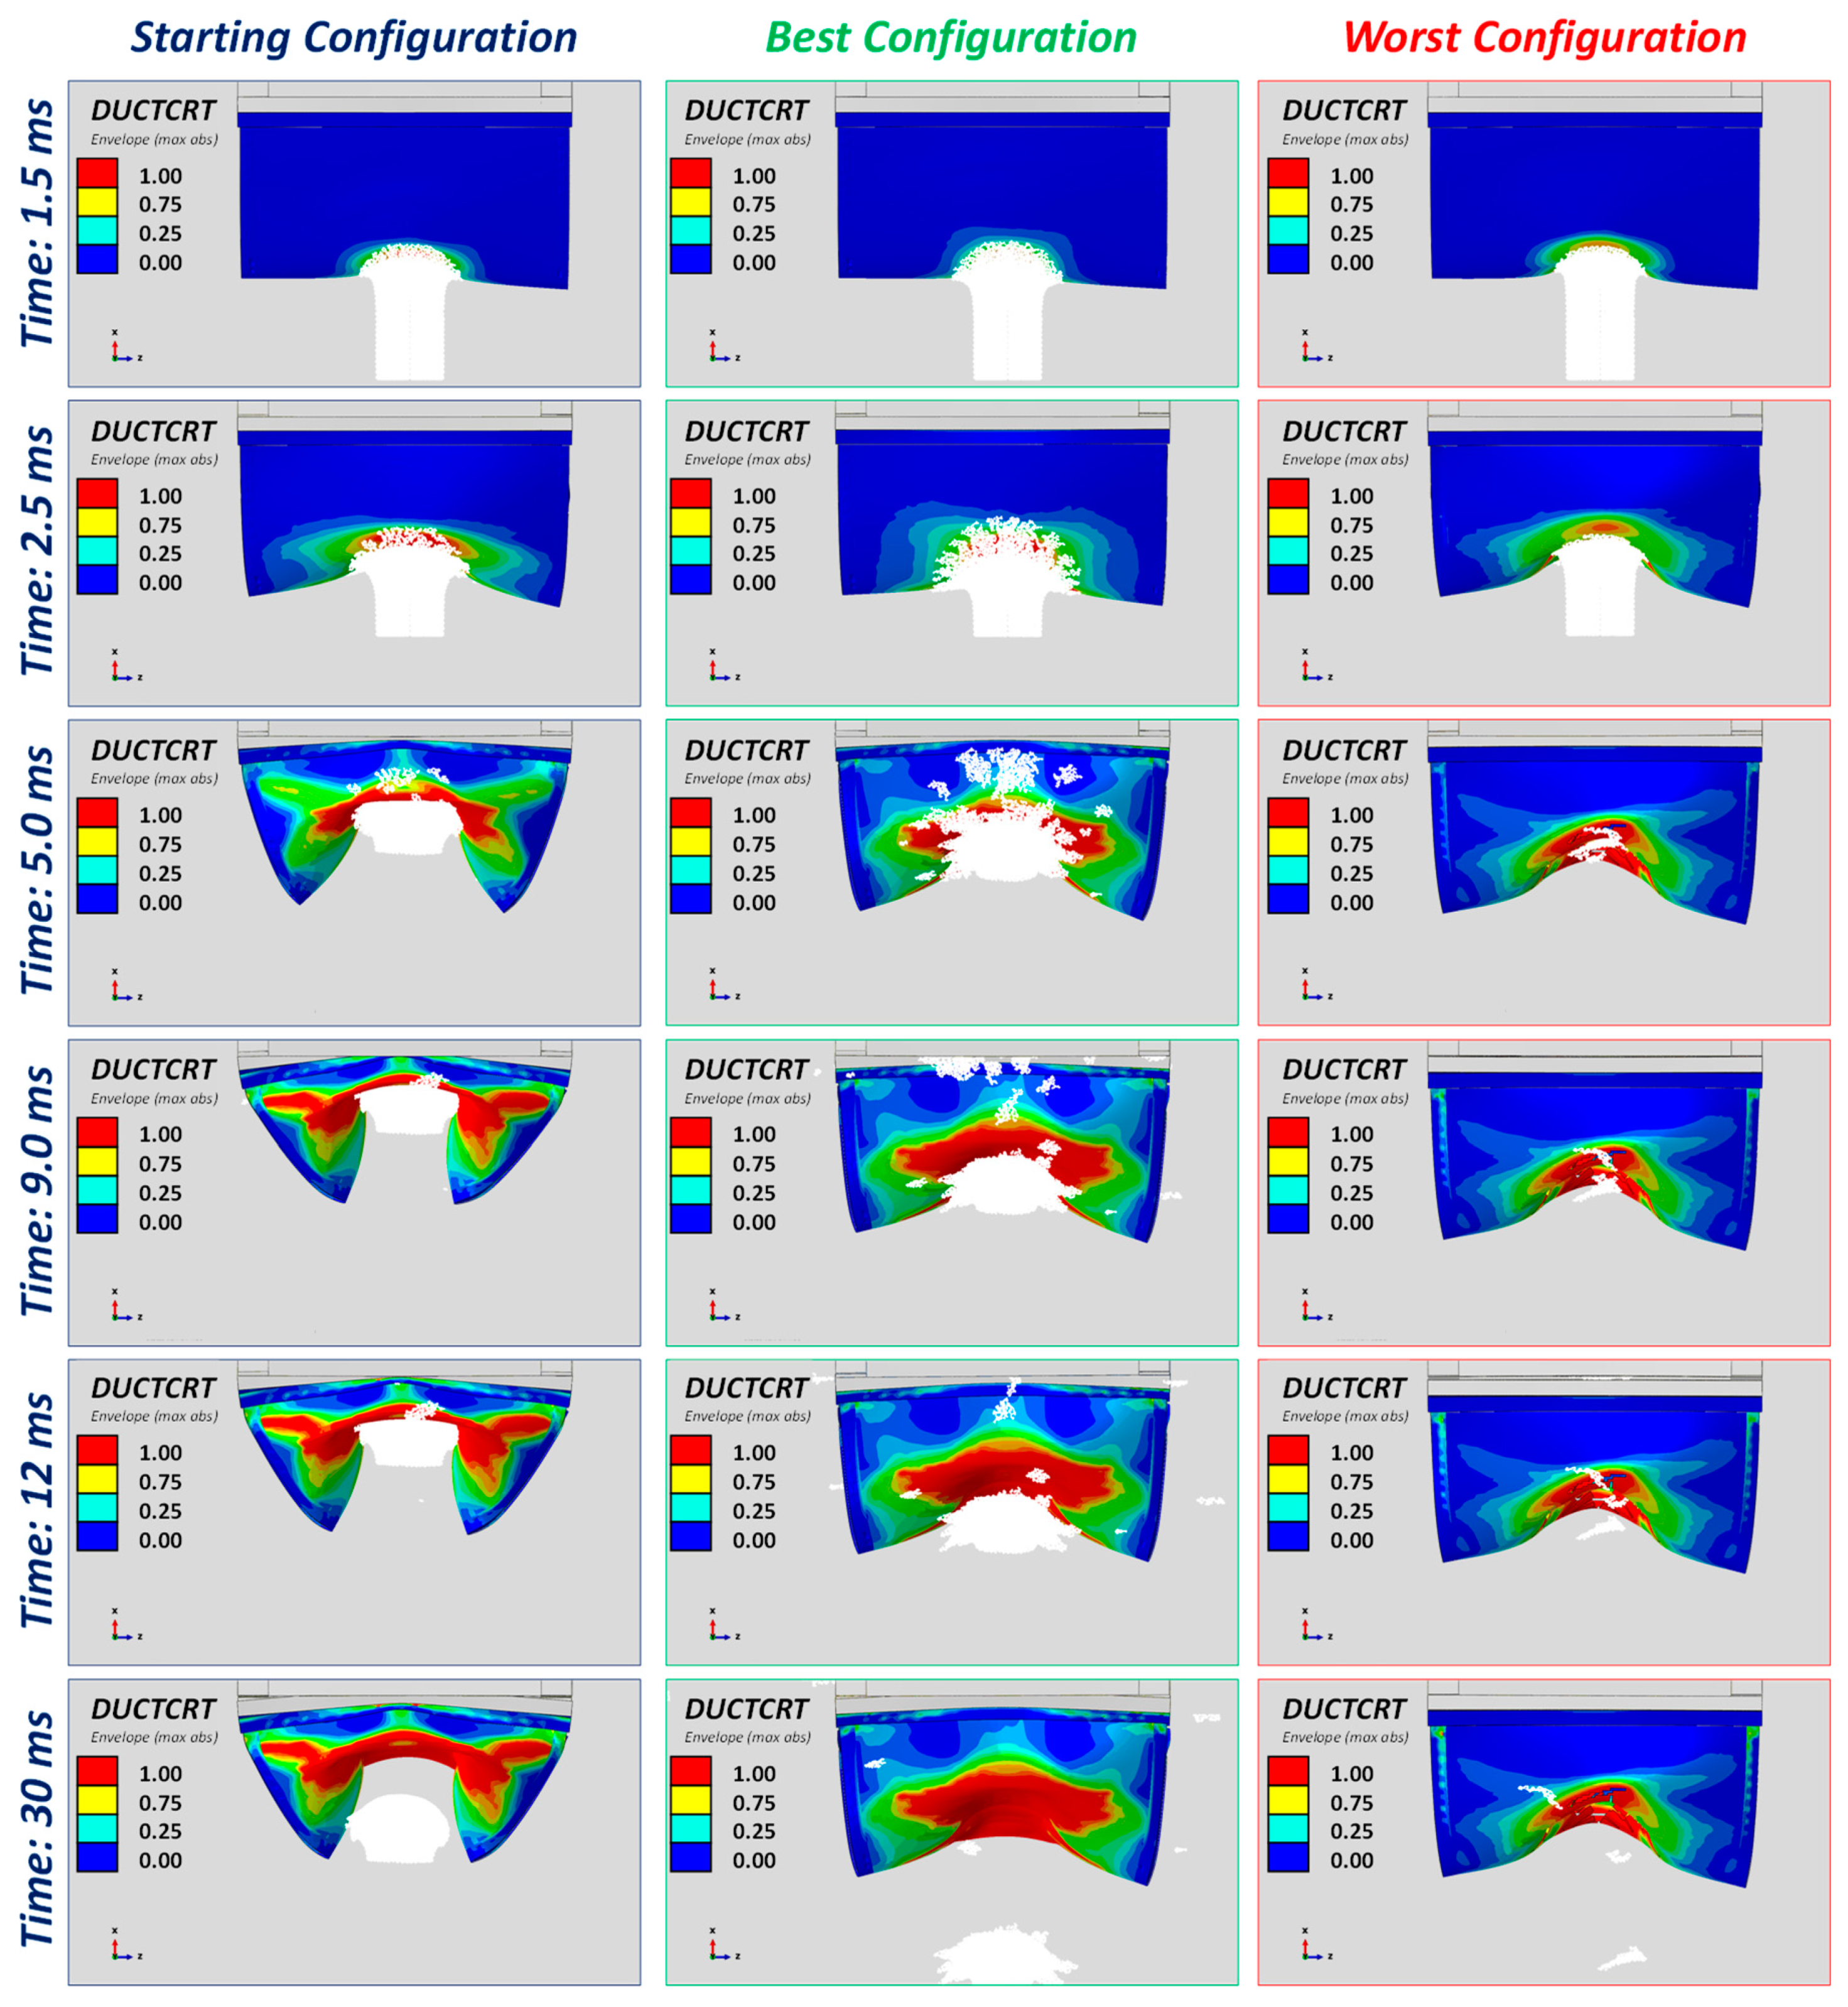
The performance of each configuration was evaluated in terms of both mass and crashworthiness; the latter deduced from the central point displacement and from the energy dissipated in the form of plastic deformation. Hereafter, for the sake of brevity, the comparison is reported considering only three configurations: the starting, the best and the worst one. Table 4 reports the design parameters for each of them, while Figure 9 and Figure 10 show a comparison with respect to global displacement and plastic deformation state (ductile criteria) at several time steps.
As reported in Table 4, the improved solution leads to an increase in structural mass since the core thickness is increased. However, compared to archived performance improvement, discussed below, this small weight increment (+4.7%) can be considered acceptable.
Figure 9 and Figure 10 highlight the effect of changing the skin parameters in terms of the thickness of the main components. The best configuration has an improved capability to dissipate the impact energy, and in particular, it is able to better redistribute the impact energy. In fact, the structure is able to store a greater amount of elastic deformation energy, which can generate the total rebound of the projectile and a greater deformation recovery. Therefore, the structure, when the impact is over, exhibits a smaller deformation state. The increase in global stiffness can be appreciated by comparing the deformation shape at the same time step. In fact, between 9 and 12 ms, the best solution has already rejected the bird, while in the starting configuration, this phenomenon occurs well beyond 12 ms.
The worst configuration, on the other hand, presents a rapid and sudden catastrophic failure in the area close to the impact point. The skin tears itself completely and allows bird penetration. The bullet then finishes its run on the rear beam, totally destroying itself. Therefore, the remaining part of the structure is not able neither to absorb and convert energy nor to deform itself permanently. In fact, the distance between the ribs of this configuration is among the largest of the analyzed models.
According to Figure 9 and Figure 10, the starting and the best configurations are both able to absorb the kinetic energy of the bird not experiencing any critical damages. Indeed, in these cases, no bird penetration occurred, and the damages are localized on a wide area of the skin. Compared to the starting configuration, however, the plastic zones are concentrated around the impact area; on the other hand, the skin regions close to the ribs are subject to a smaller plasticization level, and so they are able to recover the deformation state. All that allows for a greater spring-back effect when the main impact event is over. In fact, from the previous images, it is possible to note that in the starting configuration, the plasticization reaches the regions close to the L-beams.
On the other side, the worst configuration experienced penetration, and the damage is characterized by more localized and critical damages, as confirmed by the presence of fully damage elements, which are removed during the analysis, allowing the bird to pass through the structure. The associated plastic state, at the end of the simulation, is more localized with respect to previous cases.
Figure 11 reports the time history of displacement at the skin apex (impact point) and the distance between the external ribs, for starting, worst and best configuration. The starting configuration is subject to the maximum deformation that it is achieved at about 9 ms. After this time step the structure is able to recover, partially, the deformation by elastic spring back. The data related to the worst case are not realistic, since the bird penetrate the skin thus their evolution stop at penetration time step. The best configuration allows to obtain a clear reduction in maximum apex displacement, about 50%, and a more relevant reduction in tip web displacement.
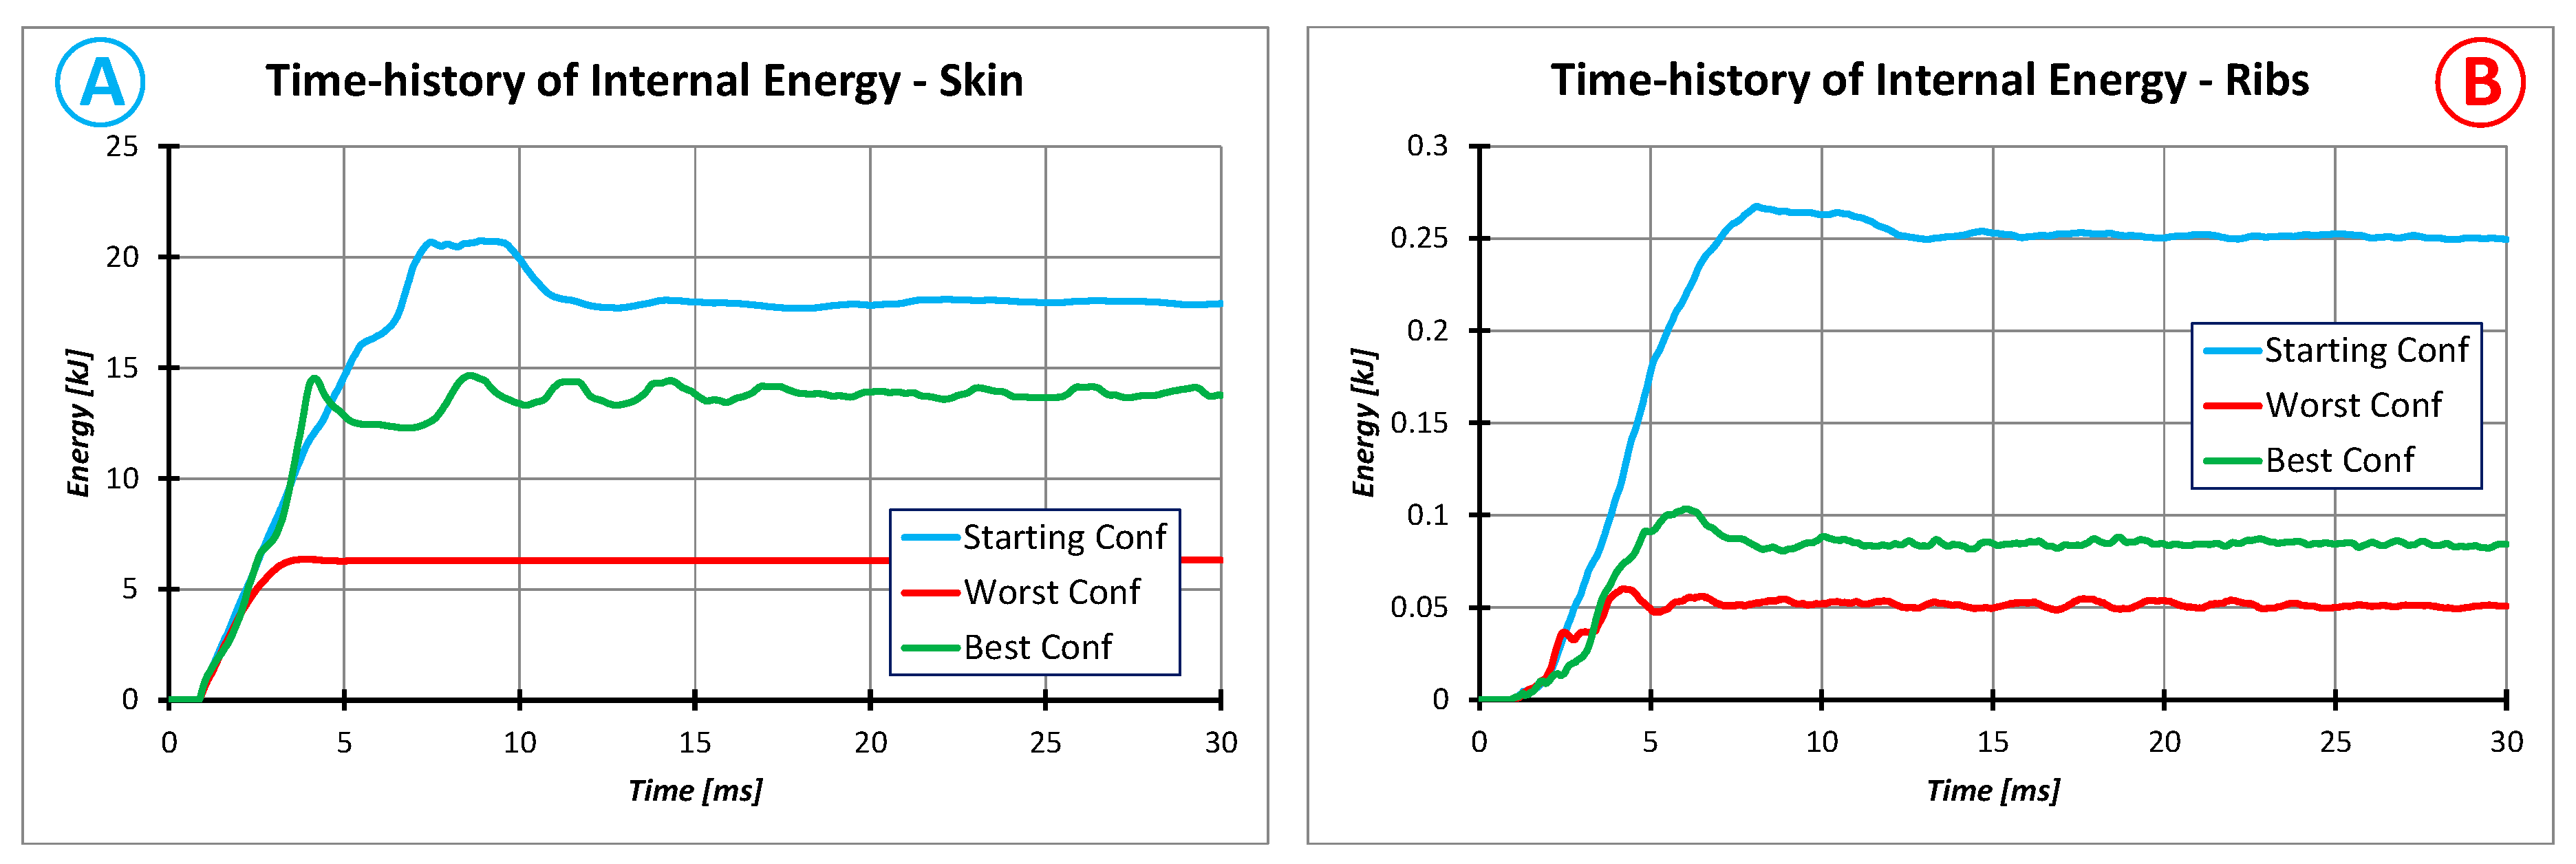
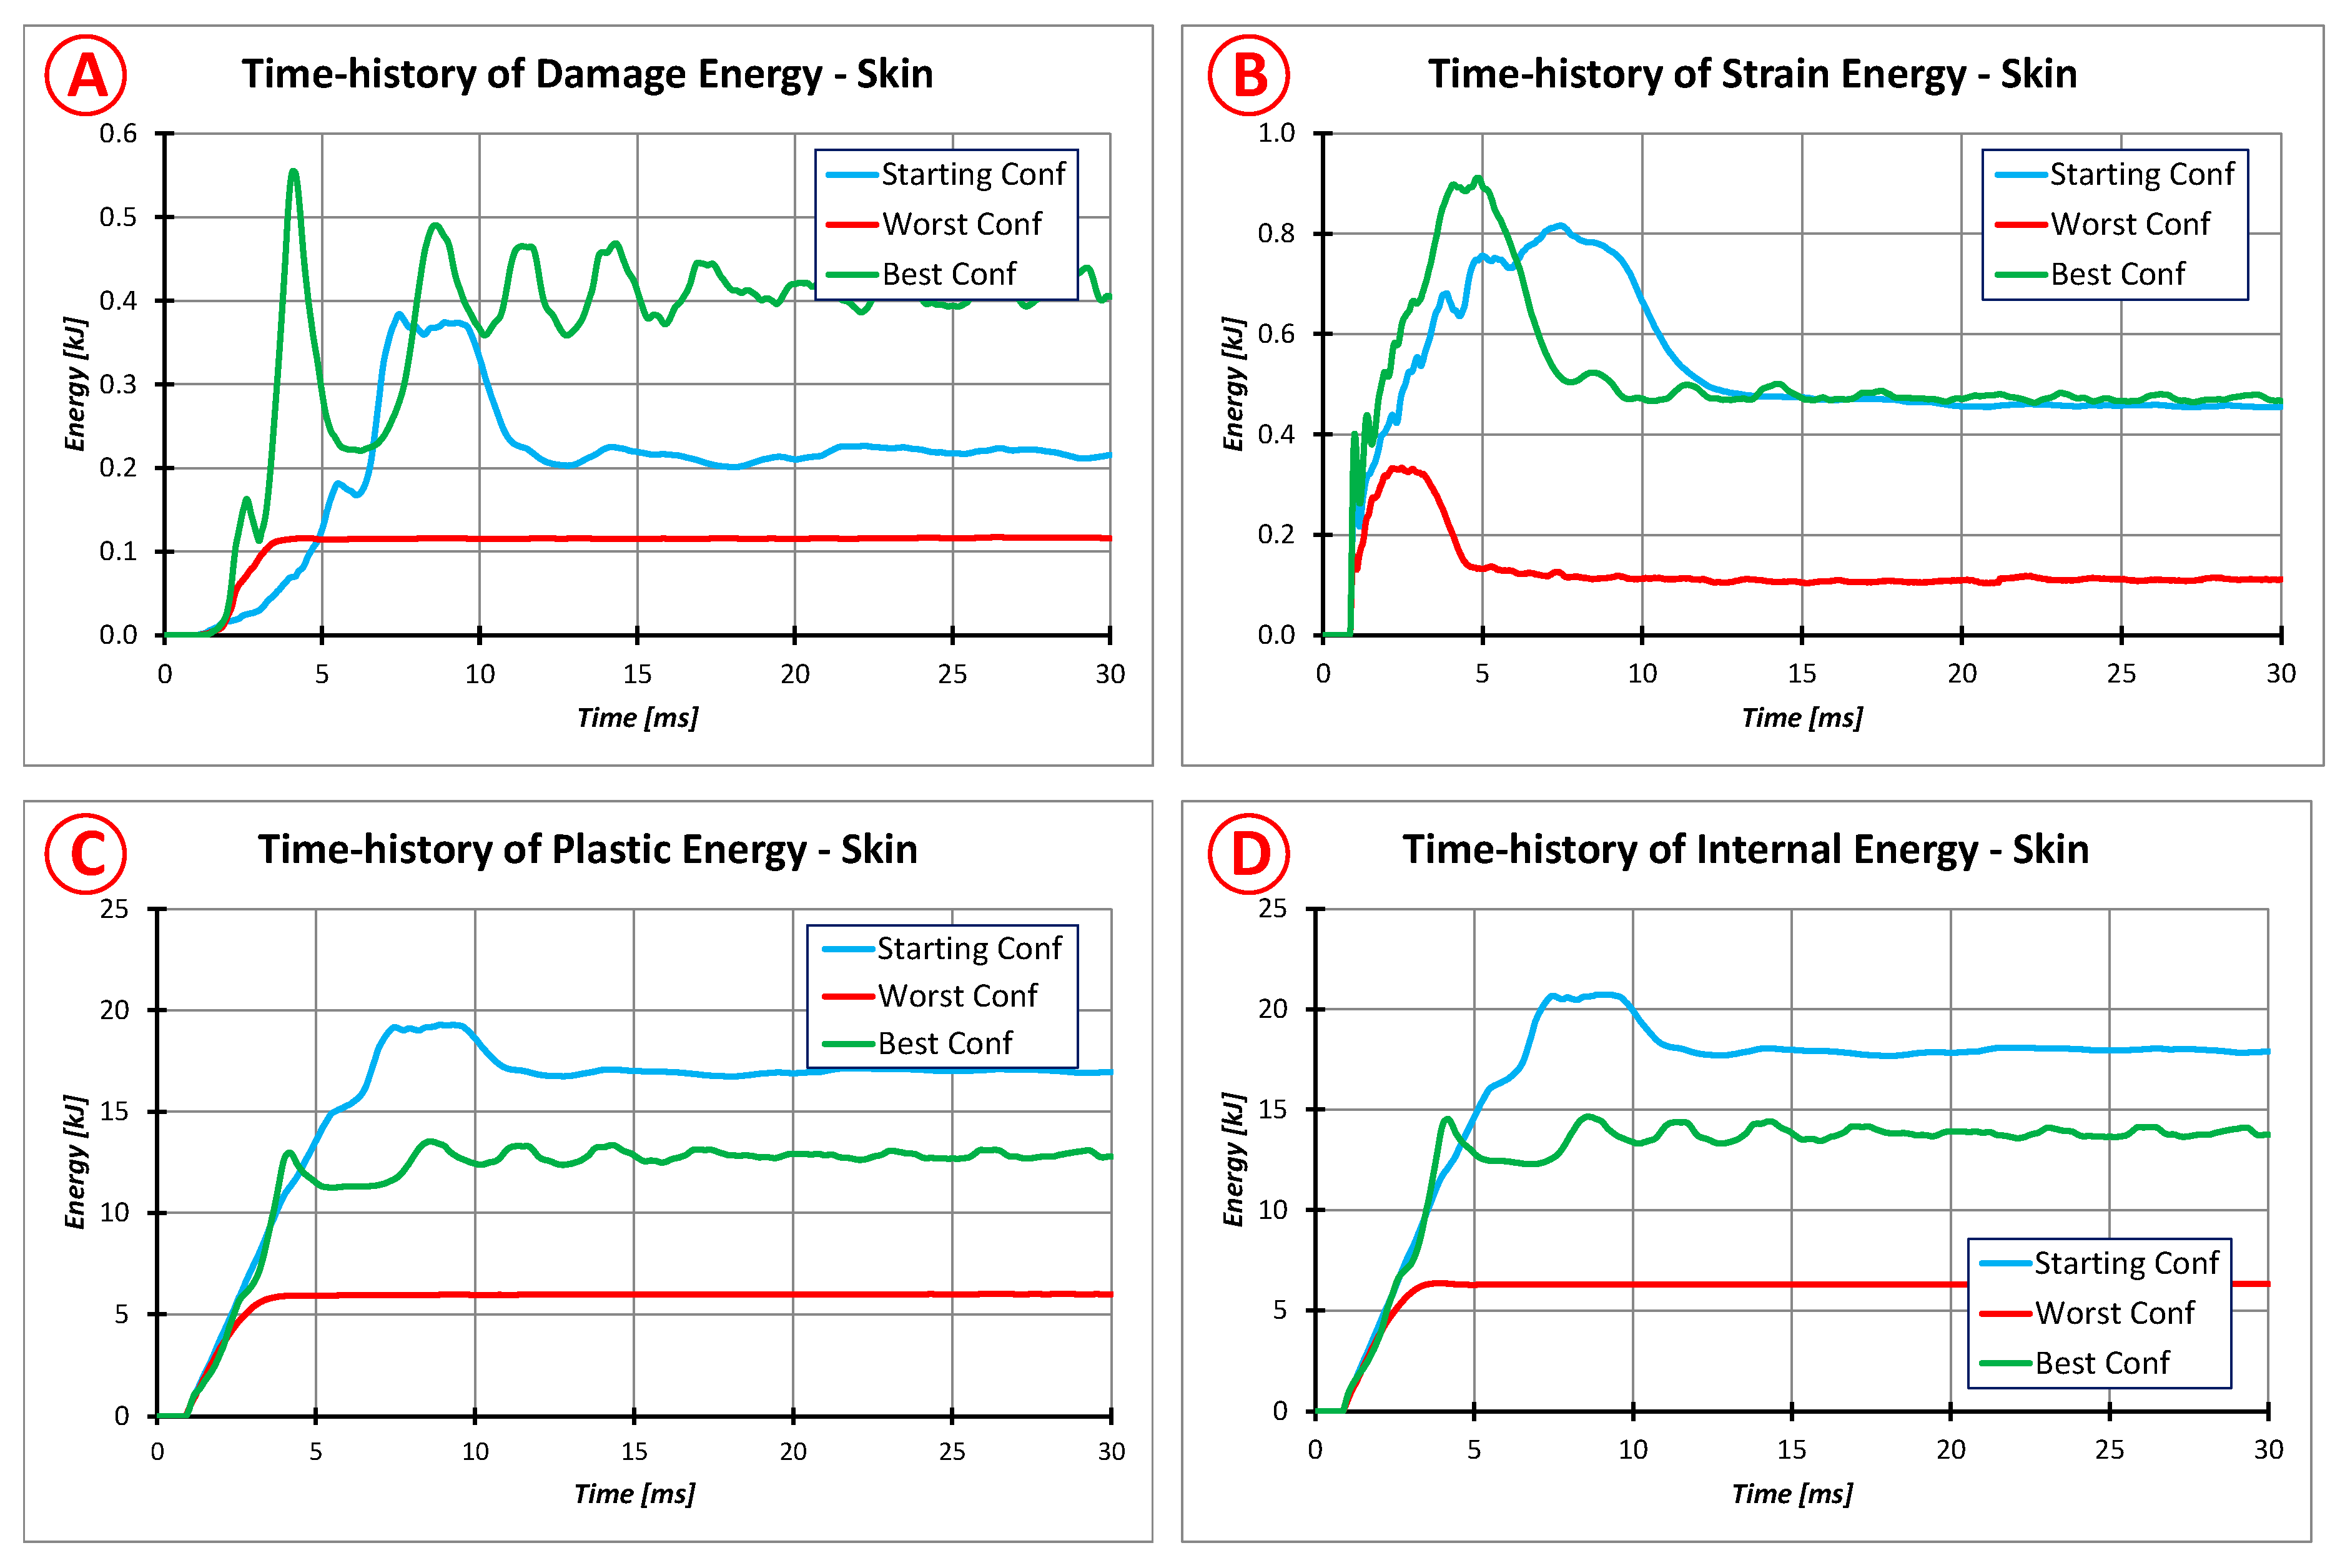
In order to compare the three reported configurations, the time-history of the energy balances are reported, calculated globally and for each part. In particular, in the following, the internal energy (internal energy = energy of elastic deformation + energy of plastic deformation + energy of damage + other minor contributions), the plastic deformation energy, and the damage energy are reported. The evaluation of these results helps to better understand how the configuration change contributes to modify the dissipative forms of energy. Figure 12 shows the internal energy for the two components of the test article, which are the skin and the two ribs. It is clear that the two ribs contribute in a minimal way to the energy dissipation; therefore, the maximum value is about 0.8% of the total energy (about 30 kJ). As the configuration changes, this value decreases and, in particular, assumes the minimum values for the worst configuration. In this case, having a sudden failure and a complete perforation of the projectile, the remaining parts have no capability to withstand large deformations and therefore to dissipate a considerable amount of energy. This highlights that the remaining parts of the test article structure have a negligible influence on overall performance. Comparing the internal energy of the three configurations, it is clear that the starting configuration shows a higher capability to absorb impact energy; therefore, the internal energy is greater than the other two configurations. The best configuration has an internal energy level smaller than the starting configuration, mainly due to the bigger stiffness related to the thicker face. Thus, the plasticized area is smaller than the ones related to the starting configuration, as reported in Figure 13 and Figure 14, too (the plastic energy represents about 90% of the internal energy). This aspect is confirmed in Figure 10, which shows a larger plasticized area in the starting configuration. Moreover, the amount of dissipated energy can be verified by looking at the projectile rebound at the end of the simulation: the smaller is this, the higher is the structure dissipated energy. Obviously, in the worst configuration, no rebound occurs since the projectile totally penetrates the skin.
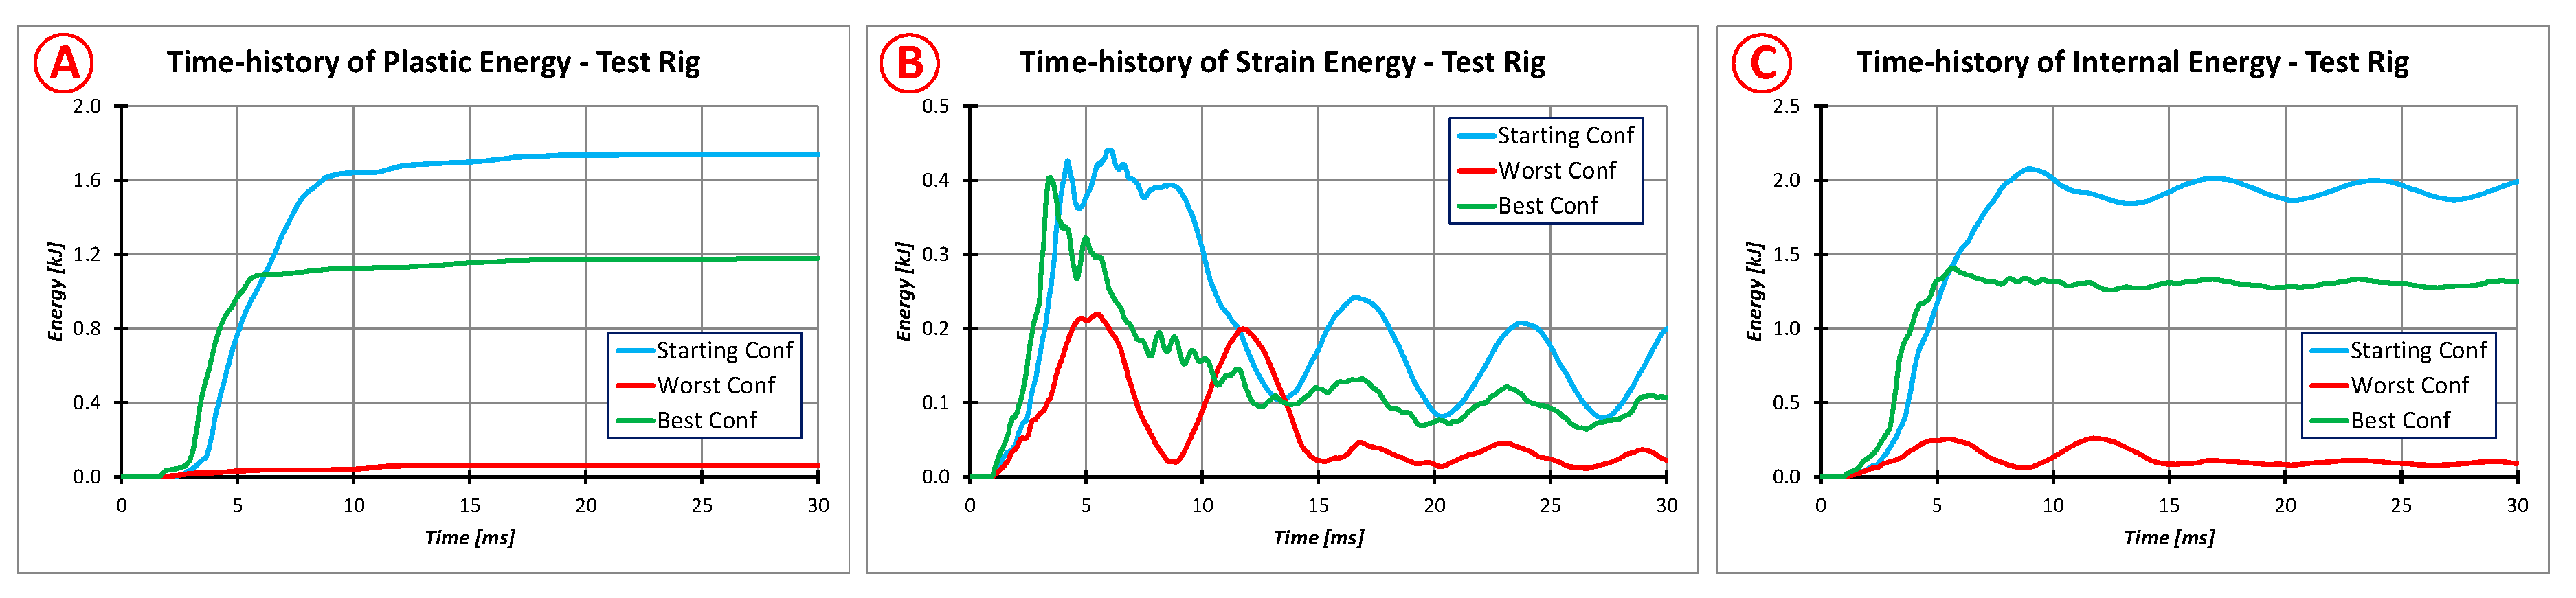
Figure 13 shows the dissipated/absorbed energy of the entire test rig (mainframe, interface fame and upper and lower beam), classified by plastic energy, elastic energy and internal energy. The plastic energy represents the energy dissipated by plasticization, which starts at the yield point and finishes at the strength limit (it is possible to define it as stress or strain value, and it depends on the adopted criteria). After this point, the software starts to calculate the energy dissipated by damage phenomena that are not instantaneous. The damage starts by the strength limit and finishes at the maximum allowed strain (that can be calculated, setting the total strain energy up to total failure) [26,27].
In this case, since no other dissipative phenomena occur, the internal energy of the test rig should be equal to the sum of the plastic and elastic energy. In this case, it can be seen that the test rig absorbs up to 7% of the total energy (starting configuration). Only when a total penetration occurs (wort configuration) the test rig does not have the capability to deform itself and to respond to the impact.
Focusing only on the skin, it can be highlighted that the greatest contribution is provided by the plastic energy (up to 65% of the total energy). In fact, even from Figure 14, it is evident that there are large plasticized areas that have not reached breaking values. Furthermore, in the worst configuration, it can be noted that both the plastic and damage energy reach very low values (despite being the only case with a total failure). This is due to the fact that small areas are subjected to a premature total failure: as a consequence, a higher amount of energy must be absorbed and dissipated by the remaining part of the skin. However, the skin is not able to manage this high amount of energy, resulting in failures. In the configurations without penetrations, on the other hand, the improvement in performance (reduction of the displacement of the skin central point) is obtained by increasing the amount of energy dissipated by plasticization. The other energies, although they have an opposite trend, have a minimal effect on the overall performance as they represent, globally, less than 5% of the total energy. Finally, the graphs show that to avoid skin penetration, it is necessary to maximize the plasticization energy and diversify it in thickness (see also Figure 14).
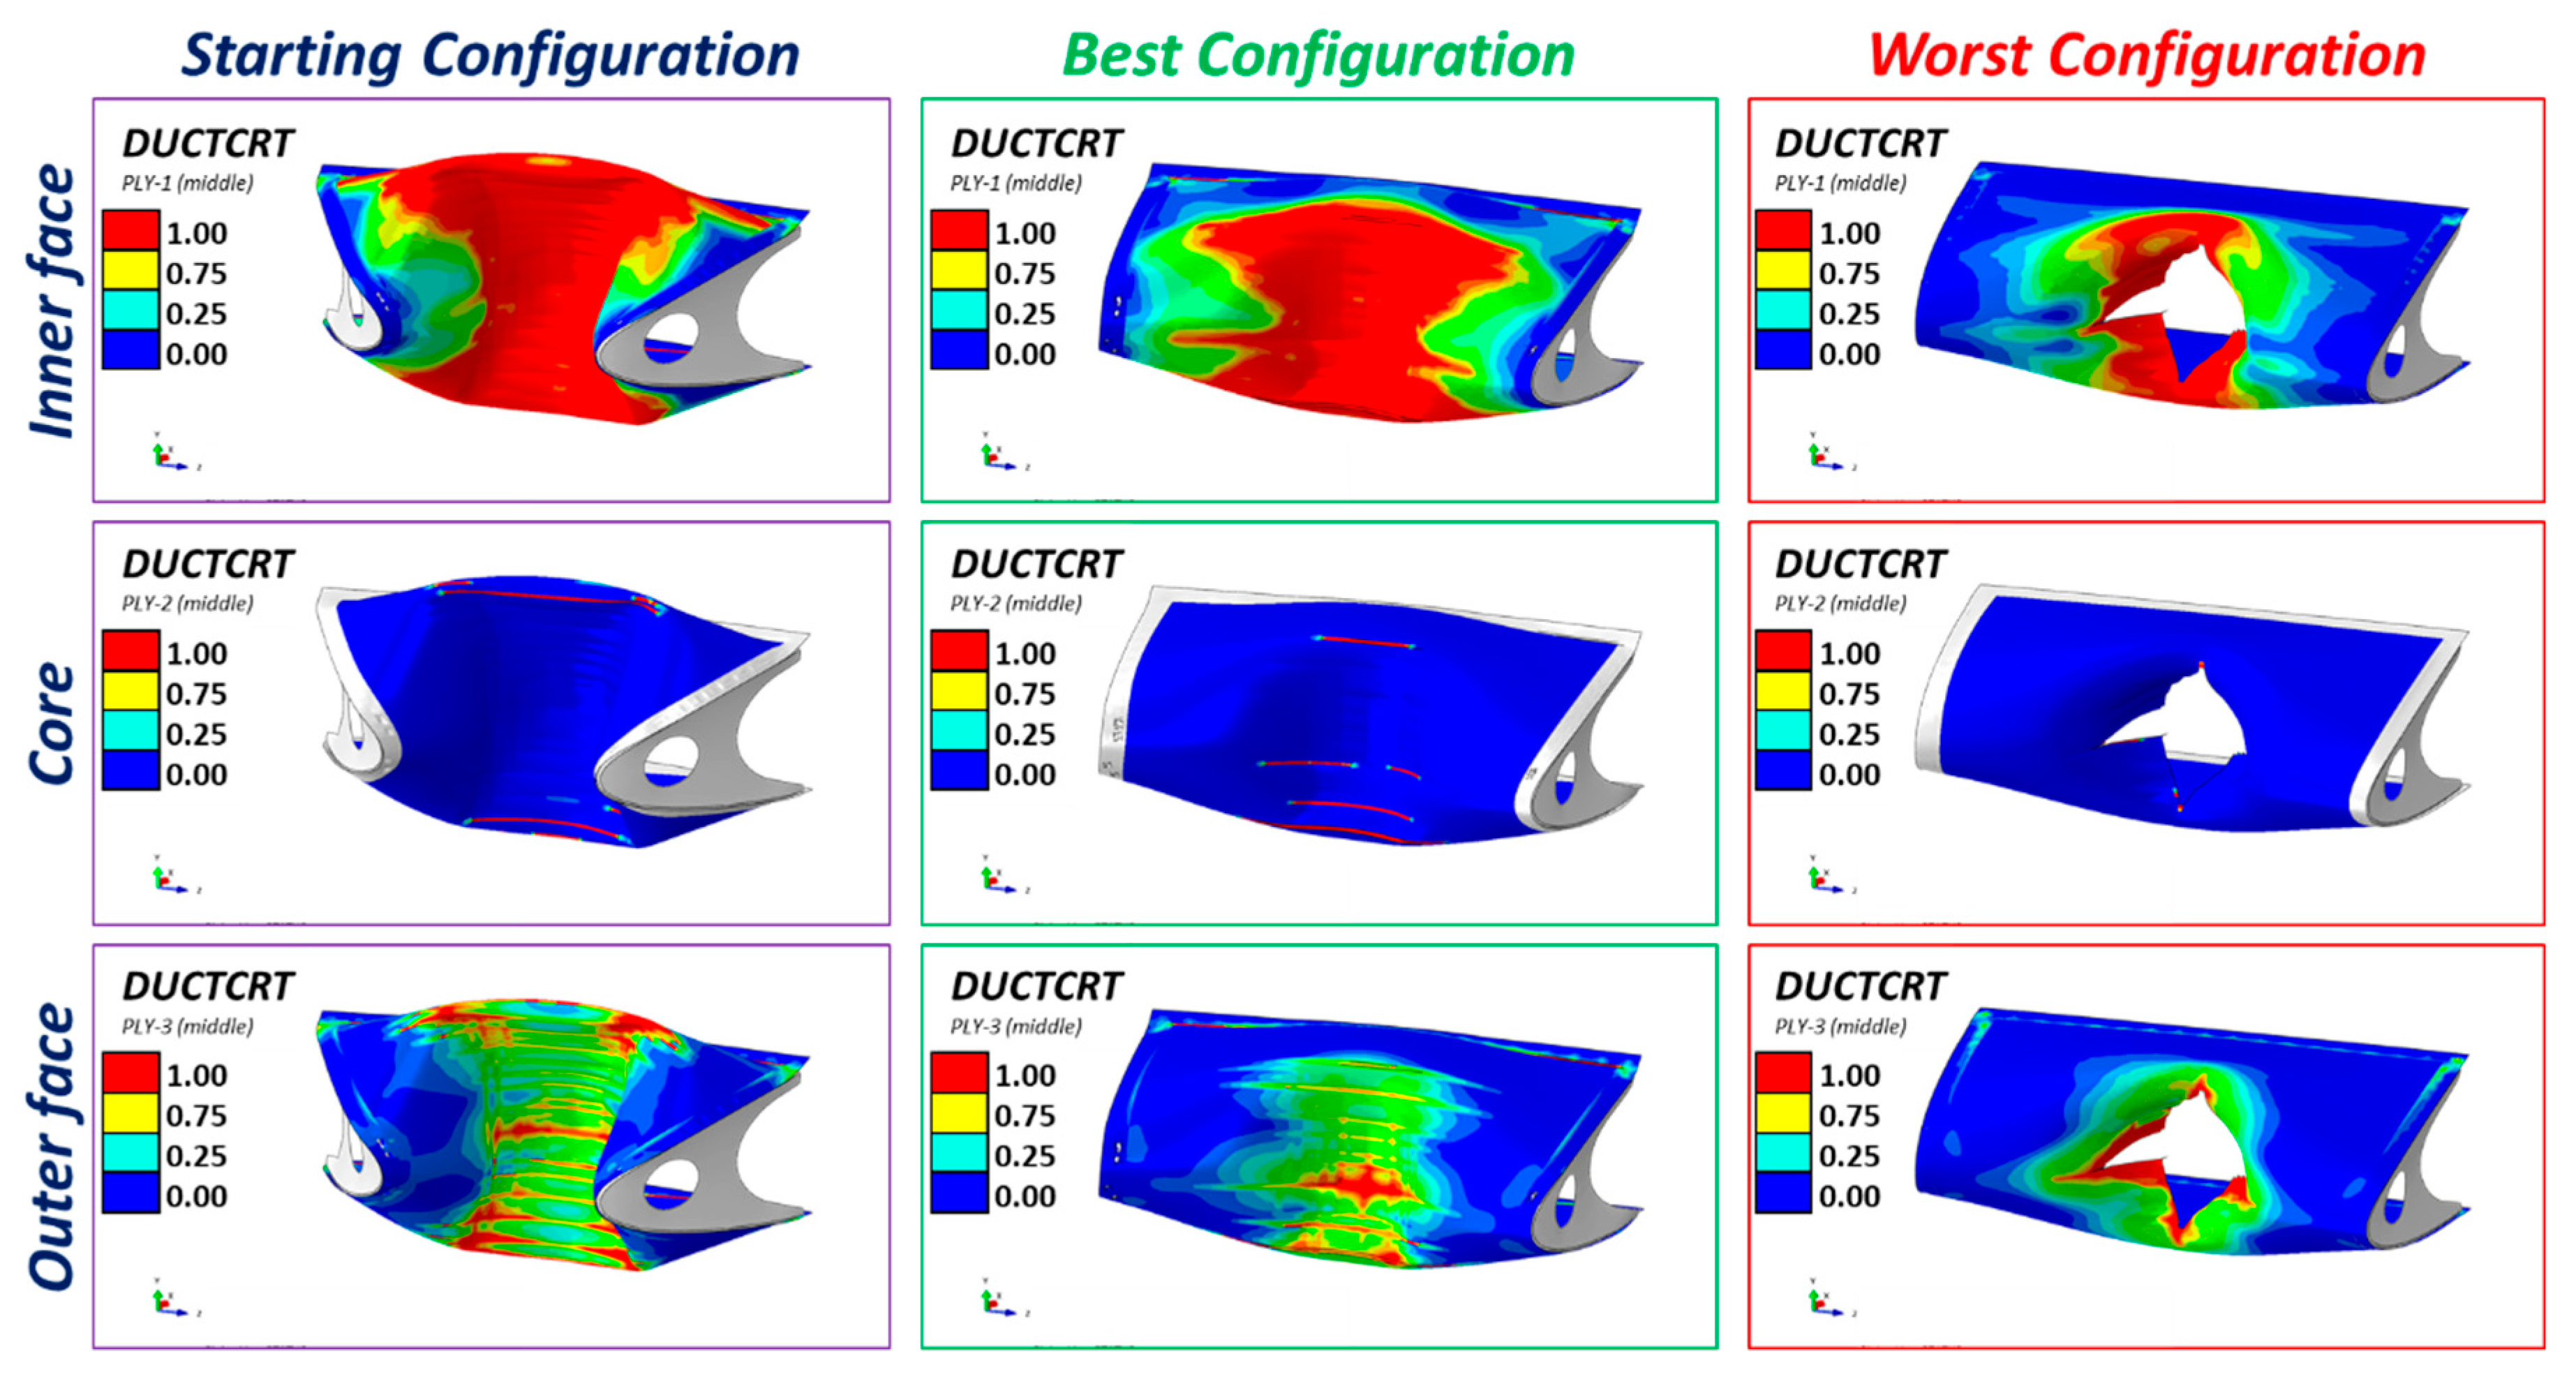
Figure 15 reports the plastic state of all the skin parts (inner face, outer face and core) of the three investigated models at the end of the simulation (time = 30 ms). It is clear that the increase of the core thickness leads to an increase in the stiffness of the skin and, therefore, to a reduction in the maximum deformation and, on the other hand, to a significant reduction in the plasticized area of the inner face. Overall, therefore, the structure has a greater capacity to recover the deformation due to the impact event. The outer face has a plasticization level that is inversely proportional to the thickness of the core. The plasticized areas, in the best configuration, are much more localized around the impact area and therefore, only in this area is there a significant impact footprint. Even for the worst configuration, there is a reduction of the plasticized areas for the inner face. On the other hand, for the outer face and core, these areas are increased (even if in a very localized way), which means that all three components reach the maximum plasticization values and the failure limits in a very restricted zone, thus leading to the total elimination of the element and to the consequent penetration.
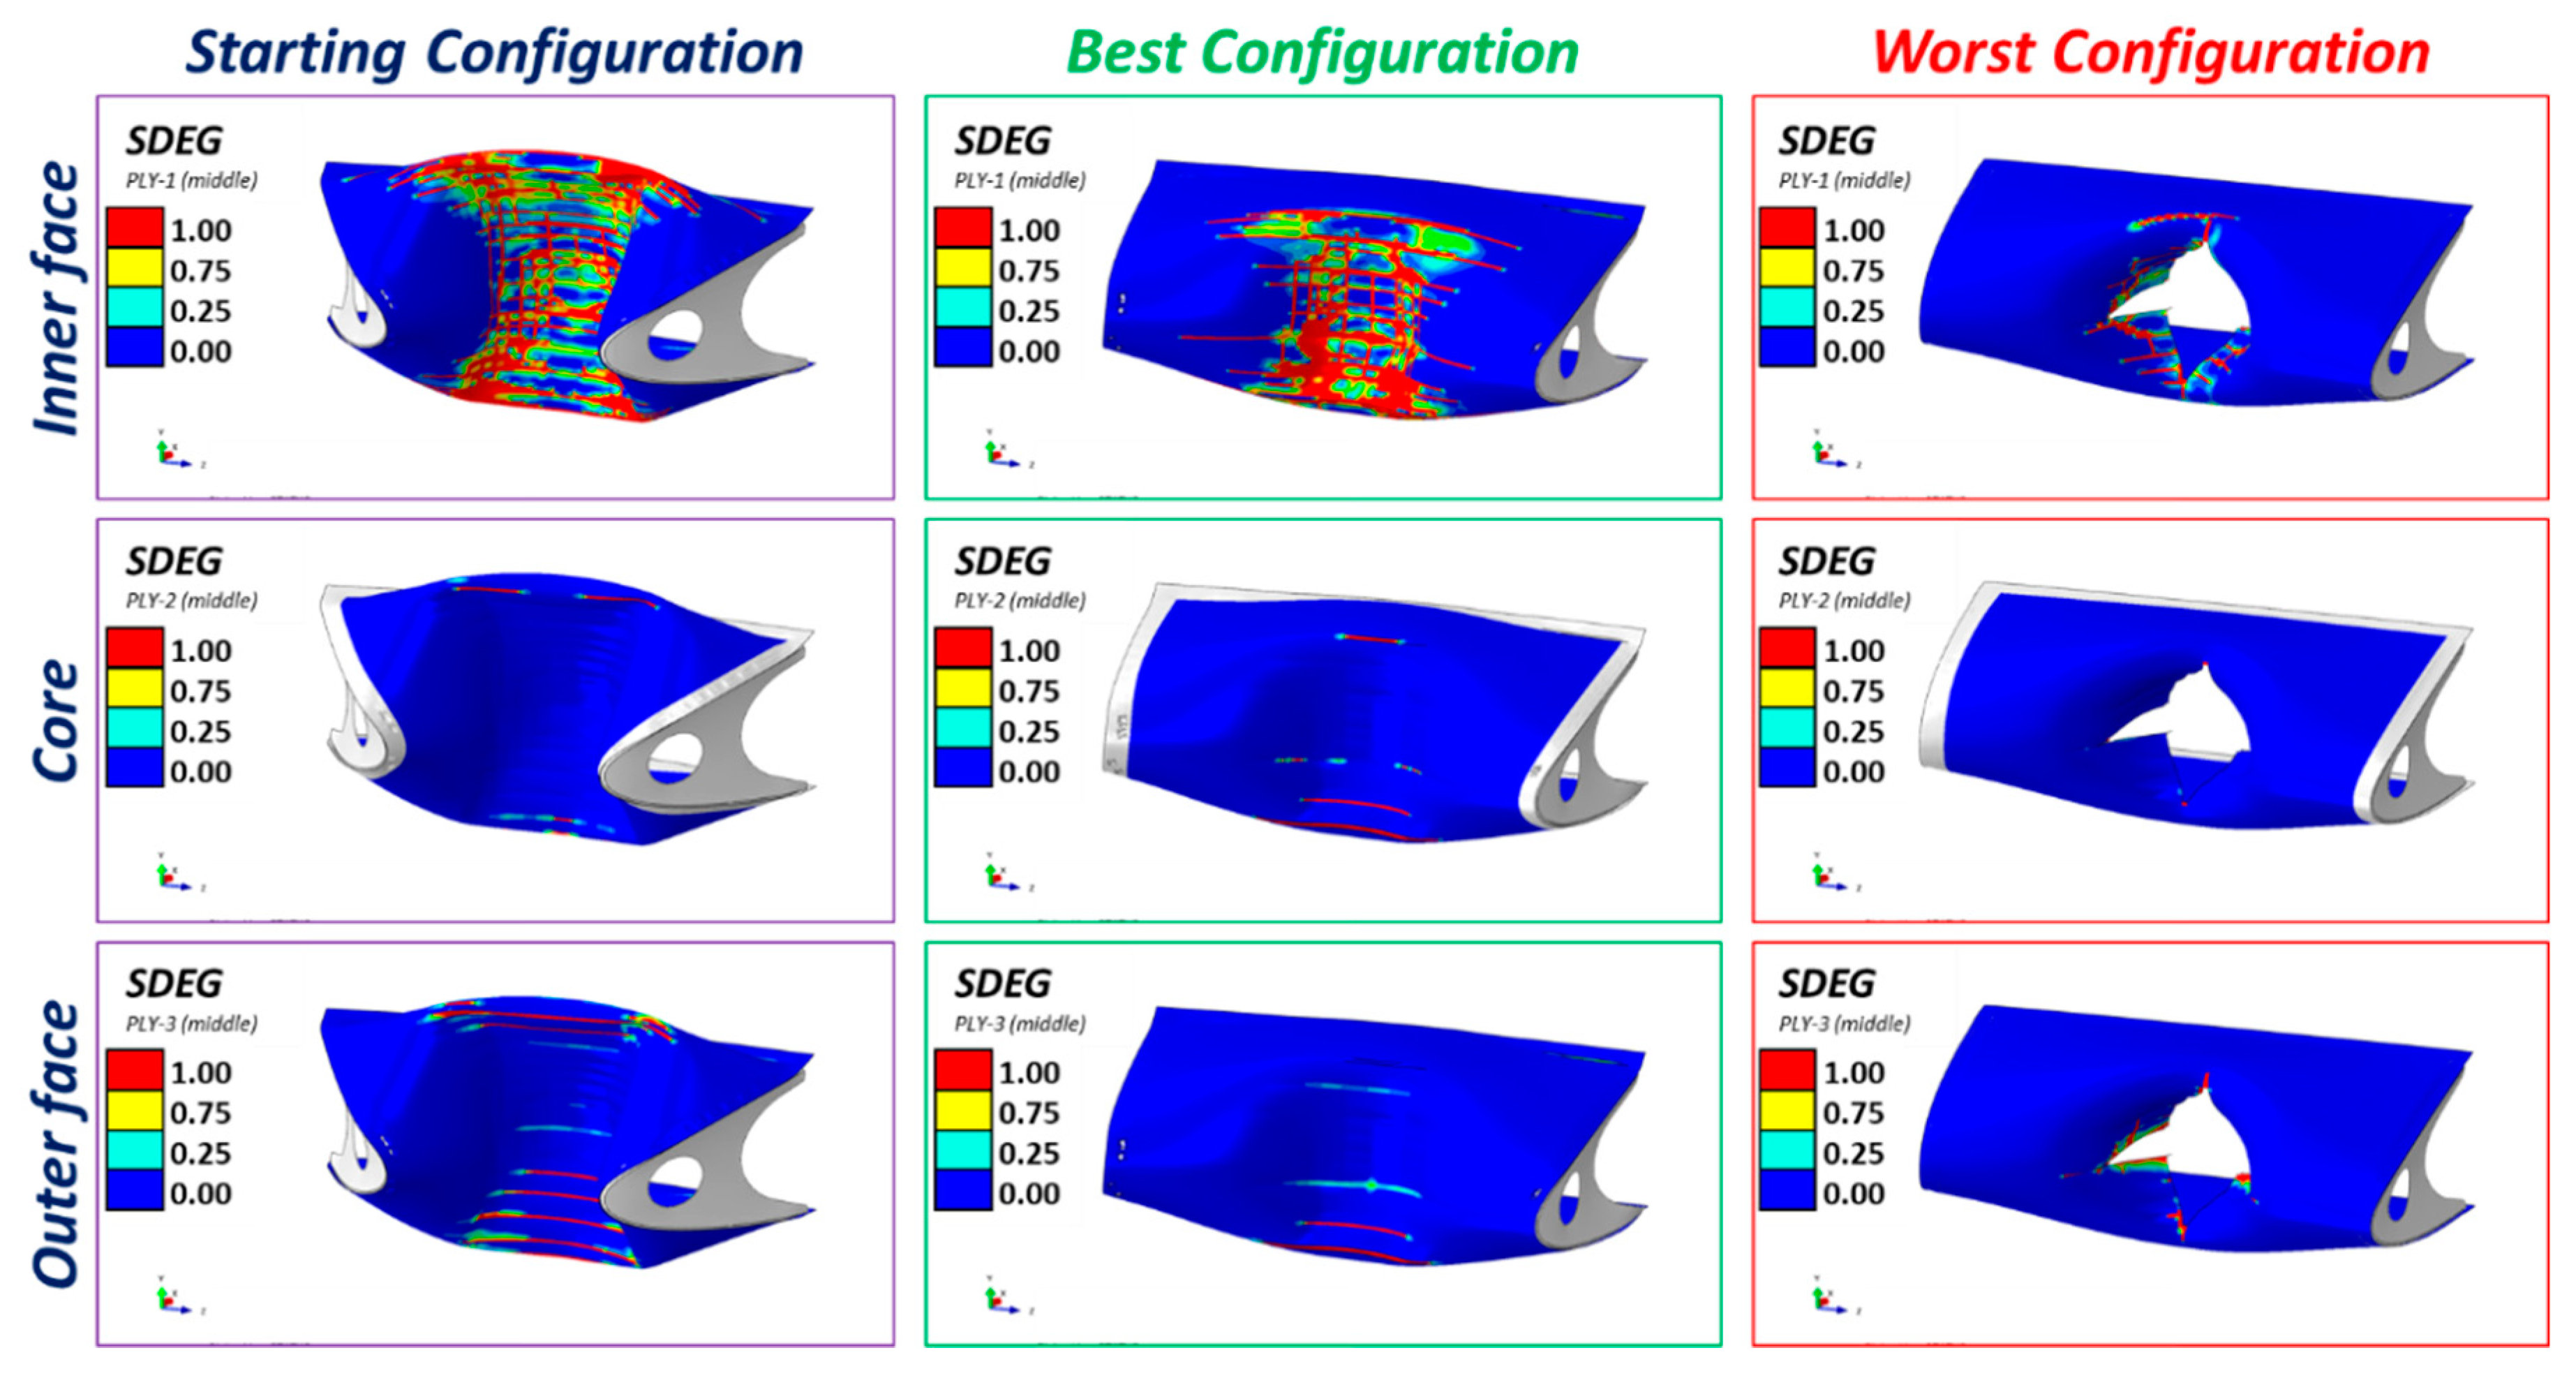
From the analysis of the damage state for the three components of the skin (Figure 16), it is possible to note that, if penetration does not occur, only the inner face undergoes considerable degradation (values equal to one mean complete degradation of the material; the element is removed from the analysis only if a unit values of the degradation parameter (SDEG) is reached by all the through-the-thickness integration points of the element). The increase in core thickness leads, in the case of the best configuration, to a further reduction of damage to the outer face. The images related to the worst configuration helps to understand the graph reported in Figure 16 too. In fact, it is evident that overall damaged areas are smaller in extension in the worst case. Therefore, even in this case, the best solution would be to increase the rate of failure energy and, above all, diversify it both in-plane and through the thickness. Hence, at the same point, it must be avoided that all components reach maximum deformation values.
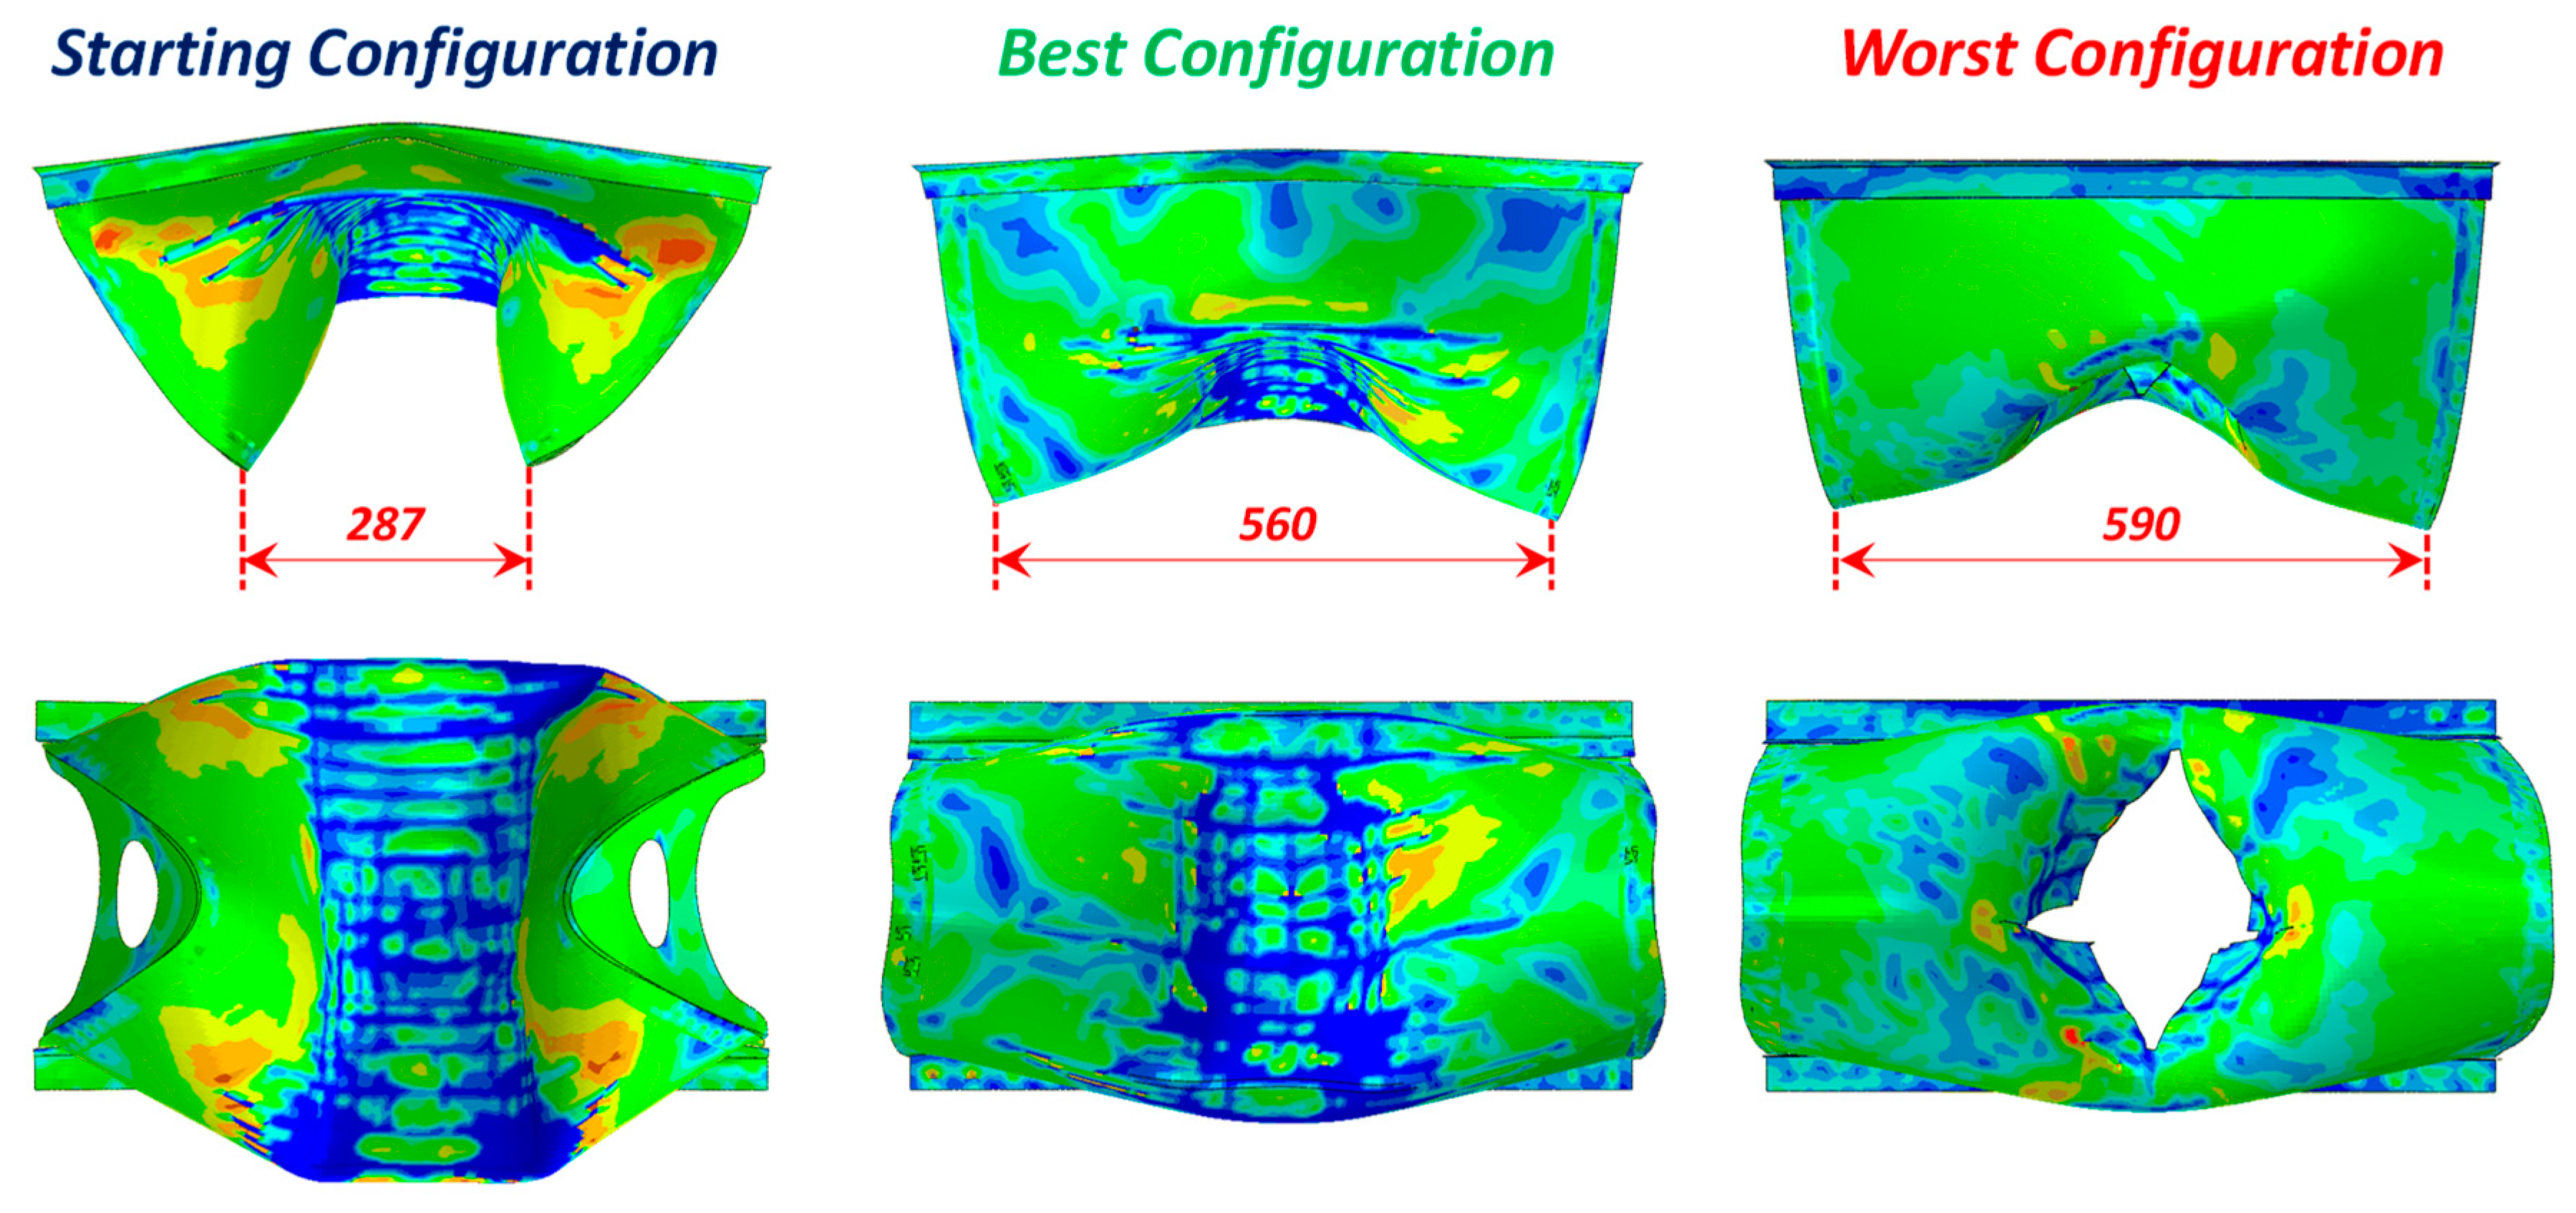
According to Figure 17, the worst configuration, which is the one with the minimum thickness for all sandwich components, presents a catastrophic damage status since the bird penetrates the structure. The reduced frame tips distance, thus, is not reasonable parameters to take into account for performance evaluation like the displacement of the central point. The best configuration, on the contrary, shows a consistent performance improvement. Indeed, the frame tips distance was increased by about 93%, and the central point displacement was reduced by about 40%. On the other hand, to this structural performance improvements correspond a structural mass increasing of about 5%, that can be considered reasonable, compared to the performance improvement.
5. Conclusions
In this work, a numerical study for increasing the structural performance of a leading-edge subject to bird strike is presented. The component is derived from a vatical tail of a general aviation aircraft and is made of aluminum parts (ribs) and a metal sandwich (skin).
A sensitivity analysis was carried out on the geometric parameters of the skin, i.e., the thicknesses of the two faces of the sandwich and the core’s one. The material systems and the remaining parts were not subject to any changes. The parametric model is obtained by means of a python macro that is the core of a sensitivity analysis workflow developed in the ModeFrontier environment. The main parameter for controlling the performance of the component is the maximum displacement of the impact point placed on the skin (center of the bay). Therefore, the sensitivity analysis aims to identify the configuration that maximizes structural performance and keeps the total weight within a reduced range of variability.
The results show that the increase in the thickness of each considered part (outer/inner face and core) leads to a reduction in the maximum displacement of the target point, as was to be expected. However, on the other hand, by associating this increase in thickness with the increases in mass, it is possible to see that minimal increases in the thickness of the outer/inner face (0.4/0.6 mm) lead to significant increases in weight, high increases (6.35 mm) in the thickness of the core lead to minimal mass increases and to maximization of structural performance.
Furthermore, the results allow identifying the configurations that degrade the performances significantly. In fact, the reduction in the thickness of the outer face quickly leads to a catastrophic failure and thus to a complete penetration of the bird.
In particular, three solutions were compared: the starting configuration, the optimal and the worst one. The best solution shows that with a minimum mass increase of about 5%, it is possible to obtain a clear structural performance improvement and, therefore, a reduction of about 50% of the maximum displacement. Obviously, intermediate solutions can preserve the functional requirements and keep the total mass even more reduced.
The presented work also aims to identify the key parameters that could be implemented in an optimization analysis for maximizing the structural performance (compliance with functional requirements at minimum weight). For example, the results highlighted that minimizing the damage energy does not avoid certainly penetration possibility. In contrast, it can be quite large, but it must be well distributed and localized in the model.
Author Contributions
All authors equally contribute to this work. All authors have read and agreed to the published version of the manuscript.
Funding
This research received no external funding.
Conflicts of Interest
The authors declare no conflict of interest.
References
- Federal Aviation Administration. Policy for Bird Strike; U.S. Department of Transportation: Washington, DC, USA, 2002. [Google Scholar]
- EASA. Modelling & Simulation—CS 25 Structural Certification Specification. Available online: https://www.easa.europa.eu/sites/default/files/dfu/proposed_cm-s-014_modelling_simulation_-_for_consultation.pdf (accessed on 18 November 2020).
- Barber, J.P.; Taylor, H.R.; Wilbeck, J.S. Bird Impact Forces and Pressures on Rigid and Compliant Targets; Dayton University OH Research Institute: Dayton, OH, USA, 1978. [Google Scholar]
- Pernas-Sánchez, J.; Artero-Guerrero, J.; Varas, D.; López-Puente, J. Artificial bird strike on Hopkinson tube device: Experimental and numerical analysis. Int. J. Impact Eng. 2020, 138, 103477. [Google Scholar] [CrossRef]
- Hanssen, A.; Girard, Y.; Olovsson, L.; Berstad, T.; Langseth, M. A Numerical Model for Birdstrike of Aluminium Foam-based Sandwich Panels. Int. J. Impact Eng. 2006, 32, 1127–1144. [Google Scholar] [CrossRef]
- Marulo, F.; Guida, M. Design criteria for birdstrike damage on windshield. Adv. Aircr. Spacecr. Sci. 2014, 1, 233–251. [Google Scholar] [CrossRef]
- Grimaldi, A.; Sollo, A.; Guida, M.; Marulo, F. Parametric study of a SPH high velocity impact analysis: A birdstrike windshield application. Compos. Struct. 2013, 96, 616–630. [Google Scholar] [CrossRef]
- Smojver, I.; Ivančević, D. Numerical simulation of bird strike damage prediction in airplane flap structure. Compos. Struct. 2010, 92, 2016–2026. [Google Scholar] [CrossRef]
- Arachchige, B.; Ghasemnejad, H.; Yasaee, M. Effect of bird-strike on sandwich composite aircraft wing leading edge. Adv. Eng. Softw. 2020, 148, 102839. [Google Scholar] [CrossRef]
- Yu, Z.; Xue, P.; Yao, P.; Zahran, M.S. Novel Design of Wing Leading Edge against Birdstrike. J. Aerosp. Eng. 2020, 33, 04020009. [Google Scholar] [CrossRef]
- Qiu, J.; Chen, H. Dynamic response of bird strike on variable stiffness laminates of composite leading edge. Int. J. Crashworthiness 2020. [Google Scholar] [CrossRef]
- Li, H.; Liu, J.; Wang, Z.; Yu, Z.; Liu, Y.; Sun, M. The low velocity impact response of shape memory alloy hybrid polymer composites. Polymers 2018, 10, 1026. [Google Scholar] [CrossRef] [Green Version]
- Guida, M.; Sellitto, A.; Marulo, F.; Riccio, A. Analysis of the impact dynamics of shape memory alloy hybrid composites for advanced applications. Materials 2019, 12, 153. [Google Scholar] [CrossRef] [Green Version]
- Guida, M.; Marulo, F.; Meo, M.; Russo, S. Experimental Tests Analysis of Fiber Metal Laminate under Birdstrike. Mech. Adv. Mater. Struct. 2012, 19, 376–395. [Google Scholar] [CrossRef] [Green Version]
- Zhou, Y.; Sun, Y.; Huang, T. Bird-strike resistance of composite laminates with different materials. Materials 2020, 13, 129. [Google Scholar] [CrossRef] [Green Version]
- Guida, M.; Marulo, F.; Meo, M.; Russo, S. Certification by birdstrike analysis on C27J fullscale ribless composite leading edge. Int. J. Impact Eng. 2013, 54, 105–113. [Google Scholar] [CrossRef]
- Di Caprio, F.; Sellitto, A.; Guida, M.; Riccio, A. Crashworthiness of wing leading edges under bird impact event. Compos. Struct. 2019, 216, 39–52. [Google Scholar] [CrossRef]
- Zhou, Y.; Sun, Y.; Huang, T.; Cai, W. SPH-FEM simulation of impacted composite laminates with different layups. Aerosp. Sci. Technol. 2019, 95, 105469. [Google Scholar] [CrossRef]
- Lacome, J.L. Smoothed particle hydrodynamics (sph): A new feature in ls-dyna. In Proceedings of the 7th International LS-DYNA Users Conference, Dearborn, MI, USA, 19–21 May 2002. [Google Scholar]
- Guida, M.; Marulo, F.; Meo, M.; Riccio, M. Analysis of Bird Impact on a Composite Tailplane Leading Edge. Appl. Compos. Mater. 2008, 15, 241–257. [Google Scholar] [CrossRef] [Green Version]
- Riccio, A.; Cristiano, R.; Saputo, S.; Sellitto, A. Numerical methodologies for simulating bird-strike on composite wings. Compos. Struct. 2018, 202, 590–602. [Google Scholar] [CrossRef]
- Vijay, K.; Goyal, C.A.; Huertas, T.; Vasko, J. Bird-Strike Modeling Based on the Lagrangian Formulation Using LS-DYNA. Am. Trans. Eng. Appl. Sci. 2013, 2, 57–81. [Google Scholar]
- Saputo, S.; Sellitto, A.; Riccio, A.; Di Caprio, F. Crashworthiness of a Composite Wing Section: Numerical Investigation of the Bird Strike Phenomenon by Using a Coupled Eulerian-Lagrangian Approach. J. Mater. Eng. Perform. 2019, 28, 3228–3238. [Google Scholar] [CrossRef]
- Georgiadis, S.; Gunnion, A.J.; Thomson, R.S.; Cartwright, B.K. Birdstrike Simulation for Certification of the Boeing 787 Composite Moveable Trailing Edge. Compos. Struct. 2008, 86, 258–268. [Google Scholar] [CrossRef]
- Anghileri, M.; Castelletti, L.M.L.; Mazza, V. Birdstrike: Aapproaches to the Analysis of Impacts with Penetration. In International Conference on Impact Loading of Lightweight Structures; WIT Transactions on Engineering Sciences: Ashurst Lodge, UK, 2005; Available online: https://www.esteco.com/modefrontier (accessed on 13 October 2019).
- Smith, M. ABAQUS/Explicit User’s Manual; Dassault Systèmes Simulia Corp: Providence, RI, USA, 2019. [Google Scholar]
- Borrelli, R.; Di Caprio, F.; Mercurio, U.; Romano, F. Assessment of progressive failure analysis capabilities of commercial FE codes. Int. J. Struct. Integr. 2012, 4, 300–320. [Google Scholar] [CrossRef] [Green Version]
- Shaue, G.H.; Lee, H. The thermomechanical behaviour for aluminium alloy under uniaxial tensile. Mater. Sci. Eng. 1999, 268, 154–164. [Google Scholar]
Figure 1.
Load cells positions: experimental set up (left) and numerical model (right).

Figure 2.
Numerical model. Test article and test rig.

Figure 3.
Results at different time steps. (A) Experimental deformations; (B) numerical—Von Mises stress; (C) numerical—damage status.
Figure 3.
Results at different time steps. (A) Experimental deformations; (B) numerical—Von Mises stress; (C) numerical—damage status.

Figure 4.
Experimental–numerical comparison. (A) Deformed shape during the test; (B) permanent deformation after the impact.
Figure 4.
Experimental–numerical comparison. (A) Deformed shape during the test; (B) permanent deformation after the impact.

Figure 5.
Reaction loads comparison. (A) Load cell 01; (B) load cell 02; (C) load cell 03.

Figure 6.
Numerical results. (A) Time-history of the displacement along impact direction of the skin central point; (B) tip web distance time-history.
Figure 6.
Numerical results. (A) Time-history of the displacement along impact direction of the skin central point; (B) tip web distance time-history.

Figure 7.
Sensibility analysis workflow and detail of design variables.

Figure 8.
Sensitivity analysis results. (A) Apex displacement vs. thickness; (B) Apex displacement vs. mass.
Figure 8.
Sensitivity analysis results. (A) Apex displacement vs. thickness; (B) Apex displacement vs. mass.

Figure 9.
Von Mises stress for starting, best and worst configuration at different time steps.

Figure 10.
Ductile criteria envelope for starting, best and worst configuration at different time steps.
Figure 10.
Ductile criteria envelope for starting, best and worst configuration at different time steps.

Figure 11.
(A) Time-history of the displacement along impact direction of the skin central point; (B) tip web distance time-history.
Figure 11.
(A) Time-history of the displacement along impact direction of the skin central point; (B) tip web distance time-history.

Figure 12.
Time-history of internal energy for skin (A) and ribs (B).

Figure 13.
Energy balance for the test rig. (A) Plastic energy; (B) strain energy; (C) internal energy.
Figure 13.
Energy balance for the test rig. (A) Plastic energy; (B) strain energy; (C) internal energy.

Figure 14.
Energy balance for the skin. (A) Damage energy; (B) strain energy; (C) plastic energy; (D) internal energy.
Figure 14.
Energy balance for the skin. (A) Damage energy; (B) strain energy; (C) plastic energy; (D) internal energy.

Figure 15.
Ductile criteria for inner and outer face and core for all investigated models.

Figure 16.
Degradation factor for inner and outer face and core for all investigated models.

Figure 17.
Deformed configurations.


Table 1.
Aluminum alloy mechanical properties [20].
Table 1.
Aluminum alloy mechanical properties [20].
| Description | Symbol | Unit | Value |
|---|---|---|---|
| Young’s modulus | E | [GPa] | 72 |
| Yield stress | σy | [MPa] | 280 |
| Ultimate strength | σu | [MPa] | 385 |
| Failure strain | εult | [mm/mm] | 0.18 |
| Density | ρ | [g/cm3] | 2.7 |
Table 2.
Honeycomb mechanical properties [20].
Table 2.
Honeycomb mechanical properties [20].
| Description | Symbol | Unit | Value |
|---|---|---|---|
| Elastic modulus (out-of-plane) | EC | [MPa] | 861 |
| Shear modulus—ribbon direction | GL | [MPa] | 200 |
| Shear modulus—transverse direction | GW | [MPa] | 90 |
| density | ρ | [g/cm3] | 0.046 |
Table 3.
Design parameters.
| Inner Face: AL2024-T3 | Outer Face: AL2024-T3 | Core: Hexcel—Hexweb Aluminum Flexcore | |
|---|---|---|---|
| Analyzed Values [mm] | 0.4; 1; 1.4; 2 | 0.4; 1; 1.4; 2 | 3.125; 6.35; 9.475; 12.7 |
Table 4.
Design parameters of the starting, the best and the worst configuration.
| Starting Configuration | Worst Configuration | Best Configuration | |
|---|---|---|---|
| Inner thickness [mm] | 0.4 | 0.4 | 0.4 |
| Outer thickness [mm] | 1.4 | 0.4 | 1.4 |
| Core thickness [mm] | 6.35 | 6.35 | 12.7 |
| Total L.E. mass [kg] | 2.53 | 1.4 | 2.65 |
Publisher’s Note: MDPI stays neutral with regard to jurisdictional claims in published maps and institutional affiliations. |
© 2020 by the authors. Licensee MDPI, Basel, Switzerland. This article is an open access article distributed under the terms and conditions of the Creative Commons Attribution (CC BY) license (http://creativecommons.org/licenses/by/4.0/).
Share and Cite
MDPI and ACS Style
Di Caprio, F.; Sellitto, A.; Saputo, S.; Guida, M.; Riccio, A. A Sensitivity Analysis of the Damage Behavior of a Leading-Edge Subject to Bird Strike. Appl. Sci. 2020, 10, 8187. https://0-doi-org.brum.beds.ac.uk/10.3390/app10228187
AMA Style
Di Caprio F, Sellitto A, Saputo S, Guida M, Riccio A. A Sensitivity Analysis of the Damage Behavior of a Leading-Edge Subject to Bird Strike. Applied Sciences. 2020; 10(22):8187. https://0-doi-org.brum.beds.ac.uk/10.3390/app10228187
Chicago/Turabian StyleDi Caprio, Francesco, Andrea Sellitto, Salvatore Saputo, Michele Guida, and Aniello Riccio. 2020. "A Sensitivity Analysis of the Damage Behavior of a Leading-Edge Subject to Bird Strike" Applied Sciences 10, no. 22: 8187. https://0-doi-org.brum.beds.ac.uk/10.3390/app10228187
Note that from the first issue of 2016, this journal uses article numbers instead of page numbers. See further details here.