Article

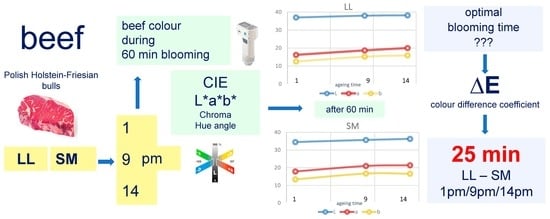
The Applicability of Total Color Difference ΔE for Determining the Blooming Time in Longissimus Lumborum and Semimembranosus Muscles from Holstein-Friesian Bulls at Different Ageing Times

by
Katarzyna Tkacz
1,*,
Monika Modzelewska-Kapituła
1,
Adam Więk
1 and
Zenon Nogalski
2
1
Department of Meat Technology and Chemistry, Faculty of Food Sciences, University of Warmia and Mazury in Olsztyn, Plac Cieszyński 1, 10-719 Olsztyn, Poland
2
Department of Cattle Breeding and Milk Evaluation, Faculty of Animal Bioengineering, University of Warmia and Mazury in Olsztyn, Oczapowskiego 5, 10-719 Olsztyn, Poland
*
Author to whom correspondence should be addressed.
Submission received: 30 October 2020 / Revised: 17 November 2020 / Accepted: 18 November 2020 / Published: 20 November 2020
(This article belongs to the Special Issue New Frontiers in Meat Science and Technology)

Abstract

:

Featured Application

The results of this study may have practical applications because an increase in the values of color parameters during beef ageing and the color of beef after blooming will be perceived by consumers as more attractive.

Abstract

This study was conducted to determine the optimal blooming time in beef muscles based on ΔE, and to analyze the effects of muscle type and ageing time on beef color and blooming. Beef color was determined on freshly cut longissimus lumborum (LL, n = 8) and semimembranosus (SM, n = 8) muscles on days 1, 9, and 14 of ageing during 60 min blooming at 5 min intervals. It was found that ΔE0, representing the difference in color between freshly cut muscles and subsequently analyzed samples, supported the determination of the optimal blooming time, which varied across ageing times (15, 20, 25 min for the LL muscle, and 10, 15, 20 min for the SM muscle on days 1, 9, and 14 of ageing, respectively). Beef color was affected by both muscle type and ageing. The values of color parameters increased between days 1 and 9 of ageing. The results may have practical applications because beef should be presented to consumers and restaurant owners approximately 25 min after cutting, when its color has fully developed.

Graphical Abstract

1. Introduction

The appearance of beef offered at retail is the most important factor considered by consumers when making purchasing decisions [1,2]. Consumers analyze their perceptions of meat color, the amount of fat and marbling [3,4,5]. According to consumers, color closely correlates with the quality of meat, including its freshness and suitability for consumption [6,7]. In general, beef color should be bright red and intense since any color deviations are associated with a decrease in quality and freshness [8,9,10,11]. Moreover, consumers often predict the sensory quality of the final, ready-to-eat dish based on the color of fresh meat [1,5]. If meat color is not consistent with their expectations, consumers will not decide to buy the product, even if the remaining attributes, assessed visually, are satisfactory.
Meat color is the product of various chemical forms of myoglobin [2,8,10,12,13,14] whose concentration depends, among others, on the breed, gender, age, and diet of animals, breeding methods, muscle pH and metabolism, enzymatic systems, and extrinsic factors such as temperature, oxygen availability, type of lighting, and surface microbial growth [5,15]. The proportions of different myoglobin forms on the surface of meat change as a function of time (ageing, blooming) [1]. Under the influence of atmospheric oxygen, the color of freshly cut beef turns bright red due to the oxygenation of the myoglobin molecule (deoxymyoglobin to oxymyoglobin) [5,7,13]. This process, which is usually referred to as blooming [16], depends on oxygen availability, oxygen diffusion into the meat, and mitochondrial oxygen consumption rate [17]. Blooming time is also affected by the type of muscle and its location in the carcass. The muscles that were more active in live animals contain more myoglobin, which ultimately affects the values of chromatic parameters during blooming [18]. In addition to myoglobin, mitochondria also remain biochemically active in post-mortem beef muscles, and they can influence meat color and its stability. Myoglobin molecules and mitochondria compete for oxygen, which influences the intensity of early bloomed color and the formation of oxymyoglobin [19].
The differences in the color and quality of beef muscles may also result from the composition of muscle fiber types [8,20]. Hwang et al. [21] characterized muscle fibers by histochemical analysis (fiber number percentage, area percentage, and diameter) and found that the differences in the composition of muscle fiber types between cattle muscles affected their color, marbling, and tenderness. All of these factors significantly affect meat color, and therefore it is difficult to establish a universal blooming time, which may vary depending on the breed and age of animals as well as the production system. The researchers who studied different beef muscles have reported differences in blooming time. Lee et al. [22,23] noted that up to 90% of color changes in beef occurred during the first 60 min after steaks had been cut. Cierach and Niedźwiedź [18] found that at least 16–18 min were needed for blooming in the semitendinosus (ST) muscle 48 h post-mortem, whereas Rentfrow et al. [16] estimated it for 10–12 min. Holman et al. [9] allowed beef samples to bloom for 30–45 min at 1–2 °C before the first color measurement was taken, whereas Beriain et al. [15], Kilgannon et al. [24], and Utama et al. [25] performed color measurements in the longissimus lumborum (LL) muscle after 60 min blooming. The cited authors analyzed the rate of changes in color parameters a * and b *, as well as color stabilization time. However, it seems interesting to use coefficient ΔE to determine color stabilization time, indicating the absence of significant differences in color coordinates over time. ΔE represents the total color difference by accounting for combined changes in the values of L *, a *, and b *. Based on ΔE, it is possible to predict whether the observer (consumer) will notice a change in meat color CIE [26]. This is a very important consideration in retail displays, where beef consumers make their purchasing decisions based on beef color, and for beef producers and suppliers who are to offer attractive products.
The LL and SM muscles differ in terms of their functions in live animals. The LL muscle is a positional muscle important for maintaining the posture, whereas the SM muscle is a primary locomotive muscle [27]. These differences affect the color stability of beef, where SM is classified as “unstable” and LL is considered as “stable” [28]. Steaks cut from these two muscles are most frequently offered in refrigerated counters, for both individual consumers and restaurant owners. This study was conducted to determine the optimal blooming time required to obtain repeatable and stable measurements of the color of bovine longissimus lumborum (LL) and semimembranosus (SM) muscles, taking into consideration the time and significance of the ageing process. Coefficient ΔE was used for this purpose.

2. Materials and Methods

The experimental materials comprised longissimus lumborum (LL, n = 8) and semimembranosus (SM, n = 8) muscles obtained from the carcasses of Polish Holstein-Friesian bulls (19.2 ± 0.6 months of age, body weight of 598 ± 18.8 kg). The same animals were used in our previous study which investigated the influence of different feed additives on beef quality [29], and they constituted the control group. In that study, blooming time was determined in all experimental groups fed different feed additives.
The rearing conditions were described in detail in our previous study [29]. The muscles were removed from the left half-carcass of each animal 24 h post-mortem, and were transported to a laboratory in a cool box at refrigerated temperature. The muscles were kept at refrigerated temperature (4 ± 1 °C) overnight. Subsequently, each muscle was divided into two cuts, and after color measurement (day 1), each cut was packaged individually in a vacuum pouch (PA/PE, thickness 70 µm, Inter Arma Ltd., Rudawa, Poland). Vacuum-packaged meat was stored until 9 and 14 days post-mortem [30] at 4 ± 1 °C (Memmert GmbH, Schwabach, Germany).
Beef color was determined on days 1, 9, and 14 of ageing, on freshly cut muscles (2.5 cm thick steaks, approx. 230 g) during 60 min blooming (4 °C), according to the standard conditions of the CIE LAB system using, (MiniScan XE Plus, HunterLab, Reston, Virginia 20190 USA) with standard illuminant D65, a 10° standard observer angle and a 2.54 cm diameter aperture. Before measurements, the device was calibrated using white and black tiles. The values of lightness (L *), redness (a *), and yellowness (b *) were measured at 5 min intervals in three different locations on the muscle’s cross-section. The values of hue (H * = tan−1(b */a *)) and chroma (C * = (a *2 + b *2)1/2) were calculated [12]. The total color change (ΔE) over the entire blooming period (between 0 and 60 min measurements) was then calculated for each sample, using Equation (1):
∆E = [(∆L*)2 + (∆a*)2 + (∆b*)2]0.5
where ΔL *, Δa *, and Δb * are the derivatives of corresponding parameters, respectively.
ΔE0 was calculated to determine the time after which the color stabilizes (reflected in the absence of significant differences between mean values). ΔE0 denotes the difference in color measured on freshly cut beef (time 0) and during blooming. ΔExy, which denotes the difference in color between two consecutive measurements made on a sample during blooming, was calculated to determine the intensity of color changes taking place at 5 min intervals.
Due to the fact that the data in each experimental group met the assumptions of normal distribution (Shapiro–Wilk test) and the homogeneity of variance (Leven’s test), an analysis of variance (ANOVA) was conducted, followed by Duncan’s test for comparisons of mean values (at p < 0.05). Two-way ANOVA (Statistica 12, StatSoft Inc., Tulsa, OK, USA) was performed to determine the effects of ageing time (three levels: 1, 9, and 14 days) and muscle type (two levels: LL and SM) on the color parameters of beef.
Differences in the values of color parameters L *, a *, b *, C *, and H * over time were analyzed using repeated measures ANOVA with 13 sampling dates, separately for each color attribute. The same procedure, with 12 sampling dates, was used when analyzing the values of ΔE0 and ΔExy. The values obtained on different sampling dates were treated as dependent variables, whereas time was a repeated measures factor. The significance of differences between the values obtained on different sampling dates was determined with the Bonferroni test.
A total of 24 replications were used in the statistical analysis of color changes in muscles aged for different periods of time (8 bulls × 3 measurements at each time interval), and a total of 72 replications were used in the analysis of the effects of muscle type (8 bulls × 3 ageing times × 3 measurements) and ageing (8 bulls × 2 muscles × 3 measurements) on color parameters after 25 min blooming.

3. Results

Color parameters L *, a *, b *, and C * changed during 60 min blooming. In the LL muscle, L * values ranged from 35.5 to 37.1, from 36.71 to 38.3, and from 37.1 to 38.2, whereas in the SM muscle, from 33.48 to 34.59, from 34.3 to 35.9, and from 34.5 to 36.8 on days 1, 9, and 14 of ageing, respectively. Blooming contributed to an increase in the values of a * in LL and SM muscles at each ageing time. In the LL muscle, the values of a * increased from 14.53 to 16.68, from 14.99 to 19.1, and from 16.07 to 20.16, and the parameter stabilized after 10, 15, and 25 min on days 1, 9, and 14 of ageing, respectively. In the SM muscle, the values of a * increased from 14.96 to 18.21, from 16.92 to 21.70, and from 17.0 to 21.56, and the parameter stabilized after 10, 30, and 10 min on days 1, 9, and 14 of ageing, respectively.
Changes in the values of b * were also noted during 60 min blooming. In the LL muscle, the values of b * increased from 10.76 to 12.68, from 12.16 to 15.30, and from 13.02 to 16.09, and the parameter stabilized after 30, 20, and 20 min on days 1, 9, and 14 of ageing, respectively. In the SM muscle, the values of b * increased from 11.29 to 13.96, from 13.92 to 17.35, and from 13.3 to 16.7, and the parameter stabilized after 10, 25, and 10 min in meat aged for 1, 9, and 14 days, respectively.
Changes in chroma, which defines color intensity (higher values indicate a more vivid color), followed a similar trend to changes in parameter a *. In the LL muscle, chroma increased from 18.09 to 20.68, from 19.31 to 24.5, and from 20.69 to 25.80, and it stabilized after 15, 20, and 25 min of blooming. In the SM muscle, chroma increased from 18.76 to 22.9, from 21.92 to 27.6, and from 21.6 to 27.2, and it stabilized after 10, 25, and 20 min on days 1, 9, and 14 of ageing, respectively.
Differences in the values of hue angle during blooming were noted in both muscles only on day 1 of ageing when they increased from 36.0 to 38.2 in the LL muscle, and from 36.2 to 37.7 in the SM muscle. However, on subsequent sampling dates, no changes in the values of hue angle were observed during blooming in either of the studied muscles, due to changes that occurred in meat during ageing.
The results of this study indicate that the time needed for the stabilization of individual color parameters varied, therefore, it was difficult to determine the optimal blooming time unambiguously. Thus, an attempt was made to use ΔE for this purpose (Table 1).
The color differences expressed as ΔExy point to the relevance of the first 10 min in the intensity of blooming in the SM muscle. On days 1 and 14 of ageing, during the first 10 min of blooming, the color difference could have been seen even by an inexperienced observer, because ΔExy exceeded 2 [26]. After 10 min blooming in samples aged for 1 and 14 days and after 5 min blooming in samples aged for 9 days, in blooming intervals, the changes that cause color differences between measurements were smaller and could have been distinguished by an experienced observer (ΔExy < 2). In the LL muscle, the highest values of ΔExy were also noted during the first 10 min of blooming, however, they were below 2, which indicates that color changes could have been distinguished only by an experienced observer.
The color difference ΔE0 increased in both studied muscles during blooming regardless of ageing time. In the LL muscle, color stabilized after 15 min on day 1 of ageing and after 20 min on day 9 of ageing, and the observer could have seen an evident difference in color compared with the color of freshly cut beef (2 < ΔE < 5). On day 14, color stabilized after 25 min and the observer could have an impression of two distinct colors (ΔE > 5). In the SM muscle, the blooming process proceeded similarly to the LL muscle. However, as soon as 5 min after cutting, the value of ΔE0 exceeded 2 (Table 1), which indicates that the color difference could have been perceived even by an inexperienced observer. Color stabilized faster in the SM muscle than in the LL muscle, after 10, 15, and 20 min on days 1, 9, and 14 of ageing, respectively.
ΔE was found to be a reliable tool for determining the blooming time, which accounted for the changes in all color coordinates examined in the study. Based on ΔE0, the color parameters of bovine LL and SM muscles can be determined 25 and 20 min after cutting, respectively, provided that the color parameters affecting the color difference have already fully developed.
The effects of ageing and muscle type on changes in color parameters were determined based on the results of measurements taken after 25 min blooming (Table 2). Ageing affected (p < 0.001) the values of L *, a *, b *, C *, and H *, whereas muscle type affected (p < 0.001) the values of L *, a *, b *, and C *. An interaction between ageing and muscle type was found for b * (p = 0.031) and H * (p = 0.012). Since ageing affected (p < 0.001) all color parameters, the values recorded at different ageing times in LL and SM muscles were compared in detail (Table 3). Regardless of muscle type, 9-day ageing increased the values of all parameters compared with day 1, whereas the additional 5 days of ageing (days 9–14), did not affect the analyzed values.

4. Discussion

The values of L *, a *, b *, and C * tended to increase during the blooming process. A similar trend was observed in LL and SM muscles in several previous studies [15,16,18,24,31,32].
An analysis of ΔE0 revealed that the most pronounced changes in color occurred during the first 10 min of blooming; relative to the color parameters determined after 60 min of blooming, the changes noted in the LL muscle accounted for 69%, 53%, and 51%, whereas the changes noted in the SM muscle accounted for 95%, 69%, and 61% on days 1, 9, and 14 of ageing, respectively. It was also found that the optimal blooming time (color stabilization time) increased proportionally to ageing time (5, 20, and 25 min for the LL muscle and 10, 15, and 20 min for the SM muscle, on days 1, 9, and 14 of ageing, respectively). Moreover, color stabilized faster in the SM muscle than in the LL muscle. The researchers who studied the blooming process highlighted the relevance of the first minutes after cutting meat. However, they analyzed individual color parameters instead of using ΔE, which combines all color coordinates. Lee et al. [22] reported an over 50% increase in the values of L *, a *, and b * in longissimus thoracis (LT) steaks, which occurred within the first 10 min after cutting, and an over 90% increase in the values of color parameters that occurred during 60 min of blooming. Rentfrow et al. [16] found no changes in L * values during 93 min of the blooming process, and reported an increase in a * values during the first 9 min followed by their stabilization after 12 min, and an increase in b * values during the first 6 min and their stabilization after 6 min. The above results suggest that blooming times in excess of 12 min are necessary to obtain the most stable and repeatable color measurements on freshly cut beef [16]. More recently, these findings were confirmed by Alvarenga et al. [33] who studied blooming in lamb meat and reported that the process did not affect the lightness of meat aged for 6 and 12 days, but increased other color parameters (a * and b *). They suggested that the appropriate blooming time for 12-d aged lamb meat was 18 min.
The muscles analyzed in this study differ in terms of their functions in live animals—LL is a positional muscle important for maintaining the posture, whereas SM is a primary locomotive muscle [27]. The main functions of these muscles affect their composition (muscle fibers, connective, adipose, vascular, and nervous tissues) and color [34,35]. More active muscles, such as SM, are darker than the remaining muscles, including LTL [34], which was also noted in this study. As expected, muscle type had a significant (p < 0.001) influence on lightness (L *), redness (a *), yellowness (b *), and chroma (C *). The SM muscle, regardless of ageing time, was darker, with a higher contribution of red hues and higher chroma. The effect of muscle type on beef color was also observed by Van Rooyen et al. [36].
The differences in color between LL and SM muscles, noted in the present study, could result from the possible formation of metmyoglobin on the freshly cut surface of the SM muscle, which was reported by Lindahl [17]. In contrast, McKenna et al. [37] demonstrated that metmyoglobin did not appear on the freshly cut surface of the LL muscle and concluded that LL was resistant to metmyoglobin formation.
The composition of muscle fibers, which affects myoglobin concentration, is yet another factor influencing beef color [14,21,36]. Based on their molecular, structural, contractile, and metabolic differences, myofibrils were classified into three types of fibers: type I—slow-twitch oxidative; type IIA—fast-twitch oxido-glycolytic; type IIB—fast-twitch glycolytic [34,35]. According to Hwang et al. [21], LTL and SM muscles differ in terms of the proportions of I, IIA and IIB fibers. The LTL muscle from Hanwoo cattle was composed of type I fibers in 33.1%, type IIA fibers in 14.9%, and type IIB fibers in 52.6%, whereas the fiber composition of the SM muscle was as follows: type I fibers—12.0%; type IIA fibers—27.3%; type IIB fibers—61.8%. Moreover, Hwang et al. [21] reported that L * values were negatively correlated with the content of type IIA and IIB fibers (r = −0.38 and −0.30, respectively) and positively correlated with the content of type I fibers (r = 0.36). Similar trends were also noted by Gajaweera et al. [34] and Salim et al. [14]. The above relationships explain the lighter color of the LL muscle, compared with the SM muscle, observed in the present study. The lighter color of LL could also result from its higher fat content and marbling, compared with SM [9,21,29]. However, as demonstrated by Purslow et al. [2], factors other than myoglobin chemistry could also produce differences in meat color. In the case of L *, a crucial role can be played by the following three mechanisms: (1) variable spacing of the myofilament lattice within myofibrils, which affects myofibril diameter and the diameter of the entire muscle fiber; (2) changes in sarcomere length; (3) variations in protein composition and distribution in the sarcoplasm. The first of these mechanisms can be responsible for a 20% increase in L * between muscles with pH values of 6.1 and 5.4 [2].
In studies of beef, blooming processes were explained by changes in myoglobin forms and concentration. Beriain et al. [15] found that ageing affected the concentrations of myoglobin forms by increasing the proportion of MbO2 (responsible for the bright red color of fresh meat) and decreasing the proportion of deoxymyoglobin (Mb). In the present study, regardless of muscle type, ageing time affected changes in all color parameters. Aged beef was lighter, redder, and had higher chroma. Similar values of color parameters were also reported by Insausti et al. [38] who studied color changes in vacuum-packaged beef. The highest increase in the values of L *, a *, b *, C *, and H * was noted during the first 5 days post-mortem, then the values of these parameters stabilized and remained unchanged until day 15 [38]. A similar trend was observed by Wyrwisz et al. [31], Domaradzki et al. [32], and Beriain et al. [15]. Changes in beef color during ageing result from meat protein degradation, which leads to the weakening of protein structures, causing a greater dispersion of light. An increase in a * and b * values during ageing is also related to the reduced activity of mitochondria, which increases the amount of oxygen on meat surface and promotes its diffusion into the meat tissue during blooming. As a result, the color of muscle tissue becomes lighter and pinker [15,32].

5. Conclusions

The results of color measurements performed in two beef muscles during 60 min blooming at three different ageing times indicate that beef color depends on muscle type and ageing time. An analysis of ΔE revealed that beef color stabilized after 15, 20, and 25 min in the LL muscle, and after 10, 15, and 20 min in the SM muscle, in samples aged for 1, 9, and 14 days, respectively. Therefore, coefficient ΔE, which mathematically combines changes in lightness L *, redness a *, and yellowness b *, was found to be a useful tool for determining the completion of the blooming process. The present findings suggest that the color of beef should be measured after 25 min blooming. From a practical point of view, beef should be presented to consumers and restaurant owners approximately 25 min after cutting, when its color has fully developed. This will have a considerable impact on consumer acceptability when aged beef cut into individual steaks is sold at retail. The same rule applies to taking photographs of beef for advertising purposes.

Author Contributions

Conceptualization, formulation of objectives and scope of research, formulation of conclusions, and creation of the publication text, K.T.; Participated in management and discussion of the results, statistical analysis, and writing and editing of the manuscript, M.M.-K.; Funding acquisition, A.W.; Provision of the research material and scientific consultation, Z.N. All authors have read and agreed to the published version of the manuscript.

Funding

Project financially supported by Minister of Science and Higher Education in the range of the program entitled ‘‘Regional Initiative of Excellence’’ for the years 2019-2022, Project No. 010/RID/2018/19, amount of funding 12.000.000 PLN.: Project No. 010/RID/2018/19.

Conflicts of Interest

The authors declare that there is no conflict of interest between them and other people or organizations that could inappropriately bias the results.

References

  1. Font-i-Furnols, M.; Guerrero, L. Consumer preference, behavior and perception about meat and meat products: An overview. Meat Sci. 2014, 98, 361–371. [Google Scholar] [CrossRef]
  2. Purslow, P.P.; Warner, R.D.; Clarke, F.M.; Hughes, J.M. Variations in meat colour due to factors other than myoglobin chemistry; a synthesis of recent findings (invited review). Meat Sci. 2020, 159, 107941. [Google Scholar] [CrossRef]
  3. Holman, B.W.B.; van de Ven, R.J.; Mao, Y.; Coombs, C.E.O.; Hopkins, D.L. Using instrumental (CIE and reflectance) measures to predict consumers’ acceptance of beef colour. Meat Sci. 2017, 127, 57–62. [Google Scholar] [CrossRef]
  4. Mancini, R.A.; Hunt, M.C. Current research in meat color. Meat Sci. 2005, 71, 100–121. [Google Scholar] [CrossRef]
  5. Šuput, D.Z.; Lazić, L.V.; Lević, B.L.; Pezo, L.L.; Tomović, M.V.; Hromiš, M.N. Effect of specific packaging conditions on myoglobin and meat color. Food Feed Res. 2013, 40, 1–10. [Google Scholar]
  6. Carpenter, C.E.; Cornforth, D.P.; Whittier, D. Consumer preferences for beef color and packaging did not affect eating satisfaction. Meat Sci. 2001, 57, 359–363. [Google Scholar] [CrossRef]
  7. Salueña, B.H.; Gamasa, C.S.; Rubial, J.M.D.; Odriozola, C.A. CIELAB color paths during meat shelf life. Meat Sci. 2019, 157, 1078–1089. [Google Scholar] [CrossRef] [Green Version]
  8. Canto, A.C.; Costa-Lima, B.R.; Suman, S.P.; Monteiro, M.L.G.; Viana, F.M.; Salim, A.P.A.; Nair, M.N.; Silva, T.J.P.; Conte-Junior, C.A. Color attributes and oxidative stability of longissimus lumborum and psoas major muscles from Nellore bulls. Meat Sci. 2016, 121, 19–26. [Google Scholar] [CrossRef] [Green Version]
  9. Holman, B.W.B.; Kerr, M.J.; Morris, S.; Hopkins, D.L. The identification of dark cutting beef carcasses in Australia, using Nix Pro Color Sensor™ colour measures, and their relationship to bolar blade, striploin and topside quality traits. Meat Sci. 2019, 148, 50–54. [Google Scholar] [CrossRef]
  10. Suman, S.P.; Hunt, M.C.; Nair, M.N.; Rentfrow, G. Improving beef color stability: Practical strategies and underlying mechanisms. Meat Sci. 2014, 98, 490–504. [Google Scholar] [CrossRef]
  11. Van Rooyen, L.A.; Allen, P.; Crawley, S.M.; O’Connor, D.I. The effect of carbon monoxide pretreatment exposure time on the colour stability and quality attributes of vacuum packaged beef steaks. Meat Sci. 2017, 129, 74–80. [Google Scholar] [CrossRef]
  12. AMSA. Meat Color Measurement Guidelines; American Meat Science Association: Champaign, IL, USA, 2012. [Google Scholar]
  13. Mancini, R.A.; Ramanathan, R. Effects of postmortem storage time on color and mitochondria in beef. Meat Sci. 2014, 98, 65–70. [Google Scholar] [CrossRef]
  14. Salim, A.P.A.A.; Suman, S.P.; Canto, A.C.V.C.S.; Costa-Lima, B.R.C.; Viana, F.M.; Monteiro, M.L.G.; Silva, T.J.P.; Conte-Junior, C.A. Muscle-specific color stability in fresh beef from grain-finished Bos indicus cattle. Asian Austral. J. Anim. 2019, 32, 1036–1043. [Google Scholar] [CrossRef] [Green Version]
  15. Beriain, M.J.; Goñi, M.V.; Indurain, G.; Sarriés, M.V.; Insausti, K. Predicting Longissimus dorsi myoglobin oxidation in aged beef based on early post-mortem colour measurements on the carcass as a colour stability index. Meat Sci. 2009, 81, 439–445. [Google Scholar] [CrossRef]
  16. Rentfrow, G.; Linville, M.L.; Stahl, C.A.; Olson, K.C.; Berg, E.P. The effects of the antioxidant lipoic acid on beef longissimus bloom time. J. Anim. Sci. 2004, 82, 3034–3037. [Google Scholar] [CrossRef]
  17. Lindahl, G. Colour stability of steaks from large beef cuts aged under vacuum or high oxygen modified atmosphere. Meat Sci. 2011, 87, 428–435. [Google Scholar] [CrossRef]
  18. Cierach, M.; Niedźwiedź, J. Effects of three lighting intensities during display on discolouration of beef semitendinosus muscle. Eur. Food Res. Technol. 2014, 239, 377–383. [Google Scholar] [CrossRef] [Green Version]
  19. Mancini, R.A.; Belskie, K.; Suman, S.P.; Ramanathan, R. Muscle-specific mitochondrial functionality and its influence on fresh beef color stability. J. Food Sci. 2018, 83, 2077–2082. [Google Scholar] [CrossRef]
  20. Salim, A.P.A.A.; Suman, S.P.; Canto, A.C.V.C.S.; Costa-Lima, B.R.C.; Viana, F.M.; Monteiro, M.L.G.; Silva, T.J.P.; Conte-Junior, C.A. Influence of muscle source on proximate composition, texture profile and protein oxidation of beef from grain-finished Bos indicus cattle. Ciência Rural 2019, 49, 1–6. [Google Scholar] [CrossRef]
  21. Hwang, Y.H.; Kim, G.D.; Jeong, J.Y.; Hur, S.J.; Joo, S.T. The relationship between muscle fiber characteristics and meat quality traits of highly marbled Hanwoo (Korean native cattle) steers. Meat Sci. 2010, 86, 456–461. [Google Scholar] [CrossRef]
  22. Lee, M.S.; Apple, J.K.; Yancey, J.W.S.; Sawyer, J.T.; Johnson, Z.B. Influence of vacuum-aging period on bloom development of the beef gluteus medius from top sirloin butts. Meat Sci. 2008, 80, 592–598. [Google Scholar] [CrossRef] [PubMed]
  23. Lee, M.S.; Apple, J.K.; Yancey, J.W.S.; Sawyer, J.T.; Johnson, Z.B. Influence of wet-aging on bloom development in the longissimus thoracis. Meat Sci. 2008, 80, 703–707. [Google Scholar] [CrossRef] [PubMed]
  24. Kilgannon, A.K.; Holman, B.W.B.; Mawson, J.C.; Campbell, M.; Collins, D.; Hopkins, D.L. The effect of different temperature-time combinations when ageing beef: Sensory quality traits and microbial loads. Meat Sci. 2019, 150, 23–32. [Google Scholar] [CrossRef] [PubMed]
  25. Utama, D.; Lee, C.; Park, Y.; Jang, A.; Lee, S. Comparison of meat quality, fatty acid composition and aroma volatiles of Chikso and Hanwoo beef. Asian Austral. J. Anim. 2018, 31, 1500–1506. [Google Scholar] [CrossRef] [PubMed] [Green Version]
  26. CIE. Recommendations on Uniform Color Spaces, Color-Difference Equations, Psychometric Color Terms; Commission Internationale de l’Eclairage: Paris, France, 1978. [Google Scholar]
  27. Belew, J.B.; Brooks, J.C.; McKenna, D.R.; Savell, J.W. Warner-Bratzler shear evaluations of 40 bovine muscles. Meat Sci. 2004, 64, 507–512. [Google Scholar] [CrossRef]
  28. Warner, R.D.; Kearney, G.; Hopkins, D.L.; Jacob, R.H. Retail colour stability of lamb meat is influenced by breed type, muscle, packaging and iron concentration. Meat Sci. 2019, 129, 28–37. [Google Scholar] [CrossRef] [PubMed]
  29. Modzelewska-Kapituła, M.; Tkacz, K.; Nogalski, Z.; Karpińska-Tymoszczyk, M.; Draszanowska, A.; Pietrzak-Fiećko, R.; Purwin, C.; Lipiński, K. Addition of herbal extracts to the Holstein-Friesian bulls’ diet changes the quality of beef. Meat Sci. 2018, 145, 163–170. [Google Scholar] [CrossRef]
  30. AMSA. Research Guidelines for Cookery, Sensory Evaluation, and Instrumental Tenderness Measurements of Meat, 2nd ed.; American Meat Science Association: Champaign, IL, USA, 2015. [Google Scholar]
  31. Wyrwisz, J.; Moczkowska, M.; Kurek, M.; Stelmasiak, A.; Półtorak, A.; Wierzbicka, A. Influence of 21 days of vacuum-aging on color, bloom development, and WBSF of beef semimembranosus. Meat Sci. 2016, 122, 48–54. [Google Scholar] [CrossRef]
  32. Domaradzki, P.; Litwińczuk, Z.; Florek, M.; Żółkiewski, P. Effect of ageing on the physicochemical properties of musculus longissimus lumborum of young bulls of five breeds. Med. Wet. 2017, 73, 802–810. [Google Scholar] [CrossRef] [Green Version]
  33. Alvarenga, T.I.R.C.; Hopkins, D.L.; Ramos, E.M.; Almeida, A.K.; Geesink, G. Ageing-freezing/thaw process affects blooming time and myoglobin forms of lamb meat during retail display. Meat Sci. 2019, 153, 19–25. [Google Scholar] [CrossRef]
  34. Gajaweera, C.; Chung, K.Y.; Lee, S.H.; Wijayananda, H.I.; Kwon, E.G.; Kim, H.J.; Cho, S.H.; Lee, S.H. Assessment of carcass and meat quality of longissimus thoracis and semimembranosus muscles of Hanwoo with Korean beef grading standards. Meat Sci. 2010, 160, 107944. [Google Scholar] [CrossRef]
  35. Listrat, A.; Lebret, B.; Louveau, I.; Astruc, T.; Bonnet, M.; Lefaucheur, L.; Picard, B.; Bugeon, J. How muscle structure and composition influence meat and flesh quality. Sci. World J. 2016, 2016, 1–14. [Google Scholar] [CrossRef] [PubMed] [Green Version]
  36. Van Rooyen, L.A.; Allen, P.; O’Connor, D.I. Effect of muscle type and CO-pretreatment combinations on the colour stability, protein oxidation and shelf-life of vacuum packaged beef steaks. Meat Sci. 2018, 145, 407–414. [Google Scholar] [CrossRef] [PubMed]
  37. McKenna, D.R.; Mies, P.D.; Baird, B.E.; Pfeiffer, K.D.; Ellebracht, J.W.; Savell, J.W. Biochemical and physical factors affecting discoloration characteristics of 19 bovine muscles. Meat Sci. 2005, 70, 665–682. [Google Scholar] [CrossRef] [PubMed]
  38. Insausti, K.; Beriain, M.J.; Purroy, A.; Alberti, P.; Lizaso, L.; Hernandez, B. Colour stability of beef from different Spanish native cattle breeds stored under vacuum and modified atmosphere. Meat Sci. 1999, 53, 241–249. [Google Scholar] [CrossRef]
Table 1. Color differences during 60 min blooming in longissimus lumborum (LL, n = 24) and semimembranosus (SM, n = 24) muscles (mean values ± SEM).
AgeingMuscles
LLSM
ΔE0ΔExyΔE0ΔExy
1-day
0 min----
5 min1.93 ± 0.24 b1.93 ± 0.24 a2.80 ± 0.24 b2.80 ± 0.24 a
10 min2.17 ± 0.3 b1.69 ± 0.18 a3.71 ± 0.28 a2.15 ± 0.17 b
15 min2.58 ± 0.26 a,b1.33 ± 0.21 c4.20 ± 0.23 a1.30 ± 0.15 c
20 min2.92 ± 0.24 a,b1.29 ± 0.19 c4.44 ± 0.26 a1.46 ± 0.17 c
25 min3.2 ± 0.4 a1.52 ± 0.18 b4.37 ± 0.29 a1.67 ± 0.18 c
30 min3.8 ± 0.4 a1.72 ± 0.29 a4.5 ± 0.3 a1.27 ± 0.10 c
35 min3.6 ± 0.3 a1.8 ± 0.3 a4.4 ± 0.3 a1.39 ± 0.17 c
40 min3.8 ± 0.4 a1.80 ± 0.29 a3.9 ± 0.4 a1.51 ± 0.15 c
45 min3.8 ± 0.4 a1.7 ± 0.3 a4.1 ± 0.4 a1.58 ± 0.14 c
50 min3.9 ± 0.4 a1.79 ± 0.23 a4.1 ± 0.3 a1.42 ± 0.15 c
55 min3.6 ± 0.4 a1.48 ± 0.16 b,c3.75 ± 0.26 a1.21 ± 0.13 c
60 min3. 6 ± 0.3 a1.22 ± 0.13 c3.9 ± 0.3 a1.51 ± 0.15 c
9-days
0 min----
5 min1.83 ± 0.23 c1.83 ± 0.23 a2.55 ± 0.22 c2.55 ± 0.27 a
10 min3.60 ± 0.26 b1.80 ± 0.26 a3.8 ± 0.3 b1.75 ± 0.19 b
15 min4.6 ± 0.3 b1.58 ± 0.27 a4.74 ± 0.15 a1.19 ± 0.08 c
20 min5.8 ± 0.3 a1.48 ± 0.22 a,b4.9 ± 0.4 a1.58 ± 0.28 b,c
25 min6.5 ± 0.7 a1.51 ± 0.17 a5.48 ± 0.27 a1.50 ± 0.15 b,c
30 min7.4 ± 0.6 a1.50 ± 0.12 a5.5 ± 0.3 a1.58 ± 0.12 b,c
35 min7.3 ± 0.5 a1.48 ± 0.16 a,b5.6 ± 0.4 a1.66 ± 0.16 b,c
40 min7.1 ± 0.7 a1.52 ± 0.16 a5.2 ± 0.3 a1.62 ± 0.16 b,c
45 min7.0 ± 0.7 a1.76 ± 0.14 a5.5 ± 0.4 a1.39 ± 0.14 b,c
50 min7.1 ± 0.7 a1.37 ± 0.13 b5.3 ± 0.4 a1.27 ± 0.13 b,c
55 min7.0 ± 0.6 a1.22 ± 0.15 c5.7 ± 0.3 a1.64 ± 0.15 b,c
60 min6.8 ± 0.6 a1.39 ± 0.14 b5.5 ± 0.3 a1.39 ± 0.14 b,c
14-days
0 min----
5 min1.86 ± 0.21 d1.86 ± 0.21 a2.39 ± 0.20 c2.39 ± 0.16 a
10 min3.5 ± 0.3 c1.62 ± 0.20 a3.54 ± 0.21 b2.08 ± 0.19 a,b
15 min3.8 ± 0.3 c1.61 ± 0.18 a3.69 ± 0.24 b1.79 ± 0.08 b,c
20 min5.2 ± 0.4 b1.28 ± 0.17 b5.1 ± 0.4 a1.69 ± 0.21 b,c
25 min6.2 ± 0.5 a1.56 ± 0.21 a5.26 ± 0.19 a1.54 ± 0.13 c,d
30 min6.1 ± 0.5 a1.12 ± 0.18 b,c5.31 ± 0.25 a1.35 ± 0.10 d
35 min6.2 ± 0.5 a1.45 ± 0.20 a5.20 ± 0.24 a1.32 ± 0.16 d
40 min6.4 ± 0.5 a1.40 ± 0.12 a5.39 ± 0.25 a1.31 ± 0.16 d
45 min6.5 ± 0.5 a1.18 ± 0.15 b,c5.4 ± 0.4 a1.20 ± 0.11 d
50 min7.1 ± 0.4 a1.57 ± 0.16 a5.9 ± 0.3 a1.26 ± 0.15 d
55 min7.3 ± 0.4 a1.01 ± 0.12 c5.9 ± 0.3 a1.13 ± 0.11 d
60 min6.9 ± 0.4 a0.96 ± 0.14 c5.8 ± 0.4 a0.92 ± 0.10 d
a–d—mean values in columns within each ageing time with different letters differ at p < 0.05. ΔE0—the color difference between a freshly cut beef (0 min) and the next measurement on the sample; ΔExy—the color difference between two consecutive measurements on the sample.
Table 2. The influence of muscles (M) and ageing time (A) on color parameters (20 min blooming) of LL and (25 min blooming) of SM (mean values ± SEM).
ParameterMuscles n = 72Ageing (A) n = 48Significance (p Value)
LLSM1 Day9 Days 14 Days MAMxA
Lightness, L *37.22 ± 0.24 a35.6 ± 0.3 b35.1 ± 0.3 B36.8 ± 0.4 A37.3 ± 0.3 A0.0010.001NS
Redness, a *17.94 ± 0.21 b19.93 ± 0.24 a17.25 ± 0.22 B19.70 ± 0.26 A19.91 ± 0.29 A0.0010.001NS
Yellowness, b *13.98 ± 0.25 b15.66 ± 0.25 a12.84 ± 0.22 B15.80 ± 0.22 A15.88 ± 0.26 A0.0010.0010.031
Chroma, C *22.8 ± 0.3 b25.4 ± 0.3 a21.5 ± 0.3 B25.3 ± 0.3 A25.5 ± 0.4 A0.0010.001NS
Hue angle, H *37.8 ± 0.26 a37.8 ± 0.21 a36.59 ± 0.24 B38.54 ± 0.21 A38.74 ± 0.27 ANS0.0010.012
NS—nonsignificant at p > 0.05. a,b—mean values in rows within muscles with different letters differ at p < 0.05. A,B—mean values in rows within each ageing time with different letters differ at p < 0.05.
Table 3. The influence of ageing time on color parameters of LL and SM muscles (n = 24) (mean values ± SEM).
Ageing (A)LLSM
1 Day9 Days14 Days1 Day9 Days14 Days
Lightness, L *35.9 ± 0.4 b37.9 ± 0.4 a37.7 ± 0.4 a34.3 ± 0.3 b35.7 ± 0.6 a36.7 ± 0.5 a
Redness, a *16.30 ± 0.18 b18.61 ± 0.29 a19.02 ± 0.24 a18.21 ± 0.23 b20.78 ± 0.23 a20.8 ± 0.5 a
Yellowness, b *11.78 ± 0.15 b14.81 ± 0.21 a15.44 ± 0.21 a13.89 ± 0.23 b16.80 ± 0.17 a16.3 ± 0.5 a
Chroma, C *20.12 ± 0.21 b23.8 ± 0.3 a24.5 ± 0.3 a22.9 ± 0.3 b26.73 ± 0.25 a25.4 ± 0.6 a
Hue angle, H *35.9 ± 0.3 b38.5 ± 0.3 a39.2 ± 0.23 a37.31± 0.28 b38.97 ± 0.26 a38.4 ± 0.4 a
a,b—mean values in rows within each muscles ageing time with different letters differ at p < 0.05.
Publisher’s Note: MDPI stays neutral with regard to jurisdictional claims in published maps and institutional affiliations.

