Data-Driven Approach for Incident Management in a Smart City
by
 , , , and
Luís B. Elvas
1,2 ,
,
Carolina F. Marreiros
1,
João M. Dinis
1,
Maria C. Pereira
1, 
Ana L. Martins
3 and
João C. Ferreira
1,2,*
1
ISTAR, ISCTE-Instituto Universitário de Lisboa, 1649-026 Lisboa, Portugal
2
Inov Inesc Inovação—Instituto de Novas Tecnologias, 1000-029 Lisbon, Portugal
3
Business Research Unit (BRU-IUL), Iscte-Instituto Universitário de Lisboa, 1649-026 Lisbon, Portugal
*
Author to whom correspondence should be addressed.
Appl. Sci. 2020, 10(22), 8281; https://0-doi-org.brum.beds.ac.uk/10.3390/app10228281
Submission received: 29 October 2020
/
Revised: 19 November 2020
/
Accepted: 20 November 2020
/
Published: 22 November 2020
(This article belongs to the Special Issue New Directions in Hazard and Disaster Science: Advances in Applied Sciences II)
Abstract
:Buildings in Lisbon are often the victim of several types of events (such as accidents, fires, collapses, etc.). This study aims to apply a data-driven approach towards knowledge extraction from past incident data, nowadays available in the context of a Smart City. We apply a Cross Industry Standard Process for Data Mining (CRISP-DM) approach to perform incident management of the city of Lisbon. From this data-driven process, a descriptive and predictive analysis of an events dataset provided by the Lisbon Municipality was possible, together with other data obtained from the public domain, such as the temperature and humidity on the day of the events. The dataset provided contains events from 2011 to 2018 for the municipality of Lisbon. This data mining approach over past data identified patterns that provide useful knowledge for city incident managers. Additionally, the forecasts can be used for better city planning, and data correlations of variables can provide information about the most important variables towards those incidents. This approach is fundamental in the context of smart cities, where sensors and data can be used to improve citizens’ quality of life. Smart Cities allow the collecting of data from different systems, and for the case of disruptive events, these data allow us to understand them and their cascading effects better.
1. Introduction
Cities—in the context of a Smart City, where most data are available to understand Critical Infrastructures (CI)—play an important role in ensuring the livability, safety, security, and health of citizens. Modern critical infrastructures are becoming increasingly smarter, leading to the birth of Smart Cities. Following the beginning of the COVID-19 pandemic, it became clear that the Smart City should be considered an overall Critical Infrastructure composed of a set of infrastructures that are, in turn, critical and part of the same system, with strong interdependencies. In this perspective, the failure of one of its components can lead to a series of internal cascading effects, such as compromising the functioning of the Smart City itself.
Making the Smart City Critical Infrastructure (SCCI) and its Critical Infrastructure Components (CIC) smarter usually means making them smarter in regular operation and use—more adaptive, more intelligent, and more connected. Making existing infrastructures smarter is usually associated with making them more complex, but it can also make them more vulnerable and subject to cascading effects. The SCCI is exposed to extreme threats, such as physical disasters or cyber-attacks. Protecting the CIC and ensuring their continued operation will be an important part of assuring the future sustainability of the SCCI. It is therefore essential to minimize the destruction of CIC and interrupt the cascading effects on the Smart City [1]; this could be achieved with a Smart Resilience approach. The CIC’s ability to anticipate, prepare for, adapt, withstand, respond to, and recover will influence the resilience of the SCCI [1]. Current response procedures rely on outdated information sharing techniques and provide little or no opportunity to produce change within the failing infrastructure systems. There may also be a minimal understanding of important systems and their roles that are being provided by components of the failing system.
Disasters and incidents have increased due to climate change, increasing population, more economic activity, and infrastructure aging. Natural disasters increased in 2000–2010 to about 3500, while in 1970–1980, they were five times less (about 750) [2]. The identification and characterization of the type of event that has been happening are essential to make informed management decisions and to prevent future disasters. Without reliable and up to date data, response readiness and the ability to anticipate new accidents are low, resulting in a poor ability to strategically plan for mitigation, adaptation, or response. This results in increased vulnerability to events and decreased resilience [3]. Accidents did not occur often and as such, there used to be no structured data available; however, due to the increase in their frequency, this topic is receiving more attention and data are starting to be collected. These data can be analyzed for proper knowledge extraction and consequently, allow for better decision making and planning by competent authorities. Data allow the identification of spatiotemporal patterns and correlations among different variables. Disaster management requires data and knowledge information for the development of better contingency plans and better decision making during the crisis process.
Lisbon, the capital of Portugal, is a city with little over five hundred thousand inhabitants, but if the surrounding areas are considered, the population is about 3500 thousand. It is a city with intense activity, and the incidents that emerge are addressed by a limited volume of resources (both material and human).
With this research work, we aim to improve the performance of incidents management in the city of Lisbon by understanding what the leading causes of these incidents are and how the city should prepare based on the identified causes to prevent the impact of natural disasters. In doing so, we will perceive which areas are the most vulnerable and where the impacts will be more significant. In parallel, the variables more relevant to incidents will be identified to improve preparedness and allow prevention units to be ready to respond to upcoming incidents.
To achieve the goal of this research, we will use data from the Lisbon incident report system, and through a data-driven process, identify the significant spatial–temporal patterns of these data. The extraction of important facts will allow the development of improved plans for city preparedness (resource planning and intervention). Since the data represent incidents in a city, their understanding through descriptive analytics will allow, for instance, better planning of fire brigades and other intervention teams, and also, an improved intervention. By allowing increased resilience in some of the critical infrastructures, data analytics will prevent the magnitude of a possible cascading effect.
2. State of the Art
Urban communities can be viewed as the complex dynamic interactions of physical, social, economic, and environmental systems [4]. An urban system may be exposed to a great variety of external shocks like environmental disasters such as earthquakes, floods, and fires (e.g., a very strong earthquake followed by a massive tsunami in Lisbon in 1755), socio-natural hazards associated with socio-economic fragilities of urban populations [5] causing social unrest (e.g., Tripoli) [6] and human-made disasters [7] like building fires and infrastructure, industrial, or technological accidents. Many aspects of urban development affect disaster risk, like urban growth boundaries, density, structural types, construction standards, and specifications. Progressive urban development initiatives usually promote compact urban form and, inadvertently, often serve to aggravate natural hazard risk in hazard-prone areas [8] and human-made disasters by increasing urban density. Multi-hazard risk analyses demonstrate the value of acknowledging different sources of risk. Considering multiple hazards simultaneously can help decision-makers in an urban area to prioritize risk management and climate adaptation actions [5]. Comparing risks across hazards on a frequent and consistent basis, such as in terms of the value of property damage, can allow for identifying which hazards are associated with higher expected losses [9]. The methodological approaches in risk assessment studies range from very coarse indices to elaborate assessments. An example of a coarse index approach is the methodology based on readily available data and expert knowledge about the hazards and their possible effects on the municipality [10]. This method yields a ranking of the different risks in a community and guides both mitigation and preparedness priorities [10]. At the other end of the spectrum, elaborate assessments consider the complete risk chain using complex simulation tools for hazard and vulnerability analyses, but most of them lack the multi-hazard aspect [11]. One example of a true multi-hazard study in damage to buildings quantifies the damage resulting from a range of natural hazards in Australia [12].
To conduct risk analysis in a multi-hazard scenario, large amounts of data are required [2]. For example, historical data on natural disasters, geo-location and topography data, atmospheric data, and data on human and socio-economic losses due to each type of disaster are required. As a data source for historical data, EM-DAT and Wikipedia are primarily used [2,3,6]. Since 1988, the Centre for Research on the Epidemiology of Disasters, located in the School of Public Health at the Université Catholique de Louvain, has been developing and maintaining an Emergency Events Database (EM-DAT). Geographical, topographic, and geological data can be obtained from Geographical Information Systems (GIS) [5,13,14,15], HAZUS [8,16], satellites [14,16,17,18], local records [8,17,19], and social media [2,7,20]. HAZUS is a geographic information system-based natural hazard analysis tool developed and freely distributed by the Federal Emergency Management Agency (FEMA). As sources for atmospheric data, remote sensing, weather stations, and national meteorological information centers are being used [2,14,15,18]. Data of man-made disasters are commonly obtained from social media (Twitter), local emergency services (fire brigades, municipal services, hospitals), and others like interviews and surveys [2,3,4,7,8,13,20,21].
Research and applications concerning multi-source data fusion oriented to disaster emergencies are severe problems, owing to the diverse data sources. Combining and analyzing multi-sourced data and extracting critical information can be quite challenging, especially during a crisis [2]. Various types of computational infrastructures are being used to address this challenge of a large volume of data, which are often hard to store, difficult to visualize, and are highly variable in format and type. The process of examining large and varied datasets is usually denominated “big data” analytics and is especially important in disaster mitigation, and risk and resilience analysis [22]. The recent development of cloud computing has been increasingly viewed as a viable solution to utilize multiple low-profile computing resources to parallelize the analysis of massive data into smaller processes [22]. Python (Pandas) is currently used to integrate various datasets and form the basis repository [4]. After the creation of a data repository, a considerable amount of processing is necessary. Some steps present in the preparation of data are the initial cleaning of missing, incomplete, or incorrect information in the dataset, selecting relevant features, cleaning irrelevant variables, and formulating scores. To perform feature selection, some analyses have attempted to use machine learning algorithms and statistical correlation methods [4]. Machine learning is a branch of artificial intelligence that focuses on algorithms for prediction and classification. These algorithms are either supervised or unsupervised. Least squares and nearest neighbor analyses are commonly used supervised methods, while cluster analyses are widely used for unsupervised methods [22]. One of the machine learning methods for developing prediction models is the Random Forest classification [23]. Random Forest is an ensemble of decision trees used to perform predictions on new data [23]. Other examples of classifiers are Logit Boost, Naive Bayes, Bayes Net, Logistic regression, K Nearest Neighbors (KNN), and Linear Regression [24]. We highlight data/text mining and statistical analysis. The publications considered have a diversity of approaches, taking into account social networks, Geographic information systems, and emergency databases. These sources provide data for these decision support systems (DSS), but the major problem is data integration and access due to system diversity and that there is no data standardization performed among several proprietary systems. The search was performed in the Scopus and Google Scholar databases using, as the preferable source, journal papers. A list of 24 documents was gathered. Their titles and abstracts were analyzed in detail for topic propriety, and duplications were eliminated. In the end, 19 documents remained. From the publication dates, it is possible to conclude that data analysis for disaster management is an emergent topic. In the context of smart cities, more data will be available, and it will be the trigger to the DSS. Table 1 summarizes some of the relevant publications from the past five years on the topic of decision support systems (DSS) for disaster management.
3. Methodology
3.1. The Case Study Approach
Some infrastructures are common to most cities, but each city has its own specificities. As critical components are interdependent, data analysis needs to address the specificities of each case. Consequently, this research is based on a specific city, the city of Lisbon, the capital of Portugal. Findings are specific from this city; nonetheless, conclusions may apply to cities with a similar profile. With adequate adjustments in terms of the most relevant critical infrastructures and variables, the following methodology applies to other cities.
To narrow the scope of the research and make it sounder, it will focus on one type of infrastructure—buildings.
3.2. Methodology towards SCCI Knowledge Extraction
The methodology follows the CRISP-DM method [26] to use CIC data and transform these into knowledge.
Firstly, and to serve the overall purpose of this research, we detailed the analysis to pinpoint the risks faced by buildings located in Lisbon. We intended to understand what are the main incidents occurring in Lisbon, which ones happen more often, and what are the influencing factors of those incidents.
In order to achieve this, we were provided with a report of the occurrences in the city created by firefighters. This report contained data such as the location of the incident, its category, a brief description of the occurrence (when necessary), and how many elements and vehicles were deployed to resolve the incident.
Secondly, we performed “Data Understanding” by exploring all the variables in the dataset with the data related to incidents in buildings.
In “Data Preparation”, we analyzed the null values from certain entries. The data only included values between 2011 and 2018. The entries with more nulls had 45 nulls. With 6386 entries in the database, those entries were eliminated since they would not have a relevant impact on our dataset. We ended up with a workable dataset of 6341 entries.
The “Type of Occurrence” was one of the variables in the dataset. This variable has already been classified by the system into 20 pre-defined types of CIC incidents. These are as follows:
- Infrastructures and Communication Routes—Falling Structures;
- Infrastructures and Communication Routes—Flood Private Space;
- Industrial–technological—Suspicious Situations—Check Smoke;
- Industrial–technological—Suspicious Situations—Check Smells;
- Industrial–technological—Gas Leak—Plumbing/Conduct;
- Industrial–technological—Gas Leak—Bottle;
- Industrial–technological—Gas Leak—Deposit/Reservoir;
- Accidents—Equipment—Lifts;
- Accidents—Equipment;
- Fire—Building (Infrastructures/Installation)—School;
- Fire—Building (Infrastructures/Installation)—Empty/Degraded Building;
- Fire—Building (Infrastructures/Installation)—Commercial/Shops/Fairs/Transport Station;
- Fire—Building (Infrastructures/Installation)—Performance/Recreation Religious Worship;
- Fire—Building (Infrastructures/Installation)—Services;
- Fire—Building (Infrastructures/Installation)—Hospital/Home;
- Fire—Building (Infrastructures/Installation)—Industry/Workshop/Warehouse;
- Fire—Building (Infrastructures/Installation)—Housing;
- Fire—Building (Infrastructures/Installation)—Hospitality and Similar;
- Fire—Building (Infrastructures/Installation)—Parking;
- Fire—Building (Infrastructures/Installation)—Military/Security Forces.
These 20 types of CIC incidents belong to 4 main categories of incidents, also already defined by the experts for civil protection:
- Fire (building fires);
- Infrastructure (floods and falls);
- Industrial–technological (gas leaks and suspicious situations);
- Accident (with equipment or with elevators).
Based on these four categories, the different subcategories were clustered into these four major categories, to have a better perception of data variation and to have a greater volume of data for each incident category.
Findings showed that the volume of data is well distributed among the four options. We found that industrial technological accidents represent 36.57% of the observations in the database, the occurrences of infrastructure incidents represent 26.94% of the data, accidents represent 21.28% of the data, and fires represent 15.21% of the data under analysis. It is concluded that although industrial and technological situations are the category with the most incidents, the remaining categories are also well represented.
To gain more understanding on the buildings of different municipal zones/neighborhoods (hereafter named “zones”), we imported another dataset with the structure of the building in the different zones of the city. This dataset was nulls free and had the following structures: “with or without a slab”, “concrete”, “stone”, “wood”, and “others”.
Additionally, we had access to the number of buildings by date of construction in each Lisbon zone, and the number of buildings by the number of floors. Experts divided the number of floors into three categories: 1 or 2 floors, 3 or 4 floors, and More than 4 floors. Regarding the construction date of the buildings, experts divided it into five categories, now with the number of buildings constructed: Before 1919, Between 1919 and 1970, Between 1971 and 1990, Between 1991 and 2000, and After 2001.
The status of conservation of the builds in each Lisbon zone was also provided. This status is represented by the proportion of buildings in need of major repairs or badly damaged (%) by geographic location. It varied from 0.89 (zone of Olivais) to 13.04 (zone of Beato).
The average age of the buildings and the number of social houses were also considered. It allowed us not only to understand where the buildings were older but also where low-income families were more concentrated.
The number of habitants in each geographic zone, per gender, was also included. All the previous data were concatenated into a single dataset for analysis. Since we had the date of the incidents reported, we added the temperature, the relative humidity (rh), precipitation, and solar radiation (rad) of the specific day to assess the influence of meteorological parameters on the different incidents.
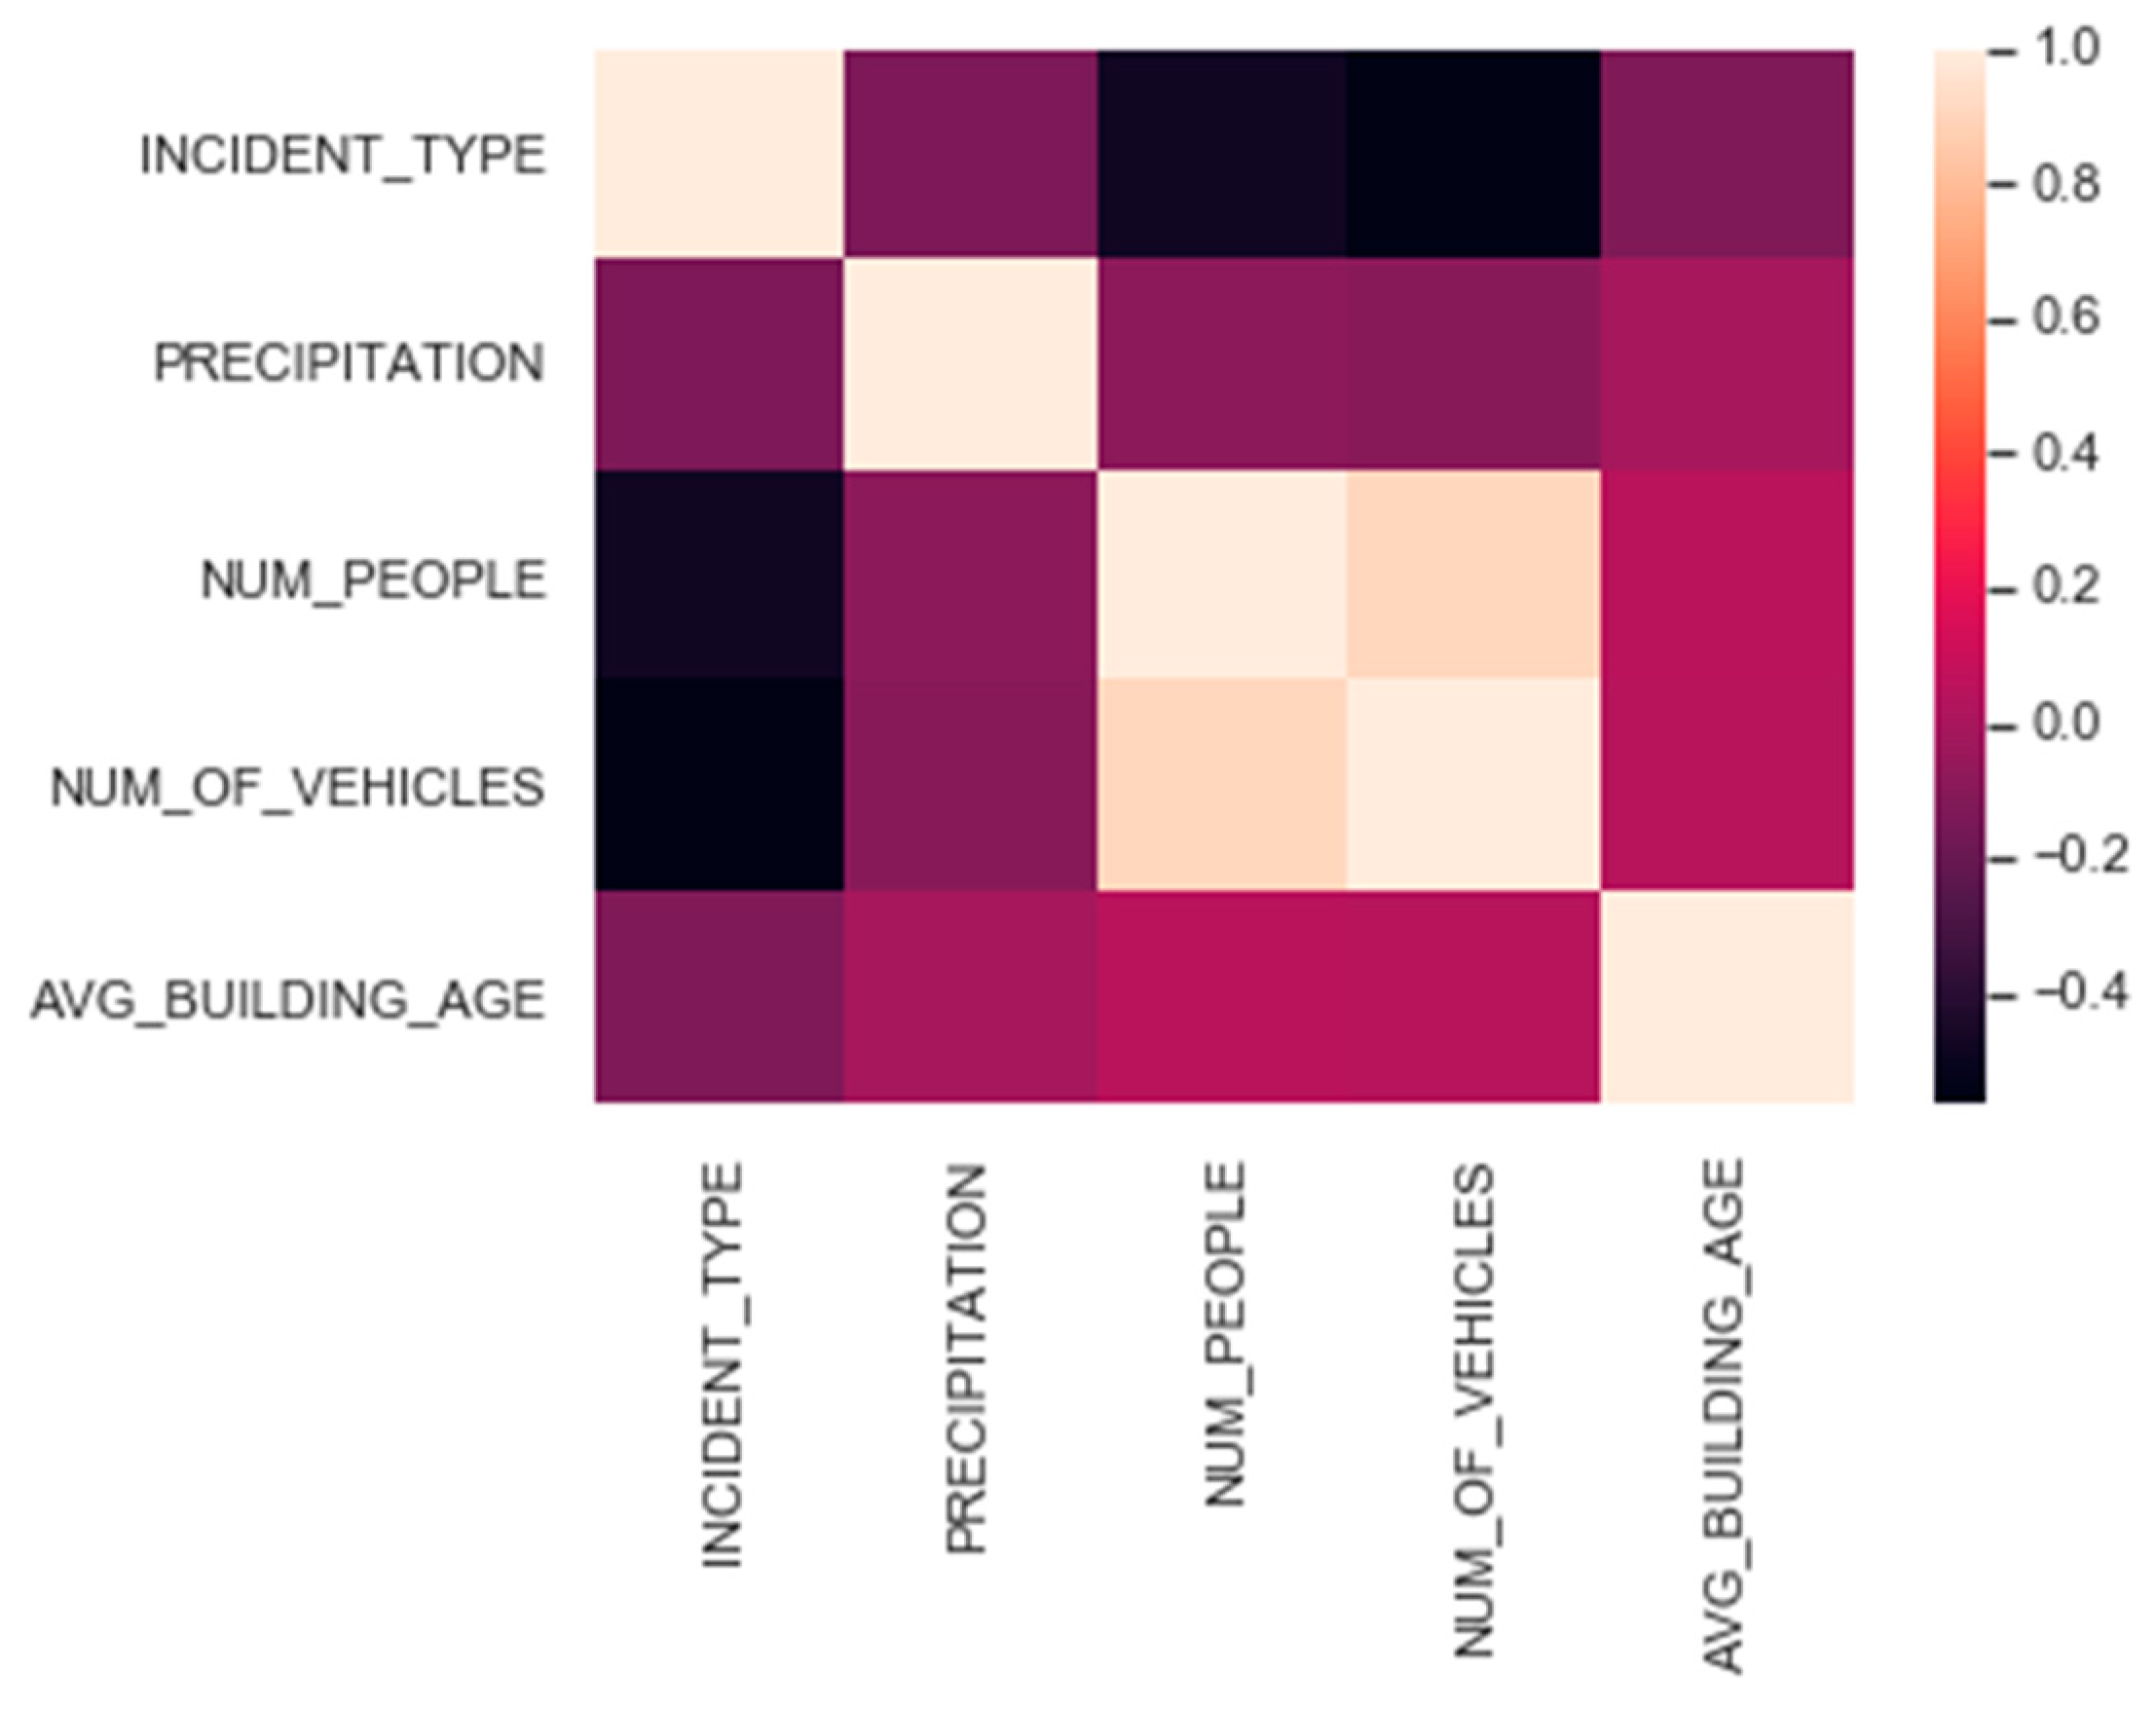
With the dataset complete with variables that we believe could influence the incidents, we performed the first correlation map between them. The variables that showed a stronger association with the occurrence of incidents are the following ones: Number of buildings per structure (Concrete, slab, stone); Number of buildings by the number of floors (1 to 2, 3 to 4, …); Number of buildings constructed per period (before 1919, from 1919 to 1970, 1971 to 1990, …); Conservation status of buildings; Average age of buildings; Number of social stores by zone; Number of individuals per zone; Occurrence month; Day temperature; Precipitation of the day; Zone.
Considering only the variables with the strongest correlations between them, the correlation map presented in Figure 1 was produced.
4. Data Visualization
Spatial-temporal data visualization helps in the construction of the big picture by providing a visual structure that can be easily understood and be used in all phases of emergency management.
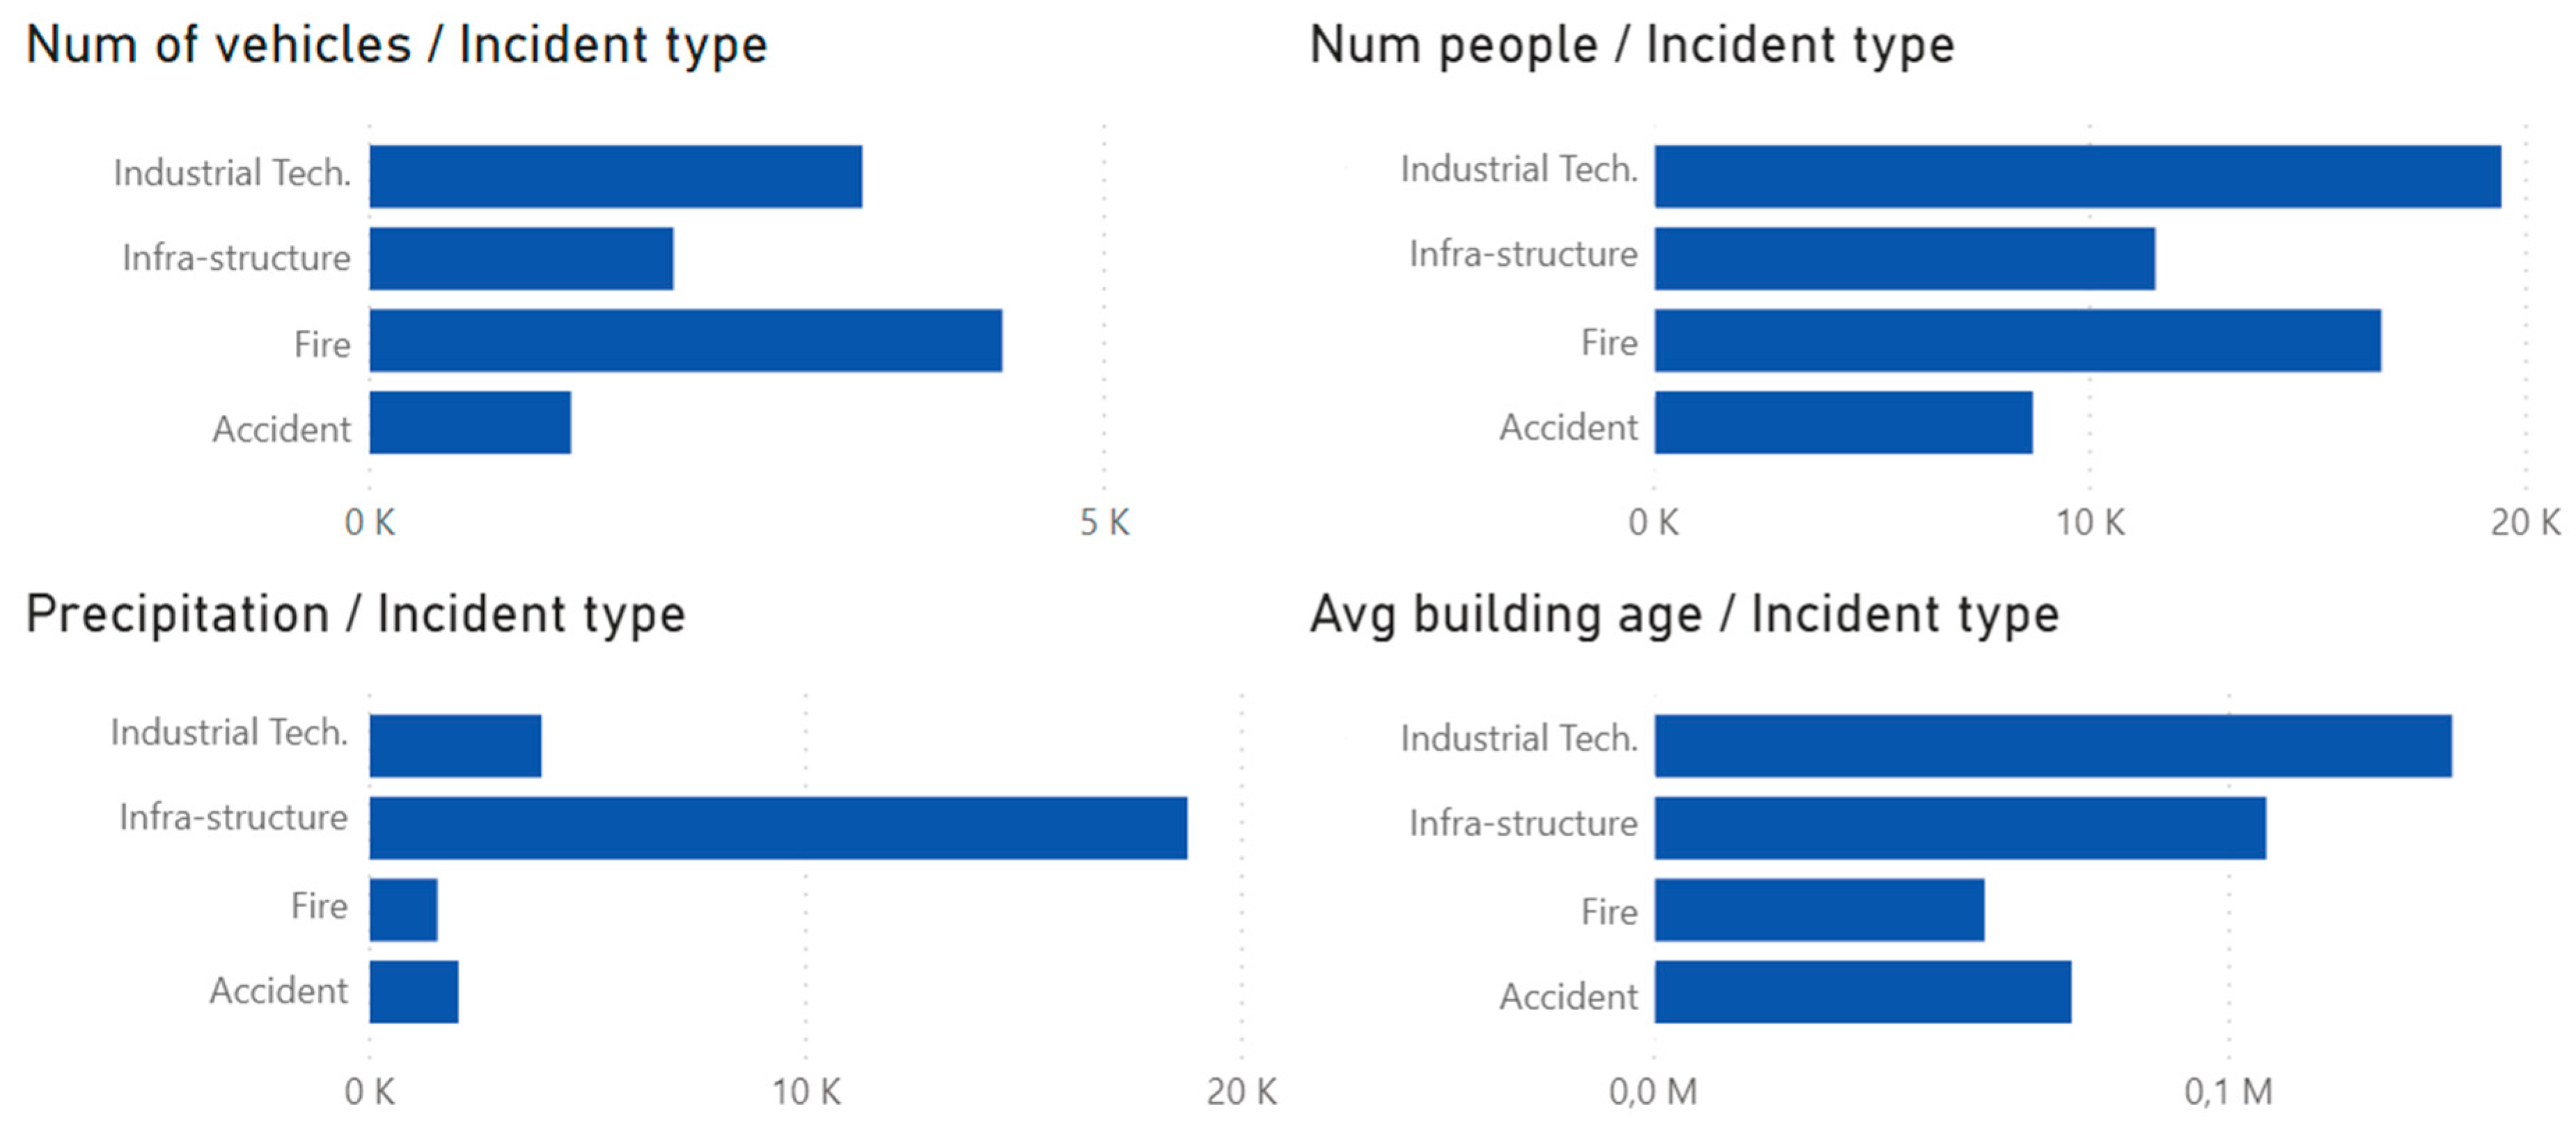
In order to understand the variables and how they relate to each other, we set to make visualizations that explore the following perspectives: temporal (both in the sense of perceiving whether the time (months) have an impact on the type and number of incidents that occur and in the sense of understanding if the building’s age influences the occurrence of events), spatial (perception of zones of concentration of incidents), and construction characteristics of the building (relation between the number of building floors and the type of structure with which they were built and the occurrence of incidents). Aiming to understand how the variables behave, an exploratory analysis was conducted, as shown in Figure 2. For prediction purposes, only variables with a correlation with incident type higher than 0.1 or lower than −0.1 were considered.
The top-left graphic in Figure 2 relates the number of incidents to the number of emergency vehicles used. Data show that fires are the event requiring a greater number of vehicles. This shows that the least frequent incidents (fires) are the ones requiring more resources (emergency vehicles).
The top-right graphic in Figure 2 shows the number of persons that were involved in solving the incident. This resource (human resource) is needed in larger quantities in technological and industrial incidents, and accidents register the lowest number. These findings show that the incidents that occur the most are the ones requiring more human resources, stressing the pressure on the availability of this type of resource.
Regarding precipitation values (bottom-left graphic in Figure 2), it is shown that events related to infrastructure are the ones that occur the most with the increase in precipitation.
The average age of the buildings (bottom-right graphic in Figure 2) highlights that older buildings have a higher incidence of occurrences related to industrial–technological events and infrastructure events. Additional analysis shows that accidents are the most common occurrences among buildings with a lower average age.
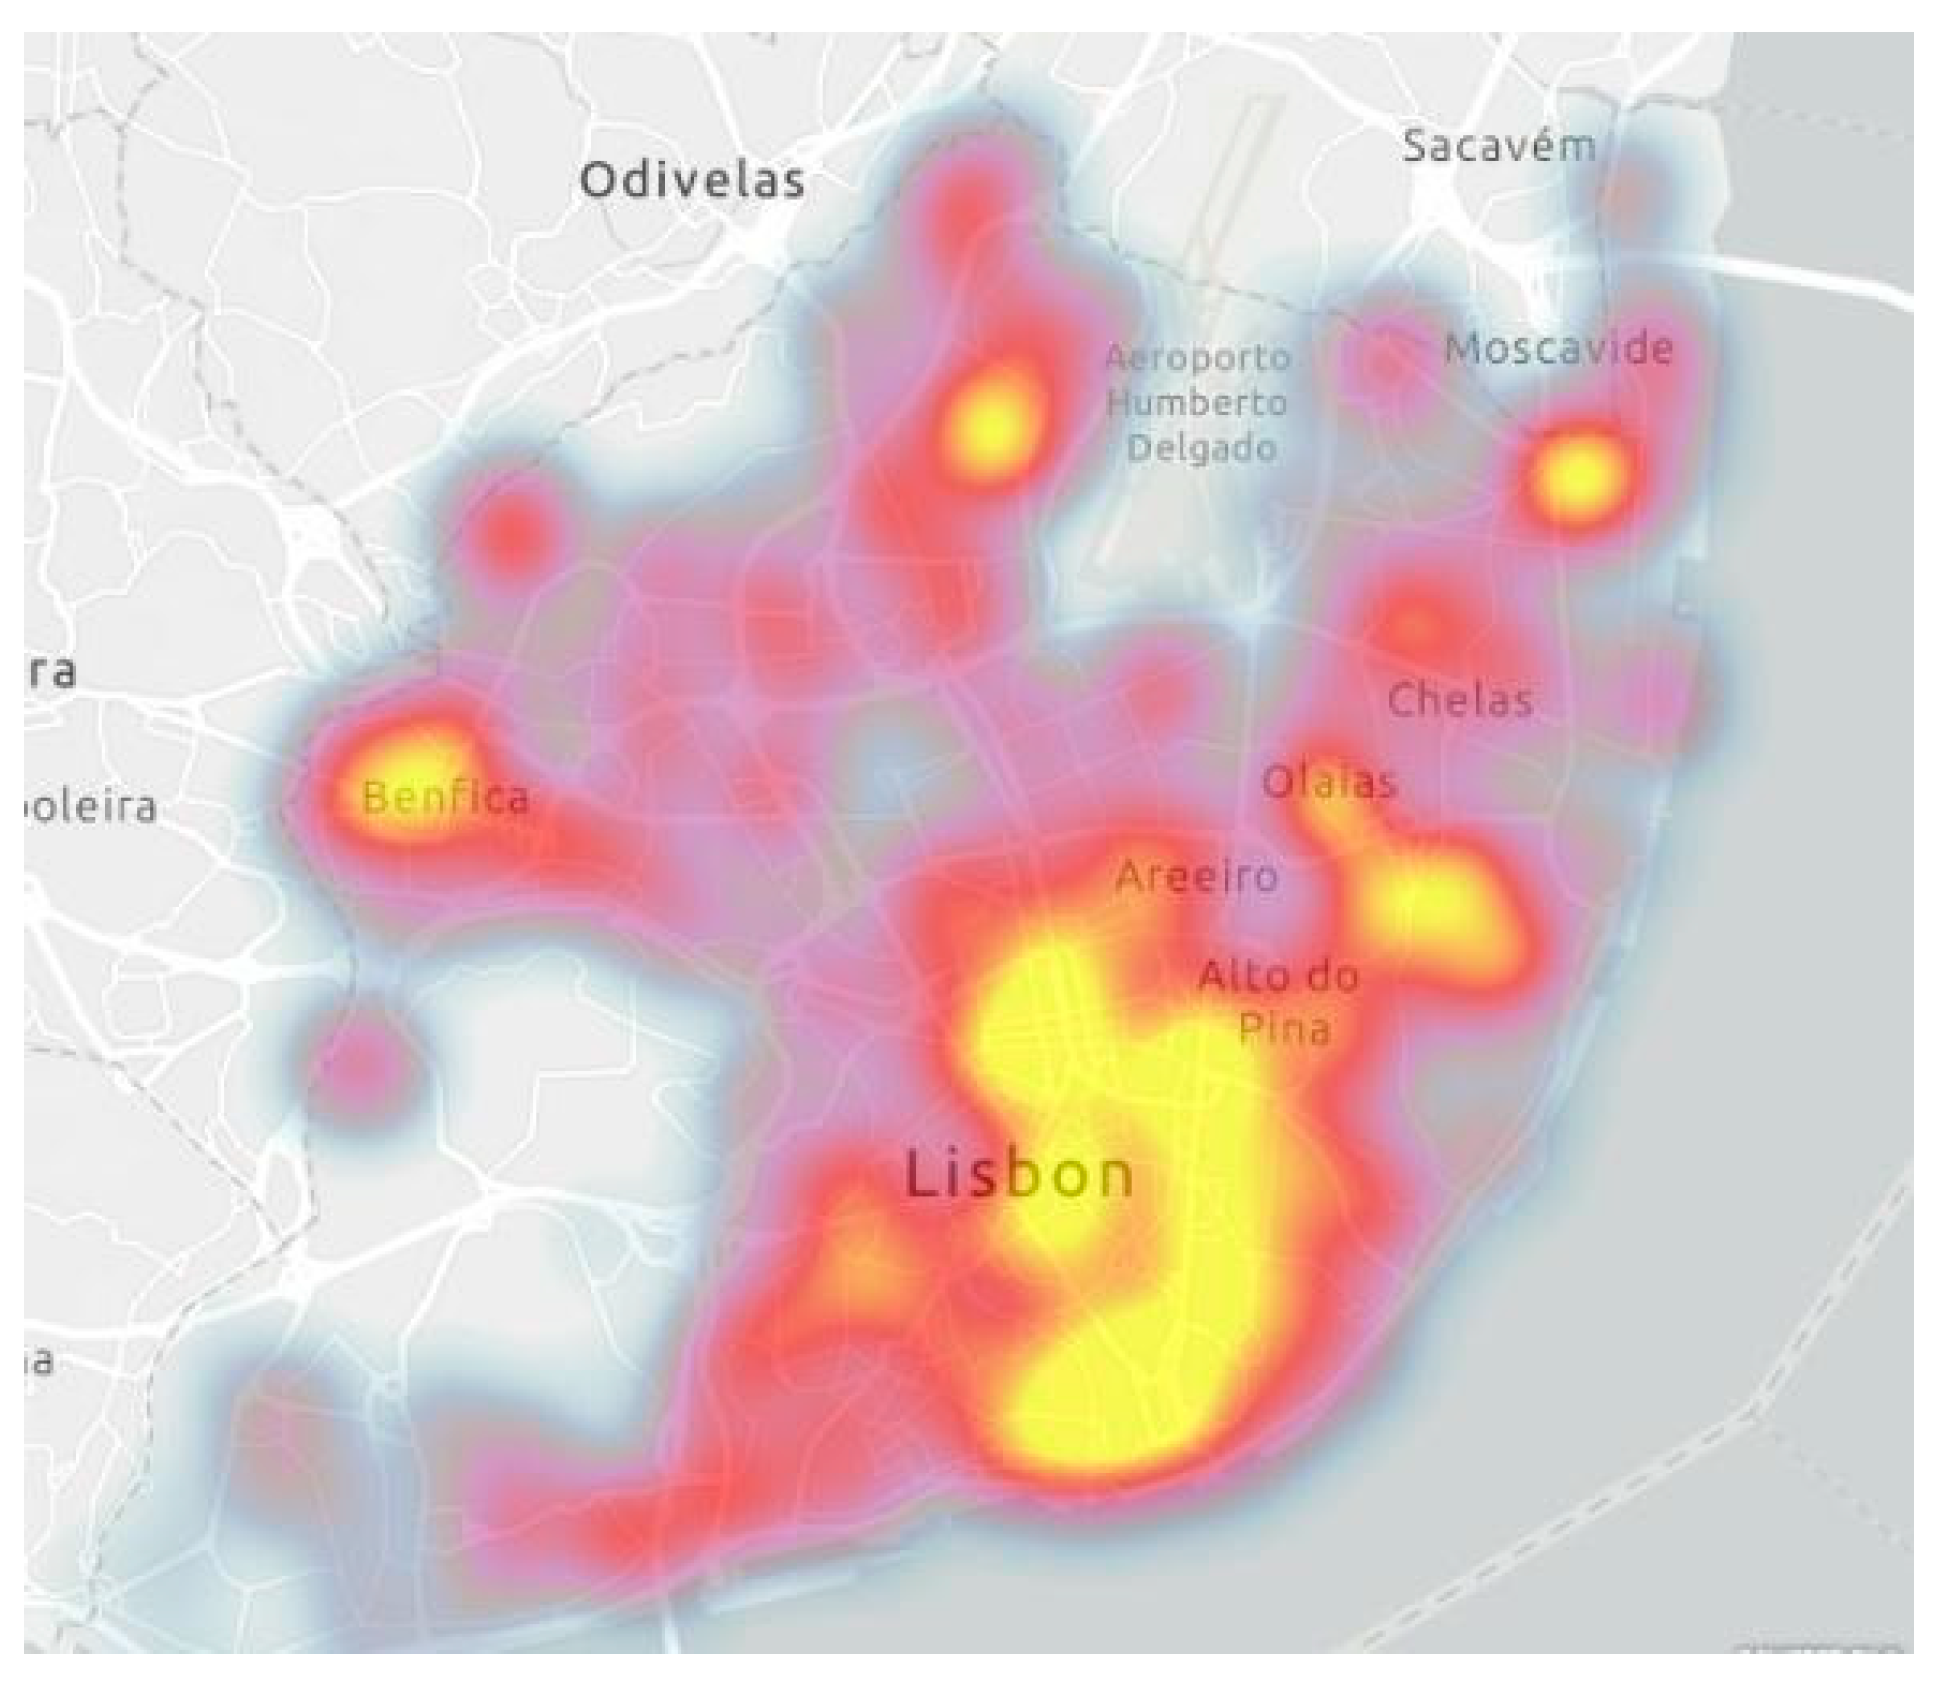
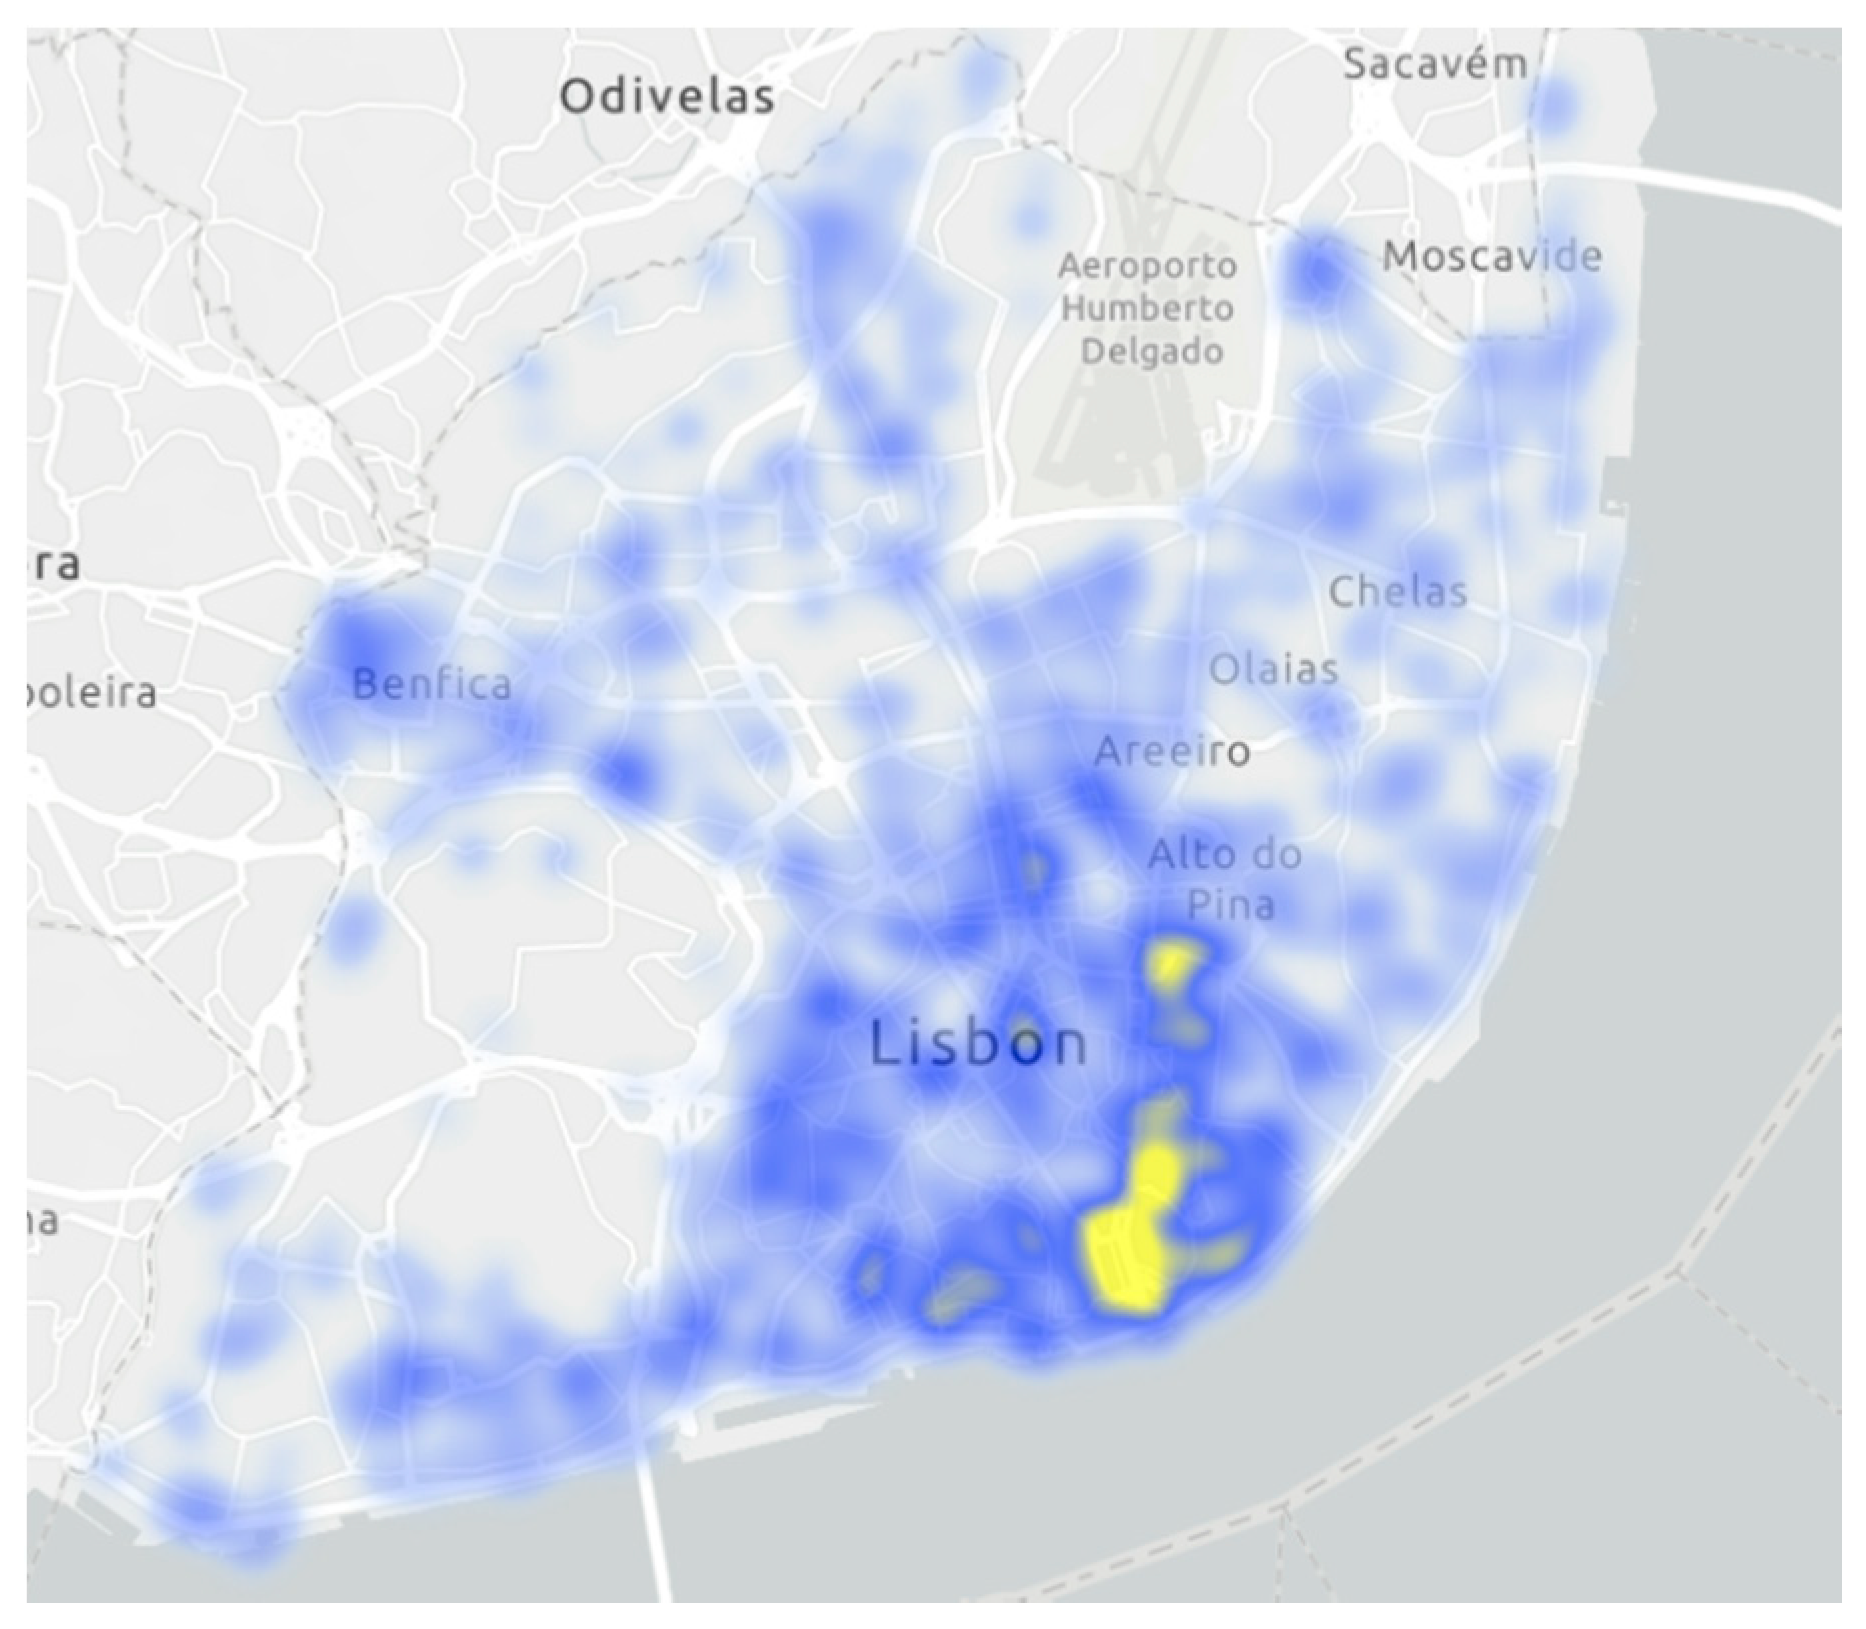
In the heat map of Figure 3, which distributes all occurrences by their location, it is possible to see that these are concentrated in downtown Lisbon, Olaias, Parque das Nações, Lumiar, and Benfica. Heat maps are intuitive spatial data representations where different colors are used to represent areas with different concentrations of points—showing overall shape and concentration trends [27]. From a technical point of view, it is a visualization of the areas of influence of each point and further summation in places where areas overlap. The color gradient shows the power of influence at a certain point. For a non-cartographer user, the map is attractive, easily readable, and the visualization is more comprehensible.
Overall, it is concluded that the four types of incidents under analysis have a greater occurrence in downtown Lisbon, which is, as can be seen in Figure 4, the area of Lisbon with a higher value of buildings antiquity—the historical area of the city. In these zones, streets are narrow. Figure 5 shows the building age distribution in the city and there is a correlation of building age (most of them in the city center) with fire, accidents with equipment, and infrastructure.
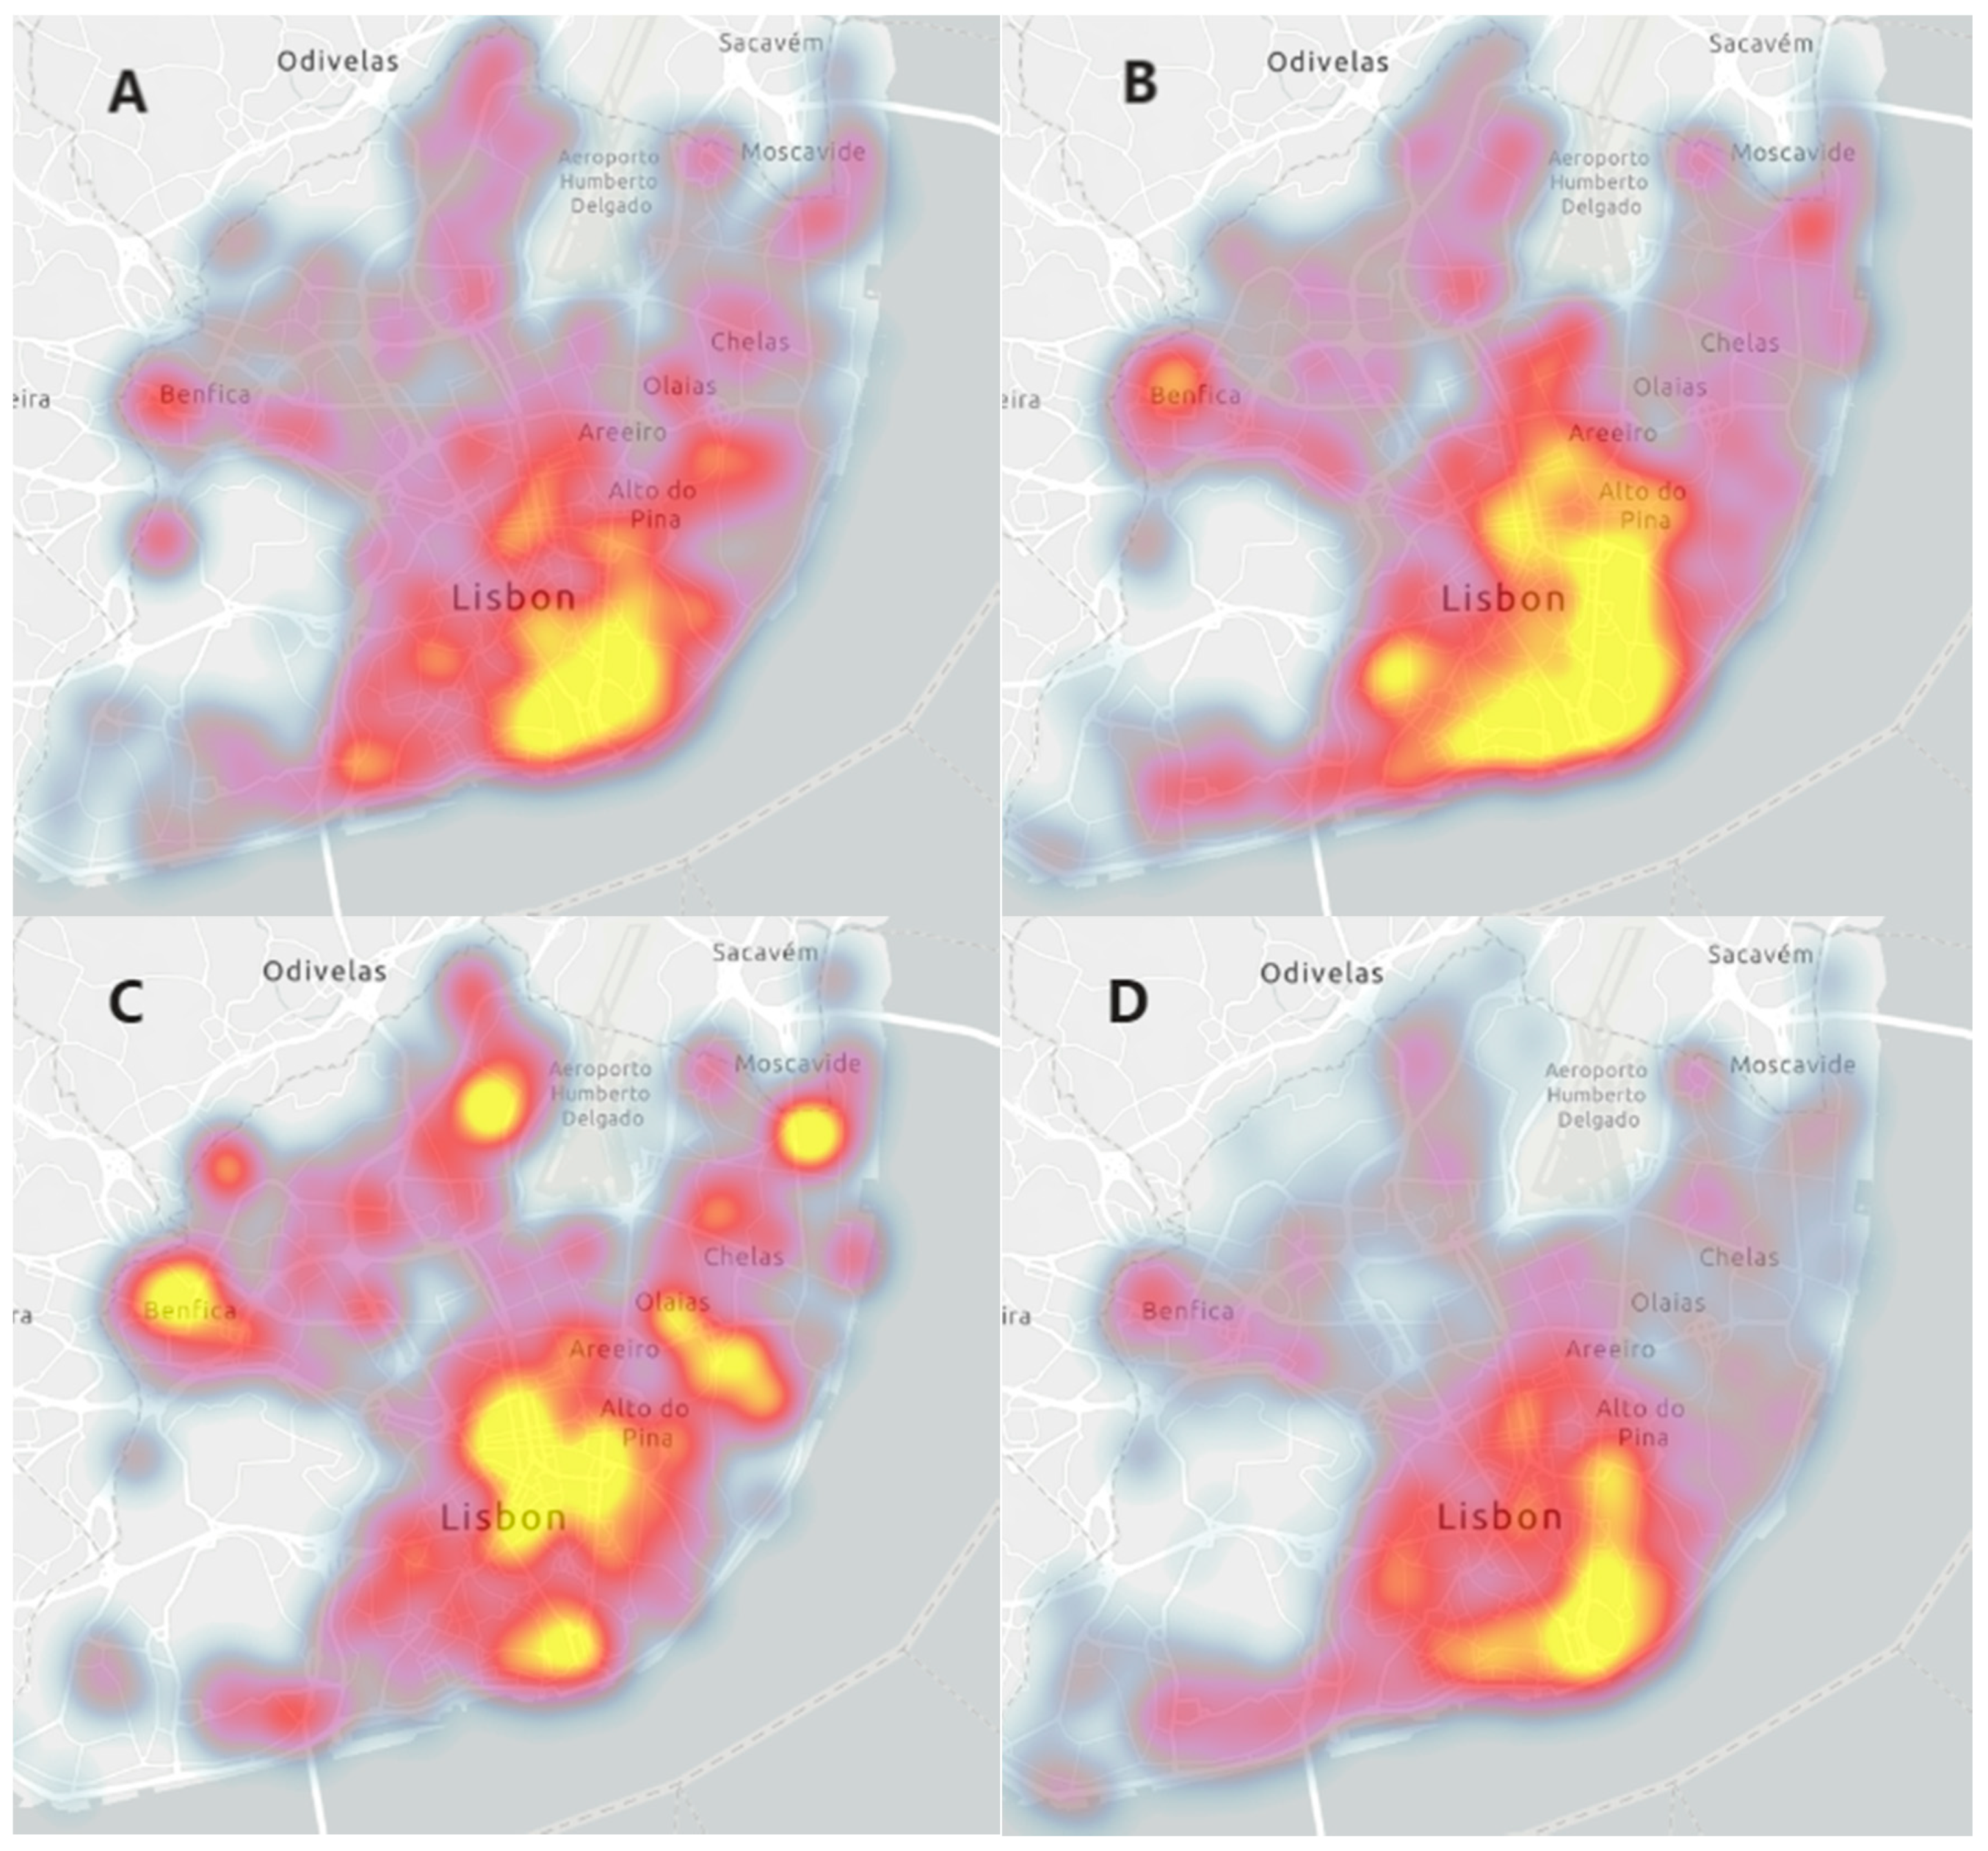
In order to understand the spatial distribution of each type of incident, we have created four heat maps, as shown in Figure 4. It is known that occurrences like accidents have more concentration points, whereas industrial/technological occurrences occupy a greater spot in downtown Lisbon. This hot spot analysis uses heat maps to determine hazard risk, and it is a piece of important information for disaster planning management [28].
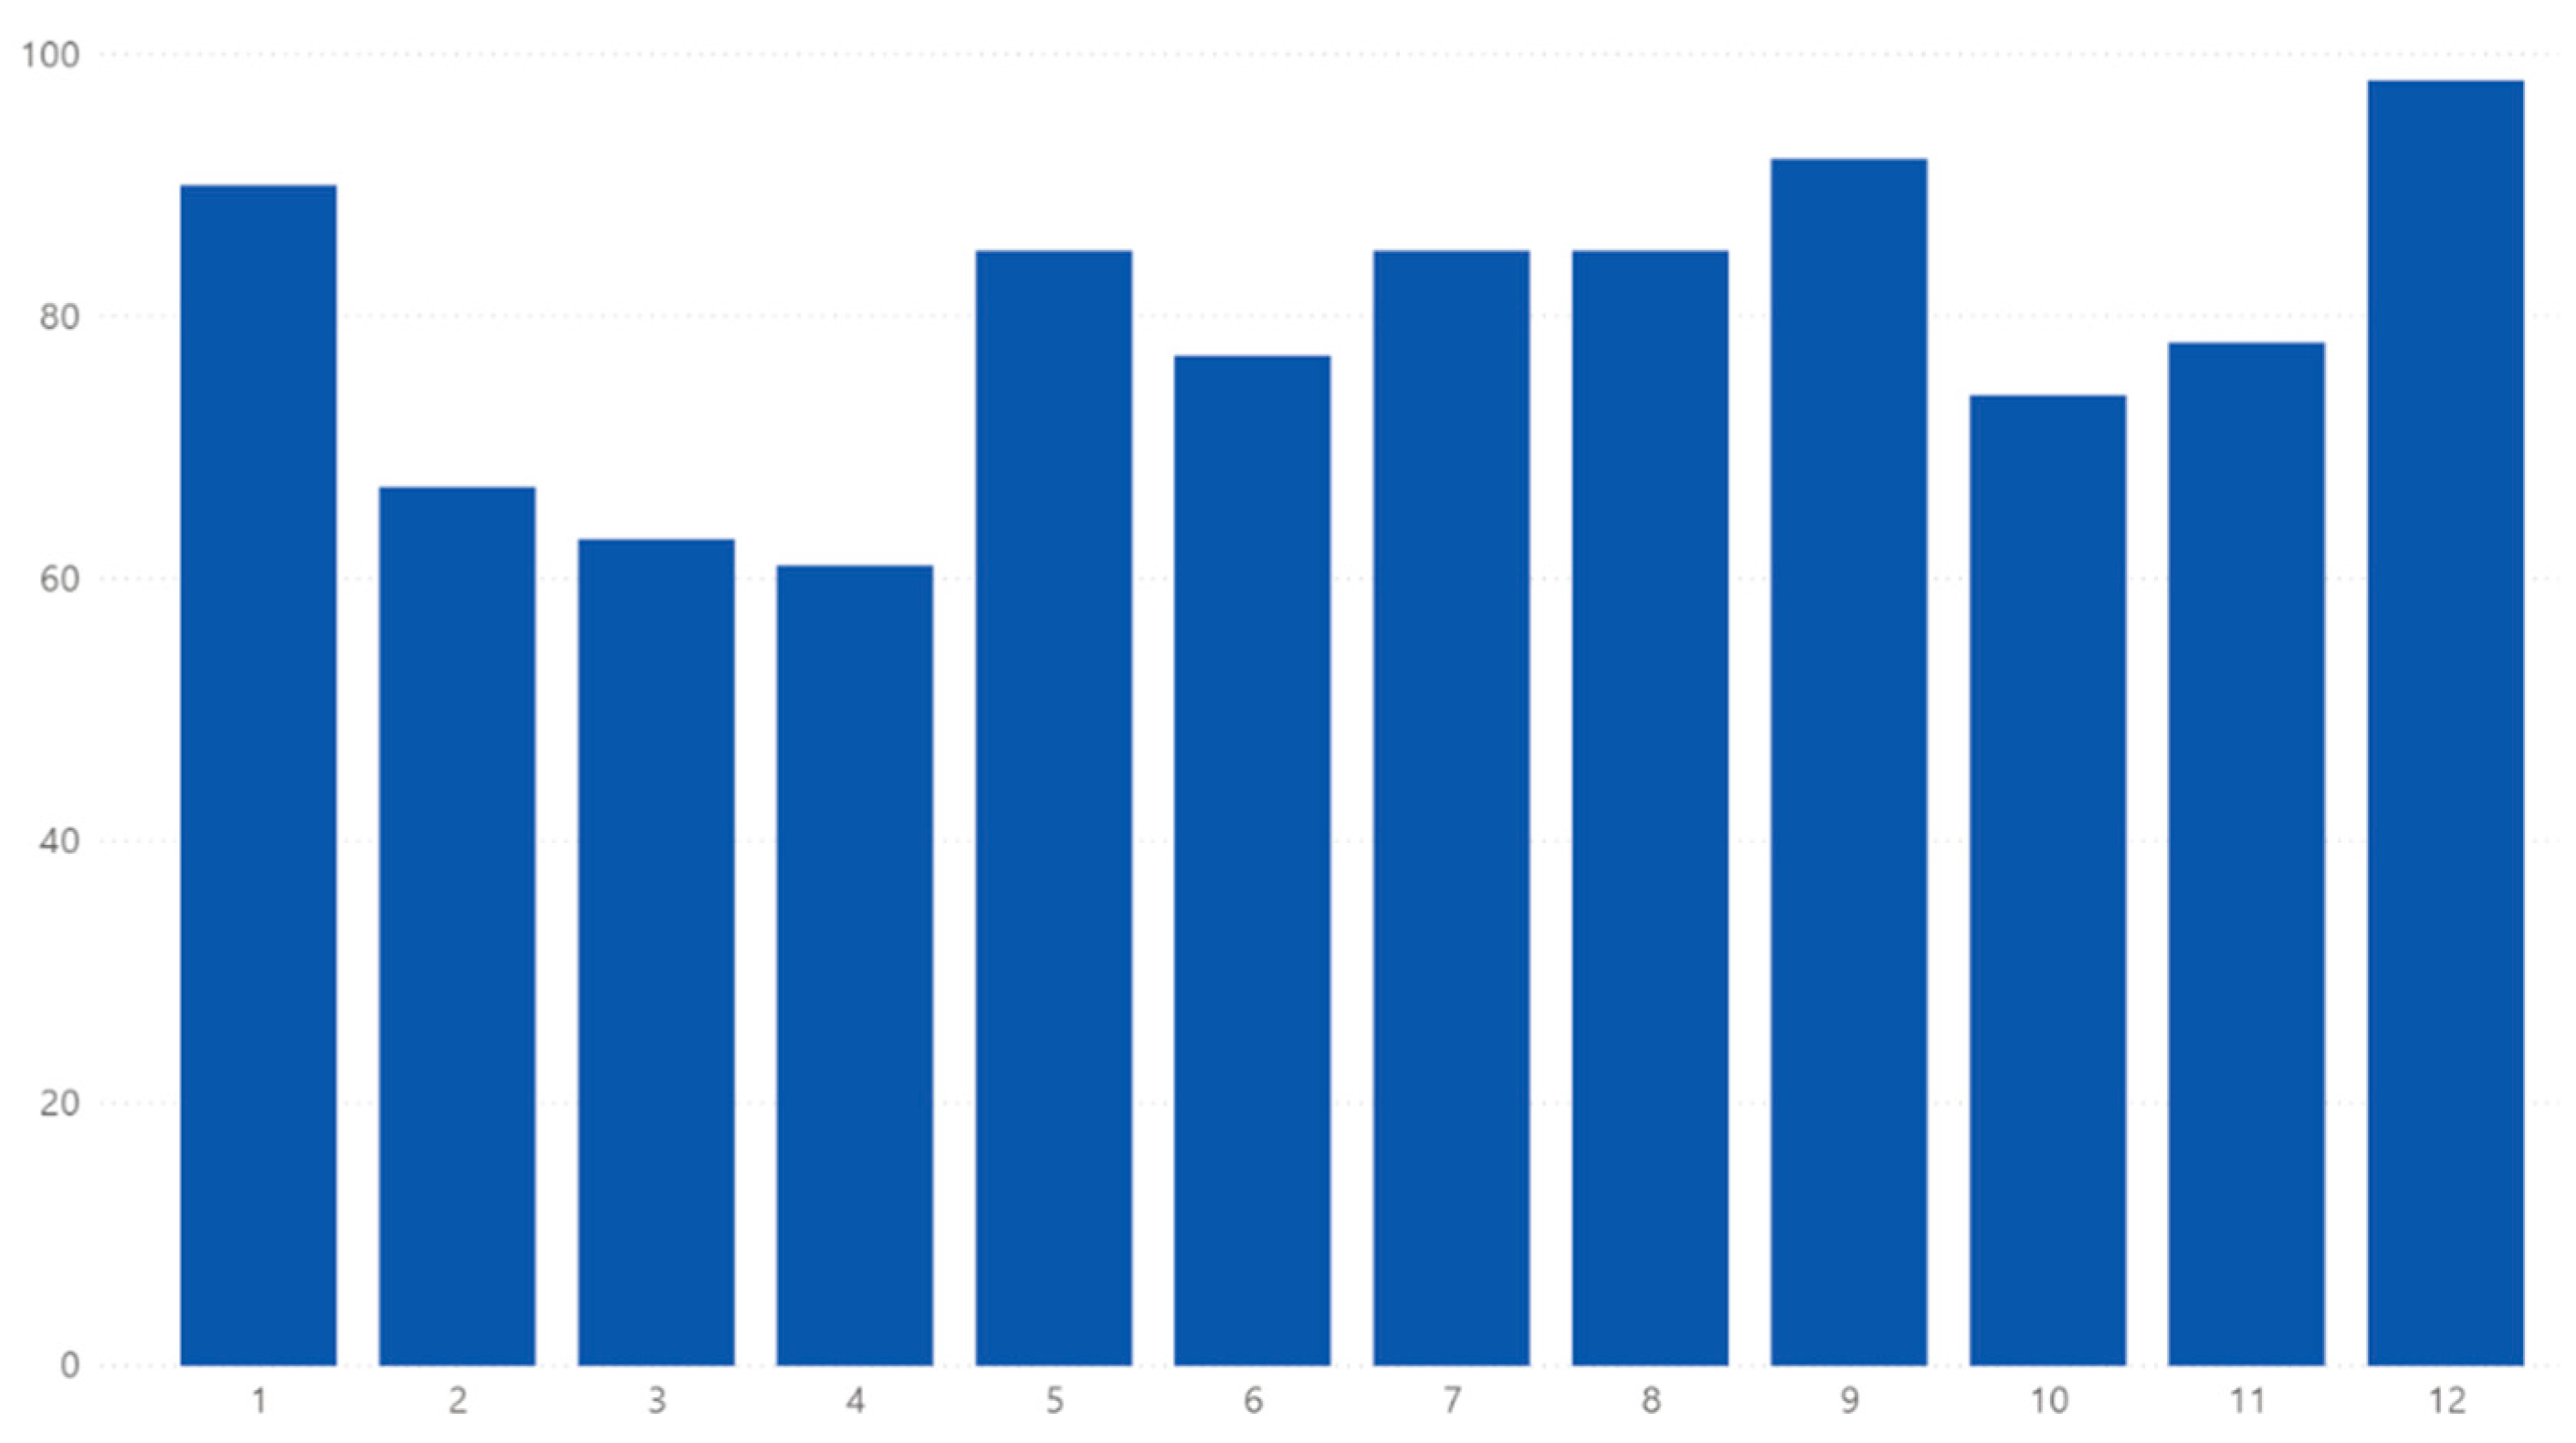
The temporal distribution of occurrences is shown in Figure 6, Figure 7 and Figure 8, which depict the number of each type of incident in each month of the year. Figure 6 shows that fires happen mostly in the summer and the first and last month of the year. This last observation may be due to the use of fireplaces and candles.
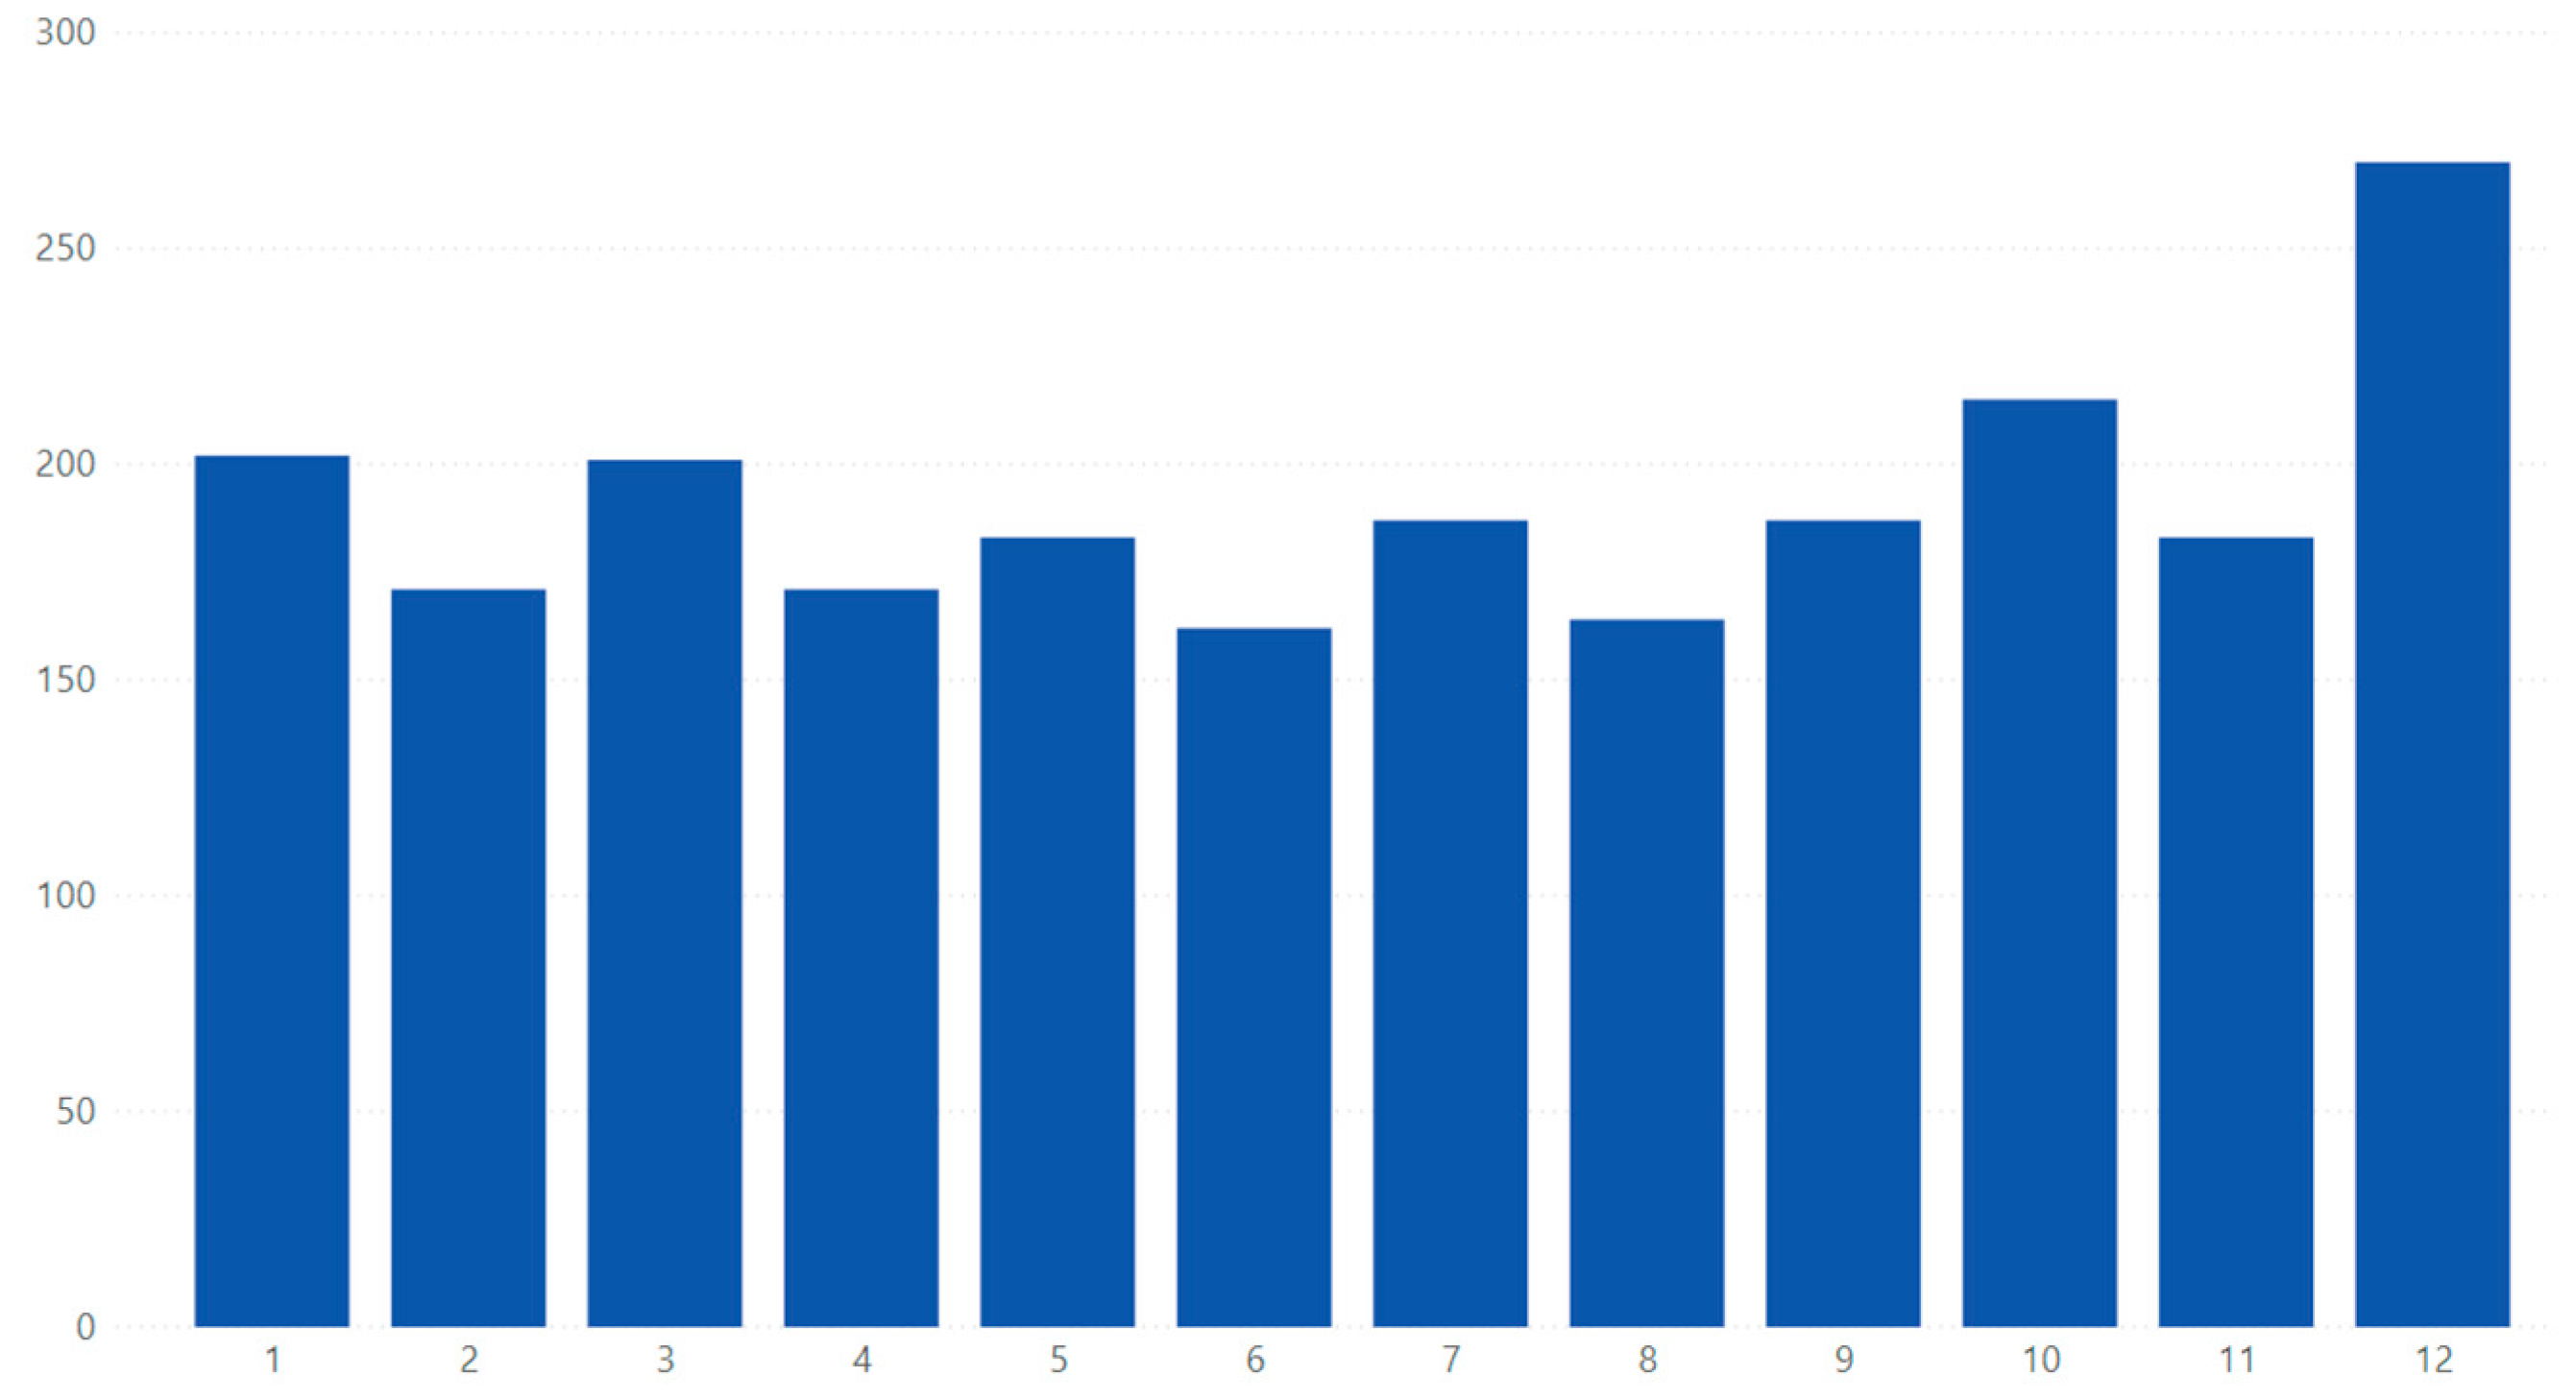
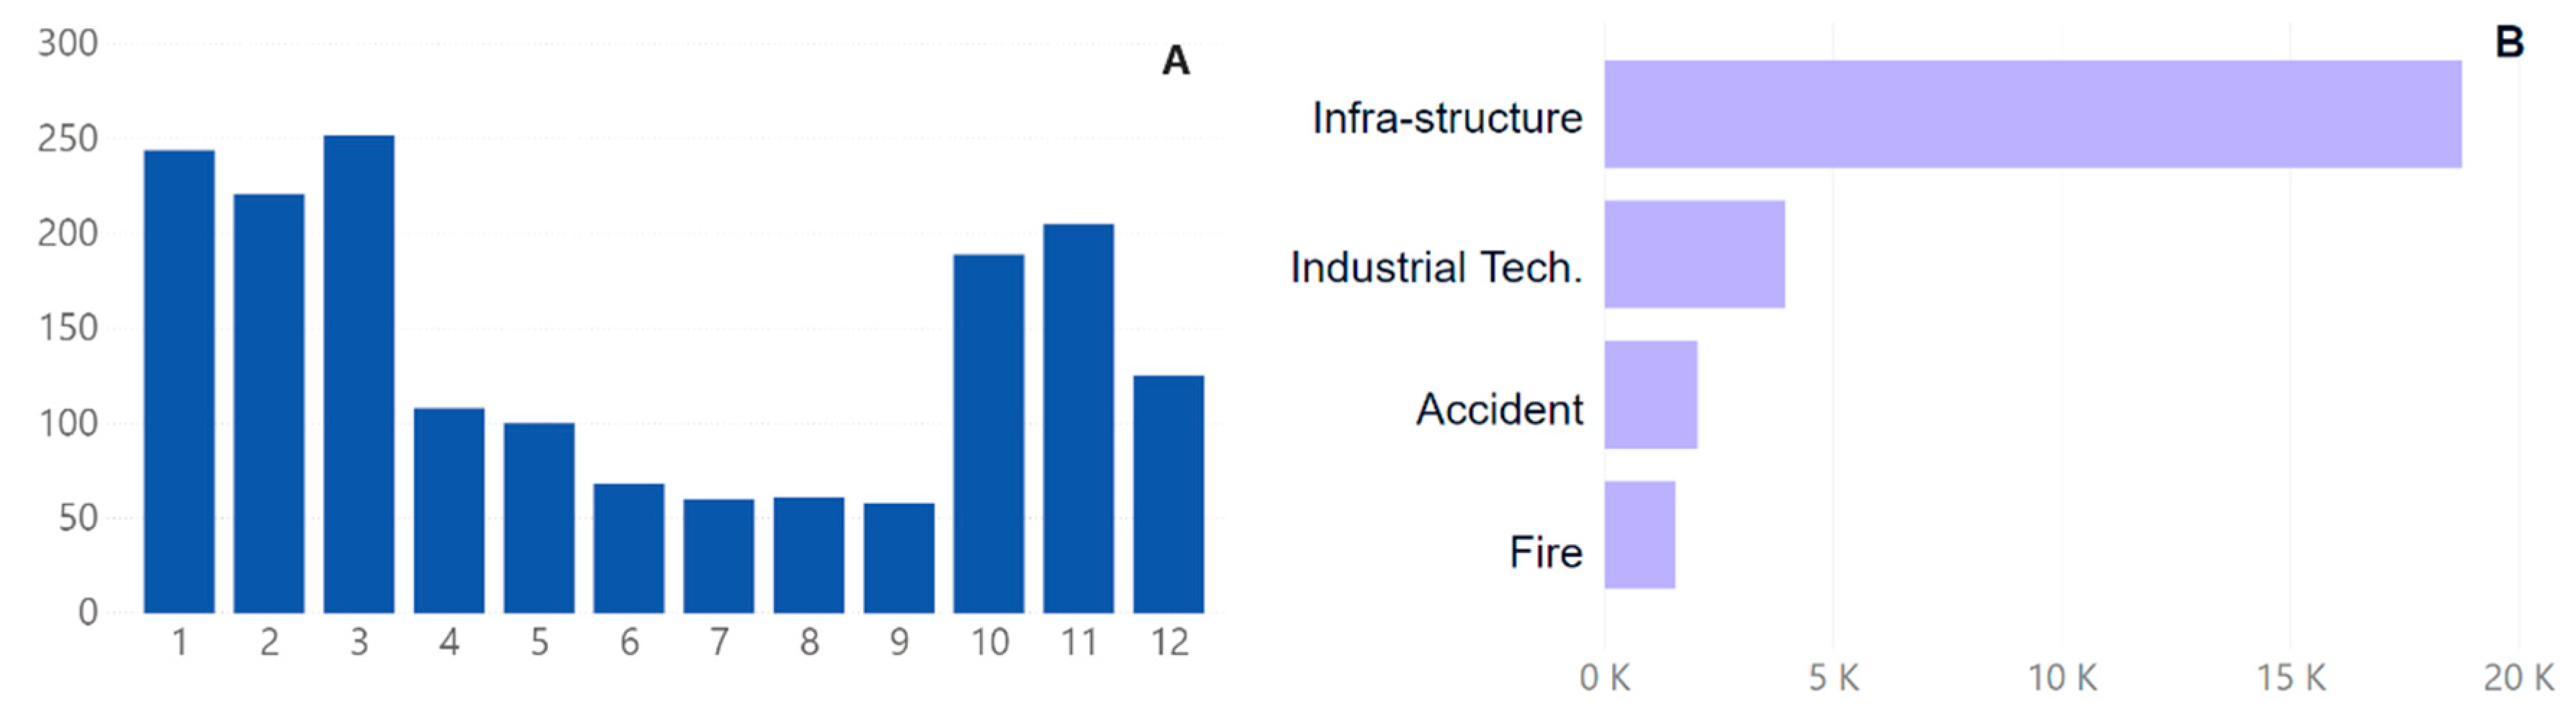
In the case of industrial–technological accidents, it is concluded that the monthly variation is irregular, as presented in Figure 8. As for infrastructure accidents, as can be seen in Figure 8 (A graphic), it appears that they have a higher frequency in the first trimester of the year, probably due to a greater intensity of precipitation, as we can see in Figure 8 (B graphic).
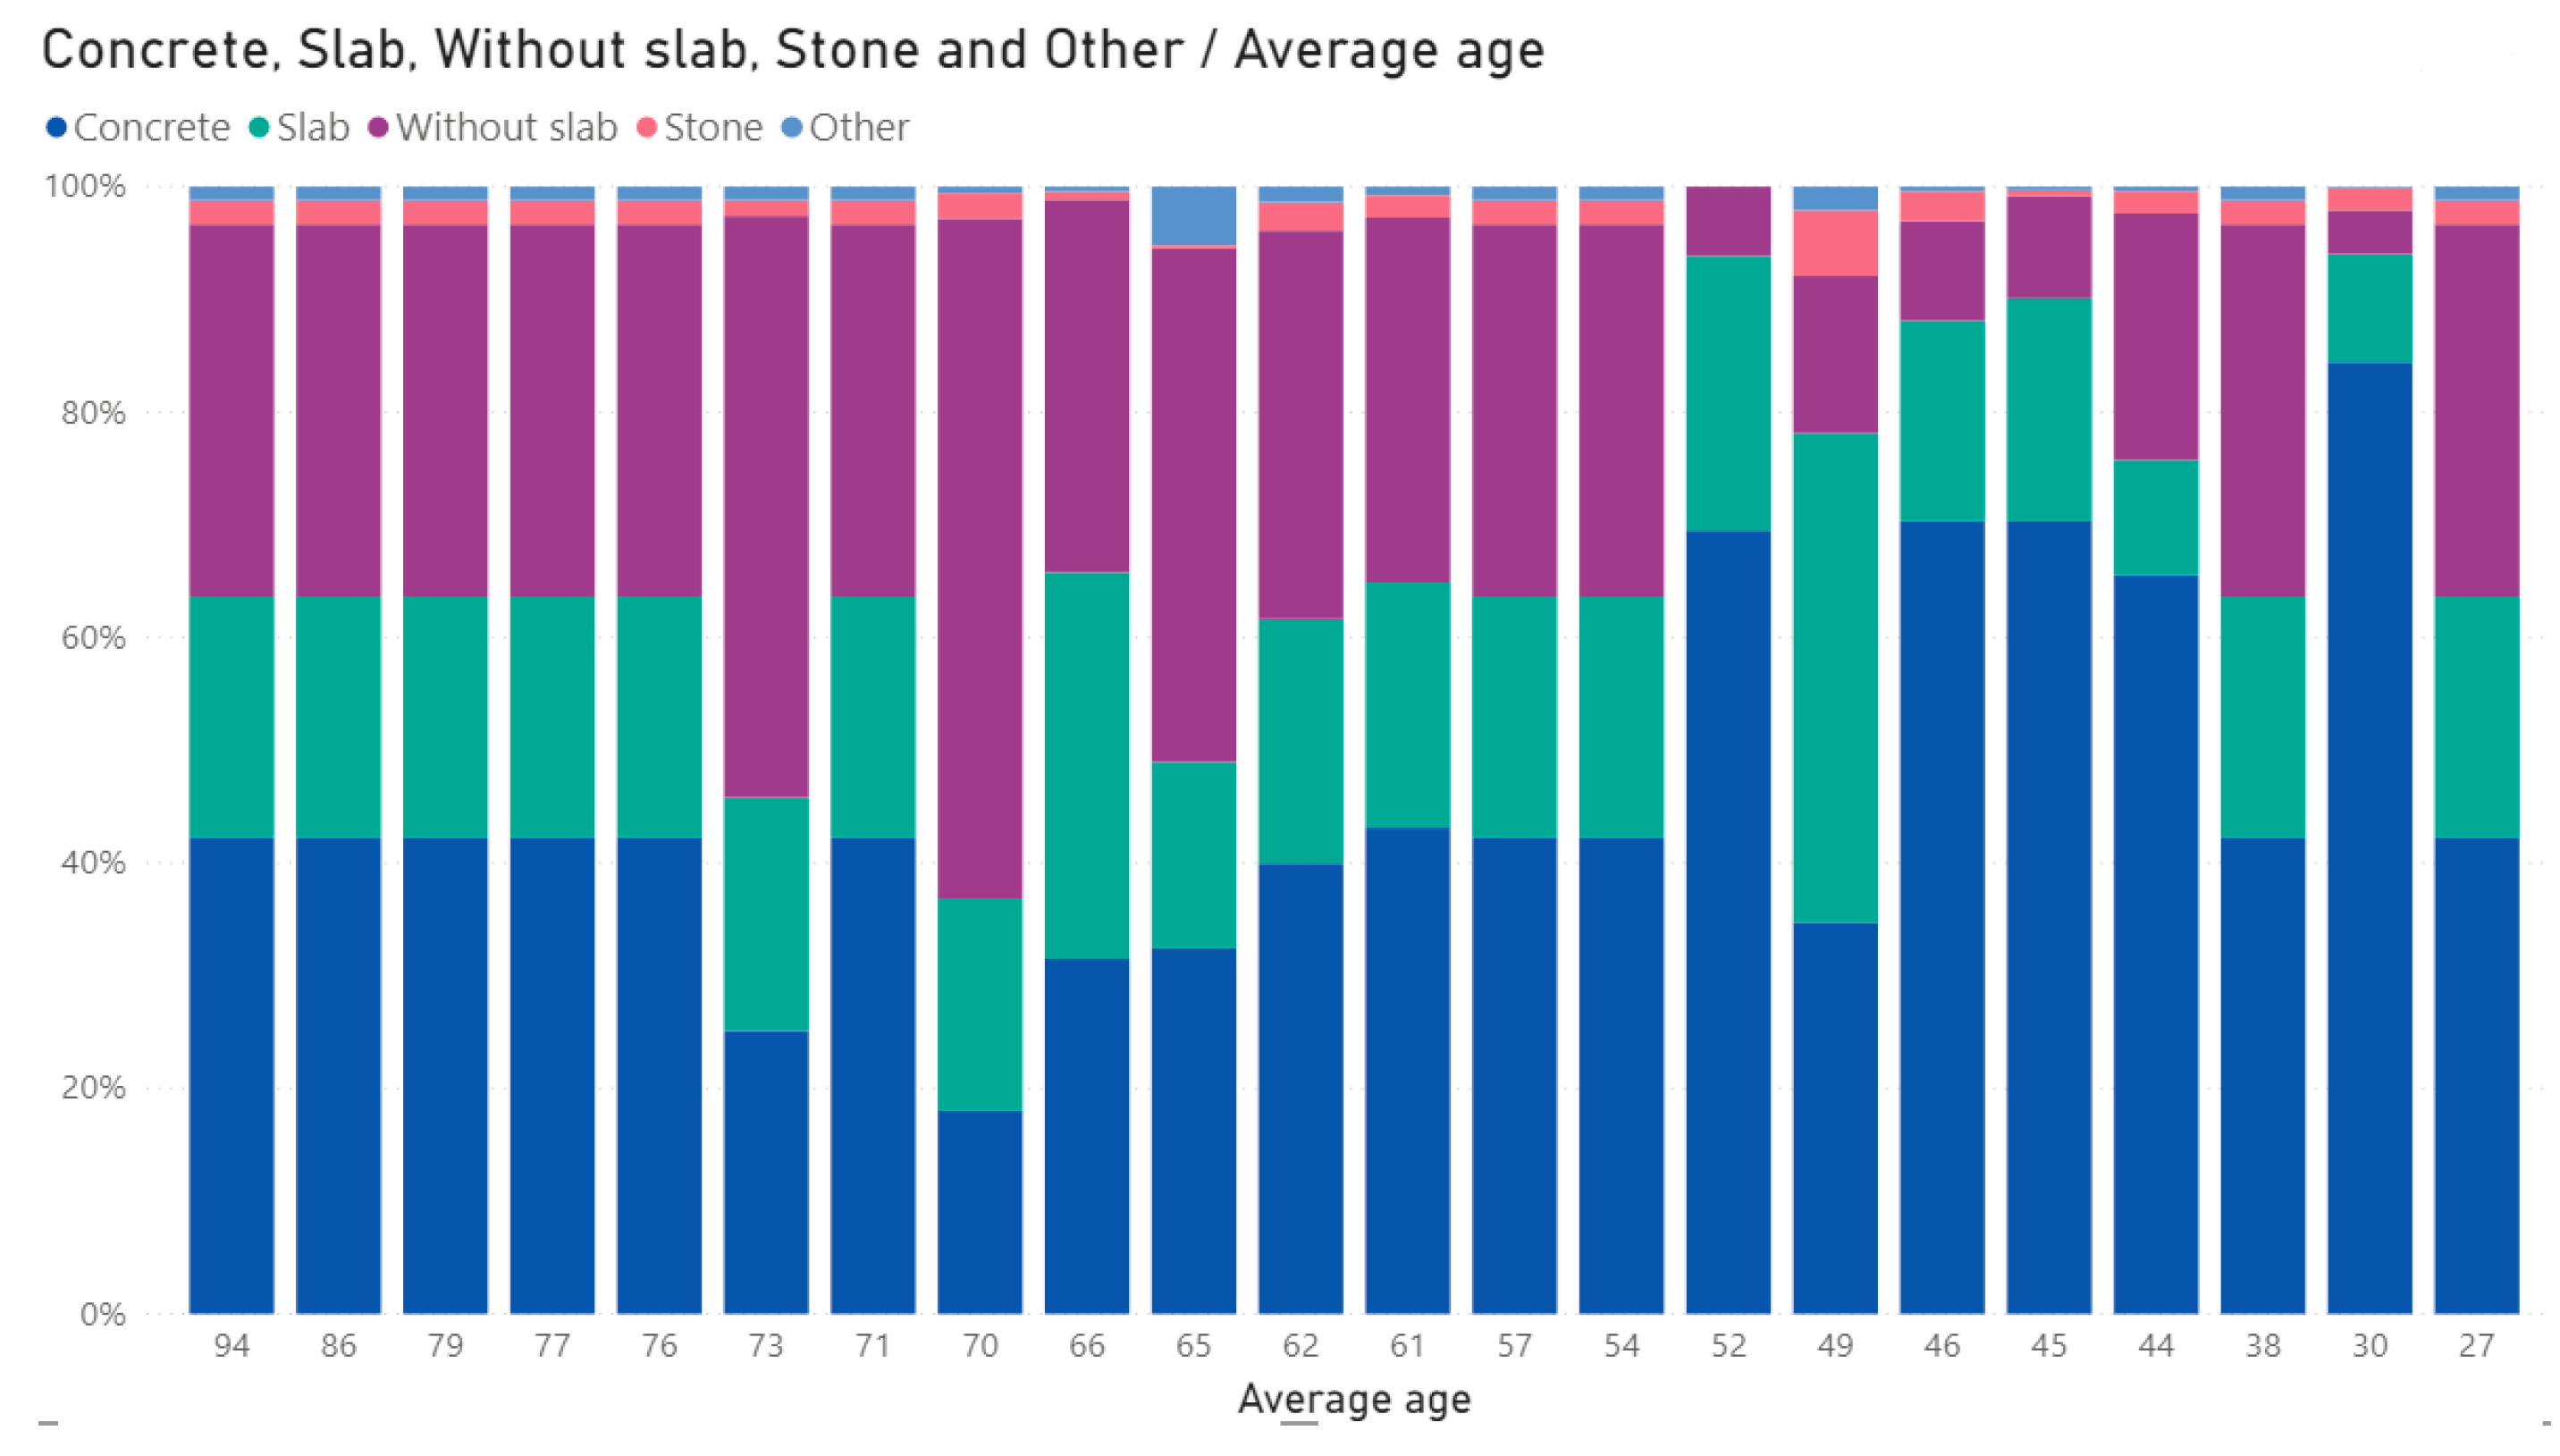
Considering the five types of structure by which the buildings are built (concrete, slab, without a slab, stone, and other types of materials), 100% stacked column charts were created—as represented in Figure 9. This allows analyzing of the relation the type of construction has with the registered incidents.
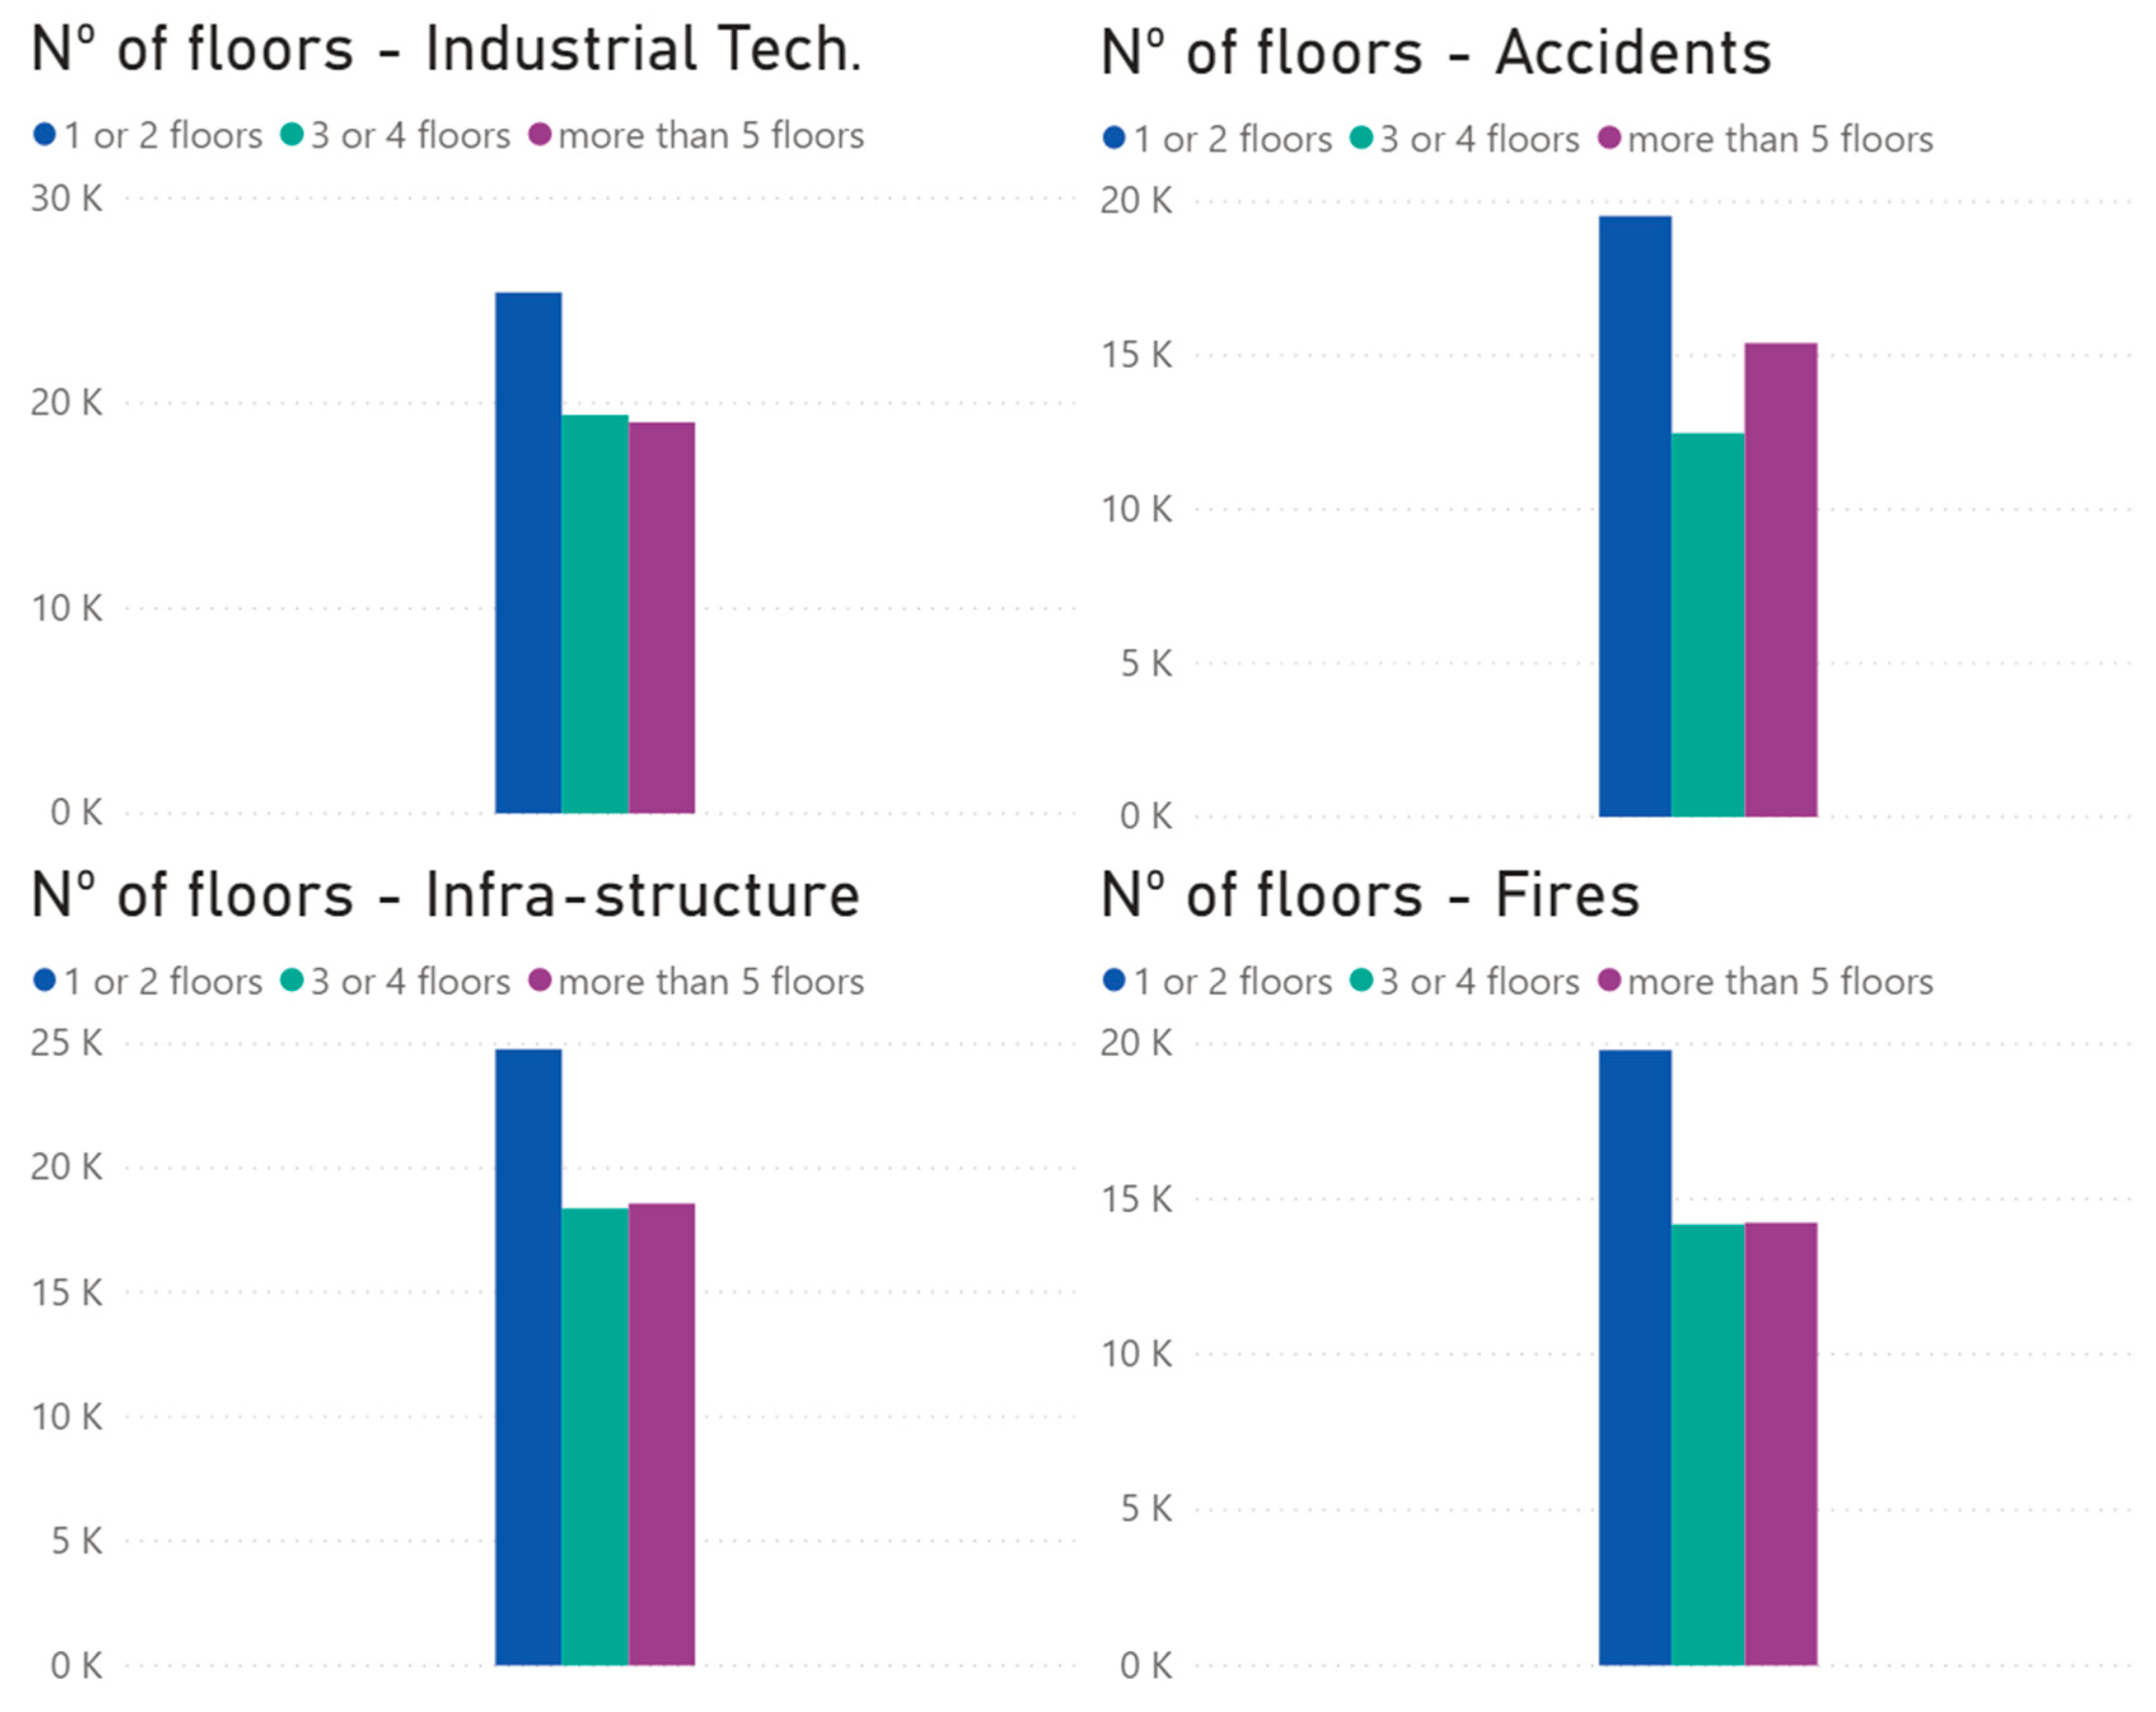
Visualization was also made regarding the number of floors in the buildings. This was made in order to check if it was possible to highlight any associations between the types of incidents and the number of floors in the building. Regarding these incidents, it is possible to say that they are more present in buildings with fewer floors, as shown in Figure 10.
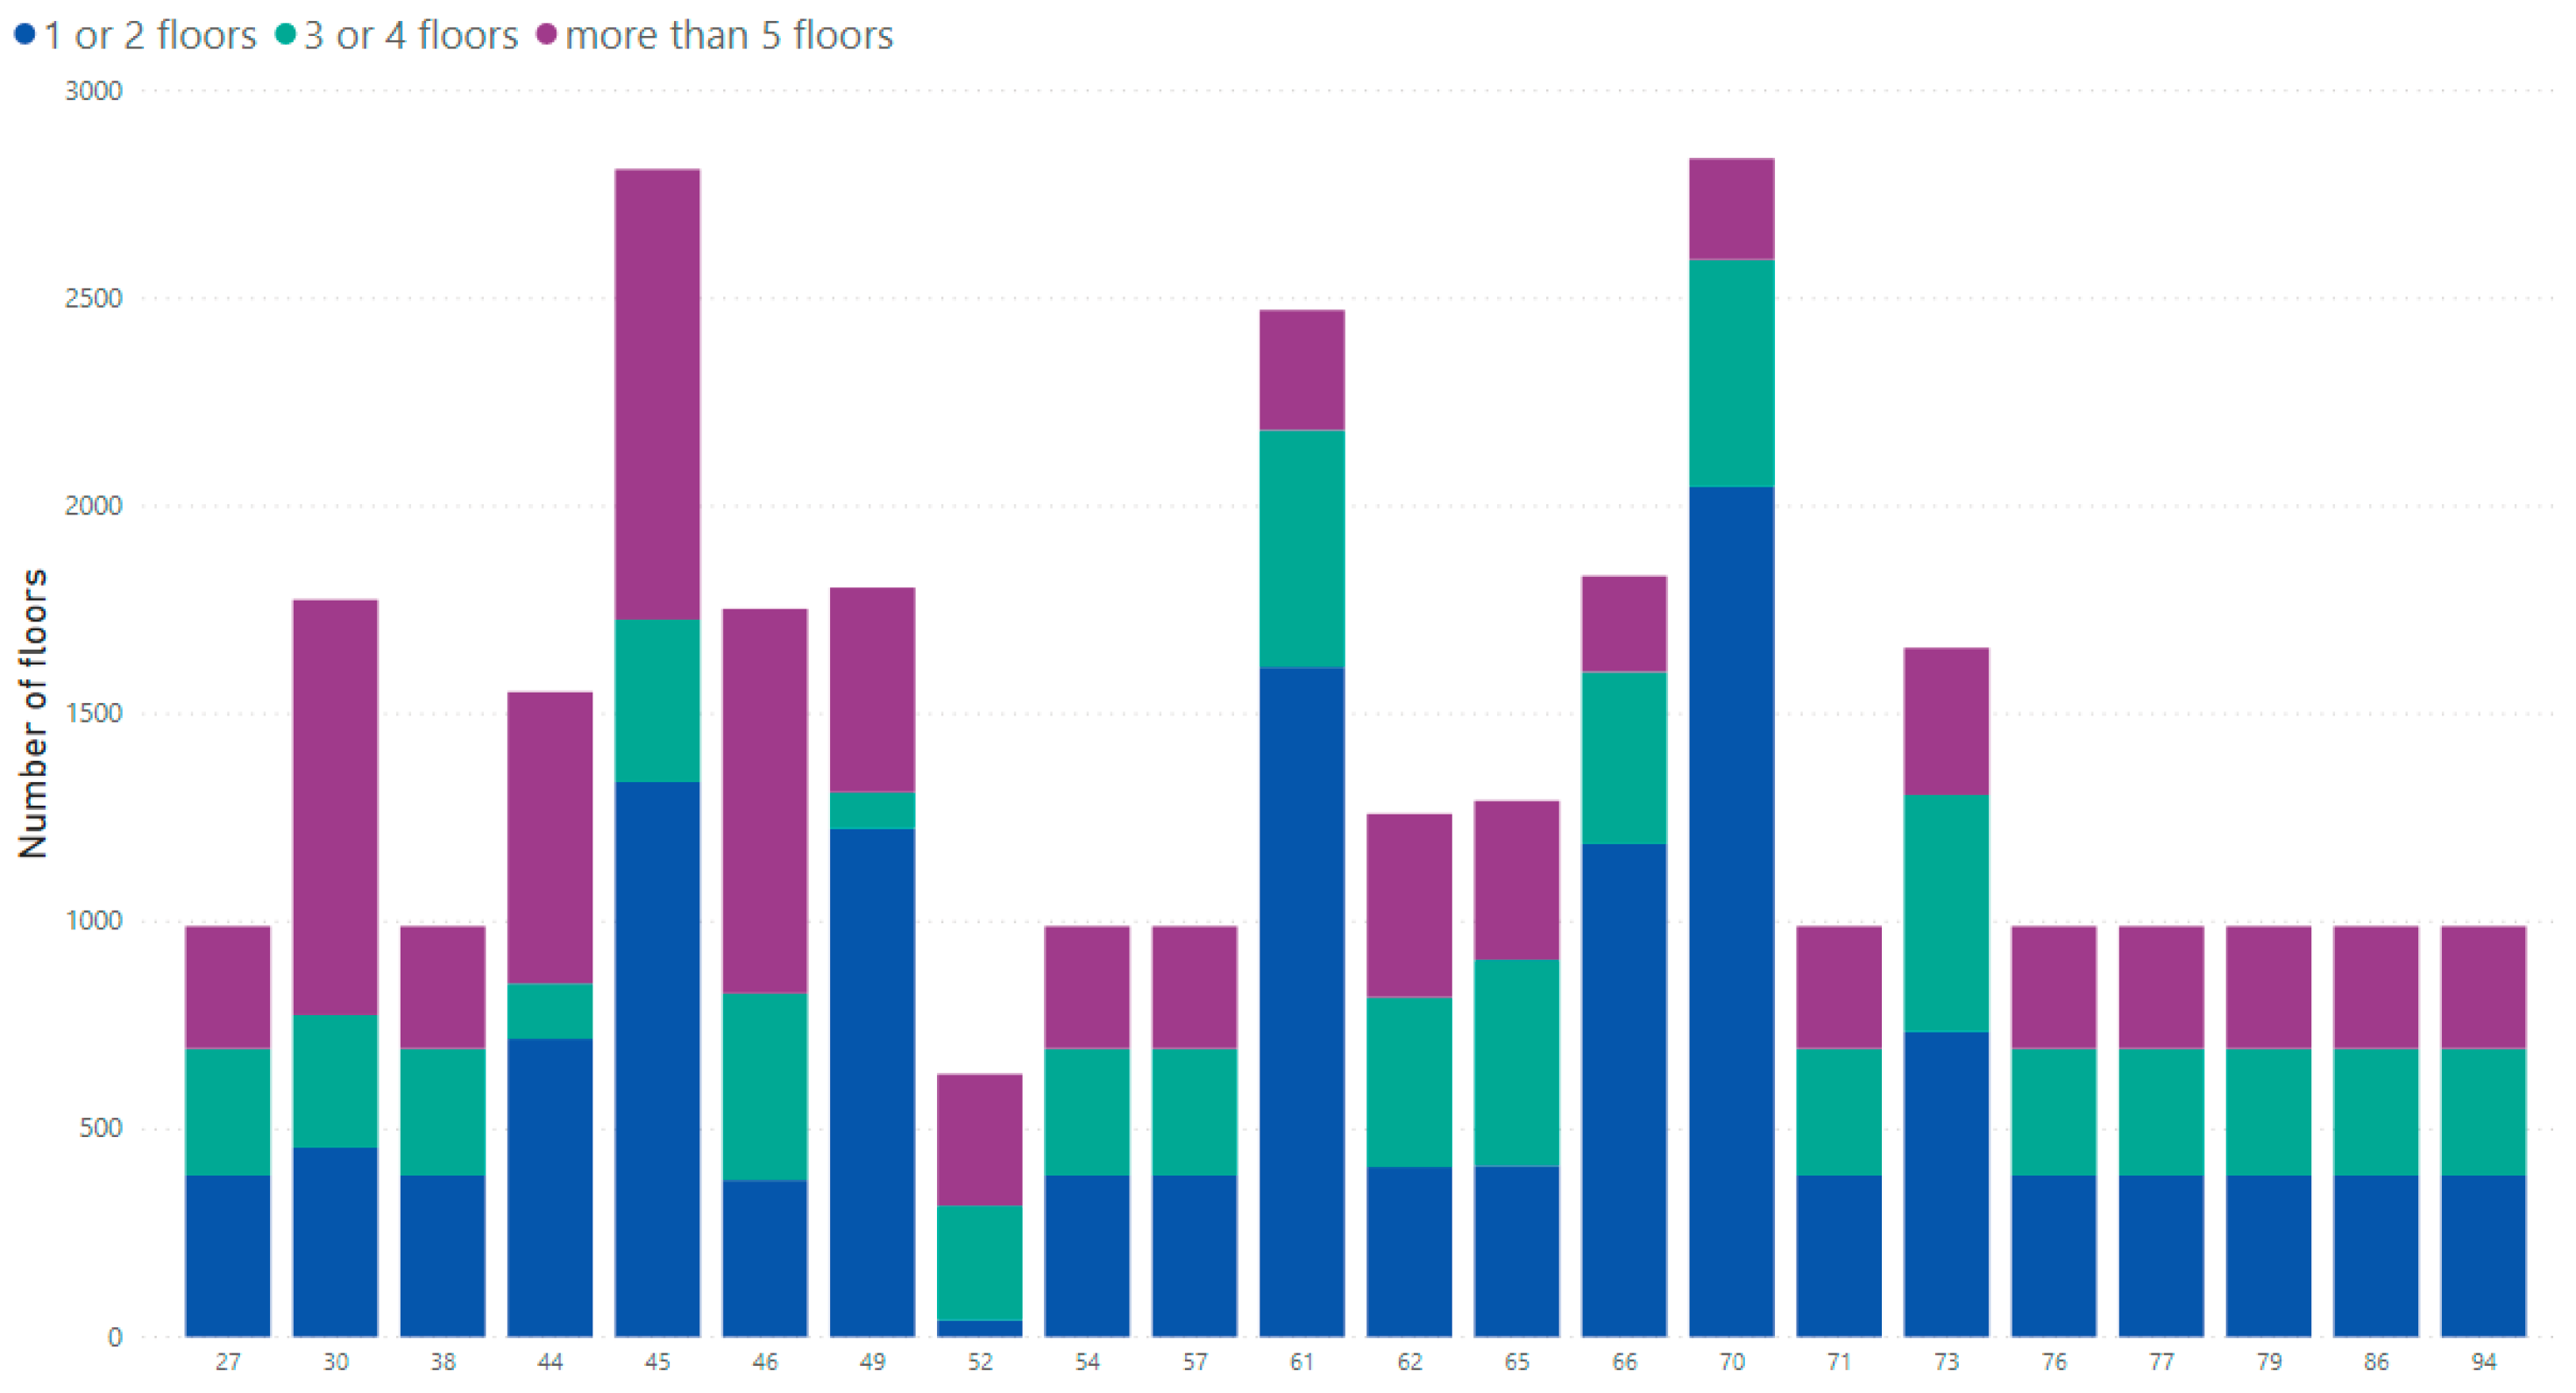
Analyzing Figure 9 and Figure 10 and crossing these conclusions with the distribution of the number of floors by building age, we can see in Figure 11 that older buildings have fewer floors, and as seen previously, older buildings have more incidents.
The data visualization allows the identification of space and temporal buildings and disaster effects in a faster and more intuitive way. Table 2 shows the main incident type versus variable importance, and this is a piece of useful information for management, less variable to handle. Results were presented to the Risk Management Department of Lisbon Municipality. This data analysis allows identification of the most relevant factors (variables) for the report of incidents, and a big picture was produced. Associated data visualization improves decision making and situation awareness. Additionally, it is possible to automatically generate incident reports in real-time, improving the quality of the decisions made by the relevant authorities. Consequently, available resources can be better managed along with an improvement in the management of the entire process, from planning to the smart allocation of means, following the prediction and analysis of threat evolution. This visualization process helps in planning the availability of intervention teams through time (for instance, adjust holiday periods or increase capacity in certain months) and space (improve the allocation of teams to specific zones). The output of this work will be used as a new tool by this department from the Lisbon Municipality.
5. Prediction Process
In the previous sections, the most relevant variables were identified. To understand which variables have the most meaning in predicting the incidents and which ones are explanatory, further analysis was conducted. Two different datasets with different variables were considered, as follows.
In the first dataset (Dataset 1), the variables considered were: incident type—the one we intend to predict, i.e., the dependent variable—precipitation, number of vehicles involved, the number of people involved, and the average age of the buildings, as represented in Table 2. As some of these variables are only known after/during the occurrence of the incident, we created a more explanatory dataset (Dataset 2), with the dataset 1 variables present. This new dataset is composed of the following variables: number of buildings by structure, number of buildings by number of floors, buildings built by decade, state of preservation, average age of the buildings, number of social stores present in that area, number of people by zone, month of the occurrence, temperature of the day, and city zone.
In Dataset 2, there are more explanatory variables, where it is possible to reach several conclusions, like the ones presented in Section 4.
The dependent variable (incident type) takes four possible values (four types of an incident), as follows:
- Fire (building fires);
- Infrastructure (floods and falls);
- Industrial–technological (gas leaks and suspicious situations);
- Accident (with equipment or with elevators).
As the problem we are dealing with is a classification one and the dependent variable is discrete, classification algorithms were used: Logistic Regression, KNN, Support Vector Machine (SVM), Naïve Bayes, Decision Tree, and Random Forest algorithms.
Before implementing any algorithm, we divided the dataset in two parts: the first part, with 80% of the data, was used to train the algorithms; the second part, with 20% of the data, was used to evaluate the predicted results.
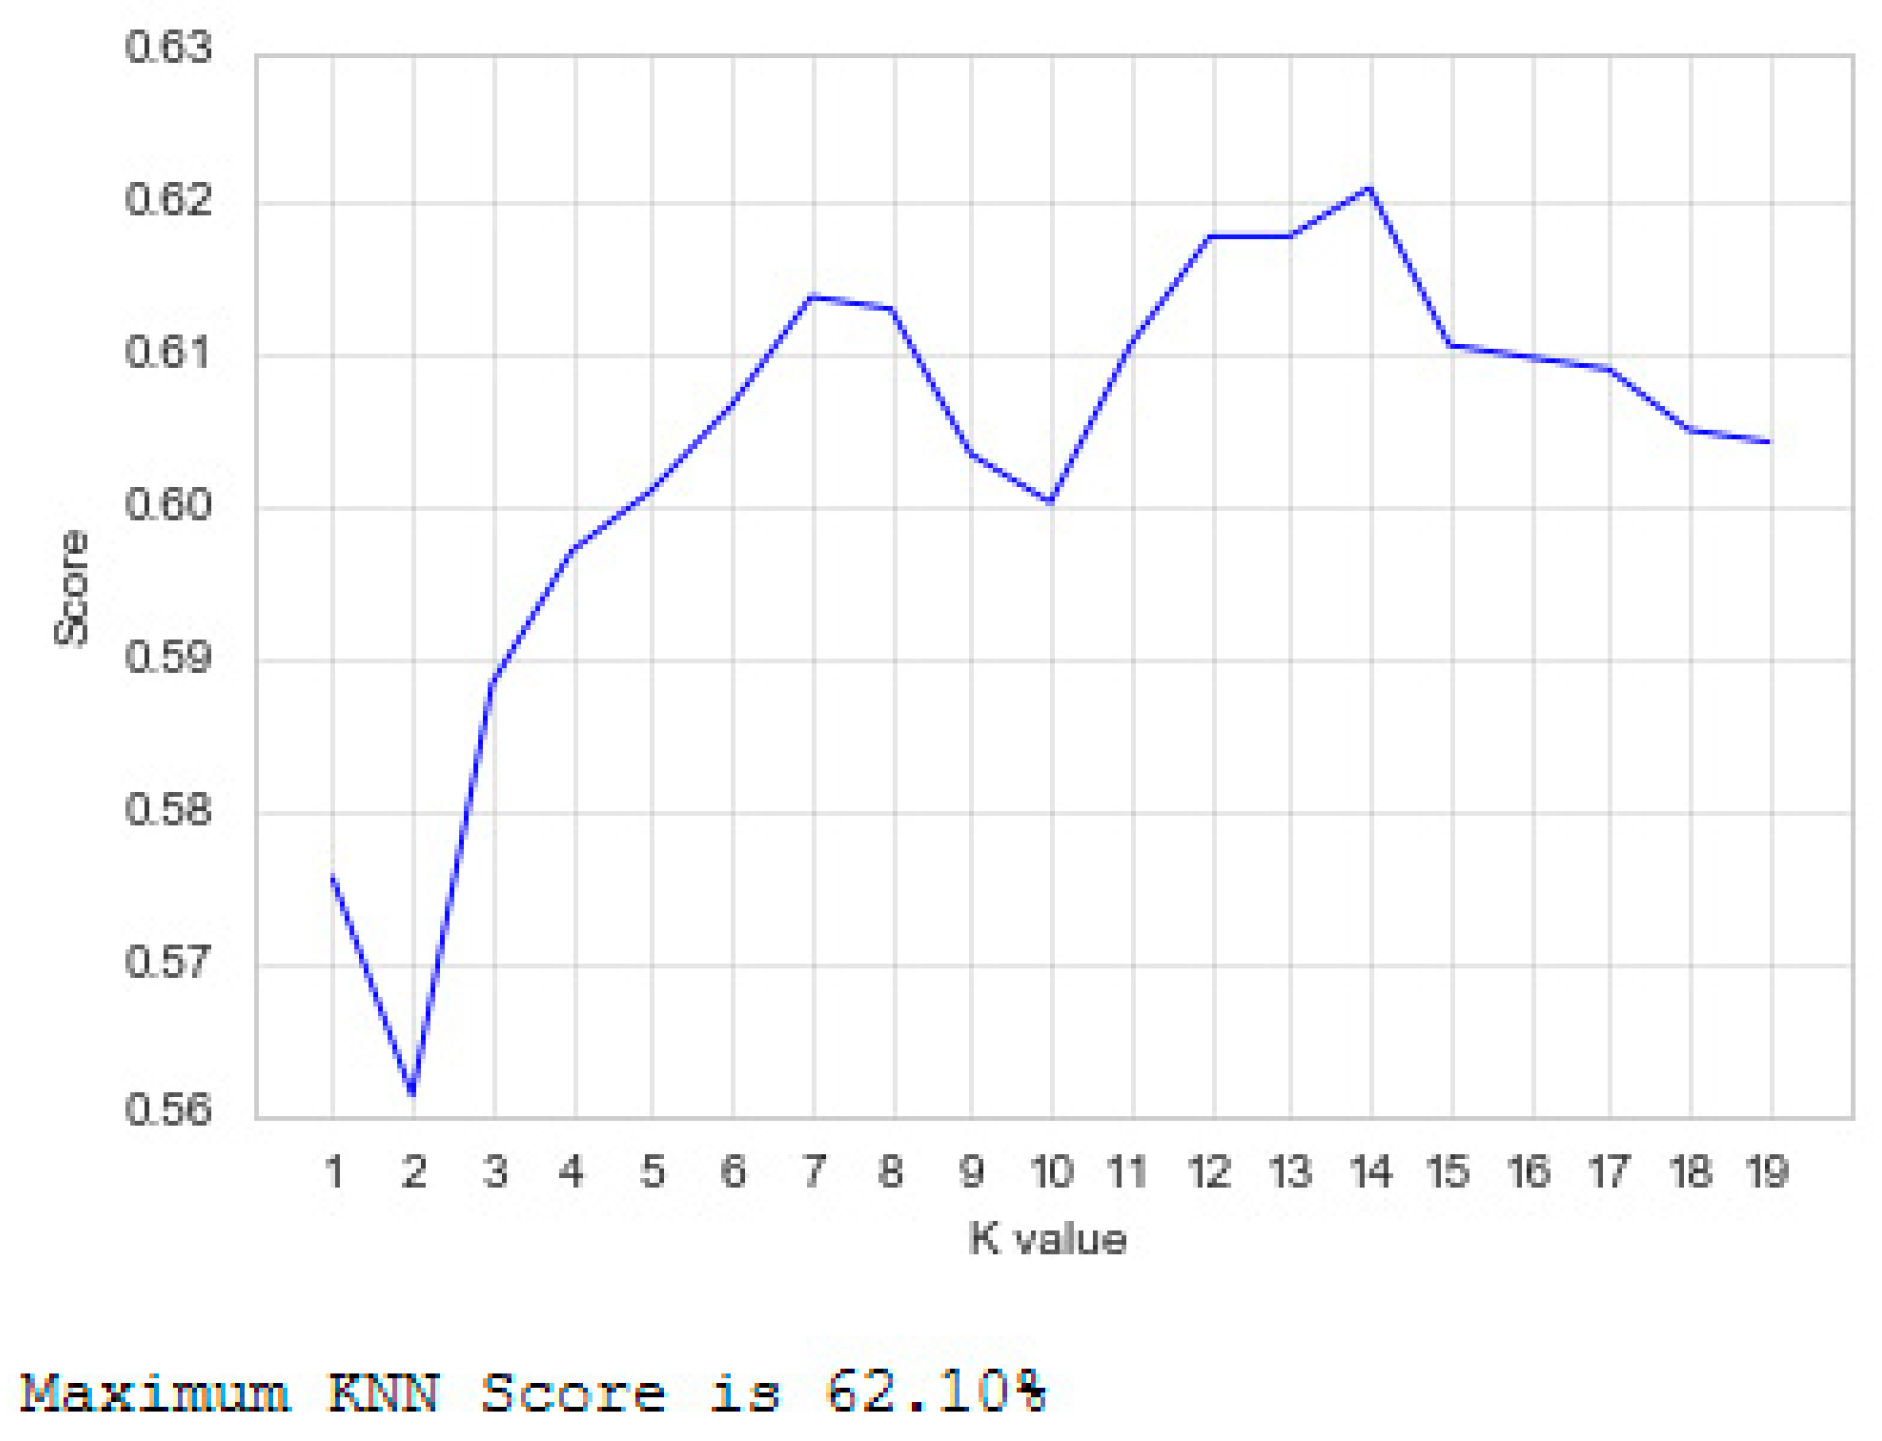
To identify the number of neighbors of KNN that assure that this algorithm achieves the maximum performance, we conducted a simulation for the number of neighbors with twenty iterations. In every iteration, we calculated the accuracy value and saved it. Furthermore, these values were used to build a plot and identify the maximum accuracy value, i.e., the best result achieved. The output of this function can be seen in Figure 12, which shows that the algorithm achieves its best accuracy performance with a k = 14. The obtained results show that, for a certain point in space, it will be classified according to the 14 closest neighbors, based on the Euclidean distance.
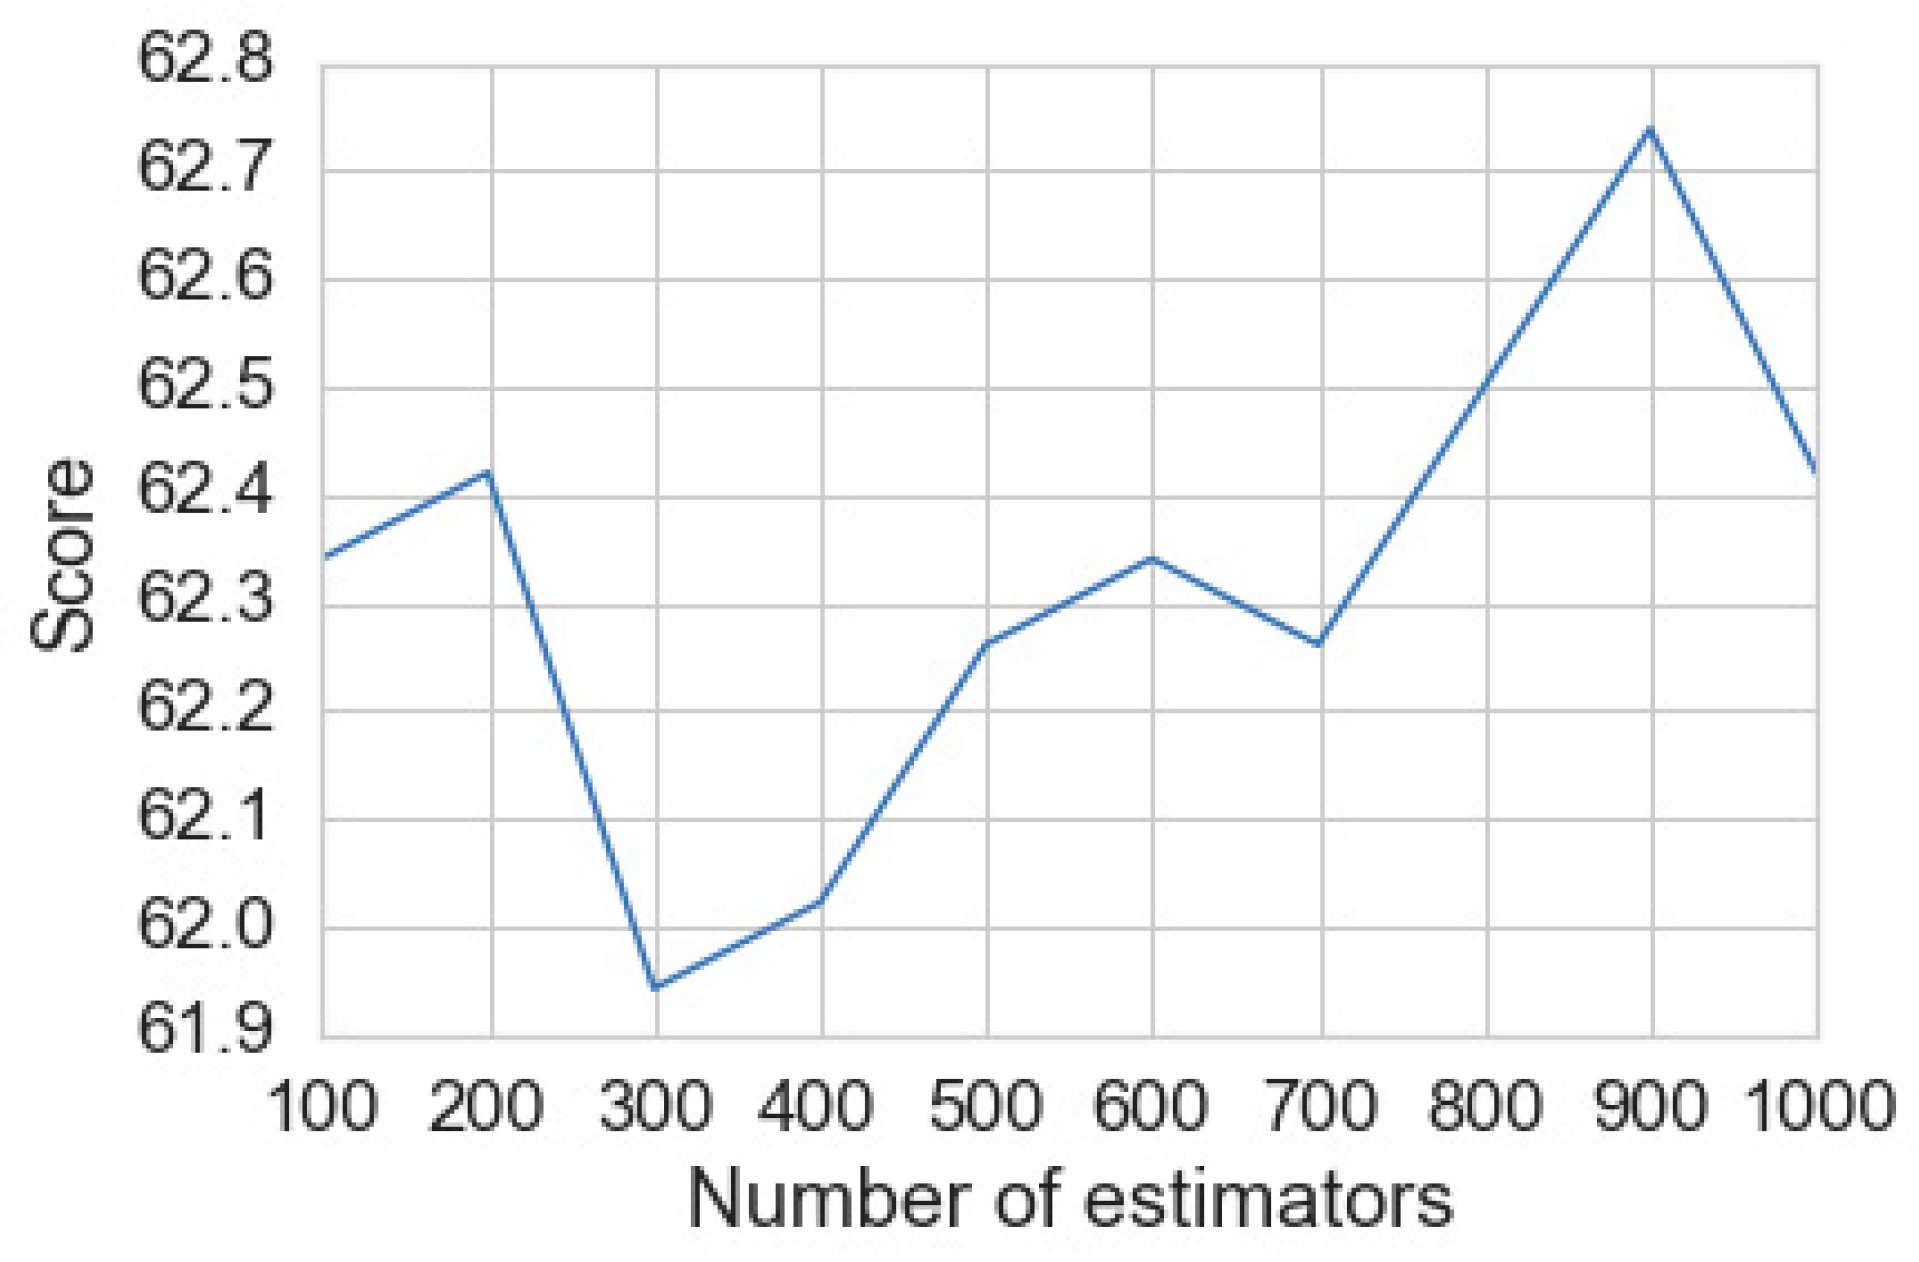
For SVM, the random state parameter that rearranges the data for probabilistic estimations was added. As the dependent variable has four prediction classes, the SVM’s performance accuracy was limited. The Random Forest algorithm combines the output of multiple (randomly created) Decision Trees to generate the final output. In the random forest, we made several attempts, and the best result obtained was for 900 trees (default is 100), where, again, we used the Random State, as shown in Figure 13 for Dataset 1. The decision tree/random forest showed better accuracy than the SVM.
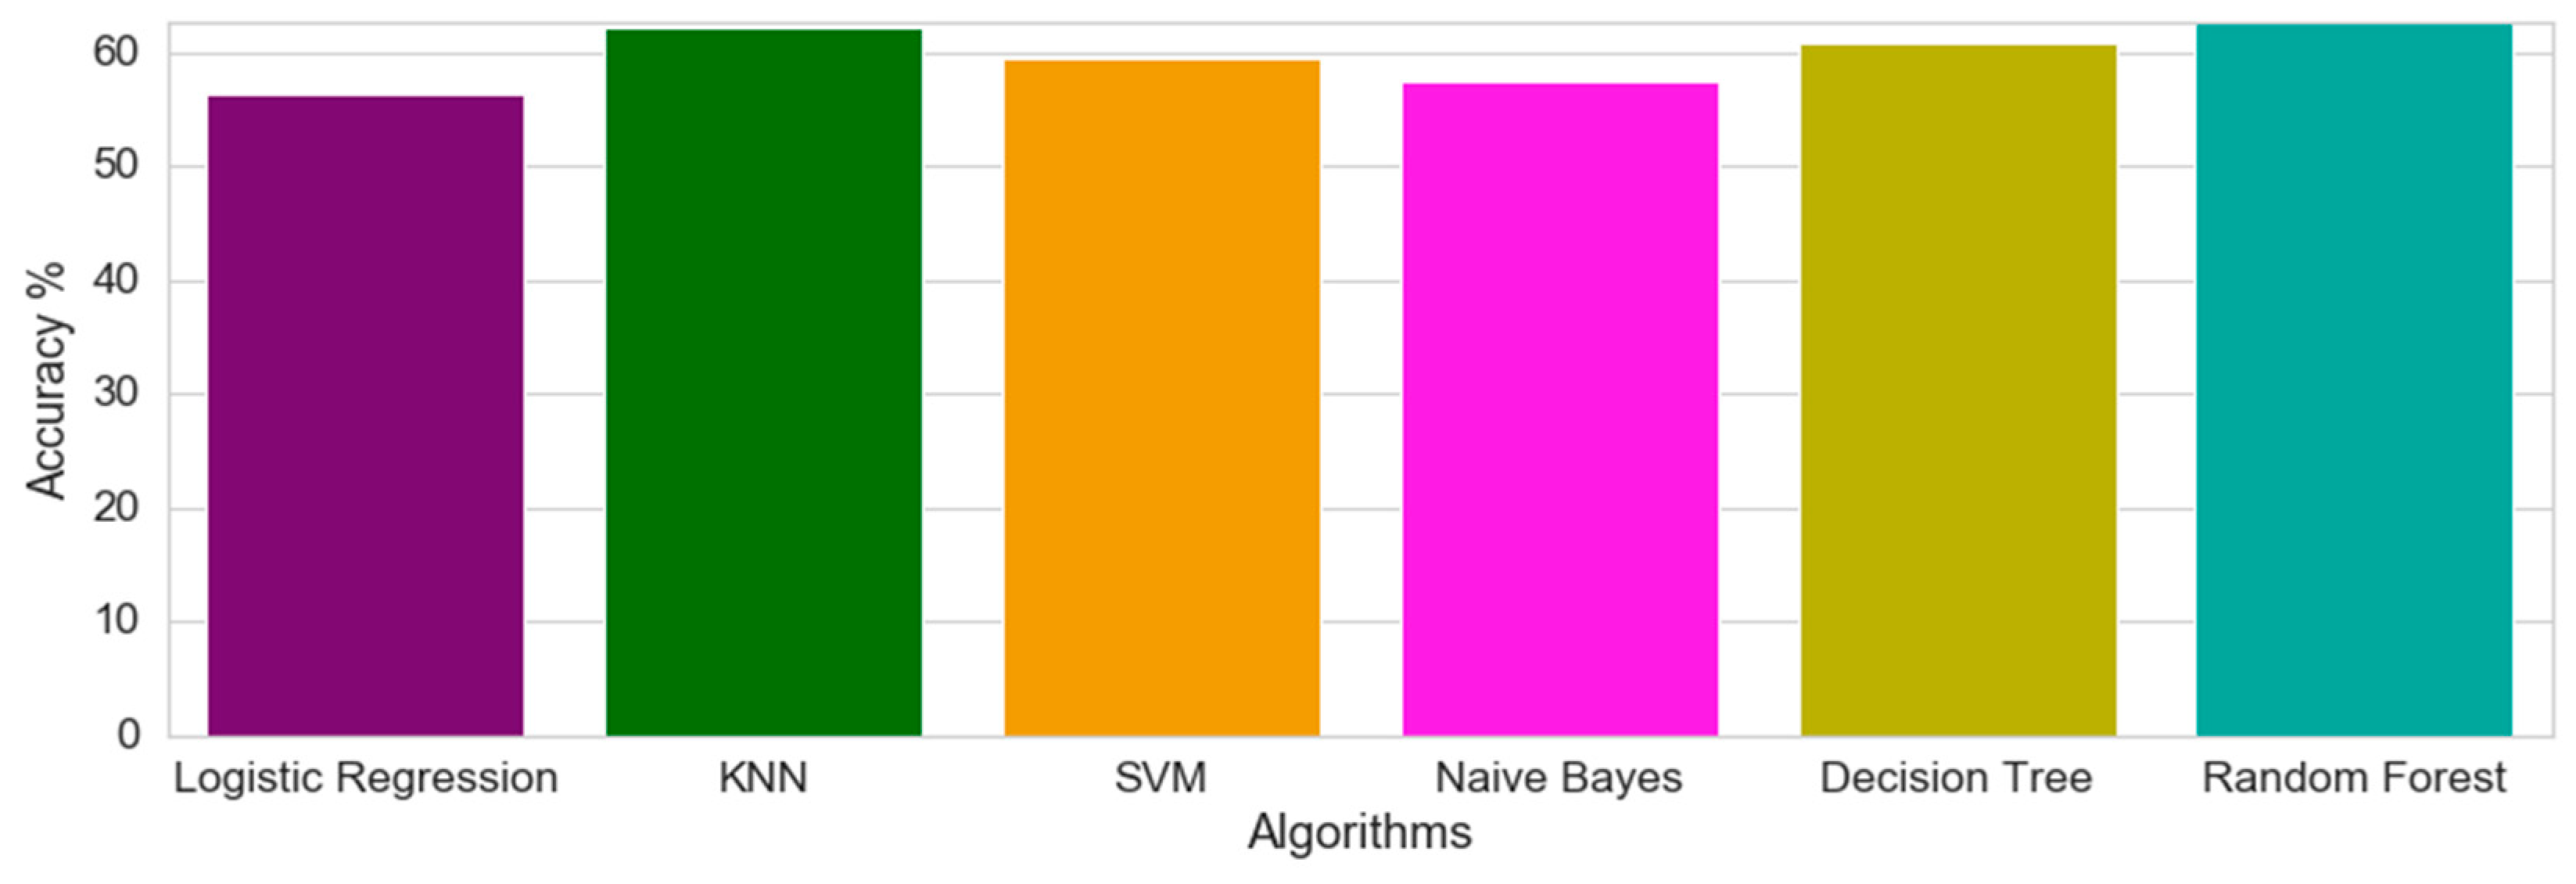
For Dataset 1, the prediction algorithm showing the best prediction performance was Random Forest, achieving 62.74% accuracy. The KNN was the second-best, achieving 62.1% accuracy. These results are shown in Figure 14.
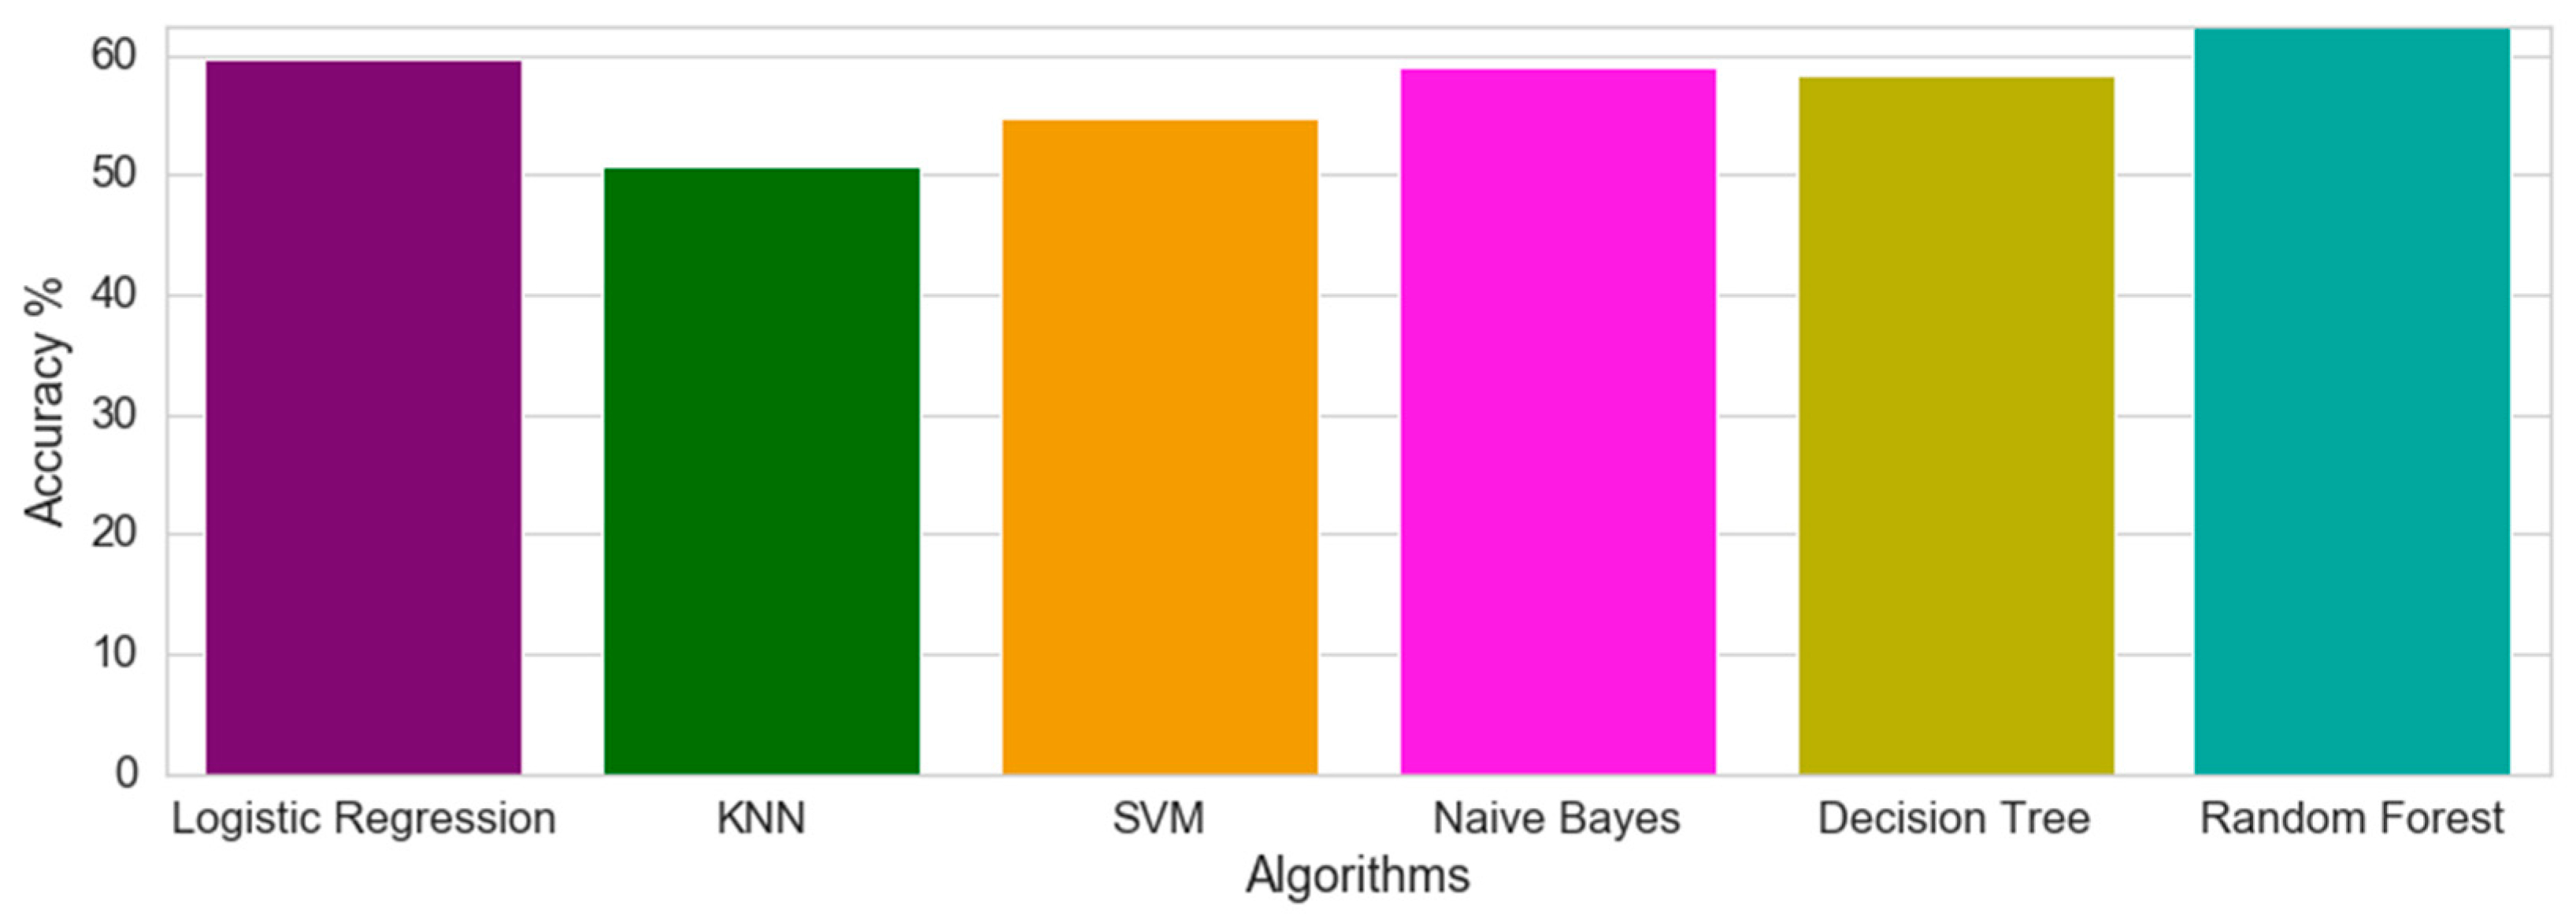
The same prediction was in a second instance applied to Dataset 2, with the expectation that the additional variables could have some influence in the prediction performance. The Random Forest algorithm was again the best performing one, having 62.42% accuracy, almost achieving the previous result. The KNN showed a decrease in accuracy performance from 62.1% to 50.8%. The second-best algorithm for Dataset 2 is the Logistic Regression, with 59.63% accuracy, a large gap from the Random Forest.
With the second dataset, the prediction values are slightly lower; nevertheless, they are more meaningful, since, by replacing these variables with values, we can predict 1 out of 4 incidents with 62.42% certainty, as shown in Figure 15.
The prediction accuracy was not as high as desirable (only around 60%). This might be the result of some specificities: (1) limited correlation levels between variables; (2) the dependent variable can take four possible values (fire (building fires), infrastructure (floods and falls), industrial–technological (gas leaks and suspicious situations), and accident (with equipment or with elevators)), which is more demanding in terms of prediction than if it was a binary variable; and (3) limited volume of data (slightly above 6300 entries).
6. Discussion
The different analyses showed that the management of the emergency resources of the city (vehicles and persons) is a challenge. Fires and industrial–technological incidents, by their nature, are the most difficult to predict but are also the ones that require the most resources, both in terms of vehicles and in terms of persons. The randomness of the location would be an additional layer of difficulty. However, it was possible to perceive where (the zones of the city) these incidents occur the most, therefore providing the critical incident managers with the possibility to locate these resources in advance for a more timely response. The reduction in response time allows for limiting of the expansion of the incident, which in turn reduces the cascading effects of these incidents.
Downtown Lisbon emerges as the most critical area of the city. Although other areas of the city also require preparedness, this area has older and more fragile buildings, i.e., the buildings more exposed to risk. Taskforces should be prepared at all times for interventions, with appropriate vehicles and trained personnel.
Using Random Forest algorithms with variables replaced by the values will allow the risk management department to be better prepared to respond to incidents in the city.
From spatial visualization analytics, this is useful information to allocate intervention teams for big catastrophes and place material near critical areas.
With this study we can conclude that a big part of the occurrences is largely concentrated in the city center, the zone of Benfica also being one of the foci. The most common occurrence is technological and industrial incidents, taking place equally all year, except during December. Occurrences related to fire happen mainly during the summer, December, and January, where we believe the reason for having a more significant number of fires in these latter two months is the presence of fireplaces and fire pits. It is part of our knowledge that infrastructure-type occurrences tend to occur when there is more precipitation, having a reduction in these occurrences during the summer.
Occurrences of the accident type tend to occur in the areas with worse conservation levels, and a lower average age of buildings, which we believe is one of the reasons for the presence of lifts in these newer buildings.
Historical data about incidents have considerable potential as data show patterns, allow predictions, and highlight the city’s recurrent problems. The study of these data allows better future city planning and data integration among different systems and creates an important tendency, allowing this information to be used for future problems. By being able to respond in a more adjusted way to an incident, it might reduce the consequences of that incident and prevent a cascading effect on other subsystems of the city. Data mining can be used for incident management, and it is important to identify spatial and temporal patterns to manage these incidents in the city context.
Visualizing these data using a visualization process allows identification of the city’s patterns and is an important tool for city incident management. The prediction process allows for better planning and improves the response time of intervention teams.
This research was based on a single city, and the specific conclusions are adjusted solely to the city of Lisbon. Nonetheless, the overall process can be replicated for other cities and adjusted to their specific characteristics. Future research should be conducted on this replication.
7. Conclusions
Smart Cities are definitely enriched by big data technologies, and data-driven methods are fundamental in this context to extract patterns for more informed decision-making. This paper aimed to discuss how the new data-driven smart city can be applied using Python in a CRISP-DM approach. Additionally, the predictive process can play an important role in city management because of the distribution of intervention forces. Accuracy of this prediction process will increased on data volume availability.
With data collection and the use of data in the Smart Cities strategy, there are many problems and opportunities. Nevertheless, many problems and complexities exist for municipalities to fix as smart city programs linked to data are introduced. The research explored the complexities of data collection and data usage in the approach to smart cities, with a systematic framework addressing key topics such as privacy law, data ethics, cybersecurity, data infrastructure (data sovereignty and data ownership), and municipal resources.
Nevertheless, the effective implementation and management of big data technology involve a holistic perspective in order to be able to recognize and handle discrepancies and disputes, as well as to harness synergies in functionality, ownership, access, and governance between various technical components.
As the consequences of data collection and data use in the approach to smart cities are complex, the process of design and implementation should be carefully considered at each step of the way. In this study, we show an implementation process through a CRISP-DM process.
The execution of Smart City projects should not be hurried due to issues that will arise if smart city projects related to data are not properly planned. The problems of data collecting and data use in the smart cities approach seem scary, but at the same time, they bring an amount of excitement to the possibilities municipalities can achieve with their people.
Another conclusion of the present work is that these systems to report incidents need to involve more people in the city, with improved interfaces, using social networks to add data to the prediction process because, in most cases, the collected data are not sufficient for the prediction process.
Author Contributions
L.B.E., C.F.M. and J.M.D. performed all data mining processes. M.C.P. wrote state of the art, A.L.M. performed of all the management interface and contributed to the writing of the article and J.C.F. coordinated the research and contributed to the writing of the article. All authors have read and agreed to the published version of the manuscript.
Funding
This research was funded by the Foundation for Science and Technology (FCT) through ISTAR-IUL’s project UIDB/04466/2020 and UIDP/04466/2020.
Acknowledgments
J.C.F. received support from the Portuguese National Funds through FITEC—Programa Interface, with reference CIT INOV—INESC INOVAÇÃO—Financiamento Base.
Conflicts of Interest
The authors declare no conflict of interest.
References
- Dubbeldeman, R.; Stephen, W. Smart Cities How Rapid Advances in Technology Are Reshaping Our Economy and Society; Deloitte: Amesterday, The Netherlands, 2015. [Google Scholar]
- Huang, Q.; Cervone, G.; Zhang, G. A cloud-enabled automatic disaster analysis system of multi-sourced data streams: An example synthesizing social media, remote sensing and Wikipedia data. Comput. Environ. Urban Syst. 2017, 66, 23–37, ISSN 0198-9715. [Google Scholar] [CrossRef]
- Cuthbertson, J.; Rodriguez-Llanes, J.M.; Robertson, A.G.; Archer, F. Current and Emerging Disaster Risks Perceptions in Oceania: Key Stakeholders Recommendations for Disaster Management and Resilience Building. Int. J. Environ. Res. Public Health 2019, 16, 460. [Google Scholar] [CrossRef] [PubMed] [Green Version]
- Kontokosta, C.E.; Malik, A. The Resilience to Emergencies and Disasters Index: Applying big data to benchmark and validate neighbourhood resilience capacity. Sustain. Cities Soc. 2018, 36, 272–285. [Google Scholar] [CrossRef]
- Johnson, K.S.; Depietri, Y.; Breil, M. Multi-hazard risk assessment of two Hong Kong districts. Int. J. Disaster Risk Reduct. 2016, 19, 311–323. [Google Scholar] [CrossRef]
- Borsekova, K.; Nijkamp, P. Blessing in disguise: Long-run benefits of urban disasters. In Resilience and Urban Disasters: Surviving Cities; Edward Elgar Publishing: Northampton, MA, USA, 2019; pp. 2–29. [Google Scholar]
- Avvenuti, M.; Cresci, S.; Del Vigna, F.; Fagni, T.; Tesconi, M. CrisMap: A big data crisis mapping system based on damage detection and geoparsing. Inf. Syst. Front 2018, 20, 993–1011. [Google Scholar] [CrossRef]
- Chang, S.E.; Yip, J.Z.K.; Tse, W. Effects of urban development on future multi-hazard risk: The case of Vancouver, Canada. Nat. Hazards 2019, 96, 251–265. [Google Scholar] [CrossRef]
- Grünthal, G.; Thieken, A.H.; Schwarz, J.; Radtke, K.S.; Smolka, A.; Merz, B. Comparative Risk Assessments for the City of Cologne—Storms, Floods, Earthquakes. Nat. Hazards 2006, 38, 21–44. [Google Scholar] [CrossRef] [Green Version]
- Ferrier, N.; Haque, C.E. Hazards Risk Assessment Methodology for Emergency Managers: A Standardized Framework for Application. Nat. Hazards 2003, 28, 271–290. [Google Scholar] [CrossRef]
- Davidson, R.A.; Shah, H.C. An Urban Hearthquake Disaster Risk Index; Stanford University: Stanford, CA, USA, 1997. [Google Scholar]
- Blong, R. A New Damage Index. Nat. Hazards 2003, 30, 1–23. [Google Scholar] [CrossRef]
- Guo, J.; Wu, X.; Wei, G. A new economic loss assessment system for urban severe rainfall and flooding disasters based on big data fusion. Environ. Res. 2020, 188, 109822. [Google Scholar] [CrossRef]
- Rimal, B.; Zhang, L.; Keshtkar, H.; Sun, X.; Rijal, S. Quantifying the Spatiotemporal Pattern of Urban Expansion and Hazard and Risk Area Identification in the Kaski District of Nepal. Land 2018, 7, 37. [Google Scholar] [CrossRef] [Green Version]
- Chen, J.; Li, Q.; Wang, H.; Deng, M. A Machine Learning Ensemble Approach Based on Random Forest and Radial Basis Function Neural Network for Risk Evaluation of Regional Flood Disaster: A Case Study of the Yangtze River Delta, China. Int. J. Environ. Res. Public Health 2019, 17, 49. [Google Scholar] [CrossRef] [PubMed] [Green Version]
- Chai, S.-S.; Suh, D. Design and Implementation of a Multi-Disaster Risk Assessment Database System in South Korea. Information 2019, 11, 8. [Google Scholar] [CrossRef] [Green Version]
- Bathrellos, G.D.; Skilodimou, H.D.; Chousianitis, K.; Youssef, A.M.; Pradhan, B. Suitability estimation for urban development using multi-hazard assessment map. Sci. Total Environ. 2017, 575, 119–134. [Google Scholar] [CrossRef]
- Pourghasemi, H.R.; Gayen, A.; Panahi, M.; Rezaie, F.; Blaschke, T. Multi-hazard probability assessment and mapping in Iran. Sci. Total Environ. 2019, 692, 556–571. [Google Scholar] [CrossRef]
- Skilodimou, H.D.; Bathrellos, G.D.; Chousianitis, K.; Youssef, A.M.; Pradhan, B. Multi-hazard assessment modeling via multi-criteria analysis and GIS: A case study. Environ. Earth Sci. 2019, 79, 47. [Google Scholar] [CrossRef]
- Wu, D.; Cui, Y. Disaster early warning and damage assessment analysis using social media data and geo-location information. Decis. Support Syst. 2018, 111, 48–59. [Google Scholar] [CrossRef]
- Lee, C.-H.; Lin, S.-H.; Kao, C.-L.; Hong, M.-Y.; Huang, P.-C.; Shih, C.-L.; Chuang, C.-C. Impact of climate change on disaster events in metropolitan cities-trend of disasters reported by Taiwan national medical response and preparedness system. Environ. Res. 2020, 183, 109186. [Google Scholar] [CrossRef]
- Boakye, J.; Gardoni, P.; Murphy, C. Using opportunities in big data analytics to more accurately predict societal consequences of natural disasters. Civ. Eng. Environ. Syst. 2019, 36, 100–114. [Google Scholar] [CrossRef]
- Speiser, J.L.; Miller, M.E.; Tooze, J.A.; Ip, E.H. A comparison of random forest variable selection methods for classification prediction modeling. Expert Syst. Appl. 2019, 134, 93–101. [Google Scholar] [CrossRef]
- Arabameri, A.; Pradhan, B.; Lombardo, L. Comparative assessment using boosted regression trees, binary logistic regression, frequency ratio and numerical risk factor for gully erosion susceptibility modelling. CATENA 2019, 183, 104223. [Google Scholar] [CrossRef]
- Huang, Q.; Yang, C.; Benedict, K.; Chen, S.; Rezgui, A.; Xie, J. Utilize cloud computing to support dust storm forecasting. Int. J. Digit. Earth 2013, 6, 338–355. [Google Scholar] [CrossRef] [Green Version]
- Shearer, C. The CRISP-DM model: The new blueprint for data mining. Data Warehous. 2000, 5, 13–22. [Google Scholar]
- Netek, R.; Pour, T.; Slezakova, R. Implementation of Heat Maps in Geographical Information System–Exploratory Study on Traffic Accident Data. Open Geosci. 2018, 10, 367–384. [Google Scholar] [CrossRef]
- Papathoma-Köhle, M.; Promper, C.; Bojariu, R.; Cica, R.; Sik, A.; Perge, K.; László, P.; Czikora, E.B.; Dumitrescu, A.; Turcus, C.; et al. A common methodology for risk assessment and mapping for south-east Europe: An application for heat wave risk in Romania. Nat. Hazards 2016, 82, 89–109. [Google Scholar] [CrossRef] [Green Version]
Figure 1.
Correlation between the variables with the strongest associations.

Figure 2.
Distribution of occurrences in each variable by incident type.

Figure 3.
Heatmap—Distribution of incidents in the city of Lisbon.

Figure 4.
Heatmap—Spatial Distribution of each type of occurrence group. The A subfigure shows fire (building fires), B subfigure shows industrial–technological (gas leaks and suspicious situations). C subfigure shows accidents (with equipment or with elevators), and D subfigure shows infrastructure (floods and falls).

Figure 5.
Heatmap—Buildings’ antiquity distribution, where yellow colors represent older buildings, mainly in the city center.
Figure 5.
Heatmap—Buildings’ antiquity distribution, where yellow colors represent older buildings, mainly in the city center.

Figure 6.
Number of fires per month of the year, where 1 is the 1st month, January, and 12th, the last, December.
Figure 6.
Number of fires per month of the year, where 1 is the 1st month, January, and 12th, the last, December.

Figure 7.
Number of industrial incidents per month of the year, where 1 is the 1st month, January, and 12th, the last, December.
Figure 7.
Number of industrial incidents per month of the year, where 1 is the 1st month, January, and 12th, the last, December.

Figure 8.
The number of infrastructure incidents distribution per month of the year, where 1 is the 1st month, January, and 12th, the last, December (A) and influence of weather conditions—rain precipitation in mm3 per incident type. Values in the period of 2011 to 2018 (B).
Figure 8.
The number of infrastructure incidents distribution per month of the year, where 1 is the 1st month, January, and 12th, the last, December (A) and influence of weather conditions—rain precipitation in mm3 per incident type. Values in the period of 2011 to 2018 (B).

Figure 9.
Structure types by building’s age.

Figure 10.
Distribution of types of incidents by number of floors, based on the building age.

Figure 11.
Distribution of the number of floors by building age.

Figure 12.
The graphic that represents the best number of neighbors to choose for k-nearest neighbor (KNN), where k represents the number of neighbors.
Figure 12.
The graphic that represents the best number of neighbors to choose for k-nearest neighbor (KNN), where k represents the number of neighbors.

Figure 13.
The random forest accuracy (identified as score), based on the estimators’ numbers.

Figure 14.
Algorithm accuracy comparison for Dataset 1 with four independent variables with high correlation.
Figure 14.
Algorithm accuracy comparison for Dataset 1 with four independent variables with high correlation.

Figure 15.
Algorithm accuracy comparison for Dataset 2, with fourteen independent variables.


Table 1.
Summary of the publications found in the literature search. (*) Decision Support System/Framework Prototype/Risk analysis platform. (1) Data/Text mining; (2) Statistical Analysis. Notes: (+) Multi-hazard assessment, response, and planning (http://ergo.ncsa.illinois.edu/); (++) Satellite digital elevation model; (+++) Centre for Research on the Epidemiology of Disasters. Document type: B—book chapter; J—journal article.
| Ref. | Year | Doc. Type | Topic | Data Source | Methodology Applied | (*) | |
|---|---|---|---|---|---|---|---|
| (1) | (2) | ||||||
| [6] | 2019 | B | Urban disasters | Emergency Events Database (EM-DAT) | X | X | |
| [21] | 2020 | J | Impact of climate change on disaster events in metropolitan cities | Regional Emergency Medical Operation Centers (REMOCs) | X | ||
| [13] | 2020 | J | Urban severe rainfall and flooding disasters | Data fusion: GIS, interviews, surveys | X | X | X |
| [20] | 2018 | J | Disaster early warning and damage assessment analysis | Social media (Twitter), geo-location, information on disaster losses | X | X | X |
| [2] | 2017 | J | A cloud-enabled automatic disaster analysis system | Social media, remote sensing, Wikipedia data | X | X | X |
| [4] | 2017 | J | The Resilience to Emergencies and Disasters Index | New York City’s 311 service request system, others | X | X | X |
| [16] | 2019 | J | Design and Implementation of a Multi-Disaster Risk Assessment Database System | HAZUS-MH, ERGO (+), public data | X | X | X |
| [14] | 2018 | J | Quantifying the Spatiotemporal Pattern of Urban Expansion, Hazard and Risk Area | Landsat images, Remote sensing, GIS | X | X | |
| [17] | 2016 | J | Suitability estimation for urban development | Topographic, geological, precipitation, earthquake catalog, landslide, observations | X | X | |
| [18] | 2019 | J | Multi-hazard probability assessment and mapping | Satellite, Landsat8, Weather stations | X | X | |
| [25] | 2019 | J | Comparative assessment (…) for gully erosion susceptibility modeling | Several including GIS and DEM (++) | X | X | |
| [5] | 2016 | J | Multi-hazard risk assessment | GIS | X | X | |
| [7] | 2018 | J | CrisMap: A Big Data Crisis Mapping System | Social media (Twitter) | X | X | X |
| [8] | 2018 | J | Effects of urban development on future multi-hazard risk | HAZUS-MH, 2006 Census of Canada | X | X | |
| [3] | 2019 | J | Current and Emerging Disaster Risks Perceptions in Oceania | CRED (+++), EM-DAT, interviews | X | X | |
| [15] | 2019 | J | A Machine Learning Ensemble Approach | Several including GIS and National Meteorological Information Center | X | X | |
| [19] | 2019 | J | Multi-hazard assessment modeling | Topographic, geological, precipitation, landslide, observations | X | X | X |
Table 2.
Incident type versus variable importance from the data analytics performed, where +++ means higher intensity of occurrences ++ medium intensity of occurrences and + lower intensity of occurrences.
Table 2.
Incident type versus variable importance from the data analytics performed, where +++ means higher intensity of occurrences ++ medium intensity of occurrences and + lower intensity of occurrences.
| Number Vehicles | Number of Human Resources | Weather Condition-Precipitation | Building Age | |
|---|---|---|---|---|
| Industrial–tech. | ++ | +++ | + | +++ |
| Infrastructure | ++ | + | +++ | ++ |
| Fire | +++ | ++ | + | + |
| Accidents | + | + | + | + |
Publisher’s Note: MDPI stays neutral with regard to jurisdictional claims in published maps and institutional affiliations. |
© 2020 by the authors. Licensee MDPI, Basel, Switzerland. This article is an open access article distributed under the terms and conditions of the Creative Commons Attribution (CC BY) license (http://creativecommons.org/licenses/by/4.0/).
Share and Cite
MDPI and ACS Style
Elvas, L.B.; Marreiros, C.F.; Dinis, J.M.; Pereira, M.C.; Martins, A.L.; Ferreira, J.C. Data-Driven Approach for Incident Management in a Smart City. Appl. Sci. 2020, 10, 8281. https://0-doi-org.brum.beds.ac.uk/10.3390/app10228281
AMA Style
Elvas LB, Marreiros CF, Dinis JM, Pereira MC, Martins AL, Ferreira JC. Data-Driven Approach for Incident Management in a Smart City. Applied Sciences. 2020; 10(22):8281. https://0-doi-org.brum.beds.ac.uk/10.3390/app10228281
Chicago/Turabian StyleElvas, Luís B., Carolina F. Marreiros, João M. Dinis, Maria C. Pereira, Ana L. Martins, and João C. Ferreira. 2020. "Data-Driven Approach for Incident Management in a Smart City" Applied Sciences 10, no. 22: 8281. https://0-doi-org.brum.beds.ac.uk/10.3390/app10228281
Note that from the first issue of 2016, this journal uses article numbers instead of page numbers. See further details here.