Bio-Energy Generation from Synthetic Winery Wastewaters
by
 ,
,
Stanislaw Marks
1, 
Jacek Dach
1,
Jose Luis Garcia-Morales
2 and
Francisco Jesus Fernandez-Morales
3,* 1
Institute of Biosystems Engineering, Poznań University of Life Sciences, ul. Wojska Polskiego 50, 60-637 Poznań, Poland
2
Environmental Technologies Department, Institute of Viticulture and Agri-Food Research (IVAGRO), Faculty of Environmental and Marine Sciences, International Campus of Excellence (ceiA3), University of Cadiz, Puerto Real, 11510 Cádiz, Spain
3
Chemical Engineering Department, Faculty of Chemical Sciences & Technologies, University of Castilla-La Mancha, Avenida Camilo José Cela, 12, 13071 Ciudad Real, Spain
*
Author to whom correspondence should be addressed.
Appl. Sci. 2020, 10(23), 8360; https://0-doi-org.brum.beds.ac.uk/10.3390/app10238360
Submission received: 10 November 2020
/
Revised: 21 November 2020
/
Accepted: 22 November 2020
/
Published: 25 November 2020
(This article belongs to the Special Issue 10th Anniversary of Applied Sciences: Invited Papers in Energy Section)
Abstract
:Featured Application
Acidogenic fermentation of winery wastes can represent an interesting option for the energetic valorization of these highly polluted wastewaters.
Abstract
In Spain, the winery industry exerts a great influence on the national economy. Proportional to the scale of production, a significant volume of waste is generated, estimated at 2 million tons per year. In this work, a laboratory-scale reactor was used to study the feasibility of the energetic valorization of winery effluents into hydrogen by means of dark fermentation and its subsequent conversion into electrical energy using fuel cells. First, winery wastewater was characterized, identifying and determining the concentration of the main organic substrates contained within it. To achieve this, a synthetic winery effluent was prepared according to the composition of the winery wastewater studied. This effluent was fermented anaerobically at 26 °C and pH = 5.0 to produce hydrogen. The acidogenic fermentation generated a gas effluent composed of CO2 and H2, with the percentage of hydrogen being about 55% and the hydrogen yield being about 1.5 L of hydrogen at standard conditions per liter of wastewater fermented. A gas effluent with the same composition was fed into a fuel cell and the electrical current generated was monitored, obtaining a power generation of 1 W·h L−1 of winery wastewater. These results indicate that it is feasible to transform winery wastewater into electricity by means of acidogenic fermentation and the subsequent oxidation of the bio-hydrogen generated in a fuel cell.
1. Introduction
The environmental constraints of fossil fuels are accelerating the change from fossil energy resources to renewable and environmentlly-friendly ones. Every year, the earth provides us with a considerable amount of organic waste products, which are even more complex than fossil fuels, presenting very high concentrations of carbohydrates. Most of these carbohydrates are polysaccharides, mainly based on glucose, fructose or xylose units. The advantages of these polysaccharides are their low cost and their large-scale availability. However, despite their large-scale availability and low cost, it must be said that nowadays the energy industry scarcely uses these polysaccharides [1]. As fossil fuel prices and environmental regulations begin to adversely affect traditional fossil fuel energy sources, the transition to an energy industry based on renewable energy sources is practically inevitable.
One of the best ways to extract the energy contained in organic waste is through the application of acidogenic fermentation processes. In these processes, the substrates contained in the waste are able to be transformed into a gas stream that is rich in hydrogen, a promising energy vector due to characteristics including its energy yield and carbon neutral abilities [2], as well as carbon dioxide. Simultaneously, the liquid phase is rich in short-chain fatty acids (SCFAs), mainly acetate, butyrate and propionate at low pH and butanol, ethanol and isopropanol at high pH, all of which are very interesting substrates [3]. The acidogenic fermentation process can be carried out with mixed or pure cultures [4]. Mixed culture fermentations are characterized by their low operational costs due to the absence of sterilization processes. Additionally, due to the lack of sterilization stages, it is possible to implement continuous fermentative processes. On the other hand, pure culture fermentation processes require sterilization stages [5,6]. Because of this, pure culture fermentative processes consume significant amounts of energy and are not recommended for the treatment of waste because of the microbial contamination of the culture. These drawbacks impede the practical implementation of the acidogenic fermentation of wastes with pure cultures [7].
In Spain one of the most representative agro-industries is the winery industry. Castilla–La Mancha is the region with the highest grape production, about 3.7 million tons in 2018, which represents about 55% of Spanish production. Like most industrial activities, wine production generates large volumes of wastewater, mainly due to washing and sanitizing operations [7]. In Spain, the overall wastewater production ranges from 0.7 to 3.8 m3 per ton of grapes processed, a value within the ranges reported in the literature [8]. These effluents contain high concentrations of easily biodegradable pollutants, mainly carbohydrates, that could be converted into hydrogen by means of acidogenic fermentation processes [9,10]. Hydrogen is an environmentally-friendly energy vector presenting a high specific energy yield, 122 kJ g−1, and significant advantages over fossil energy sources, such as its production using environmental sustainable bio-processes and the possibility of the conversion of renewable raw materials, including biowastes [11,12,13,14].
In this context, the aim of this work was to study the conversion of winery wastewater into energy. To achieve this, winery wastewater was characterized and its main components were identified. Subsequently, bio-hydrogen production from winery wastewater was studied and the potential bio-hydrogen production from winery wastewater was determined. Finally, the bio-hydrogen produced from winery wastewater was fed into a fuel cell stack of 150 cm2, operated at 150 °C and the electric power generated was determined.
2. Materials and Methods
2.1. Inoculum and Winery Wastewater
The present study was carried out using a mixed culture obtained by biokinetic control according to the procedure described in the literature [15]. The inoculum was activated sludge from a conventional wastewater treatment plant, described elsewhere [16]. This kind of inoculum mainly contains aerobic and facultative microorganisms [17,18]. Acidogenic microorganisms are also present in activated sludges but at low concentrations [19]; the main strains are Clostridium and Klebsiella [20,21,22].
The acidogenic culture used in this work was acclimatized in a sequential batch reactor (SBR) operating at pH 5 and 26 °C, according to the literature [23]. With the aim of ensuring anaerobic conditions, the reactor was sparged with 40 mL min−1 of nitrogen gas. Silicone antifoaming (Rhodrorsil 426 R, DBH prolabo) solution at 2% was continuously dosed at 25 μL min−1 in order to avoid foaming of the culture. In order to ensure the reproducibility of the cycles, the SBR was fed with a synthetic winery effluent. In order to define the composition of the synthetic winery effluent, real winery wastewater was taken from a winery located in Valdepeñas (Ciudad Real, Spain) and was subsequently analyzed. From these analyses, it was observed that the main monosaccharides contained in the winery effluents were glucose and fructose, with their average concentrations being 4.5 g L−1 of glucose, 4.5 g L−1 of fructose. The relevance of the monosaccharide determination is because they are the substrates converted into hydrogen, carbon dioxide and SCFA during the acidogenic fermentative processes. In the literature, glucose and fructose were also identified as the main monosaccharides contained in winery effluents [24,25,26]. Additionally, in order to ensure the feasibility of the acidogenic fermentation processes, the synthetic winery wastewater was supplemented with inorganic minerals. The organic and inorganic components of the synthetic winery wastewater used in this work are presented in Table 1. Before the experiments, the synthetic winery wastewater was sterilized at 100 °C for 30 min according to the literature [15] with the aim of avoiding its degradation during storage.
The acclimatization cycles were carried out for more than five months in order to reach the steady state operation. Once the steady state was reached, the acclimatized culture was used to carry out the fermentation experiments.
2.2. Batch Experiments
The fermentative processes of the substrates contained in the winery effluent were studied, performing three different series of batch tests. At the beginning, in order to study the contribution of the main pollutants contained in the winery effluent, glucose and fructose were fermented separately by the acclimatized culture. After studying, the fermentation of these two substrates, a series of batch tests was performed upon the synthetic winery effluent. All the batch test were carried out in an SBR of 3 L capacity (2 L working volume of the liquid phase and 1 L working volume of the gas phase), using the acclimatized biomass at 26 °C and pH 5. A schematic design of the experimental setup used in this work is presented in Figure 1.
2.3. Sampling Procedure and Analytical Methods
A variety of analytical techniques were used in order to characterize the liquid and gas phases. The total suspended solids (TSS) were determined by means of filtering the sample through a Millipore 0.45-µm membrane filter and dried overnight at 105 °C. This filter was subsequently calcinated for 2 h at 550 °C with the aim of determining the volatile suspended solids (VSS). The TSS and the VSS were determined according to the standard methods [27]. To accurately characterize the liquid phase, samples were taken and immediately centrifuged at 13,000 rpm, filtered through a 0.45-µm membrane and frozen at −4 °C until analysis. Glucose and fructose concentrations were determined using an HPLC (Agilent) system equipped with a Zorbax Carbohydrate column (4.6 × 150 mm 5-micron) operating at 35 °C and using a mobile phase composed of 84 vol.% acetonitrile and 16 vol.% water at a flow rate of 1.2 mL min−1. Fermentation products (acetate, propionate and butyrate) were determined by gas chromatography (Perkin Elmer) with a flame ionization detector (FID) using a Crossbond Carbowax column. The oven temperature was maintained at 140 °C for 1.5 min and then increased at 25 °C/min until the temperature reached 190 °C, where it was maintained for 2 min. The temperatures of the injector and detector were 200 °C and 230 °C, respectively. Lactate concentration was determined by HPLC (Agilent) along with ultraviolet diode array detection (UV-DAD) and a Zorbax SB-Aq column (4.6 × 150 mm 5 µm). The mobile phase was a 0.02 M phosphate buffer (pH 2) composed of 99% water and 1% acetonitrile. The pH was measured and controlled by means of BioXpert software and a Biocontroller ADI 1030 (Applikon). The gas composition was on-line determined by means of a multi-component gas analyzer (Rosemount Analytical NGA 2000 MLT, Emerson).
2.4. Fuel Cell
The fuel cell hardware used in this work was made of two bipolar graphite plates (Sofacel, Spain). The fuel cell temperature was controlled with a controller (CAL 3300, Cal Controls Ltd., Brighton, UK) [28,29]. The cathodic electrode was doped with 0.5 mg Pt cm−2 in order to enhance its catalytic activity. A PBI membrane was sandwiched between the anode and the cathode by hot-pressing 100 kg cm−2 for 15 min [30] at 150 °C. A synthetic bio-hydrogen gas was fed into the anodic chamber of the fuel cell at a flow rate of 230 mL min−1. The synthetic bio-hydrogen presented the same composition of bio-hydrogen as that generated in the acidogenic fermentation of the winery wastewater. Synthetic bio-hydrogen was used because of the high volumetric hydrogen consumption of the fuel cell. The cathodic chamber was fed with oxygen at a flow rate of 375 mL min−1. Both gas flows were measured at standard temperature and pressure (STP) conditions.
3. Results and Discussion
In order to study the individual contributions to the hydrogen production of organic monosaccharides contained in the winery wastewaters—glucose and fructose—batch acidogenic fermentation tests were performed by separately feeding 9 g L−1 of glucose alone and fructose alone. These experiments were performed by using the culture acclimatized to the synthetic winery effluent and adding the required trace minerals. The individual contribution of the glucose and fructose is described below. In these experiments, the substrate consumption, hydrogen and carbon dioxide production, biomass concentration (measured as TSS and VSS) and SCFA generation were determined.
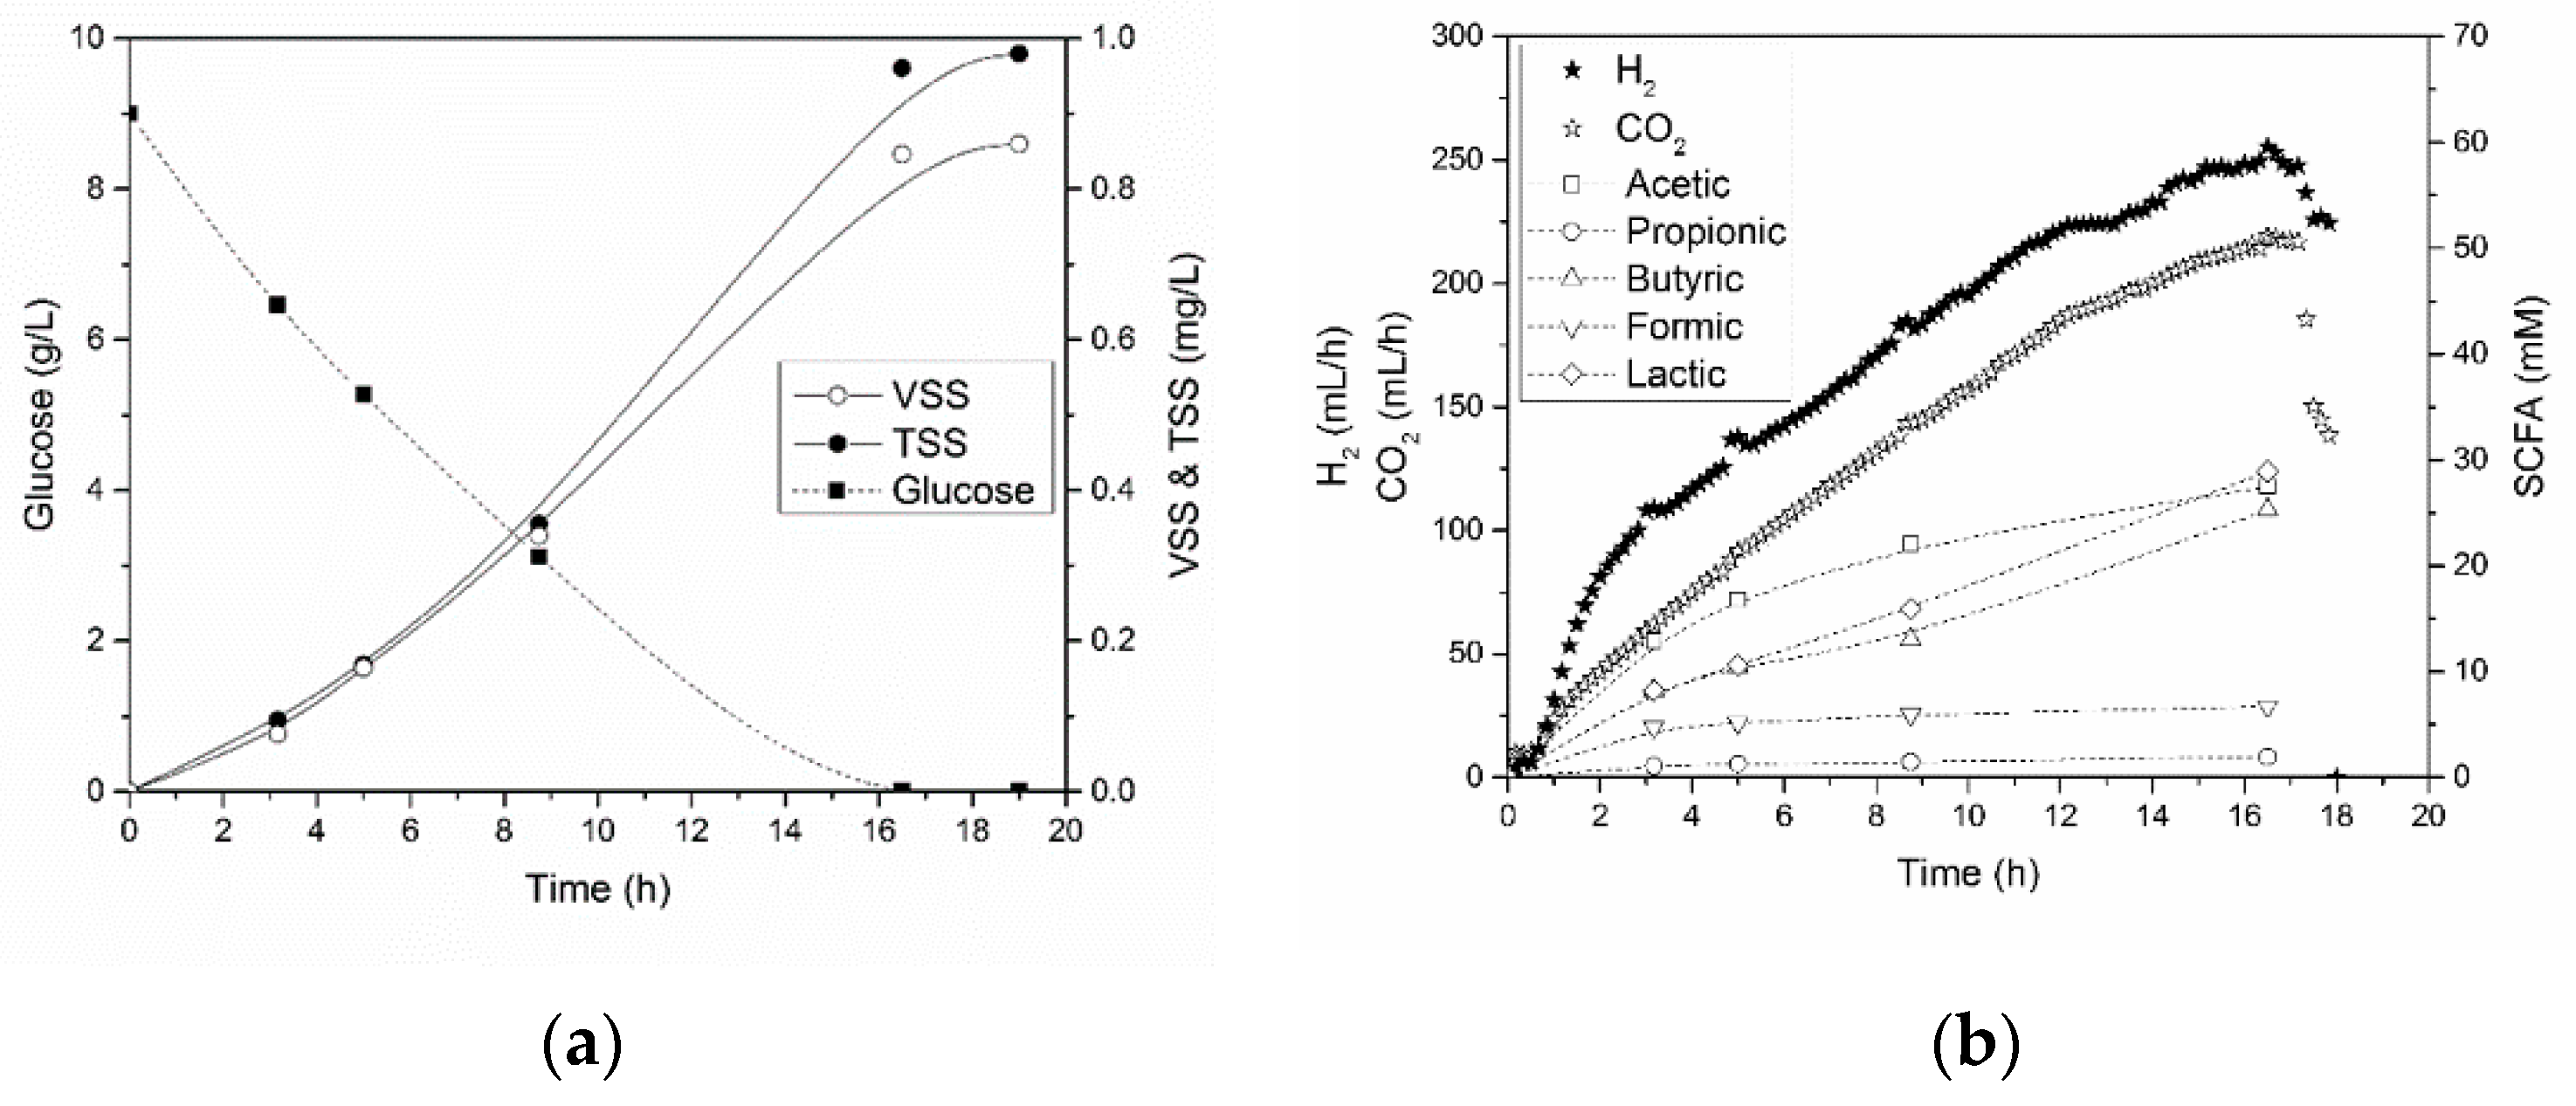
3.1. Acidogenic Fermentation of Glucose
The experimental results obtained when fermenting glucose are presented in Figure 2. In this Figure, the glucose consumption and the biomass growth, as well as the bio-hydrogen, carbon dioxide and SCFA generation are shown. As shown in Figure 2, the glucose was completely consumed after about 16.5 h. In this experiment the trend was almost linear during the first 8 h, with an average degradation rate of 0.55 g L−1 h−1; after that, the fermentation rate decreased. The decrease in the fermentation rate could be due to the low substrate concentration, near the half-saturation coefficient value, which limited the mass transfer and therefore the fermentation rate. Once the acidogenic fermentation of the glucose was complete, the average hydrogen yield was 370 mL g−1 glucose consumed, measured at STP. The maximum hydrogen production rate when fermenting glucose was obtained during the first two hours, with a value of 250 mL of hydrogen h−1. The cumulative hydrogen production was about 3.33 L measured at STP, whereas the cumulative carbon dioxide production was 2.68 L measured at STP. These results are in accordance with those reported in the literature [31].
The glucose fermentation presented a biomass growth yield of 0.11 g TSS g−1 glucose consumed. Regarding the production of SCFAs, the acetate presented the highest production rate at the beginning of the experiment. However, lactate was the SCFA presenting the highest final concentration—28.9 mmoL, a value slightly higher than that obtained by the acetate, at 27.5 mmoL.
3.2. Acidogenic Fermentation of Fructose
The results obtained when fermenting fructose with the acclimatized culture are presented in Figure 3. In the case of the fructose, its acidogenic fermentation took about 15 h, a value slightly lower than that of the fermentation of glucose. The average fermentation rate of the fructose, about 0.60 g L−1 h−1, was slightly higher than that of the glucose. However, the biomass yield obtained when fermenting fructose was 0.10 g TSS g−1 fructose consumed, a value slightly lower than that obtained when fermenting glucose. Comparing the SCFA yields obtained when fermenting glucose and fructose, it was observed that the product distribution obtained, as well as their concentrations, were similar in both cases. These results are in accordance with results previously reported in the literature about the acidogenic fermentation of glucose and fructose by mixed cultures [23].
Regarding the bio-hydrogen production obtained when fermenting fructose, it must be stated that its value was lower than that obtained with glucose. The maximum bio-hydrogen production rate when fermenting fructose was about 200 mL h−1, whereas the bio-hydrogen yield was about 334 mL g−1 fructose consumed (STP); both values were slightly lower than that obtained when fermenting glucose. The cumulative hydrogen production was about 3.00 L measured at STP, whereas the cumulative carbon dioxide production was 2.85 L measured at STP. The cumulative hydrogen and carbon dioxide obtained were slightly lower than those observed in the acidogenic fermentation of the glucose. However, the product distribution was very similar in both cases, with a H2/CO2 ratio of 1.2 in the case of the glucose fermentation and 1.1 in the case of the fructose fermentation.
Once the fermentation of the main organic pollutants present in the winery effluent had been studied, the acidogenic fermentation of the synthetic winery effluent was evaluated.
3.3. Winery Wastewater Fermentation
After studying the acidogenic fermentation of the main saccharides contained in the winery wastewater, the acidogenic fermentation of the synthetic winery wastewater was carried out. In these experiments the total monosaccharide concentration was the same as in the previous tests, 9 g L−1. However, due to the presence of both saccharides—glucose and fructose—in the winery effluent the concentration of each of them was 4.5 g L−1. The main results obtained during the acidogenic fermentation of the synthetic winery wastewater are shown in Figure 4. In this figure the substrate consumption, glucose and fructose content and biomass growth, as well as the hydrogen, carbon dioxide production and SCFA generation are presented.
In Figure 4 it can be seen that the fructose was fully consumed before the full consumption of the glucose, which needed two hours more to be completely consumed. The different moments at which the substrates were consumed were reflected in the biomass growth, which showed a slow reduction in the biomass growth once the fructose was fully consumed after 9.5 h of fermentation. The average glucose and fructose consumption rates were representative of the process taking place in the bioreactor, with values of 0.47 g L−1 h−1 for the fructose and 0.37 g L−1 h−1 for the glucose. The full consumption of the fructose was also observed in the hydrogen and the carbon dioxide production, which presented different trends throughout the experiment. During the first hour of the experiment, the gas production increased according to an exponential trend; however, after this moment the trend slowed down to a linear trend. This linear trend drastically changed after approximately 9.5 h from the beginning of the experiment, presenting a drastic decrease, which can be explained by the full consumption of the fructose in the bulk solution. Finally, after 12 h the hydrogen and carbon dioxide generation finished, because of the full consumption of the organic pollutants contained in the synthetic winery wastewater. Parallel to the hydrogen, carbon dioxide and biomass production, several SCFAs were produced. The main SCFA produced was acetate, followed by butyrate and lactate. The amounts of propionic and formic acid produced by the acidogenic fermentation of the winery effluents were negligible. The product distribution obtained was close to that previously described in the literature when dealing with similar substrates [32,33].
The biomass yield obtained when fermenting the winery wastewater was 0.10 g TSS g−1 substrate fermented. This value was identical to that obtained when fermenting fructose and was very similar to the value obtained with glucose as the substrate. Because of this, the biomass yield obtained when fermenting the synthetic winery wastewater could be explained by the proportional contributions of the fructose and glucose, without significant differences. The bio-hydrogen production obtained when fermenting the winery effluent, 350 mL h−1, was also an average of the values obtained when fermenting the glucose and the fructose in isolation—370 mL STP g−1 glucose was fermented and 334 mL STP g−1 fructose was fermented, respectively. However, the fermentation products generated when fermenting the synthetic winery wastewater were different to those obtained when fermenting the glucose and the fructose in isolation, with the acetic acid generation being about a 30% higher than those observed when fermenting the glucose and the fructose separately. This behavior could be explained by the effect of co-fermentation on SCFA production, as described in the literature [34].
When comparing the substrate consumption rate, it must be highlighted that the rates obtained when fermenting the glucose and fructose separately were slower than those obtained when fermenting the winery wastewater. As indicated above, this behavior could be explained by the co-fermentation effect [34]. These results are in accordance with previous works described in the literature, which reported positive effects of co-fermentation processes due to synergistic effects on acidogenic fermentation [33,35]. Once the acidogenic fermentation of the synthetic winery wastewater was complete, a total quantity of 3.26 L (STP) of hydrogen, 55% H2 and 45% CO2, was obtained from the 2 L reactor.
3.4. Electricity Production
Finally, after completing the acidogenic fermentation study, a synthetic gas stream presenting the same composition as the bio-hydrogen generated in the acidogenic fermentation of the winery effluent was synthesized. The synthetic bio-hydrogen gas was fed into an anodic chamber fuel cell at a flow rate of 230 mL min−1 (STP). The bio-hydrogen and air were fed at atmospheric pressure and at constant stoichiometries of 2 and 3, respectively. Oxygen was fed into the cathodic chamber at a flow rate of 375 mL min−1 (STP). The voltage exerted by the fuel cell when generating a current density of 0.3 A cm−2 was determined. The maximum power exerted by the fuel cell fuel cell oxidizing the synthetic bio-hydrogen obtained in the fermentation of the winery effluent was 14.3 W.
4. Conclusions
From the results obtained in this work, it can be concluded that it is possible to easily convert the organic pollutants contained in winery effluents into hydrogen and SCFA by acidogenic fermentation. This option allows the recovery of the energy contained in the substrates within this kind of effluent—mainly monosaccharides. From the acidogenic fermentation of the synthetic winery wastewater, a gas stream containing 55% hydrogen and 45% carbon dioxide was obtained, with the hydrogen production being about 1.5 L (STP) L−1 from synthetic winery wastewater. A gas stream with the same composition as the gas stream obtained in the acidogenic fermentation tests was fed into a fuel cell operating 150 °C, and the maximum power exerted was 14.3 W at a current density of 0.3 A cm−2. Taking into account the hydrogen production and the maximum power generation, it can be stated that each L of winery wastewater could generate about 1W·h L−1.
Author Contributions
Conceptualization and methodology, F.J.F.-M.; investigation, S.M.; data curation, J.L.G.-M.; writing-original draft, F.J.F.-M.; writing—review and editing, F.J.F.-M. and J.D.; project administration, J.L.G.-M.; funding acquisition, J.L.G.-M. and F.J.F.-M. All authors have read and agreed to the published version of the manuscript.
Funding
This research has been co-financed by the 2014-2020 ERDF Operational Programme and by the Department of Economy, Knowledge, Business and University of the Regional Government of Andalusia. Project reference: FEDER-UCA18-107460.
Conflicts of Interest
The authors declare no conflict of interest.
References
- Hao, H.-T.N.; Karthikeyan, O.P.; Heimann, K. Bio-Refining of Carbohydrate-Rich Food Waste for Biofuels. Energies 2015, 8, 6350–6364. [Google Scholar] [CrossRef] [Green Version]
- Xi-Yu, C.; Chun-Zhao, L. Hydrogen Production via Thermophilic Fermentation of Cornstalk by Clostridium thermocellum. Energy Fuels 2011, 25, 1714–1720. [Google Scholar]
- Mechery, J.; Thomas, D.M.; Kumar, C.S.P.; Laigi, J.; Sylas, V.P. Biohydrogen production from acidic and alkaline hydrolysates of paddy straw using locally isolated facultative bacteria through dark fermentation. Biomass Conv. Bioref. 2019. [Google Scholar] [CrossRef]
- Kleerebezem, R.; van Loosdrecht, M.C. Mixed culture biotechnology for bioenergy production. Curr. Opin. Biotechnol. 2007, 18, 207–212. [Google Scholar] [CrossRef]
- Kotay, S.M.; Das, D. Microbial hydrogen production with Bacillus coagulans IIT-BT S1 isolated from anaerobic sewage sludge. Biores. Technol. 2007, 98, 1183–1190. [Google Scholar] [CrossRef]
- Chen, W.-M.; Tseng, Z.-J.; Lee, K.-S.; Chang, J.-S. Fermentative Hydrogen production with Clostridium butyricum CGS5 isolated from anaerobic sewage sludge. Int. J. Hydrogen Energy. 2005, 30, 1063–1070. [Google Scholar] [CrossRef]
- Rodriguez, L.; Villaseñor, J.; Fernández, F.J. Use of agro-food wastewaters for the optimisation of the denitrification process. Water Sci. Technol. 2005, 55, 63–70. [Google Scholar] [CrossRef]
- Kyzas, G.Z.; Symeonidou, M.P.; Matis, K.A. Technologies of winery wastewater treatment: A critical approach. Desal. Water Treat. 2016, 57, 3372–3386. [Google Scholar] [CrossRef]
- Carrillo-Reyes, J.; Albarrán-Contreras, B.A.; Buitrón, G. Influence of Added Nutrients and Substrate Concentration in Biohydrogen Production from Winery Wastewaters Coupled to Methane Production. Appl. Biochem. Biotechnol. 2019, 187, 140–151. [Google Scholar] [CrossRef]
- Das, D.; Veziroǧlu, T.N. Hydrogen production by biological processes: A survey of literature. Int. J. Hydrogen Energy 2001, 26, 13–28. [Google Scholar] [CrossRef]
- Dong, L.; Zhenhong, Y.; Yongming, S.; Xiaoying, K.; Yu, Z. Hydrogen production characteristics of the organic fraction of municipal solid wastes by anaerobic mixed culture fermentation. Int. J. Hydrogen Energy 2009, 34, 812–820. [Google Scholar] [CrossRef]
- Kotay, S.M.; Das, D. Biohydrogen as a renewable energy resource—Prospects and potentials. Int. J. Hydrogen Energy 2008, 33, 258–263. [Google Scholar]
- Fang, H.H.P.; Liu, H. Effect of pH on hydrogen production from glucose by a mixed culture. Biores. Technol. 2002, 82, 87–93. [Google Scholar] [CrossRef]
- De Lucas, A.; Rodriguez, L.; Villaseñor, J.; Fernández, F.J. Fermentation of agro-food wastewaters by activated sludge. Water Res. 2007, 41, 1635–1644. [Google Scholar] [CrossRef]
- Fernández-Morales, F.J.; Villaseñor, J.; Infantes, D. Modeling and monitoring of the acclimatization of conventional activated sludge to a biohydrogen producing culture by biokinetic control. Int. J. Hydrogen Energy. 2010, 35, 10927–10933. [Google Scholar] [CrossRef]
- Rodríguez Mayor, L.; Villaseñor Camacho, J.; Fernández Morales, F.J. Operational optimisation of pilot scale biological nutrient removal at the Ciudad Real (Spain) domestic wastewater treatment plant. Water Air Soil Pollut. 2004, 152, 279–296. [Google Scholar] [CrossRef]
- Schlegel, H.G. General Microbiology, 7th ed.; Cambridge University Press: Stuttgart, Germany, 1993. [Google Scholar]
- International Commission on Microbiological Specifications of Foods (ICMSF). Microorganisms in Foods 6: Microbial Ecology of Food Commodities, 2nd ed.; Springer: New York, NY, USA, 2005. [Google Scholar]
- Seonaez, M.; Angulo, I. Aguas Residuales Urbanas. Tratamientos Naturales de bajo Costo y Aprovechamiento; Mundi-Prensa: Madrid, Spain, 1995. [Google Scholar]
- Wang, J.; Wan, W. Factors influencing fermentative hydrogen production: A review. Int. J. Hydrogen Energy 2009, 34, 799–811. [Google Scholar] [CrossRef]
- Zhu, H.; Béland, M. Evaluation of alternative methods of preparing hydrogen producing seeds from digested wastewater sludge. Int. J. Hydrogen Energy 2006, 31, 1980–1988. [Google Scholar] [CrossRef]
- Temudo, M.F.; Muyzer, G.; Kleerebezem, R.; van Loosdrecht, M.C.M. Diversity of microbial communities in open mixed culture fermentations: Impact of the pH and carbon source. Appl. Microbiol. Biotechnol. 2008, 80, 1121–1130. [Google Scholar] [CrossRef] [Green Version]
- Colin, T.; Bories, A.; Sire, Y.; Perrin, R. Treatment and valorisation of winery wastewater by a new biophysical process (ECCF). Water Sci. Technol. 2005, 51, 99–106. [Google Scholar] [CrossRef]
- Malandra, L.; Wolfaardt, G.; Zietsman, A.; Viljoen-Bloom, M. Microbiology of a biological contactor for winery wastewater treatment. Water Res. 2003, 37, 4125–4134. [Google Scholar] [CrossRef]
- Quayle, W.C.; Fattore, A.; Zandona, R.; Christen, E.W.; Arienzo, M. Evaluation of organic matter concentration in winery wastewater: A case study from Australia. Water Sci. Technol. 2009, 60, 2521–2528. [Google Scholar] [CrossRef] [PubMed]
- Infantes, D.; González del Campo, A.; Villaseñor, J.; Fernández, F.J. Kinetic model and study of the influence of pH, temperature and undissociated acids on acidogenic fermentation. Biochem. Eng. J. 2012, 66, 66–72. [Google Scholar] [CrossRef]
- Eaton, A.D. Standard Methods for the Examination of Water and Wastewater; American Public Health Association: Washington, DC, USA, 2005. [Google Scholar]
- Lobato, J.; Cañizares, P.; Rodrigo, M.A.; Linares, J.J. PBI-based polymer electrolyte membranes fuel cells. Temperature effects on cell performance and catalyst stability. Electrochim. Acta 2007, 52, 3910–3920. [Google Scholar] [CrossRef]
- Pinar, F.J.; Cañizares, P.; Rodrigo, M.A.; Úbeda, D.; Lobato, J. Scale-up of a high temperature polymer electrolyte membrane fuel cell based on polybenzimidazole. J. Power Sources 2011, 196, 4306–4313. [Google Scholar] [CrossRef]
- Lobato, J.; Cañizares, P.; Rodrigo, M.A.; Linares, J.J.; Pinar, F.J. Study of the influence of the amount of PBI-H3PO4 in the catalytic layer of a high temperature PEMFC. Int. J. Hydrogen Energy 2010, 35, 1347–1355. [Google Scholar] [CrossRef]
- Rodríguez, J.; Kleerebezem, R.; Lema, J.M.; van Loosdrecht, M.C. Modeling product formation in anaerobic mixed culture fermentations. Biotechnol. Bioeng. 2006, 93, 592–606. [Google Scholar] [CrossRef] [PubMed]
- Dahiya, S.; Sarkar, O.; Swamy, Y.V.; Venkata Mohan, S. Acidogenic fermentation of food waste for volatile fatty acid production with co-generation of biohydrogen. Bioresour. Technol. 2015, 182, 103–113. [Google Scholar] [CrossRef]
- Yin, J.; Yu, X.; Wang, K.; Shen, D. Acidogenic fermentation of the main substrates of food waste to produce volatile fatty acids. Int. J. Hydrogen Energy 2016, 41, 21713–21720. [Google Scholar] [CrossRef]
- Esteban-Gutiérrez, M.; Garcia-Aguirre, J.; Irizar, I.; Aymerich, E. From sewage sludge and agri-food waste to VFA: Individual acid production potential and up-scaling. Waste Manag. 2018, 77, 203–212. [Google Scholar] [CrossRef]
- Den Boer, E.; Łukaszewska, A.; Kluczkiewicz, W.; Lewandowska, D.; King, K.; Reijonen, T.; Kuhmonen, T.; Suhonen, A.; Jääskeläinen, A.; Heitto, A.; et al. Volatile fatty acids as an added value from biowaste. Waste Manag. 2016, 58, 62–69. [Google Scholar] [CrossRef] [PubMed]
Figure 1.
Set-up used in the acidogenic fermentative studies of the winery effluents.

Figure 2.
(a) Substrate consumption, biomass growth, expressed as volatile suspended solids (VSS) and total suspended solids (TSS). (b) Hydrogen and short-chain fatty acid (SCFA) production during glucose fermentation.
Figure 2.
(a) Substrate consumption, biomass growth, expressed as volatile suspended solids (VSS) and total suspended solids (TSS). (b) Hydrogen and short-chain fatty acid (SCFA) production during glucose fermentation.

Figure 3.
(a) Substrate consumption, biomass growth, expressed as VSS and TSS. (b) Hydrogen and SCFA production during fructose fermentation.
Figure 3.
(a) Substrate consumption, biomass growth, expressed as VSS and TSS. (b) Hydrogen and SCFA production during fructose fermentation.

Figure 4.
(a) Substrate consumption, biomass growth, expressed as VSS and TSS. (b) Hydrogen and SCFA production during fermentation of the synthetic winery effluent.
Figure 4.
(a) Substrate consumption, biomass growth, expressed as VSS and TSS. (b) Hydrogen and SCFA production during fermentation of the synthetic winery effluent.


Table 1.
Composition of the synthetic wastewater.
| Component | Concentration (g L−1) | Component | Concentration (g L−1) |
|---|---|---|---|
| Glucose | 4.5000 | ZnSO4 7H2O | 0.0072 |
| Fructose | 4.5000 | FeSO4 7H2O | 0.0070 |
| (NH4)Cl | 3.0150 | MnCl2 4H2O | 0.0056 |
| KH2PO4 | 1.7550 | CuCl 2H2O | 0.0050 |
| NaCl | 6.5700 | CoCl2 6H2O | 0.0022 |
| Na2SO4 | 0.1290 | CaCl2 | 0.0014 |
| MgCl2 6H2O | 0.2700 | NiCl2 6H2O | 0.0011 |
| EDTA | 0.1125 |
Publisher’s Note: MDPI stays neutral with regard to jurisdictional claims in published maps and institutional affiliations. |
© 2020 by the authors. Licensee MDPI, Basel, Switzerland. This article is an open access article distributed under the terms and conditions of the Creative Commons Attribution (CC BY) license (http://creativecommons.org/licenses/by/4.0/).
Share and Cite
MDPI and ACS Style
Marks, S.; Dach, J.; Garcia-Morales, J.L.; Fernandez-Morales, F.J. Bio-Energy Generation from Synthetic Winery Wastewaters. Appl. Sci. 2020, 10, 8360. https://0-doi-org.brum.beds.ac.uk/10.3390/app10238360
AMA Style
Marks S, Dach J, Garcia-Morales JL, Fernandez-Morales FJ. Bio-Energy Generation from Synthetic Winery Wastewaters. Applied Sciences. 2020; 10(23):8360. https://0-doi-org.brum.beds.ac.uk/10.3390/app10238360
Chicago/Turabian StyleMarks, Stanislaw, Jacek Dach, Jose Luis Garcia-Morales, and Francisco Jesus Fernandez-Morales. 2020. "Bio-Energy Generation from Synthetic Winery Wastewaters" Applied Sciences 10, no. 23: 8360. https://0-doi-org.brum.beds.ac.uk/10.3390/app10238360
Note that from the first issue of 2016, this journal uses article numbers instead of page numbers. See further details here.