Detection of Smoking in Indoor Environment Using Machine Learning


School of Electronic Engineering, Soongsil University, Seoul 06978, Korea
Appl. Sci. 2020, 10(24), 8912; https://0-doi-org.brum.beds.ac.uk/10.3390/app10248912
Submission received: 14 November 2020
/
Revised: 1 December 2020
/
Accepted: 10 December 2020
/
Published: 14 December 2020
(This article belongs to the Collection The Development and Application of Fuzzy Logic)
Abstract
:Revealed by the effect of indoor pollutants on the human body, indoor air quality management is increasing. In particular, indoor smoking is one of the common sources of indoor air pollution, and its harmfulness has been well studied. Accordingly, the regulation of indoor smoking is emerging all over the world. Technical approaches are also being carried out to regulate indoor smoking, but research is focused on detection hardware. This study includes analytical and machine learning approach of cigarette detection by detecting typical gases (total volatile organic compounds, CO2 etc.) being collected from IoT sensors. In detail, data set for machine learning was built using IoT sensors, including training data set securely collected from the rotary smoking machine and test data set gained from actual indoor environment with spontaneous smokers. The prediction accuracy was evaluated with accuracy, precision, and recall. As a result, the non-linear support vector machine (SVM) model showed the best performance with 93% in accuracy and 88% in the F1 score. The supervised learning k-nearest neighbors (KNN) and multilayer perceptron (MLP) models also showed relatively fine results, but shows effectivity simplifying prediction with binary classification to improve accuracy and speed.
1. Introduction
In modern society, most people mainly live indoors. Therefore, the importance of indoor air pollution has been continuously mentioned [1]. According to World Health Organization (WHO) research results, each year, 3.8 million people worldwide prematurely die from illnesses attributable to indoor air quality [2]. Moreover, the wake of recent events with COVID-19 is expected to increase the interest and importance of indoor living environments as living patterns change. As indoor air pollutants, there are various factors such as outdoor air inflow, cooking, smoking, building materials, etc. Among them, heating, cooking and smoking were reported as typical indoor air pollution produced by human activities with purpose [3]. However, cooking and heating are essential parts of our lives while indoor smoking is only the preference but adversely affects our health. According to WHO, indoor smoking exhausts fine particles 100 times higher than acceptable levels [4]. Additionally, the US Environmental Health Administration indicates a study found that when nicotine and a tobacco toxic substance combine with dust in the air, 40% remained even after 21 days. This long-term effect of indoor smoke is the evidence of possibility of even third-hand smoke. Nevertheless, cigarette sales in the first quarter of 2020 increased by 4.1% compared to last year. Compared to last year, sales of e-cigarettes decreased this year, while sales of tobacco increased. Thus, the tobacco cigarette ratio is 80% of total tobacco sales [5].
In order to define the effect of tobacco emissions on indoor air quality, many studies are conducted while global air quality monitoring regulations are framed in each country to save the human and environment from harmful gases in the air [6]. Therefore, beside the air contamination issues of smoking, the other studies have been proceeded to identify and detect pollutants such as Total Volatile Organic Compounds (TVOC), Particulate Matter (PM), Carbon Dioxide (CO2), Nitrogen Oxide (NOX), etc. [7,8,9,10]. When smoking indoors occurs, the aforementioned pollutants are produced and can be detected by various sensors. As previously announced through many studies, environmental sensors have been developed or utilized for accurate measurement of pollutants. However, the measurement of air quality is very difficult because the atmospheric environment is changed in real time. In addition, it is difficult to predict and prepare for the future of the atmospheric environment using outdated data or measurement methods. Nowadays all the cities in the world are integrated with Information and Communication Technology (ICT) and Internet of Things (IoT) technology to promote urban development. The IoT technology is used to manage and improve the cities which assert and service for the overall system This paper aims to detect pollution of indoor smoking in real time and accurately predict the pollution caused by indoor smoking and various general indoor air pollutions using ICT based sensors, which is relatively reasonable priced than existing real time detection method; camera, motion detector, etc. In this study, we were able to predict the smoking situation in the indoor environment by using non-intrusive environmental sensors. We experimented to predict the presence or absence of smoking in various general situations (cooking, heating, smoking). The problem with vision-based technology is that it is relatively expensive and the installation of surveillance cameras such as infrared sensors and motion sensors is rather difficult. Smoking detection using commercially available sensors is relatively easy and inexpensive to deploy, and existing installed sensors can be utilized. Therefore, we proposed a system that monitors the changing atmospheric environment in real time by combining ICT technology and pre-installed sensors.
1.1. Recent Studies on Cigarette Detection Sensing System
Previously, various studies have been conducted to identify and detect pollutants in indoor smoking. First, by connecting the MQ-7 carbon monoxide gas sensor to the Raspberry Pi camera through Serial Peripheral Interface (SPI) communication, it is possible to monitor the smoking information in the indoor smoking area in real time by measuring the concentration of Carbon Monoxide (CO) [11]. Additionally, using the same Raspberry Pi camera, a smoke sensor and a gas sensor were connected through serial communication to determine whether smoking indoors in public places, while a separate study was conducted on a smoking detecting system in real time. This made it possible to search for images using 3D printing after detecting indoor smoking in public places [12]. In addition, a study introduces a new system for detecting human smoking behavior or small smoke using image techniques. Smoking or non-smoking were detected by using a wearable sensor system (Personal Automatic Cigarette Tracker 2.0, PACT 2.0). This proposed a method of integrating the information of the lighter and the Inertial Measurement Unit (IMU) on the wrist [13]. A similar study has developed a new system that uses images to detect human smoking or small smoke, in which motion detection and background removal functions are combined with motion area saving, skin-based image segmentation, and smoke-based image segmentation to provide potential. Selecting a smoke area made it possible to determine the occurrence of smoking [14]. Recently, smoking image detection model based on a convolutional Neural Network (NN) called Smoking Net, which automatically detects smoking behavior in video contents through images and images is suggested. This method has proven high accuracy and excellent performance for real-time monitoring as it can detect smoking images using only the smoking gesture information and cigarette image characteristics without detecting cigarette smoke [15]. Using the smoking gesture detection model is trained to detect smoking gestures as described above, it was confirmed that a gesture classification indicating whether or not a smoking gesture was indicated is received through sensor data [16].
1.2. Sensing System for Indoor Air Quality Detection
Recently, a system that monitors the environment in real time by combining ICT technology with sensor technology has been used in order to only complement the existing method. Many different technologies have been studied to identify powerful and practical ways to monitor air quality in daily life. Research was conducted mainly to minimize human intervention and to automatically monitor indoor air quality. The system included a physical circuit and an interactive platform, and the used main components in the physical circuit were the elements as Arduino Leonardo, a dust sensor, a temperature, humidity sensor, a Liquid Crystal Display (LCD). These are connected with sensor network or Ubidots (Boston, MA, USA) under specific conditions. And then air quality was analyzed [17]. Generally, pollutant concentrations of PM 2.5 and CO generated indoors were measured for pollutants using an IQ Air Visual Pro sensor (PM 2.5) and an electrochemical COA1 (CO, UEI, Gardena, CA, USA) detector adapter device [18]. Personal PM exposure of indoor and outdoor was evaluated using an inexpensive measuring device called DustDuino (Dominican Republic) consisting of a dust sensor (Plantower#3003, Plantpower, Beijing, China) that counts particles using infrared photodiodes [19] and changes in air conditions to check indoor air pollution. In addition, through a similar study, an IoT sensing system was developed that monitors and analyzes the indoor CO2 concentration in real time. Additionally, it is intended to predict CO2 accumulation. A hybrid prediction approach which combines ARIMA and SVR models is used, and this prediction performance was measured using Mean Absolute Percentage Error (MAPE), Root Mean Square Error (RMSE) and R Square (R2) [20]. Efficient reception is possible regardless of Internet connection, so it can be measured using IoT, which analyzes indoor air pollution. The used air quality sensor is a MQ135 (RJ TECH, Hong Kong, China), which can be used with a microcontroller to monitor indoor pollution [21].
1.3. Artificial Intelligence Technology Used for IoT Monitoring
In previous studies, supervised model and unsupervised model techniques were studied in various fields and disciplines. Related to this paper, indoor air quality (IAQ), which is determined by the concentration of indoor air pollutants, could be predicted using physically based mechanical models or statistical models based on measured data. Statistical models have great potential to explore IAQs captured in large-scale measurement campaigns or in real-world occupancy environments. The most popular statistical models applied to IAQ are artificial NNs, multiple linear regression, partial least squares, and decision trees [22]. There are two kinds of studies implementing machine learning approaches for air quality prediction. Most of the first classes are expressed as focusing on estimating the concentration of pollutants. They mainly use Ensemble Learning or Regression algorithms as they provide an excellent compromise between interpretability and model performance. The second class consists of manuscripts dealing with forecasting problems. These kinds of questions are handled explicitly, using NN and SVM techniques [23]. In modeling of PM spatial variability, a non-linear approach can be used to accurately predict the limits of excess PM concentration [24].
2. Materials and Methods
2.1. Material
2.1.1. Training Set
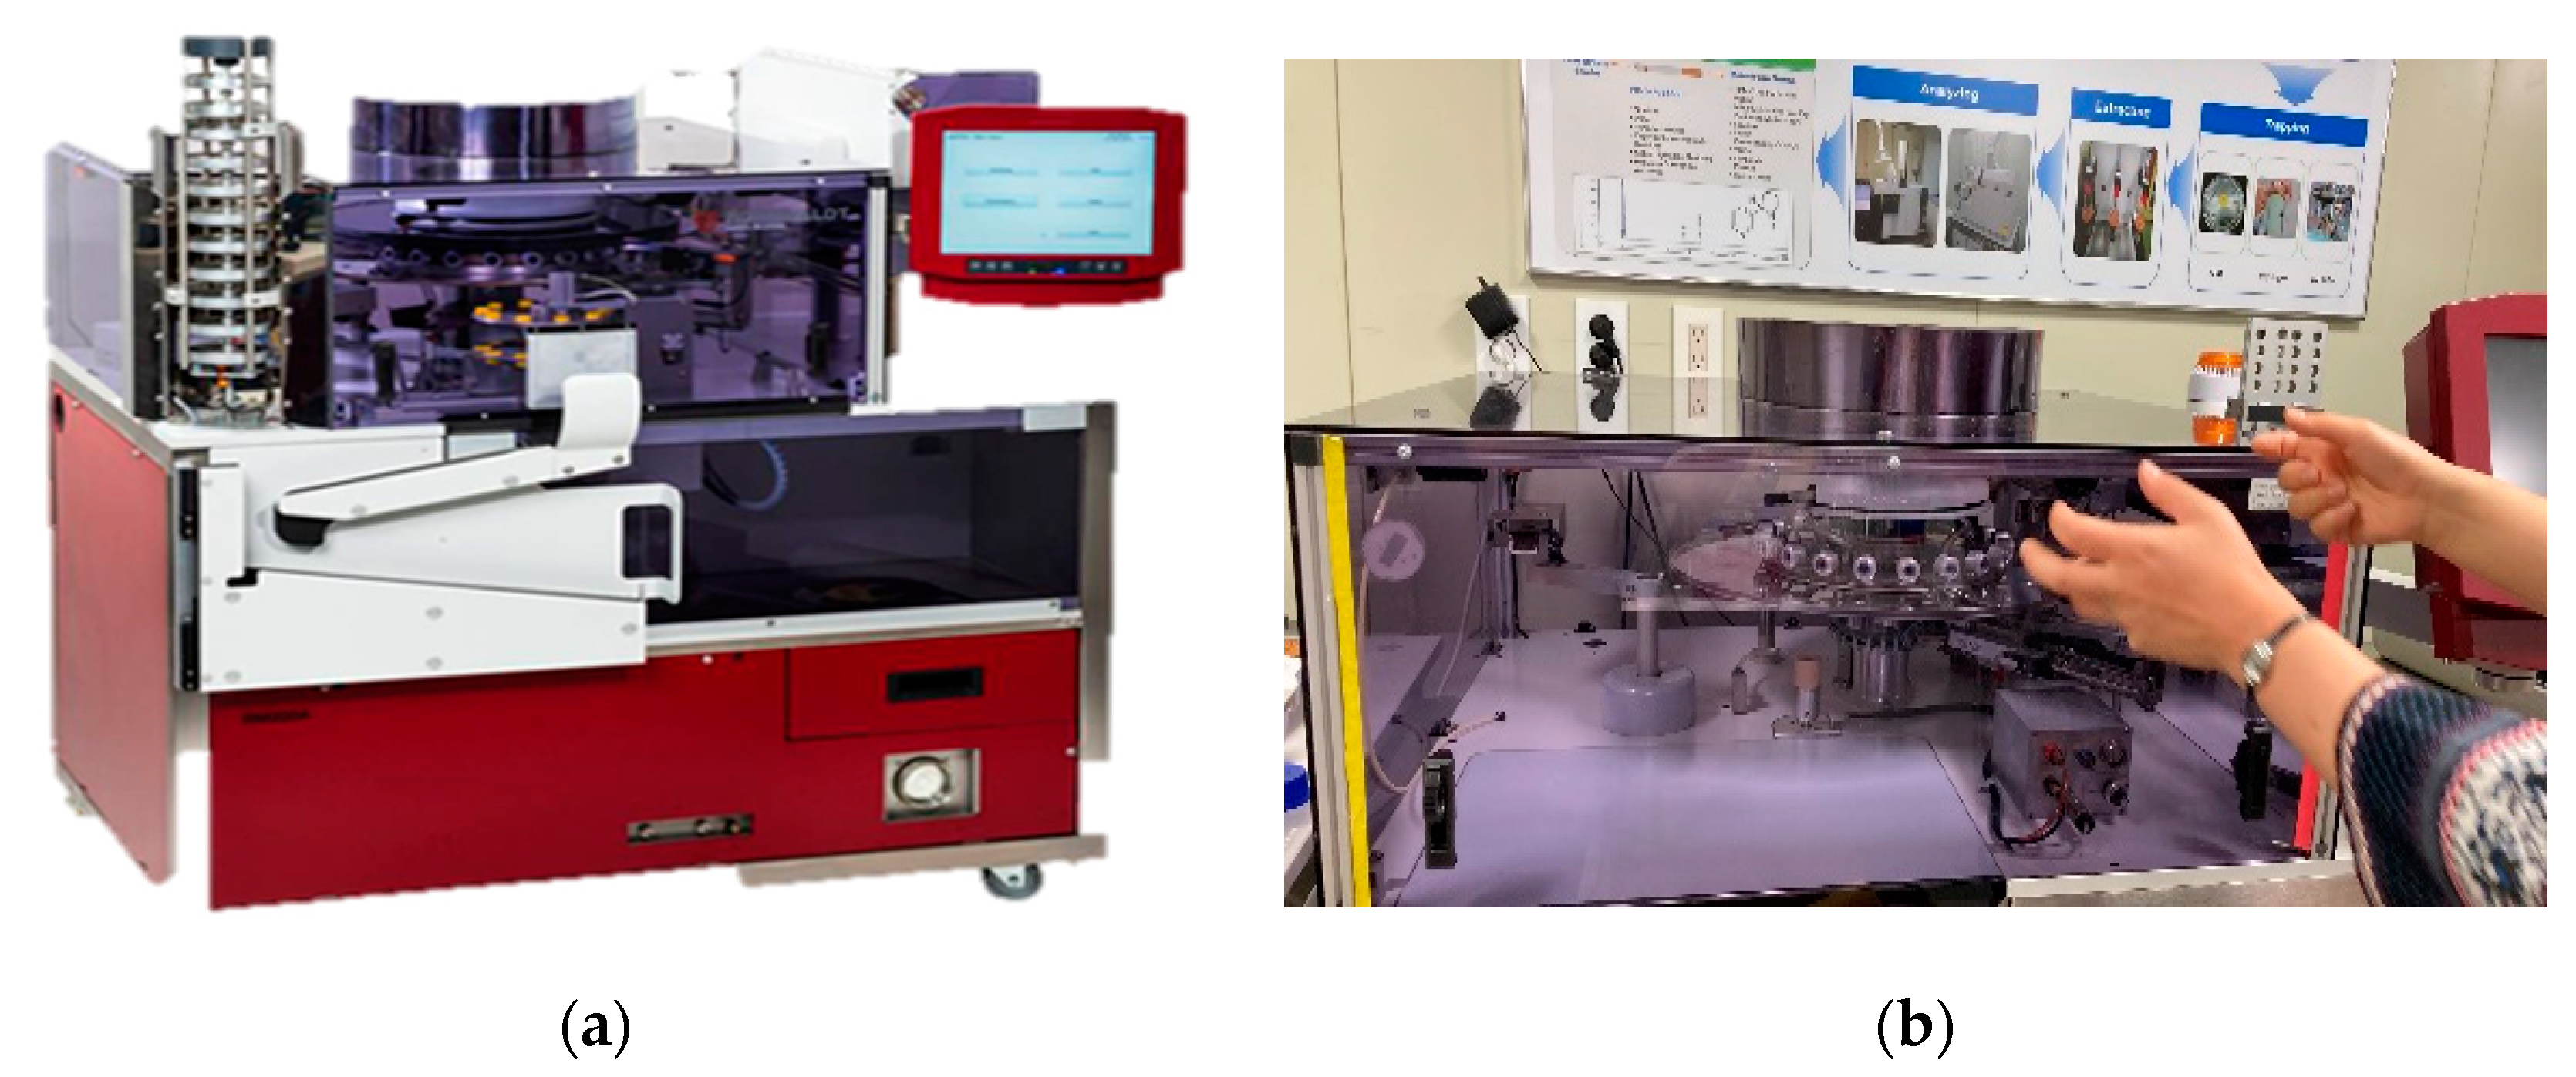
In order to increase the accuracy of predictions for various environments in real situations, it is essential to obtain a limited experimental feature model [25]. To create feature models of smoking for supervised machine learning, as shown in Figure 1, we used BORGWALDT’s Smoking machine RM 200A2 (from Germany) to test cigarette smoke generation. RM200A2 is a fully automatic 20 port rotary smoking machine, which meets the requirements of ISO 3308. It is not only suitable for routine smoking according to ISO 4387 and ISO 8454 but also allows smoking of Fine Cut Smoking Articles (FCSAs) according to ISO 15592-3 [26].
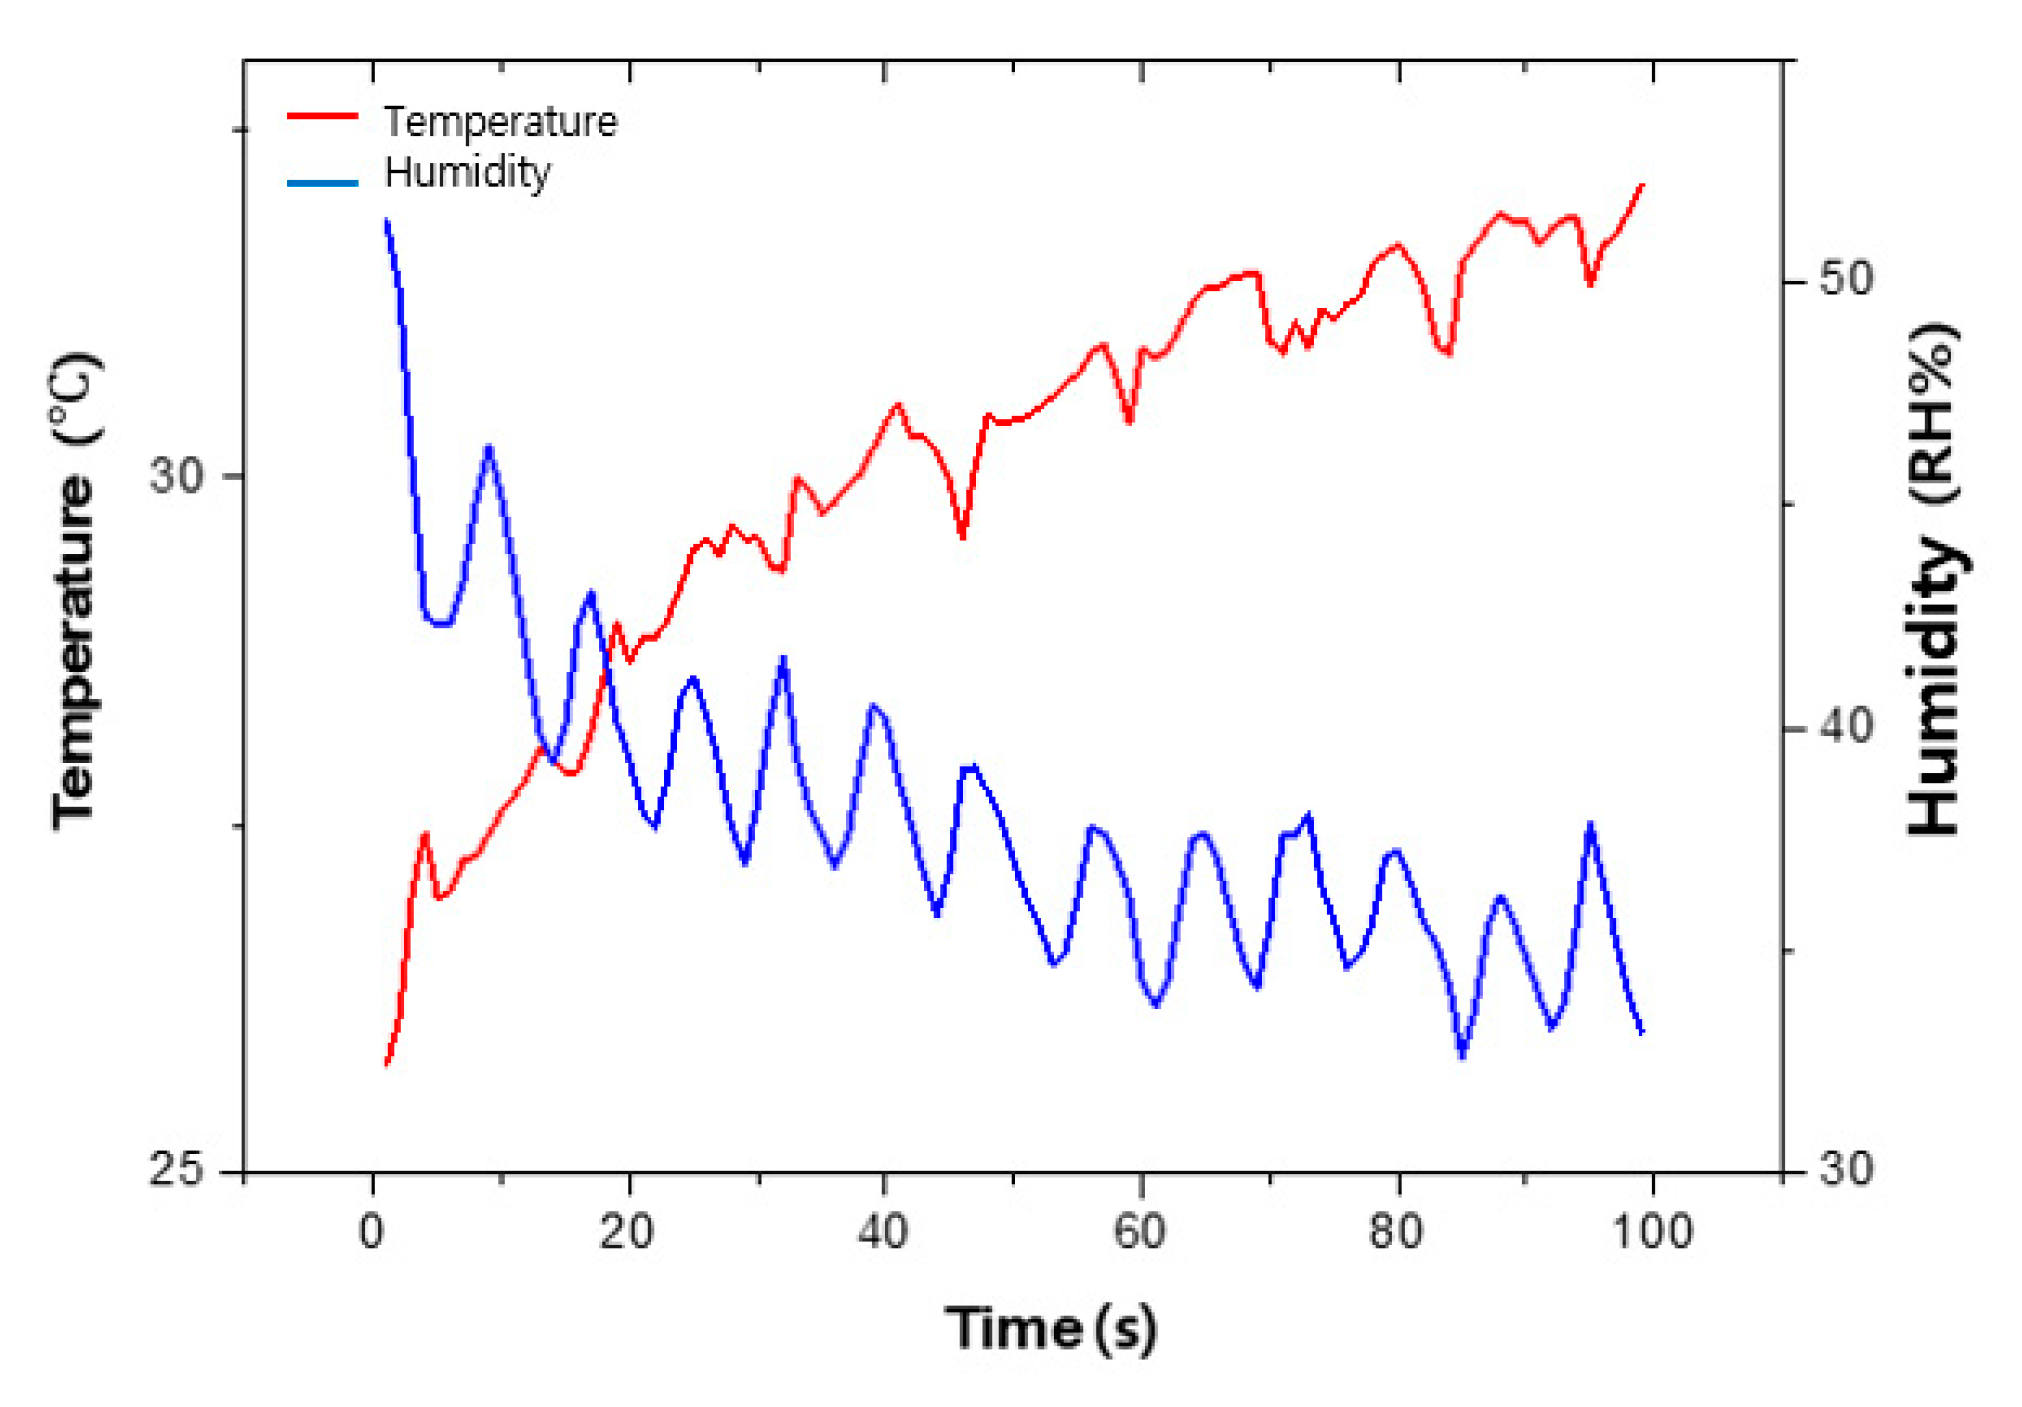
The atmosphere monitoring sensors are installed in the vaping chamber while the machine generates smoked vaper from 20 cigarettes per one experiment. During the experiment, gases generated by cigarettes are discharged through the ventilated system at the top of the chamber. After each smoking, the chamber was ventilated in 5 min to initialize the atmosphere between the experiment. As shown in Figure 1, this machine contents separated vaping chamber so that it may minimize external environment changes. Tabacos used in this experiment are described in Table 1 as below. The experiment was performed as a type of cigarette set, and repeated 10 times per a set. During the smoking, TVOC, CO2, PM 2.5 and 10, temperature and humidity were measured by 10 sets of the sensors (SVM30 and SPS 30) in the smoking chamber. The changes in temperature and humidity during the experiment were at temperature of 26 to 34 °C and humidity of 33 to 51% as shown in Figure 2.
2.1.2. Indoor Smoking Environment-Testing Set
In order to imitate real life indoor air quality, a small room (16 m2) was conducted and applied as a testing set of supervised learning. We target the changes of TVOC, Humidity (H), Temperature (T), CO2 and PM 2.5, PM 10, emitted to the surrounding atmosphere before/after smoking of conventional tobacco. We ventilated through the window before/after the smoking to initialize the indoor air conditions. All the tests are conducted in the initial air condition of TVOC, H, T, CO2, PM 2.5 and PM 10 as Table 2. During the experiment, T, H are controlled separately by the air conditioner. Additionally, the experiment shows that smoking is not related with smoking but opening/closing the window well affects the temperature and humidity of the room.
The used cigarettes are not defined, since the experiment was occurred by volunteer smokers. The room conditions are only controlled on the material we are focusing, as Table 2, while other factors are not considered. As the considered factors are limited, this testing set is considered as reflection of real situation. Heating and cooking are also performed in the same room with same condition in non-smoking situation to create comparing situation. The heating source is an electric heater which consume 400 W, without humidity changes. For cooking environment, Portable butane gas stove was applied with 600 g of meat (port, beef) on the pan.
2.1.3. Measurement Devices
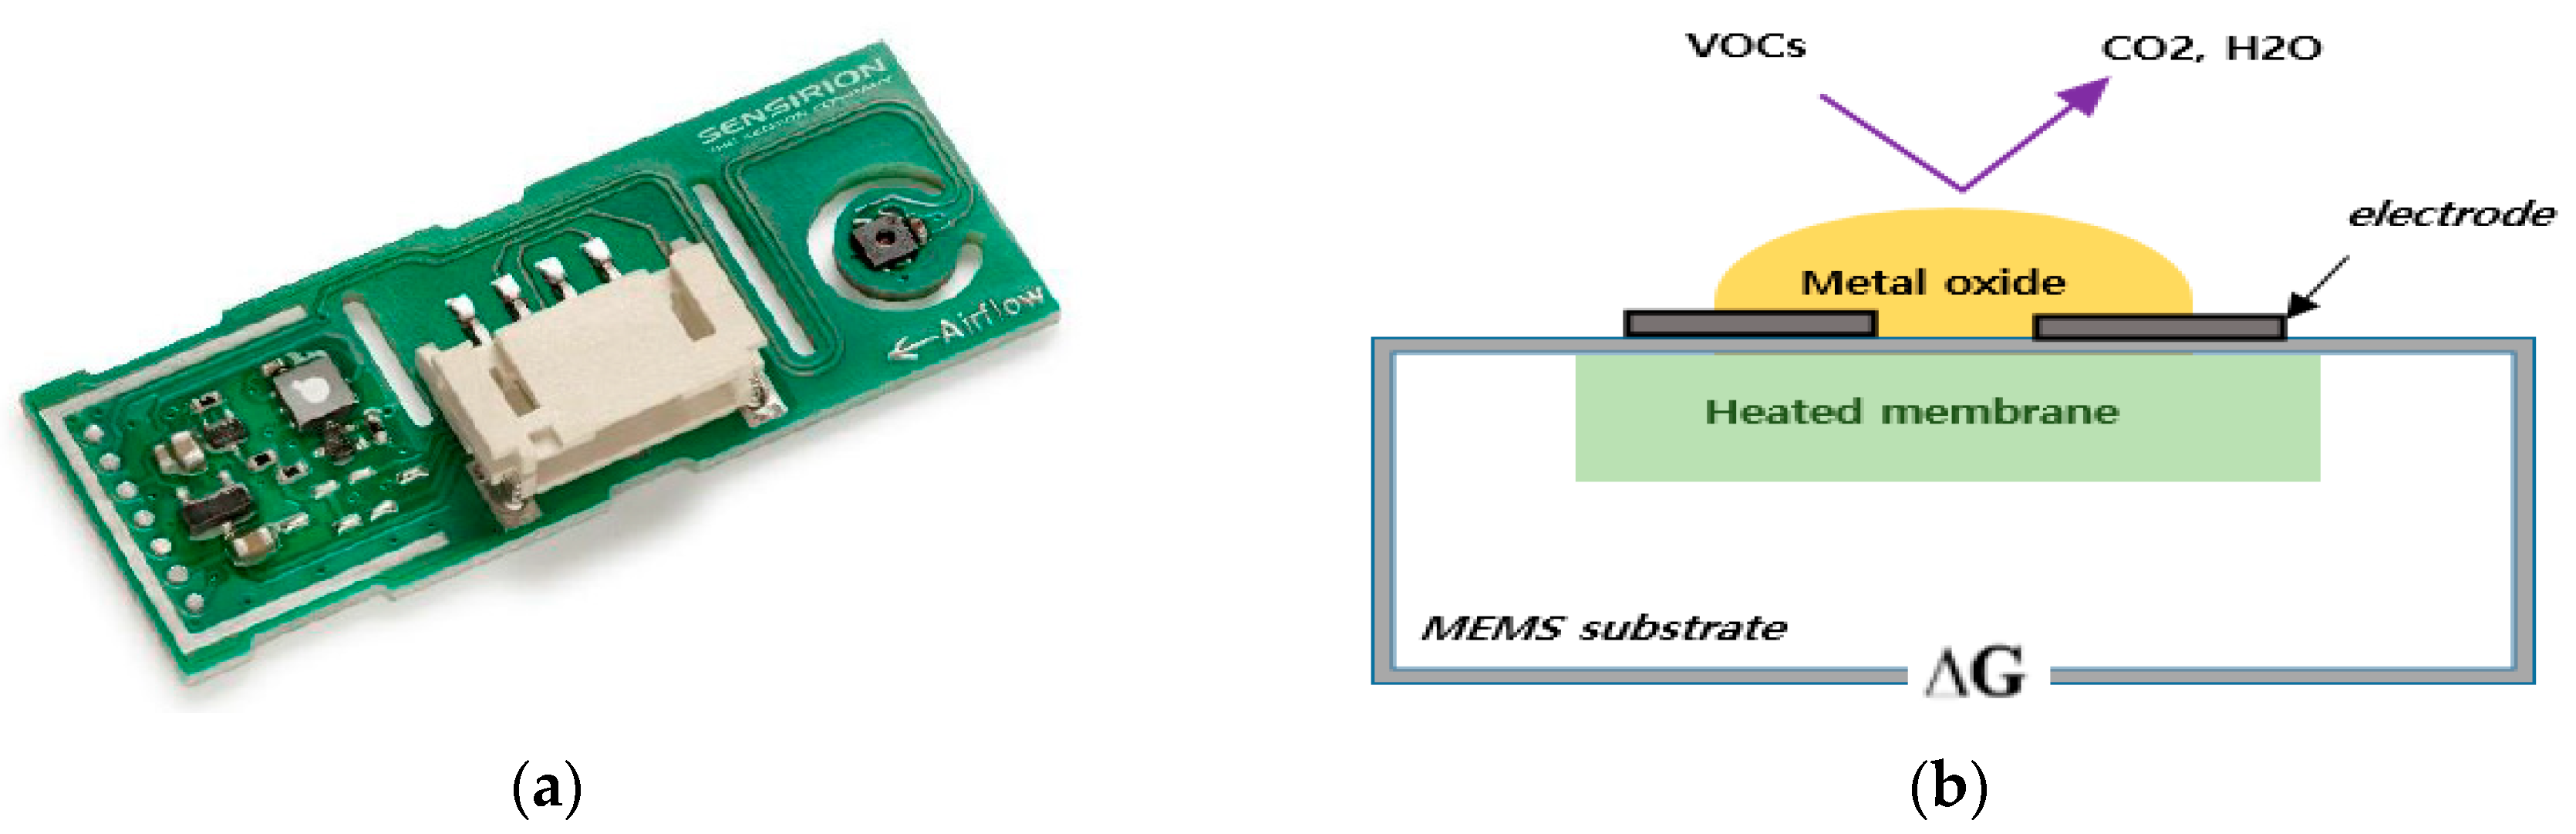
Table 3 presents the aspects of sensors. We installed 2 sets of sensors in a small room including a SVM 30 (TVOC, H, T, CO2) Multi-pixel MOX gas sensor, and SPS 30 (PM 2.5, PM 10) that is a particulate matter sensor for air quality monitoring and control of Sensirion Inc. SVM 30 is a semiconductor gas sensor.
Figure 3 shows the feature of SVM30, Semiconductor sensors, defined as devices that consist of a metal oxide gas sensing material such as SnO2, WO3, and In2O3. A heater maintains the proper operating temperature of the metal oxide, and a sensing electrode to measure the resistance of the sensing material.
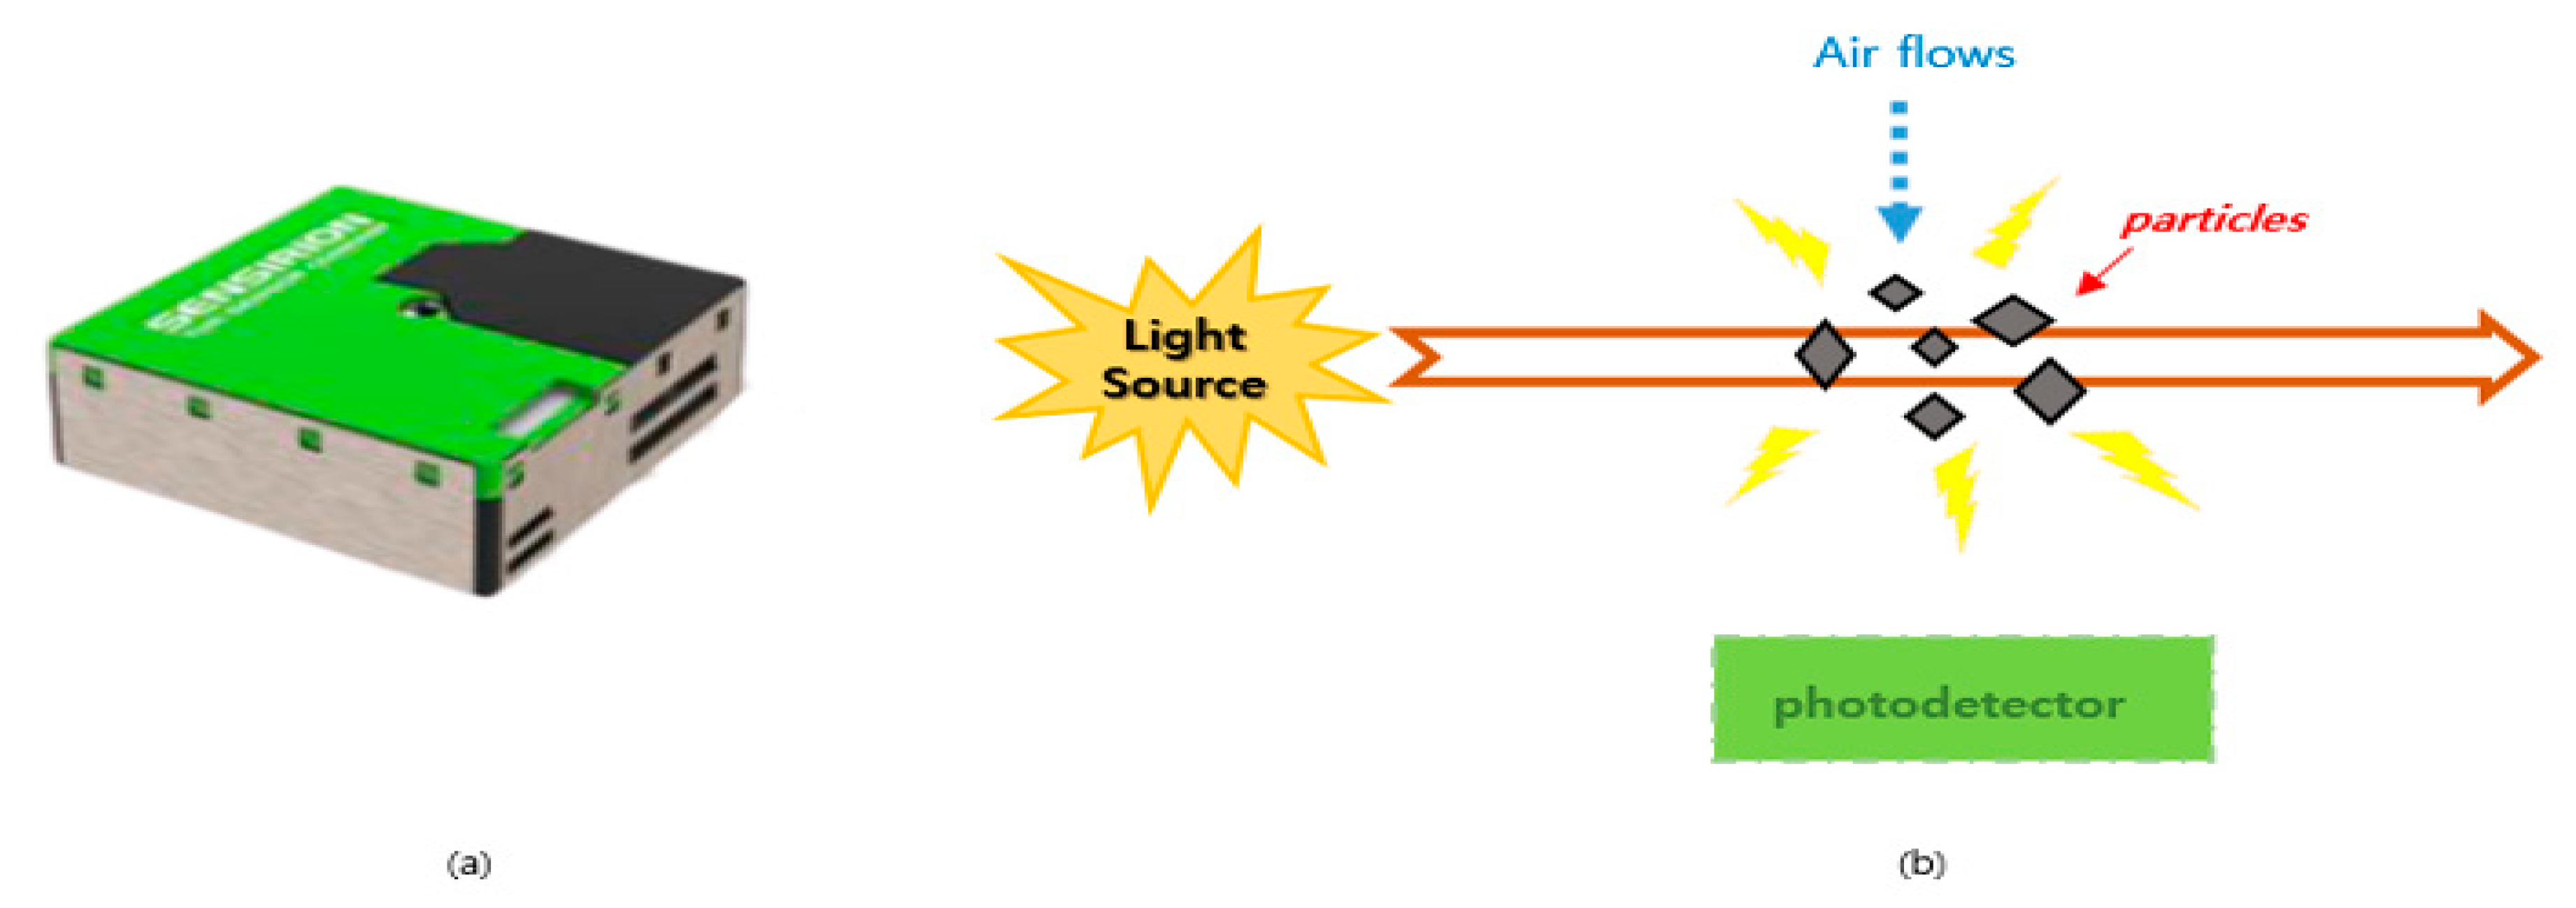
Figure 4 shows that SPS 30 is a typical optical sensor. It works with photoelectric properties, which detect fine dust such as smoke, aerosol and PM 2.5, PM 10. The light scattering method is measuring the diameter and number of particles by irradiating a light source onto the suspended particles. And then detecting the scattered light. During smoking, temperature and humidity is mainly influenced by the air conditioner and outdoor environment, not the human activity so temperature and humidity is only measure not analyzed. Besides, the concentration of TVOC and CO2 is highly related with smoking activity and occupancy while PM 2.5, PM 10 only occurred by smoking. SVM 30, SPS 30 can be used by utilizing the URL related to supplementary materials.
2.2. Feature Selection for Machine Learning
Figure 5 is a block diagram of a measurement system and a smoking detection system. Through the Wireless Local Area Net-work (WLAN) access point, the indoor air measurement system collects and stores indoor measurements. The measurement results are transmitted to a PC with low energy wireless technology using Bluetooth/LoRa. Using the Comma Separated Value (CSV) file of the collected data, preprocessing, feature extraction, feature selection, and classification are performed on a PC.
In addition, if the value suddenly jumps to an abnormal value due to low reliability and high sensitivity of the IOT sensor, the abnormality is eliminated as it is considered as outlier. Min-Max Scaler was used as a preprocessing process to extract valuable data from raw data, showing data trends, patterns and matching data units. In normalized data set, the maximum value is 1, the minimum value is 0, and the rest of values are in between 1 and 0. The data is scaled by applying the following operation to each data. Data is divided by the value obtained by subtracting the minimum value (Data.min) of the data from the data (Data[i]) and the value subtracting the minimum value (Data.min) of the data from the maximum value (Data.max) of the data. Formula (1) is as below.
Data[i] = (Data[i] – (Data.min))/((Data.max) – (Data.min))
2.2.1. Characteristics of Collecting Data
There are four attributes of data for the sensing and classifying cigarettes, consisting of CO2, TVOC, PM 2.5, and PM 10, and as a result of the experiment, each attribute has a decisive influence to classify smoking. The amount of data and the number of attributes of this study are comparatively considered as not bulky so the process of feature extraction can be minimized. In addition, there is the true value for machine learning because it is possible to know when to start smoking and when to non-smoking through an experiment. Therefore, both supervised and unsupervised learning methods can be applied.
2.2.2. Problem Definition and Application Method
Figure 6 describes a machine learning that we can choose from weighing the characteristics of the data we have. The result of detection and prediction of smoking is considered as discontinuous data so the results are better expressed in cluster model than linear model.
In Figure 6, the selection is made first according to the presence or absence of labeled data. as the labeled data set can provide training set with true values, which is so called supervised learning. If the data are non-labeled, it can belong to an unsupervised learning group represented by clustering. The next choice depends on whether there is a hierarchy. If there is a hierarchy, it branches into a hierarchical model. If there is no hierarchy, you can choose a model such as DBSCAN depending on the presence or absence of K. If K is present and categorical variables are present, it is possible to select K-modes, otherwise, depending on the preferential probability, the gaussian mixture model or K-means model can be selected.
In the case of labeled data, it is classified into the regression group of unsupervised learning and the classification group of supervised learning according to whether it is predicting numeric or not. If it is not predicting numeric, it is divided according to the aspect of speed or accuracy. Models with high accuracy include Kernel SVM/Non-linear SVM, NN, MLP, and Random Forest, and models with good speed include models such as linear SVM, K-Nearest Neighbors (KNN), and Decision trees. Models belonging to the Regression group, which is Predicting Numerics, can be divided into GRU, Linear Regression, and Decision Trees models with high speed and Neural Network, RNN, LSTM, Random Forest, and Gradient Boosting Trees models with high accuracy. The Possibilistic Fuzzy C-means (PFCM) algorithm that combines Fuzzy C-means (FCM) and Possibilistic C-means (PCM) as a weighted sum was used as a fuzzy algorithm for performance comparison. We selected a representative model from among those shown in this figure, and the regression model did not fit the experiment and was not used.
Machine learning techniques that can be tried in consideration of features such as Section 2.2.1 and Section 2.2.2 are mainly applied a classification model of a supervised learning method and a classification model of an unsupervised learning method in the experiment.
Also, FCM and PCM have been typically used in many pattern recognition problems in the fuzzy clustering domain. However, these methods are highly sensitive to noise and overlapping cluster problems. To overcome these problems, PFCM showed the result of mitigating the problems of both methods by integrating FCM and PCM at the objective function level.
Among supervised learning models, the regression method is suitable for continuous value not for classification. Since the target data of this study has classifying aspects, the regression method is foreclosed and we select representative algorithm from the other categories. The conducted supervised learning model is as follows; in the algorithms performed by Linear SVM, Non-linear SVM-Support Vector Machine Radial Basis Function (SVM RBF), KNN and MLP.
The SVM is well-developed supervised learning model for pattern recognition and data analysis as one of the fields of machine learning, and is mainly used for classification and regression analysis.
Linear SVM model is to find a straight line which separates classes(groups), adjusting the degree of misclassification in straight lines. There is a way to add polynomial properties to add and classify polynomial features using linear SVM. This method is simple and works mostly fine, but higher order features add a lot of polynomial features, which make the computation very complicated. As the order of the polynomial property increases, the computational amount increases. Therefore, it will take longer to find the optimal hyperplane and kernel tricks can be used. Using the kernel trick, it can achieve the same result as adding multiple polynomial features without actually adding polynomial features. , are vectors describing the centers, is the value of the parameter, is the distance of Euclidean Distance. Gaussian Radial Basis Function Formula (2) is as below.
is polynomial order. R-order polynomial kernel Formula (3) is as below.
In this experiment, we selected the maximum margin boundary (Hyperplane) linearly to maximize the SVM classification margin. However, when using linear SVM, it is difficult to classify data only linearly in a high-dimensional space with many predictors. So, using a nonlinear SVM, a hyperplane was created to classify the four situations: heating, cooking, smoking, and non-smoking.
In nonlinear SVM, the Gaussian RBF kernel trick is used because the Gaussian makes the curved hyperplane softer than the polynomial kernel, which enables more accurate classification of high-dimensional spaces.
Using the KNN model, 4 attributes (CO2, TVOC, PM 2.5, PM 10) were used as 1 vector, and k = 3 was set the distance of each vector was obtained using the Euclidean distance, while a cluster was created in a 4D space using supervised learning. For example, when new data needs to be classified, if there are many neighbors belonging to cluster 0 among the three closest neighbors, the data are classified as 0, and if there are many neighbors belonging to cluster 1, the data are classified as 1.
MLP (Multilayer perceptron), called Feed-forward Neural Network, or Neural Network, is a generalized form of Linear Model that makes decisions through several steps. [27]. Normally, in multi-layered learning method, a single hidden layer, given enough neurons, can form any mapping needed. In practice, two hidden layers are often used to speed up convergence. Problems that require more than two hidden layers were rare prior to deep learning. Two or fewer layers will often suffice with simple data sets. However, with complex datasets involving time-series or computer vision, additional layers are required [28,29]. Given from this conventional hidden layer implementation of the MLP method, we conducted 1 input layer with 4 properties, 1 output layer, and 2 hidden layers.
Rectified Linear Unit (ReLu) was used as the activation function of the layers excluding the output layer, and the output layer was set to sigmoid for binary classification.
Besides of supervised learning, K-means clustering, the most-well known unsupervised learning, was used. The K-means algorithm is a separate clustering algorithm that groups given data into k clusters, and operates in a manner that minimizes the variance of the difference between each cluster and the distance. Since the k-means algorithm randomly determines the initial value of each cluster, the desired result may not be obtained depending on the location of the initial value. Alternatively, clusters may not be formed well even if the cluster size, cluster density, and data distribution are unusual. Due to this limitation, the majority voting method, which is a method of performing clustering several times and assigning it to the cluster that appears most frequently, is often used [27].
The k-means was calculated using the Euclidean distance between the vectors, and the initial cluster number was set to 2 to categorize smoking and non-smoking cases. The initial number of clusters was set to 2 (k = 2) (smoking group, non-smoking group). First, K-means clustering is calculated in advance using the training data, and the test data is classified into proximity clusters by Euclidean distance. In addition, this model calculates the cluster center of each data and predicts the cluster index (0,1). The case of smoking is automatically classified as 1, and the case of non-smoking is automatically classified as 0.
2.3. Evaluation Metrics
We describe conceptual metrics used to evaluate the classification performance of a model or pattern in machine learning. The factors that evaluate the model can ultimately be defined as the relationship between the predicted answer and the actual correct answer. The correct answer is divided into True and False, and the predictive model is divided into Positive and Negative. That way, we can divide the case by a 2 × 2 matrix as shown Figure 7 below.
The actual smoking is true value, and the actual non-smoking situation has a false value. If smoking is predicted in the predictive model, it has a positive value, and if it is predicted as non-smoking, it has a negative value. In this matrix, we need to be careful about the false positives and false negatives. False positive is to misjudge what is wrong as right, False Negative is when it is judged that what is right is wrong. The viewpoints that we consider as important differ depends on the situation. The denominator of accuracy is all everyday situations such as smoking, non-smoking, heating, and cooking, and the numerator is a summed value of true positive predicting smoking in a smoking situation and a true negative predicting not smoking in a non-smoking state. The accuracy formula, precision formula, recall Formula (4) are as below.
Precision measures the actual smoking in all situations predicted as smoking. The denominator is the sum of the total predicted amount of smoking, the true positives predicted that who actually smoked and the false positives predicted that who smoked even though who did not actually smoke. And the numerator has the true positives predicted that who actually smoked.
Recall is the predicted proportion of smoking among actual smoking situations. It is a measure to sensitively judge the smoking situation. The denominator of the recall is (actual smoking situation) the sum of the true positive, predicted as smoking by actual smoking, and the sum of the false negative, predicted that actual smoking but did not smoke. The molecule actually smoked and is calculated as the value of the true positive predicted as smoking.
The F1 score is the harmonic average of Precision and Recall. The F1 score can accurately evaluate the model’s performance when the data label is unbalanced, and the performance can be expressed as a single number. The F1 score Formula (5) is as below.
F1 is used because it is evaluated differently according to the importance in various aspects such as the status of the user and the supplier, rather than simply judging the performance of the model based on accuracy, precision, and recall. Additionally, the reason for using the F1 score is related to the nature of the IoT sensor we used. The sensor data used in the time series is sensitive and reliable, so data verification is required. Therefore, there is a limit to evaluating only the accuracy result, so the F1 score was also used as an evaluation scale. Through the meaning of each evaluation index, it is necessary to identify and select where strengths and weaknesses exist and which characteristics exist.
3. Results
3.1. Feature Extraction and Correlation-Based Feature Selection
After performing EDA based on sensing data transmitted from CO2, PM 2.5, PM 10, and TVOC sensors extracted for indoor air quality monitoring, correlations between these values are derived. Basic data analysis is done using Python’s Pandas library. Table 4 shows statistical information of CO2, TVOC, PM 2.5, and PM 10 among the sensor data used in the experiment. It has a total of 3516 data, and the sensor data measured every second is acquired and transmitted to the collection server.
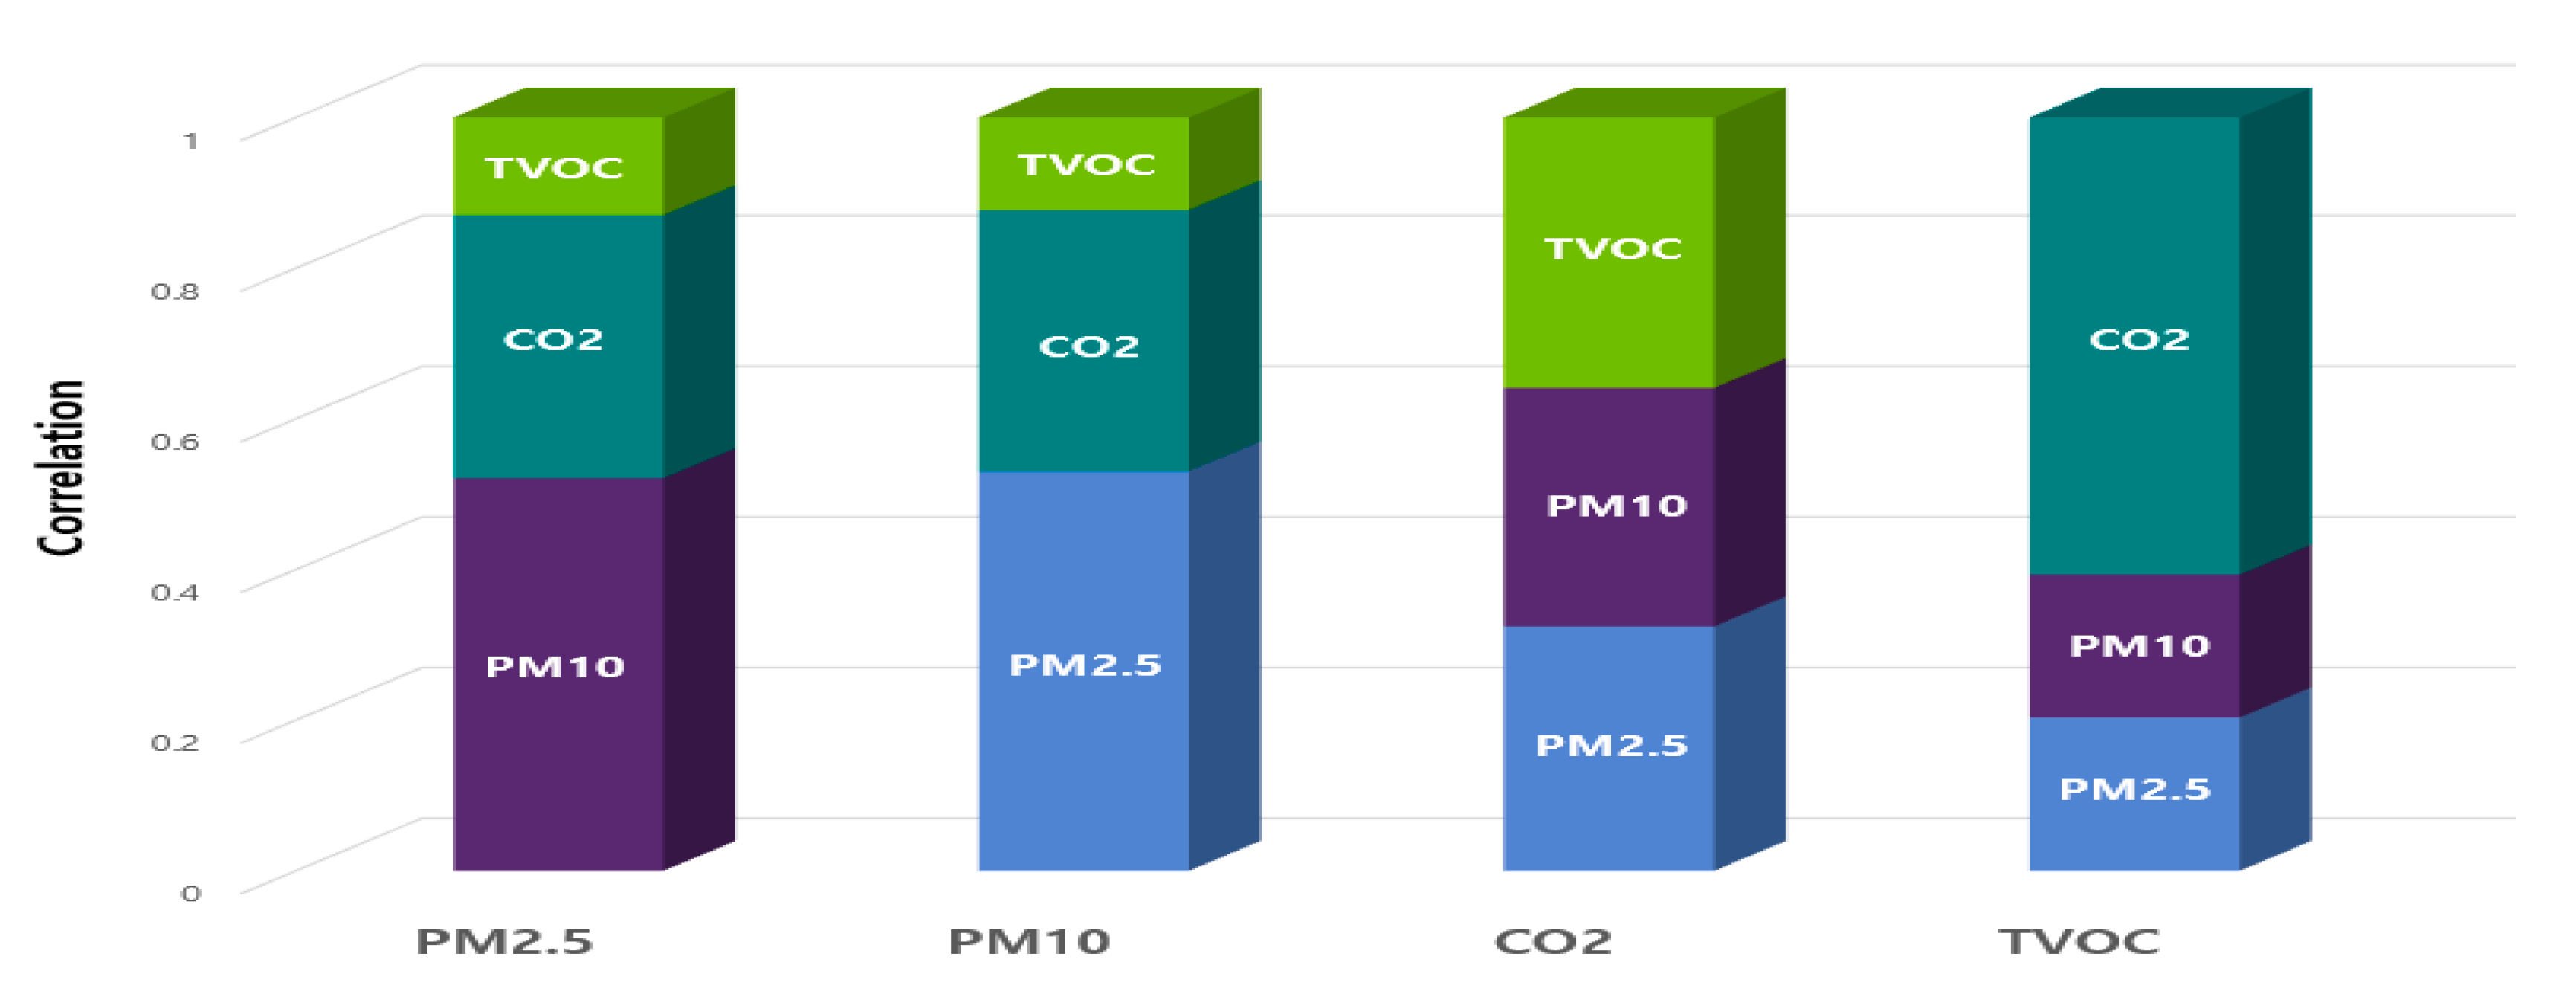
The correlation between the measured data was derived from two situations. First, we looked at the correlation in the overall situation (smoking, cooking, heating). In Figure 8, the correlation between TVOC and CO2 was 0.915857, showing a high correlation. There was a high correlation (0.999868) between PM 2.5 and PM 10, and the correlation between TVOC and PM 10 was 0. 197758, indicating a low correlation.
Second, we analyzed the correlation in smoking situations. As a result, looking at Figure 9, the correlation between TVOC and CO2 was 0.738492, and the correlation between PM 2.5 and PM 10 was 0.997929. The correlation between PM 10 and TVOC was 0.230974, showing the lowest correlation.
3.2. Data Characteristics
Looking at the characteristics of the training data, the values of CO2 and TVOC show a symmetrical linearity. Additionally, the values of PM 2.5 and PM 10 are symmetrical in Figure 10. When smoking a cigarette, each sensing information is expressed as a graph, and we can see that four types of information are integrated.
Figure 11 shows the changes in CO2, TVOC, PM 2.5, and PM 10 of the training data set.
- Smoking
During smoking, CO2, TVOC, PM 2.5 and PM 10 increase. Among them, TVOC increases rapidly as soon as smoking starts, and fine dust is affected by the inhalation and exhalation, which increases slightly later. CO2 and TVOC decrease when inhaled and increase when exhaled.
- Cooking
Cooking data is grilled meat such as beef, pork, and chicken using a gas stove. CO2, TVOC, PM 2.5, PM 10 have risen overall. As soon as cooking was started, the amount of fine dust rose three times more than cigarettes. CO2 and TVOC from cooking utensils are continuously generated, showing an increasing trend.
- Heating
Heat was generated using an electric heater. As the temperature increased, CO2 and TVOC gradually increased. However, it occurred significantly less than cigarettes and cooking. There was little change in PM 2.5 and PM 10.
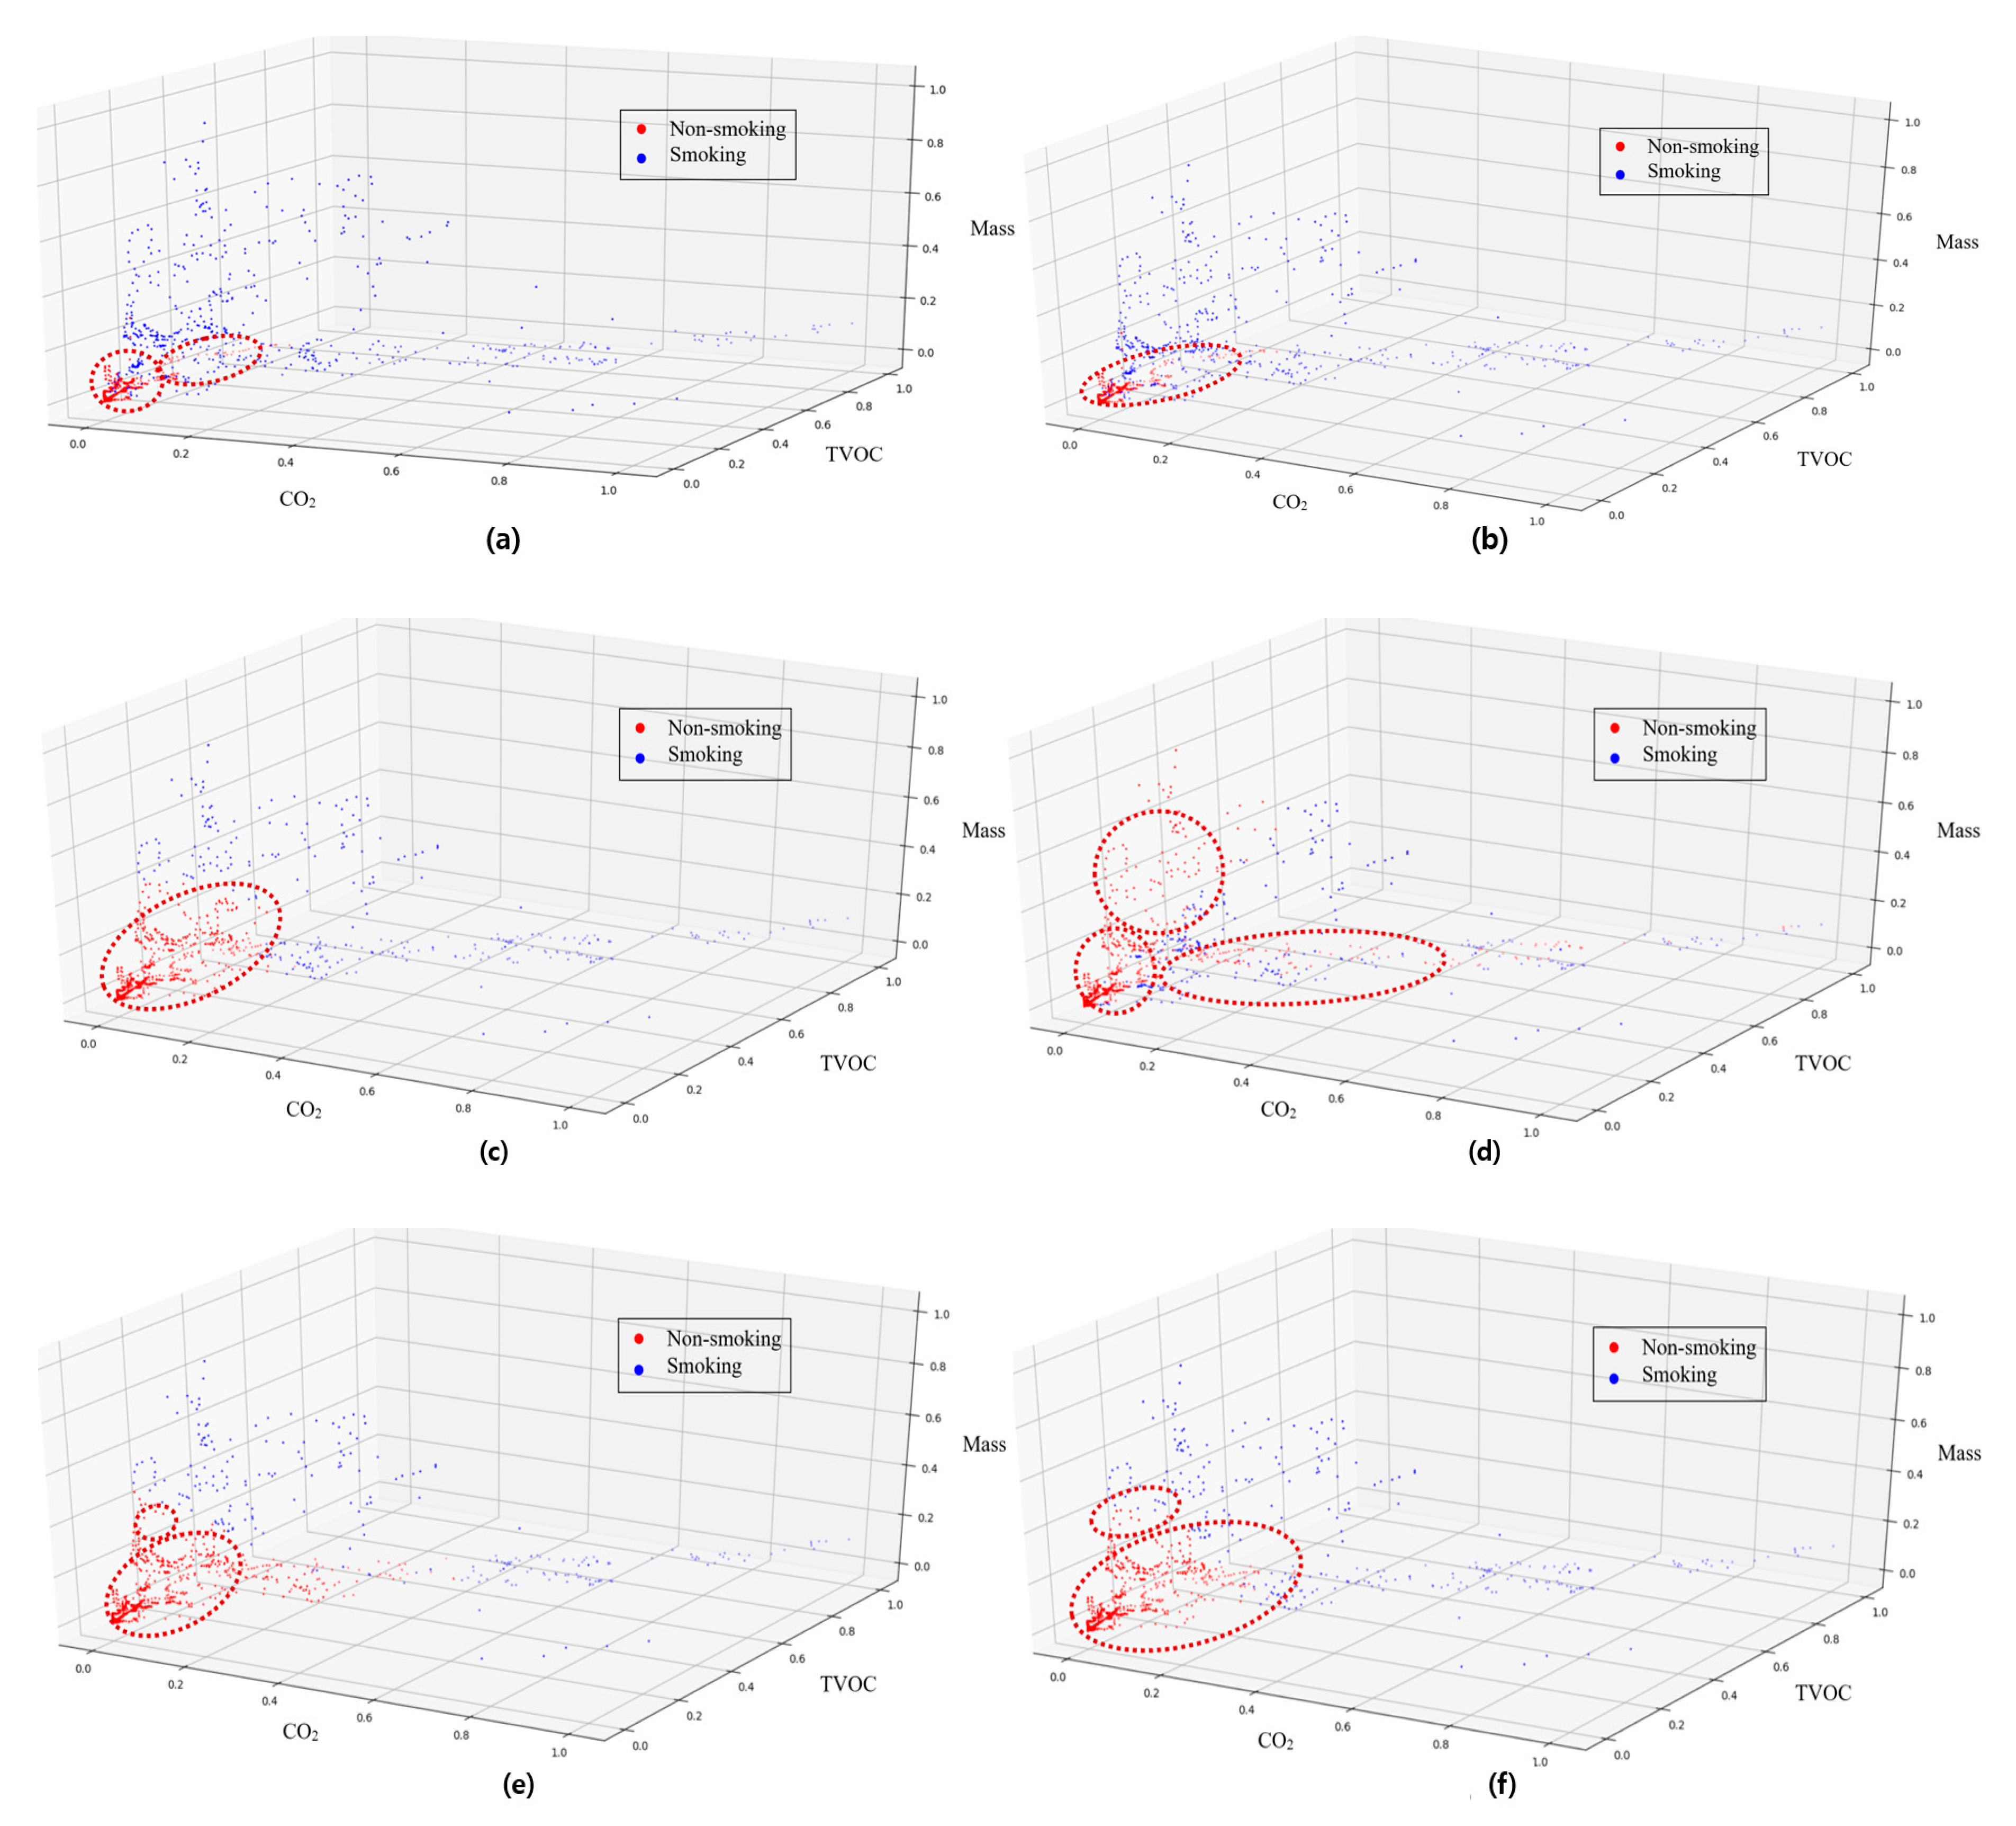
Figure 12 shows the data for the five models as a 3D graph. Smoking data is indicated by blue dots and non-smoking by red dots. The degree of variance for each model is different according to the algorithm, and smoking predictions according to each sensor value are displayed in the coordinates. (c) MLP, (e) SVM RBF model shows that the recall value is relatively high, so the False Negative (undetected) is low. In addition, models other than (a) K-Means have high Precision values, showing low false positives.
The model with the highest number on four performance metrics is the non-linear SVM RBF. Next, the three models of KNN, MLP and Linear SVM show similar values. In terms of accuracy, except for K-means, models are found to be a relatively high value of 83.9~93.1% in accuracy. The reason is the result of using the binary classification technique in the experimental method. The analysis results are as follows Table 5.
K-means showed the worst performance. The binary classification method we used is a method specific to supervised learning, so its performance is relatively low at unsupervised K-means. This result was obtained because it is ambiguous in determining the k value, and it is difficult to centroid scattered data.
Since we value the perspective of users who are not affected by smoking in the evaluation method, it is necessary to consider the value of False Negative. For example, when people perceive that they have not smoked even though they smoked, the damage is great for non-smokers. So, we thought that the recall number was more important than other metrics. From the viewpoint of accuracy, it showed good accuracy with a value of more than 90% in the order of SVM RBF, KNN, and MLP. In the case of recall, the order of SVM RBF, MLP, KNN, PFCM and K-means also showed good performance, and in the worst case, the value of linear SVM was only 51%.
By extracting CO2, TVOC, PM 2.5, and PM 10 for each data set and comparing the graphs of smoking, cooking, and heating, it was confirmed that each data set has distinct characteristics. We used five methods of smoking detect algorithms. K-means as an unsupervised method and PFCM as a fuzzy method, linear SVM, Non-linear SVM, SVM RBF, KNN, and MLP as supervised models, based upon the selection cheat sheet.
As shown in Figure 13, it is necessary to decide that SVM RBF, and other machine learning methods such as KNN and MLP can be applied to other places than to decide it as a good model simply due to high accuracy and recall. For example, in a system that detects smoker, it is even more important to classify them as smoking only if it can be sure that they are smoking. In this case, precision is important and the linear SVM model with 99% precision is most effective. On the other hand, it would be effective to use SVM RBF, in a system that detects air quality due to smoking and warns people about it. This is because it is sensitive to the deterioration of air quality, so if air pollution occurs even a little, it is effectively classified. In future research, it is necessary to apply several algorithms derived from the above types.
Receiver Operating Characteristic (ROC) curves are effective in evaluating the model on a binary target. Since clustering is unsupervised learning, so it was excluded as a case which no target could be assessed in terms of sensitivity and 1-specificity. ROC curves for the SVM linear, SVM RBF and MLP methods with binary targets are presented as shown in Figure 14. The SVM linear and SVM RBF methods have a wide Area under the Curve (AUC), and are shown to have good performance considering the correlation between sensitivity and specificity.
4. Discussion
In the case of ventilation, the internal air can be discharged through the ventilation facility, but the inflow of external air is inevitable. Therefore, the prediction error range should be considered in the external environment. Therefore, in future experiments, we will collect a lot of training data and test data, considering change of seasons, combine different sensor types, or compare and select different prediction methods to improve accuracy. Tobacco detection with improved accuracy can be monitored in real time in an optimized situation by fusion of multiple sensors for pollution data (cigarettes), and can be used as an integrated detection system operating in an IoT environment. The developed system in this study is analysis based on previously acquired data. However, ultimately, there is a need for real-time prediction of smoking conditions and alarm generation. This study has implications as the first attempt to develop a machine learning solution system to prevent smoking and minimize damage from smoking. Through the optimized machine learning technique discovered this time, in the future, we intend to develop a complex system that enables the operation of an air purifier to improve indoor air quality, as well as active response through linkage with the building air conditioning system.
5. Conclusions
Our experiment generated training data from indoor air monitoring sensors in limited circumstances to detect smoking activity, and predicted the smoking environment by including false test data (cooking, heating). Through this, we are collecting detailed information optimized for the situation in order to detect smoking status.
For data suitable for the algorithm, the Min-Max Scale method was used as a preprocessing method. As a result of the experiment, the non-linear SVM (SVM RBF) showed the best performance over the entire test data. SVM (SVM RBF) was the best with 93% in accuracy and 88% in the F1 score representing the harmonized average of precision and recall values. Supervised learning methods roughly show better results than Un supervised one. The reason for this is from data set feature, as smoking status shows binary characteristic, supervised learning deduces higher precision and recall values. Formation of hyperplane stands as the criteria for comparison of results of SVMs. Linear SVM creates linear hyperplane by making 3D to 2D linearly, marking the lowest recall and the highest precision, while SVM RBF overcoming linear SVM errors with Euclidean distance. On the other hands, MLP, multi layered style learning system, is not showing better results since it is not conducted as deep learning. However, the data is too simple to build more than 2 hidden layers, since it is not effective in manner of time and resources. Eventually, KNN and MLP showed the best performance.
In this paper, we demonstrated that our environmental sensor fusion approach successfully detected indoor smoking in the office. We introduced a number of features that can be extracted from the environmental sensors, and showed that the highest predictive power is attained with sensor fusion. We use the evaluation and prediction methods but facing information overload, collecting and implying suitable state of art for analysis is one of the kinds of science. The approach offers a number of advantages, such as being nonintrusive, which is an important aspect in smart homes, targeting the users who are only reach to open sources.
Supplementary Materials
The following are available online at https://0-www-mdpi-com.brum.beds.ac.uk/2076-3417/10/24/8912/s1, Section 2.1.3 Measurement Devices; The following are available online at https://www.sensirion.com/fileadmin/user_upload/customers/sensirion/Dokumente/9_Gas_Sensors/Datasheets/Sensirion_Gas_Sensors_SVM30_Datasheet.pdf, https://www.sensirion.com/fileadmin/user_upload/customers/sensirion/Dokumente/9.6_Particulate_Matter/Datasheets/Sensirion_PM_Sensors_SPS30_Datasheet.pdf.
Funding
This research was funded by Institute of Korea Health Industry Development Institute (KHIDI), grant number HI19C0806 and The APC was funded by Ministry of Health and Welfare (MOHW).
Acknowledgments
This work was supported by Institute of Korea Health Industry Development Institute (KHIDI) grant funded by the Korea government (Ministry of Health and Welfare, MOHW) (No. HI19C0806, the development of information management system and security tools to avoid the invasion threat of CDM information security based on laws for utilization of distributed research network).
Conflicts of Interest
The authors declare no conflict of interest.
References
- Jones, A.P. Indoor air quality and health. Atmos. Environ. 1999, 33, 4535–4564. [Google Scholar] [CrossRef]
- Nwanaji-Enwerem, J.C.; Allen, J.G.; Beamer, P.I. Another invisible enemy indoors: COVID-19, human health, the home, and United States indoor air policy. J. Expo. Sci. Environ. Epidemiol. 2020, 30, 773–775. [Google Scholar] [CrossRef] [PubMed]
- Yang, W.H. Indoor Air Quality and Risk Management; Jipmoondang: Paju, Korea, 2008; Available online: https://press.knou.ac.kr/goods/textBookView.do?condCmdtCode=9788920005121&condLscValue=001&condYr=2020&condSmst=2 (accessed on 18 September 2020).
- Household Air Pollution and Health. Available online: https://www.who.int/en/news-room/fact-sheets/detail/household-air-pollution-and-health (accessed on 18 September 2020).
- The Hidden Hazard of Third Hand Smoke. National Environmental Health Association. Available online: https://www.neha.org/eh-topics/air-quality-0/third-hand-smoke (accessed on 1 December 2020).
- Ministry of Economy and Finance, Republic of Korea. Available online: https://www.moef.go.kr/lw/lap/detailTbPrvntcView.do?menuNo=7040000&searchNttId1=MOSF_000000000041588&searchBbsId1=MOSFBBS_000000000055 (accessed on 1 December 2020).
- Grace, R.K.; Manju, S. A comprehensive review of wireless sensor networks based air pollution monitoring systems. Wirel. Pers. Commun. 2019, 108, 2499–2515. [Google Scholar] [CrossRef]
- O’Connell, G.; Colard, S.; Cahours, X.; Pritchard, J.D. An assessment of indoor air quality before, during and after unrestricted use of e-cigarettes in a small room. Int. J. Environ. Rese. Public Health 2015, 12, 4889–4907. [Google Scholar] [CrossRef] [PubMed] [Green Version]
- Son, Y.; Giovenco, P.; Delnevo, C.; Khlystov, A.; Samburova, V.; Meng, Q. Indoor Air Quality and Passive E-cigarette Aerosol Exposures in Vape-shops. Nicotine Tob. Res. 2020. [Google Scholar] [CrossRef] [PubMed]
- Chen, R.; Aherrera, A.; Isichei, C.; Olmedo, P.; Jarmul, S.; Cohen, J.E.; Navas-Acien, A.; Rule, A.M. Assessment of indoor air quality at an electronic cigarette (vaping) convention. J. Expo. Sci. Environ. Epidemiol. 2018, 28, 522–529. [Google Scholar] [CrossRef] [PubMed] [Green Version]
- Weber, A.; Jermini, C.; Grandjean, E. Irritating effects on man of air pollution due to cigarette smoke. Am. J. Public Health 1976, 66, 672–676. [Google Scholar] [CrossRef] [PubMed] [Green Version]
- Choi, H.E.; Kim, C.; Yoo, H.S.; Lee, S.H.; An, B.K. Indoor Smoking Detection Monitoring System Using a Sensor Network. In Proceedings of the Symposium of the Korean Institute of Communications and Information Science, Seoul, Korea, 21 November 2015; Volume 1, pp. 363–364. [Google Scholar]
- Han, S.; Hong, H.; Yu, H.; Kim, Y.; Lee, J.; Gim, J.; Jeong, D. Real-time Monitoring System for Smoking Detection in Indoor Public Areas. In Proceedings of the Korea Information Processing Society Conference, Korea Information Processing Society, Seoul, Korea, 10–13 December 2017; pp. 1267–1270. [Google Scholar]
- Senyurek, V.; Imtiaz, M.; Belsare, P.; Tiffany, S.; Sazonov, E. Cigarette smoking detection with an inertial sensor and a smart lighter. Sensors 2019, 19, 570. [Google Scholar] [CrossRef] [PubMed] [Green Version]
- Odetallah, A.D.; Agaian, S.S. Human Visual System-based Smoking Event detection. In Mobile Multimedia/Image Processing, Security, and Applications; International Society for Optics and Photonics: Bellingham, WA, USA, 2012; Volume 8406, p. 840607. [Google Scholar]
- Zhang, D.; Jiao, C.; Wang, S. Smoking Image Detection Based on Convolutional Neural Networks. In Proceedings of the IEEE 4th International Conference on Computer and Communications (ICCC), Chengdu, China, 7–10 December 2018; IEEE: New York, NY, USA, 2018; pp. 1509–1515. [Google Scholar]
- Valafar, H.; Cole, C.A.; Thrasher, J.F.; Strayer, S.M. Wearable Computing Device Featuring Machine-Learning-Based Smoking Detection. U.S. Patent 10,551,935, 4 February 2020. [Google Scholar]
- Huboyo, H.S.; Tohno, S.; Cao, R. Indoor PM2.5 characteristics and CO concentration related to water-based and oil-based cooking emissions using a gas stove. Aerosol Air Qual. Res. 2011, 11, 401–411. [Google Scholar] [CrossRef]
- Kelley, A.; Butler, A.J. Personal exposure monitoring of airborne particulate using a low-cost sensor. In Proceedings of the Air and Waste Management Association’s Annual Conference and Exhibition, Quebec City, QC, Canada, 25–28 June 2019. [Google Scholar]
- Rastogi, K.; Lohani, D. An Internet of Things Framework to Forecast Indoor Air Quality Using Machine Learning. In Symposium on Machine Learning and Metaheuristics Algorithms, and Applications; Springer: Berlin/Heidelberg, Germany, 2019; pp. 90–104. [Google Scholar]
- Kannaki, M.S.; Priya, S.N.; Mukhilan, J.S.; Santhosh, M.; Sudharsanan, E.K.; Ganapathy, A.B.; Abhinav, S.; Tansin, M. Development of smart air quality monitoring & filtering system. J. Crit. Rev. 2020, 7, 367–370. [Google Scholar]
- Wei, W.; Ramalho, O.; Malingre, L.; Sivanantham, S.; Little, J.C.; Mandin, C. Machine learning and statistical models for predicting indoor air quality. Indoor Air 2019, 29, 704–726. [Google Scholar] [CrossRef] [PubMed]
- Rybarczyk, Y.; Zalakeviciute, R. Machine learning approaches for outdoor air quality modelling: A systematic review. Appl. Sci. 2018, 8, 2570. [Google Scholar] [CrossRef] [Green Version]
- Tzanis, C.G.; Alimissis, A.; Philippopoulos, K.; Deligiorgi, D. Applying linear and nonlinear models for the estimation of particulate matter variability. Environ. Pollut. 2019, 246, 89–98. [Google Scholar] [CrossRef] [PubMed]
- Halios, C.H.; Assimakopoulos, V.D.; Helmis, C.G.; Flocas, H.A. Investigating cigarette-smoke indoor pollution in a controlled environment. Sci. Total Environ. 2005, 337, 183–190. [Google Scholar] [CrossRef] [PubMed]
- Smoking/Vaping Machines of Borgwaldt KC. Available online: https://www.borgwaldt.com/en/products/smoking-vaping-machines (accessed on 18 September 2020).
- Shih, P.; Hsu, C.; Tien, F. Automatic Reclaimed Wafer Classification Using Deep Learning Neural Networks. Symmetry 2020, 12, 705. [Google Scholar] [CrossRef]
- Cybenko, G. Approximation by superpositions of a sigmoidal function. Math. Control Signals Syst. 1989, 2, 303–314. [Google Scholar] [CrossRef]
- Hornik, K.; Stinchcombe, M.; White, H. Multilayer feedforward networks are universal approximators. Neural Netw. 1989, 2, 359–366. [Google Scholar] [CrossRef]
Figure 1.
Rotary smoking machines (a) RM200A2 of BORGWALDT (b) Operation of Smoking Machine RM200A2 (in Seoul, Korea).
Figure 1.
Rotary smoking machines (a) RM200A2 of BORGWALDT (b) Operation of Smoking Machine RM200A2 (in Seoul, Korea).

Figure 2.
The experimental atmosphere: temperature and humidity changes.

Figure 3.
ICT-TVOC sensor (SVM30) (a) semiconductor sensor structure (b) principle of semiconductor sensor.
Figure 3.
ICT-TVOC sensor (SVM30) (a) semiconductor sensor structure (b) principle of semiconductor sensor.

Figure 4.
ICT-Particulate Matter Sensor (SPS 30), (a) optical sensor structure, (b) principle of optical sensor.
Figure 4.
ICT-Particulate Matter Sensor (SPS 30), (a) optical sensor structure, (b) principle of optical sensor.

Figure 5.
Block diagram of the measurement system and smoking detector.

Figure 6.
The machine learning algorithms cheat sheet to find the appropriate algorithms.

Figure 7.
Contextual matrix.

Figure 8.
Correlation results of graph in all situations.

Figure 9.
Correlation results of graph in smoking situations.

Figure 10.
Pre-processed training data.

Figure 11.
Data change depending on the situation in test data.

Figure 12.
3D Coordinate graph of (a) K-Means (b) PFCM (c) KNN (d) MLP (e) Linear SVM (f) SVM RBF model.
Figure 12.
3D Coordinate graph of (a) K-Means (b) PFCM (c) KNN (d) MLP (e) Linear SVM (f) SVM RBF model.

Figure 13.
Summary of performance comparison of cigarette detection algorithm.

Figure 14.
ROC Curve.


Table 1.
Information of used cigarette.
| Type of Cigarette | Puff (Count) | Tarr (mg) | Nicotine (mg) |
|---|---|---|---|
| cigarette 1 | 5, 7, 10 | 5 | 0.35 |
| cigarette 2 | 3, 5, 7 | 3 | 0.2 |
| cigarette 3 | 5, 7, 10 | 5 | 0.4 |
| cigarette 4 | 3, 5, 7 | 1 | 0.1 |
Table 2.
The range of initial states of experiment.
| TVOC (ppb) | Humidity (% RH) | Temperature (°C) | CO2 (ppm) | PM 2.5 (μg/m3) | PM 10 (μg/m3) |
|---|---|---|---|---|---|
| 100 | 33~51 | 26~34 | 400 | 20 | 20 |
Table 3.
List of sensors used in the system.
| No | Sensor Model | Sensor Type | Target Parameter | Typical Detection Range |
|---|---|---|---|---|
| 1 | SPS 30 | Optical | PM 1.0, PM 2.5, PM 4, PM 10 | 1–1000 μg/m3 |
| 2 | SVM 30 | Semiconductor | Humidity, Temperature, TVOC, CO2 | TVOC: 0~60,000 ppb CO2: 0~60,000 ppm Temperature: −20~85 °C Humidity: 0~100% RH |
Table 4.
Data change depending on the situation.
| CO2 (ppm) | TVOC (ppb) | PM 2.5 (μg/m3) | PM 10 (μg/m3) | |
|---|---|---|---|---|
| COUNT | 3516.0000 | 3516.0000 | 3516.0000 | 3516.0000 |
| MEAN | 1185.9130 | 372.1780 | 419.9350 | 860.0320 |
| STD | 1560.0200 | 675.5250 | 696.8620 | 721.4680 |
| MAX | 9408.0000 | 4056.0000 | 4416.3100 | 4667.0200 |
| MIN | 400.0000 | 0.0000 | 4.4114 | 4.4304 |
Table 5.
Summary of smoking detection algorithms.
| Approach | Performance Metrics | |||
|---|---|---|---|---|
| Accuracy | Precision | Recall | F1 Score | |
| K-means | 0.245117 | 0.268174 | 0.740257 | 0.393714 |
| PFCM | 0.491750 | 0.493748 | 0.480058 | 0.481908 |
| Linear SVM | 0.839724 | 0.991550 | 0.518633 | 0.680990 |
| MLP | 0.910538 | 0.956022 | 0.765015 | 0.849918 |
| KNN | 0.913537 | 0.989159 | 0.747396 | 0.851141 |
| SVM RBF | 0.931726 | 0.989533 | 0.802139 | 0.886026 |
Publisher’s Note: MDPI stays neutral with regard to jurisdictional claims in published maps and institutional affiliations. |
© 2020 by the author. Licensee MDPI, Basel, Switzerland. This article is an open access article distributed under the terms and conditions of the Creative Commons Attribution (CC BY) license (http://creativecommons.org/licenses/by/4.0/).
Share and Cite
MDPI and ACS Style
Cho, J.H. Detection of Smoking in Indoor Environment Using Machine Learning. Appl. Sci. 2020, 10, 8912. https://0-doi-org.brum.beds.ac.uk/10.3390/app10248912
AMA Style
Cho JH. Detection of Smoking in Indoor Environment Using Machine Learning. Applied Sciences. 2020; 10(24):8912. https://0-doi-org.brum.beds.ac.uk/10.3390/app10248912
Chicago/Turabian StyleCho, Jae Hyuk. 2020. "Detection of Smoking in Indoor Environment Using Machine Learning" Applied Sciences 10, no. 24: 8912. https://0-doi-org.brum.beds.ac.uk/10.3390/app10248912
Note that from the first issue of 2016, this journal uses article numbers instead of page numbers. See further details here.