Article

Intra-Segment Coordination Variability in Road Cyclists during Pedaling at Different Intensities

1
Department of Biomechanics and Sports Injuries, Faculty of Physical Education and Sports Sciences, Kharazmi University, Tehran 15719-14911, Iran
2
School of Informatics, The University of Edinburgh, Edinburgh EH8 9AB, UK
*
Author to whom correspondence should be addressed.
Submission received: 13 November 2020 / Revised: 4 December 2020 / Accepted: 9 December 2020 / Published: 16 December 2020
(This article belongs to the Special Issue Biomechanical Spectrum of Human Sport Performance Ⅱ)

Abstract

:
Background: The purpose of this study is to examine the lower extremity intra-segment coordination and variability of road cyclists during pedaling at different intensities. Methods: Eleven semi-professional road cyclists perform four trials at workloads of 50%, 75%, 100%, and 125% of their maximum power output in a randomized order. Thigh, shank, and foot range of motions (ROM) and the coordination and variability of these segments are compared across different pedaling intensities. Results: Foot ROM in the sagittal plane and shank ROM in the transverse plane are significantly different between different pedaling intensities. Moreover, specific coupling patterns and variabilities are observed across the pedaling cycle; however, they were not significantly different across different pedaling intensities in four pedaling phases. Conclusion: The results highlight the role of knee extensors and plantar flexors during the first and second half of the propulsion phase of pedaling, respectively. Thigh abduction dominancy with faster movement compared to the shank indicates a more valgus stress during the propulsive phase of pedaling, which can increase the risk of overuse injuries in the knee. Moreover, the smaller variability during the transition between the propulsive and recovery phases indicates a reduction in degrees of freedom and may increase the risk of overuse injuries.

1. Introduction

Road cycling is one of the world’s most popular sporting events [1]. Cycling with a steady cadence and appropriate endurance also can be a suitable rehabilitation exercise for patients with an anterior cruciate ligament injury [2]. Cycling is assumed to have a low impact on the body, but cyclists still suffer from a considerable number of overuse injuries. The repetitive nature of the lower extremity during pedaling, and much time spent on training and matches, is one of the main reasons for cyclist overuse injuries [3]. The most common injuries in cyclists occur in the neck (48%) and knee (41.7%) [4].
Researchers report that many factors such as changes in cadence, body position and direction, saddle height, and fatigue can affect the mechanics of pedaling [5,6]. Moreover, cycling competition and exercises are performed in different workloads that may alter the kinematics of the joints and segments. Two studies, for instance, focused on the relationship between workload intensity and 3D kinematics in cycling that demonstrated a small-to-moderate difference in lateral spine inclination and spine rotation between recreational and competitive cyclists [6], and an increased joint ranges of motion (ROM) with increasing intensity [7]. Thus, it is beneficial for clinicians and bike fitters to understand how the full-body kinematics and lower limb muscles are affected by differing intensities encountered in cycling training and racing.
Several studies focus on joint and segment kinematics during cycling, and the majority of these studies have used linear analysis methods by considering the kinematics of individual joints rather than addressing the interactions between joints [6,7,8,9,10,11,12,13]. However, the motion of segments subsequently influence each other in a kinematic chain [14], as nonlinear dynamic analysis methods, such as the coordination pattern of joints or segments, recently have suggested to provide a better understanding of the biomechanics of human movement and effectively capture the complexity of the coordinated motion of components of the body [15,16,17].
Human body segments are mechanically linked by joints; therefore, the motion of one segment can be affected by the motion of other segments in the same kinetic chain. Therefore, research has suggested using a dynamical system approach in human movement analyses, rather than looking at the kinematics of a single joint [17,18,19]. Quantifying kinematic coordination is a tool to determine coupled movements between two segments, and coordination variability (CV) quantifies the variety of movement patterns that an individual uses during a task and can provide a measure of the flexibility/adaptability of an individual’s motor system [20,21]. Thus, a comprehensive approach for investigating segment movement coordination and CV during different pedaling rates is necessary to understand the relation between the pedaling rate and lower extremity biomechanics. The aim of this study is to compare lower limb segment coordination and their variability in cyclists during pedaling at different intensities. We hypothesize that (1) Segment ranges of motion increase with an increase in pedaling intensity, (2) lower extremity intra-segment coordination changes with an increase in pedaling intensity and (3) lower extremity intra-segment coordination variabilities decrease with an increase in pedaling intensity.

2. Materials and Methods

2.1. Participants

Eleven semi-professional road cyclists (age 27.42 ± 5.12 years, mass 64.94 ± 5.19 kg, height 168.67 ± 3.47 cm) volunteered to participate in this study. All participants had a minimum of three years road cycling experience and were physically active and free from injury at the time of testing. They had no history of serious injuries or surgery in their lower extremities within the preceding year. The cyclists who had less than three years cycling experience or had injury were excluded from the research. They signed a written informed consent before the enrolment.

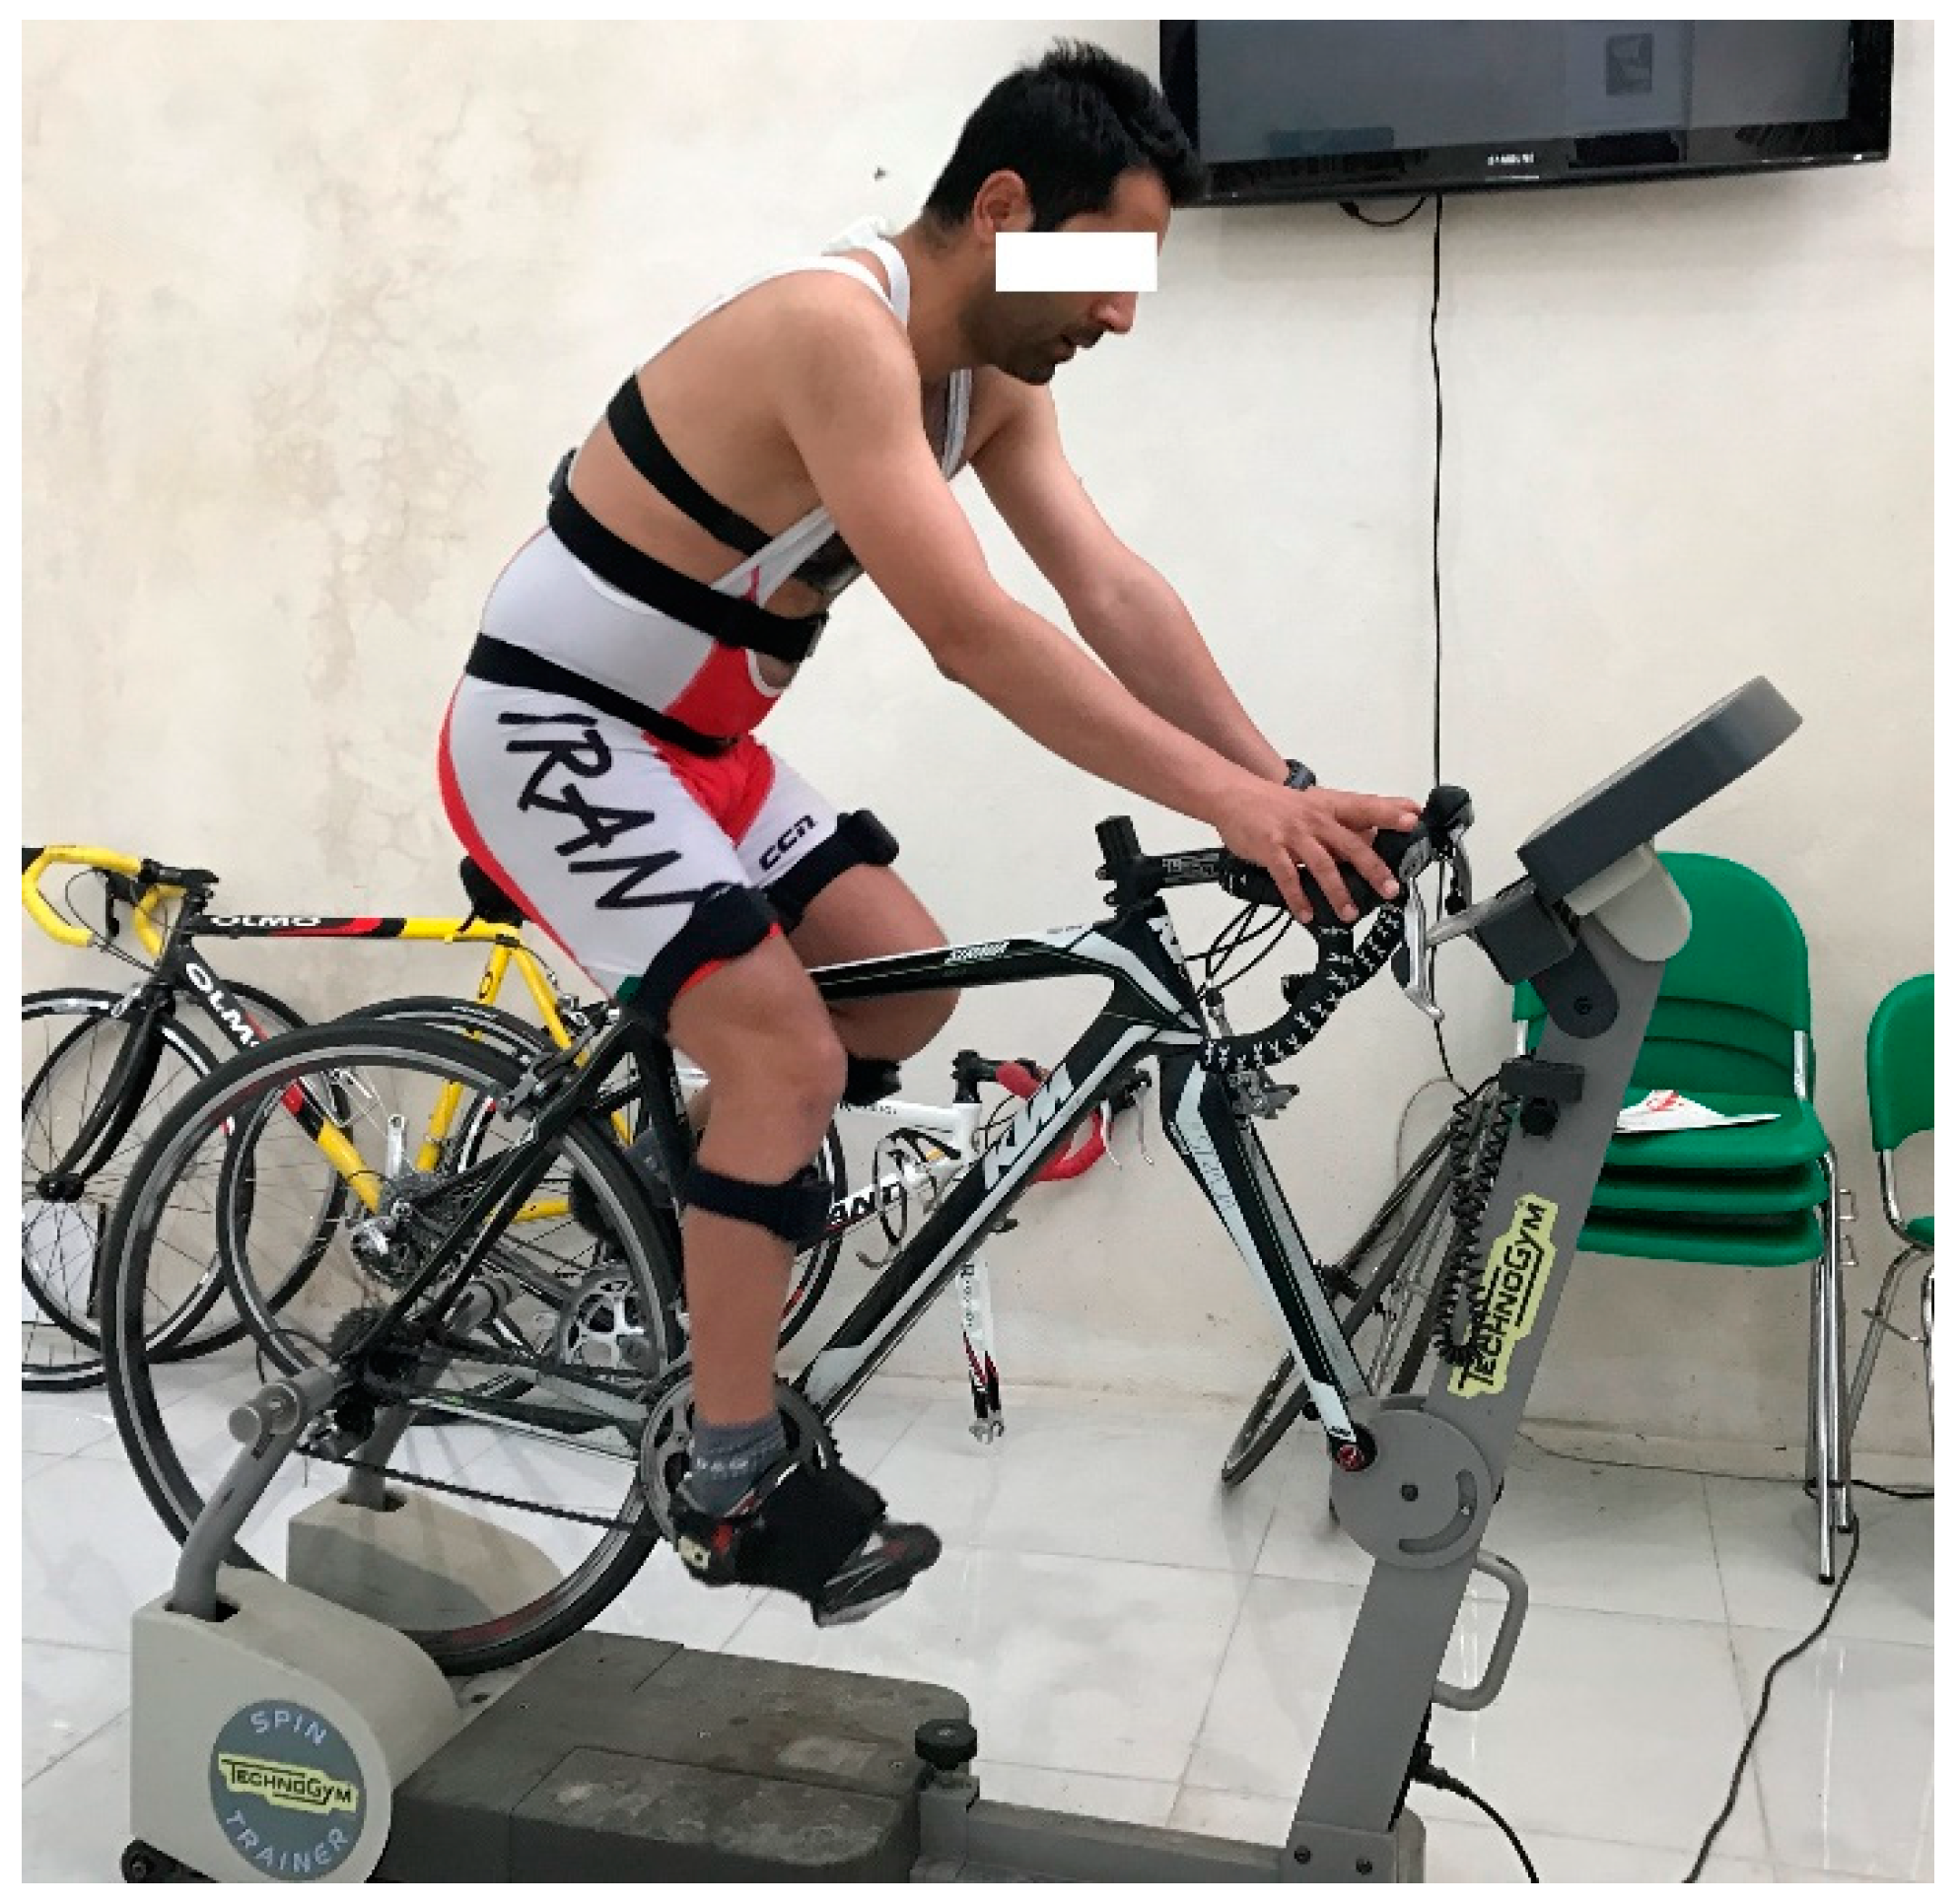
2.2. Experimental Procedure

All protocols were previously approved by Kharazmi University Institutional Review Board with ID: KH-13600404. The test was performed over two days, with an interval of 48 h. The first session involved measuring the height and weight of the participants and adjusting saddle height. Saddle height was adjusted to achieve a 150-degree knee extension with the pedal at its lowest point for each participant [22]. All participants used their own bike that was connected to an ergometer (Technogym, Gambettola, Italy). To measure maximal oxygen uptake (VO2max), the participants were asked to begin pedaling with an initial load of 1 watt per kilogram of body mass. Load was increased by 35 W for male participants and 25 W for female participants every three minutes until exhaustion. The pedaling rate was controlled within 90–95 revolutions per minute (RPM), and testing finished when the pedaling rate dropped below 85 RPM. The peak power output ( P O p e a k ) was calculated from the percentage of time (t%) and the power output at the final stage ( P O f i n a l ) according to Equation (1) [22,23]:
P O p e a k =   P O f i n a l   × t %
Forty eight hours after peak power testing, the participants visited the laboratory for a kinematic evaluation of lower extremity joints at different intensities. The kinematics data were collected by a myoMotion system (Noraxon Inc., Scottsdale, AZ, USA) in three dimensions. The myoMotion sensors were positioned on the feet, shanks, thighs, and pelvis segments and calibrated based on the manufacturer’s instructions according to former research [17] (Figure 1). The sampling frequency of the system was set at 200 Hz. After five minutes of warm-up (at power less than 150 W), participants pedaled at 50%, 75%, 100%, and 125% intensity (40 s in each intensity) and the lower extremity kinematic data were recorded in each intensity. There was a 5 min rest between each intensity to ensure fatigue did not affect pedaling.

2.3. Data Processing

Kinematics data were low pass filtered by a zero lag fourth order Butterworth filter with an 8 Hz cutoff frequency. Pedaling cycles were separated using the right knee angle, and kinematic data of 10 continuous pedaling cycles were selected for further analysis. The maximum knee angle was assigned as top dead center (TDC) of the pedaling cycle, and each pedaling cycle was defined as the TDC to the next TDC. Each pedaling cycle time series was time normalized to 101 data points and expressed as a percent of the pedaling phase such that the propulsive phase and recovery phase were identified during 0 to 50% and 51–100% of the pedaling cycle, respectively.

2.4. Segments Range of Motion (ROM) Calculation

To determine segment ranges of motion (ROM), the minimum value was subtracted from the maximum value for each pedaling cycle in all three planes of movement and then were averaged across cycles at each intensity.

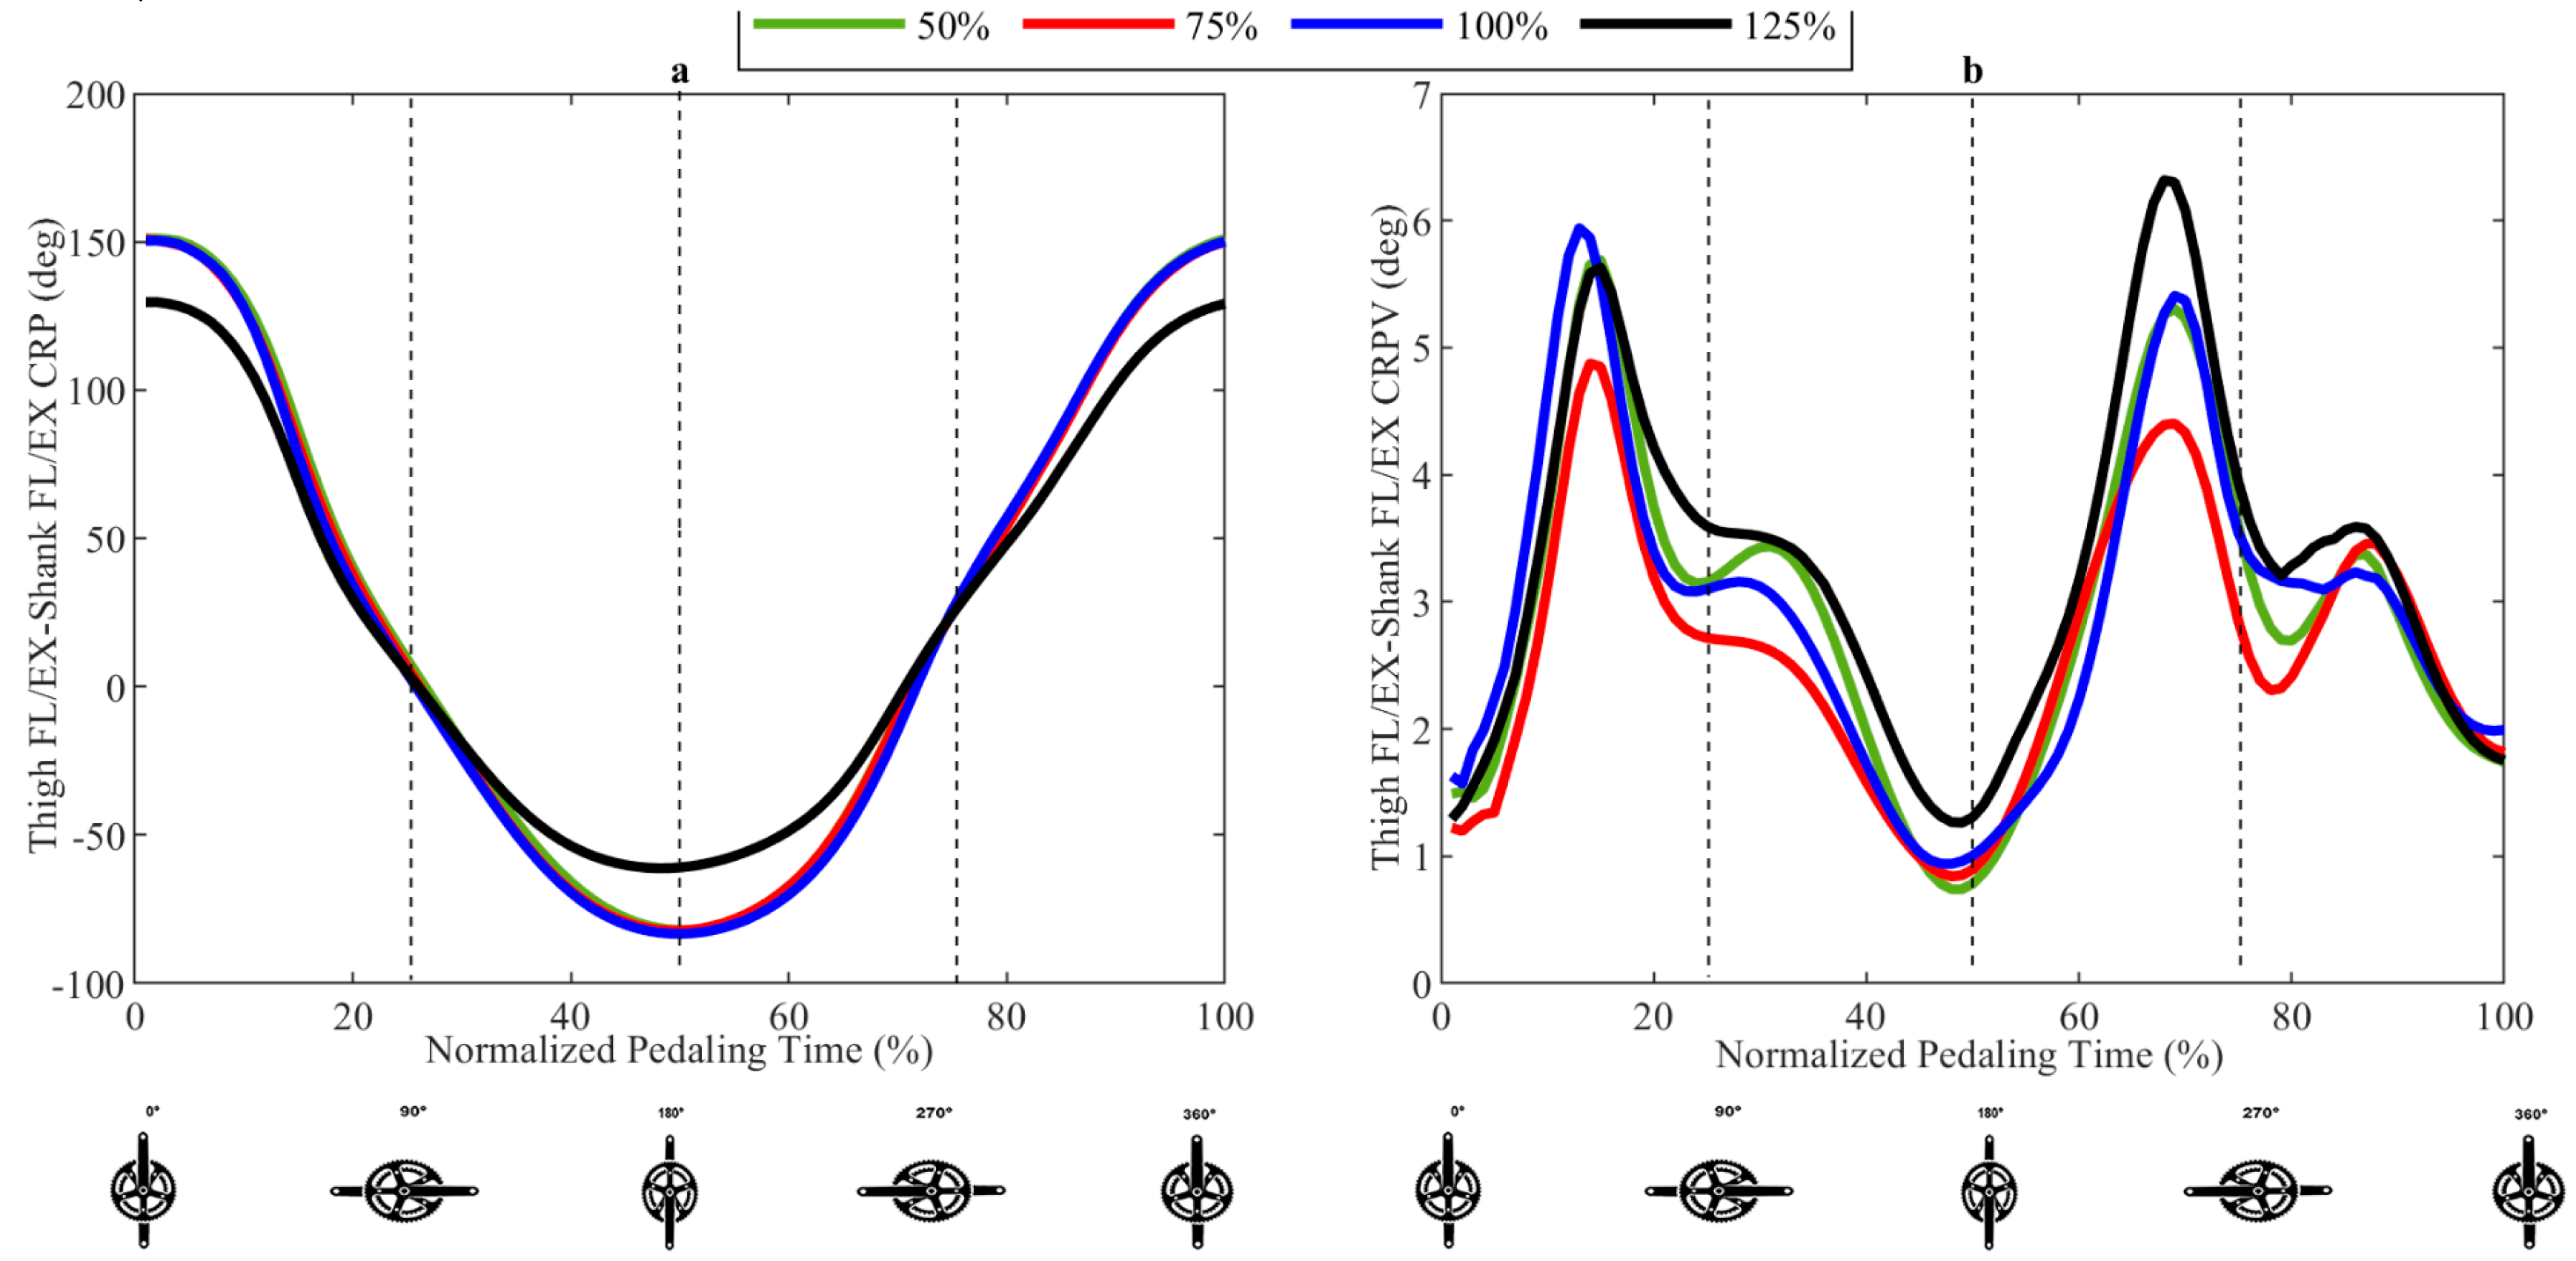
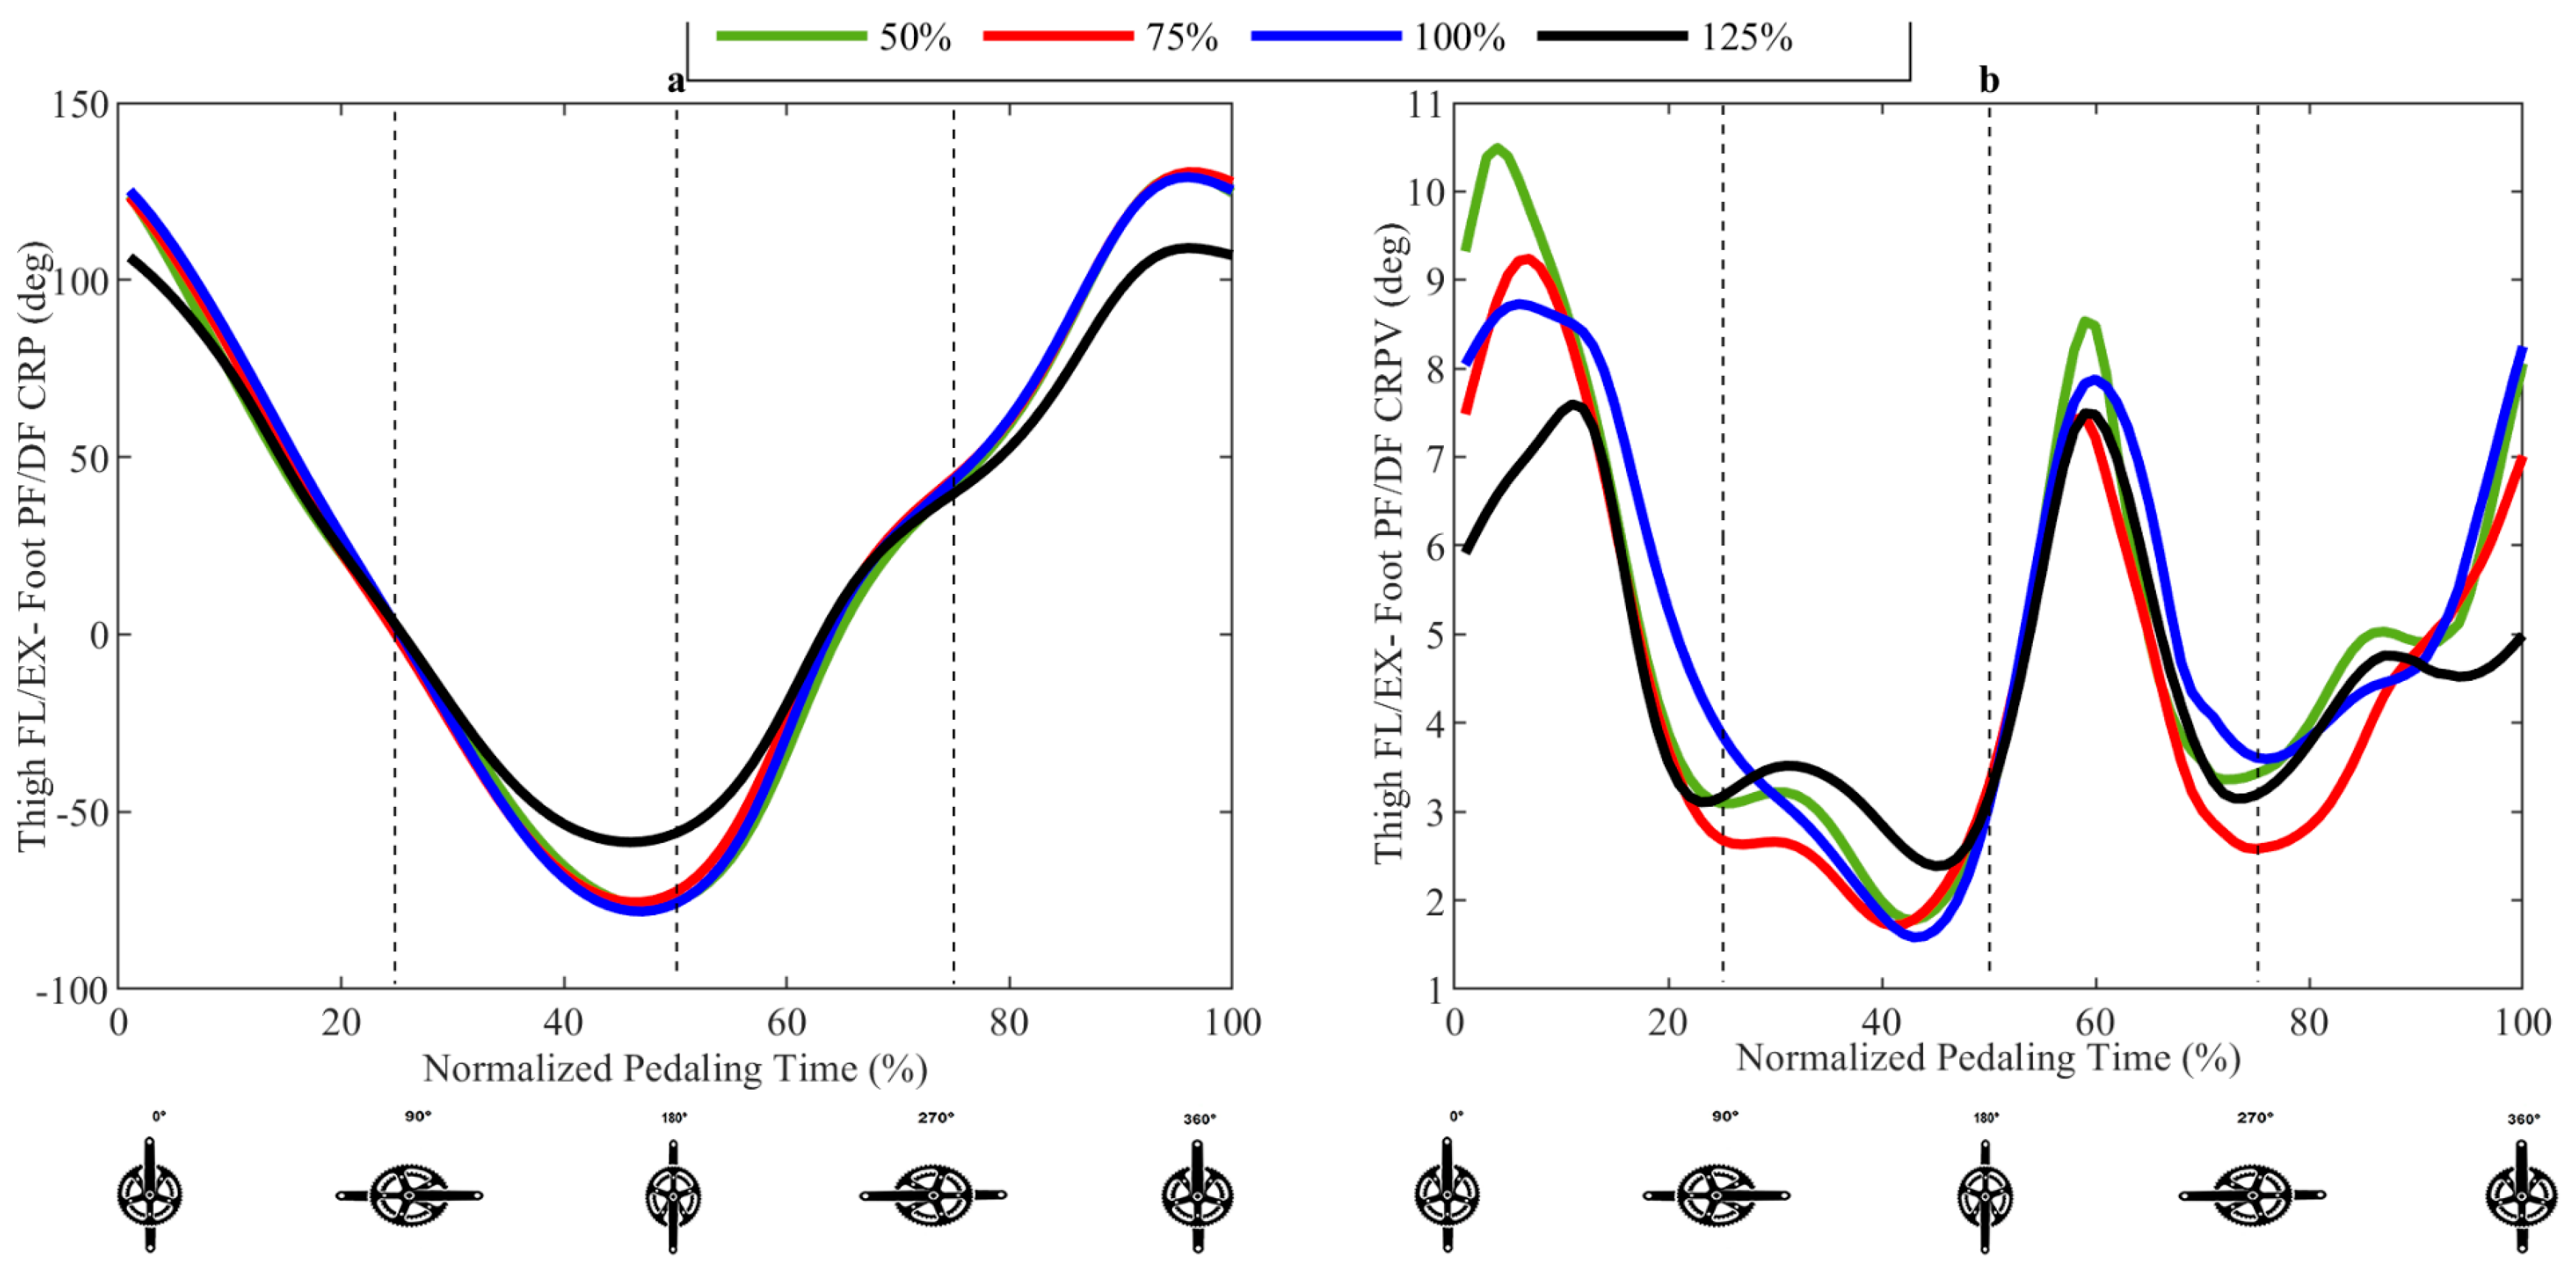
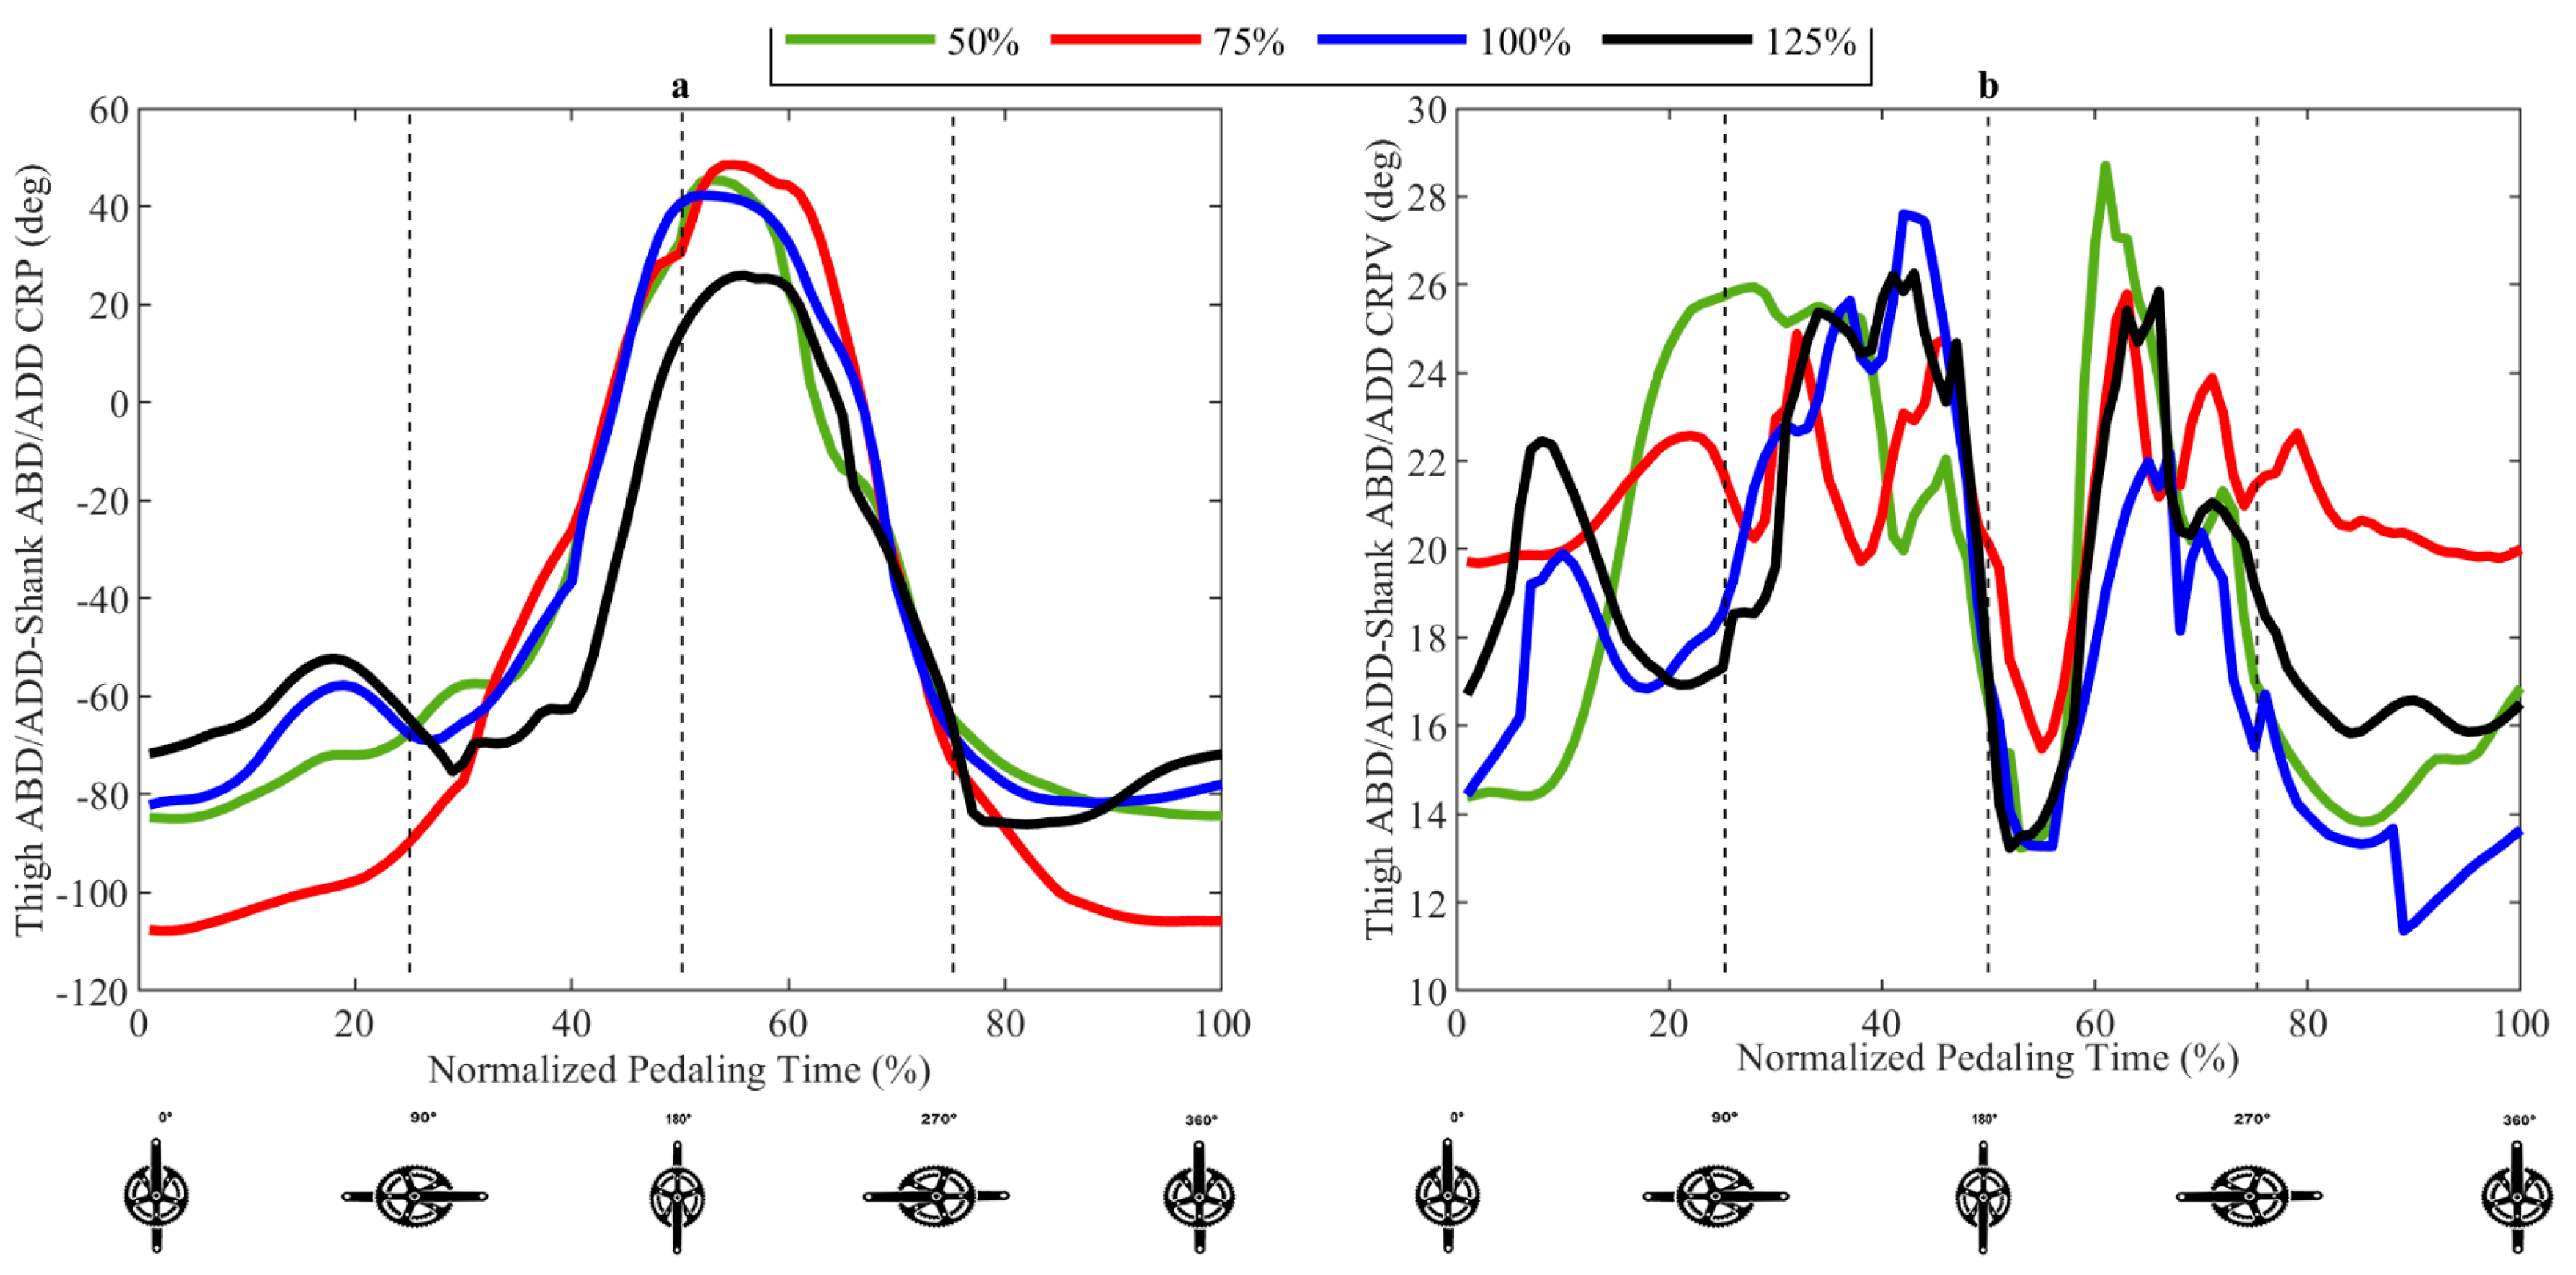
2.5. Continuous Relative Phase and Its Variability Calculation

The continuous relative phase (CRP) and the CRP variability (CRPV) were used to calculate segment coordination and its variability, respectively, in line with previous literature [17,24]. CRP and CRPV were calculated for foot, shank, thigh, and hip segments. A phase plane for each segment throughout a pedaling cycle was constructed by plotting normalized angular positions (θ: x-axis) versus normalized angular velocities (ω: y-axis). Phase angle (Φ) was calculated as Φ = tan−1(ω/θ) along each data point of the pedaling cycle. Normalized angular position (θinorm) and angular velocity (ωinorm) profiles were calculated using Equations (2) and (3), respectively.
θ i n o r m =   ( 2   [ θ i min ( θ i ) ] max ( θ i ) min ( θ i ) ) 1
ω i n o r m =   ( ω i max { | ω i | } )
where i denotes each data point of the pedaling cycle. The minimum (min) and maximum (max) angles for the series of ten pedaling cycles in each condition were used to normalize the angular position (θ) for each of the 101 data points i. The angular velocity (ω) data were normalized to the maximal ( max | ω | ) velocity within the ten pedaling cycles. Regarding each of the oscillators, the phase angle () was obtained by calculating the four-quadrant arctangent angle relative to the right horizontal axis at each instant in the pedaling cycle [17,24].
The CRP for data point i was calculated by subtracting the phase angle of the distal segment from that of the proximal segment and used as the coordination of two segments [17,24] according to Equation (4):
C R P i =   i d i s t a l   i p r o x i m a l
where i d i s t a l and i p r o x i m a l are the phase angle of the distal and proximal oscillators, respectively, at data point   i   in the pedaling cycle. CRP angles were calculated for ten couplings according to the Table 1. The CRPV was calculated as the between-cycling cycle standard deviation of the CRP data points within all trials for all participants.

2.6. Statistics

One-way repeated measure ANOVA was used to detect significant differences between segment range of motion (ROM) at different pedaling intensities. Statistical parametric mapping (SPM), one-way repeated-measures ANOVA, and a paired t-test (as post-hoc) were used to detect significant differences between the continuous relative phase (CRP) and the continuous relative phase variability (CRPV) waveforms in four different pedaling intensities. The statistical significance level was set at α = 0.05 and all SPM analyses were implemented using the open-source spm1d code (v.M0.1, www.spm1d.org) in MATLAB.

3. Results

3.1. Range of Motion (ROM) Results

The results of the one-way repeated measure ANOVA showed that the majority of ranges of motion (ROM) in all segments increased with increasing intensity. (Table 2) There were significant differences in foot ROM in the sagittal plane (p = 0.04), and shank ROM in the transverse plane (p = 0.002) between different pedaling intensities. The results of the Bonferroni post-hoc showed that there were significant differences in shank ROM in the transverse plane between 50%–125% (p = 0.016) and 75%–125% (p = 0.042) intensities, and there were significant differences in foot ROM in the sagittal plane between 50–100% intensities (p = 0.041).

3.2. Coordination Variability Results

The results of vector analysis one-way repeated measure ANOVA in statistical parametric mapping (SPM) did not show any significant differences in all calculated continuous relative phases (CRPs) and continuous relative phase variabilities (CRPVs) during four pedaling phases (p > 0.05) (Figure 2, Figure 3, Figure 4 and Figure 5).

4. Discussion

We studied the intra-segment coordination of the lower extremity and its variability during pedaling at different intensities. The results showed that the shank range of motion (ROM) in transverse significantly increased at a higher pedaling intensity and the foot ROM in the sagittal plane significantly increased in a higher pedaling intensity, which verifies our first hypothesis partially. The results of the present study are in line with the results of Holliday et al. (2019), who reported an increase in the knee and ankle ROM with increasing pedaling intensity [7]. They examined joint ROM at different pedaling intensities. The increase in shank ROM in a transverse plane at a higher pedaling intensity can increase the valgus and varus loading on the knee and increase the risk for overuse injuries on the knee. Moreover, the increase in foot ROM at a higher pedaling intensity indicates the increase of plantar/dorsi flexion of the foot at higher pedaling intensity. It highlights the ankle roles when increasing the pedaling intensity in cyclists.
The results show that there were not significant differences in the intra-segment coordination of the lower extremity and its variability between different pedaling intensities, rejecting our second and third hypotheses. Participants showed a positive continuous relative phase (CRP) during 0–20% (shank extension dominancy) and 80–100% (shank flexion dominancy) of pedaling, and a negative CRP at 20–80% of pedaling (thigh extension dominancy at 20–50% and thigh flexion dominancy at 50–80%) for thigh flexion/extension (FL/EX)–shank FL/EX coupling (Figure 2a). However, this coupling pattern was not significantly different between different intensities. This coupling pattern highlights the quadriceps and hamstring roles for shank extension and flexion, respectively, during the first and fourth quadrant phases of pedaling, and, also, the hip extensors and flexors role for thigh extension and flexion during the second and third quadrants of pedaling, respectively. The coupling pattern for thigh FL/EX–foot plantarflexion/dorsiflexion (PF/DF) followed a similar pattern to thigh FL/EX–shank FL/EX coupling (Figure 3a). This indicates thigh extension dominancy during the first quadrant, thigh flexion dominancy during the fourth quadrant, foot plantarflexion dominancy during the second quadrant (plantar flexor role), and foot dorsiflexion (dorsiflexor role) during the third quadrant of the pedaling cycle. Coaches and cyclists can use these patterns as a guideline to strengthen the muscles. In addition, these patterns may be utilized by physical therapists to design recovery exercises.
Consistent with our results, Sides et al., (2012) reported no significant differences in hip-knee and knee-ankle coupling between different work rate conditions [24], and no differences in segment and joint angles between different workloads has been reported [6]. However, contrary to our results, a change in lower extremity joint kinematics during different power outputs has been reported [7,9], but these researchers compared singular joint mechanics during each power output situation. We conclude, although the hip, knee, and ankle joint kinetics vary between different power outputs, cyclists may change their motor strategy so their lower extremity segments and joint coordination patterns do not change significantly during different intensities.
Participants showed thigh adduction dominancy during 0–45% of the pedaling phase, and thigh abduction dominancy during 65–100% of the pedaling phase for thigh abduction/adduction (AD/AB)–shank AD/AB coupling. However, they showed a shank abduction dominancy during 45–65% of the pedaling phase (Figure 4a). The 45–65% of pedaling is the transition from the propulsive to the recovery phase. Moreover, the results show that the thigh moves faster during the propulsive phase, but the shank moves faster during the recovery phase of the pedaling in phase space. It has been reported that the injury mechanism is associated with altered segment and joint motions in various sports like cycling. Specifically, greater hip adduction was linked to anterior knee pain [25]. Thigh adduction in cyclists indicates a knee valgus loading during the power phase and the faster movement of the thigh indicates a more valgus stress during the propulsive phase. Although this coupling was not significantly different between different pedaling intensities, this coupling pattern shows a valgus loading on the knee during the propulsive phase of pedaling, which can increase the risk of overuse injuries like patellofemoral pain on this joint.
The results show an in-phase shank dominancy during the first half of the propulsive phase (0–25%) for the shank FL/EX–foot PF/DF coupling which decreases with an increase in pedaling intensity. The pedaling task continues with an in-phase foot plantar flexion dominancy (25–50%) and foot dorsiflexion dominancy (50–90%) (Figure 5a). This coupling did not significantly vary between different pedaling rates, however, it indicates the knee extensor and foot plantar flexor rules in the first and second half of the propulsive phase, respectively. Moreover, it indicates the ankle dorsiflexor muscles are more active during the recovery phase of pedaling.
Generally, our results show that continuous relative phase variabilities (CRPVs) increase at mid-propulsive and mid-recovery phases for all calculated couplings and thigh-shank CRPVs reduce during the transition from the propulsive to recovery (about 50%) and recovery to propulsive (about 100%) phases. However, these changes were not statistically significant (Figure 2b, Figure 3b, Figure 4b, and Figure 5b). It has been reported that the increased variability of fluctuations is an essential feature of abrupt changes or phase transitions in movement patterns [26]. Moreover, a reduction in the effective degrees of freedom, interacting components, and synergies involved in the control of human movement may become associated with a reduction invariability and, when these reductions in degrees of freedom and variability reach a critical threshold, injury or disease may emerge. The increase in CRPV during the mid-propulsive and mid-recovery phases can be attributed to the mid-phase transitions, during which cyclists need to change their strategy to transit their lower extremity from push forward to push backward (mid-propulsive) and from pull backward to pull forward (mid-recovery). Moreover, the knees are in their maximum extension and flexion during the transition from propulsive to recovery and recovery to propulsive phases, respectively. The reduction in coupling variabilities in these sites indicates a reduction in degrees of freedom, and there may be an increased risk for overuse injuries. The results of the present study regarding CRPV are in contrast with the results of Sides et al., (2012). They examined hip-knee and knee-ankle coordination and its variability during pedaling at various cadences and work rates and they reported significantly higher knee-ankle coordination variability during the recovery phase of pedaling in the 60 rpm stage compared to during the 90 and 120 rpm stages [24]. However, they presented the mean of joint CRP and CRPV across all 100 data points, which cannot be a good representation of all 100 coupling data points, where we have used the statistical parametric mapping (SPM) method in all 100 data points.
One of the limitations of this study was the number of participants (n = 11), so the results of this study should be considered with caution. Further work is required with a larger number of cyclists to attain a better understanding of kinematic changes at different pedaling intensities. We did not find any significant differences in segments CRP and CRPV between different pedaling rates. However, we examined only four couplings in the sagittal and frontal planes using the CRP method. The examination of further couplings in joints and segments in the three planes of movement may present different results. We controlled the pedaling rates at 70 rpm. Hereafter, we will examine coupling variability at different pedaling rates and power outputs to gain a better understanding about the change in lower extremity mechanics during pedaling at different intensities. Finally, fixing the bicycle on an ergometer limits the degrees of freedom and movement of the cyclists, which might influence the adoption of coordination and variability strategies. The examination of pedaling kinematics during a real cycling task on the road at different pedaling intensities can give a better insight to the adaptation of joint and segment coordination with different pedaling intensities.

Author Contributions

Conceptualization, A.A. and R.M.; methodology, A.A., R.M., and M.K.T.; software, A.A., R.M., and K.N.; validation, A.A., R.M., and M.K.T.; formal analysis, A.A., R.M., and K.N.; investigation, A.A., and R.M.; A.A., and S.A.; writing—original draft preparation, A.A., R.M., S.A., M.K.T., and K.N.; writing—review and editing, A.A., R.M., S.A., K.N., and M.K.T.; supervision, A.A.; project administration, K.N. All authors have read and agreed to the published version of the manuscript.

Funding

This research received no external funding.

Acknowledgments

The authors would like to thank ‘Khane Docharkhe Shiraz Gym’ and all road cyclists that participated in this research. The work of KN is supported by Engineering and Physical Sciences Research Council, UK (grant number: EP/R004242/1).

Conflicts of Interest

The authors declare no conflict of interest.

References

  1. Clarsen, B.; Krosshaug, T.; Bahr, R. Overuse Injuries in Professional Road Cyclists. Am. J. Sports Med. 2010, 38, 2494–2501. [Google Scholar] [CrossRef] [PubMed]
  2. Fleming, B.C.; Beynnon, B.D.; Renstrom, P.A.; Peura, G.D.; Nichols, C.E.; Johnson, R.J. The Strain Behavior of the Anterior Cruciate Ligament during Bicycling. Am. J. Sports Med. 1998, 26, 109–118. [Google Scholar] [CrossRef] [PubMed]
  3. Callaghan, M.J. Lower body problems and injury in cycling. J. Bodyw. Mov. Ther. 2005, 9, 226–236. [Google Scholar] [CrossRef]
  4. Wilber, C.A.; Holland, G.J.; Madison, R.E.; Loy, S.F. An Epidemiological Analysis of Overuse Injuries Among Recreational Cyclists. Int. J. Sports Med. 1995, 16, 201–206. [Google Scholar] [CrossRef] [Green Version]
  5. Asplund, C.A.; Pierre, P.S. Knee Pain and Bicycling. Physician Sportsmed. 2004, 32, 23–30. [Google Scholar] [CrossRef] [Green Version]
  6. Bini, R.R.; Dagnese, F.; Da Rocha, E.S.; Silveira, M.C.; Carpes, F.P.; Mota, C.B. Three-dimensional kinematics of competitive and recreational cyclists across different workloads during cycling. Eur. J. Sport Sci. 2016, 16, 1–7. [Google Scholar] [CrossRef]
  7. Holliday, W.; Theo, R.; Fisher, J.; Swart, J. Cycling: Joint kinematics and muscle activity during differing intensities. Sports Biomech. 2019, 00, 1–15. [Google Scholar] [CrossRef]
  8. Bini, R.R.; Jacques, T.C.; Lanferdini, F.J.; Vaz, M.A. Comparison of Kinetics, Kinematics, and Electromyography during Single-Leg Assisted and Unassisted Cycling. J. Strength Cond. Res. 2015, 29, 1534–1541. [Google Scholar] [CrossRef]
  9. Bini, R.R.; Tamborindeguy, A.C.; Mota, C.B. Effects of Saddle Height, Pedaling Cadence, and Workload on Joint Kinetics and Kinematics during Cycling. J. Sport Rehab. 2010, 19, 301–314. [Google Scholar] [CrossRef]
  10. Burnett, A.F.; Cornelius, M.W.; Dankaerts, W.; O’Sullivan, P.P. Spinal kinematics and trunk muscle activity in cyclists: A comparison between healthy controls and non-specific chronic low back pain subjects—a pilot investigation. Man. Ther. 2004, 9, 211–219. [Google Scholar] [CrossRef]
  11. Suzuki, S.; Watanabe, S.; Homma, S. EMG activity and kinematics of human cycling movements at different constant velocities. Brain Res. 1982, 240, 245–258. [Google Scholar] [CrossRef]
  12. Streisfeld, G.M.; Bartoszek, C.; Creran, E.; Inge, B.; McShane, M.D.; Johnston, T. Relationship Between Body Positioning, Muscle Activity, and Spinal Kinematics in Cyclists With and Without Low Back Pain. Sports Heal. A Multidiscip. Approach 2017, 9, 75–79. [Google Scholar] [CrossRef] [PubMed]
  13. Momeni, K.; Chin, P.D.F.W.S.; Evans, M. Lower-extremity joint kinematics and muscle activations during semi-reclined cycling at different workloads in healthy individuals. J. Neuroeng. Rehab. 2014, 11. [Google Scholar] [CrossRef] [PubMed] [Green Version]
  14. Bartlett, R.; Wheat, J.; Robins, M. Is movement variability important for sports biomechanists? Sports Biomech. 2007, 6, 224–243. [Google Scholar] [CrossRef] [PubMed]
  15. Needham, R.; Naemi, R.; Chockalingam, N. A new coordination pattern classification to assess gait kinematics when utilising a modified vector coding technique. J. Biomech. 2015, 48, 3506–3511. [Google Scholar] [CrossRef] [PubMed]
  16. Needham, R.; Naemi, R.; Hamill, J.; Chockalingam, N. Analysing patterns of coordination and patterns of control using novel data visualisation techniques in vector coding. Foot 2020, 44. [Google Scholar] [CrossRef]
  17. Abbasi, A.; Yazdanbakhsh, F.; Khaleghi Tazji, M.; Aghaei Ataabadi, P.; Svoboda, Z.; Nazarpour, K.; Fraga Vieira, M. A comparison of coordination and its variability in lower extremity segments during treadmill and overground running at different speeds. Gait Posture 2020, 79, 139–144. [Google Scholar] [CrossRef]
  18. Hamill, J.; Palmer, C.; Van Emmerik, R.E. Coordinative variability and overuse injury. Sports Med. Arthrosc. Rehabil. Ther. Technol. 2012, 4. [Google Scholar] [CrossRef] [Green Version]
  19. Hamill, J.; Van Emmerik, R.E.; Heiderscheit, B.C.; Li, L. A dynamical systems approach to lower extremity running injuries. Clin. Biomech. 1999, 14, 297–308. [Google Scholar] [CrossRef]
  20. Heiderscheit, B.C. Movement Variability as a Clinical Measure for Locomotion. J. Appl. Biomech. 2000, 16, 419–427. [Google Scholar] [CrossRef]
  21. Van Emmerik, R.E.; Ducharme, S.W.; Amado, A.C.; Hamill, J. Comparing dynamical systems concepts and techniques for biomechanical analysis. J. Sport Health Sci. 2016, 5, 3–13. [Google Scholar] [CrossRef] [PubMed]
  22. Abbasi, A.; Mohammadian, M.A.; Abbasi, S.; Bashafaat, H. The Effect of Changes in Bicycle Pedal Width on the Kinematics of Segments and Joints of Lower Extremity: Analysis of the Risk of Knee Overuse Injuries with Pedaling (A Cross-sectional Study). J. Res. Rehabil. Sci. 2020, 15, 354–360. [Google Scholar]
  23. Bieuzen, F.; Lepers, R.; Vercruyssen, F.; Hausswirth, C.; Brisswalter, J. Muscle activation during cycling at different cadences: Effect of maximal strength capacity. J. Electromyogr. Kinesiol. 2007, 17, 731–738. [Google Scholar] [CrossRef] [PubMed]
  24. Sides, D.; Wilson, C. Intra-limb coordinative adaptations in cycling. Sports Biomech. 2012, 11, 1–9. [Google Scholar] [CrossRef] [PubMed] [Green Version]
  25. Bailey, M.P.; Maillardet, F.J.; Messenger, N. Kinematics of cycling in relation to anterior knee pain and patellar tendinitis. J. Sports Sci. 2003, 21, 649–657. [Google Scholar] [CrossRef] [PubMed]
  26. Robertson, D.G.E.; Caldwell, G.E.; Hamill, J.; Kamen, G.; Whittlesey, S. Research methods in biomechanics. Hum. Kinet. 2013, 2E, 294. [Google Scholar]
Figure 1. MyoMotion sensors placements on segments.
Applsci 10 08964 g001
Figure 2. Thigh flexion/extension (FL/EX)-Shank FL/EX continuous relative phase (CRP) (a) and continuous relative phase variability (CRPV) (b) in different pedaling intensities.
Applsci 10 08964 g002
Figure 3. Thigh flexion/extension (FL/EX)-Foot plantarflexion/dorsiflexion (PF/DF) continuous relative phase (CRP) (a) and continuous relative phase variability (CRPV) (b) in different pedaling intensities.
Applsci 10 08964 g003
Figure 4. Thigh abduction/adduction (AD/AB)-Shank AD/AB continuous relative phase (CRP) (a) and continuous relative phase variability (CRPV) (b) in different pedaling intensities.
Applsci 10 08964 g004
Figure 5. Shank flexion/extension (FL/EX)-Foot plantarflexion/dorsiflexion (PF/DF) continuous relative phase (CRP) (a) and continuous relative phase variability (CRPV) (b) in different pedaling intensities.
Applsci 10 08964 g005
Table 1. The calculated segment coordination and its abbreviation.
CoordinationAbbreviation
1Thigh flexion/extension to shank flexion/extensionThigh FL/EX—Shank FL/EX
2Thigh flexion/extension to foot plantarflexion/dorsiflexionThigh FL/EX—Foot PF/DF
3Thigh abduction/adduction to shank abduction/adductionThigh ABD/ADD—Shank ABD/ADD
4Shank flexion/extension to foot plantarflexion/dorsiflexionShank FL/EX—Foot PF/DF
Table 2. Segment ranges of motion (ROM) in transverse, frontal, and sagittal plane during pedaling at different intensities.
SegmentsTransverse PlaneFrontal PlaneSagittal Plane
50%75%100%125%p Value50%75%100%125%p Value50%75%100%125%p Value
Thigh24.58 ± 12.4325.01 ± 12.3327.27 ± 16.0622.95 ± 11.900.6228.16 ± 16.4527.53 ± 17.1125.80 ± 12.9227.86 ± 14.860.8049.19 ± 7.9448.72 ± 7.8949.40 ± 8.3749.42 ± 8.070.72
Shank9.56 ± 3.789.76 ± 3.3710.75 ± 4.2111.83 ± 4.800.002 *9.71 ± 5.509.51 ± 4.929.20 ± 4.4010.03 ± 5.610.6643.38 ± 2.7542.69 ± 2.2842.08 ± 4.3442.01 ± 2.690.08
Foot9.08 ± 5.1114.48 ± 8.9312.93 ± 7.5614.67 ± 7.550.0911.8 ± 1.4312.27 ± 1.7114.36 ± 1.9216.43 ± 1.650.1743.03 ± 11.0344.31 ± 10.7453.10 ± 14.5446.76 ± 11.180.04 *
* Significant differences between intensities at α = 0.05
Publisher’s Note: MDPI stays neutral with regard to jurisdictional claims in published maps and institutional affiliations.

