Article

Patient Profiling Based on Spectral Clustering for an Enhanced Classification of Patients with Tension-Type Headache

by
Oscar J. Pellicer-Valero
1,
César Fernández-de-las-Peñas
2,*,
José D. Martín-Guerrero
1,
Esperanza Navarro-Pardo
3,
Margarita I. Cigarán-Méndez
2,4 and
Lidiane L. Florencio
2
1
Department of Electronic Engineering, Intelligent Data Analysis Laboratory, ETSE (Engineering School), Universitat de València, 46010 Valencia, Spain
2
Department of Physical Therapy, Occupational Therapy, Rehabilitation and Physical Medicine, Health Sciences Faculty, Universidad Rey Juan Carlos, 28922 Alcorcón, Madrid, Spain
3
Department of Developmental and Educational Psychology, Psychology Faculty, Universitat de València, 46010 Valencia, Spain
4
Department of Psychology, Health Sciences Faculty, Universidad Rey Juan Carlos, 28922 Alcorcón, Madrid, Spain
*
Author to whom correspondence should be addressed.
Submission received: 28 November 2020 / Revised: 15 December 2020 / Accepted: 17 December 2020 / Published: 20 December 2020

Abstract

:
Profiling groups of patients in clusters can provide meaningful insights into the features of the population, thus helping to identify people at risk of chronification and the development of specific therapeutic strategies. Our aim was to determine if spectral clustering is able to distinguish subgroups (clusters) of tension-type headache (TTH) patients, identify the profile of each group, and argue about potential different therapeutic interventions. A total of 208 patients (n = 208) with TTH participated. Headache intensity, frequency, and duration were collected with a 4-week diary. Anxiety and depressive levels, headache-related burden, sleep quality, health-related quality of life, pressure pain thresholds (PPTs), dynamic pressure thresholds (DPT) and evoked-pain, and the number of trigger points (TrPs) were evaluated. Spectral clustering was used to identify clusters of patients without any previous assumption. A total of three clusters of patients based on a main difference on headache frequency were identified: one cluster including patients with chronic TTH (cluster 2) and two clusters including patients with episodic TTH (clusters 0–1). Patients in cluster 2 showed worse scores in all outcomes than those in clusters 0–1. A subgroup of patients with episodic TTH exhibited pressure pain hypersensitivity (cluster 0) similarly to those with chronic TTH (cluster 2). Spectral clustering was able to confirm subgrouping of patients with TTH by headache frequency and to identify a group of patients with episodic TTH with higher sensitization, which may need particular attention and specific therapeutic programs for avoiding potential chronification.

1. Introduction

Neurological disorders represent the leading cause of disability-adjusted life-years and the second leading cause of deaths worldwide [1]. Primary headache is the most common condition attended by neurologists in clinical practice. Tension-type headache (TTH), in particular, is one of the most prevalent headaches with a point prevalence of 42% in the general population [2].
A recent longitudinal study conducted in Norway found that the one-year prevalence of TTH has increased during the last decade from 16 to 21% [3]. Despite its high prevalence, TTH is the most neglected primary headache, probably because its mechanisms are not fully understood [4].
There is evidence supporting a role of peripheral and central sensitization mechanisms in the course of TTH. The most accepted theories agree that the episodic form is more peripherally related, whereas the chronic form is more centrally related [5]. In fact, the main classification is based on the presence or absence of peri-cranial tenderness, and, most importantly, in the frequency of headaches, e.g., infrequent TTH (IETTH), frequent episodic TTH (FETTH) or chronic TTH (CTTH) [6]. According to the International Headache Society, IETTH is the headache with a frequency of less than one attack per month; FETTH is the headache with a frequency ranging from 1 to 15 attacks per month; whereas CTTH is the headache with a frequency higher than 15 attacks per month [6].
Identification of subgroups of patients with different levels of sensitization can help to better understand the evolution from episodic to chronic form of the disease, and to identify improved therapeutic strategies. In fact, subgrouping of patients according to sensitization levels has been observed in chronic pain conditions such as knee osteoarthritis [7], or chronic whiplash associated disorders [8]. However, there is a lack of studies investigating a subclassification system in people with TTH. A previous study identified a subgroup of patients with TTH with higher pressure pain hyperalgesia and worse health-related quality of life, but lower frequency and duration of headache attacks by applying a clinical classification originally developed for identifying women with TTH who are likely to respond favorably to physiotherapy [9]. This grouping seems to be non-intuitive since it is commonly accepted that patients with higher frequency of headaches exhibit higher pressure pain sensitivity. Regarding subclassification of primary headaches, machine learning algorithms were recently employed to identify the characteristics of groups of women with increased migraine intensity levels [10]. However, such an a priori splitting criterion may account for potential biases.
This work proposes the use of clustering, an unsupervised learning methodology whose pursuit is to find typical profiles in a dataset. Spectral clustering (SC) is a particularly interesting approach since it usually outperforms traditional approaches (such as k-means) and can be solved efficiently by standard linear algebra methods. Based on these advances, it has been extensively used in image segmentation and machine learning tasks [11,12]. Although strong constrains may also be inserted [13], typically no a priori hypotheses are given by the user (clinician), particularly regarding which features to split, or how. The objective of this study was to investigate if SC was able to classify subgroups (clusters) of individuals with TTH differing in clinical, psychological, and psycho-physical outcomes to further identify different profiles of patients susceptible of potential different therapeutic interventions.

2. Methods

2.1. Participants

Consecutive participants with headache were recruited from different university-based hospitals between January 2016 and December 2017. Diagnosis was performed following the criteria of the International Classification of Headache Disorders (ICHD-III beta, 2013) by neurologists with more than 20 years of clinical experience in headaches [14]. Participants were included if they exhibited pain features of TTH, reported no more than one photophobia, phonophobia or mild nausea, and presented no moderate/severe nausea or vomiting as requested by the ICHD-III beta diagnostic criteria [14]. Participants were excluded if they presented: 1, any other primary or secondary headache including medication overuse headache as defined by the ICHD-III; 2, previous neck or head trauma; 3, cervical herniated disk on medical records; 4, systemic medical disease; 5, fibromyalgia syndrome; 6, had received physical therapy or anesthetic blocks the previous 6 months; or, 7, pregnancy.
The study design was approved by the Local Human Ethical Committees (URJC 23/2014, HRJ 07/14, CESU 5/2015). All participants read and signed a written consent form prior to their inclusion in the study.
Evaluations were conducted when patients were headache-free or, in those with a high frequency of headaches, when the intensity of pain was ≤3 points on the numerical pain rate scale (NPRS). They were asked to avoid any analgesic or muscle relaxant 24 h prior to examination. No change was made on their regular pharmacological treatment.

2.2. Headache Diary

A 4-week diary was used to confirm the diagnosis and to obtain headache features and use of preventive medication [15]. Participants registered the number of days with headache (days/week), the duration of the headache episodes (h/day), and the intensity of pain of each headache episode on an 11-point NPRS; 0: no pain; 10: the worst unimaginable pain) [16].

2.3. Headache Disability Inventory

Headache-related disability was assessed with the Headache Disability Inventory (HDI), which includes 25 items about the impact of headache on emotional functioning and daily activities [17]. Possible answers for each item include yes (4 points), sometimes (2 point) or no (0 points). A total of thirteen items evaluate the emotional burden (HDI-E, maximum score: 52), and the remaining 12 items the physical burden (HDI-P, maximum score: 48) of headache. A greater score suggests greater headache-related burden. The HDI has exhibited good test–retest reliability (r = 0.93–0.95 at short-term and r = 0.76–0.83 at long-term) and good internal consistency (Cronbach α 0.79) [18].

2.4. Hospital Anxiety and Depression Scale (HADS)

The Hospital Anxiety and Depression Scale (HADS) was used to determine the presence of anxiety/depressive symptoms. Seven items are used to assess anxiety (HADS-A) and the other seven to assess depressive (HADS-D) symptoms [19]. Each question is scored on a 4-point scale ranging from 0 to 3 points (total score 0–21 points of each subscale). The HADS has shown good internal consistency (Cronbach α 0.84) in people with headache [20].

2.5. Health-Related Quality of Life

Health-related quality of life was assessed with the Medical Outcomes Study Short Form 36 (SF-36) questionnaire, which consists of 8 domains: physical functioning, physical role, bodily pain (pain interference), general health, vitality, social function, role-emotional, and mental health [21]. The total score ranges from 0 (the lowest quality of life) to 100 (the highest quality of life) [22].

2.6. Sleep Quality

Sleep quality was assessed with the Pittsburgh Sleep Quality Index (PSQI) [23]. This questionnaire consists of 19 questions evaluating the quality of sleep over a 1-month period (e.g., usual bed time, usual wake time, number of actual hours slept and number of minutes to fall asleep). The sum of all answers is transformed into a global score (0–21) where higher score indicates worse sleep quality [24]. A total score greater than 8.0 points suggests poor sleep quality [24]. The PSQI has shown good internal consistency (Cronbach α 0.83) and test-retest reliability (r = 0.73) [25].

2.7. Pressure Pain Thresholds

Pressure pain thresholds (PPT), defined as the minimal amount of pressure where a sense of pressure first changes to pain, were assessed over the temporalis muscle, cervical spine, second metacarpal, and tibialis anterior muscle with an electronic pressure algometer (Somedic® Algometer, Sollentuna, Sweden) following previous guidelines [26]. The mean of 3 trials on each point, with a 30s resting period for avoiding temporal summation of pain [27], was calculated and used for the analyses.
The order of assessment was randomized between participants. Since no side-to-side differences were found, the mean of both sides for each measure was used within the analysis. The reliability of pressure algometry in the head has been found to be high [28].

2.8. Dynamic Pressure Thresholds

Dynamic pressure thresholds (DPT), defined as the load level of the roller where the dynamic pressure first changes to pain, over the temporalis muscle were assessed with a dynamic pressure algometer (Aalborg University®, Aalborg, Denmark) specifically developed for this topic [29].
The experimenter maintained a constant pressure while the roller was moving at a speed of approximately 0.5 cm/sec crossing over the temporalis muscle from anterior to posterior as previously described [29]. The assessment was repeated twice on each side of the head and the mean was used in the analyses. In addition, participants were asked to rate the pain intensity elicited (roller-evoked pain) during the DPT on a 11-point NPRS (0: no pain, 10: maximum pain). The dynamic pressure algometry has shown good reliability in both DPT and pain ratings with interclass correlation coefficients ranging from 0.75 to 0.88 [30].

2.9. Trigger Point Examination

The number of active and latent trigger points (TrPs) was calculated on each participant. Trigger points were explored bilaterally in the temporalis, masseter, suboccipital, sternocleidomastoid, upper trapezius, and splenius capitis muscles by a clinician with more than 15 years of experience. The diagnosis was performed following international guidelines [31,32]: (1) presence of a palpable taut band in the muscle; (2) presence of a painful spot in the taut band; (3) local twitch response on palpation of the muscle taut band; (4) reproduction of referred pain with manual palpation. The TrP was considered active when the referred pain elicited during the examination reproduced, at least part of the TTH pattern that the participant suffered from, and, therefore, the pain was recognized as a usual or familiar pain. A TrP was considered latent when the pain elicited during examination did not reproduce any TTH pain feature, and, therefore, the elicited pain was not recognized as a usual or familiar pain symptom [31,32].

2.10. Data Preprocessing and Imputation

Before clustering analysis, the dataset was cleaned and prepared. Firstly, the features (i.e., the variables) were standardized by applying x ˜ = x     μ x σ x , where x is the original feature, σ x represents its sample standard deviation, μ x its sample mean, and x ˜ is the standardized feature. This ensures that all features have zero mean and unit variance, which is required by many clustering techniques, especially those that employ Euclidean distances (typically inside the Gaussian similarity function) to compute the similarity between the data points; otherwise, larger features would be considered as being more dissimilar only by virtue of the scale that they were measured in.
Secondly, missing values were imputed by means of k-Nearest Neighbors imputation (with k = 5 ), which simply replaces the missing value by the mean value of the k   nearest points (in terms of Euclidean distance) for that feature. Table 1 contains some summary statistics for the dataset. It must be noted that these imputations were only applied for the clustering phase and, after obtaining the clusters, any further statistical tests were performed on the actual data, with no imputation applied. For both imputation and clustering steps, Python library scikit-learn (ver. 0.23.1) [33] was employed.

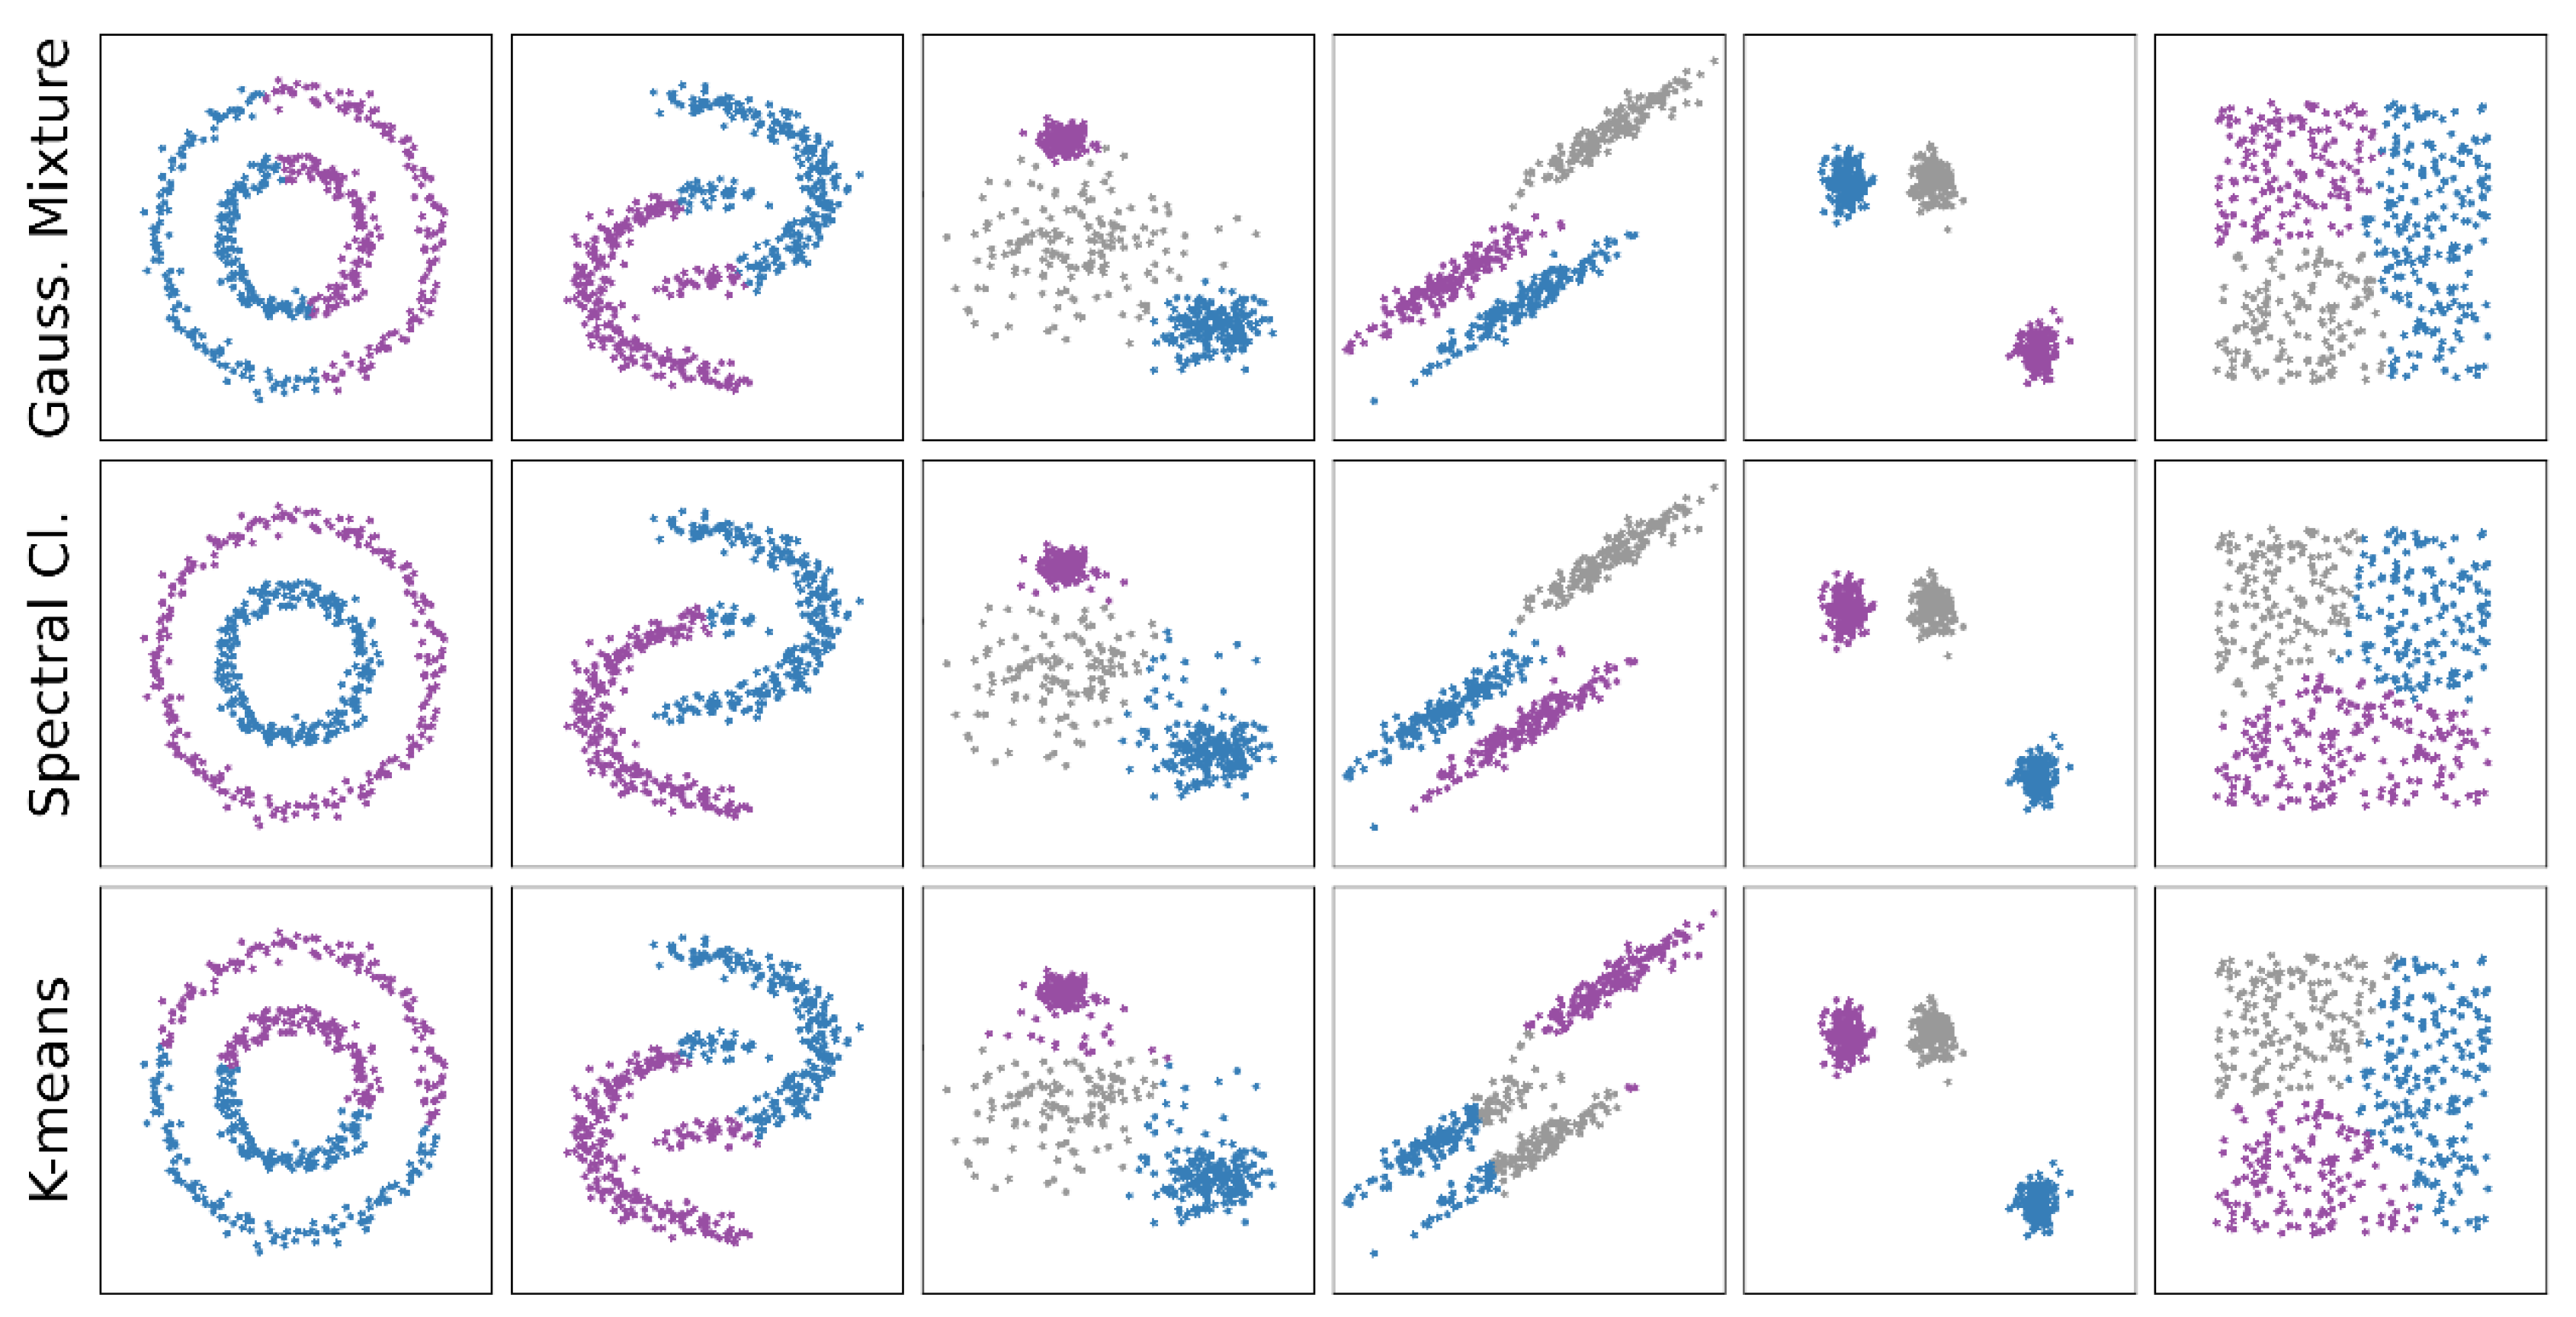
2.11. Clustering Algorithms

Clustering techniques seek to automatically detect sets of points that are similar among themselves (thus forming a cluster) and different from the rest [34]. For instance, three common clustering techniques (K-means, SC and Gaussian Mixture) are shown within Figure 1 on six different two-dimensional datasets. Points with the same color have been assigned to the same cluster by the algorithm. Visually, SC seems to be the best able to find the correct groupings in all the datasets.
In the above-mentioned example, it is possible to visually assess the results of each algorithm, since the data is two-dimensional, and the clusters are clearly separated. However, for general N-dimensional problems (as is our sample of TTH patients), it is extremely difficult to evaluate the performances. Even if several metrics exist for that matter, such as the Silhouette Score or the Davies Bouldin Score [35], for our particular problem their values were similar among the algorithms and inconsistent among metrics (e.g., an algorithm deemed good by one metric would be bad by others). Hence, the decision to use SC over competing techniques was qualitative, based on its reported advantages and its perceived improved performance on our data.

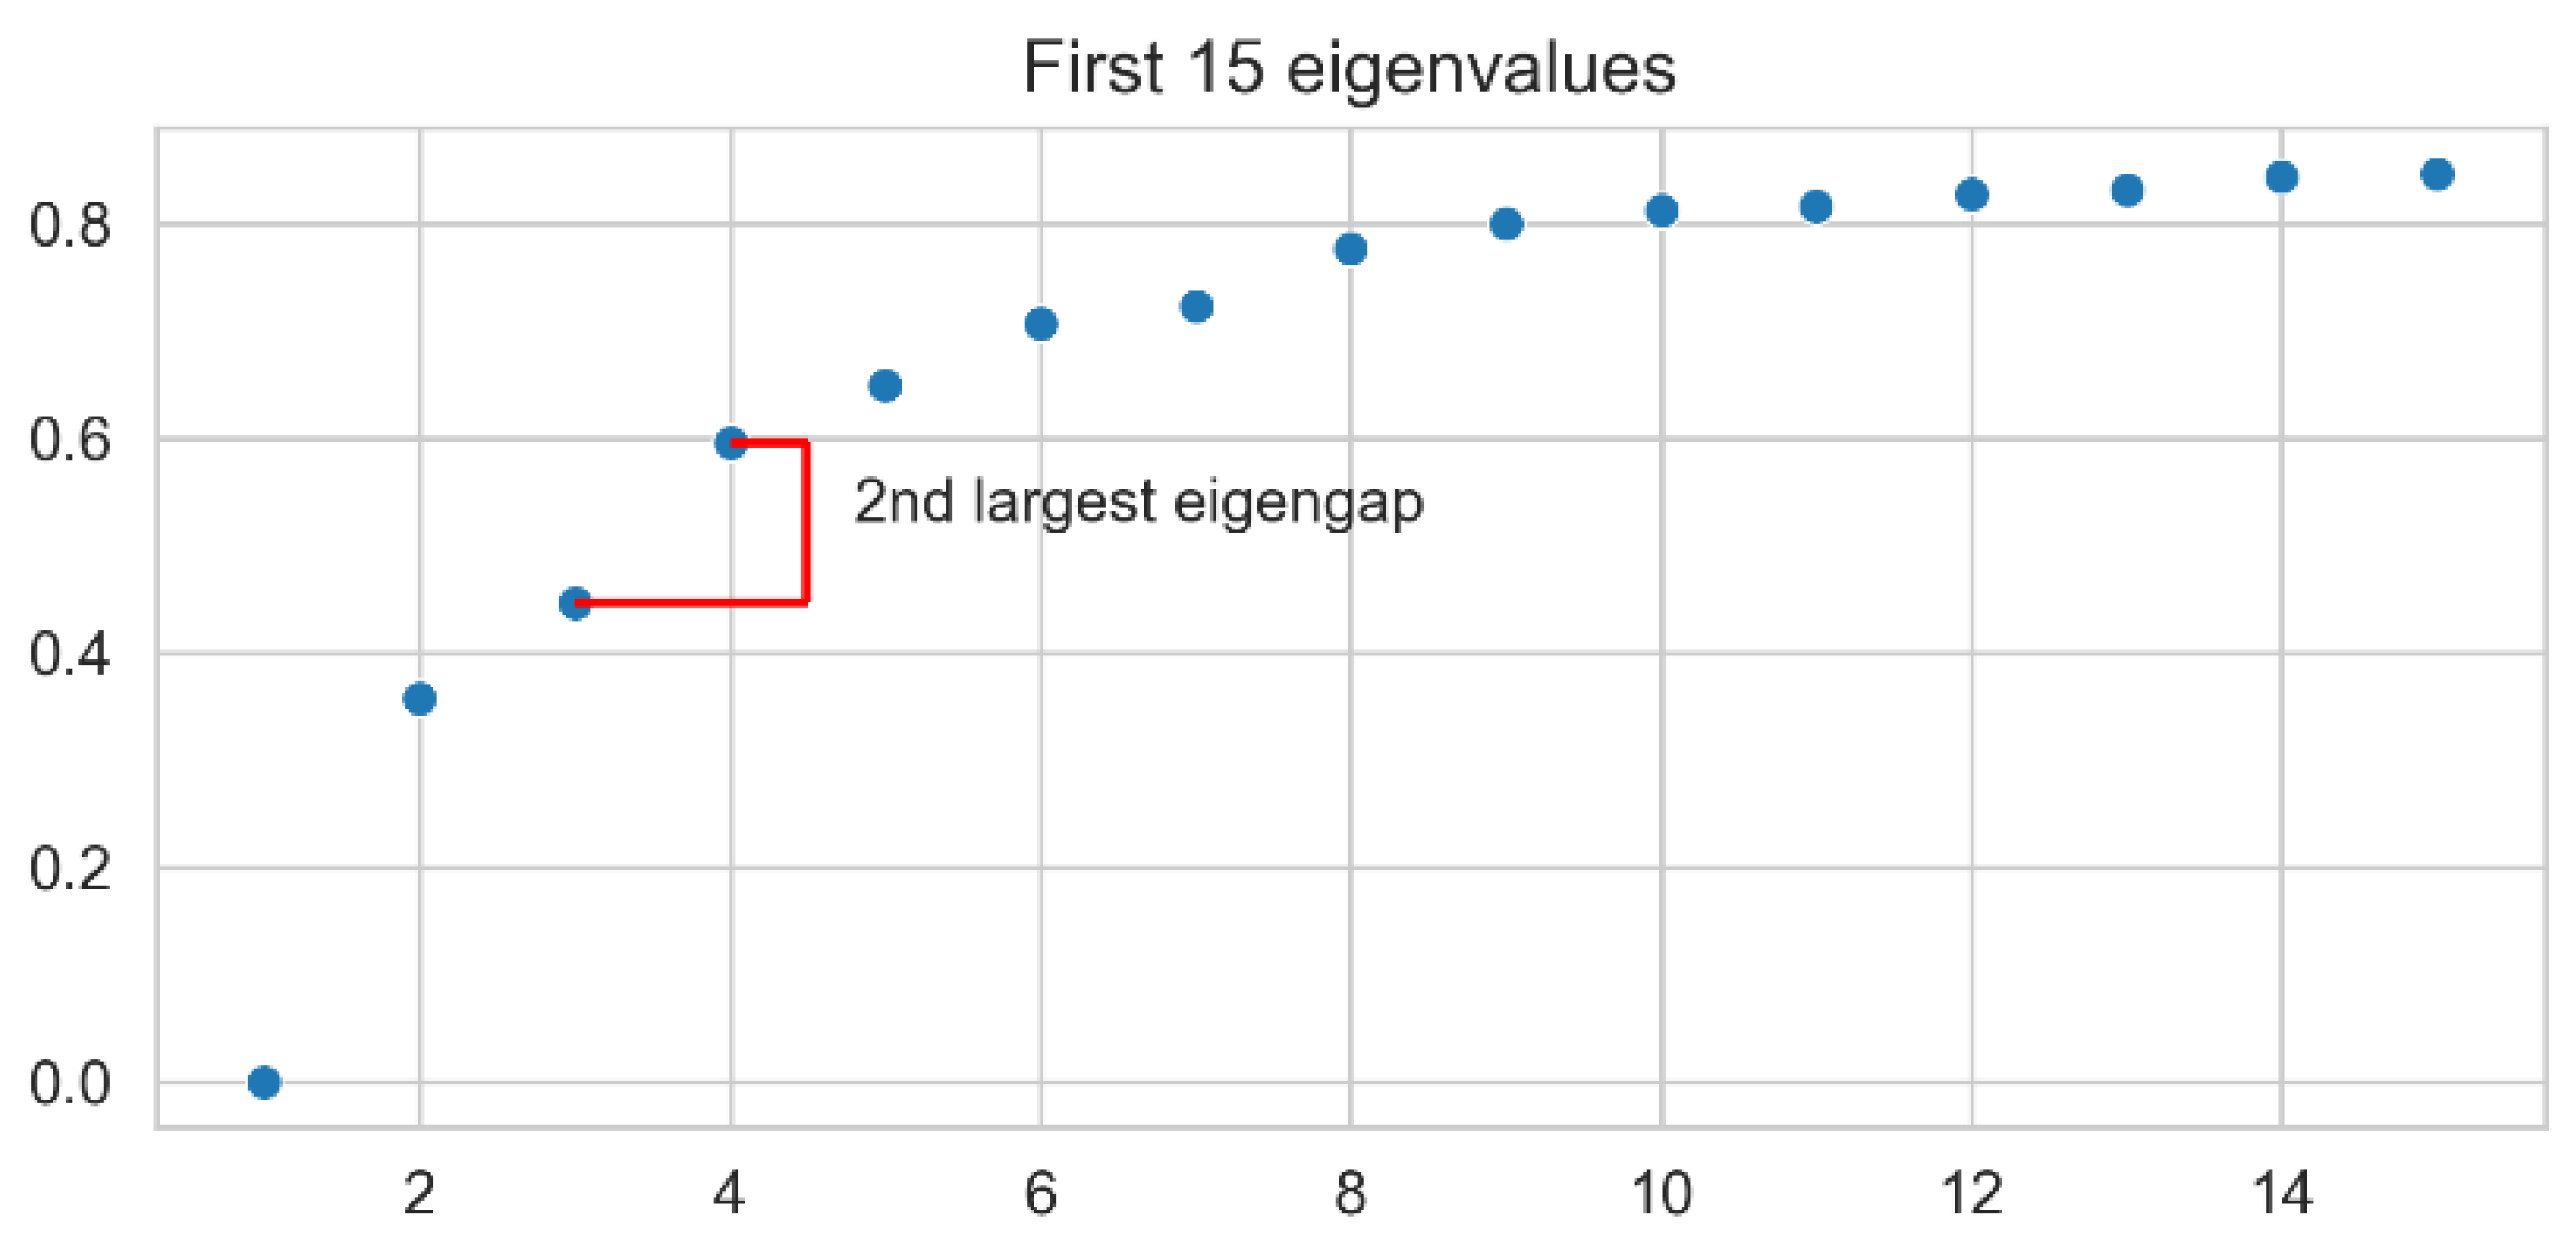
2.12. Spectral Clustering

SC works by considering the dataset as an undirected graph G = { V , E } , where the vertices V represent the data points (the patients), and the edges E are weighted according to similarity between vertices (i.e., the edge connecting two very similar patients a and b has a high weight w a , b ). In this context, the problem of clustering can be defined as finding k partitions (or cuts) A 1 , A 2 ,   ,   A k in the graph such that (1) the edges among partitions have small weights (patients in different clusters are dissimilar), (2) the edges within a partition have high weights (patients within a cluster are similar), and (3) the partitions are of similar sizes (there are no partitions with very few patients, which in general would not be very useful).
This, however, has been proven to be an NP-complete problem, for which SC has been proposed as an approximation obtained by relaxation of some of its constraints [34]. Even if no theoretical guarantees exist regarding the quality of the solution to the SC problem compared to the original NCut, it is still widely used due to the fact that it results in a standard linear algebra problem that can be efficiently solved. As a very short summary, SC works by (a) building a similarity matrix W = ( w i , j ) (we employed the pairwise Gaussian similarity between points with σ = 0.1 , which is a typical choice for data in R n ), (b) constructing a normalized graph Laplacian matrix L r w = I D 1 W , where I is the identity matrix, and D is a diagonal matrix with values d i , i = j V w i , j , (c) getting the eigenvectors associated with the k smallest eigenvalues of L r w (hence the name: Spectral Clustering), and (d) applying k-means clustering over these, and transferring the labels over to the original data points. Although the concept of SC is general and thus any clustering algorithm could be applied, in this work we make use of the most usual choice, which is k-means.
The optimal number of clusters was chosen with the eigengap heuristic, which recommends using the number of clusters for which the eigengap (or gap between consecutive eigenvalues) is maximized [34]. This heuristic is based on the theoretical result that, for a graph with k disconnected clusters, the first k eigenvalues have a value of zero, while the rest have much higher values. Hence, understanding the real clustering problem as a perturbation of some underlying ideal clustering with n clusters, the first n eigenvalues should have very similarly low values, and the rest should be higher. Figure 2 shows the application of this heuristic to our problem, where the first largest eigengap would suggest using a single cluster (which would be of no use), and the second largest eigengap suggests using three (which is the number of clusters that was eventually employed).

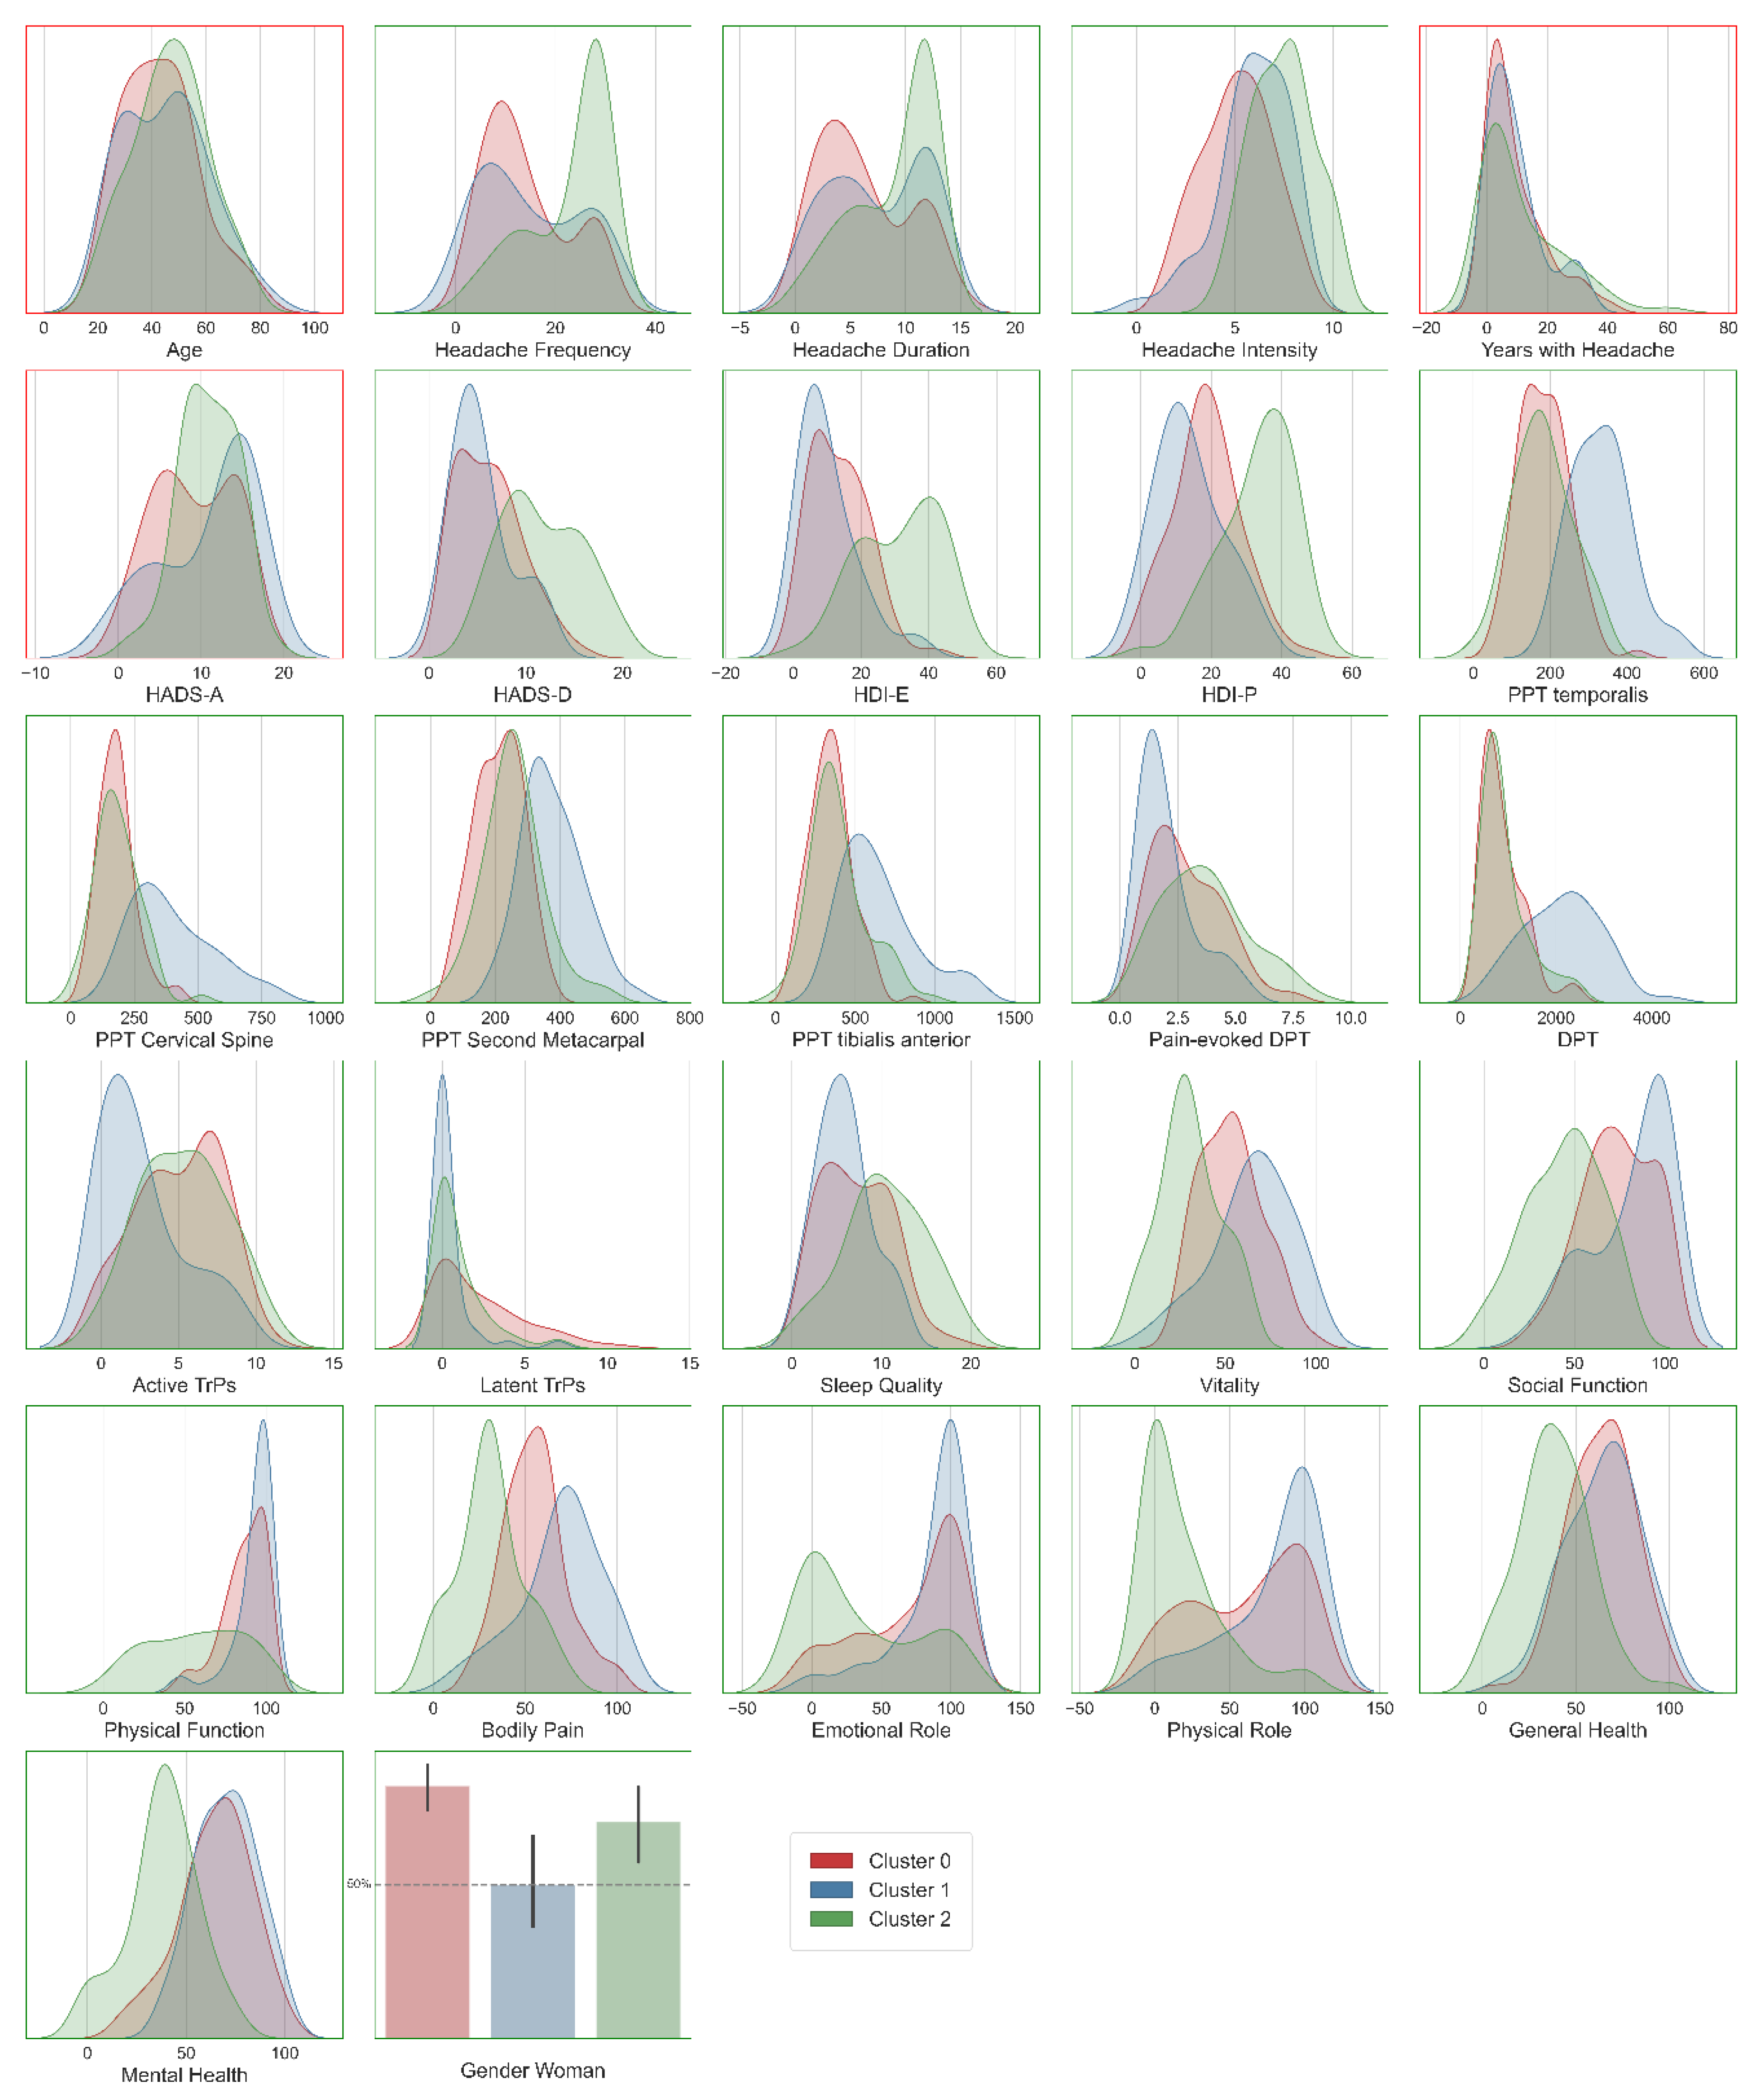
2.13. Statistical Analysis of the Clusters

Once the data was separated into three clusters by means of the SC algorithm, the mean and standard deviation of each feature was determined for each of the clusters, and the one-way ANOVA test (corrected with Holmes-Bonferroni for multiple comparisons) was employed to determine if, within a feature, the distributions of the clusters were significantly different. The one-way ANOVA was calculated by using Python library Scipy (ver. 1.5.2) [36] and the p-values were corrected with Python library statsmodels (ver. 0.11.1) [37].

3. Results

Participants

A total of 235 (n = 235) participants with headache were screened for possible eligibility criteria. Of these, 208 patients (72% women) satisfied all the eligibility criteria, agreed to participate, and signed the written informed consent. The reasons for exclusion were co-morbid migraine (n = 15), fibromyalgia (n = 5), medication overuse headache (n = 4), or previous whiplash (n = 3). A total of 108 (n = 108, 52%) were classified as frequent episodic tension-type headache (FETTH), and 100 (48%) were classified as chronic tension-type headache (CTTH) accordingly to the ICHD-III diagnostic criteria. A total of 60 (42%) were currently taking prophylactic medication intake, i.e., amitriptyline, on a regular basis, but none fulfilled the diagnosis of medication overuse headache.
The SC reveals three clusters with different distributions within the variables as visualized in Figure 3. To further analyze the differences of each cluster, the mean and standard deviation of each feature were computed for each cluster and compared (Table 2). By analyzing Table 2, the three clusters were identified and characterized: the first one (cluster number 2) included patients with high headache frequency (all CTTH) and the other two (clusters number 0 and 1) including individuals with less headache frequency (75% FETTH). In general, individuals of cluster 2 showed higher headache intensity, longer headache duration, more headache-related disability (HDI-P, HDI-E), widespread pressure pain hypersensitivity (lower PPTs and DPTs but higher pain-evoked DPT), worse sleep quality, higher number of active TrPs and lower health-related quality of life (SF-36), but between-cluster differences were heterogeneous.
Clusters 0 and 2 were significantly different for headache intensity, frequency, and duration, HADS-D, HDI-E, HDI-P, sleep quality, and SF-36 scores (all, p < 0.01), but not for psychophysical outcomes such as PPTs and DPTs (all, p > 0.254) and the number of active TrPs: patients within the cluster 2 exhibited worse headache features, higher depression and related-burden, and worse health-related quality of life, but similar widespread pressure pain sensitivity and active TrPs than those within cluster 0.
Patients within cluster 2 showed significantly higher scores for headache frequency, HADS-D, HDI-E, HDI-P, sleep quality, SF-36 scores, widespread pressure pain sensitivity, e.g., PPTs and DPTs, and the number of active TrPs (all, p < 0.01), but similar headache intensity (p = 0.152) and headache duration (p = 0.785) than those within cluster 1.
Finally, participants from clusters 0 and 1 exhibited similar clinical (headache frequency: p = 0.831; intensity: p = 0.770; duration: p = 0.123), psychological (HADS-A: p = 0.956; HADS-D: p = 0.486; HDI-P: p = 0.075; HDI-E: p = 0.265; sleep quality: p = 0.808), and most health-related scores (SF-36 scores, P from 0.266 to 0.789). They differed significantly for sensory psychophysical outcomes, such as widespread PPTs and DPTs (all, p < 0.001) and the number of active TrPs (p = 0.045), bodily pain (p = 0.003): individuals within cluster 0 were similar in all headache-related outcomes, but exhibited higher widespread pressure pain sensitivity (i.e., decreased PPTs and DPTs), higher number of active TrPs and higher bodily pain than those assigned to cluster 1.

4. Discussion

The current study has identified three subgroups of patients with TTH by using, for the first time, the SC algorithm. This analysis identified one cluster including all patients with CTTH (cluster 2) and two clusters including most patients with FETTH (clusters 0 and 1). In general, patients with CTTH (cluster 2) showed worse scores in all outcomes as compared to those with FETTH (clusters 0-1); however, the SC analysis identified a subgroup of patients with FETTH exhibiting widespread pressure pain hypersensitivity (cluster 0) in a similar proportion than those with CTTH (cluster 2).
This study using SC supports the clinical classification commonly used by the International Headache Society establishing 15 days per month as a potential cut-off value for differentiating between CTTH and FETTH [6,14]. In addition, SC analysis also supports the presence of worse clinical presentation and widespread pressure pain hypersensitivity in patients with CTTH (cluster 2) than in those with FETTH (clusters 0 and 1). The presence of widespread sensitivity to pressure pain is a clinical manifestation of central sensitization in CTTH. In fact, a recent meta-analysis concluded that sensitivity to pressure pain seems to be widespread in CTTH and confined to the head and cervical spine in FETTH [38], supporting those findings identified by the current SC analysis.
There is evidence supporting that development of central sensitization is a continuous process related to an increase in the frequency of headache [39]. Interestingly, the current SC analysis found two subgroups of patients with FETTH, one group with less widespread pain sensitivity to pressure pain (cluster 1) and other group (cluster 0) with a similar widespread pain hyperalgesia than CTTH patients (cluster 2). This subclassification could potentially help to identify individuals with FETTH at a higher risk for developing central sensitization and a potentially quicker transition from the episodic to the chronic form of the disease. It is also possible that this subgroup of FETTH patients with higher levels of central sensitization would be more susceptible for developing widespread pain symptoms representing the 35–44% of TTH patients suffering from co-morbid fibromyalgia syndrome [40]. This hypothesis is supported by the presence of widespread symptoms in this group (cluster 0) experienced by lower scores in the bodily pain domain of the health-related quality of life questionnaire [41]. Although the most accepted theories agree that the episodic form is more peripherally related whereas the chronic form is more centrally related [6], SC has been able to identify a group of patients with FETTH exhibiting a more central component (cluster 0) which could be at a higher risk of chronification. Current findings are clinically relevant since identification of this subgroup of individuals with FETTH showing greater sensitization could lead to earlier therapeutic strategies for preventing chronification of the headache.
The fact that one group of patients with FETTH exhibited higher widespread pain sensitization may suggest different mechanisms underlying this subgrouping of the patients. It is accepted that prolonged nociception from peripheral tissues are the main responsible for triggering centralized sensitization mechanisms [42] and, hence, they promote the evolution from episodic to chronic TTH [6]. In this sensitization process, muscle tissues, particularly trigger points, have received particular attention in the last decades [43]. In fact, it has been postulated that the pain referral elicited by active TrPs (those reproducing the headache pain features) could be one of the main responsible of TTH-related pain and sensitization [44]. Interestingly, the SC analysis found that the subgroup of patients with FETTH with sensitization (cluster 0) presented a higher number of active TrPs than those FETTH patients with less sensitization (cluster 1), but, most importantly, in a similar proportion to those with CTTH (cluster 2). These findings support the hypothesis that muscle TrPs could be more relevant in subgroups of patients with TTH rather than in all patients [45]. It is also possible that this subgroup of patients with FETTH exhibits differences in brainstem processing [46], explaining the observed differences; however, this hypothesis should be investigated in future studies.
Current findings have several implications for daily clinical practice. First, early therapeutic interventions for preventing the development of central sensitization should be encouraged in the subgroup of patients with FETTH with higher sensitization (cluster 0). For instance, clinicians should try to identify patients with FETTH exhibiting more active myofascial TrPs, since earlier management of TrPs seems to be relevant for positive outcomes [47]. Second, the SC analysis identified that patients with CTTH (cluster 2) exhibiting higher levels of central sensitization also showed higher anxiety and depressive levels. Since stress is one of the most common trigger and aggravating factors of TTH [48,49], it is possible that this subgroup of patients would be more susceptible to stressful situations and therefore to promoting more hyperalgesia. Consequently, psychological approaches targeting mood disorders should also be implemented in this subgroup of patients. Identification of the subgroup (cluster) to which the patient is assigned could lead to therapeutic approaches better targeting peripheral or central mechanisms.
Although this is the first study investigating a classification system in patients with TTH by using SC analysis, some potential limitations are recognized. First, we recruited our patients from tertiary care hospitals, which could lead to the inclusion of patients with more severe headaches. Therefore, studies including participants recruited from the general population are needed for a better extrapolation of the results. Second, we only tested widespread pressure sensitivity as a feature of central sensitization [38]. It would be interesting to investigate other outcomes of sensitization, e.g., thermal or electrical thresholds, conditioning pain modulation or nociception flexor reflex to further determine the differences between the identified clusters.

5. Conclusions

The application of spectral clustering has identified three subgroups of patients with TTH, one cluster including patients with CTTH (cluster 2) and two clusters including most patients with FETTH (clusters 0 and 1). Patients with CTTH (cluster 2) showed worse scores in all outcomes than those with FETTH (clusters 0–1); however, a subgroup of patients with FETTH exhibited widespread pressure pain hypersensitivity (cluster 0) in a similar proportion than those with CTTH (cluster 2).

Author Contributions

Conceptualization, all authors; Methodology, all authors; Software, O.J.P.-V. and J.D.M.-G.; Validation, all authors; Formal analysis, O.J.P.-V. and J.D.M.-G.; Investigation, all authors; Resources, C.F.-d.-l.-P.; Data curation, O.J.P.-V. and J.D.M.-G.; Writing—original draft preparation, all authors; Writing—review and editing, all authors; Visualization, all authors; Supervision, E.N.-P. and L.L.F.; Project administration, C.F.-d.-l.-P. N/A; Funding acquisition, N/A. All authors have read and agreed to the published version of the manuscript.

Funding

This research received no external funding.

Conflicts of Interest

The authors declare no conflict of interest.

References

  1. GBD 2016 Neurology Collaborators. Global, regional, and national burden of neurological disorders, 1990–2016: A systematic analysis for the Global Burden of Disease Study 2016. Lancet Neurol. 2019, 18, 459–480. [Google Scholar] [CrossRef] [Green Version]
  2. Ferrante, T.; Manzoni, G.C.; Russo, M.; Camarda, C.; Taga, A.; Veronesi, L.; Pasquarella, C.; Sansebastiano, G.; Torelli, P. Prevalence of tension-type headache in adult general population: The PACE study and review of the literature. Neurol. Sci. 2013, 34, 137–138. [Google Scholar] [CrossRef] [Green Version]
  3. Hagen, K.; Stovner, L.J.; Zwart, J.-A. Time trends of major headache diagnoses and predictive factors. Data from three Nord-Trøndelag health surveys. J. Headache Pain 2020, 21, 1–10. [Google Scholar] [CrossRef] [Green Version]
  4. Jensen, R.H. Tension-type headache: The normal and most prevalent headache. Headache 2018, 58, 339–345. [Google Scholar] [CrossRef]
  5. De Tommaso, M.; Fernández-de-las-Peñas, C. Tension type headache. Curr. Rheumatol. Rev. 2016, 12, 127–139. [Google Scholar] [CrossRef]
  6. ICHD-III Headache Classification Subcommittee of the International Headache Society: The International Classification of Headache Disorders, 3rd edition. Cephalalgia 2018, 38, 1–211. [CrossRef]
  7. Arendt-Nielsen, L.; Egsgaard, L.L.; Petersen, K.K.; Eskehave, T.N.; Graven-Nielsen, T.; Hoeck, H.C.; Simonsen, O. A mechanism-based pain sensitivity index to characterize knee osteoarthritis patients with different disease stages and pain levels. Eur. J. Pain 2015, 19, 1406–1417. [Google Scholar] [CrossRef]
  8. Pedler, A.; Sterling, M. Patients with chronic whiplash can be subgrouped on the basis of symptoms of sensory hypersensitivity and posttraumatic stress. Pain 2013, 154, 1640–1648. [Google Scholar] [CrossRef]
  9. Fernández-de-las-Peñas, C.; Benito-González, E.; Palacios-Ceña, M.; Wang, K.; Castaldo, M.; Arendt-Nielsen, L. Identification of subgroups of patients with tension type headache with higher widespread pressure pain hyperalgesia. J. Headache. Pain 2017, 18, 43. [Google Scholar] [CrossRef] [PubMed] [Green Version]
  10. Pérez-Benito, F.J.; Conejero, J.A.; Sáez, C.; García-Gómez, J.M.; Navarro-Pardo, E.; Florencio, L.L.; Fernández-de-Las-Peñas, C. Subgrouping factors influencing migraine intensity in women: A semi-automatic methodology based on machine learning and information geometry. Pain Pract. 2020, 20, 297–309. [Google Scholar] [CrossRef] [PubMed]
  11. Li, Z.; Chen, J. Superpixel segmentation using linear spectral clustering. In Proceedings of the IEEE Conference on Computer Vision and Pattern Recognition (CVPR), Boston, MA, USA, 7–12 June 2015; pp. 1356–1363. [Google Scholar]
  12. Craddock, R.C.; James, G.A.; Holtzheimer, P.E., 3rd; Hu, X.P.; Mayberg, H.S. A whole brain fMRI atlas generated via spatially constrained spectral clustering. Hum. Brain Mapp. 2012, 33, 1914–1928. [Google Scholar] [CrossRef] [PubMed] [Green Version]
  13. Wang, X.; Qian, B.; Davidson, I. On constrained spectral clustering and its applications. Data Min. Knowl. Disc. 2014, 28, 1–30. [Google Scholar] [CrossRef] [Green Version]
  14. Headache Classification Committee of the International Headache Society (IHS). ICHD-III International Classification of Headache Disorders: Headache Classification Subcommittee of the International Headache Society, 3nd edition. Cephalalgia 2013, 33, 629–808. [Google Scholar]
  15. Phillip, D.; Lyngberg, A.C.; Jensen, R. Assessment of headache diagnosis: A comparative population study of a clinical interview with a diagnostic headache diary. Cephalalgia 2007, 27, 1–8. [Google Scholar] [CrossRef] [PubMed]
  16. Jensen, M.P.; Turner, J.A.; Romano, J.M.; Fisher, L. Comparative reliability and validity of chronic pain intensity measures. Pain 1999, 83, 157–162. [Google Scholar] [CrossRef]
  17. Jacobson, G.P.; Ramadan, N.M.; Norris, L.; Newman, C.W. The Henry Ford Hospital Headache Disability Inventory. Neurology 1994, 44, 837–842. [Google Scholar] [CrossRef]
  18. Jacobson, G.P.; Ramadan, N.M.; Norris, L.; Newman, C.W. Headache disability inventory (HDI): Short-term test-retest reliability and spouse perceptions. Headache 1995, 35, 534–539. [Google Scholar] [CrossRef]
  19. Zigmond, A.S.; Snaith, R.P. The Hospital Anxiety and Depression Scale. Acta Psychiatr. Scand. 1983, 67, 361–370. [Google Scholar] [CrossRef] [Green Version]
  20. Juang, K.D.; Wang, S.J.; Lin, C.H.; Fuh, J.L. Use of the Hospital Anxiety and Depression Scale as a screening tool for patients with headache. Zhonghua Yi Xue Za Zhi 1999, 62, 749–755. [Google Scholar]
  21. Ware, J.E.; Sherbourne, C.D. The MOS 36-item short-form health survey (SF-36). Conceptual framework and item selection. Med. Care 1992, 30, 473–483. [Google Scholar] [CrossRef]
  22. McHorney, C.A.; Ware, J.E.; Raczek, A.E. The MOS 36-Item Short-Form Health Survey (SF-36): II. Psychometric and clinical tests of validity in measuring physical and mental health constructs. Med. Care 1993, 31, 247–263. [Google Scholar] [CrossRef] [PubMed] [Green Version]
  23. Cole, J.C.; Dubois, D.; Kosinski, M. Use of patient-reported sleep measures in clinical trials of pain treatment: A literature review and synthesis of current sleep measures and a conceptual model of sleep disturbance in pain. Clin. Ther. 2007, 29, 2580–2588. [Google Scholar] [CrossRef] [PubMed]
  24. Buysse, D.J.; Reynolds, C.F.; Monk, T.H.; Berman, S.R.; Kupfer, D.J. The Pittsburgh Sleep Quality Index: A new instrument for psychiatric practice and research. Psychiatry Res. 1989, 28, 193–213. [Google Scholar] [CrossRef]
  25. Carpenter, J.S.; Andrykowski, M.A. Psychometric evaluation of the Pittsburgh Sleep Quality Index. J. Psychosom. Res. 1998, 45, 5–13. [Google Scholar] [CrossRef]
  26. Palacios-Ceña, M.; Castaldo, M.; Wang, K.; Torelli, P.; Pillastrini, P.; Fernández-de-las-Peñas, C.; Arendt-Nielsen, L. Widespread pressure pain hypersensitivity is similar in women with frequent episodic and chronic tension-type headache: A blinded case-control study. Headache 2017, 57, 217–225. [Google Scholar] [CrossRef]
  27. Nie, H.; Arendt-Nielsen, L.; Andersen, H.; Graven-Nielsen, T. Temporal summation of pain evoked by mechanical stimulation in deep and superficial tissue. J. Pain 2005, 6, 348–355. [Google Scholar] [CrossRef]
  28. Sand, T.; Zwart, J.A.; Helde, G.; Bovim, G. The reproducibility of cephalic pain pressure thresholds in control subjects and headache patients. Cephalalgia 1997, 17, 748–755. [Google Scholar] [CrossRef]
  29. Palacios-Ceña, M.; Wang, K.; Castaldo, M.; Guerrero-Peral, Á.; Caminero, A.B.; Fernández-de-las-Peñas, C.; Arendt-Nielsen, L. Assessment of deep dynamic mechanical sensitivity in individuals with tension-type headache: The dynamic pressure algometry. Eur. J. Pain 2017, 21, 1451–1460. [Google Scholar] [CrossRef]
  30. Finocchietti, S.; Graven-Nielsen, T.; Arendt-Nielsen, L. Dynamic mechanical assessment of muscle hyperalgesia in humans: The dynamic algometer. Pain. Res. Manag. 2015, 20, 29–34. [Google Scholar] [CrossRef]
  31. Simons, D.G.; Travell, J.G.; Simons, L. Myofascial Pain and Dysfunction. The Trigger Point Manual, 3rd ed.; Wolters Kluwer: Philadelphia, PA, USA, 2019. [Google Scholar]
  32. Fernandez-de-las-Peñas, C.; Dommerholt, J. International consensus on diagnostic criteria and clinical considerations of myofascial trigger points: A Delphi Study. Pain. Med. 2018, 19, 142–150. [Google Scholar] [CrossRef] [Green Version]
  33. Pedregosa, F.; Varoquaux, G.; Gramfort, A.; Michel, V.; Thirion, B.; Grisel, O.; Blondel, M.; Prettenhofer, P.; Weiss, R.; Dubourg, V.; et al. Scikit-learn: Machine Learning in Python. J. Mach. Learn Res. 2011, 12, 2825–2830. [Google Scholar]
  34. Luxburg, U.V. A tutorial on spectral clustering. Stat. Comput. 2007, 17, 395–416. [Google Scholar] [CrossRef]
  35. Arbelaitz, O.; Gurrutxaga, J.; Muguerza, J.; Pérez, J.M.; Perona, I. An extensive comparative study of cluster validity indices. Pattern Recognit. 2013, 46, 243–256. [Google Scholar] [CrossRef]
  36. Virtanen, P.; Gommers, R.; Oliphant, T.E.; Haberland, M.; Reddy, T.; Cournapeau, D.; Burovski, E.; Peterson, P.; Weckesser, W.; Bright, J.; et al. SciPy 1.0: Fundamental algorithms for scientific computing in Python. Nat. Methods 2020, 17, 261–272. [Google Scholar] [CrossRef] [Green Version]
  37. Skipper, S.; Perktold, J. Stats models: Econometric and statistical modeling with python. In Proceedings of the 9th Python in Science Conference, Austin, TX, USA, June 28–July 3 2010. [Google Scholar]
  38. Fernández-de-las-Peñas, C.; Plaza-Manzano, G.; Navarro-Santana, M.J.; Olesen, J.; Jensen, R.H.; Bendtsen, L. Evidence of localized and widespread pressure pain hypersensitivity in patients with tension-type headache: A systematic review and meta-analysis. Cephalalgia 2020, 333102420958384. [Google Scholar] [CrossRef]
  39. Buchgreitz, L.; Lyngberg, A.C.; Bendtsen, L.; Jensen, R. Frequency of headache is related to sensitization: A population study. Pain 2006, 123, 19–27. [Google Scholar] [CrossRef]
  40. de Tommaso, M.; Sardaro, M.; Serpino, C.; Costantini, F.; Vecchio, F.; Prudenzano, M.P.; Lamberti, P.; Livrea, P. Fibromyalgia Comorbidity in Primary Headaches. Cephalalgia 2009, 29, 453–464. [Google Scholar] [CrossRef]
  41. de Tommaso, M.; Federici, A.; Serpino, C.; Vecchio, E.; Franco, G.; Sardaro, M.; Delussi, M.; Livrea, P. Clinical features of headache patients with fibromyalgia comorbidity. J. Headache Pain 2011, 12, 629–638. [Google Scholar] [CrossRef] [Green Version]
  42. Woolf, C.J. Central sensitization: Implications for the diagnosis and treatment of pain. Pain 2011, 152, S2–S15. [Google Scholar] [CrossRef]
  43. Fernández-de-las-Peñas, C.; Arendt-Nielsen, L. Improving understanding of trigger points and widespread pressure pain sensitivity in tension-type headache patients: Clinical implications. Expert Rev. Neurother. 2017, 17, 933–939. [Google Scholar] [CrossRef]
  44. Fernández-de-las-Peñas, C.; Cuadrado, M.L.; Arendt-Nielsen, L.; Simons, D.G.; Pareja, J.A. Myofascial trigger points and sensitization: An updated pain model for tension-type headache. Cephalalgia 2007, 27, 383–393. [Google Scholar] [CrossRef] [PubMed]
  45. Arendt-Nielsen, L.; Castaldo, M.; Mechelli, F.; Fernández-de-las-Peñas, C. Muscle triggers as a possible source of pain in a subgroup of tension-type headache patients? Clin. J. Pain 2016, 32, 711–718. [Google Scholar] [CrossRef] [PubMed]
  46. Wang, P.; Du, H.; Chen, N.; Guo, J.; Gong, Q.; Zhang, J.; He, L. Regional homogeneity abnormalities in patients with tension-type headache: A resting-state fMRI study. Neurosci. Bull. 2014, 30, 949–955. [Google Scholar] [CrossRef] [PubMed] [Green Version]
  47. Fernández-de-las-Peñas, C.; Cuadrado, M.L. Physical therapy for headaches. Cephalalgia 2016, 36, 1134–1142. [Google Scholar] [CrossRef]
  48. Cathcart, S.; Petkov, J.; Winefield, A.H.; Lushington, K.; Rolan, P. Central mechanisms of stress-induced headache. Cephalalgia 2010, 30, 285–295. [Google Scholar] [CrossRef]
  49. Cathcart, S.; Winefield, A.; Lushington, K.; Rolan, P. Stress and tension-type headache mechanisms. Cephalalgia 2010, 30, 1250–1267. [Google Scholar] [CrossRef]
Figure 1. Comparison of three clustering algorithms on six different two-dimensional datasets. Points of the same color have been assigned to the same cluster by the algorithm (modified from [33]).
Applsci 10 09109 g001
Figure 2. Plot of the first 15 eigenvalues, and application of the eigengap heuristic to select the optimal number of clusters.
Applsci 10 09109 g002
Figure 3. Plots of the distribution of the features for each of the three clusters. Gender feature has been represented as a bar plot at the end. The outline of each plot represents whether the corrected one-way ANOVA test was significant (green) or not (red) for that feature.
Applsci 10 09109 g003
Table 1. Summary statistics for the dataset (n = 208).
MEANSDMIN25%50%75%MAXMISSING
Age (years)44.714.418.033.045.053.583.00.5%
Headache frequency (days/month)16.89.451.08.016.028.030.02.4%
Headache duration (hours/attack)7.44.350.53.56.8512.024.07.7%
Headache intensity (nprs 0–10)6.12.650.05.06.07.631.00.0%
Years with headache10.311.250.02.05.515.060.03.85%
HADS-A (0–21)9.94.70.06.010.014.019.018.75%
HADS-D (0–21)7.94.451.04.07.011.020.018.75%
HDI-E (0–52)19.113.20.08.016.026.052.018.75%
HDI-P (0–48)22.812.30.014.022.032.052.018.75%
PPT temporalis (kpa)213.394.50.0140.9201.75267.0537.00.0%
PPT cervical spine (kpa)227.9136.60.0139.25193.5273.75784.00.0%
PPT second metacarpal (kpa)258.7105.90.0179.9253.0320.0629.50.0%
PPT tibialis anterior (kpa)423.65211.30.0296.9381.75512.61233.00.0%
Pain-evoked DPT (nprs, 0–10)2.951.70.51.52.54.08.53.85%
DPT (grammes)1170.4756.8450.0600.0850.01450.04325.03.85%
Active TrPs4.63.00.02.05.07.011.01.4%
Latent TrPs1.52.30.00.00.02.011.01.4%
Sleep quality (0–21)8.04.40.04.08.011.020.010.1%
Vitality (0–100)48.5522.30.030.050.065.0100.01.0%
Social function (0–100)66.325.40.050.063.088.0100.01.0%
Physical function (0–100)78.924.20.070.085.0100.0100.01.0%
Bodily pain (0–100)50.623.30.032.051.062.0100.01.0%
Emotional role (0–100)62.740.80.033.067.0100.0100.01.0%
Physical role (0–100)51.540.20.00.050.0100.0100.01.0%
General health (0–100)56.122.20.040.057.072.0100.01.0%
Mental health (0–100)57.722.10.040.060.076.0100.01.4%
HADS: Hospital Anxiety and Depression Scale; HDI: Headache Disability Inventory; PPT: Pressure Pain Thresholds; DPT: Dynamic Pressure Thresholds; NPRS: Numerical Pain Rate Scale.
Table 2. Mean and standard deviation of the outcomes according to each cluster.
Cluster 0 (n = 102)Cluster 1 (n = 42)Cluster 2 (n = 61)p-Value
Age (years)43.4 ± 14.244.95 ± 15.8546.75 ± 13.80.6997
Headache frequency (days/month)14.2 ± 8.4515.0 ± 10.022.6 ± 8.2<0.001
Headache duration (hours/attack)6.3 ± 4.17.5 ± 4.39.0 ± 3.7<0.01
Headache intensity (NPRS, 0–10)5.1 ± 18.85.9 ± 1.857.4 ± 1.55<0.001
Years with headache9.4 ± 9.79.3 ± 9.111.6 ± 13.450.6997
HADS-A (0–21)9.1 ± 4.910.8 ± 5.710.9 ± 3.60.161
HADS-D (0–21)6.25 ± 3.45.45 ± 3.111.7 ± 4.15<0.001
HDI-E (0–52)13.7 ± 8.7510.2 ± 8.831.2 ± 12.2<0.001
HDI-P (0–48)18.7 ± 9.613.8 ± 9.533.15 ± 10.5<0.001
PPT temporalis (kPa)183.9 ± 65.35334.5 ± 77.9180.56 ± 77.1<0.001
PPT cervical spine (kPa)181.1 ± 74.25406.35 ± 161.7183.1 ± 89.35<0.001
PPT second metacarpal (kPa)212.65 ± 73.45378.0 ± 92.2255.5 ± 96.85<0.001
PPT tibialis anterior (kPa)347.7 ± 135.2654.1 ± 238.3395.45 ± 182.1<0.001
Pain-evoked DPT (NPRS, 0–10)2.9 ± 1.552.0 ± 1.253.7 ± 1.9<0.001
DPT (grammes)902.0 ± 467.62146.4 ± 818.8933.3 ± 504.95<0.001
Active TrPs5.0 ± 2.82.7 ± 2.85.3 ± 2.8<0.001
Latent TrPs2.2 ± 2.70.4 ± 1.31.0 ± 1.65<0.001
Sleep Quality (0–100)7.2 ± 3.955.85 ± 3.0510.4 ± 4.6<0.001
Vitality (0–100)53.6 ± 17.4564.05 ± 22.730.3 ± 16.7<0.001
Social Function (0–100)74.15 ± 19.880.7 ± 22.444.15 ± 20.85<0.001
Physical Function (0–100)86.2 ± 13.7593.2 ± 12.3557.0 ± 29.1<0.001
Bodily Pain (0–100)55.3 ± 16.9569.0 ± 23.130.8 ± 18.25<0.001
Emotional Role (0–100)70.6 ± 36.485.45 ± 27.835.1 ± 40.6<0.001
Physical Role (0–100)60.4 ± 36.4578.65 ± 32.418.45 ± 27.35<0.001
General Health (0–100)63.6 ± 18.064.2 ± 20.138.45 ± 19.55<0.001
Mental Health (0–100)64.9 ± 18.670.0 ± 15.437.9 ± 17.9<0.001
HADS: Hospital Anxiety and Depression Scale; HDI: Headache Disability Inventory; PPT: Pressure Pain Thresholds; DPT: Dynamic Pressure Thresholds; NPRS: Numerical Pain Rate Scale.
Publisher’s Note: MDPI stays neutral with regard to jurisdictional claims in published maps and institutional affiliations.

