Correlation between LAA Morphological Features and Computational Fluid Dynamics Analysis for Non-Valvular Atrial Fibrillation Patients

 , , and
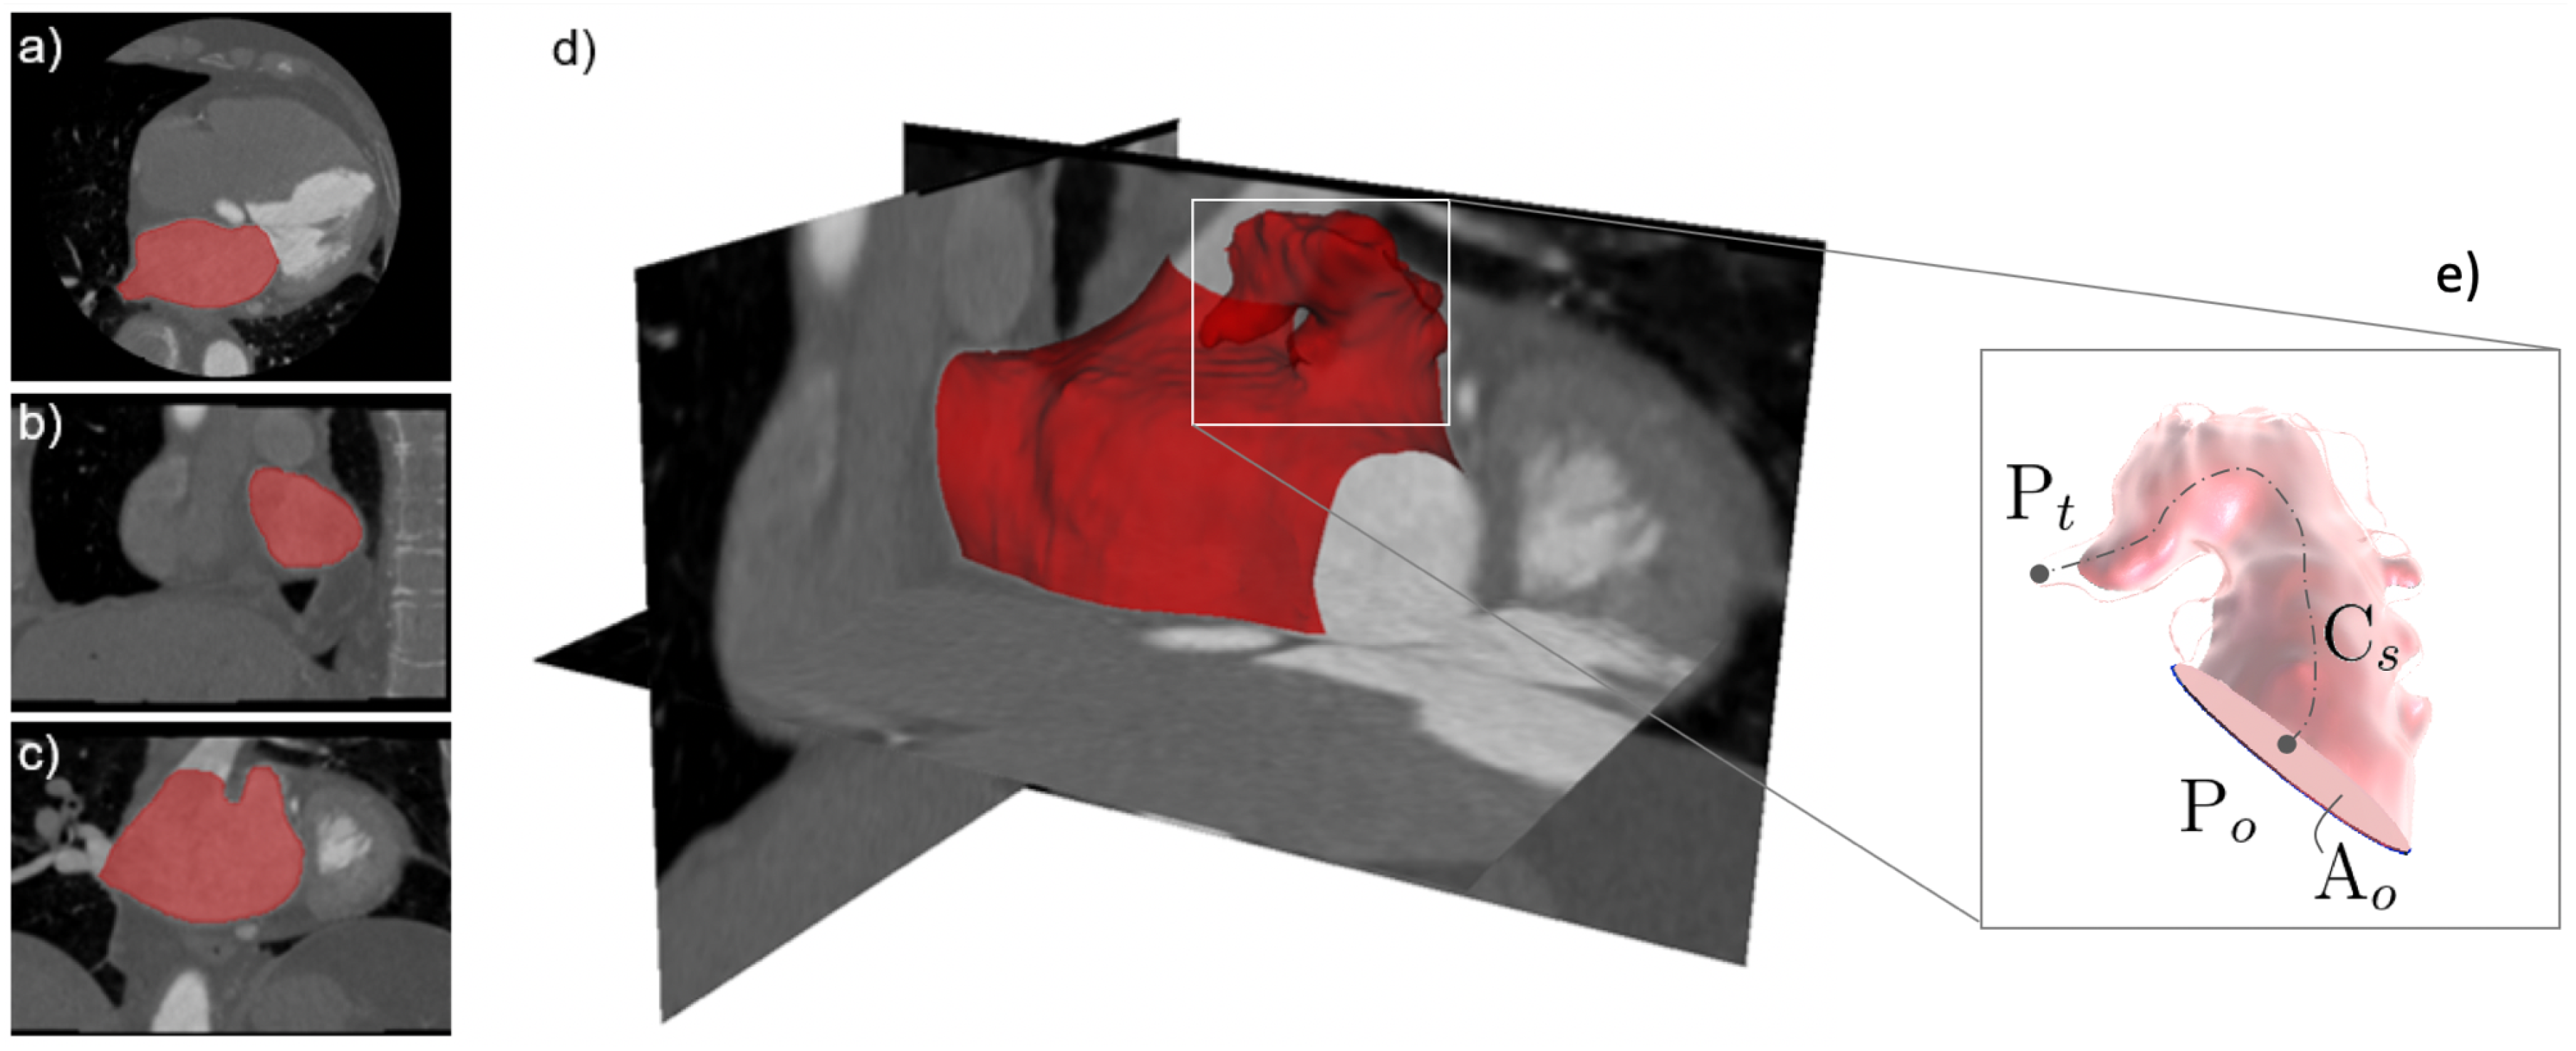
Abstract
:1. Introduction
2. Material and Methods
2.1. Image Acquisition
2.2. Image and Morphological Analysis
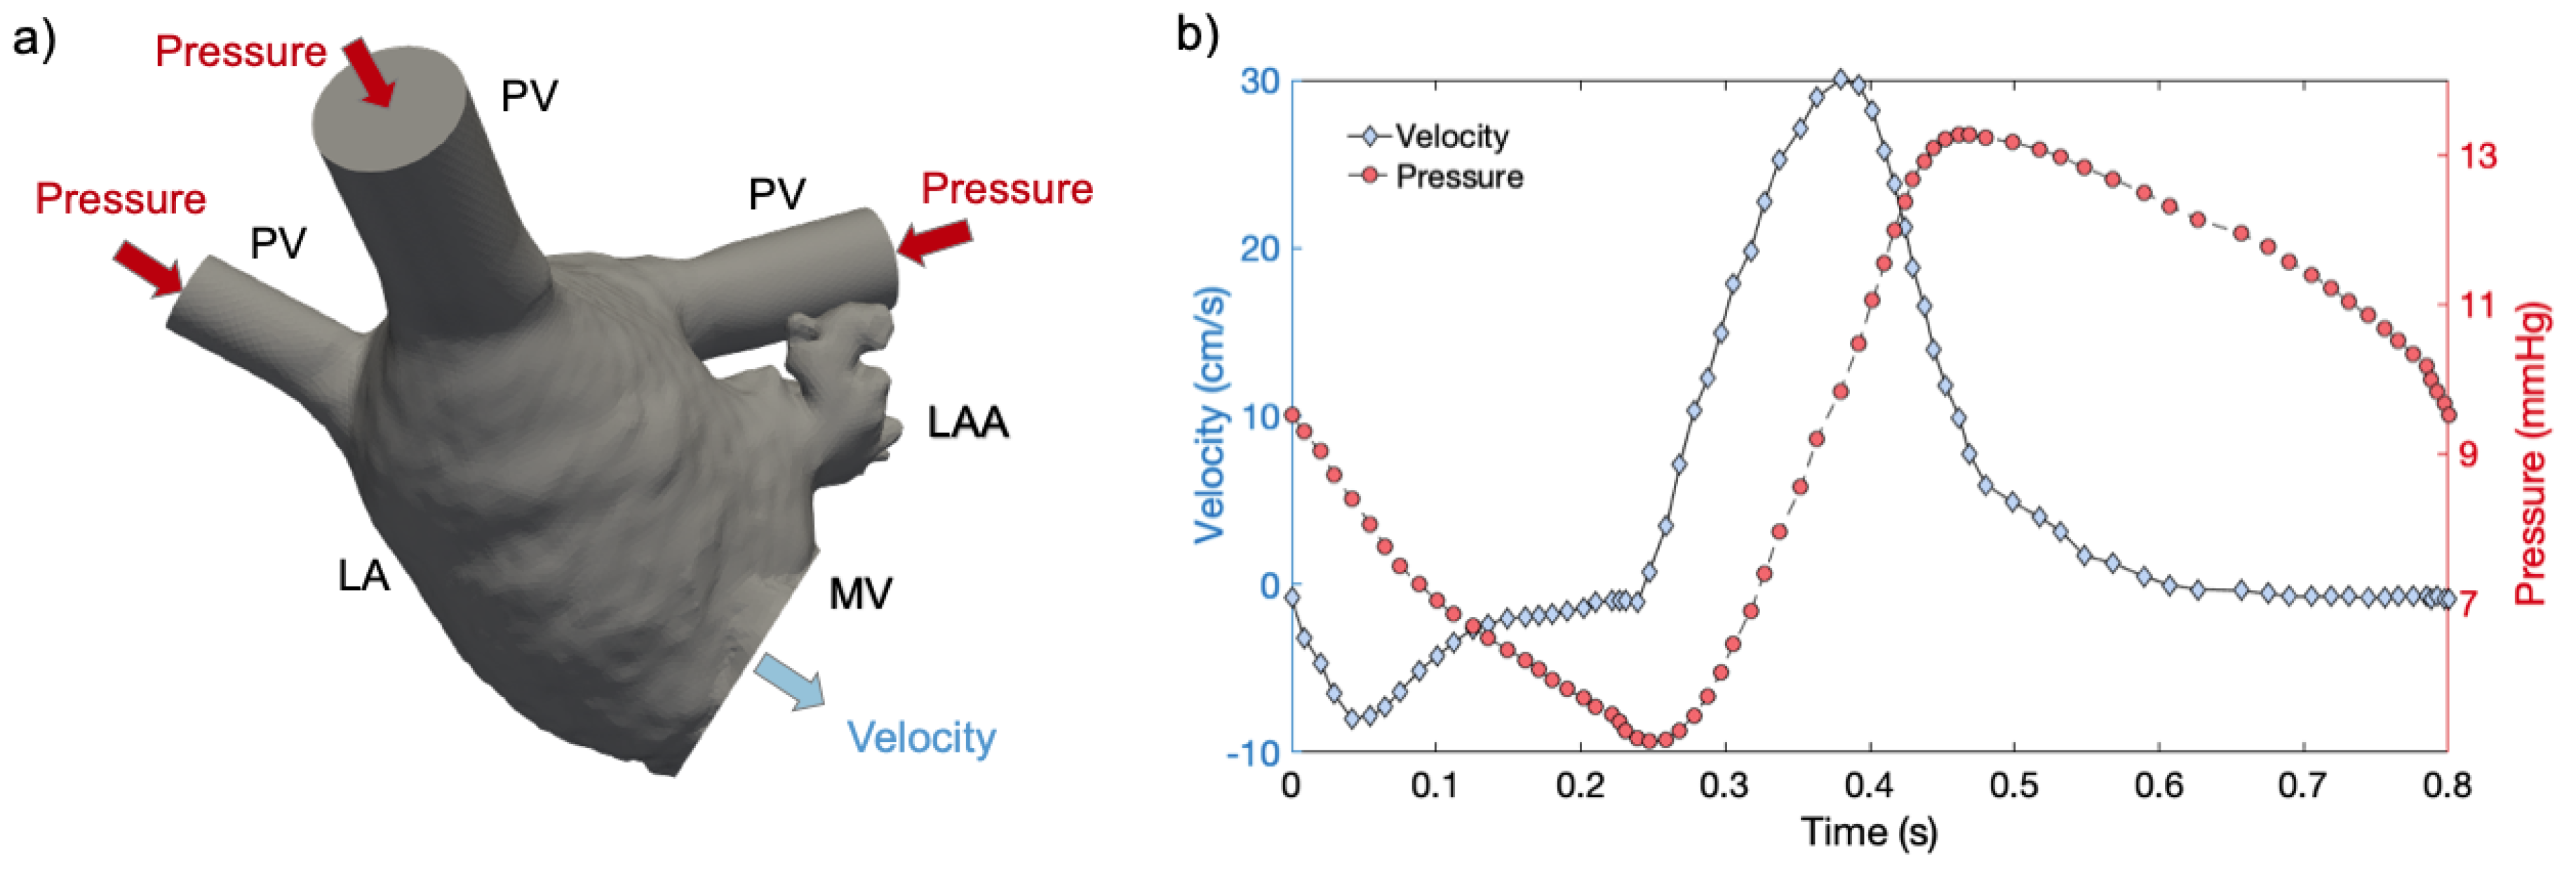
2.3. Numerical Simulations
3. Results
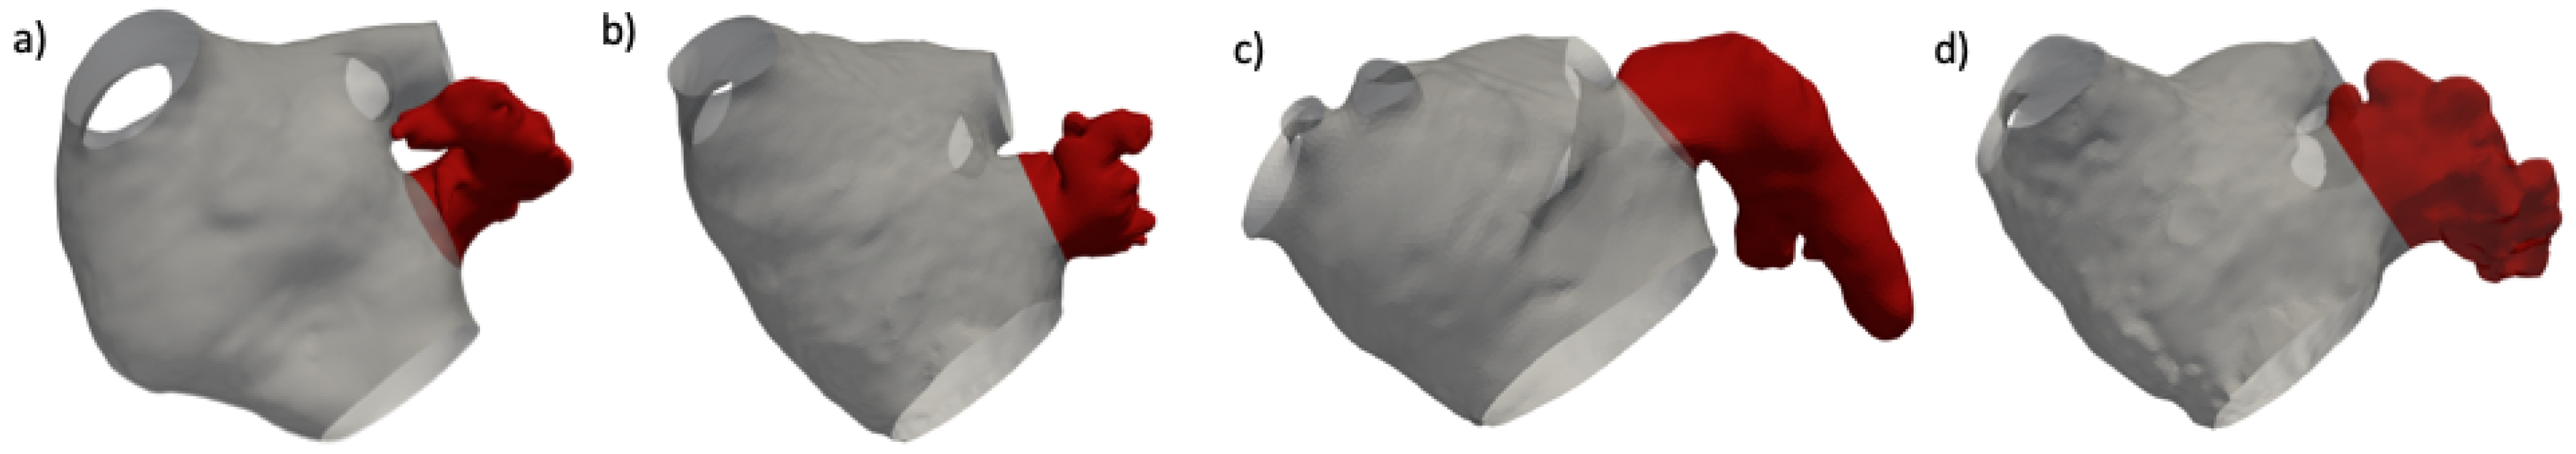
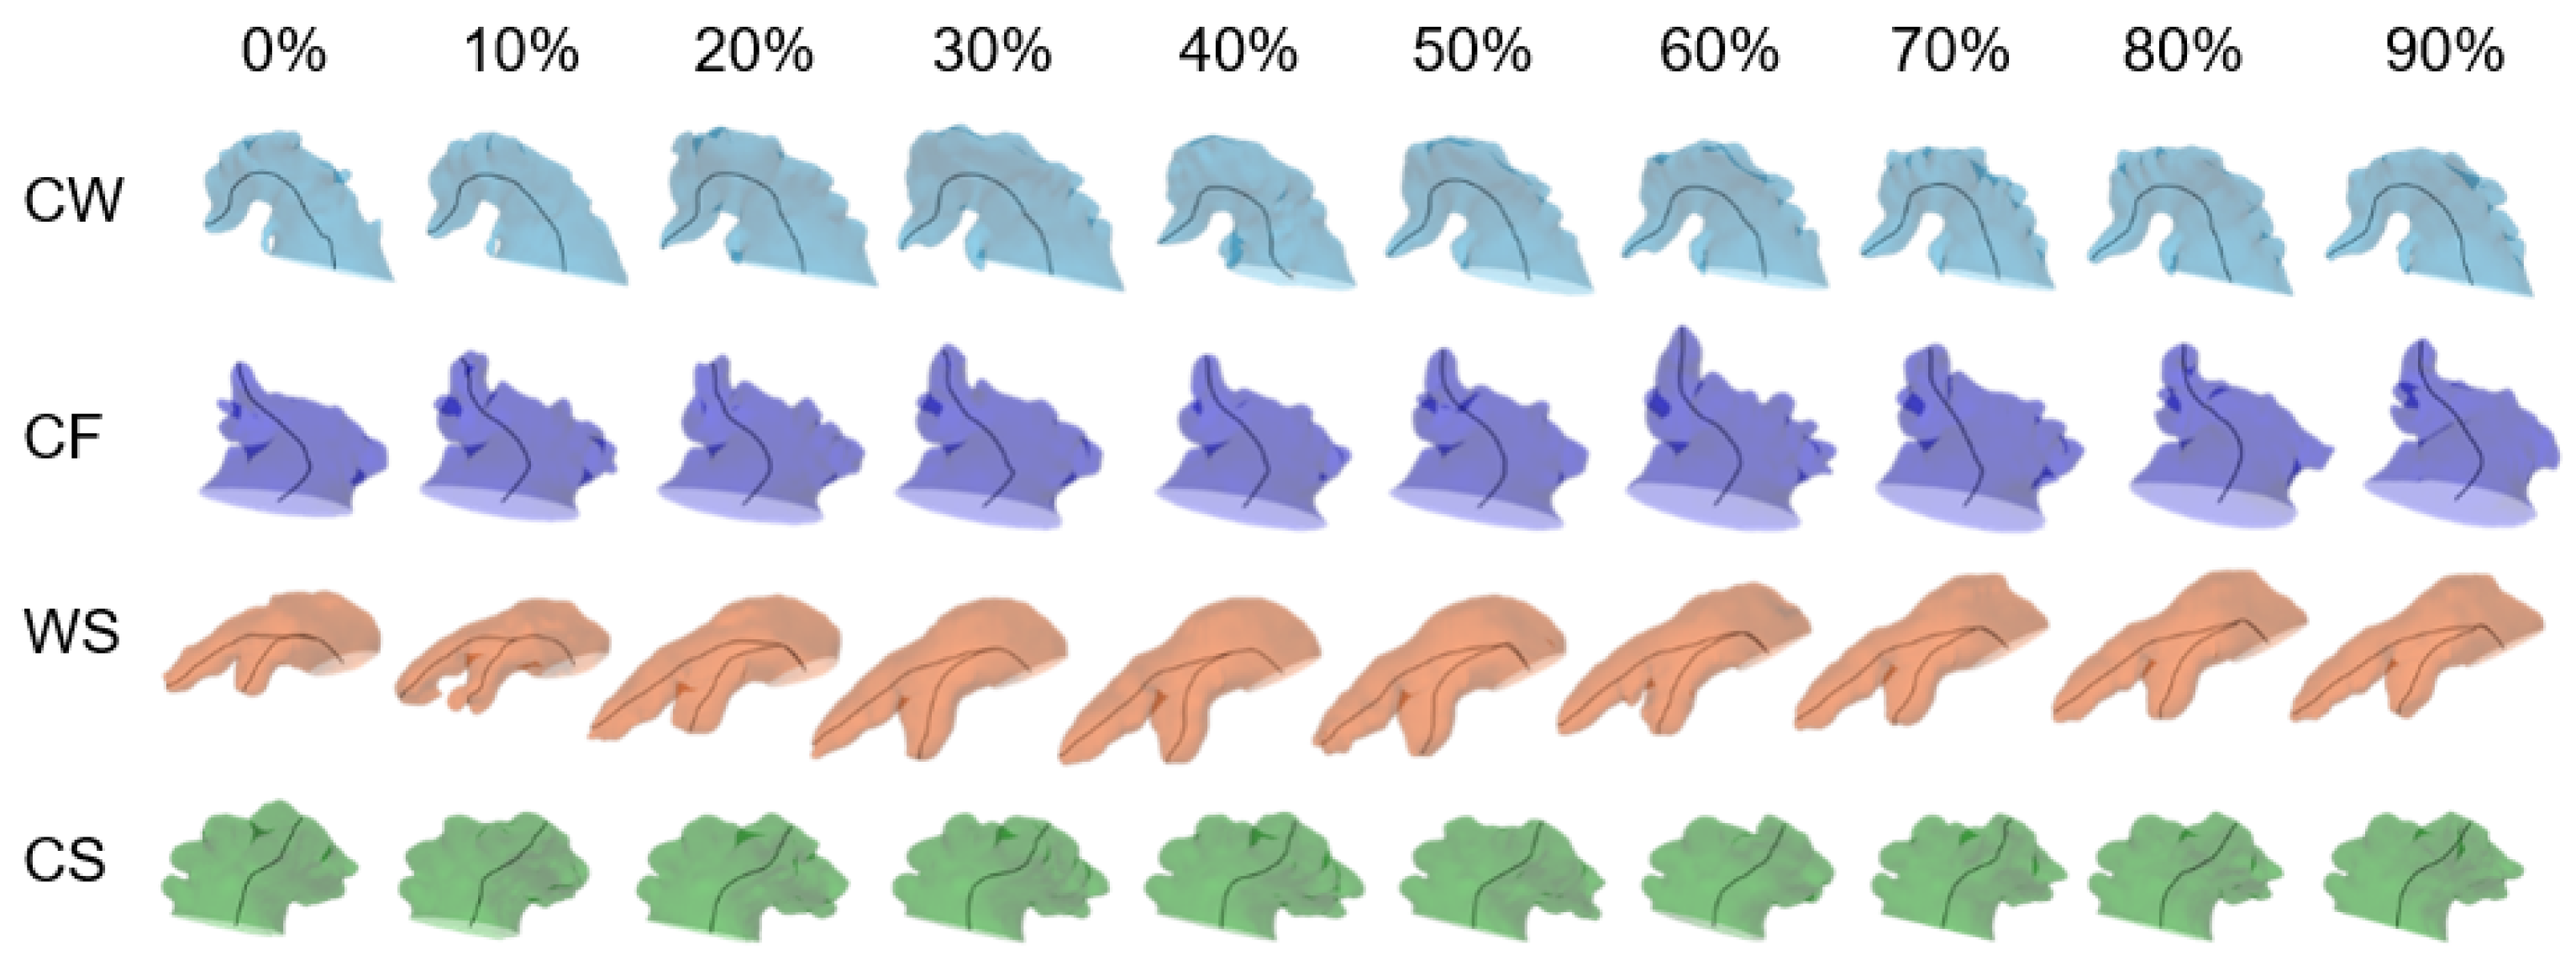
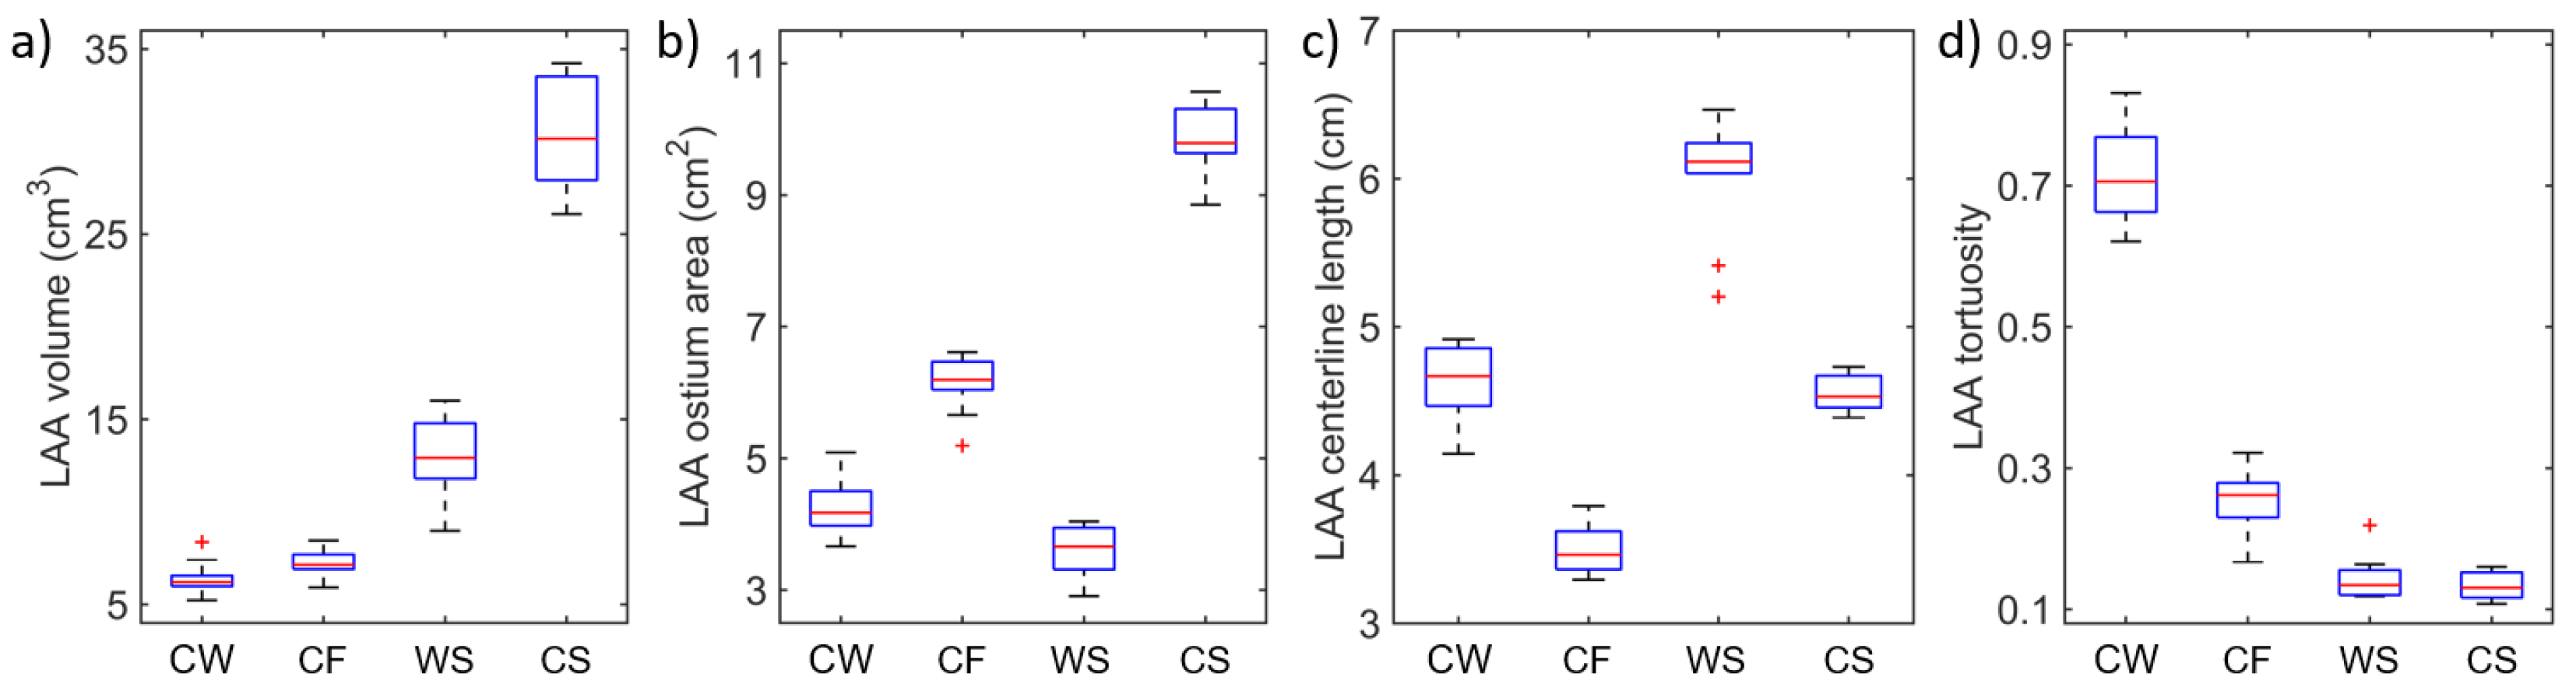
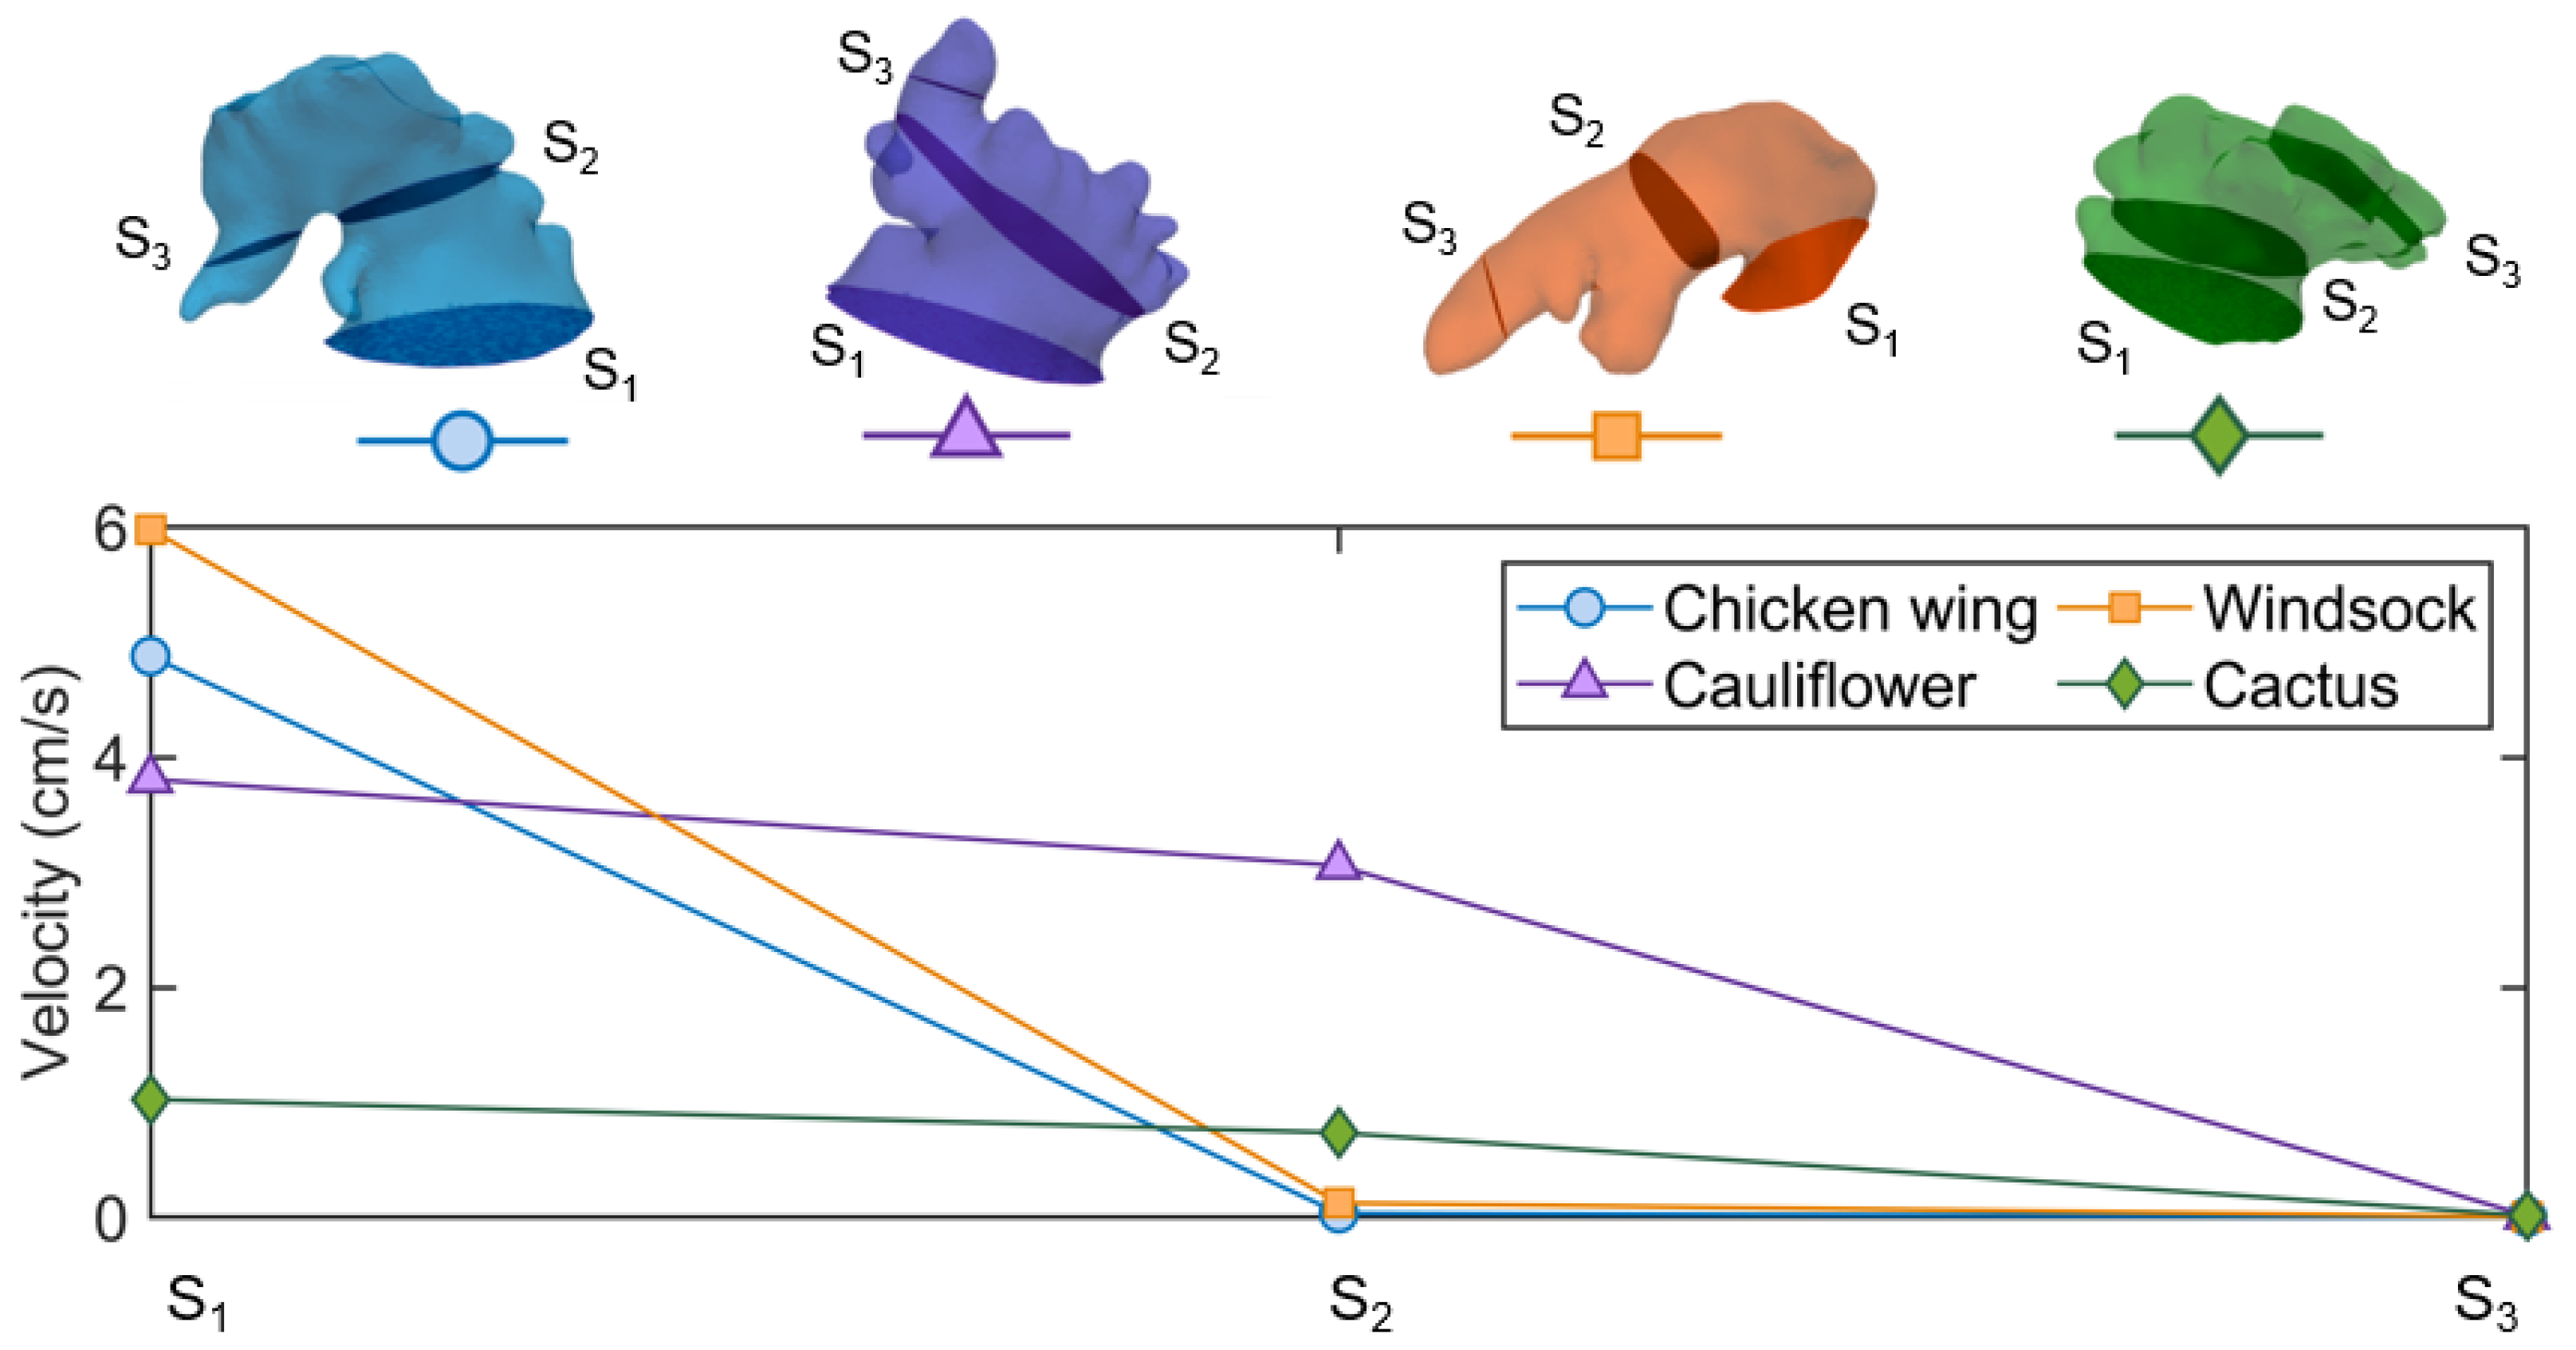
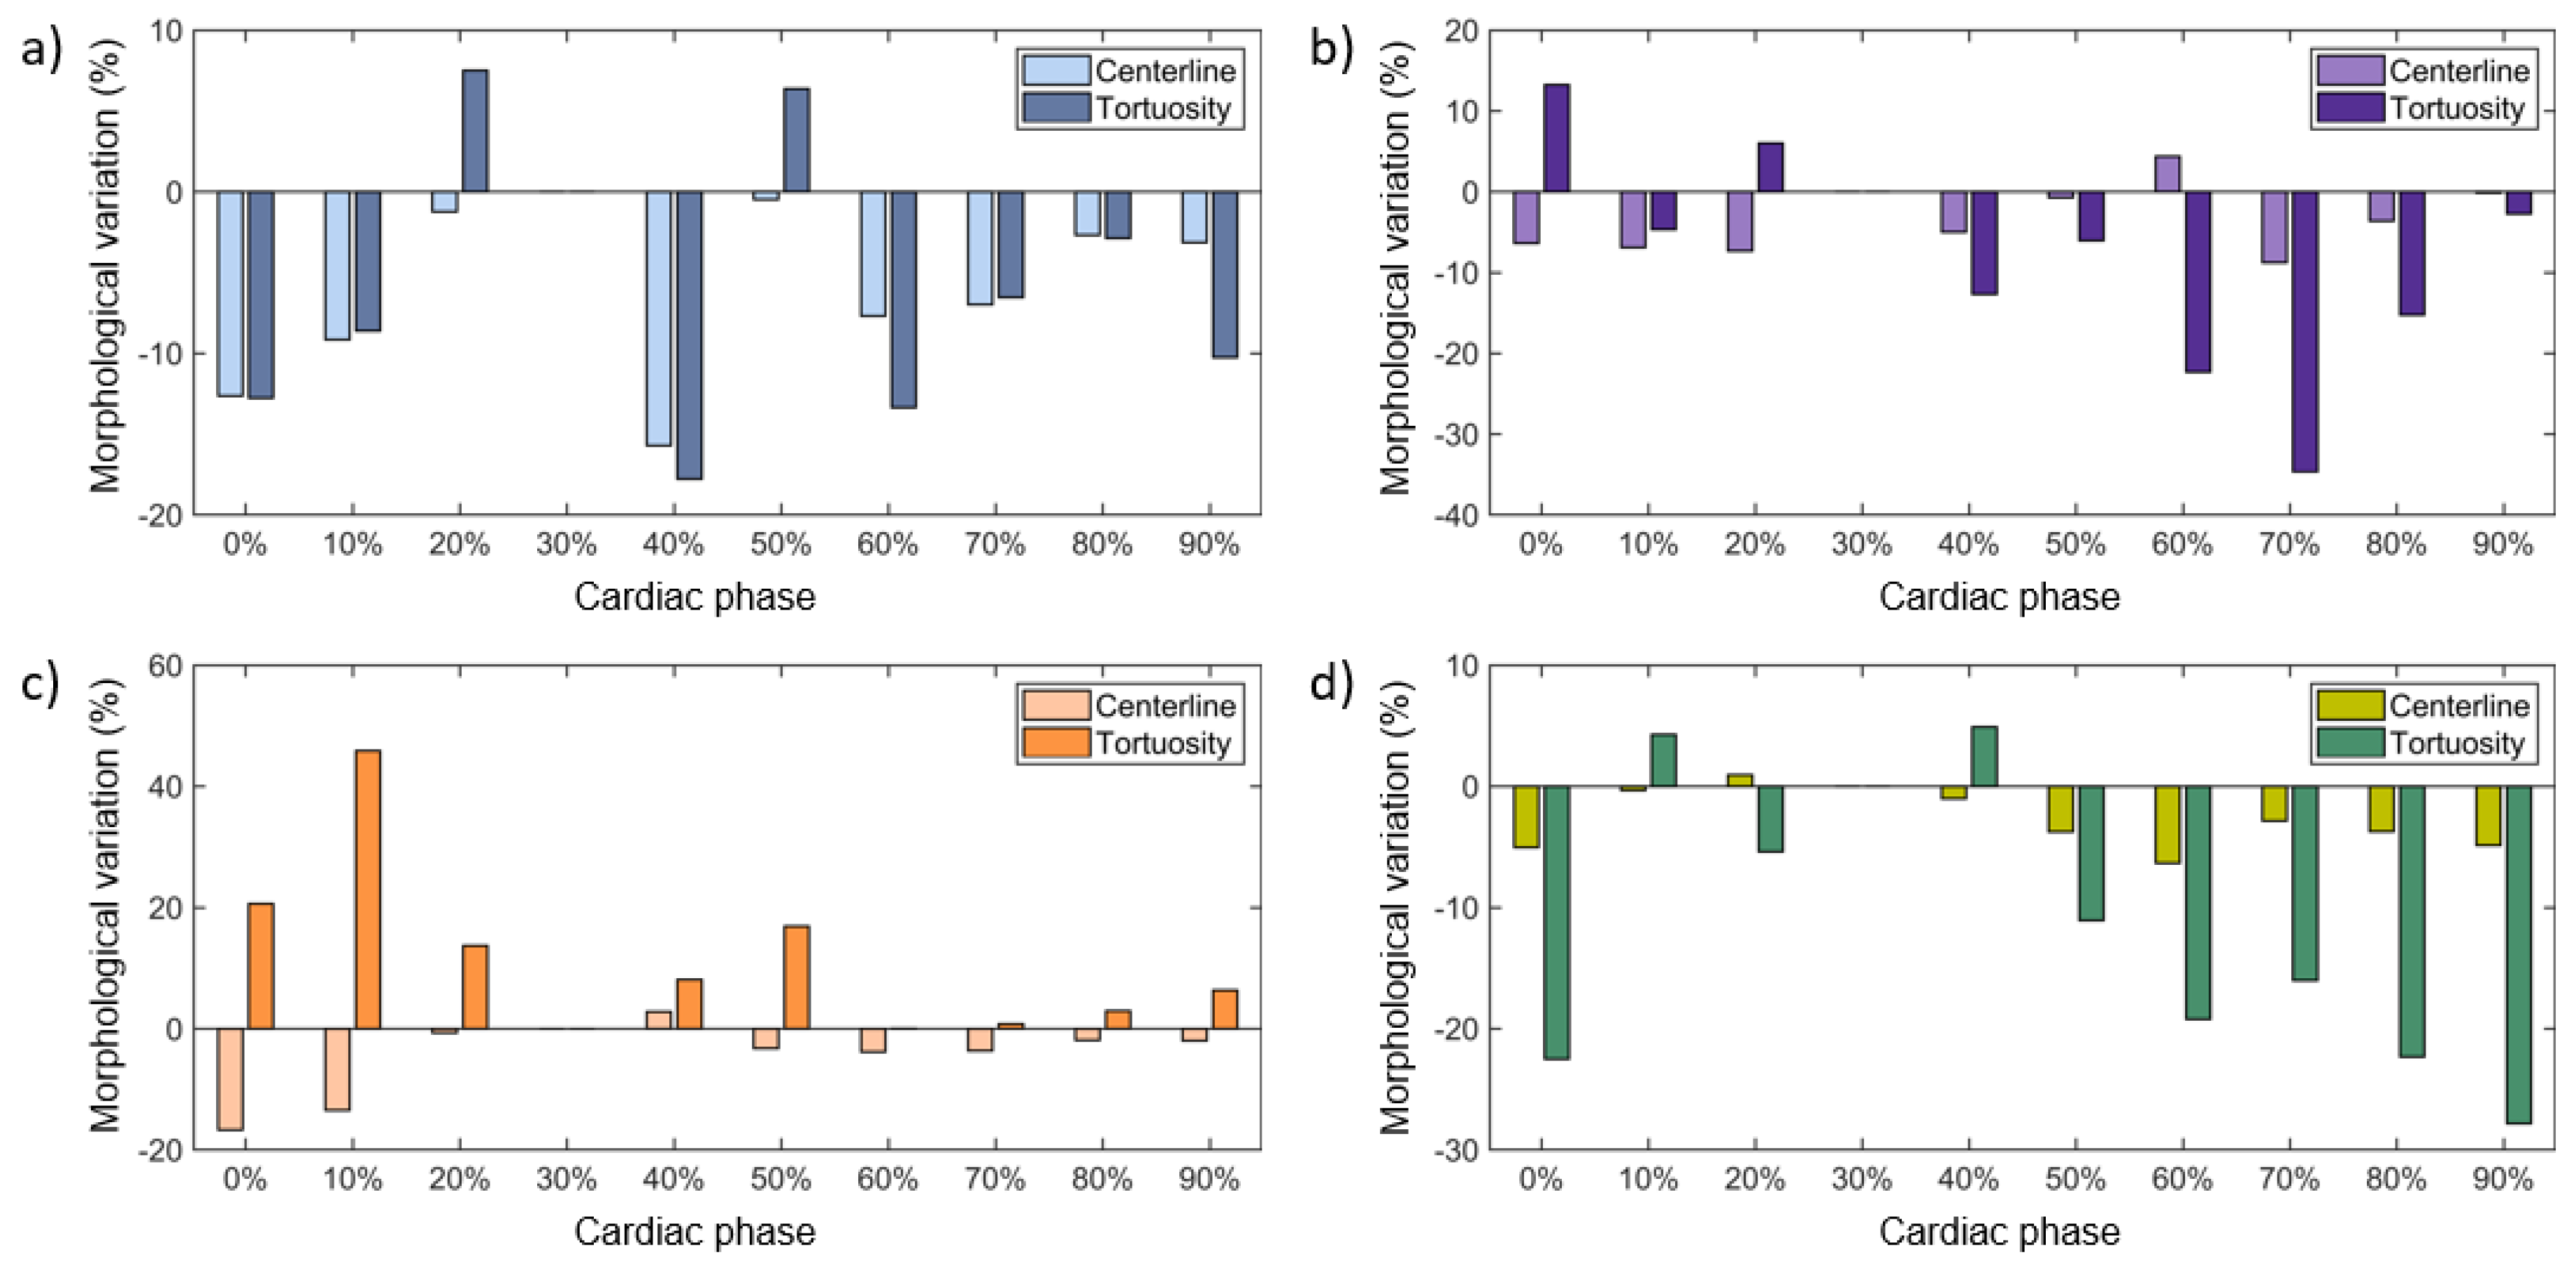
3.1. Image and Morphological Analysis
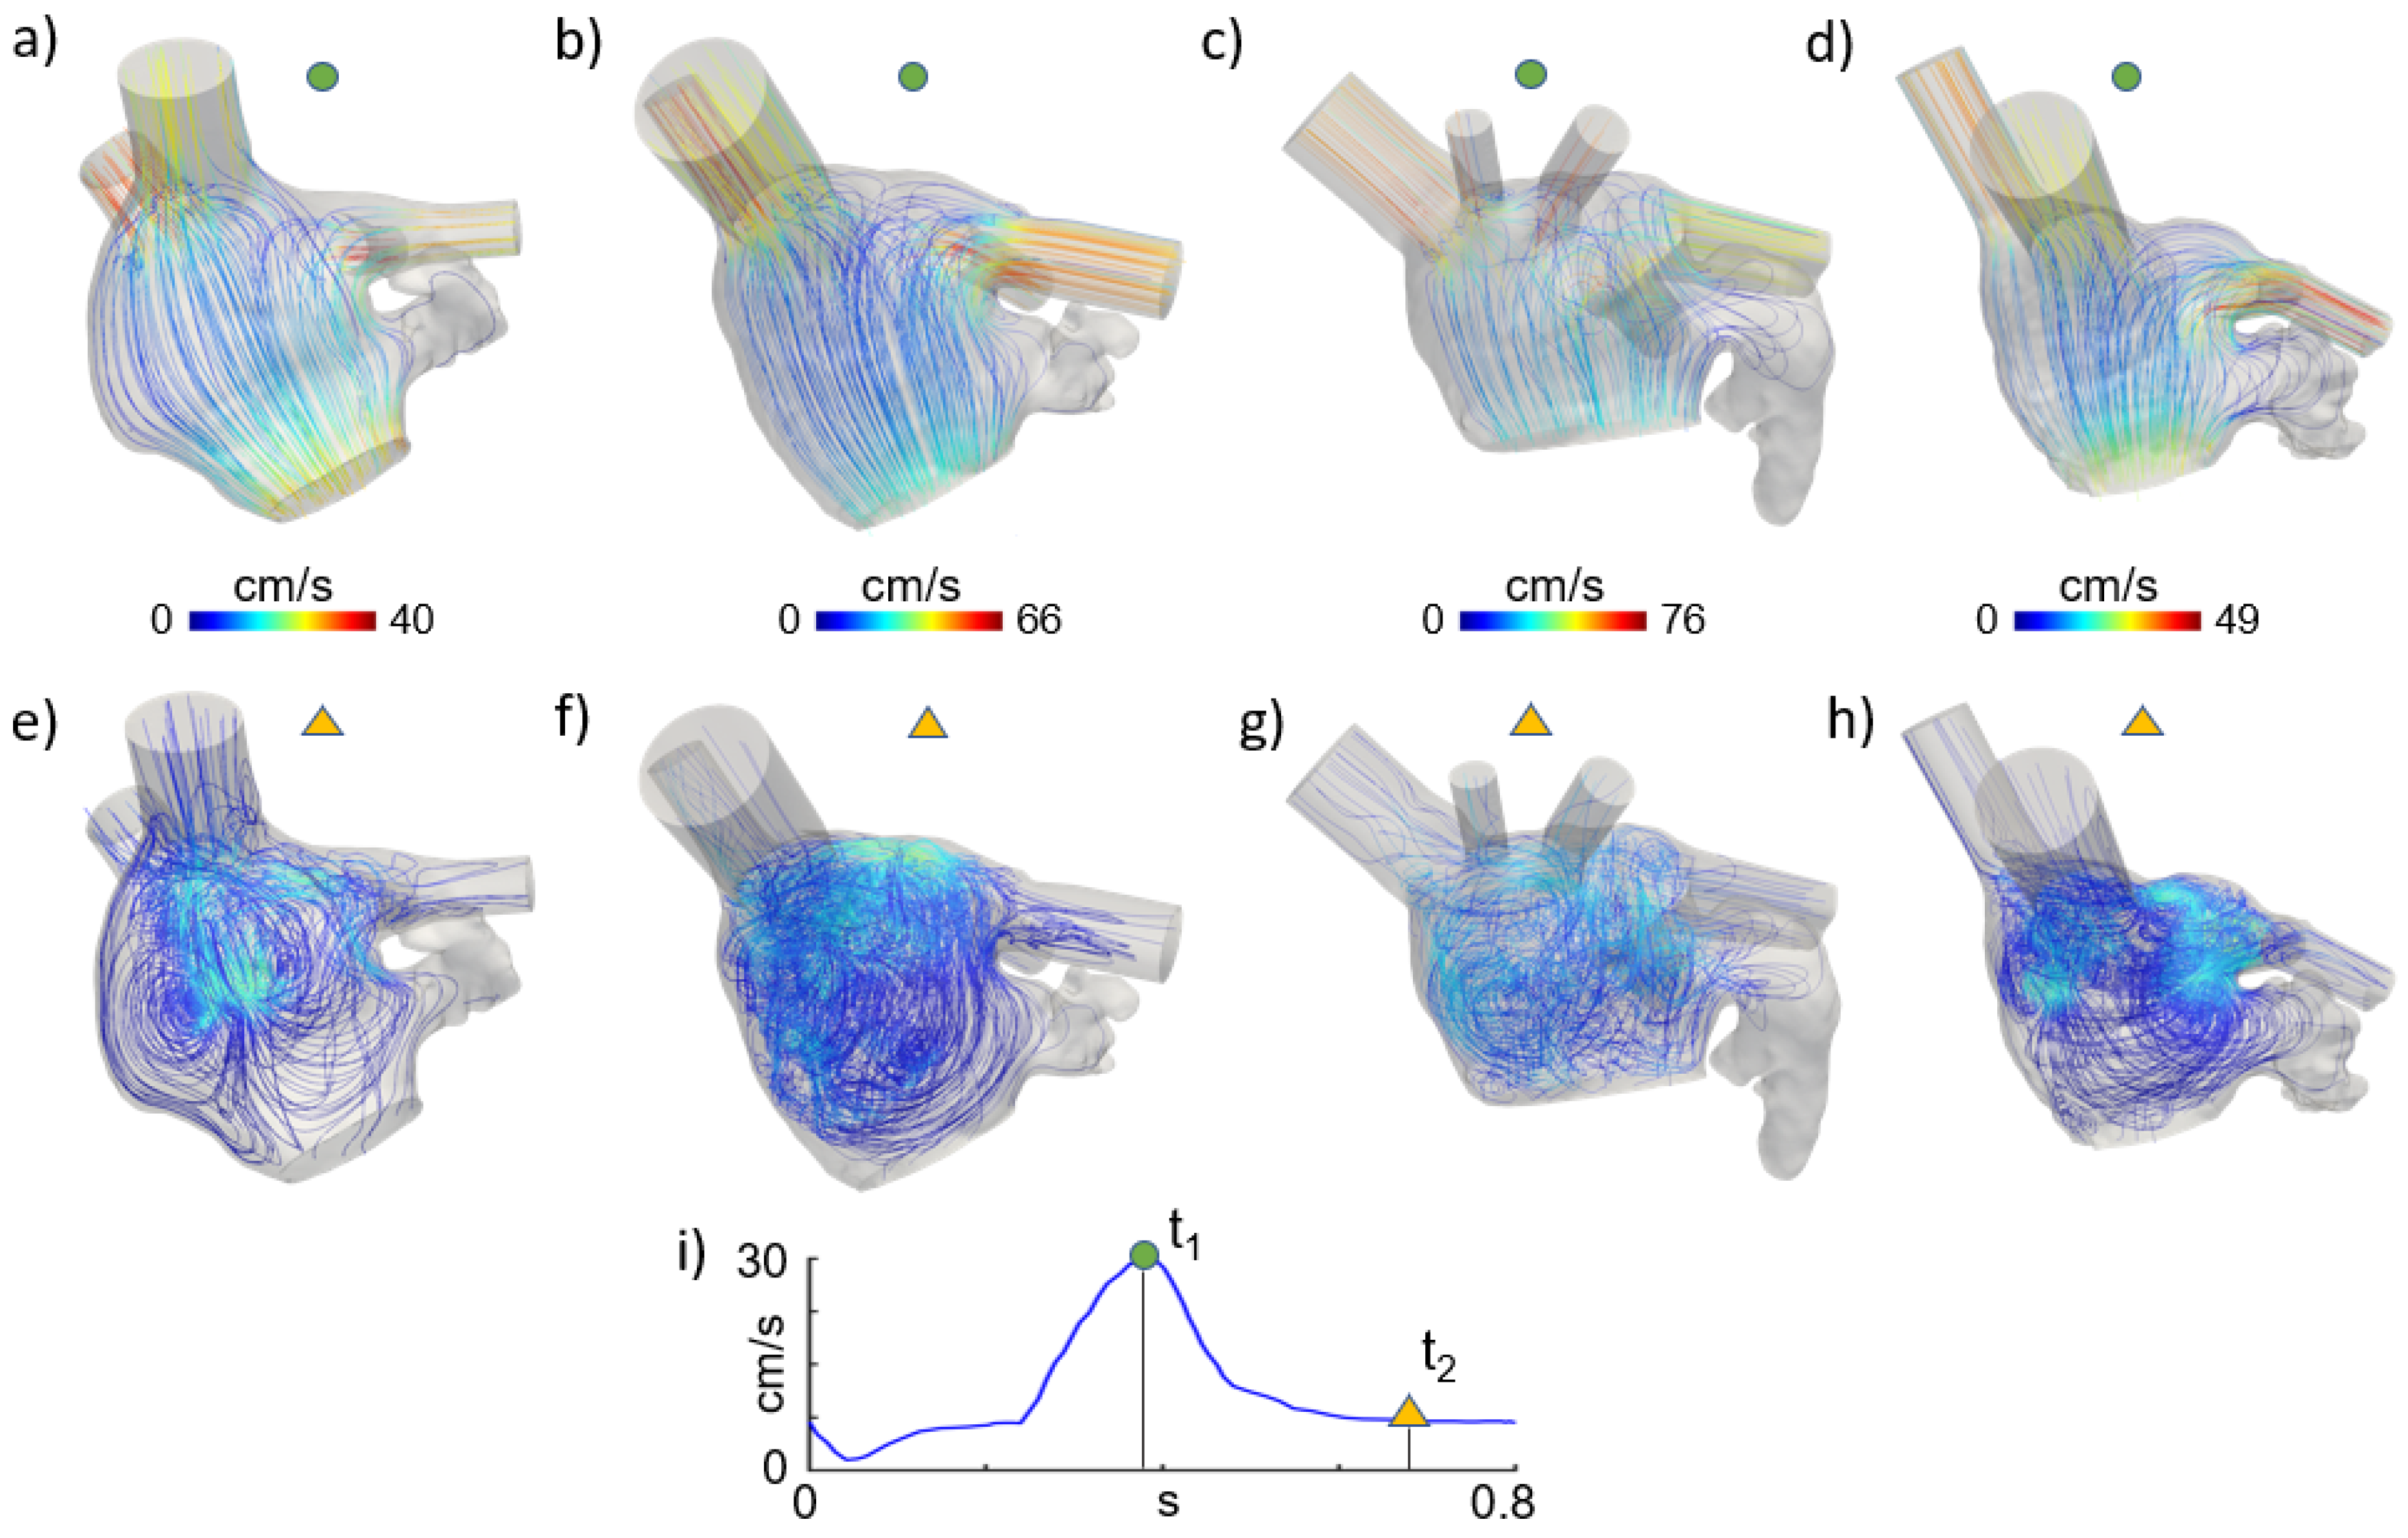
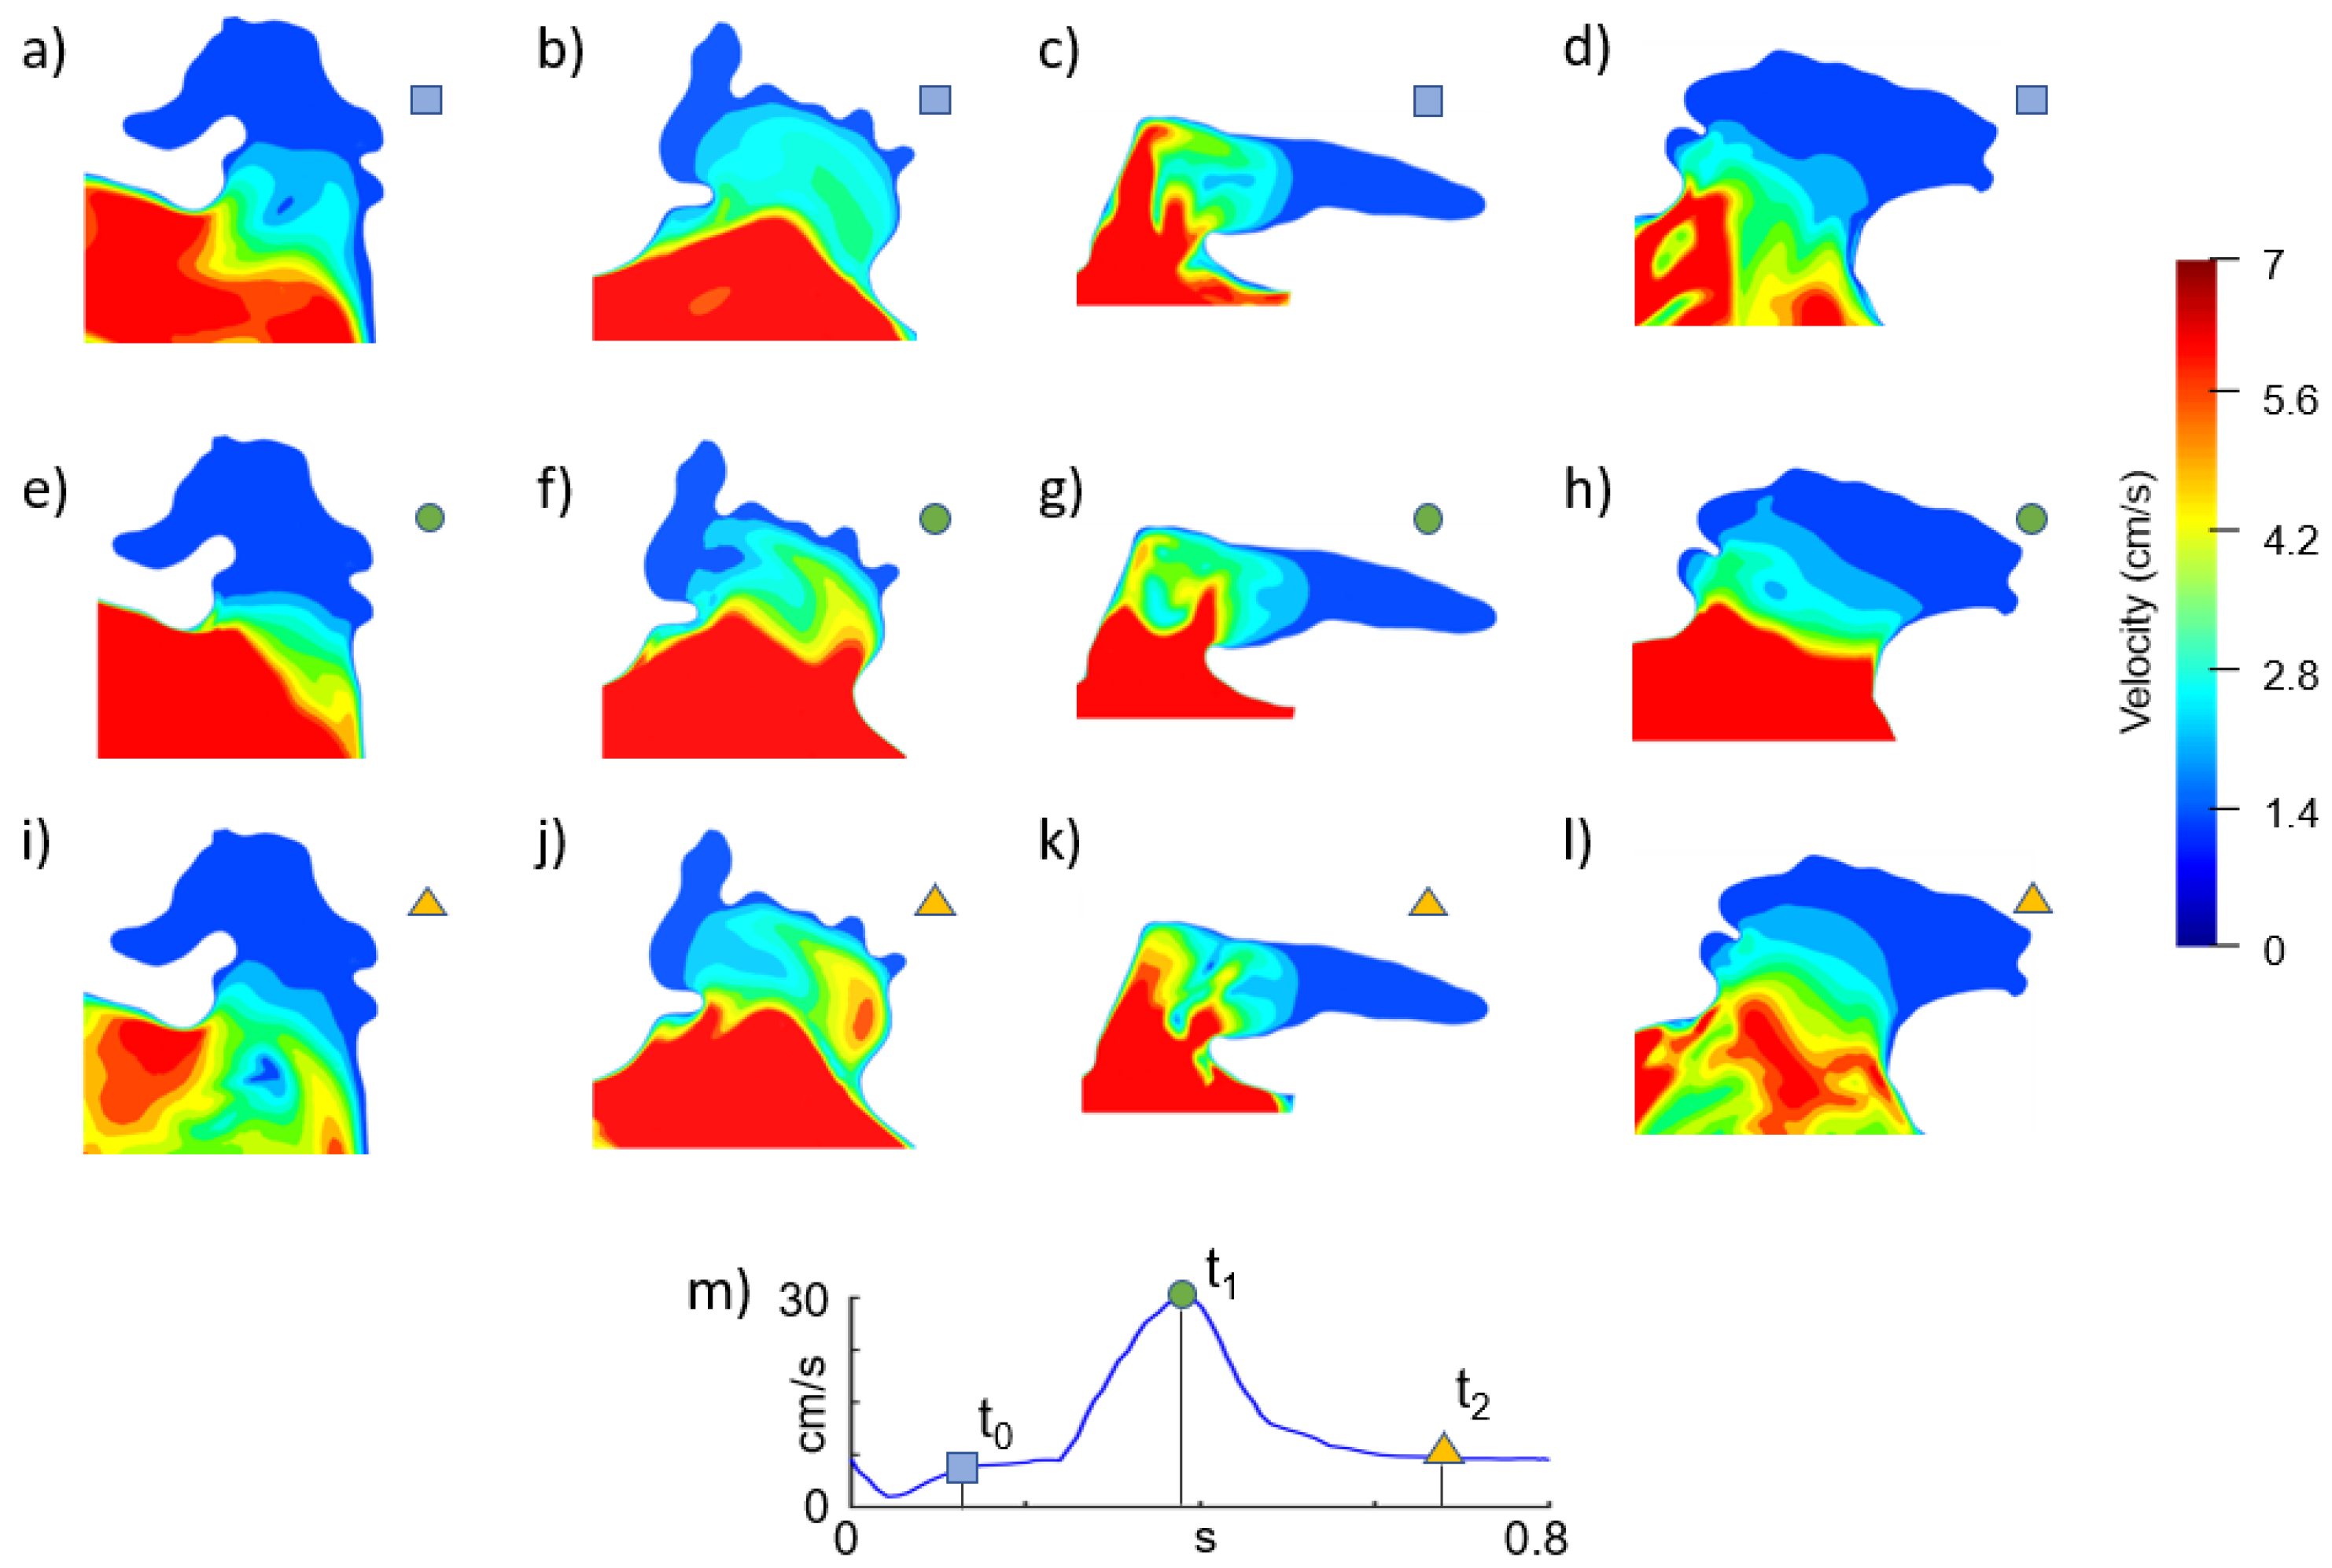
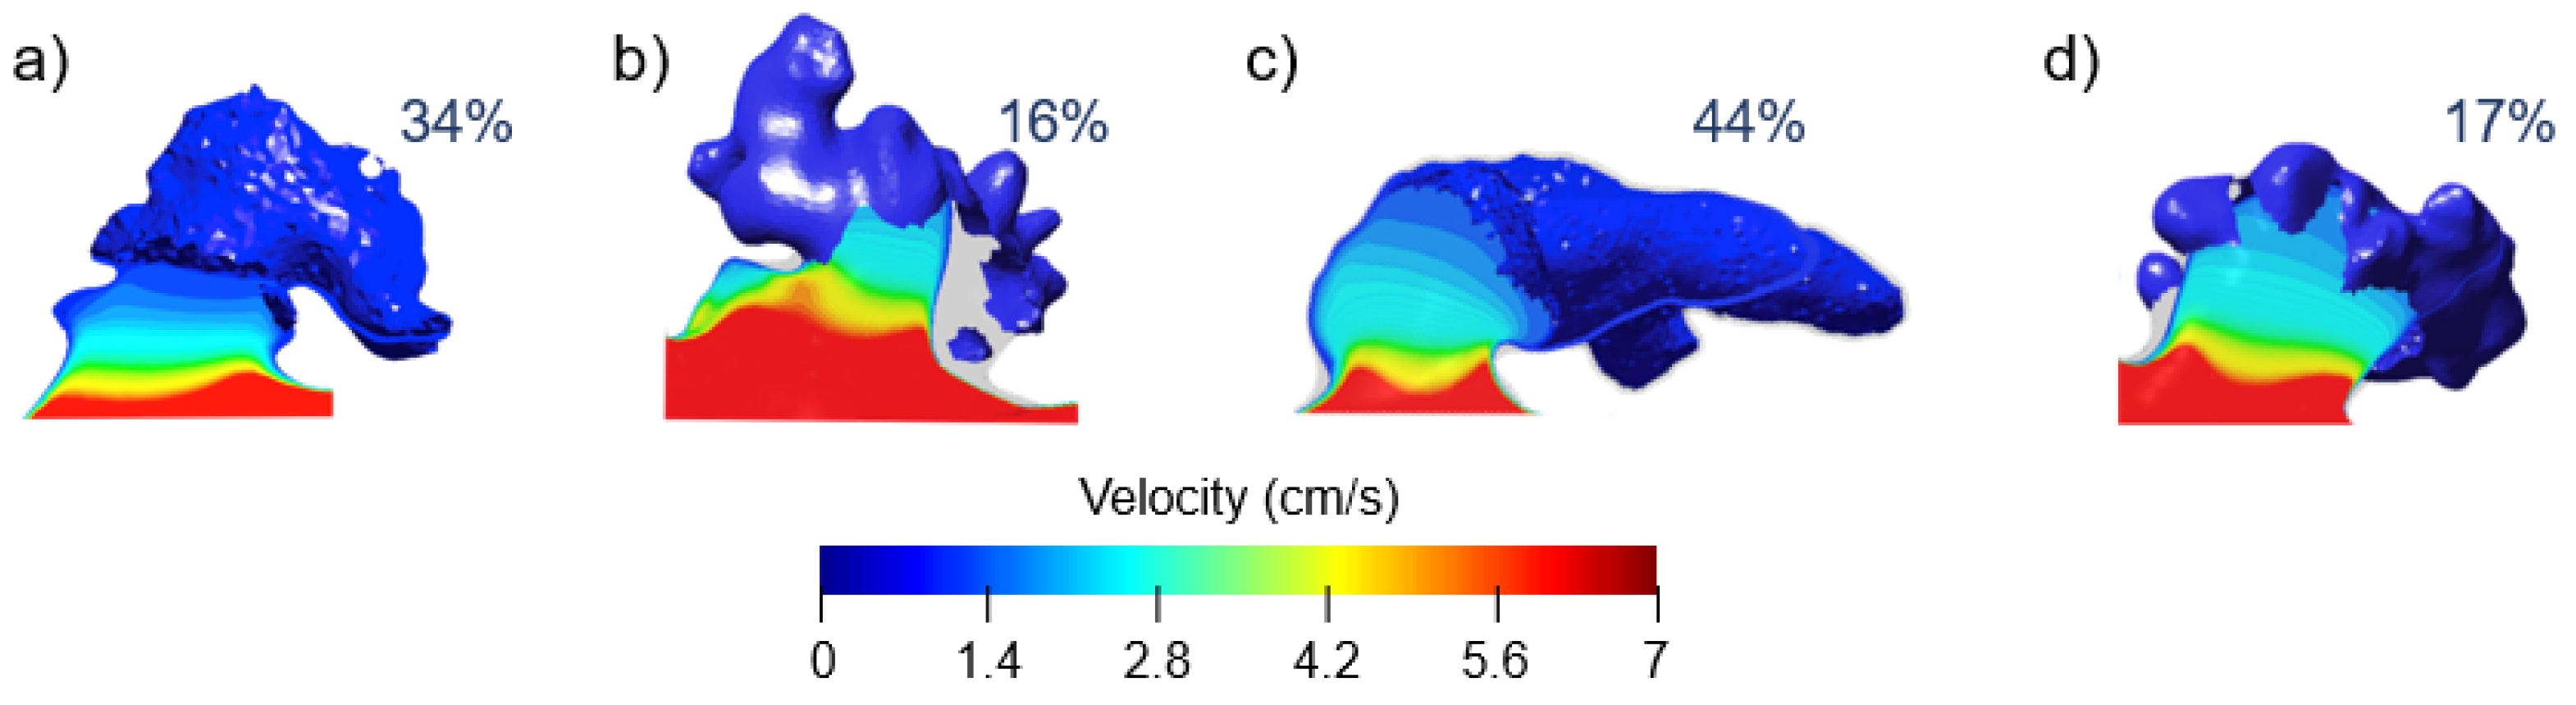
3.2. CFD Analysis
4. Discussion
5. Conclusions
Author Contributions
Funding
Conflicts of Interest
Abbreviations
| AF | Atrial Fibrillation |
| LA | Left Atrium |
| LAA | Left Atrium Appendage |
| CW | Chicken Wing |
| CS | Cactus |
| WS | Windsock |
| CF | Cauliflower |
| CFD | Computational Fluid Dynamics |
| CT | Computerised Tomography |
| PV | Pulmonary Vein |
| MV | Mitral Valve |
References
- Wolf, P.A.; Abbott, R.D.; Kannel, W.B. Atrial fibrillation as an independent risk factor for stroke: The framingham study. Stroke 1991, 22, 983–988. [Google Scholar] [CrossRef] [Green Version]
- Gupta, D.K.; Shah, A.M.; Giugliano, R.P.; Ruff, C.T.; Antman, E.M.; Grip, L.T.; Mercuri, M. Left atrial structure and function in atrial fibrillation: Engage aftimi 48. Eur. Heart J. 2014, 22, 983–988. [Google Scholar] [CrossRef]
- Holmes, D.R.; Lakkireddy, D.R.; Whitlock, R.P.; Waksman, R.; Mack, M.J. Left atrial appendage occlusion: Opportunities and challenges. J. Am. Coll. Cardiol. 2014, 63, 291–298. [Google Scholar] [CrossRef] [Green Version]
- Chanda, A.; Reilly, J.P. Left atrial appendage occlusion for stroke prevention. Prog. Cardiovasc. Dis. 2017, 59, 626–635. [Google Scholar] [CrossRef] [PubMed]
- Berti, S.; Pastormerlo, L.E.; Celi, S.; Ravani, M.; Trianni, G.; Cerone, E.; Santoro, G. First-in-human percutaneous left atrial appendage occlusion procedure guided by real-time 3-dimensional intracardiac echocardiography. JACC Cardiovasc. Interv. 2018, 11, 2228–2231. [Google Scholar] [CrossRef] [PubMed]
- Berti, S.; Pastormerlo, L.E.; Rezzaghi, M.; Trianni, G.; Paradossi, U.; Cerone, E.; Palmieri, C. Left atrial appendage occlusion in high-risk patients with non-valvular atrial fibrillation. Heart 2016, 7, 1036–1044. [Google Scholar] [CrossRef] [PubMed]
- Beigel, R.; Wunderlich, N.C.; Ho, S.Y.; Arsanjani, R.; Siegel, R.J. The left atrial appendage: Anatomy, function, and noninvasive evaluation. JACC Cardiovasc. Imag. 2014, 7, 1251–1265. [Google Scholar] [CrossRef] [Green Version]
- Koizumi, R.; Funamoto, K.; Hayase, T.; Kanke, Y.; Shibata, M.; Shiraishi, Y.; Yambe, T. Numerical analysis of hemodynamic changes in the left atrium due to atrial fibrillation. J. Biomech. 2015, 48, 472–478. [Google Scholar] [CrossRef]
- Otani, T.; Aa-Issa, A.; Pourmorteza, A.; McVeigh, E.R.; Wada, S.; Ashikaga, H. A Computational Framework for Personalized Blood Flow Analysis in the Human Left Atrium. Ann. Biomed. Eng. 2016, 44, 3284–3294. [Google Scholar] [CrossRef]
- Masci, A.; Alessandrini, M.; Dedè, L.; Forti, D.; Menghini, F.; Tornasi, C.; Corsi, C. Development of a Computational Fluid Dynamics Model of the Left Atrium in Atrial Fibrillation on a Patient Specific Basis. Comput. Cardiol. 2017. [Google Scholar] [CrossRef]
- Bosi, G.M.; Cook, A.; Rai, R.; Menezes, L.J.; Schievano, S.; Torii, R.; Burriesci, G.B. Computational Fluid Dynamic Analysis of the Left Atrial Appendage to Predict Thrombosis Risk. Front. Cardiovasc. Med. 2018, 4, 34. [Google Scholar] [CrossRef] [PubMed] [Green Version]
- Vivoli, G.; Gasparotti, E.; Rezzaghi, M.; Cerone, E.; Mariani, M.; Lini, L.; Celi, S. Simultaneous Functional and Morphological Assessment of Left Atrial Appendage by 3D Virtual Models. J. Healthc. Eng. 2019, 7, 1–8. [Google Scholar] [CrossRef] [PubMed] [Green Version]
- García Isla, G.; Olivares, A.L.; Silva, E.; Nuñez-Garcia, M.; Butakoff, C.; Sanchez-Quintana, D.; Camara, O. Sensitivity analysis of geometrical parameters to study haemodynamics and thrombus formation in the left atrial appendage: Virtual Haemodynamics and thrombus formation study in LAA. Int. J. Numer. Method Biomed. Eng. 2018, 8, e3100. [Google Scholar] [CrossRef] [PubMed]
- Masci, A.; Barone, L.; Dedè, L.; Fedele, M.; Tomasi, C.; Quarteroni, A.; Corsi, C. The Impact of Left Atrium Appendage Morphology on Stroke Risk Assessment in Atrial Fibrillation: A Computational Fluid Dynamics Study. Front. Physiol. 2018, 22, 1938. [Google Scholar] [CrossRef]
- Kimura, T.; Takatsuki, S.; Inagawa, K.; Katsumata, Y.; Nishiyama, T.; Nishiyama, N.; Jinzaki, M. Anatomical characteristics of the left atrial appendage in cardiogenic stroke with low CHADS2 scores. Heart Rhythm 2013, 10, 921–925. [Google Scholar] [CrossRef]
- Kikinis, R.; Pieper, S.D.; Vosburgh, K. 3D Slicer: A Platform for Subject-Specific Image Analysis, Visualization, and Clinical Support. Intraoperative Imaging and Image-Guided Therapy; Springer: New York, NY, USA, 2014; pp. 277–289. [Google Scholar]
- Antiga, L.; Steinman, D.A. Robust and objective decomposition and mapping of bifurcating vessels. IEE Trans. Med. Imag. 2004, 23, 704–714. [Google Scholar] [CrossRef]
- International Organization for Standardization. ISO 4850-1:2015 Cardiovascular Implants—Cardiac Valve Prostheses Part 1: General Requirements; International Organization for Standardization: Geneva, Switzerland, 2015; p. 4850. [Google Scholar]
- Boccadifuoco, A.; Mariotti, A.; Capellini, K.; Celi, S.; Salvetti, M.V. Validation of Numerical Simulations of Thoracic Aorta Hemodynamics: Comparison with In Vivo Measurements and Stochastic Sensitivity Analysis. Cardiovasc. Eng. Technol. 2018, 9, 688–706. [Google Scholar] [CrossRef]
- Capellini, K.; Vignali, E.; Costa, E.; Gasparotti, E.; Biancolini, M.E.; Lini, L.; Celi, S. Computational fluid dynamic study for aTAA hemodynamics: An integrated image-based and RBF mesh morphing approach. J. Biomech. Eng. 2018. [Google Scholar] [CrossRef]
- Chen, R.; Wu, X.; Jin, H.; Wang, B.; Ma, M.; Zhao, B. Assessment of left atrial appendage morphology and function in patients with non-valvular paroxysmal atrial fibrillation with different rhythms using real-time 3D transesophageal echocardiography. Ultrasound Med. Biol. 2016, 42, 118–124. [Google Scholar] [CrossRef]
- Matsumoto, Y.; Morino, Y.; Kumagai, A.; Hozawa, M.; Nakamura, M.; Terayama, Y.; Tashiro, A. Characteristics of anatomy and function of the left atrial appendage and their relationships in patients with cardioembolic stroke: A 3-dimensional transesophageal echocardiography study. J. Stroke Cerebrovasc. Diag. 2017, 26, 470–479. [Google Scholar] [CrossRef]
- Singh, S.M.; Jimenez-Juan, L.; Danon, A.; Bastarrika, G.; Shmatukha, A.V.; Wright, G.A.; Crystal, E. Magnetic resonance imaging of the left atrial appendage post pulmonary vein isolation: Implications for percutaneous left atrial appendage occlusion. J. Arrhythmia 2015, 31, 108–113. [Google Scholar] [CrossRef] [PubMed] [Green Version]
- Di Biase, L.; Santangeli, P.; Anselmino, M.; Mohanty, P.; Salvetti, I.; Gili, S.; Pump, A. Does the left atrial appendage morphology correlate with the risk of stroke in patients with atrial fibrillation? Results from a multicenter study. J. Am. Coll. Cardiol. 2012, 60, 531–538. [Google Scholar] [CrossRef] [PubMed]
- Lee, J.M.; Seo, J.; Uhm, J.S.; Kim, Y.J.; Joung, B. Why Is Left Atrial Appendage Morphology Related to Strokes? An Analysis of the Flow Velocity and Orifice Size of the Left Atrial Appendage. J. Cardiovasc. Electrophysiol. 2015, 26, 922–927. [Google Scholar] [CrossRef] [PubMed]
- Bax, J.J.; Marsan, N.A.; Delgado, V. Non-invasive imaging in atrial fibrillation: Focus on prognosis and catheter ablation. Heart 2015, 101, 94–100. [Google Scholar] [CrossRef]
- Iwasaki, Y.K.; Nishida, K.; Kato, T.; Nattel, S. Atrial fibrillation pathophysiology: Implications for management. Circulation 2011, 124, 2264–2274. [Google Scholar] [CrossRef] [Green Version]
- Kreidieh, B.; Rojas, F.; Schurmann, P.; Dave, A.S.; Kashani, A.; Rodríguez-Mañero, M.; Valderrábano, M. Left Atrial Appendage Remodeling After Lariat Left Atrial Appendage Ligation. Circ. Arrhythmia Electrophysiol. 2015, 8, 1351–1358. [Google Scholar] [CrossRef] [Green Version]
- Wang, F.; Zhu, M.; Wang, X.; Zhang, W.; Su, Y.; Lu, Y.; Xu, Y. Predictive value of left atrial appendage lobes on left atrial thrombus or spontaneous echo contrast in patients with non-valvular atrial fibrillation. BMC Cardiovasc. Disord. 2018, 18, 153. [Google Scholar] [CrossRef] [Green Version]
- Olivares, A.L.; Silva, E.; Nuñez-Garcia, M.; Butakoff, C.; Sánchez-Quintana, D.; Freixa, X.; Camara, O. In Silico Analysis of Haemodynamics in Patient-Specific Left Atria with Different Appendage Morphologies. FIMH 2017, 10263, 412–420. [Google Scholar]
- Kreidieh, B.; Valderrábano, M. Malignant Left Atrial Appendage Morphology and Embolization Risk in Atrial Fibrillation. Heart Rhythm Case Rep. 2015, 1, 406–410. [Google Scholar] [CrossRef] [Green Version]


© 2020 by the authors. Licensee MDPI, Basel, Switzerland. This article is an open access article distributed under the terms and conditions of the Creative Commons Attribution (CC BY) license (http://creativecommons.org/licenses/by/4.0/).
Share and Cite
Fanni, B.M.; Capellini, K.; Di Leonardo, M.; Clemente, A.; Cerone, E.; Berti, S.; Celi, S. Correlation between LAA Morphological Features and Computational Fluid Dynamics Analysis for Non-Valvular Atrial Fibrillation Patients. Appl. Sci. 2020, 10, 1448. https://0-doi-org.brum.beds.ac.uk/10.3390/app10041448
Fanni BM, Capellini K, Di Leonardo M, Clemente A, Cerone E, Berti S, Celi S. Correlation between LAA Morphological Features and Computational Fluid Dynamics Analysis for Non-Valvular Atrial Fibrillation Patients. Applied Sciences. 2020; 10(4):1448. https://0-doi-org.brum.beds.ac.uk/10.3390/app10041448
Chicago/Turabian StyleFanni, Benigno Marco, Katia Capellini, Mario Di Leonardo, Alberto Clemente, Elisa Cerone, Sergio Berti, and Simona Celi. 2020. "Correlation between LAA Morphological Features and Computational Fluid Dynamics Analysis for Non-Valvular Atrial Fibrillation Patients" Applied Sciences 10, no. 4: 1448. https://0-doi-org.brum.beds.ac.uk/10.3390/app10041448