The S-Curve as a Tool for Planning and Controlling of Construction Process—Case Study


Department of Building Engineering, Faculty of Civil Engineering, Wroclaw University of Science and Technology, 50-370 Wrocław, Poland
*
Author to whom correspondence should be addressed.
Appl. Sci. 2020, 10(6), 2071; https://0-doi-org.brum.beds.ac.uk/10.3390/app10062071
Submission received: 12 February 2020
/
Revised: 10 March 2020
/
Accepted: 13 March 2020
/
Published: 19 March 2020
(This article belongs to the Special Issue The Latest Scientific Problems Related to the Implementation and Diagnostics of Construction Objects)
Abstract
:One of the key tasks of an investor and a contractor at the stage of planning and implementing construction works is to measure the progress of execution with regard to the planned deadlines and costs. During the execution of construction works, the actual progress of the works may differ significantly from the initial plan, and it is unlikely that the construction project will be implemented entirely according to the planned work and expenditure schedule. In order to monitor the process of deviations of the deadline and the budget of the investment task, several rudimentary methods of planning—as well as the cyclical control of the progress of construction projects—are used. An effective tool for measuring the utilization of the financial outlays of a construction project is the presentation of the planned financial flows on a timeline using a cumulative cost chart, the representation of which is the S-curve. The purpose of this paper is to analyze the course of an sample construction project comparing the planned costs of the scheduled works with the actual costs of the performed works, as well as identifying the reasons leading to the failure to meet the planned deadlines and budget of the project implementation. As part of the research conducted at a construction site of a hotel facility, the authors of this paper analyzed each of the 20-month effects of financial expenditures on construction works that were developed and processed by the Bank Investment Supervision (BIS) over a period of three years (between 2017 and 2019). Based on these results, charts and tables of the scheduled and actual cumulative costs of the completed construction project were prepared, the careful analysis of which enables interesting conclusions to be drawn.
1. Introduction
Construction project management is a process that includes a number of operations, activities and decisions that are closely related to a project being executed and that aim to create new, or to increase, existing fixed assets in order to achieve utility effects [1]. The utility effect of the construction process may be the construction of a new building, or the renovation or modernization of an existing building. In each construction process, four basic phases are distinguished according to the definition of the building object life cycle: the programming/planning phase, the implementation phase, the operation/use/maintenance phase and the phase of decommissioning or demolition [2]. Appropriate planning of the entire construction process is a very important operation that has a direct impact on whether the investment project implementation is successful [3].
The construction industry is characterized by high complexity of the implemented construction processes. The execution of construction projects is specific and particularly difficult, because each implementation is a unique, complex and dynamic process that consists of a number of interrelated subprocesses in which various participants of the investment process are involved [4].
Each construction project is exposed to various types of risk [5]. The most common risks associated with the implementation of construction projects include, among others, time risk, cost risk, work quality risk, construction risk and technological risk [6]. The construction risks that occur during the execution of works can be classified into five categories: people and their safety, budget, cost, schedule, planning/quality and efficiency [7].
During the implementation of construction projects, a common phenomenon is that the planned budget is exceeded and/or the planned implementation deadlines are not met. This phenomenon occurs in all countries [8,9]. Deviations from the plan may arise as a result of changing weather conditions; changes in the volume of available means of production; untimely deliveries of materials, machinery and equipment; unprofessional project management; mediocre discipline and organization of work; delays in making decisions; incorrect decisions; and so on [10].
An important element of appropriately managing the investment process is the thoughtful planning of construction project costs and the effective control of the progress of works in the area of incurred investment costs during project implementation. When planning the costs of a construction project, the cost of construction works must always be correctly determined, and both the direct costs related to the implementation of works and the indirect costs (i.e., overheads and profit) should be taken into account [11]. Unfortunately, exceeding the planned budget and/or time is a very common attribute of construction projects, and it is unlikely that a construction investment will be carried out completely in accordance with the planned work and expenditure schedule [12].
Therefore, it is important to plan the entire investment process, in particular, by developing a correct Investor’s work and expenditure schedule with specific dates for starting and completing the project, with appropriate connections between planned tasks, and also with an outline of the specific duration of the individual tasks and the costs of their implementation. However, it should be borne in mind that during the implementation of a construction project, the actual progress of works may differ significantly from the initial plan, and it is therefore also necessary to specify the principles of control and monitoring for the construction project. Only a properly developed work plan, which includes optimal working sequences and perfect timing for executing each individual activity, can enhance the work efficiency and enable contractors to fulfill the contract at the lowest cost [13].
An effective tool for measuring the utilization of the financial outlays of a construction project is the presentation of the planned financial flows on a timeline using a cumulative cost chart, the representation of which is the S-curve. The S-curve shows the progress of the investment project from the beginning of the construction works through to their completion. The cumulative cost chart for construction projects takes the shape of the letter “S”, hence the name of the curve. The variable slope of the cost curve indicates the changing progress of works per unit of time [14].
The S-curve is flatter at the beginning and end of the execution of a construction project, and steeper in the middle. This is due to the fact that a traditional construction project starts quite slowly. At the beginning of the construction process, human resources are organized, construction site development is prepared and simple preparatory works are carried out. After some time, the implementation of work begins to accelerate. Works are carried out on several working fronts using various working teams. Contractors start to undertake more and more tasks simultaneously. The mutual implementation of parallel tasks generates a much greater increase in costs when compared to the initial stage of implementation [15].
As a result of the continuing research, the classic S-curve method is being expanded and constantly modified in the following ways: through the use of the least square method and fuzzy S-curve regression model [16,17], the use of a polynomial function to generalize the S-curve [18], the use of methods of artificial intelligence [19], the use of an S-curve Bayesian model [20] or by dividing the entire duration of a construction project into three periods for the improved accuracy of cost forecasting [21]).
The second large group of methods that are used for controlling and monitoring the progress of the construction project implementation is earned value management. Earned value management involves the control of the investment task through the cyclical comparison of the actually executed scope of work with the planned time and cost of implementation [22]. Project management that uses earned value management is a well-known management system that integrates schedule, costs and technical performance [23,24]. Earned value management allows cost and schedule deviations as well as performance indicators, project cost forecasts and schedule durations to be calculated [25,26]. In literature, there are many studies that present the effective application of earned value management in real-life construction projects [27,28,29,30].
Classic earned value management is being expanded and modified by way of, among others, the introduction of a hybrid methodology based on work packages and logical time analysis [31], the introduction of new parameters (e.g., the Schedule Forecast Indicator (SFI) [32]) or by taking into account of the impact of unplanned time and cost deviations on the financial liquidity of a construction project [33].
The purpose of this article is to analyze the course of an sample construction project by comparing the planned costs of the scheduled work with the actual costs of the performed work, and to identify reasons leading to failures to meet planned deadlines and the budget of the project’s implementation. The goals of the paper are to demonstrate the reasons for construction project cost overruns and time delays using a representative case study. Both factors are strongly based on the Earned Value Method (EVM) approach, using an indicated project budget breakdown and timeline deviations. In this particular case study the poorly managed project was carried out and the cost spent exceeded the expected and planned figures by over 50%, which is not uncommon in the Polish investment process nowadays.
2. Research and Methodology of Measurements
The following documents were analyzed as part of the research conducted: (1) the basic Investor’s work and expenditure schedule of the construction project, which was developed before the commencement of works; and (2) a set of information about the actual progress of the construction process, contained and updated in the monthly reports of the Bank Investment Supervision (BIS) [34].
The Investor’s work and expenditure schedule is a document that shows the planned progress of the project over time, taking into account the planned costs. It was developed at the planning stage of the construction project.
Information on the actual progress of the construction process was collected as part of the BIS services during the authors’ own research at the construction site of a hotel facility [34]. For non-public investment tasks that are co-financed by two entities—the Investor and the Bank—a third independent entity was appointed: the Banking Supervision Inspector, who performed a monitoring and auditing function. The BIS’s tasks included, among others: preliminary reporting (e.g., verification of documentation about a construction project such as permits, administrative decisions, the planned budget, contracts concluded by an Investor, etc.), monthly reporting (e.g., constant monitoring of the project execution, control of the state of the project implementation, settlement verification, analysis of loan tranche disbursement conditions, etc.), and final reporting (i.e., final financial analysis of the project implementation) [35].
In the implementation phase, the Bank Investment Supervision develops documents that enable the mapping and presentation of the actual progress of the construction process. From the monthly reports developed by the BIS, information about, among others, the progress of works carried out in individual implementation periods, the values of works carried out in individual implementation periods and the values of works carried out cumulatively since the beginning of the works were obtained.
As a result of the performed documentation analysis, a collective data summary was prepared. It was presented in a two-dimensional table where each subsequent row of the table contained data on subsequent periods of the construction works. The table distinguished the following information about the project [33,36]:
- the budgeted cost of work scheduled () determined for each individual examined period on the basis of the Investor’s work and expenditure schedule;
- the cumulative value of the budgeted cost of work scheduled () for each single examined period, calculated as the cumulative value obtained by adding the value of the budgeted cost of work scheduled from the analyzed period to the value of budgeted cost of work scheduled from the preceding period, determined on the basis of the Investor’s work and expenditure schedule;
- the actual cost of work performed ) determined for each individual examined period on the basis of BIS reports;
- the cumulative value of the actual cost of work performed ) for each examined individual period, calculated as a cumulative value obtained by adding the value of the actual cost of work performed from the analyzed period, based on BIS reports, to the value of the actual costs of the work performed from the preceding period;
- the actual percentage advancement of work performed ), calculated as a ratio of the value of the cumulative actual cost of work performed to the total actual cost of the construction project;
- the planned percentage advancement of work scheduled , calculated as the ratio of the cumulative value of the budgeted cost of work scheduled to the total budgeted cost of the construction project;
- the actual percentage advancement of work scheduled ), calculated as the ratio of the value of the cumulative actual cost of work performed to the total budgeted cost of the construction project;
- the actual schedule variance ), calculated as the difference between the actual duration and the planned duration of the project;
- the actual schedule performance indicator ), calculated as the ratio of the actual duration of the construction project to the planned duration of the project;
- the at-completion variance ), calculated as the difference between the total actual cost of the construction project and the total budgeted cost of the construction project;
- the performance indicator of the at-completion variance ), calculated as the ratio of the total actual cost of the construction project to the total budgeted cost of the construction project.
3. Case Study
The subject of the analyzed project is the execution of a hotel with an underground garage (one underground floor), as well as the execution of elements of land development around it. The hotel was located in a Polish city. The erected building, on the ground floor, had a reception, daytime area, offices and hotel administration, and also a catering area with a restaurant and kitchen facilities. On floor +1, there were office rooms, meeting rooms, conference rooms and sanitary facilities with toilets. On the levels +2 to +7 there were 200 hotel rooms. The floor space of the building was approximately 8200 m2.
The project was carried out according to the general contracting system. The subject of the contract was an experienced construction company concerned the execution of the “shell & core” state. This consisted of the implementation of a comprehensive investment project involving the construction of a hotel with a garage, the execution of land development and the commissioning of the project after obtaining an occupancy permit. It should be emphasized that the original contract with the General Contractor did not take into account the finishing of the rooms, and therefore the scope of works in the finishing part did not include the finishing and equipping of hotel rooms with bathrooms and annexes.
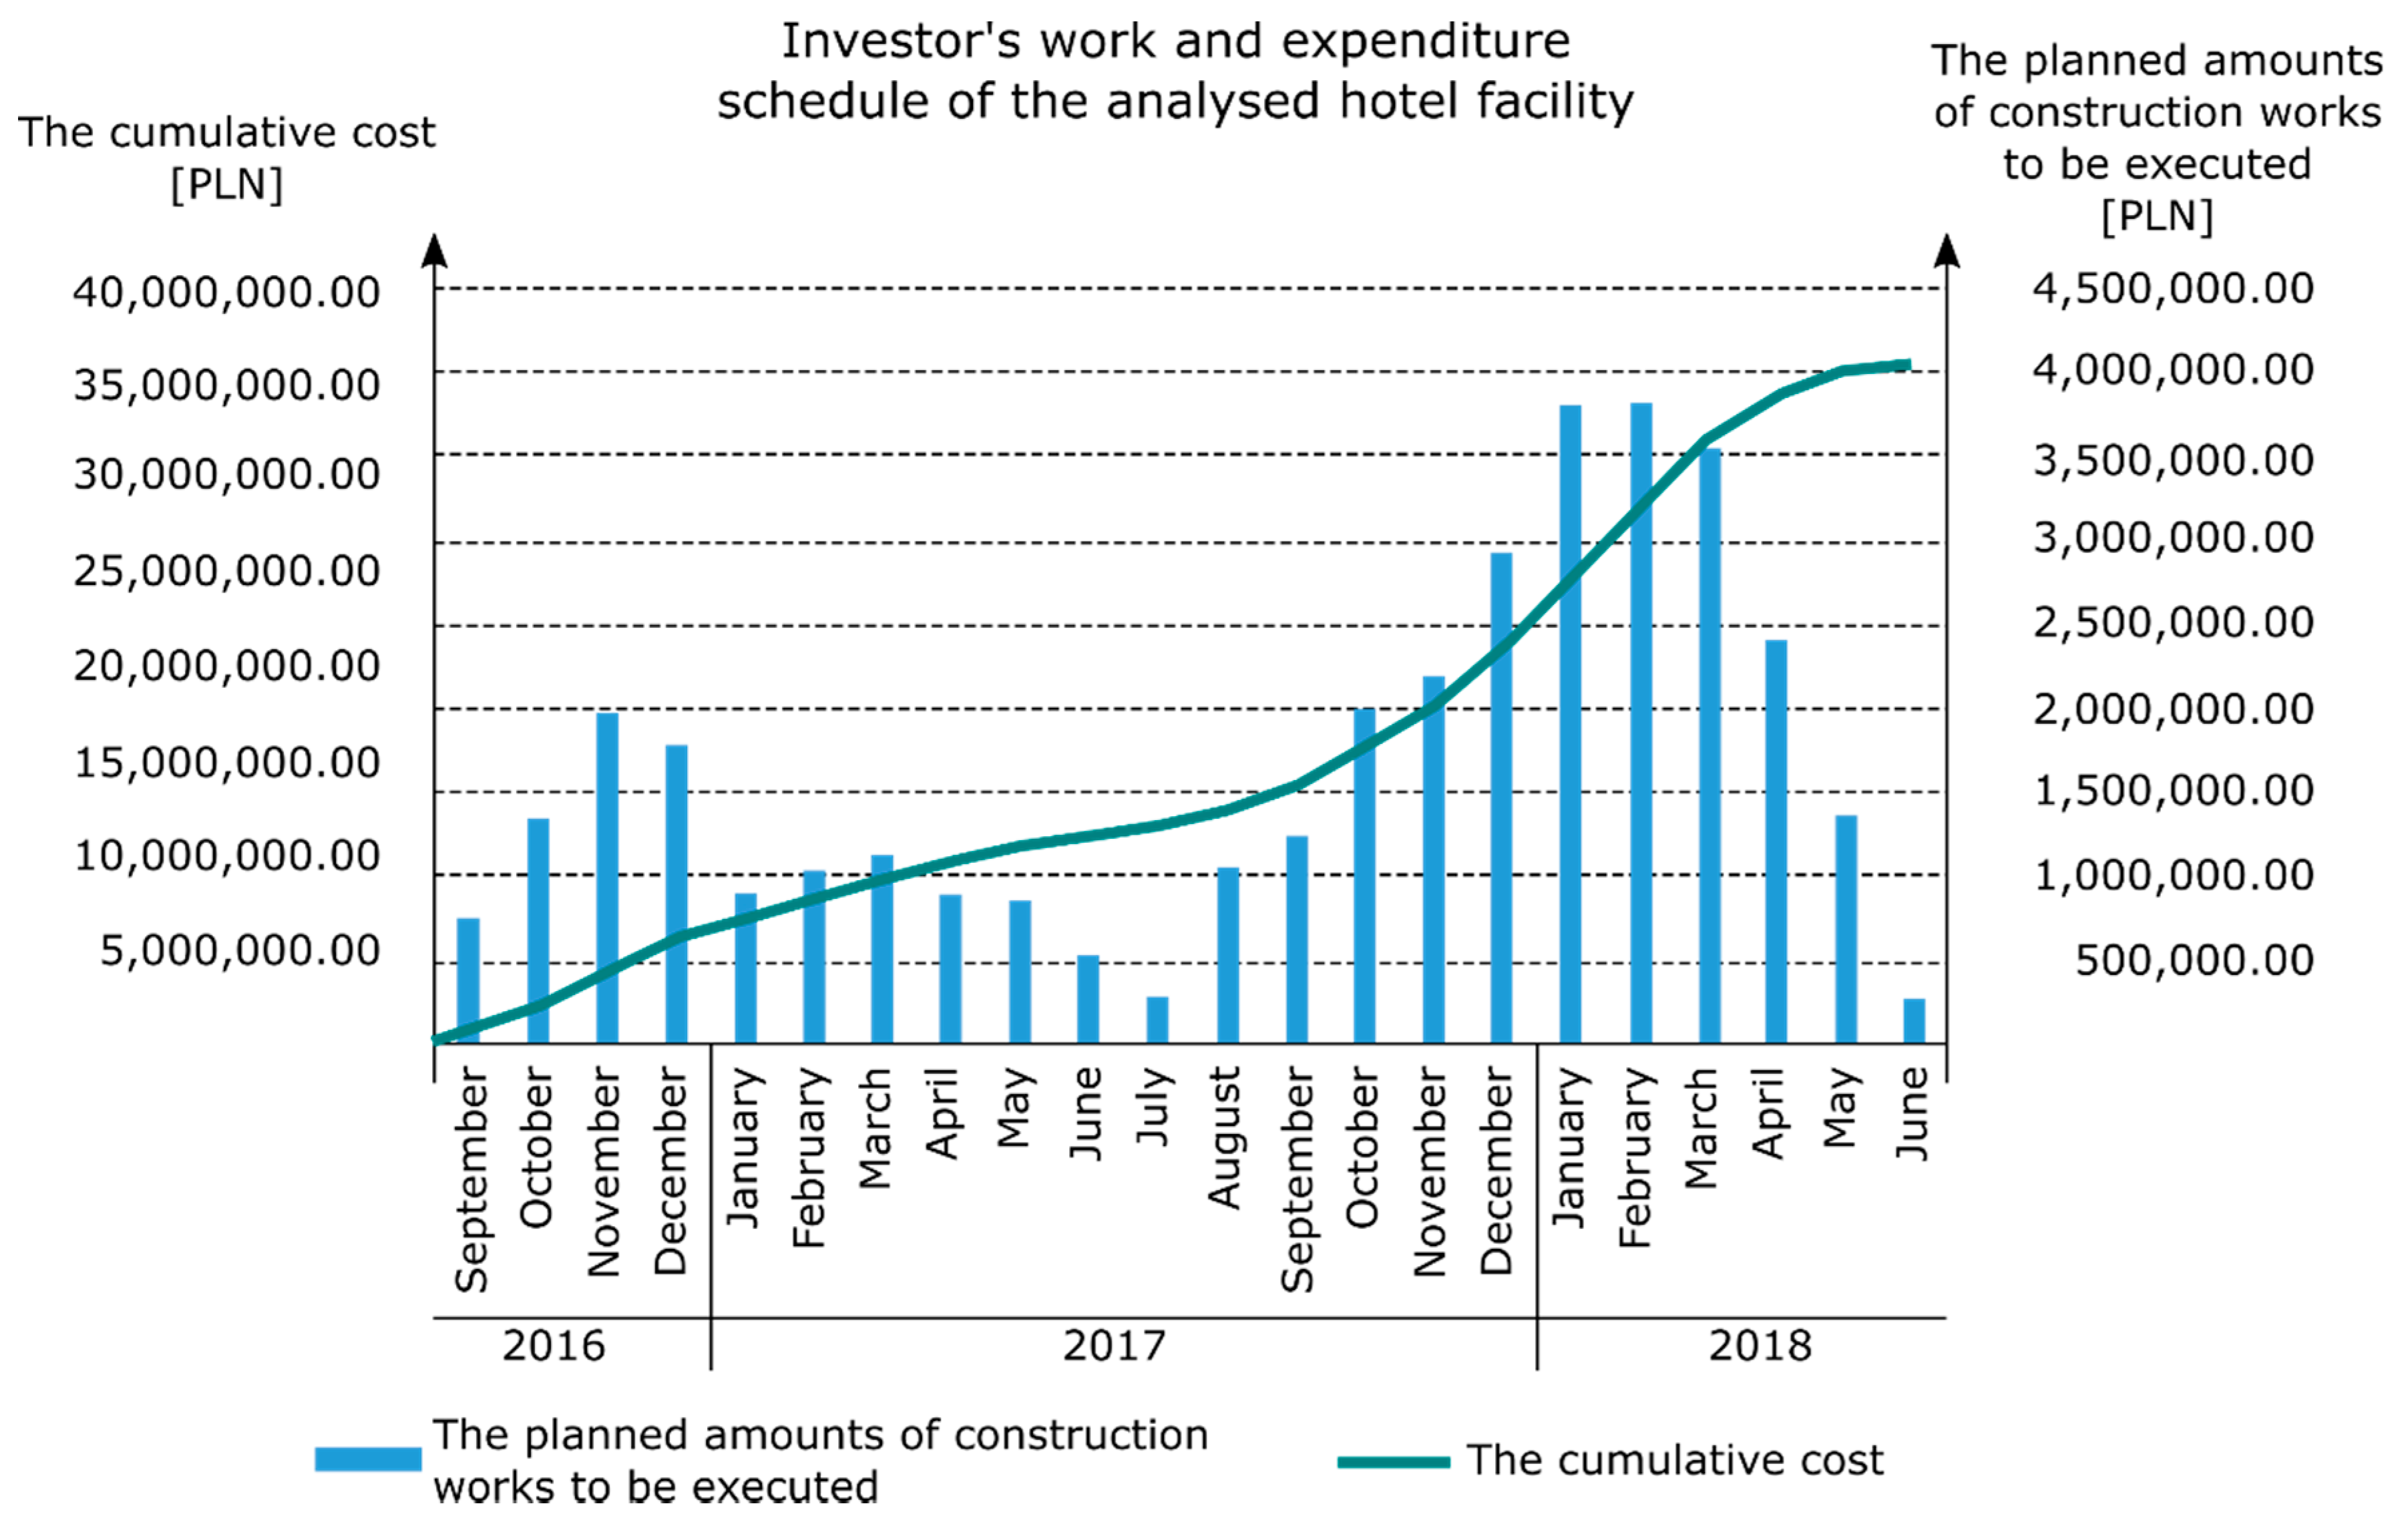
The scope of the commissioned works included the finishing of common parts (e.g., kitchen, restaurants and catering equipment) without providing the technology as described in the tender design. In addition to the contract, the equipping of the sanitary facilities, offices, facilities, reception, fitness area, toilets and technical rooms was required, as well as the provision of the premises’ mobile equipment. The deadline for the implementation of the subject of the contract was scheduled from September 2016 to June 2018. A flat-rate remuneration of PLN 36,111,146.13 net + VAT was set for performing the subject of the contract. Figure 1 presents the Investor’s work and expenditure schedule of the project, including the planned amounts of construction works to be executed.
The five most important elements of the execution process of the analyzed hotel facility are described below in the chronological order:
- August 2017: The Investor, aiming at a more efficient management of the construction project, signed an annex extending the scope of works of the General Contractor. It included specialist works concerning Leadership in Energy and Environmental Design (LEED) certification, additional fire protection and the execution of power and teletechnical installations in hotel rooms. The value of remuneration increased by 13.0% when compared to the Investor’s schedule and reached the level of PLN 40,815,455.00 net.
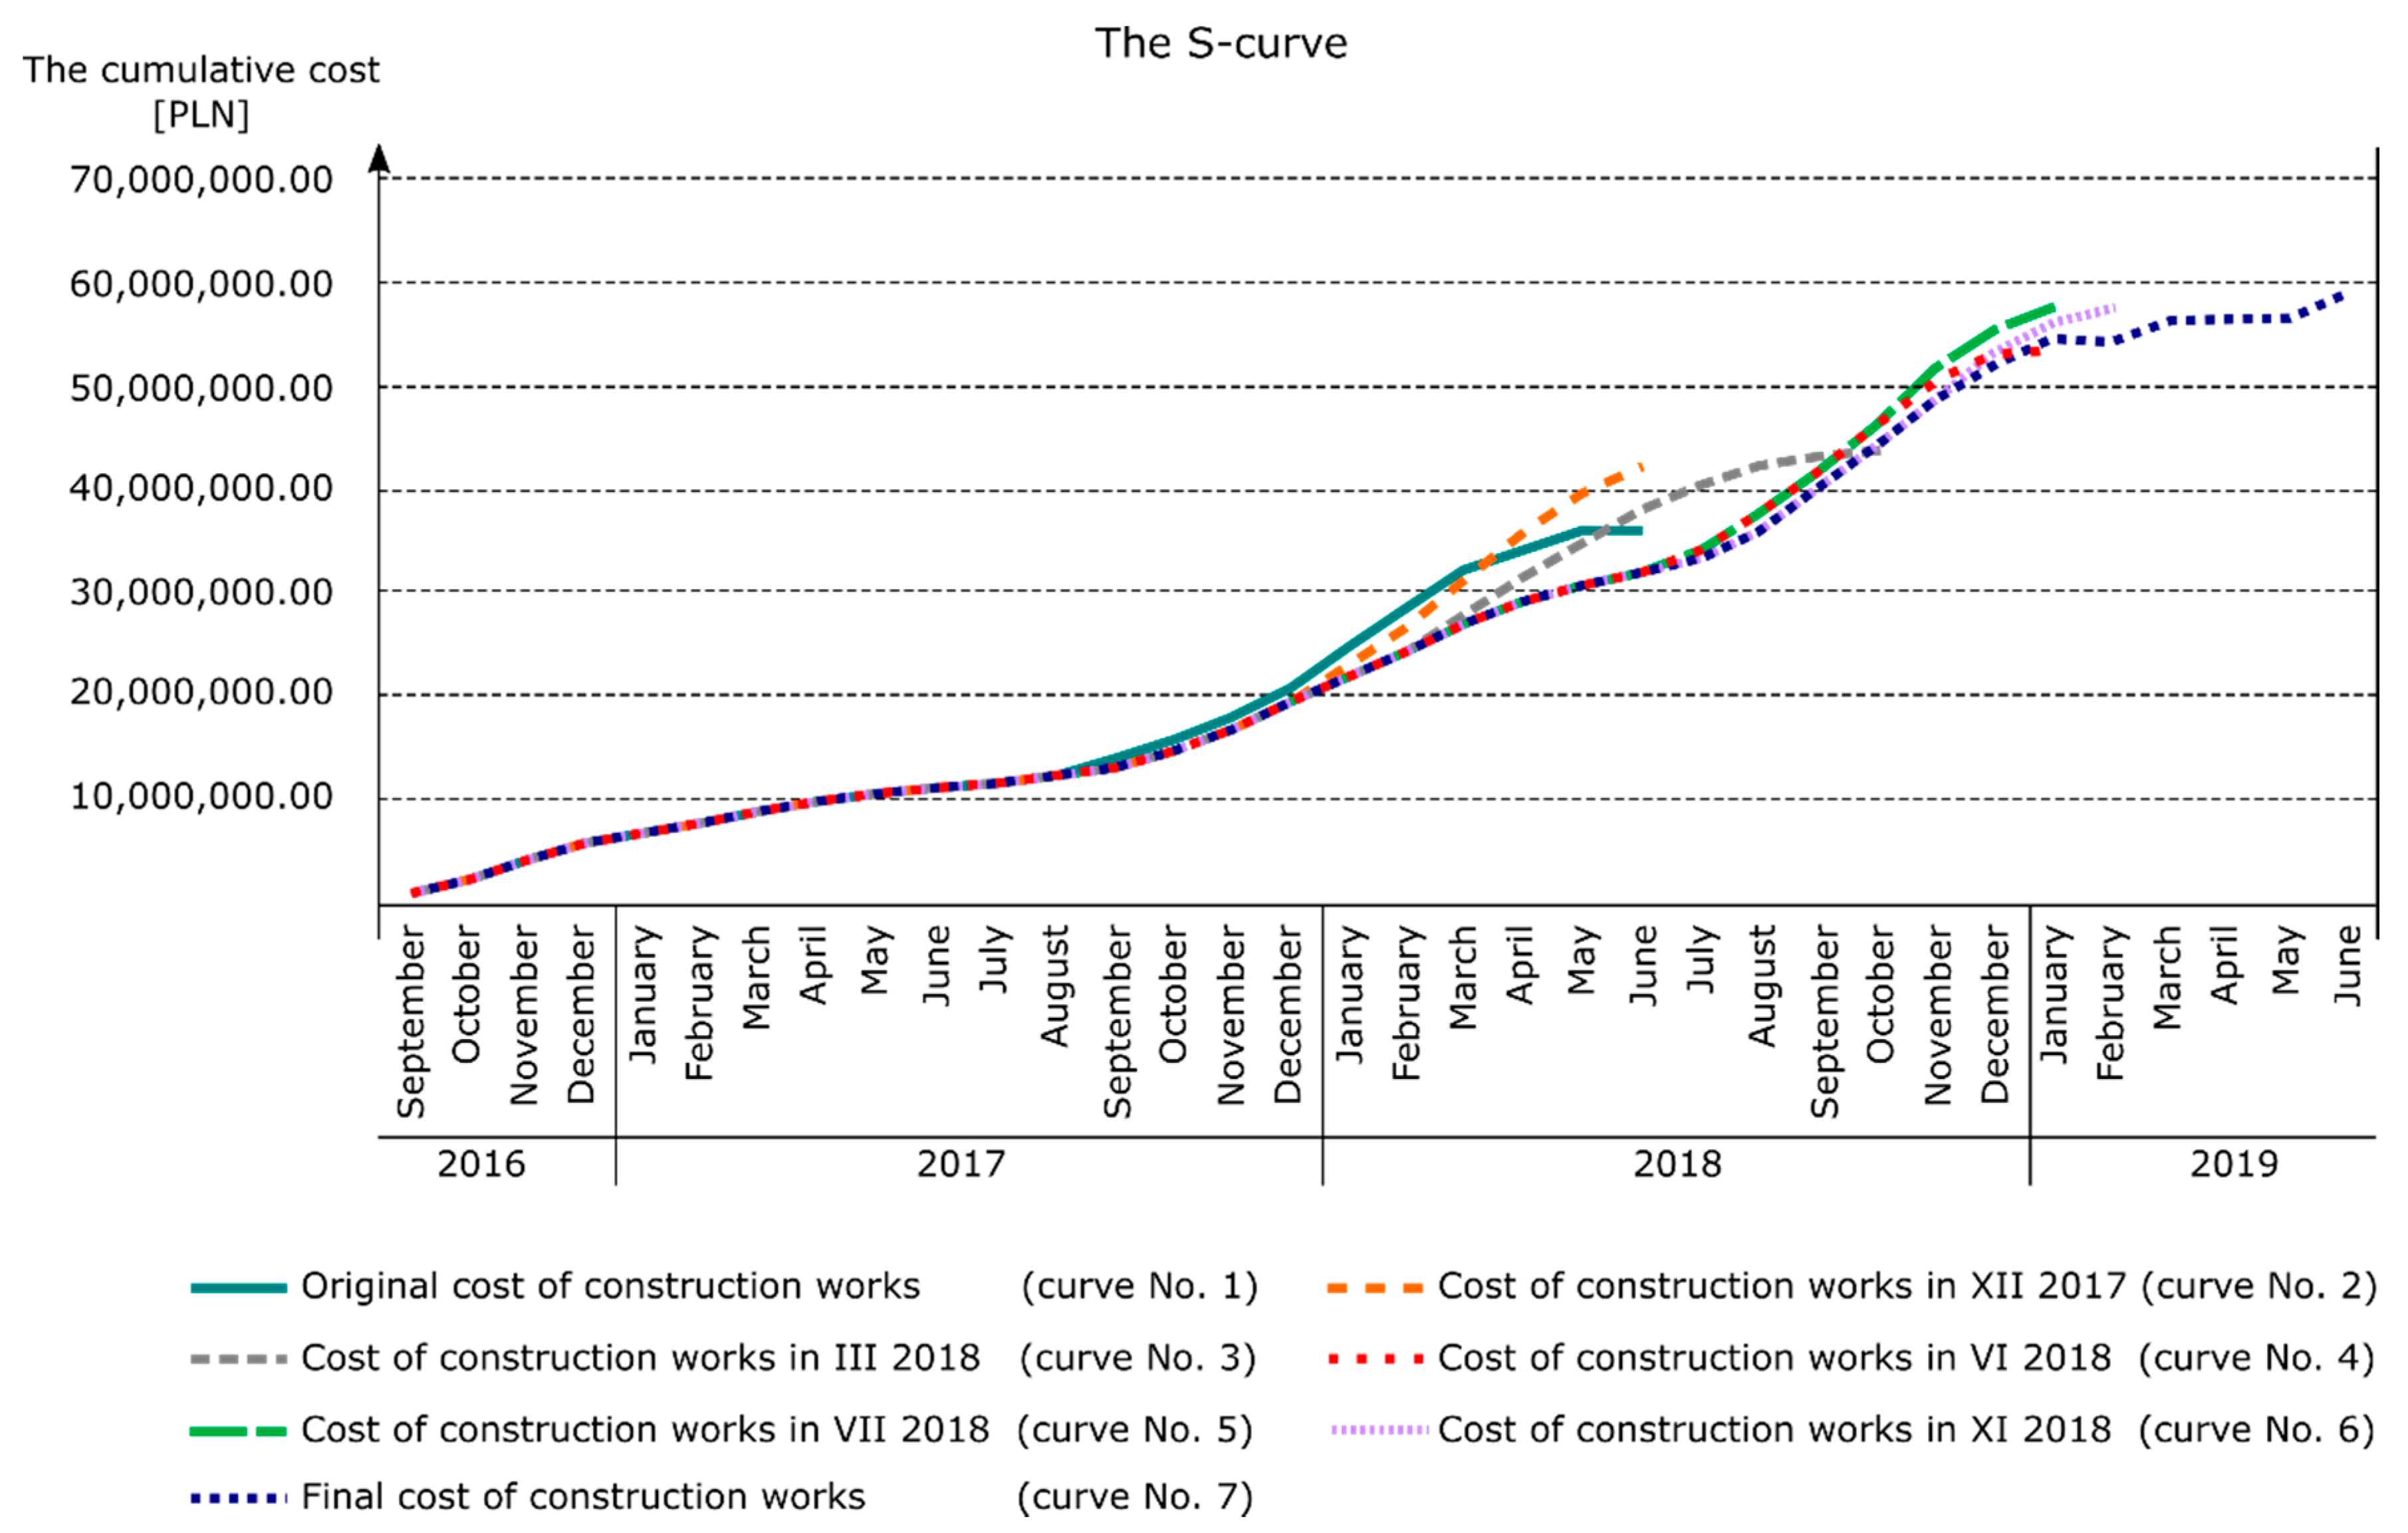
- December 2017: The General Contractor presented, in consultation with the Investor, an updated work schedule that included subsequent annexes regarding changes in the facility, covering door joinery, automation and the building façade, among others. It should be emphasized that the subsequent annexes to the Agreement introduced new elements to its basic scope that were originally excluded from the scope of the General Contractor. Increasing the scope of the subject of the contract concerned the finishing of the premises, including the installation of shower trays and frames in hotel bathrooms. The value of remuneration in December 2017 increased by 17.2% when compared to the Investor’s schedule and reached the level of PLN 42,313,695.00 net. The deadline did not change (curve No. 2 in Figure 2).
- March 2018: The Investor decided to increase the hotel standard (to four stars), which forced the introduction of changes resulting from the difference between the detailed design and the tender design. The changes concerned, among others, sanitary installations, ventilation, electrical installations of rooms, automation and wall arrangement. As a consequence, the value of remuneration increased by 20.8% when compared with the Investor’s schedule, and reached the level of PLN 43,635,084.50 net. The annex to the contract extended the duration of the execution until October 2018 (curve No. 3 in Figure 2).
- June 2018: Another annex significantly modified the basic scope of the contract with the General Contractor (as of September 2017). The Investor commissioned the General Contractor an additional scope of works and, in particular, installations of the residence and public areas (including the hall), catering and multifunctional rooms, and the execution of finishing works involving the equipping of the hotel rooms. The value of remuneration increased by 48.1% when compared to the Investor’s schedule and reached the level of PLN 53,473,979.01 net. The implementation time was extended until January 2019 (curve No. 4 in Figure 2).
- July 2018: Due to the increasing scope of work entrusted to the General Contractor and the extension of the deadline, it was necessary to agree and sign off another annex. Therefore, the value of remuneration increased by 59.4% when compared to the Investor’s schedule and reached the level of PLN 57,564,756.03 net without the end date changing (curve No. 5 in Figure 2), although in October 2018 the investment completion date was extended to February 2019 (curve No. 6 in Figure 2).
- June 2019: final completion of the investment task (i.e., 12 months later than originally planned (June 2018)). The value of remuneration increased by 62.4% and reached the final value of PLN 58,646, 84.75 net (curve No. 7 in Figure 2).
Table 1 summarizes the collected data concerning the completed construction project.
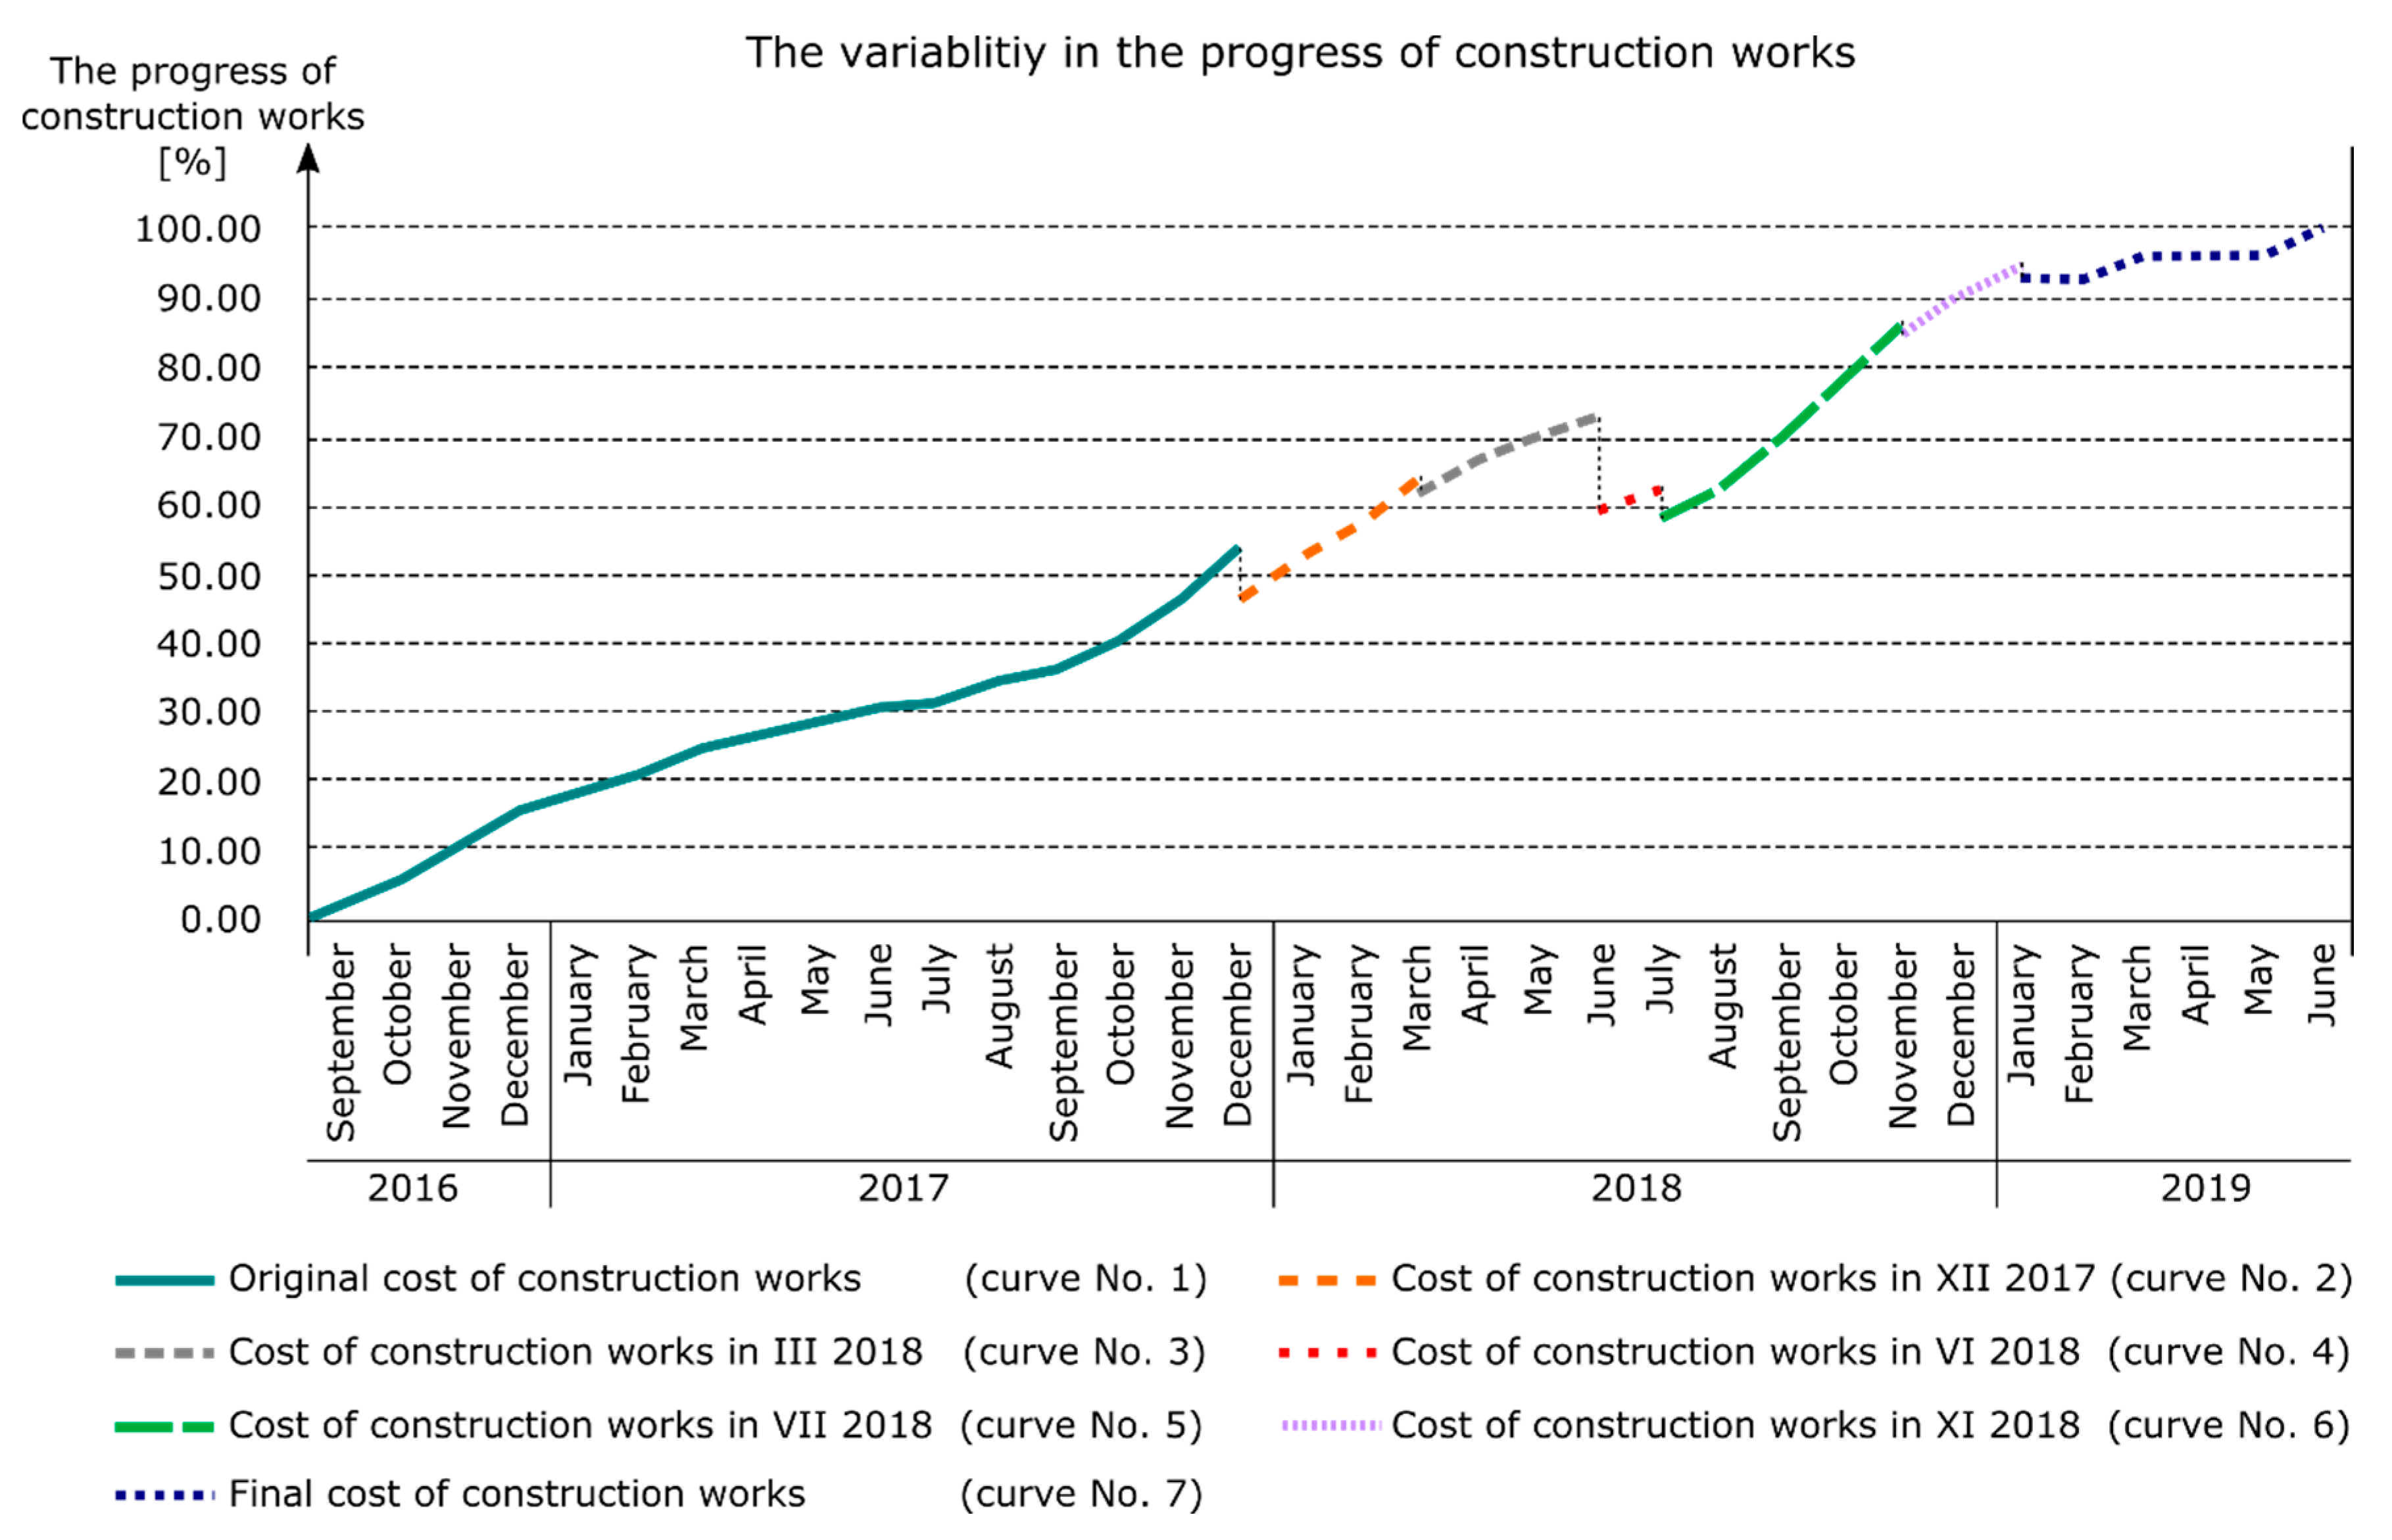
Each subsequent annex to the principal contract (as of September 2016) forced the General Contractor to develop an updated work and expenditure schedule. The updated schedule that was used for the implementation of works modified the actual progress of the work performed. Figure 3 shows the variable work progress that resulted from several work and expenditure schedule updates.
Table 2 summarizes information about individual changes in the remuneration and the completion date of the implemented task.
4. Results of the Case Study
The hotel facility was completed in June 2019 after 34 months of work. The final cost of the construction works amounted to PLN 58,646,000 and therefore was higher by PLN 22,535,000 from the figure originally assumed (as of September 2016). It should also be noted that the actual date of the commissioning and commencement of operation of the hotel was 12 months later than the planned date, resulting in additional financial losses for the Investor.
Analysis of the actual progress of works clearly indicates how much the actual state of implementation of the project differed from that originally assumed. The original budget of the investment task was underestimated. The changes that occurred during the implementation of the project resulted in failure to meet the parameters assumed by the Investor in mid-2016 (i.e., the time and cost of implementing the project).
The following reasons led to the failure of meeting the planned deadlines and implementation costs:
- A lack of appropriate preparation for the construction project in the investment planning phase. The Investor planned the cost of implementing the construction project based on prices that were valid in 2016 and did not take into account increases in prices during the subsequent periods of implementation, or the financial fluctuations over time determined by discounted techniques.
- The Investor’s lack of experience in implementing similar construction projects. The Investor had carried out in the past several smaller projects, but not from the hotel sector.
- Changes in the originally adopted standard of the hotel. The Investor incorrectly analyzed the market demand for hotel buildings and initially adopted a lower standard for the facility than required at this location.
- Changes in the scope of work of the General Contractor. Subsequent scopes of work required the General Contractor to develop additional cost estimates and offers, and this took up additional time. In turn, the increase in the scope of works resulted in a significant increase in employment at the construction site, especially with regard to specialized subcontractors. The extension of the implementation time caused an increase in the indirect costs of the General Contractor.
- The current situation of the market imbalance in the construction industry. In the analyzed project period between 2017 and 2019 there were major problems concerning contracting and subcontracting companies at the initially assumed cost level.
The case study of the analyzed hotel facility enabled the following conclusions to be made regarding the measurement of deviations in the deadlines and budget of the investment task:
- the investment task was completed 12 months later than originally planned;
- the schedule performance efficiency indicator was equal to 1.545, and therefore the project was longer than planned by 54.5%;
- the final cost of the construction works increased by PLN 22,535,338.62 net when compared to the original cost;
- the cost performance efficiency indicator was equal to 1.624, and therefore the project was more expensive than planned by 62.4%;
- analysis of the progress of the hotel facility execution indicates a growing trend of the schedule and cost performance efficiency indicator.
5. Discussion
S-curve provides the basis for monitoring cash flows while planning any construction project. Unfortunately, there is very little likelihood that a project will proceed completely as planned. Small deviations between the plan and the reality can be seen as being within the limits of the norm and usually do not interfere with the purpose. However, greater differences can hinder the goal and require a revision to ensure that project objectives are achieved [12]. The problems of overruns of a planned project budget or rescheduled deadlines are widely recognized in many countries [8,9,37,38].
The simplest scheduling methods utilizing the S-curve are assumed to be deterministic, and do not take into account possible risks and uncertainties. However, there are methods that take into account the use of stochastic curves in probabilistic monitoring and project prediction as an alternative to deterministic curves and traditional forecasting methods. For the generation of stochastic cost curves, a simulation method was adopted based on defining the variability of the duration and the costs of individual activities in the project [39]. The study also used a stochastic model approach to financial management, taking into account the uncertainty of duration and costs at different stages during the project lifecycle [40]. Effective project management requires a reliable knowledge of cash flows at different stages of the project lifecycle. Obtaining this knowledge largely depends on taking into account the precarious environmental conditions of the project, which can be obtained using the method of assessing cash flow based on the project schedule [41]. Uncertainty and imprecision in project planning have been included in cash flow calculation methodologies for projects involving fuzzy activities and/or costs. Cash flow can be represented by the cost area S (as opposed to traditional S-curves) obtained from a combination of cost curves at different risk capability levels. Unfortunately, according to the authors, the proposed concept of the cost area S, in addition to the need to collect a lot of data, also requires the use of advanced software [42].
In the presented case analysis there were continuous time and cost deviations due to poor project management and a lack of application of even the simplest model for monitoring the S-curve. (i.e., using the models indicated in this discussion).
The entire analysis of research conducted by the authors of the paper leads to the main conclusion that the models proposed earlier by various researches of the forecasted S-curve as a rule are not exactly in line with a real state. Some works are too general and too descriptive [15,23]. There are also presented models and methods that are too complicated and thus not very practical or easy to adopt in planning and managing construction projects [3,11,19,40]. In some research, the models seems to be reasonable, however they have not been tested and verified during construction process monitoring [9,15,41]. To make things worse, it is hard to find reliable, proven research data based on solid measures of actually executed construction projects where technical inspections were conducted on construction sites and what was planned, paid and earned was reviewed. Some of the published papers that are accessible have relied on questionnaires, analyses of past documents and assumptions rather than facts [38,39]. However, there are still some strong construction-based papers that present a case study of the application of the S-curve regression method to project control of construction management [17].
One of the authors of the paper represents a strong continuity and solid experience collected from more than 30 years of engineering and construction [7,35]. The main value of the described construction case study is a detailed and systematic analysis of the course of the hotel project that compares the planned costs of the scheduled work with the actual costs of the performed work, as well as the identification of the reasons leading to the failure to meet the planned deadlines and budget of the project’s implementation [34]. The paper demonstrates the reasons and the effects of construction project’s cost overruns and time delays using a representative case study. Both factors were strongly based on the EVM approach, including an indicated project budget breakdown and timeline deviations. According to the newly published Project Management Institute briefings [1], 70% of construction projects are completed with overruns of cost and time. This statement is rather frightening but credible, and the presented case study highlights the state-of-the-art.
6. Summary and Conclusions
Appropriate planning of the investment process is a very important operation with a direct impact on the successful implementation of a construction project via maintenance of the assumed budget and project completion deadline, while ensuring a consistent quality of on-going construction work. Correct planning of cash flows is of key importance for Investors and contractors, preferably taking into account financial fluctuations over time determined by discounted techniques.
Planning of costs also has a significant impact on the financial liquidity of construction companies. There is therefore a need to develop simple, fast and effective methods that enable cash flows to be properly planned and controlled. A very helpful tool for planning, monitoring and controlling construction projects is the S-curve. Knowledge of the planned and actual course of cumulative financial expenditures over time and the shape of the S-curve and its deviations permits rational actions to be taken in order to achieve the intended goal and achieve success in construction project implementation.
Cumulative cost S-curves, due to their uniqueness, are unrepeatable. Each construction project is unique because it is situated in a different location and different environment; designed and implemented by different work teams; and carried out using various technical, organizational and technological solutions. Therefore, it is justified to conduct further research into the course of cash flows and cost planning. The development of a methodology for planning cumulative cost curves in construction projects will allow the development of effective methods and verified models for better planning and utilizing financial expenditures during construction works.
Author Contributions
Conceptualization, J.K. and M.S.; Methodology, J.K. and M.S.; Formal analysis, M.S.; Resources, J.K. and M.S.; Writing—Original draft preparation, J.K. and M.S.; Supervision, J.K.; Project administration, M.S.; All authors have read and agreed to the published version of the manuscript.
Funding
This research received no external funding.
Conflicts of Interest
The authors declare no conflict of interest.
References and Note
- Project Management Institute. A Guide to the Project Management Body of Knowledge (PMBOK GUIDE), 6th ed.; Project Management Institute (PMI): Newtown Square, PA, USA, 2017. [Google Scholar]
- Plebankiewicz, E.; Zima, K. Wieczorek Damian Life cycle cost modelling of buildings with consideration of the risk. Arch. Civ. Eng. 2016, 62, 149–166. [Google Scholar]
- Kern, A.P.; Formoso, C.T. A model for integrating cost management and production planning and control in construction. J. Financ. Manag. Prop. Constr. 2006, 11, 75–90. [Google Scholar] [CrossRef]
- Hoła, B.; Sawicki, M.; Skibniewski, M. An IT model of a Knowledge Map which supports management in small and medium-sized companies using selected Polish construction enterprises as an example. J. Civ. Eng. Manag. 2015, 21, 1014–1026. [Google Scholar] [CrossRef] [Green Version]
- Kasprowicz, T. Quantitative Identification of Construction Risk. Arch. Civ. Eng. 2017, 63, 63–75. [Google Scholar] [CrossRef] [Green Version]
- Zavadskas, E.K.; Turskis, Z.; Tamošaitienė, J. Risk assessment of construction projects. J. Civ. Eng. Manag. 2010, 16, 33–46. [Google Scholar] [CrossRef] [Green Version]
- Konior, J. Enterprise’s Risk Assessment of Complex Construction Projects. Arch. Civ. Eng. 2015, 61, 63–74. [Google Scholar] [CrossRef] [Green Version]
- Makesh, S.; Mathivanan, M. Analysis on causes of delay in building construction. Int. J. Innov. Technol. Explor. Eng. 2019, 8, 335–341. [Google Scholar]
- Rachid, Z.; Toufik, B.; Mohammed, B. Causes of schedule delays in construction projects in Algeria. Int. J. Constr. Manag. 2019, 19, 371–381. [Google Scholar] [CrossRef]
- Połoński, M. Management of Construction Investment Process; Wydawnictwo SGGW (in Polish): Warszawa, Poland, 2018. [Google Scholar]
- Leśniak, A.; Zima, K. Cost Calculation of Construction Projects Including Sustainability Factors Using the Case Based Reasoning (CBR) Method. Sustainability 2018, 10, 1608. [Google Scholar] [CrossRef] [Green Version]
- Al-Jibouri, S.H. Monitoring systems and their effectiveness for project cost control in construction. Int. J. Proj. Manag. 2003, 21, 145–154. [Google Scholar] [CrossRef] [Green Version]
- Lo, W.; Chen, Y.-T. Optimization of Contractor’s S-Curve. In Proceedings of the 24th International Symposium on Automation & Robotics in Construction (ISARC 2007), 19–21 September 2007; pp. 417–420. Available online: https://www.irbnet.de/daten/iconda/CIB11259.pdf (accessed on 18 March 2020).
- Chao, L.-C.; Chen, H.-T. Predicting project progress via estimation of S-curve’s key geometric feature values. Autom. Constr. 2015, 57, 33–41. [Google Scholar] [CrossRef]
- Cristóbal, J.R.S. The S-curve envelope as a tool for monitoring and control of projects. Procedia Comput. Sci. 2017, 121, 756–761. [Google Scholar] [CrossRef]
- Hsieh, T.Y.; Wang, M.H.L.; Chen, C.W.; Chen, C.Y.; Yu, S.E.; Yang, H.C.; Chen, T.H. A new viewpoint of s-curve regression model and its application to construction management. Int. J. Artif. Intell. Tools 2006, 15, 131–142. [Google Scholar] [CrossRef]
- Hsieh, T.-Y.; Hsiao-Lung Wang, M.; Chen, C.-W. A Case Study of S-Curve Regression Method to Project Control of Construction Management via T-S Fuzzy Model. J. Mar. Sci. Technol. 2004, 12, 209–216. [Google Scholar]
- Chao, L.-C.; Chien, C.-F. Estimating Project S-Curves Using Polynomial Function and Neural Networks. J. Constr. Eng. Manag. 2009, 135, 169–177. [Google Scholar] [CrossRef]
- Chao, L.-C.; Chien, C.-F. A Model for Updating Project S-curve by Using Neural Networks and Matching Progress. Autom. Constr. 2010, 19, 84–91. [Google Scholar] [CrossRef]
- Kim, B.C.; Reinschmidt, K. An S-curve Bayesian model for forecasting probability distributions on project duration and cost at completion. In Proceedings of the CME 25 Conference of Construction Management and Economics, Reading, UK, 16–18 July 2007; pp. 1449–1459. [Google Scholar]
- Cheng, Y.M.; Yu, C.H.; Wang, H.T. Short-interval dynamic forecasting for actual S-curve in the construction phase. J. Constr. Eng. Manag. 2011, 137, 933–941. [Google Scholar] [CrossRef]
- Chen, H.L.; Chen, W.T.; Lin, Y.L. Earned value project management: Improving the predictive power of planned value. Int. J. Proj. Manag. 2016, 34, 22–29. [Google Scholar] [CrossRef]
- De Marco, A.; Narbaev, T. Earned value-based performance monitoring of facility construction projects. J. Facil. Manag. 2013, 11, 69–80. [Google Scholar] [CrossRef] [Green Version]
- Dziadosz, A.; Kapliński, O.; Rejment, M. Usefulness and fields of the application of the Earned Value Management in the implementation of construction projects. Bud. Archit. 2014, 13, 357–364. [Google Scholar]
- Waris, M.; Khamidi, M.F.; Idrus, A. The Cost Monitoring of Construction Projects through Earned Value Analysis. J. Constr. Eng. Proj. Manag. 2012, 2, 42–45. [Google Scholar] [CrossRef] [Green Version]
- Bhosekar, S.K.; Vyas, G. Cost Controlling Using Earned Value Analysis in Construction Industries. Int. J. Eng. Innov. Tech. 2012, 1, 324–332. [Google Scholar]
- Vandevoorde, S.; Vanhoucke, M. A comparison of different project duration forecasting methods using earned value metrics. Int. J. Proj. Manag. 2006, 24, 289–302. [Google Scholar] [CrossRef]
- Kwon, O.; Kim, S.; Paek, J.; Eom, S.-J. Application of Earned Value in the Korean Construction Industry. J. Asian Archit. Build. Eng. 2008, 7, 69–76. [Google Scholar] [CrossRef] [Green Version]
- Khamidi, M.F.; Ali, W.; Idrus, A. Application of Earned Value Management System on an Infrastructure Project: A Malaysian Case Study. Int. Conf. Manag. Sci. Eng. 2011, 8, 1–5. [Google Scholar]
- Połoński, M.; Komendarek, P. Earned value method for operational cost control of civil structure. Quantit. Meth. Econ. 2011, 12, 279–290. [Google Scholar]
- Howes, R. Improving the performance of Earned Value Analysis as a construction project management tool. Eng. Constr. Archit. Manag. 2000, 7, 399–411. [Google Scholar] [CrossRef]
- Czemplik, A. Application of earned value method to progress control of construction projects. Procedia Eng. 2014, 91, 424–428. [Google Scholar] [CrossRef] [Green Version]
- Przywara, D.; Rak, A. The time-cost analysis of schedule monitoring using the earned value method. Tech. Trans. 2017, 5, 57–66. [Google Scholar]
- Bauer-Celny, A.; Konior, J.; Szóstak, M. PM Group Polska sp. z o.o. 2006–2015 and 3EPCM sp. z o.o. 2016–2019, “Initial, Monthly, Close-out Reporting of Bank Investment Supervision”.
- Konior, J. Monitoring of Construction Projects Feasibility by Bank Investment Supervision Approach. Civ. Eng. Archit. 2019, 7, 31–35. [Google Scholar] [CrossRef] [Green Version]
- Kozień, E. Application of approximation technique to on-line updating of the actual cost curve in the earned value method. Czas. Tech. 2017, 9, 181–195. [Google Scholar]
- Gardezi, S.S.S.; Manarvi, I.A.; Gardezi, S.J.S. Time Extension Factors in Construction Industry of Pakistan. Procedia Eng. 2014, 77, 196–204. [Google Scholar] [CrossRef] [Green Version]
- Gebrehiwet, T.; Luo, H. Analysis of Delay Impact on Construction Project Based on RII and Correlation Coefficient: Empirical Study. Procedia Eng. 2017, 196, 366–374. [Google Scholar] [CrossRef]
- Barraza, G.A.; Back, W.E.; Mata, F. Probabilistic Forecasting of Project Performance Using Stochastic S Curves. J. Constr. Eng. Manag. 2004, 130, 25–32. [Google Scholar] [CrossRef]
- Yao, J.-S.; Chen, M.-S.; Lu, H.-F. A fuzzy stochastic single-period model for cash management. Eur. J. Oper. Res. 2006, 170, 72–90. [Google Scholar] [CrossRef]
- Mohagheghi, V.; Meysam Mousavi, S.; Vahdani, B. An Assessment Method for Project Cash Flow under Interval-Valued Fuzzy Environment. J. Optim. Ind. Eng. 2017, 22, 79–80. [Google Scholar]
- Maravas, A.; Pantouvakis, J.-P. Project cash flow analysis in the presence of uncertainty in activity duration and cost. Int. J. Proj. Manag. 2012, 30, 374–384. [Google Scholar] [CrossRef]
Figure 1.
Investor’s work and expenditure schedule of the analyzed hotel facility (own elaboration).
Figure 1.
Investor’s work and expenditure schedule of the analyzed hotel facility (own elaboration).

Figure 2.
Planned and actual cumulative costs of the completed hotel facility (own elaboration).

Figure 3.
Variability in the progress of construction works as a result of updating the work and expenditure schedule of the hotel facility (own elaboration).
Figure 3.
Variability in the progress of construction works as a result of updating the work and expenditure schedule of the hotel facility (own elaboration).


Table 1.
Results of measurements and cost analyses of the assessed hotel facility (own elaboration).
Table 1.
Results of measurements and cost analyses of the assessed hotel facility (own elaboration).
| No. | Period | The Budgeted Cost of Work Scheduled According to the Work and Expenditure Schedule | The Cumulative Value of the Budgeted Cost of Work Scheduled | The Actual Cost of Work Performed | The Cumulative Value of the Actual Cost of Work Performed | The Actual Percentage Advancement of Work Performed | The Planned Percentage Advancement of Work Scheduled | The Actual Percentage Advancement of Work Scheduled |
|---|---|---|---|---|---|---|---|---|
| (1) | (2) | (3) | (4) | (5) | (6) | (7) | (8) | (9) |
| [–] | [–] | [PLN] | [PLN] | [PLN] | [PLN] | [%] | [%] | [%] |
| 1 | Sep.16 | 743,145.00 | 743,145.00 | 743,145.00 | 743,145.00 | 1.27 | 2.06 | 2.06 |
| 2 | Oct.16 | 1,342,960.76 | 2,086,105.76 | 1,342,960.76 | 2,086,105.76 | 3.56 | 5.78 | 5.78 |
| 3 | Nov.16 | 1,962,497.14 | 4,048,602.90 | 1,962,497.14 | 4,048,602.90 | 6.90 | 11.21 | 11.21 |
| 4 | Dec.16 | 1,786,729.02 | 5,835,331.92 | 1,786,729.02 | 5,835,331.92 | 9.95 | 16.16 | 16.16 |
| 5 | Jan.17 | 890,075.82 | 6,725,407.74 | 890,075.82 | 6,725,407.74 | 11.47 | 18.62 | 18.62 |
| 6 | Feb.17 | 1,024,911.29 | 7,750,319.03 | 1,024,911.28 | 7,750,319.02 | 13.22 | 21.46 | 21.46 |
| 7 | Mar.17 | 1,124,204.85 | 8,874,523.88 | 1,124,204.85 | 8,874,523.87 | 15.13 | 24.58 | 24.58 |
| 8 | Apr.17 | 899,863.73 | 9,774,387.61 | 899,863.73 | 9,774,387.60 | 16.67 | 27.07 | 27.07 |
| 9 | May 17 | 860,000.82 | 10,634,388.43 | 860,000.82 | 10,634,388.42 | 18.13 | 29.45 | 29.45 |
| 10 | Jun.17 | 537,721.00 | 11,172,109.43 | 537,721.00 | 11,172,109.42 | 19.05 | 30.94 | 30.94 |
| 11 | Jul.17 | 293,524.63 | 11,465,634.06 | 293,524.63 | 11,465,634.05 | 19.55 | 31.75 | 31.75 |
| 12 | Aug.17 | 1,064,465.00 | 12,530,099.06 | 1,072,251.29 | 12,537,885.34 | 21.38 | 34.70 | 34.72 |
| 13 | Sep.17 | 1,236,413.52 | 13,766,512.58 | 614,825.93 | 13,152,711.27 | 22.43 | 38.12 | 36.42 |
| 14 | Oct.17 | 1,998,683.50 | 15,765,196.08 | 1,509,792.56 | 14,662,503.83 | 25.00 | 43.66 | 40.60 |
| 15 | Nov.17 | 2,195,751.00 | 17,960,947.08 | 2,231,802.48 | 16,894,306.31 | 28.81 | 49.74 | 46.78 |
| 16 | Dec.17 | 2,925,234.00 | 20,886,181.08 | 2,559,405.11 | 19,453,711.42 | 33.17 | 57.84 | 53.87 |
| 17 | Jan.18 | 3,816,618.00 | 24,702,799.08 | 2,644,027.80 | 22,097,739.22 | 37.68 | 68.41 | 61.19 |
| 18 | Feb.18 | 3,825,234.00 | 28,528,033.08 | 2,202,625.30 | 24,300,364.52 | 41.44 | 79.00 | 67.29 |
| 19 | Mar.18 | 3,540,993.30 | 32,069,026.38 | 2,905,521.47 | 27,205,885.99 | 46.39 | 88.81 | 75.34 |
| 20 | Apr.18 | 2,408,845.75 | 34,477,872.13 | 1,947,719.29 | 29,153,605.28 | 49.71 | 95.48 | 80.73 |
| 21 | May.18 | 1,358,443.00 | 35,836,315.13 | 1,488,799.77 | 30,642,405.05 | 52.25 | 99.24 | 84.86 |
| 22 | Jun.18 | 274,831.00 | 36,111,146.13 | 1,191,291.00 | 31,833,696.05 | 54.28 | 100.00 | 88.15 |
| 23 | Jul.18 | 0.00 | 36,111,146.13 | 1,622,583.04 | 33,456,279.09 | 57.05 | 100.00 | 92.65 |
| 24 | Aug.18 | 0.00 | 36,111,146.13 | 2,415,758.53 | 35,872,037.62 | 61.17 | 100.00 | 99.34 |
| 25 | Sep.18 | 0.00 | 36,111,146.13 | 4,252,403.78 | 40,124,441.40 | 68.42 | 100.00 | 111.11 |
| 26 | Oct.18 | 0.00 | 36,111,146.13 | 4,722,806.07 | 44,847,247.47 | 76.47 | 100.00 | 124.19 |
| 27 | Nov.18 | 0.00 | 36,111,146.13 | 4,470,580.10 | 49,317,827.57 | 84.09 | 100.00 | 136.57 |
| 28 | Dec.18 | 0.00 | 36,111,146.13 | 3,013,286.20 | 52,331,113.77 | 89.23 | 100.00 | 144.92 |
| 29 | Jan.19 | 0.00 | 36,111,146.13 | 2,226,044.30 | 54,557,158.07 | 93.03 | 100.00 | 151.08 |
| 30 | Feb.19 | 0.00 | 36,111,146.13 | 0.00 | 54,557,158.07 | 93.03 | 100.00 | 151.08 |
| 31 | Mar.19 | 0.00 | 36,111,146.13 | 2,014,670.58 | 56,571,828.65 | 96.46 | 100.00 | 156.66 |
| 32 | Apr.19 | 0.00 | 36,111,146.13 | 0.00 | 56,571,828.65 | 96.46 | 100.00 | 156.66 |
| 33 | May.19 | 0.00 | 36,111,146.13 | 0.00 | 56,571,828.65 | 96.46 | 100.00 | 156.66 |
| 34 | Jun.19 | 0.00 | 36,111,146.13 | 2,074,556.10 | 58,646,384.75 | 100.00 | 100.00 | 162.41 |
Table 2.
Results of measurements and cost analyses of the assessed hotel facility (own elaboration).
Table 2.
Results of measurements and cost analyses of the assessed hotel facility (own elaboration).
| Work and Expenditure Schedule | Duration | Cost of Construction Works | Deviation from Schedule | Deviation from Budget | Schedule Performance Indicator | Cost Performance Indicator |
|---|---|---|---|---|---|---|
| (1) | (2) | (3) | (4) | (5) | (6) | (7) |
| [–] | [months] | [PLN] | [months] | [PLN] | [–] | [–] |
| Original cost of construction works | 22 | 36,111,146.13 | - | - | - | - |
| Cost of construction works in Dec. 2017 | 22 | 42,313,695.00 | 0 | 6,202,548.87 | 1.000 | 1.172 |
| Cost of construction works in Mar. 2018 | 26 | 4, 635,084.50 | 4 | 7,523,938.37 | 1.182 | 1.208 |
| Cost of construction works in Jun. 2018 | 29 | 53,473,979.01 | 7 | 17,362,832.88 | 1.318 | 1.481 |
| Cost of construction works in Jul. 2018 | 29 | 57,564,756.03 | 7 | 21,453,609.90 | 1.318 | 1.594 |
| Cost of construction works in Nov. 2018 | 30 | 57,564,756.03 | 8 | 21,453,609.90 | 1.364 | 1.594 |
| Final cost of construction works | 34 | 58,646,384.75 | 12 | 22,535,238.62 | 1.545 | 1.624 |
© 2020 by the authors. Licensee MDPI, Basel, Switzerland. This article is an open access article distributed under the terms and conditions of the Creative Commons Attribution (CC BY) license (http://creativecommons.org/licenses/by/4.0/).
Share and Cite
MDPI and ACS Style
Konior, J.; Szóstak, M. The S-Curve as a Tool for Planning and Controlling of Construction Process—Case Study. Appl. Sci. 2020, 10, 2071. https://0-doi-org.brum.beds.ac.uk/10.3390/app10062071
AMA Style
Konior J, Szóstak M. The S-Curve as a Tool for Planning and Controlling of Construction Process—Case Study. Applied Sciences. 2020; 10(6):2071. https://0-doi-org.brum.beds.ac.uk/10.3390/app10062071
Chicago/Turabian StyleKonior, Jarosław, and Mariusz Szóstak. 2020. "The S-Curve as a Tool for Planning and Controlling of Construction Process—Case Study" Applied Sciences 10, no. 6: 2071. https://0-doi-org.brum.beds.ac.uk/10.3390/app10062071
Note that from the first issue of 2016, this journal uses article numbers instead of page numbers. See further details here.