Parametric Investigation of Effect of Abnormal Process Conditions on Self-Piercing Riveting


1
Joining Research Group, Korea Institute of Industrial Technology, Incheon 21999, Korea
2
Department of Mechanical and Materials Engineering, Portland State University, Portland, OR 97201, USA
*
Authors to whom correspondence should be addressed.
Appl. Sci. 2020, 10(7), 2520; https://0-doi-org.brum.beds.ac.uk/10.3390/app10072520
Submission received: 11 March 2020
/
Revised: 29 March 2020
/
Accepted: 2 April 2020
/
Published: 6 April 2020
(This article belongs to the Special Issue Recent Advances in Joining and Welding Technology Coping with New Material Combination)
Abstract
:Self-piercing riveting (SPR) is one of the mechanical joining processes, and its application to Al/Fe dissimilar materials combination, which is hard to weld, is expanding in the automotive industry. The main process parameters in SPR are types of rivet and die, setting force, and rivet setting speed. Previously, the relationship between the main process parameters and output parameters such as cross-sectional characteristics and joint strength has been studied to optimize the SPR process. In practical applications, there are unexpected and abnormal process conditions such as poor fit-up, angular misalignment, edge offset distance, and inaccurate setting and pre-clamping forces, and their effects on the joining quality have not been discussed. In this study, parametric investigation was performed using an experimental design on SPR joints for 1 mm-thick high strength steel (590 DP) and 2 mm-thick Al alloy (Al5052-H32). The main effect of each level of the abnormal process parameters on the output parameters was statistically investigated, and the analysis of variance was performed for each abnormal process parameter. In the range of abnormal process conditions applied, the set force was the most significant factor affecting the output parameters, and the effect of pre-clamping force on the output parameters was the least significant.
1. Introduction
In order to improve fuel efficiency and crashworthiness in the automotive industry, the application of various materials rather than the conventional mild steel has been expanding [1]. Increased application of non-ferrous metals and dissimilar material combinations now requires non-conventional joining processes instead of resistance spot welding (RSW) and gas metal arc welding (GMAW), which are the main joining processes in car body manufacturing. Since non-ferrous metals and dissimilar materials have poor weldability due to poor solubility, cracking, porosity formation, and so on, mechanical joining processes have been applied instead of fusion welding processes. The representative mechanical joining processes are blind riveting, clinching, self-piercing riveting (SPR), and high speed bolt joining such as flow drilling screw [2,3,4].
Compared with other mechanical joining processes, SPR process has several advantages such as a wide range of base materials, no need for a pre-drilled hole, high load-bearing capacity, and fast cycle time. In the automotive industry, it has been successfully applied to high-volume vehicles such as the Ford F150, which sold over 1 million units. [5]. During the SPR process, a semi-tubular rivet is penetrated into two or more sheets, and its skirts flare into the bottom sheet with the guidance of a die. A high setting force and rigid C-frame are also essential requirements for the SPR process because it is a cold-forming process with piercing and flaring phases [5,6].
As the need for SPR process increases, various kinds of studies have been published. Porcaro et al. presented the failure load model for Al SPR joints under pull-out and shear loading conditions [7]. Haque et al. also evaluated the joint strength in lap-shear and cross-tension loading conditions [8]. Sun et al. [9] and Haque et al. [10] defined the cross-sectional characteristics that can alter the mechanical properties of the joint. Previous studies have discussed the joint characteristics according to various combinations such as Al/Fe [11,12], CFRP/metal [13], CFRP/steel/Al [14], clad steel/Al [15], and pre-coated steel sheets [16]. As the hardware elements of the SPR process, various combinations of rivet and die have been experimentally evaluated to investigate the effects of shape [17,18,19] and coating [20,21,22]. Numerical models have been developed to simulate the riveting process and optimize the rivet, die, and process parameters [23,24]. Galvanic corrosion as an important issue in dissimilar metal joints has been discussed in the literature [25,26]. The fatigue behavior of SPR joints has been investigated for Al alloys [27,28,29,30] and dissimilar material combinations [28,31].
In most studies, the rivet, die, and setting force are considered as the main process parameters for given material combinations. In a few publications, a rivet setting speed was additionally considered as a process parameter when a servo gun was used [32,33]. From extensive experiences of RSW for sheet metal, it is known that there are diverse abnormal process conditions that are not usually considered as process control parameters but affect the quality of welding. Brown et al. suggested four setup faults such as angular misalignment, fit-up faults, axial misalignment, and edge welds during RSW [34]. Li et al. added poor cooling and electrode wear as abnormal welding conditions regarding an electrode, and they investigated the relationship between abnormal conditions and RSW quality [35,36,37]. Recently, there have been attempts to apply optimization using machine learning algorithms to automotive spot welds [38,39]. The distinction between control and noise parameters is a prerequisite for process parameter optimization and database construction. However, most studies for the SPR processes have only focused on the main process parameters, and far too little attention has been paid to the study of abnormal process conditions.
In this study, five factors such as poor fit-up, angular misalignment, edge offset distance, and inexact setting and pre-clamping forces are selected as abnormal process conditions in the SPR process. An experimental design was implemented to analyze the effect of abnormal process conditions on the cross-sectional characteristics and tensile shear strength of the SPR joint.
2. Experimental Setup
The base metals used were 1.0 mm-thick dual phase steel DP 590 on the top and 2.0 mm-thick Al alloy Al 5052-H32 on the bottom. The material properties are given in Table 1 [12].
The joining trials were performed on a hydraulic-type riveting machine (Rivset Gen2, BÖLLHOFF) with a maximum setting force of 78 kN. The rivet was made of boron steel with a hardness of 480 ± 30 HV, and it has an Almac® coating, which is a mechanical coating with Al and zinc. The rivet and die were supplied by BÖLLHOFF, and their schematic diagram and dimensions are given in Figure 1.
In total, five abnormal process conditions were considered in this study; two parameters were related to the forces, and three parameters were related to the specimen setting. On the automotive manufacturing sites, a large number of welding power supplies are connected to the main power supply, sometimes without individual power regulators. The variation in the electric power and pneumatic supply may lead to an inaccurate welding current and electrode force in RSW. Similarly in SPR, the fluctuations in the electric power input to the individual machines resulted in inaccurate forces from the rivet guns. So, an inaccurate setting force and pre-clamping force are considered as the force-related abnormal process conditions, and their levels in the experimental design are shown in Table 2. Poor fit-up, angular misalignment, and edge offset distance are considered as the specimen setting-related abnormal process conditions. Their definitions and levels are given in Figure 2 and Table 2, respectively. In particular, in manufacturing fields, there are various modes of joint gaps, so six levels are assigned for poor fit-up.
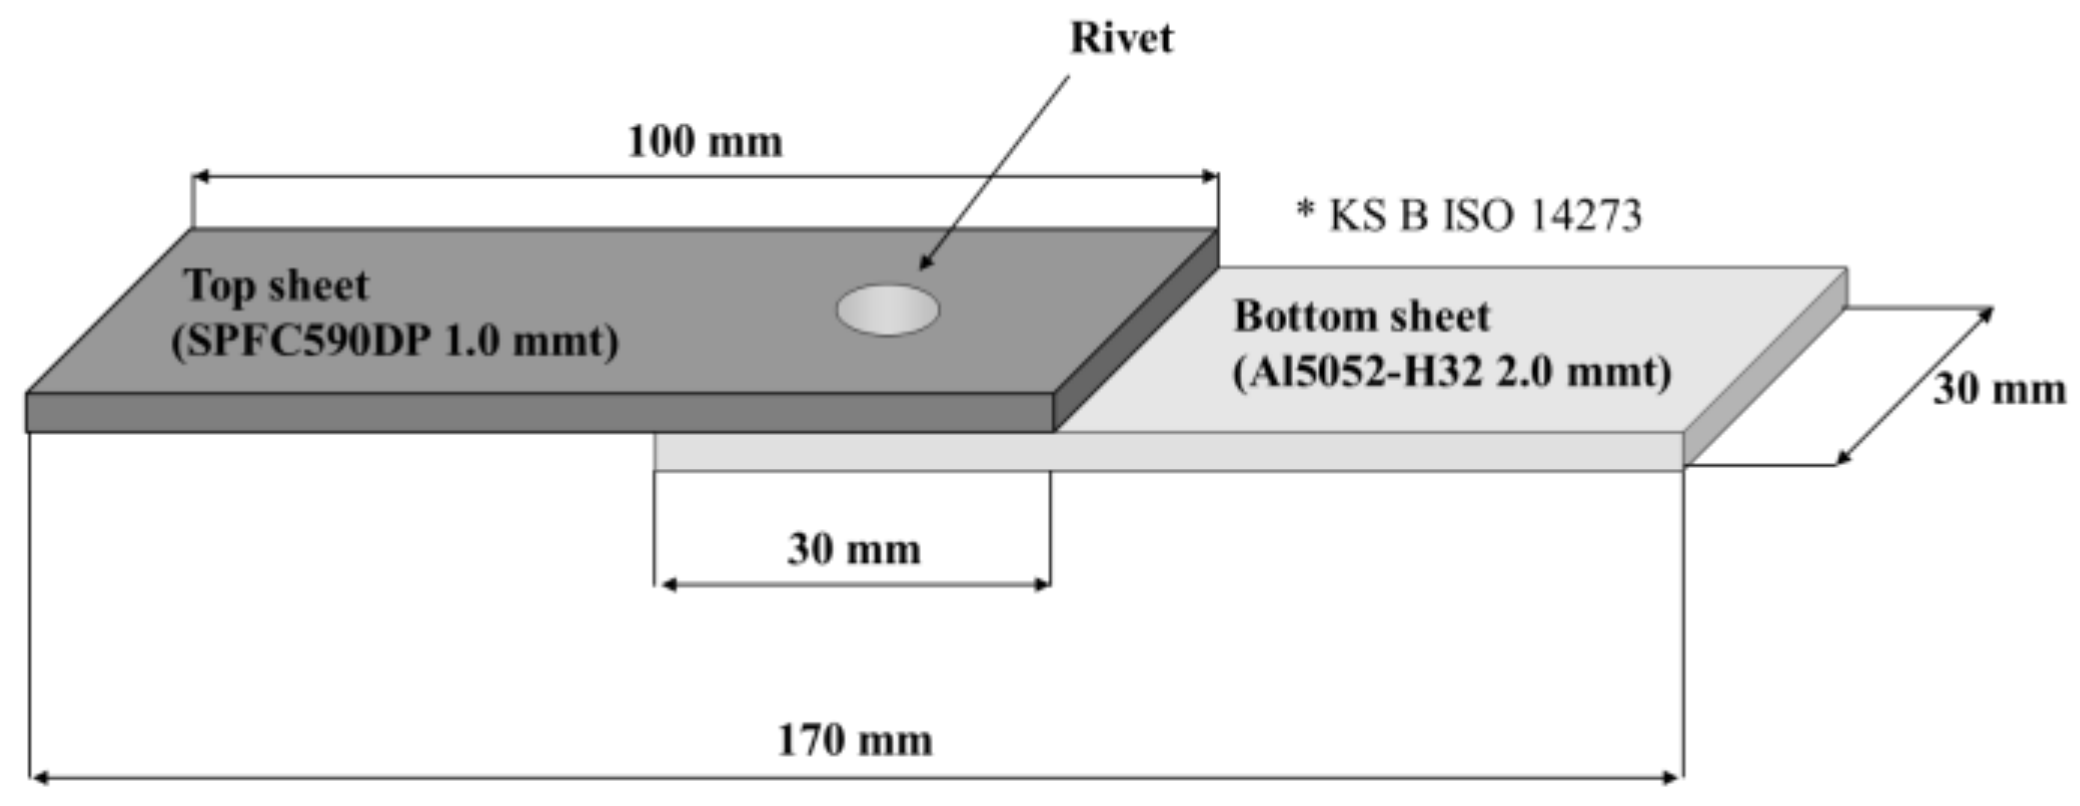
An L18 (61 × 34) experiment design was adopted as shown in Table 3, and five specimens per condition were prepared according to ISO 14237 (Figure 3). For two samples per condition, cross-sections were observed using an optical microscope to measure the cross-sectional characteristics of head height, bottom thickness, and interlock, which are known as the main geometric aspects to be controlled (Figure 4) [5]. The static tensile-shear test for three samples per condition were conducted according to ISO 14273. In the tensile-shear test, the head speed was 5 mm/min, and the tensile load at fracture was measured and called the tensile-shear strength (TSS) in this paper.
The measured and averaged data per condition were analyzed with the commercial statistics software MINITAB®. In this study, the main effects of input parameters, which are the means of output at each level of the input parameters, were calculated. In addition, the analysis of variance (ANOVA) for each input parameter was conducted, and the p-value, p was calculated. When p is less than 0.05, the effect of the input parameters on the output parameter is statistically significant at a significance level of α = 0.05, which means that there is a 5% risk to conclude that the effect of the parameter is significant. Correlation between output parameters was analyzed using a Pearson correlation coefficient.
3. Results and Discussion
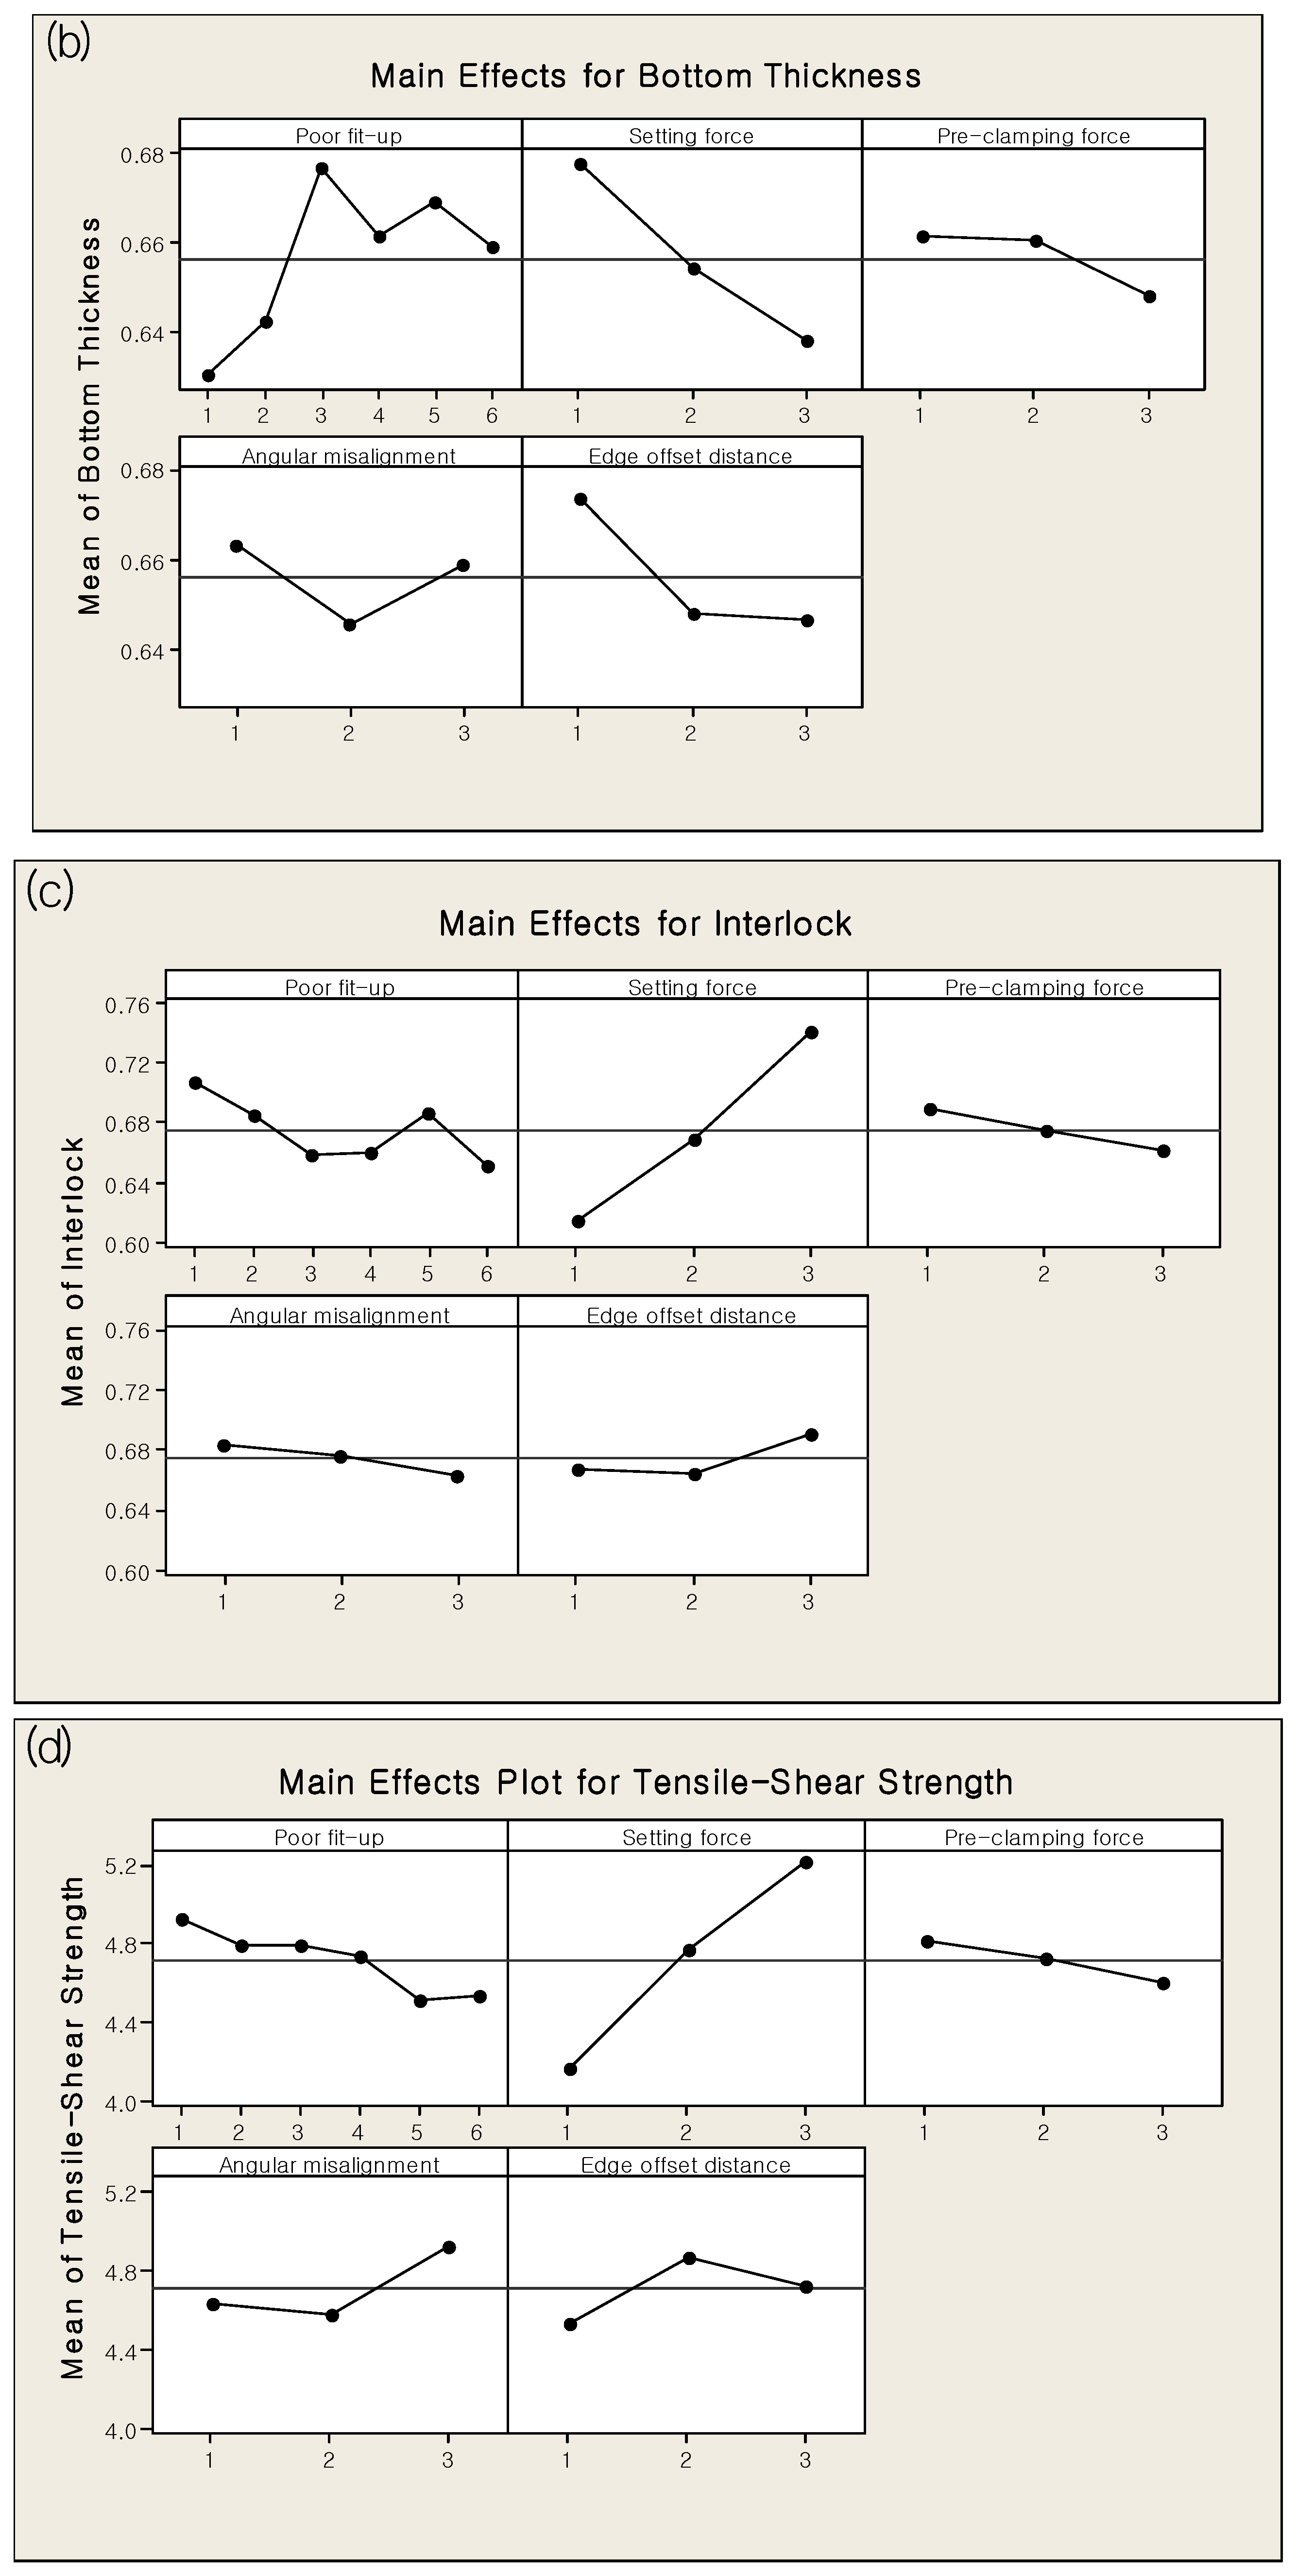
The statistical calculation results are summarized in Figure 5 and Table 4. The effects of abnormal process parameters on outputs are explained in the following sections.
3.1. Head Height
In this study, the head height was defined by the height difference between the rivet head and the top sheet (Figure 4). The head height is related to the cosmetic appearance, the tightness of the joints, the vacancy between the bottom of rivet head and the top sheet, the damage of the rivet to the top sheet, and so on [5]. The head height is also related to the effective length of the rivet in the bottom sheet teff, which is important for joint strength in the cross-tension test [8,9] and the tensile-shear test [8].
The p-value for the setting force is 0.0, so the effect of the setting force on the head height is definitely significant. This denotes that the difference of head height is obvious if the setting forces have a variation of 5 kN. By increasing the setting force, the head height decreases (Figure 5a). The setting force plays a predominant role in the piercing and flaring of SPR, and its fluctuation should be strictly managed. The p-values for the pre-clamping force and angular misalignment are relatively low, between 0.05 and 0.1. A low pre-clamping force of 1 kN caused the lowest head height, while no angular misalignment led to the lowest one. A low head height by a low pre-clamping force was originated from a large vacancy between the bottom of the rivet head and the top sheet (Figure 4). The angular misalignment induced asymmetry, increasing the head height. The effect of poor fit-up and edge offset distance on head height were not significant.
3.2. Bottom Thickness
The bottom thickness has an important role in noise, vibration, harshness (NVH), and corrosion [5]; however, high bottom thickness is generally accompanied with high head height and small teff, which reduces the static joint strength [8,9].
The bottom thickness was significantly affected by all parameters more or less, and only the p-value for the pre-clamping force was higher than 0.5. Similar to the ANOVA results for the head height, the difference according to the setting force levels was most obvious. The bottom thickness was inversely proportional to the setting force (Figure 5b). As for the poor fit-up, the difference between type 1 (no gap) and type 2 (constant gap) is smaller than the difference between type 1 and the other types (types 3 to 6) with various angular gaps. The lowest bottom thickness was found at the highest pre-clamping force, no angular misalignment, and non-negative edge offset distance.
The bottom thickness has a Pearson correlation coefficient of 0.642 for the head height, with a p-value of 0.004. This denotes that the strength of linearity between the bottom thickness and the head height is 0.642, while a Pearson correlation coefficient of 1 indicates that both parameters have a perfectly positive linearity, and there is a 0.4% risk to conclude the linearity.
3.3. Interlock
The interlock determines the locking strength between the rivet and the bottom sheet [5]. It is correlated with the joint strength under the tail pull-out mode in the cross-tension test, and the joint strength in the tensile-shear test as demonstrated analytically and experimentally in the literature [8,9].
Only the setting force was a statistically significant parameter with a p-value of 0.001, and the interlock increases as the setting force increases because a higher setting force enhanced the flaring of the rivet skirt (Figure 5c). The other parameters had p-values higher than 0.1.
The interlock has Pearson correlation coefficients of −0.873 and −0.637 for the head height (p = 0.0) and the bottom thickness (p = 0.004), respectively, so the interlock has stronger linearity with the head height compared with the bottom thickness.
3.4. Tensile-Shear Strength
For the tensile-shear strength, the setting force with a p-value of 0.001 was the only parameter that was statistically significant at a significance level of α = 0.05. By increasing the setting force, the tensile-shear strength linearly increased. In addition, the angular misalignment and the edge offset distance have p-values between 0.05 and 0.1, and their levels may affects the tensile-shear strength, which means that an angular misalignment of ±20° and edge offset distance of ±5 mm can affect the tensile shear strength. To achieve consistent tensile-shear strength, these three parameters should be regulated within the ranges narrower than those in this experiment, or they should be considered as control parameters in the experimental design.
The tensile-shear strength has a positive Pearson correlation coefficient of 0.762 for the interlock (p = 0.0), and it has negative Pearson correlation coefficients of −0.846 and −0.636 for the head height (p = 0.0) and the bottom thickness (p = 0.005), respectively.
4. Conclusions
In this study, the effect of abnormal process conditions during self-piercing riveting (SPR) on four output parameters such as the cross-sectional characteristics (head height, bottom thickness, and interlock) and the tensile shear strength of the SPR joint were investigated by using parametric investigation. Six types of poor fit-up, setting force with a variation of 5 kN, pre-clamping force with a variation of 3 kN, angular misalignments of ±20 °, and an edge offset distance of ±5 mm were considered as abnormal process conditions in the experimental design, and the following conclusions were derived.
- -
- Among five abnormal process parameters, the effects of the setting force on all the output parameters were statistically significant at a significance level of α = 0.05. Especially for the head height, the bottom thickness, and the tensile shear strength, the setting force was only one significant parameter at a significance level of α = 0.05.
- -
- The pre-clamping force has no significant effect on the output parameters at a significance level of α = 0.05.
- -
- The bottom thickness was influenced by all input parameters except for the pre-clamping force.
- -
- The tensile shear strength was affected by the setting force at a significance level of α = 0.05, and it was also affected by the angular misalignments and the edge offset distance at a significance level of α = 0.1. If the consistency of the tensile shear strength is required in process parameter optimization or database construction, these parameters should be considered as control parameters, or the ranges of these parameters should be narrower than those in this experimental design.
- -
- The output parameters are correlated with each other. Among the cross-sectional characteristics, the head height has the highest Pearson correlation coefficient with the tensile shear strength.
Author Contributions
Investigation, T.-E.J.; Methodology, T.-E.J. and D.-H.K.; Supervision, D.-H.K. and C.K.; Writing—Original draft, T.-E.J. and C.K.; Writing—Review and editing, C.K. All authors have read and agreed to the published version of the manuscript.
Funding
This research was funded by the Ministry of Trade, Industry and Energy, Republic of Korea.
Conflicts of Interest
The authors declare no conflict of interest.
References
- Chang, I.; Cho, Y.; Park, H.; So, D. Importance of Fundamental Manufacturing Technology in the Automotive Industry and the State of the Art Welding and Joining Technology. J. Weld. Join. 2016, 34, 21–25. [Google Scholar] [CrossRef]
- Meschut, G.; Janzen, V.; Olfermann, T. Innovative and highly productive joining technologies for multi-material lightweight car body structures. J. Mater. Eng. Perform. 2014, 23, 1515–1523. [Google Scholar] [CrossRef]
- Martinsen, K.; Hu, S.J.; Carlson, B.E. Joining of dissimilar materials. CIRP Ann. 2015, 64, 679–699. [Google Scholar] [CrossRef]
- Abdul Karim, M.; Park, Y.-D. A Review on Welding of Dissimilar Metals in Car Body Manufacturing. J. Weld. Join. 2020, 38, 8–23. [Google Scholar] [CrossRef] [Green Version]
- Li, D.; Chrysanthou, A.; Patel, I.; Williams, G. Self-piercing riveting-a review. Int. J. Adv. Manuf. Technol. 2017, 92, 1777–1824. [Google Scholar] [CrossRef] [Green Version]
- He, X.; Pearson, I.; Young, K. Self-pierce riveting for sheet materials: State of the art. J. Mater. Process. Technol. 2008, 199, 27–36. [Google Scholar] [CrossRef]
- Porcaro, R.; Hanssen, A.G.; Aalberg, A.; Langseth, M. Joining of aluminium using self-piercing riveting: Testing, modelling and analysis. Int. J. Crashworthiness 2004, 9, 141–154. [Google Scholar] [CrossRef]
- Haque, R.; Durandet, Y. Strength prediction of self-pierce riveted joint in cross-tension and lap-shear. Mater. Des. 2016, 108, 666–678. [Google Scholar] [CrossRef]
- Sun, X.; Khaleel, M.A. Performance optimization of self-piercing rivets through analytical rivet strength estimation. J. Manuf. Process 2005, 7, 83–93. [Google Scholar] [CrossRef]
- Haque, R. Quality of self-piercing riveting (SPR) joints from cross-sectional perspective: A review. Arch. Civ. Mech. Eng. 2018, 18, 83–93. [Google Scholar] [CrossRef]
- Abe, Y.; Kato, T.; Mori, K. Joinability of aluminium alloy and mild steel sheets by self piercing rivet. J. Mater. Process. Technol. 2006, 177, 417–421. [Google Scholar] [CrossRef]
- Jeong, T.-E.; Kim, M.-G.; Rhee, S.; Kam, D.-H. Joint Quality Study of Self-piercing Riveted Aluminum and Steel Joints Depending on the Thickness and Strength of Base Metal. J. Weld. Join. 2019, 37, 212–219. [Google Scholar] [CrossRef]
- Jeon, N.-K.; Rhee, S.; Kam, D.-H. Parametric Study of Self-Piercing Riveting for CFRP-Aluminum Dissimilar Joint. J. Weld. Join. 2018, 36, 8–17. [Google Scholar] [CrossRef] [Green Version]
- Jeon, N.-K.; Jeong, T.-E.; Rhee, S.; Kam, D.-H. Evaluation of CFRP/Steel/Aluminum Three Layer Joining with Self-Piercing Rivet. J. Weld. Join. 2019, 37, 56–61. [Google Scholar] [CrossRef] [Green Version]
- Kam, D.H.; Jeong, T.E.; Kim, M.G.; Shin, J. Self-Piercing Riveted Joint of Vibration-Damping Steel and Aluminum Alloy. Appl. Sci. Basel 2019, 9, 4575. [Google Scholar] [CrossRef] [Green Version]
- Bae, J.-H.; Kim, J.-W.; Choi, I.; Nam, D.-G.; Kim, J.-K.; Park, Y.-D. A Study on Tensile Shear Characteristics of Dissimilar Joining Between Pre-coated Automotive Metal Sheets and Galvanized Steels with the Self-Piercing Rivet and Hybrid Joining. J. Weld. Join. 2016, 34, 59–67. [Google Scholar] [CrossRef]
- Porcaro, R.; Hanssen, A.G.; Langseth, M.; Aalberg, A. Self-piercing riveting process: An experimental and numerical investigation. J. Mater. Process. Technol. 2006, 171, 10–20. [Google Scholar] [CrossRef]
- Ma, Y.; Lou, M.; Li, Y.; Lin, Z. Effect of rivet and die on self-piercing rivetability of AA6061-T6 and mild steel CR4 of different gauges. J. Mater. Process. Technol. 2018, 251, 282–294. [Google Scholar] [CrossRef]
- Haque, R.; Beynon, J.H.; Durandet, Y. Characterisation of force–displacement curve in self-pierce riveting. Sci. Technol. Weld. Join. 2012, 17, 476–488. [Google Scholar] [CrossRef]
- Han, L.; Chrysanthou, A. Evaluation of quality and behaviour of self-piercing riveted aluminium to high strength low alloy sheets with different surface coatings. Mater. Des. 2008, 29, 458–468. [Google Scholar] [CrossRef]
- Ruijun, L.; Xiangwen, D. Mechanical behaviour of self-piercing riveted two-layer joints with different surface treatment. In Proceedings of the 2011 International Conference on Mechatronic Science, Electric Engineering and Computer (MEC), Jilin, China, 19–22 August 2011; pp. 703–706. [Google Scholar]
- Van Hall, S.N.; Findley, K.O.; Freis, A.K. Improved self-pierce rivet performance through intentional decarburization. J. Mater. Process. Technol. 2018, 251, 350–359. [Google Scholar] [CrossRef]
- Kim, D.; Qiu, Y.; Cho, H.-Y. Design of self-piercing rivet to joint in advanced high strength steel and aluminium alloy sheets. J. Weld. Join. 2015, 33, 75–80. [Google Scholar] [CrossRef] [Green Version]
- Carandente, M.; Dashwood, R.; Masters, I.; Han, L. Improvements in numerical simulation of the SPR process using a thermo-mechanical finite element analysis. J. Mater. Process. Technol. 2016, 236, 148–161. [Google Scholar] [CrossRef]
- Kang, M.; Kim, C.; Kim, J.; Kim, D.; Kim, J. Corrosion Assessment of Al/Fe Dissimilar Metal Joint. J. Weld. Join. 2014, 32, 55–62. [Google Scholar] [CrossRef] [Green Version]
- Kang, S.; Yoon, J.Y.; Kim, C. Corrosion Properties and Failure Behavior of Al/Fe Self-Piercing Rivet Joint. J. Weld. Join. 2018, 36, 72–77. [Google Scholar] [CrossRef]
- Fu, M.; Mallick, P. Fatigue of self-piercing riveted joints in aluminum alloy 6111. Int. J. Fatigue 2003, 25, 183–189. [Google Scholar] [CrossRef]
- Sun, X.; Stephens, E.; Khaleel, M. Fatigue behaviors of self-piercing rivets joining similar and dissimilar sheet metals. Int. J. Fatigue 2007, 29, 370–386. [Google Scholar] [CrossRef]
- Li, D.; Han, L.; Thornton, M.; Shergold, M.; Williams, G. The influence of fatigue on the stiffness and remaining static strength of self-piercing riveted aluminium joints. Mater. Des. (1980–2015) 2014, 54, 301–314. [Google Scholar] [CrossRef]
- Huang, L.; Guo, H.; Shi, Y.; Huang, S.; Su, X. Fatigue behavior and modeling of self-piercing riveted joints in aluminum alloy 6111. Int. J. Fatigue 2017, 100, 274–284. [Google Scholar] [CrossRef]
- Rao, H.M.; Kang, J.; Huff, G.; Avery, K. Impact of specimen configuration on fatigue properties of self-piercing riveted aluminum to carbon fiber reinforced polymer composite. Int. J. Fatigue 2018, 113, 11–22. [Google Scholar] [CrossRef]
- Li, D.; Han, L.; Chrysanthou, A.; Shergold, M.; Williams, G. The Effect of Setting Velocity on the Static and Fatigue Strengths of Self-Piercing Riveted Joints for Automotive Applications. Ann. Meet. Suppl. Proc. 2014, 67, 557–564. [Google Scholar] [CrossRef]
- Lee, S.W.; Kim, J.-W. Selecting Optimum Conditions for SPR Processing of High Tension Steel Plates and Aluminium Sheets Using Response Surface Methodology. J. Weld. Join. 2019, 37, 339–346. [Google Scholar] [CrossRef] [Green Version]
- Brown, L.J.; Schwaber, J.S. Identifying operating conditions from pre-weld information for resistance spot welding. In Proceedings of the 2000 American Control Conference, ACC (IEEE Cat. No. 00CH36334), Chicago, IL, USA, 6 August 2002; pp. 1535–1539. [Google Scholar]
- Li, W.; Cheng, S.; Hu, S.J.; Shriver, J. Statistical Investigation on Resistance Spot Welding Quality Using a Two-State, Sliding-Level Experiment. J. Manuf. Sci. Eng. 2001, 123, 513–520. [Google Scholar] [CrossRef]
- Cho, Y.; Li, W.; Hu, S.J. Parameter Design and Analysis for Aluminum Resistance Spot Welding. J. Weld. Join. 2002, 20, 220–226. [Google Scholar]
- Cho, Y.; Hu, S.J.; Li, W. Resistance spot welding of aluminium and steel: A comparative experimental study. Proc. Inst. Mech. Eng. Pt. B J. Eng. Manuf. 2005, 217, 1355–1363. [Google Scholar] [CrossRef]
- Schromm, T.; Diewald, F.; Grosse, C. An attempt to detect anomalies in car body parts using machine learning algorithms. In Proceedings of the 9th Conference on Industrial Computed Tomography (iCT 2019), Padova, Italy, 1 March 2019. [Google Scholar]
- Zhou, K.; Yao, P. Overview of recent advances of process analysis and quality control in resistance spot welding. Mech. Syst. Signal Process. 2019, 124, 170–198. [Google Scholar] [CrossRef]
Figure 1.
Dimensions of rivet and die. (a) Rivet; (b) die.

Figure 2.
Abnormal joining conditions. (a) Poor fit-up; (b) angular misalignment; (c) edge offset (inaccurate setting force and pre-clamping force are not shown).
Figure 2.
Abnormal joining conditions. (a) Poor fit-up; (b) angular misalignment; (c) edge offset (inaccurate setting force and pre-clamping force are not shown).

Figure 3.
Dimensions of specimen.

Figure 4.
Cross-sectional characteristics.

Figure 5.
Main effects for control parameters. (a) Head height; (b) bottom thickness; (c) interlock; (d) tensile-shear strength.
Figure 5.
Main effects for control parameters. (a) Head height; (b) bottom thickness; (c) interlock; (d) tensile-shear strength.


Table 1.
Mechanical properties of base materials.
| Base Materials | Mechanical Properties | ||
|---|---|---|---|
| Yield Strength (MPa) | Ultimate Tensile Strength (MPa) | Elongation (%) | |
| DP 590 steel | 374 | 609 | 28 |
| Al 5052-H32 | 193 | 228 | 12 |
Table 2.
Joining parameters applied in this study.
| Parameters | Level 1 | Level 2 | Level 3 | |||
|---|---|---|---|---|---|---|
| Setting force, F (kN) | 25 | 30 | 35 | |||
| Pre-clamping force, C (kN) | 1 | 4 | 7 | |||
| Angular misalignment, β(°) | −20 | 0 | 20 | |||
| Edge offset distance, δ (mm) | −5 | 0 | 5 | |||
| Poor fit-up, G | Level 1 | Level 2 | Level 3 | Level 4 | Level 5 | Level 6 |
| Type 1 | Type 2 | Type 3 | Type 4 | Type 5 | Type 6 | |
| d = 2 mm | θ = 7.6° | |||||
Table 3.
Experimental design L18 (61 × 34).
| No. | Poor Fit-Up, G | Setting Force, F (kN) | Pre-Clamping Force, C (kN) | Angular Misalignment, β (°) | Edge Offset Distance, δ (mm) |
|---|---|---|---|---|---|
| 1 | Type 1 | 25 | 1 | −20 | −5 |
| 2 | Type 1 | 30 | 4 | 0 | 0 |
| 3 | Type 1 | 35 | 7 | 20 | 5 |
| 4 | Type 2 | 25 | 1 | 0 | 0 |
| 5 | Type 2 | 30 | 4 | 20 | 5 |
| 6 | Type 2 | 35 | 7 | −20 | −5 |
| 7 | Type 3 | 25 | 4 | −20 | 5 |
| 8 | Type 3 | 30 | 7 | 0 | −5 |
| 9 | Type 3 | 35 | 1 | 20 | 0 |
| 10 | Type 4 | 25 | 7 | 20 | 0 |
| 11 | Type 4 | 30 | 1 | −20 | 5 |
| 12 | Type 4 | 35 | 4 | 0 | −5 |
| 13 | Type 5 | 25 | 4 | 20 | −5 |
| 14 | Type 5 | 30 | 7 | −20 | 0 |
| 15 | Type 5 | 35 | 1 | 0 | 5 |
| 16 | Type 6 | 25 | 7 | 0 | 5 |
| 17 | Type 6 | 30 | 1 | 20 | −5 |
| 18 | Type 6 | 35 | 4 | −20 | 0 |
Table 4.
AVOVA results for the experiments with Table 3.
Table 4.
AVOVA results for the experiments with Table 3.
| Parameters | p-Value | ||||
|---|---|---|---|---|---|
| Poor Fit-Up, G | Setting Force, F | Pre-Clamping Force, C | Angular Misalignment, β | Edge Offset Distance, δ | |
| Head height | 0.661 | 0.0 * | 0.056 | 0.056 | 0.369 |
| Bottom thickness | 0.013 * | 0.003 * | 0.085 | 0.045 * | 0.008 * |
| Interlock | 0.108 | 0.001 * | 0.135 | 0.277 | 0.136 |
| Tensile-shear strength | 0.184 | 0.001 * | 0.228 | 0.051 | 0.071 |
* p-value ≤ 0.05.
© 2020 by the authors. Licensee MDPI, Basel, Switzerland. This article is an open access article distributed under the terms and conditions of the Creative Commons Attribution (CC BY) license (http://creativecommons.org/licenses/by/4.0/).
Share and Cite
MDPI and ACS Style
Jeong, T.-E.; Kam, D.-H.; Kim, C. Parametric Investigation of Effect of Abnormal Process Conditions on Self-Piercing Riveting. Appl. Sci. 2020, 10, 2520. https://0-doi-org.brum.beds.ac.uk/10.3390/app10072520
AMA Style
Jeong T-E, Kam D-H, Kim C. Parametric Investigation of Effect of Abnormal Process Conditions on Self-Piercing Riveting. Applied Sciences. 2020; 10(7):2520. https://0-doi-org.brum.beds.ac.uk/10.3390/app10072520
Chicago/Turabian StyleJeong, Taek-Eon, Dong-Hyuck Kam, and Cheolhee Kim. 2020. "Parametric Investigation of Effect of Abnormal Process Conditions on Self-Piercing Riveting" Applied Sciences 10, no. 7: 2520. https://0-doi-org.brum.beds.ac.uk/10.3390/app10072520
Note that from the first issue of 2016, this journal uses article numbers instead of page numbers. See further details here.