Behavior of Airport Concrete Pavement Slabs Exposed to Environmental Loadings


1
Department of Civil Engineering, Inha University, 100 Inha-ro, Michuhol-gu, Incheon 22212, Korea
2
Pacific Department, Asian Development Bank, Mandaluyong City, 1550 Metro Manila, Philippines
*
Author to whom correspondence should be addressed.
Appl. Sci. 2020, 10(7), 2618; https://0-doi-org.brum.beds.ac.uk/10.3390/app10072618
Submission received: 19 March 2020
/
Revised: 1 April 2020
/
Accepted: 5 April 2020
/
Published: 10 April 2020
(This article belongs to the Section Civil Engineering)
Abstract
:The behavior of pavement slabs was measured over a two-year period from the placement of concrete at a construction site in Incheon International Airport using temperature sensors and strain gauges. The influence of various environmental factors on the slab behavior was investigated by collecting weather data. Laboratory tests were conducted to obtain the material properties of the concrete slab, such as the elastic modulus, Poisson’s ratio, and modulus of rupture. The time of final setting of the concrete slab at the zero point of the strain gauges was determined according to the position and depth of the slab using the maturity of concrete obtained by a mortar penetration test. The real and shrinkage strains were calculated according to the position and depth of the slab using the coefficient of thermal expansion of the concrete, strain gauges, and correction factors of the strain gauges. The effects of environmental factors, such as temperature and moisture variations, were analyzed with respect to the strain in the concrete slab for the first seven days and two years after the placement of the concrete slab. The results obtained by the study shall be used to quantify the environmental effects on slabs for developing a method of designing airport concrete pavements.
1. Introduction
Environmental factors, such as variations in temperature and moisture, cause the deformation of concrete pavement slabs that leads to the development of various stresses. Thermal expansion or contraction of a concrete slab occurs owing to temperature changes; the slab shrinks continuously as it dries over a prolonged period [1,2,3]. Sufficient time is required for temperature to be transferred to the bottom of a slab, and the temperature changes continuously with daily and yearly cycles. Consequently, the top of the slab periodically contracts or expands more than the bottom of the slab. In addition, the top of the slab dries faster than the bottom, resulting in differential drying shrinkage because the slab surface is in direct contact with the ambient air [4,5,6]. Therefore, slab curling occurs, wherein the slab bends upward or downward owing to the difference in contraction and expansion between the top and bottom of the slab [3,7,8,9].
Stress develops in a concrete slab when the slab contracts or expands owing to weather conditions; this stress depends on factors such as the friction with the sublayer, weight of the slab, and dowel bars. Distress can occur in a concrete slab because of an environmental load that exceeds the strength of the slab [10]. In contrast, most design guidelines for airport pavements, including FAARFIELD (the Federal Aviation Administration’s (FAA) newest airport pavement thickness design program), do not consider the effect of environmental loading despite it having a significant impact on slab behavior and distress. Kim et al. [11] reported that the coefficient of thermal expansion (CTE) of a concrete slab must be considered when designing airport pavements to minimize distress. Gao et al. [12] analyzed the influence of temperature gradient on the curling behavior of concrete pavement slabs by measuring the temperature and strain according to the slab depth. In addition, Joshi et al. [13] reported that the efficiency of load transfer between adjoining slabs could vary according to the temperature gradient, resulting in an increase of up to 0.5 inches in the design slab thickness. The drying shrinkage of a concrete slab due to moisture evaporation was also analyzed because most prior studies focused only on the temperature effect.
The AC 150/5320-6D [14] was developed by the FAA in the 1990s and was used until the 2000s. This is an empirical guide for airport pavement design using nomographs. This design guide was upgraded to the AC 150/5320-6E [15] and AC 150/5320-6F [16] guidelines, which are mechanistic empirical design guides that utilize finite element analysis (FEA), but they also do not consider environmental loading. The mechanistic empirical pavement design guide (MEPDG) was developed by the American Association of State Highway and Transportation Officials (AASHTO) for road pavements and considers the curling of concrete slabs caused by temperature variations. Additionally, it uses empirical values for other environmental factors, such as differential drying shrinkage and creep [17]. Therefore, there is a need for the development of an airport pavement design method that simultaneously considers the effects of temperature and moisture, which are the major meteorological factors that have the highest influence on the behavior of concrete slabs.
Figure 1 presents a flow chart of this study. First, temperature sensors and strain gauges were installed at the concrete pavement construction site in Incheon International Airport (IIA). The temperature and strain data were collected from the concrete slabs, and the real and shrinkage strains were calculated according to the slab position and depth. The short- and long-term behaviors of the concrete slabs were investigated using the calculated strains. This study explains the effects of environmental factors on the behavior of a concrete slab to design airport concrete pavements more reasonably and accurately.
2. Construction and Instrumentation
The facilities of IIA were expanded with four planned stages of construction. The airport was opened in 2001 after the completion of the first stage of construction that included building the first passenger terminal, three cargo terminals, two runways, one control tower, and other facilities. The second stage included the construction of additional boarding areas for the first passenger terminal, and another runway was completed in 2008. The third project that included the construction of the second passenger terminal, passenger plane ramp, cargo plane ramp, and other facilities was completed in 2017.
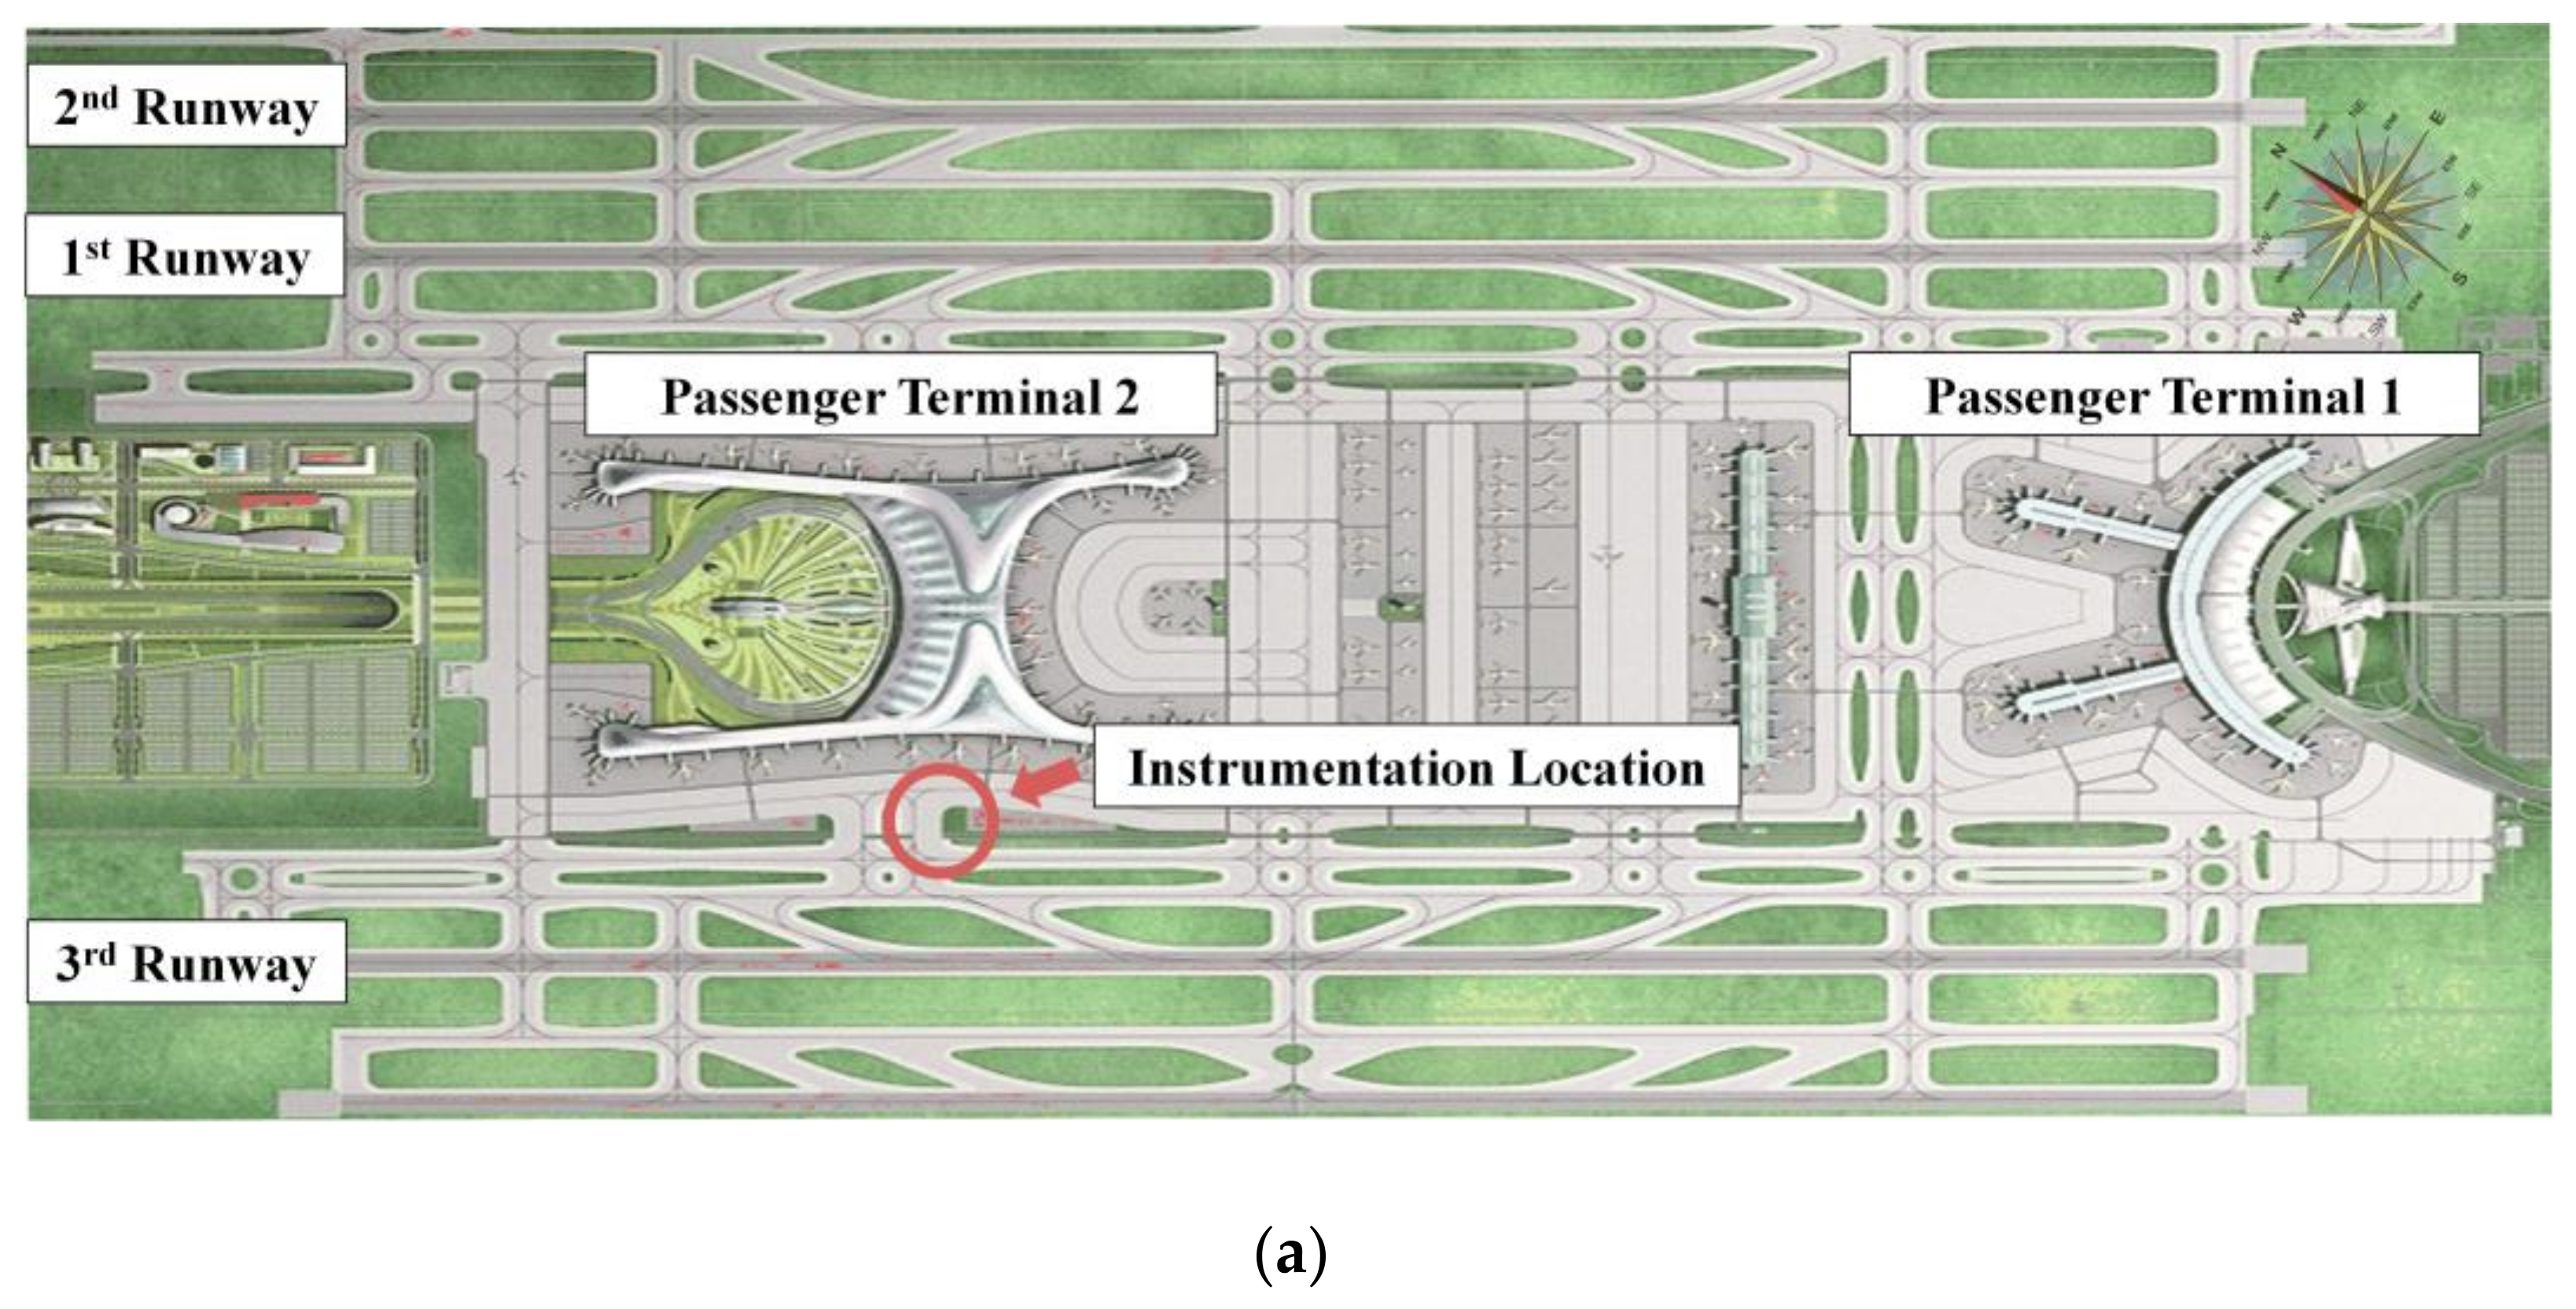
Sensors were installed in the concrete pavement constructed at a third-stage construction site in IIA. The concrete slab was placed in early November 2016 (late autumn) when the ambient temperature was decreasing. The sensors were installed at the passenger plane ramp of the second passenger terminal, as shown in Figure 2a. Lean concrete, asphalt, and concrete slabs were constructed on a subgrade with thicknesses of 150, 50, and 500 mm, respectively. The area of each slab was 6 m × 6 m. The slab was the thickest one in South Korea, and the maximum size of the coarse aggregate was 40 mm. The concrete slabs, wherein the sensors were installed, were placed manually using the mixture proportions as presented in Table 1.
Figure 2b presents the pavement slabs wherein the sensors were installed. The sections were categorized into linear and curved zones according to the shape of the airplane route in each zone. Zone A was used to measure the slab curling caused by an environmental load, and zone B was used to measure the slab behavior caused by the loading of aircraft proceeding in a straight line. Zone C was used to measure the slab behavior caused by the loading of aircraft moving in a curve. The temperature and static strain were measured in Zone A over a two-year period. The dynamic strain was measured in Zone B and Zone C from January 2018, when the aircraft began to pass the zones, and the data were analyzed. The influence of aircraft loading on slab behavior shall be reported in future publications. For Zone A, eight temperature sensors and thirty static strain gauges were installed in slab A-1 and slab A-2, and the data were collected at 10 min intervals.
The temperature sensors and static strain gauges were installed at different positions and depths of the pavement slab to examine the variations in temperature and strain that were distributed nonlinearly in the pavement. The static strain gauges were self-temperature compensated strain transducer type and KM-100B model. The temperature sensors were thermistor type and 107-L model.
As shown in Figure 3a, the static strain gauges were installed in two corners, one mid-edge, and the centers of slabs A-1 and A-2 because most curling behavior can be observed in the corners. Figure 3a also shows the labels of the sensors installed in slab A-1. The front letter of the label of the sensor was ‘L’ when the longitudinal direction of the sensor coincided with the movement direction of the airplane, whereas letter ‘T’ was used when the directions were perpendicular. The last letter was ‘L’ when the sensor was installed on the left of the slab, whereas letter ‘R’ indicated that the sensors were installed on the right of the slab. ‘ME’ implies that the sensors were installed at the mid-edge of the slab, and ‘CE’ implies that the sensors were installed at the center.
Figure 3b shows section A-A indicated in Figure 3a. The depth of the sensor installed at each position of slabs A-1 and A-2 is presented. The temperature sensors and static strain gauges were installed at depths of 50, 150, 250, 350, and 450 mm in a 500 mm-thick slab to assess the slab behavior according to depth. In addition, one temperature sensor per layer of asphalt, lean concrete, and subgrade was installed to monitor the temperature variations in the sublayers.
The concrete slabs were placed in the order of Zone A and Zone B under the condition that the surrounding slabs had already been placed, as shown in Figure 4. The two edges of slab A-1, which were linked at the corner where LR and TR are located, were connected to the existing concrete slabs by dowel bars. A third edge of the slab was extended to the next slab by the continuous placement of concrete, and the last edge was free until it was connected to slab B-2 after nine days. Therefore, every corner of slab A-1 had different constraint conditions. The behavior of slab A-1 was analyzed using the static strain gauges of TR because most slab curling was found to occur at the corners, and both adjacent edges were connected to existing slabs in different ways from the corners. The analysis according to the location of the traffic loading was easier in this case because the longitudinal direction of the gauges was perpendicular to the movement direction of the airplanes.
Temperature sensors, dynamic strain gauges, dowel strain gauges, horizontal displacement gauges, and CCTV cameras were also installed in Zones B and C to measure the slab behavior due to the loading of running aircraft. This paper presents the measurement and analysis results of the behavior of concrete pavement in Zone A due to environmental effects. The behavior of the concrete pavement in Zones B and C due to traffic loading shall be reported in another paper.
3. Data Collection
The effects of environmental factors on slab behavior were investigated by collecting weather data of IIA. The material properties of the concrete slab were obtained by laboratory tests, including the elastic modulus, Poisson’s ratio, CTE, and modulus of rupture. The final setting times of the concrete slab, which were the zero points of the gauges, were predicted according to the slab position and depth using the maturity of concrete obtained from a mortar penetration test. The real and shrinkage strains of the concrete slab were calculated using the CTE of the concrete, strain gauges, and correction factors of the strain gauges.
3.1. Weather Data
Weather data were collected over a two-year period from the placement of the concrete slab and included the ambient temperature, ambient relative humidity, solar radiation, and wind speed [8,18]. Figure 5 presents the weather data for the first seven days from the placement of the concrete slab. The ambient temperature increased in the daytime and decreased at night, exhibiting daily cycles of change. The temperature increased until the day after the concrete placement and then decreased gradually. The ambient relative humidity also exhibited daily cycles of change; it decreased in the daytime and increased at night, which is contrary to the changes in ambient temperature. The solar radiation was the highest in the afternoon, whereas at night, there was no solar radiation.
The wind speed did not exhibit any particular trend. Figure 6 presents the weather data over a two-year period from the placement of the concrete slab. The ambient temperature increased to 31 °C in summer and decreased to −9 °C in winter. The ambient relative humidity in summer was higher than that in the rainy season. The solar radiation was the highest in summer and lowest in winter; a similar trend was observed in the case of the ambient temperature.
3.2. Material Properties of the Concrete Slab
The concrete specimens were molded at the construction site to test the material properties of the concrete slabs in the laboratory. The CTE of the specimens was tested according to the TxDOT standard, and the other material properties were tested according to the American Society for Testing and Materials [19,20,21]. The elastic modulus, Poisson’s ratio, modulus of rupture, and CTE were measured for the concrete specimens that had been cured in water for 28 days, and they were also measured after aging for 90 days (Table 2). The modulus of rupture satisfied the designed flexural strength required by the IIA Corporation. The elastic modulus, Poisson’s ratio, and CTE were in the general range required for a concrete pavement slab [22].
The final setting times at which the concrete slabs hardened and began to resist tensile stresses were determined according to the slab position and depth using the maturity obtained from a mortar penetration test. The results were designated as the zero points of the measured strain [23]. Maturity is a unique characteristic of concrete and is expressed by multiplying the temperature and time, as given below.
- : Maturity after time t from the placement of concrete (°C h);
- : Average temperature for a time interval (°C);
- : Datum temperature (−10 °C);
- : Time interval (h).
Maturity refers to the hardening of concrete depending on the material and mixture properties [24,25,26]. Thus, the setting times of the concrete slabs with the same materials and mixture proportions under different curing temperature conditions could be estimated using maturity.
The maturity was 336 °C h at the final setting time, when the penetration resistance of the mortar extracted from the concrete slab mixture was 28.0 MPa, as shown in Figure 7. The time corresponding to the maturity of 336 °C h could be found according to the slab depth for use as the zero points of the strain using the concrete temperature measured from the placement of the concrete slab. Figure 8 presents the temperature gradient of each slab at the final setting time. The trends of the temperature gradients are typically the same; however, there was a slight difference according to the construction time.
3.3. Real Strain and Shrinkage of the Concrete Slab
The strain data measured by the static strain gauges were analyzed for the real and shrinkage strains. The strain data shown in the paper were from the positions where the strain trends at each depth were clearer than other positions even though the strain data from all the positions were reasonable. The real strain was calculated using Equation (2) [27]. The real strain develops in a concrete slab owing to environmental loads, such as temperature and moisture variations.
- : Real strain ();
- : Calibration coefficient of the strain gauge;
- : Change in the measured strain from the first strain ();
- : CTE of the strain gauge ();
- : Temperature change from the final setting time (°C).
The change in the measured strain from the first strain at the final setting of concrete was multiplied by the calibration coefficient of each strain gauge for the first correction of the strain in the slab. The thermal strain of the strain gauge was calculated by multiplying the CTE of the gauge with the temperature change from the final setting. The real strain was calculated by subtracting the thermal strain of the strain gauge from the corrected strain in the slab.
The shrinkage strain was calculated by subtracting the thermal strain due to temperature variations from the real strain and is expressed as Equation (3) [27].
- : Shrinkage strain ();
- : CTE of concrete (9.92);
- : Temperature change from the final setting time (°C).
The CTE of concrete was obtained from a test of the concrete specimens [21]. The thermal strain of the concrete slab due to temperature variations was calculated by multiplying the CTE of concrete with the change in concrete temperature from the final setting of the concrete slab.
4. Temperature and Moisture Effects of Slab Behavior
The real and shrinkage strains were calculated according to the concrete slab position and depth using the collected data. The effects of environmental loads, such as temperature and moisture variations, on the slab behavior were analyzed for the first seven days and two years after the placement of the concrete slab.
4.1. Temperature of the Concrete Slab
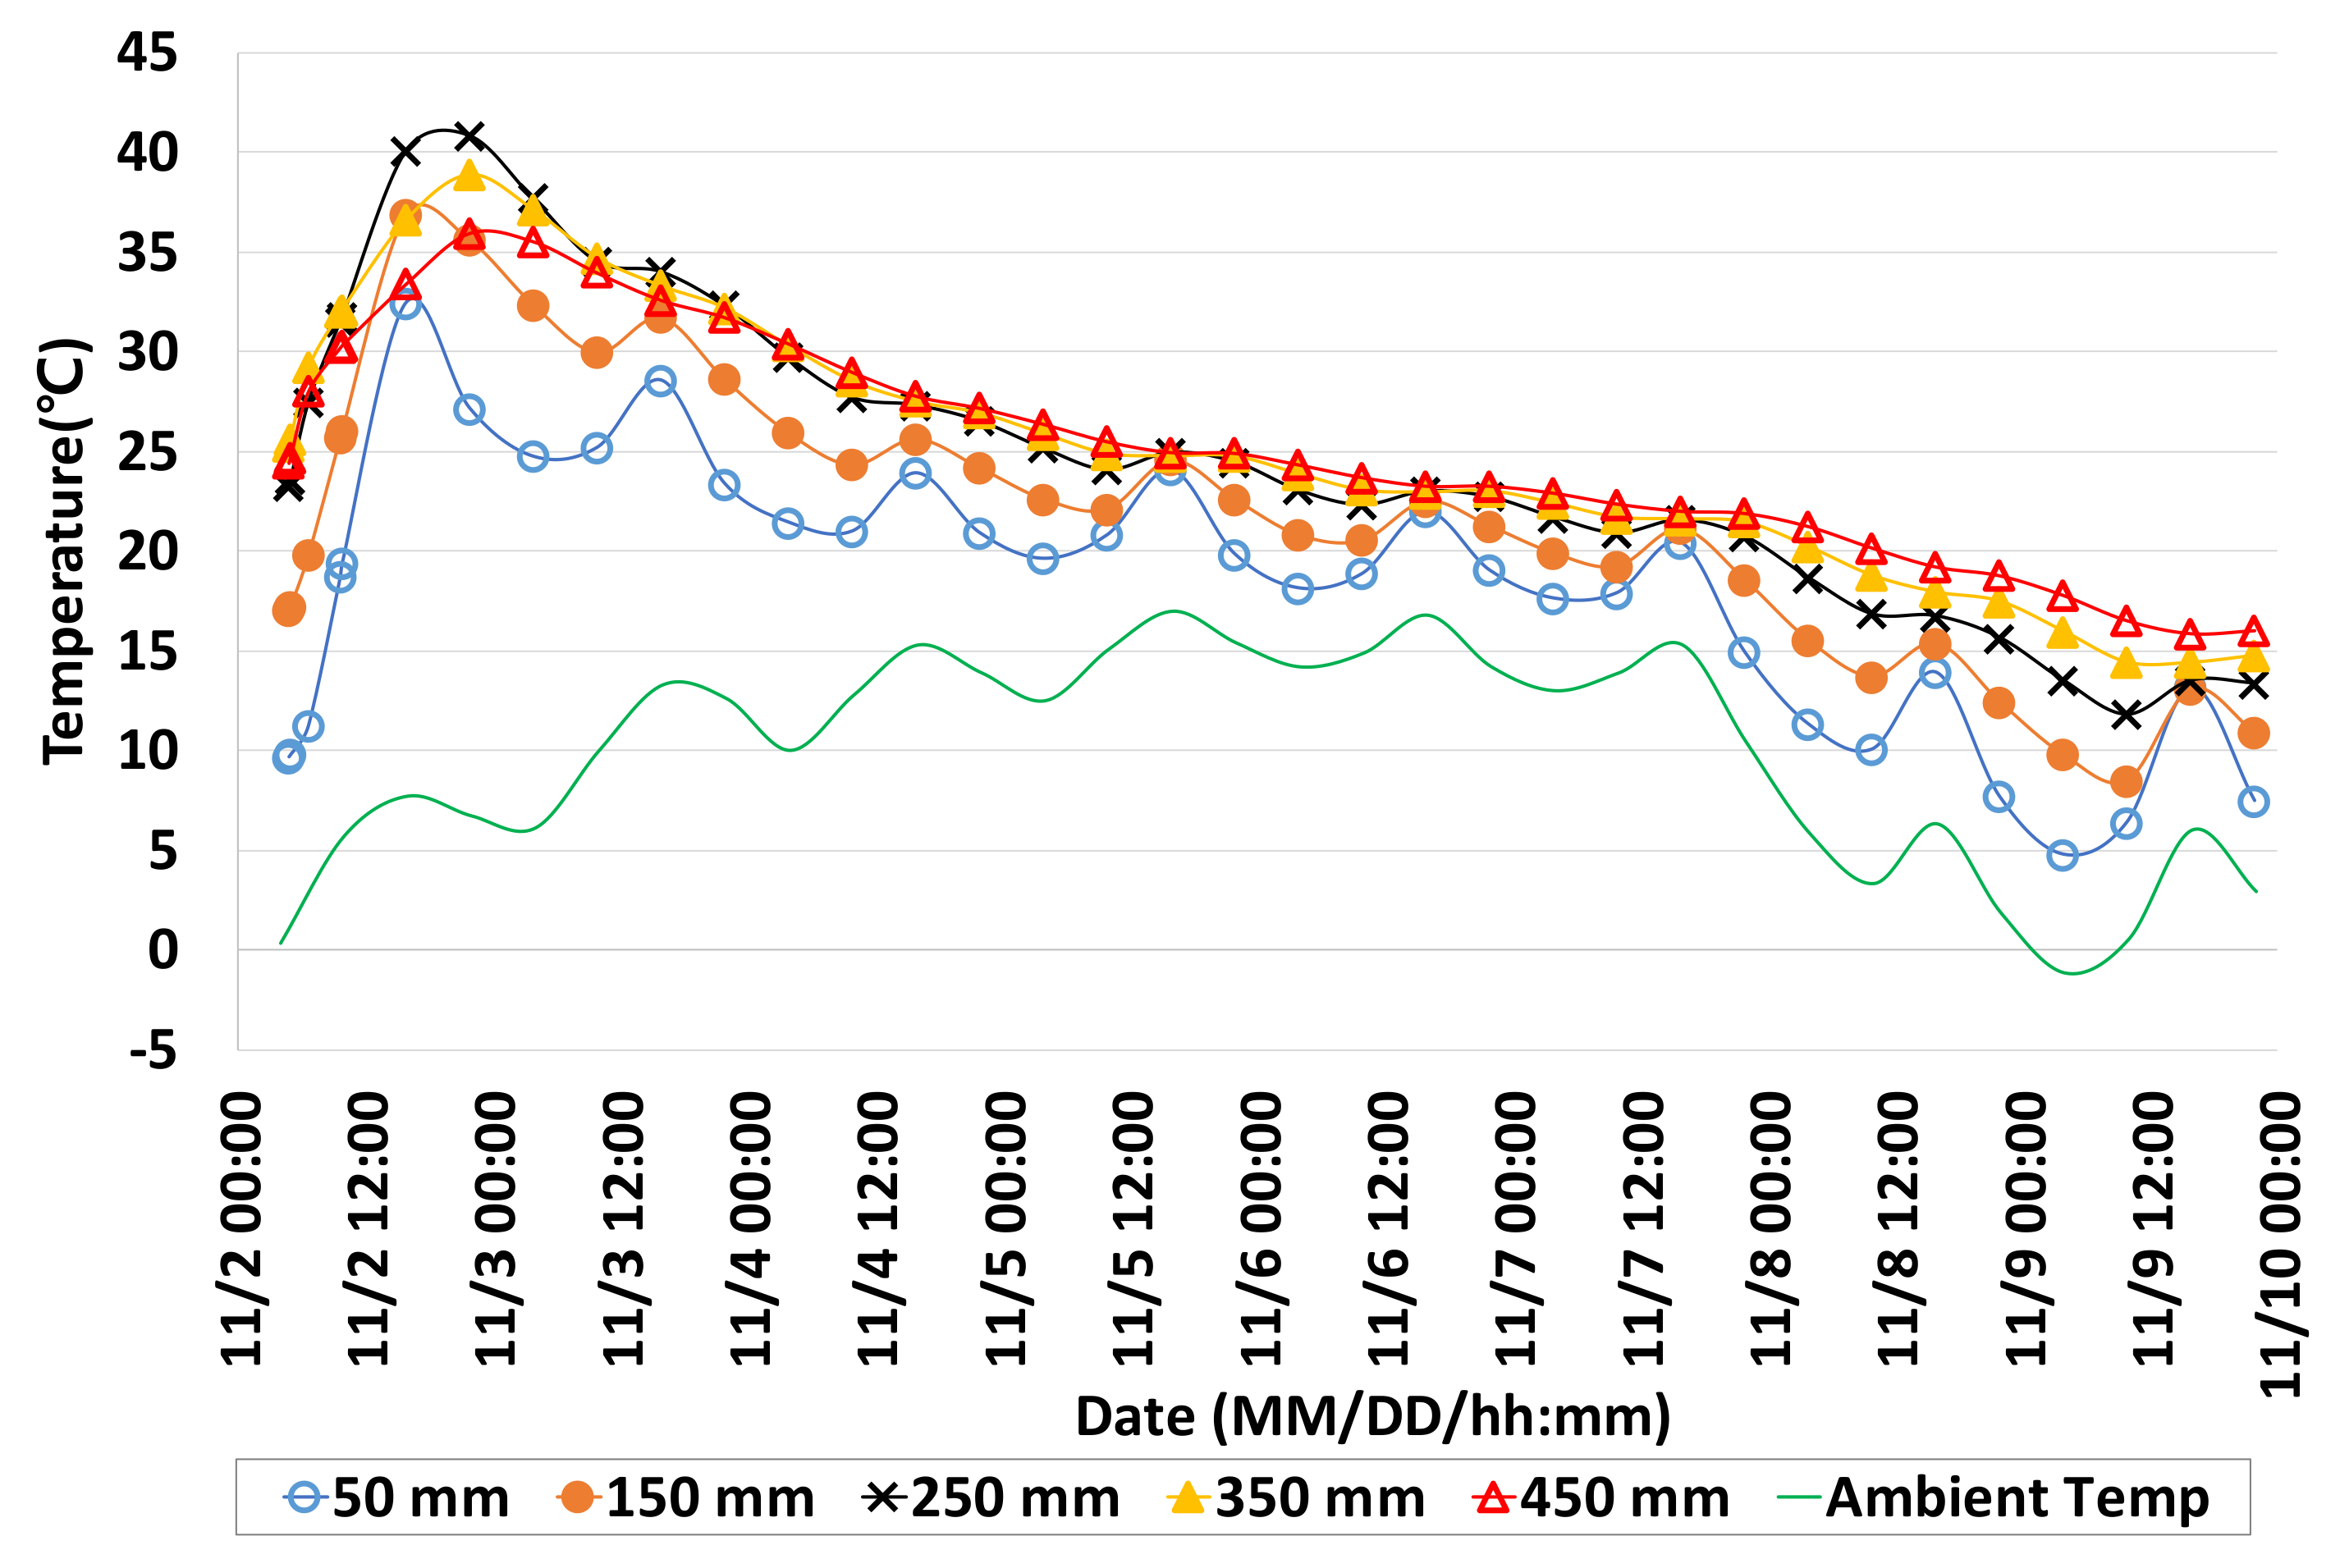
Figure 9 presents the ambient and concrete temperatures according to the slab depth for the first seven days from the placement of the concrete slab. The increase in slab temperature immediately after the placement of the concrete was substantial owing to the heat of hydration, and it then decreased gradually owing to the disappearance of the heat of hydration and the decrease in ambient temperature, as reported elsewhere [7,8]. The heat of hydration was the largest for slab depths ranging from 150 to 350 mm. Furthermore, a higher temperature was continuously maintained at those depths because the heat of the concrete slab was transferred to the ambient air and asphalt layer at the top and bottom of the slab, respectively. The daily cycles of the temperature variation were more evident near the top of the slab; the temperature variations were smaller near the bottom of the slab because of the effect of ambient temperature.
4.2. Real Strain of the Concrete Slab
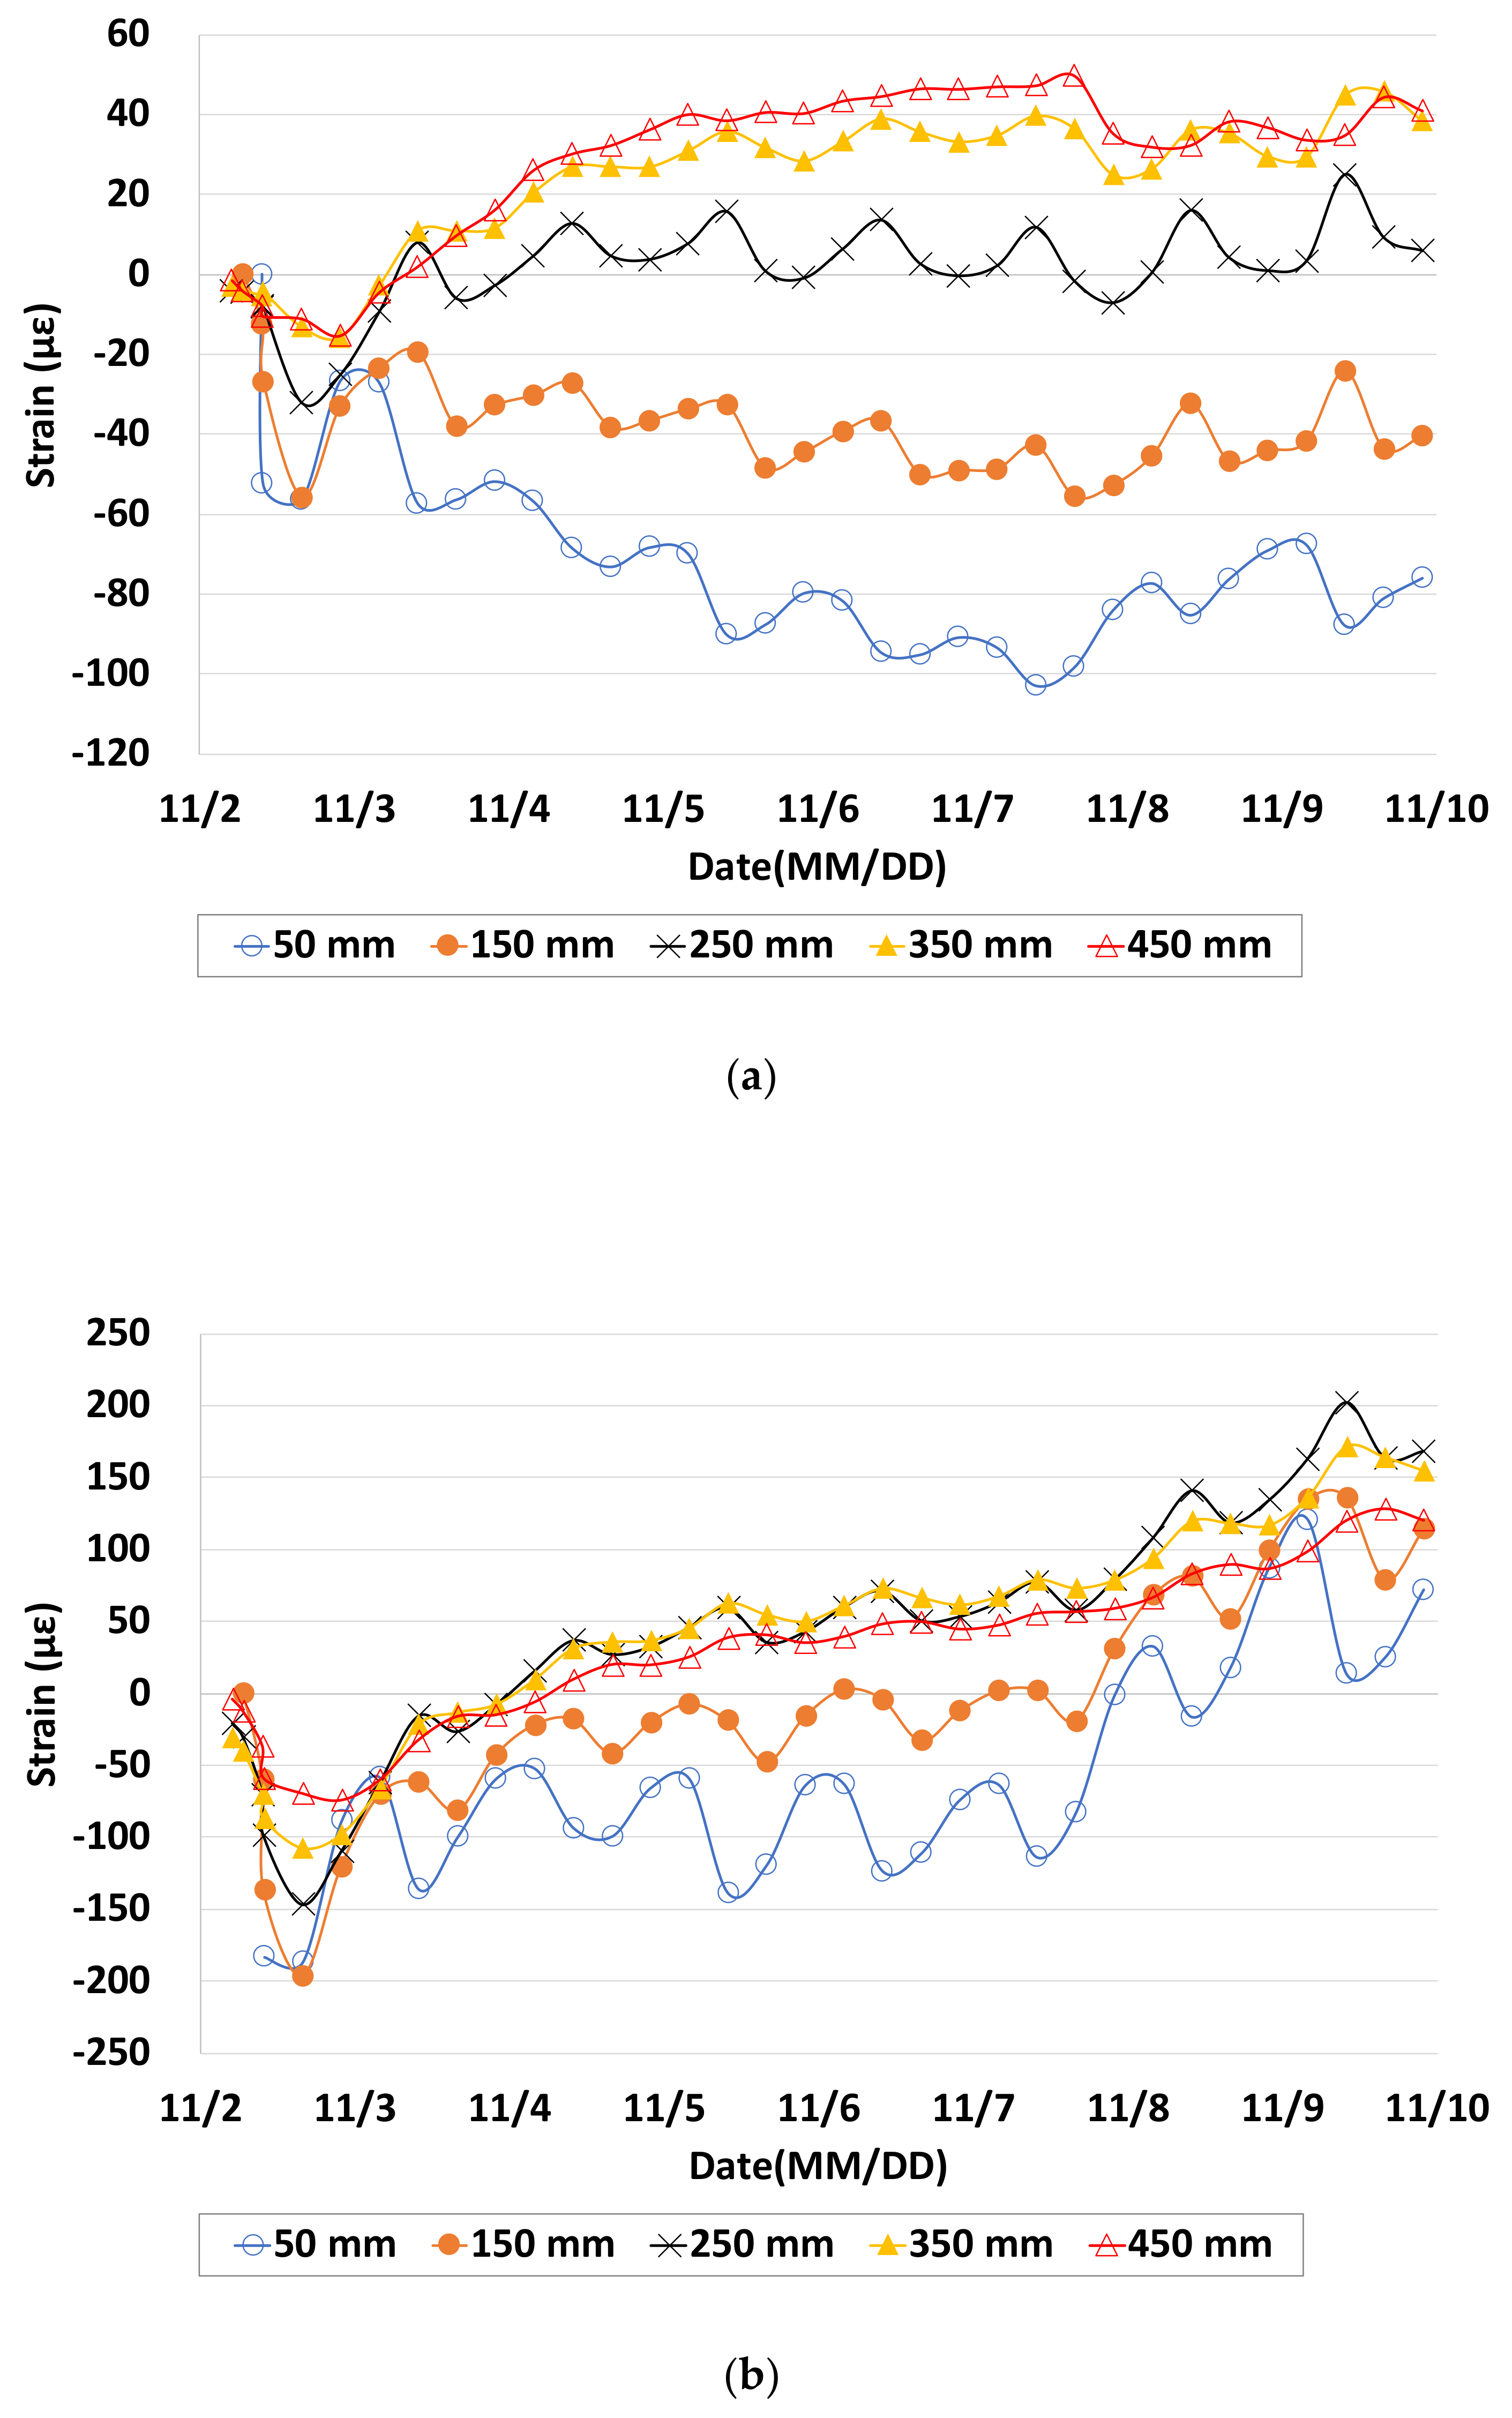
The real strain calculated using Equation (2) reflected the slab behavior caused by the environmental loading constrained by friction with the sublayer, the self-weight of the slab, dowel bars, and other factors. The trend of variations in the real strain was similar to that of variations in the concrete temperature at the same depths, as shown in Figure 10. The correlation between temperature and real strain was examined according to the slab depth to analyze the effects of temperature. Temperature predominantly affected the real strain for the first seven days and exhibited a linear correlation with > 0.8 at every slab depth, as shown in Figure 11. The at a depth of 50 mm was 0.8555, and it increased to 0.9741 at a depth of 450 mm. Therefore, factors other than temperature affected the real strain near top of the slab, such as the drying shrinkage [28].
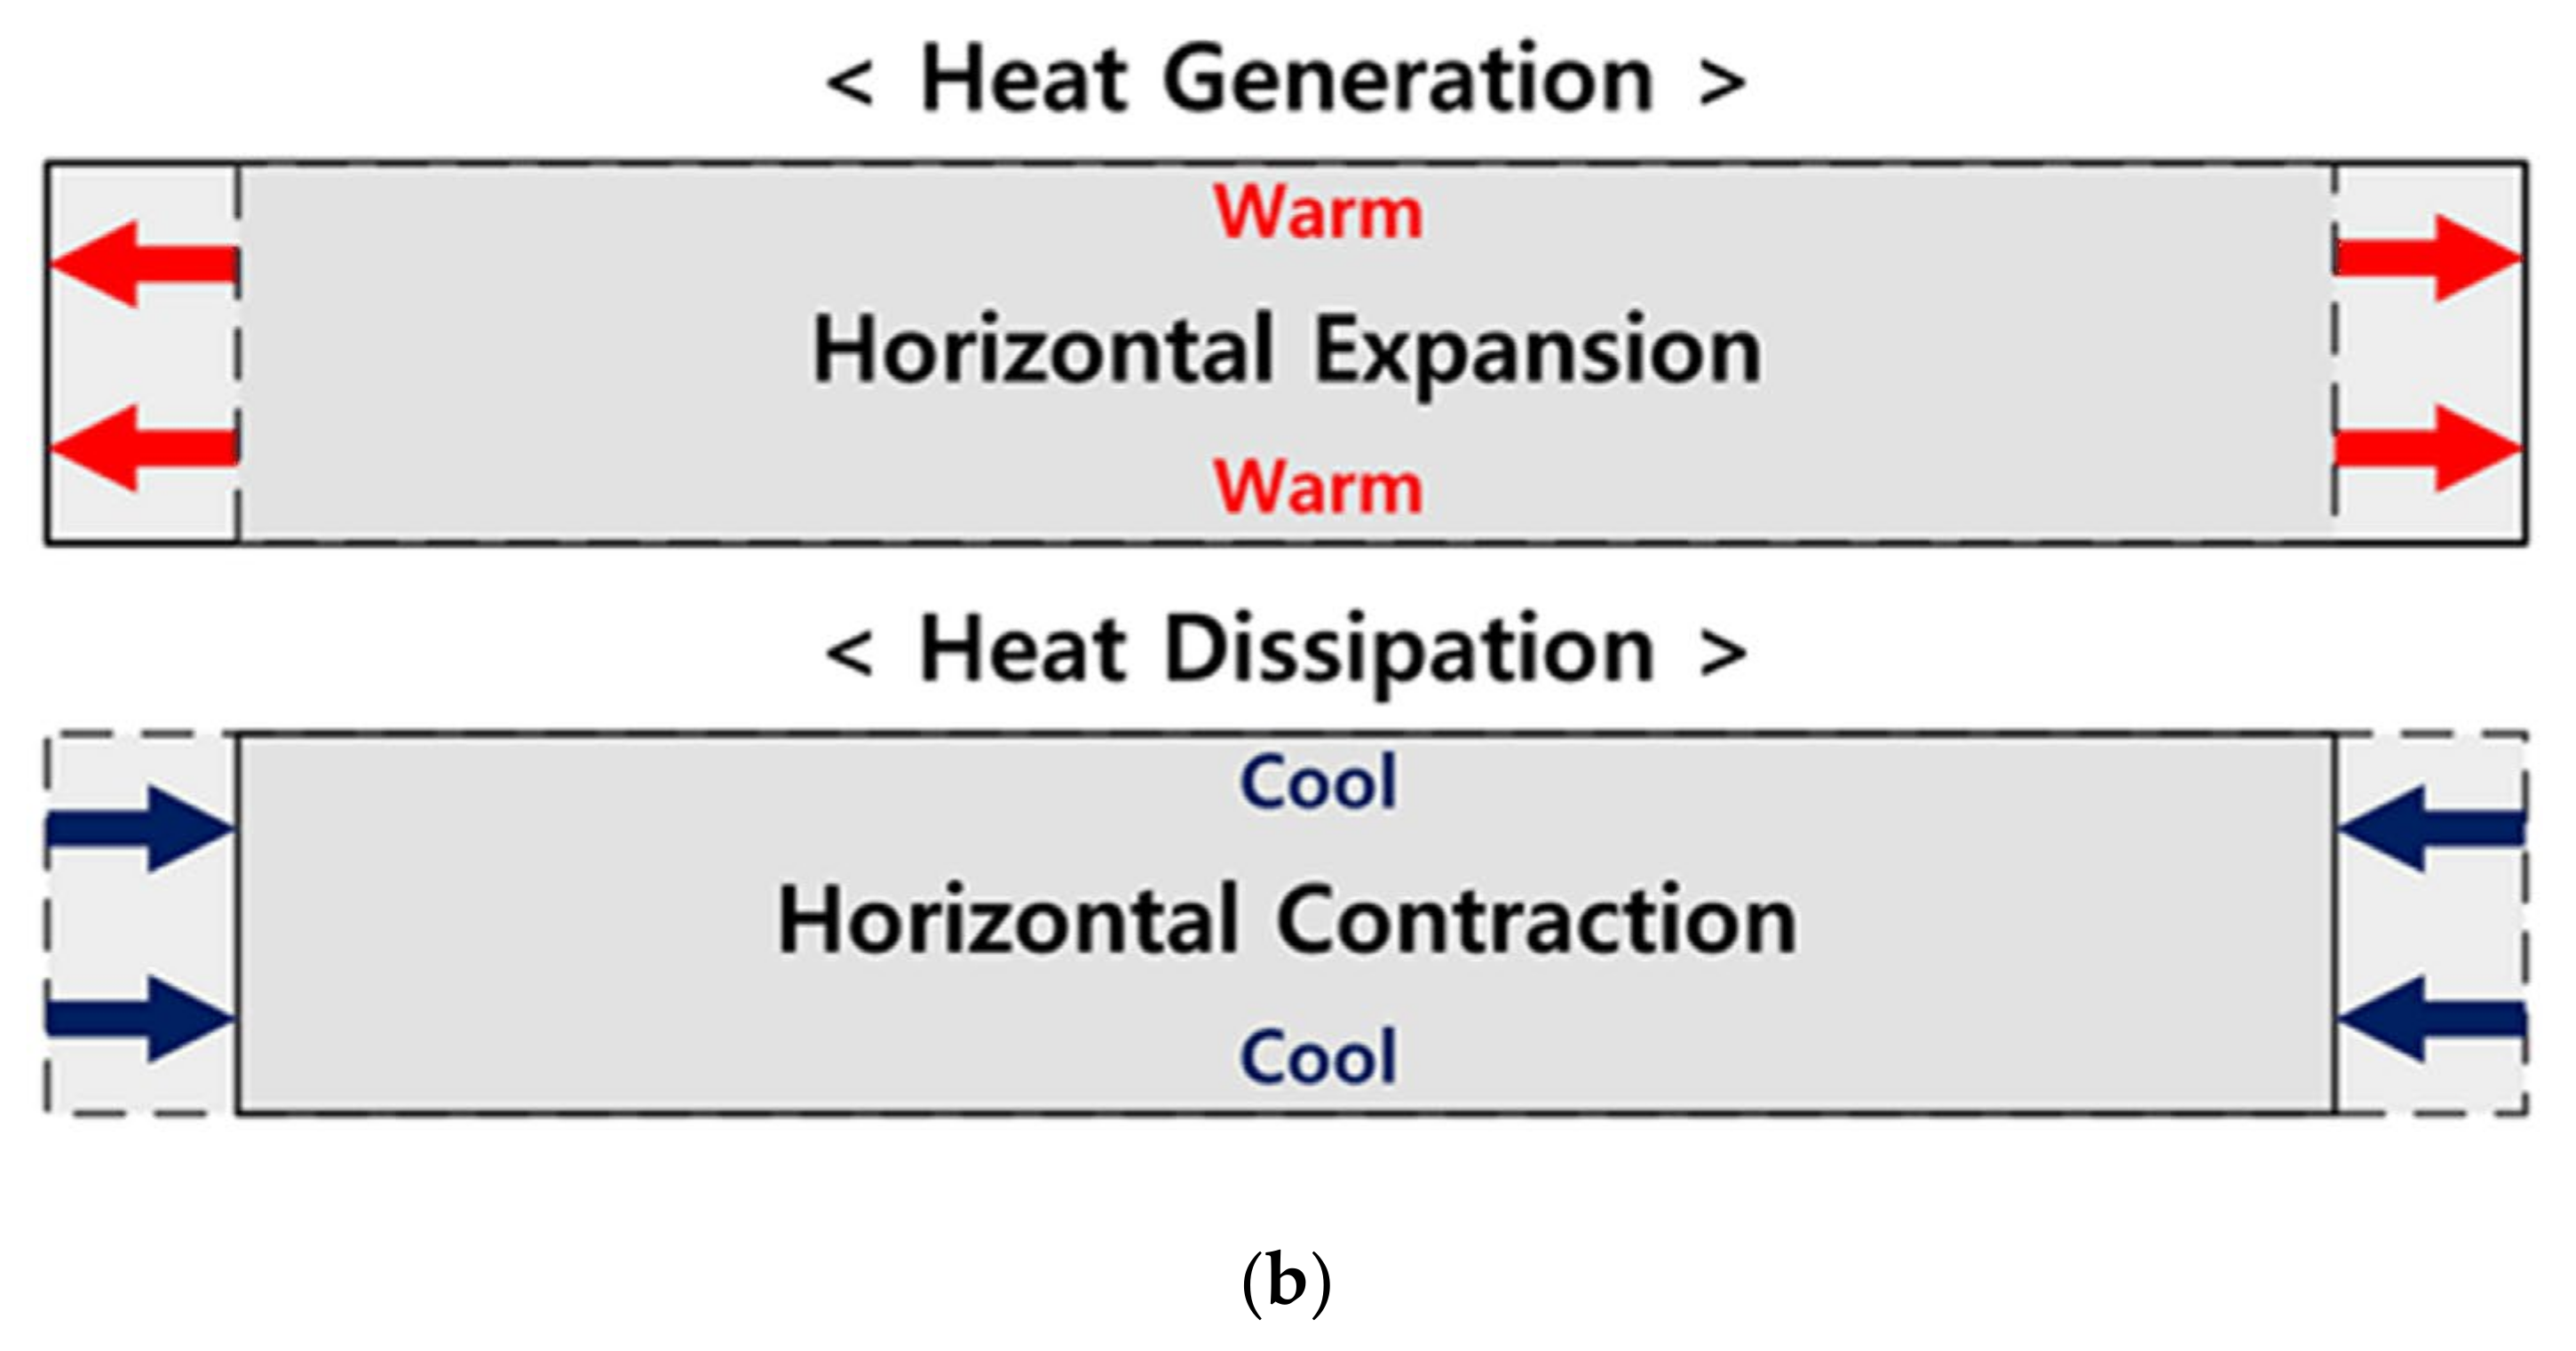
The real strain measured at the corners, mid-edge, and center of the concrete slab were compared according to the slab depth, as shown in Figure 12. The expansion strain increased in the daytime when the ambient temperature was high, whereas the contraction strain increased at night when the ambient temperature was low, as reported elsewhere [7,8]. The variations in the daily expansion and contraction strain cycles were more evident near the top of the slab, where they were affected directly by the ambient temperature. Accordingly, downward curling occurred in the daytime when the top of the slab expanded more than the bottom, and upward curling occurred at night when the top of the slab contracted more than the bottom, as shown in Figure 13.
Immediately after the concrete was placed, the expansion strain increased at all positions and depths because of the heat of hydration of the concrete, as shown in Figure 10. The contraction strain increased at all positions and depths as the heat of hydration disappeared and the ambient temperature decreased. Figure 12b represents a conceptual diagram of the horizontal expansion and contraction of the slab due to the generation and disappearance of the heat of hydration and the decrease in ambient temperature. The expansion strain that occurred at the center of the slab due to the heat of hydration was approximately 50% smaller than those at the mid-edge and corner. The contraction strain caused by the disappearance of the heat of hydration and decrease in ambient temperature increased near the top of the slab at the corner, where the upward curling was the most evident. The contraction strain was similar throughout the slab depth at the mid-edge and center.
4.3. Shrinkage Strain of the Concrete Slab
The shrinkage strain was analyzed by eliminating the thermal strain from the real strain. However, the shrinkage strain still included the strain constraining the slab behavior due to environmental loading by factors such as the friction with the sublayer, weight of the slab, and dowel bars. The creep strain due to the long-lasting environmental stress in the slab is also included in the shrinkage strain.
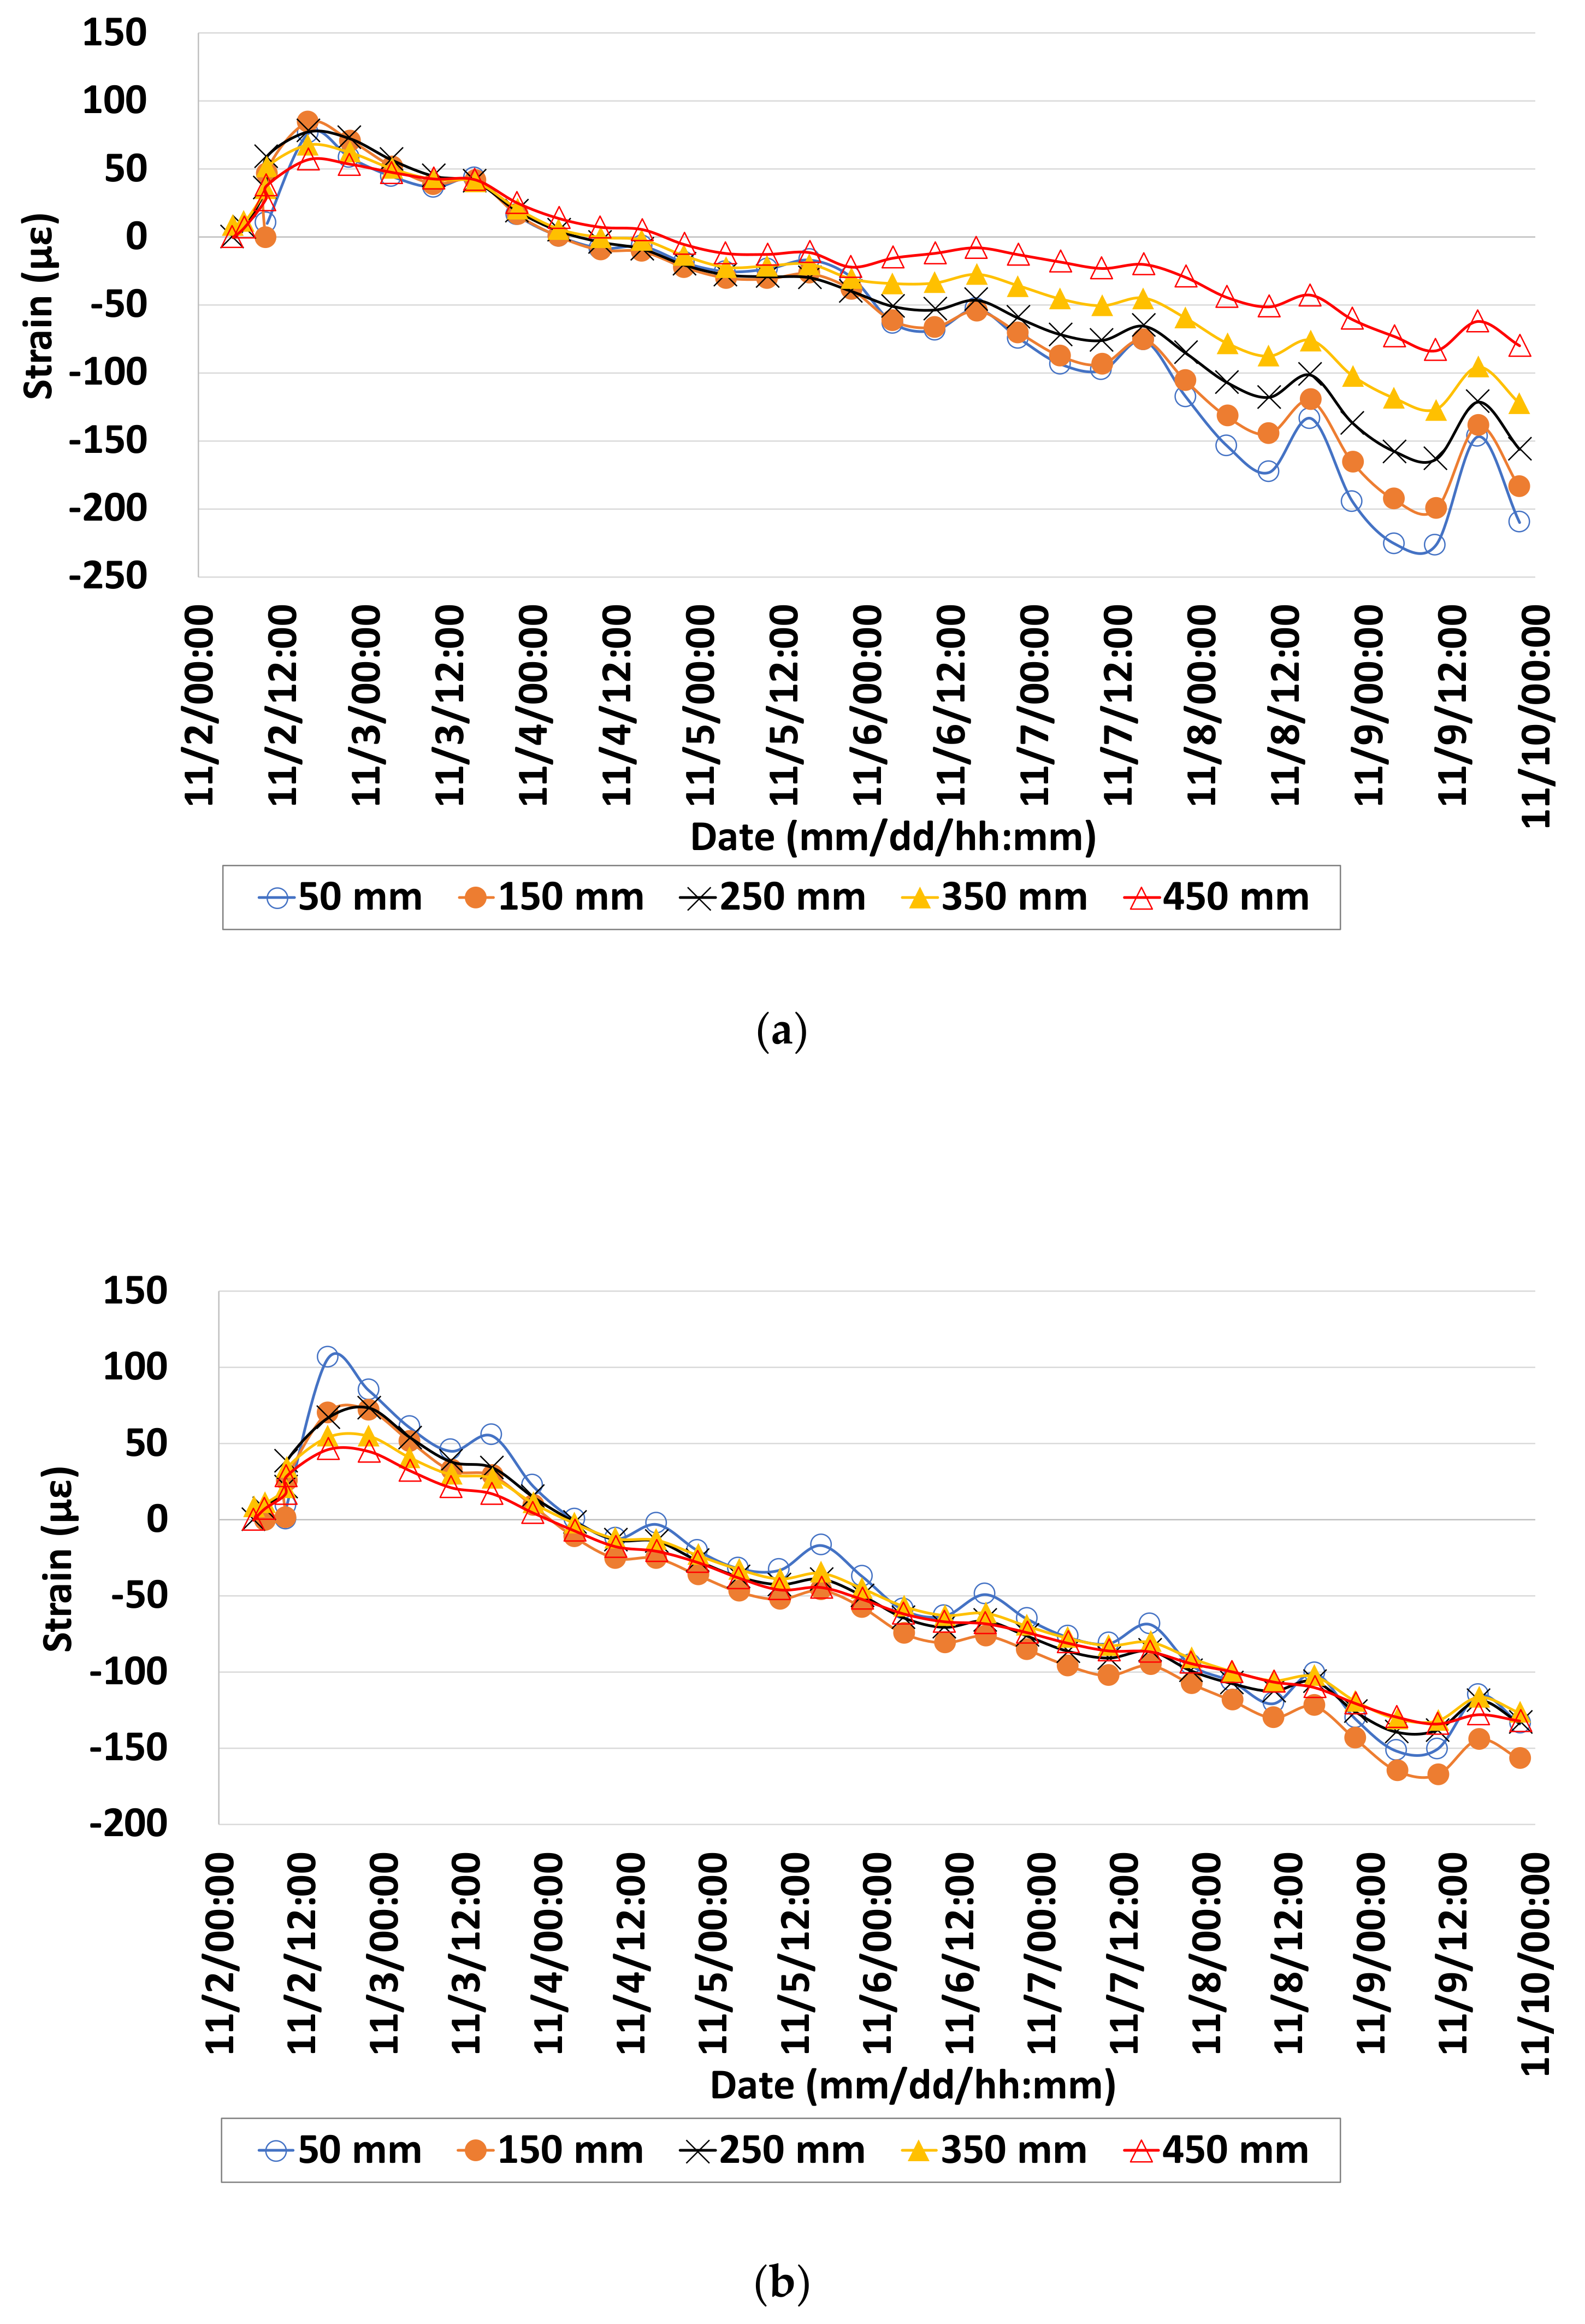
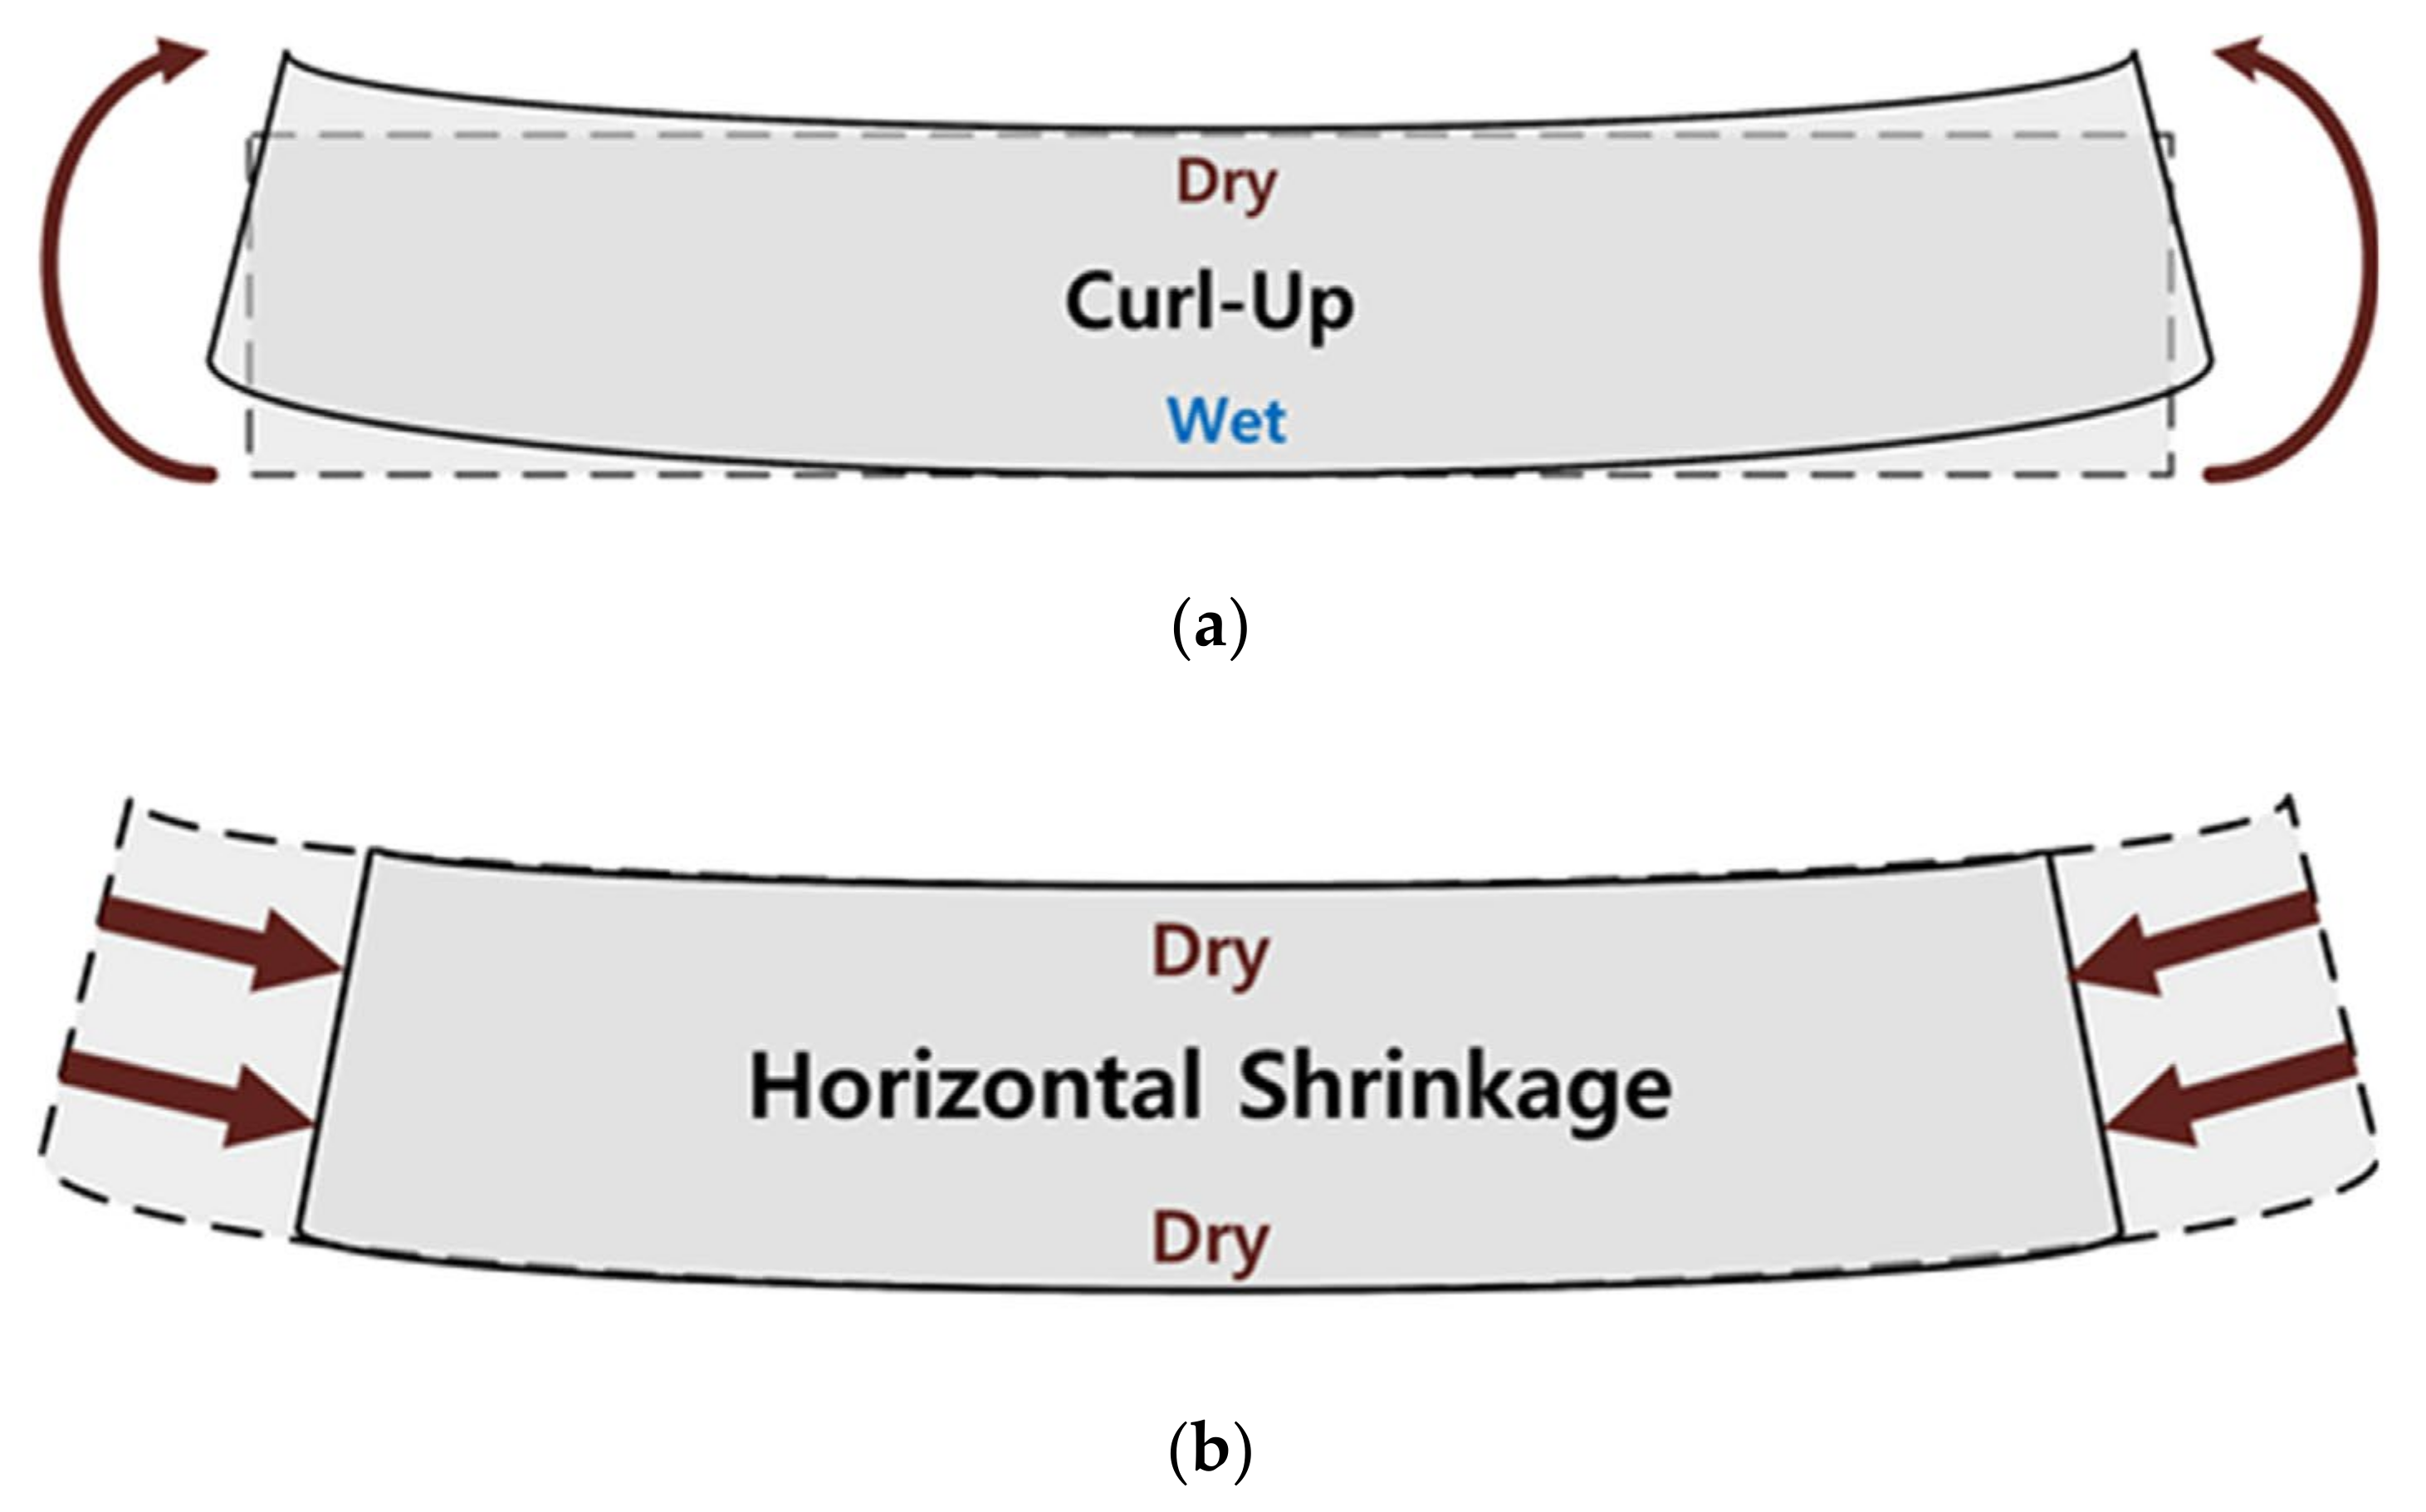
In contrast to the temperature, the concrete slab expanded at night when the ambient relative humidity was high and contracted in the daytime when the ambient relative humidity was low, as shown in Figure 14. The variations in the daily expansion and contraction strain cycles were more evident near the top of the slab, as in the case of temperature. Consequently, downward curling occurred at night, whereas upward curling occurred in the daytime, as shown in Figure 15a.
The concrete slab contracted gradually at shallow depths of 50–150 mm, where moisture evaporation and drying shrinkage were relatively large, similar to previous studies [7,8]. The slab expanded from a depth of 250 mm, as shown in Figure 14. This trend was the most distinct at the corners because the moisture evaporation and drying shrinkage developed fastest at these positions. This can be attributed to the extensive area that was in contact with the ambient air, and the curling behavior was the most evident in the slab. As a result, it was estimated that the upward slab curling increased for the first seven days, as shown in Figure 15b.
4.4. Long-Term Behavior of the Concrete Slab
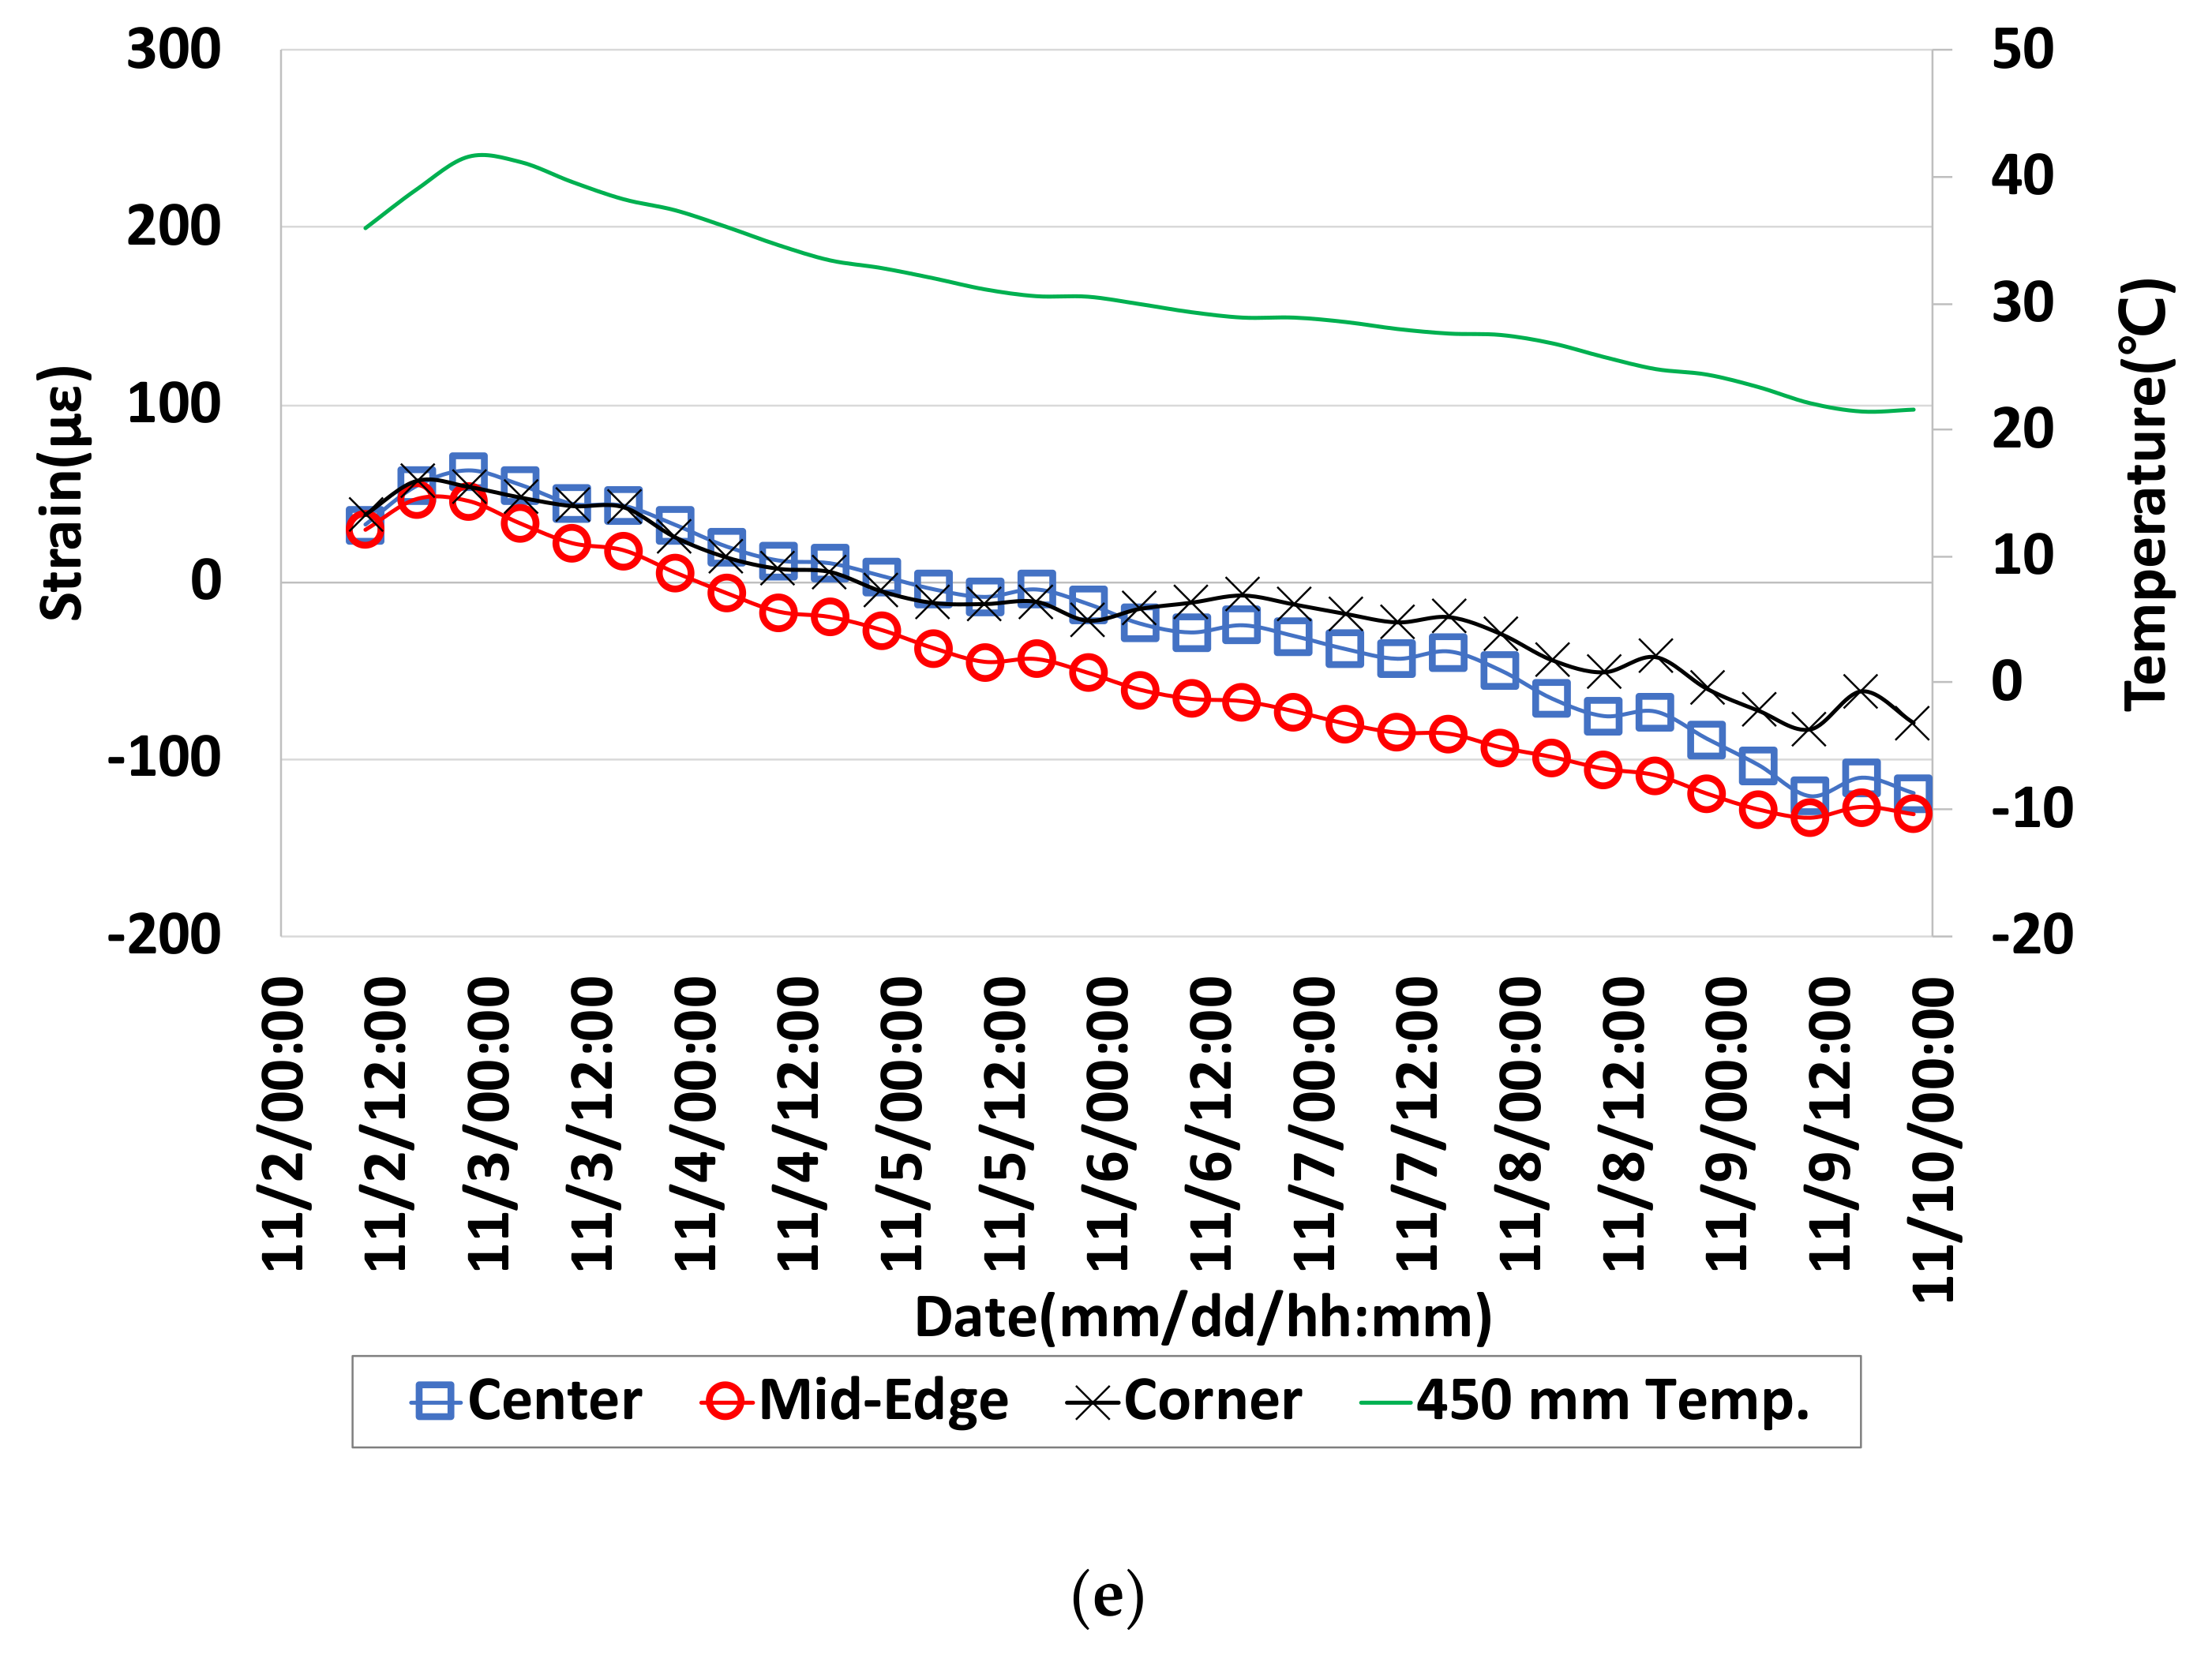
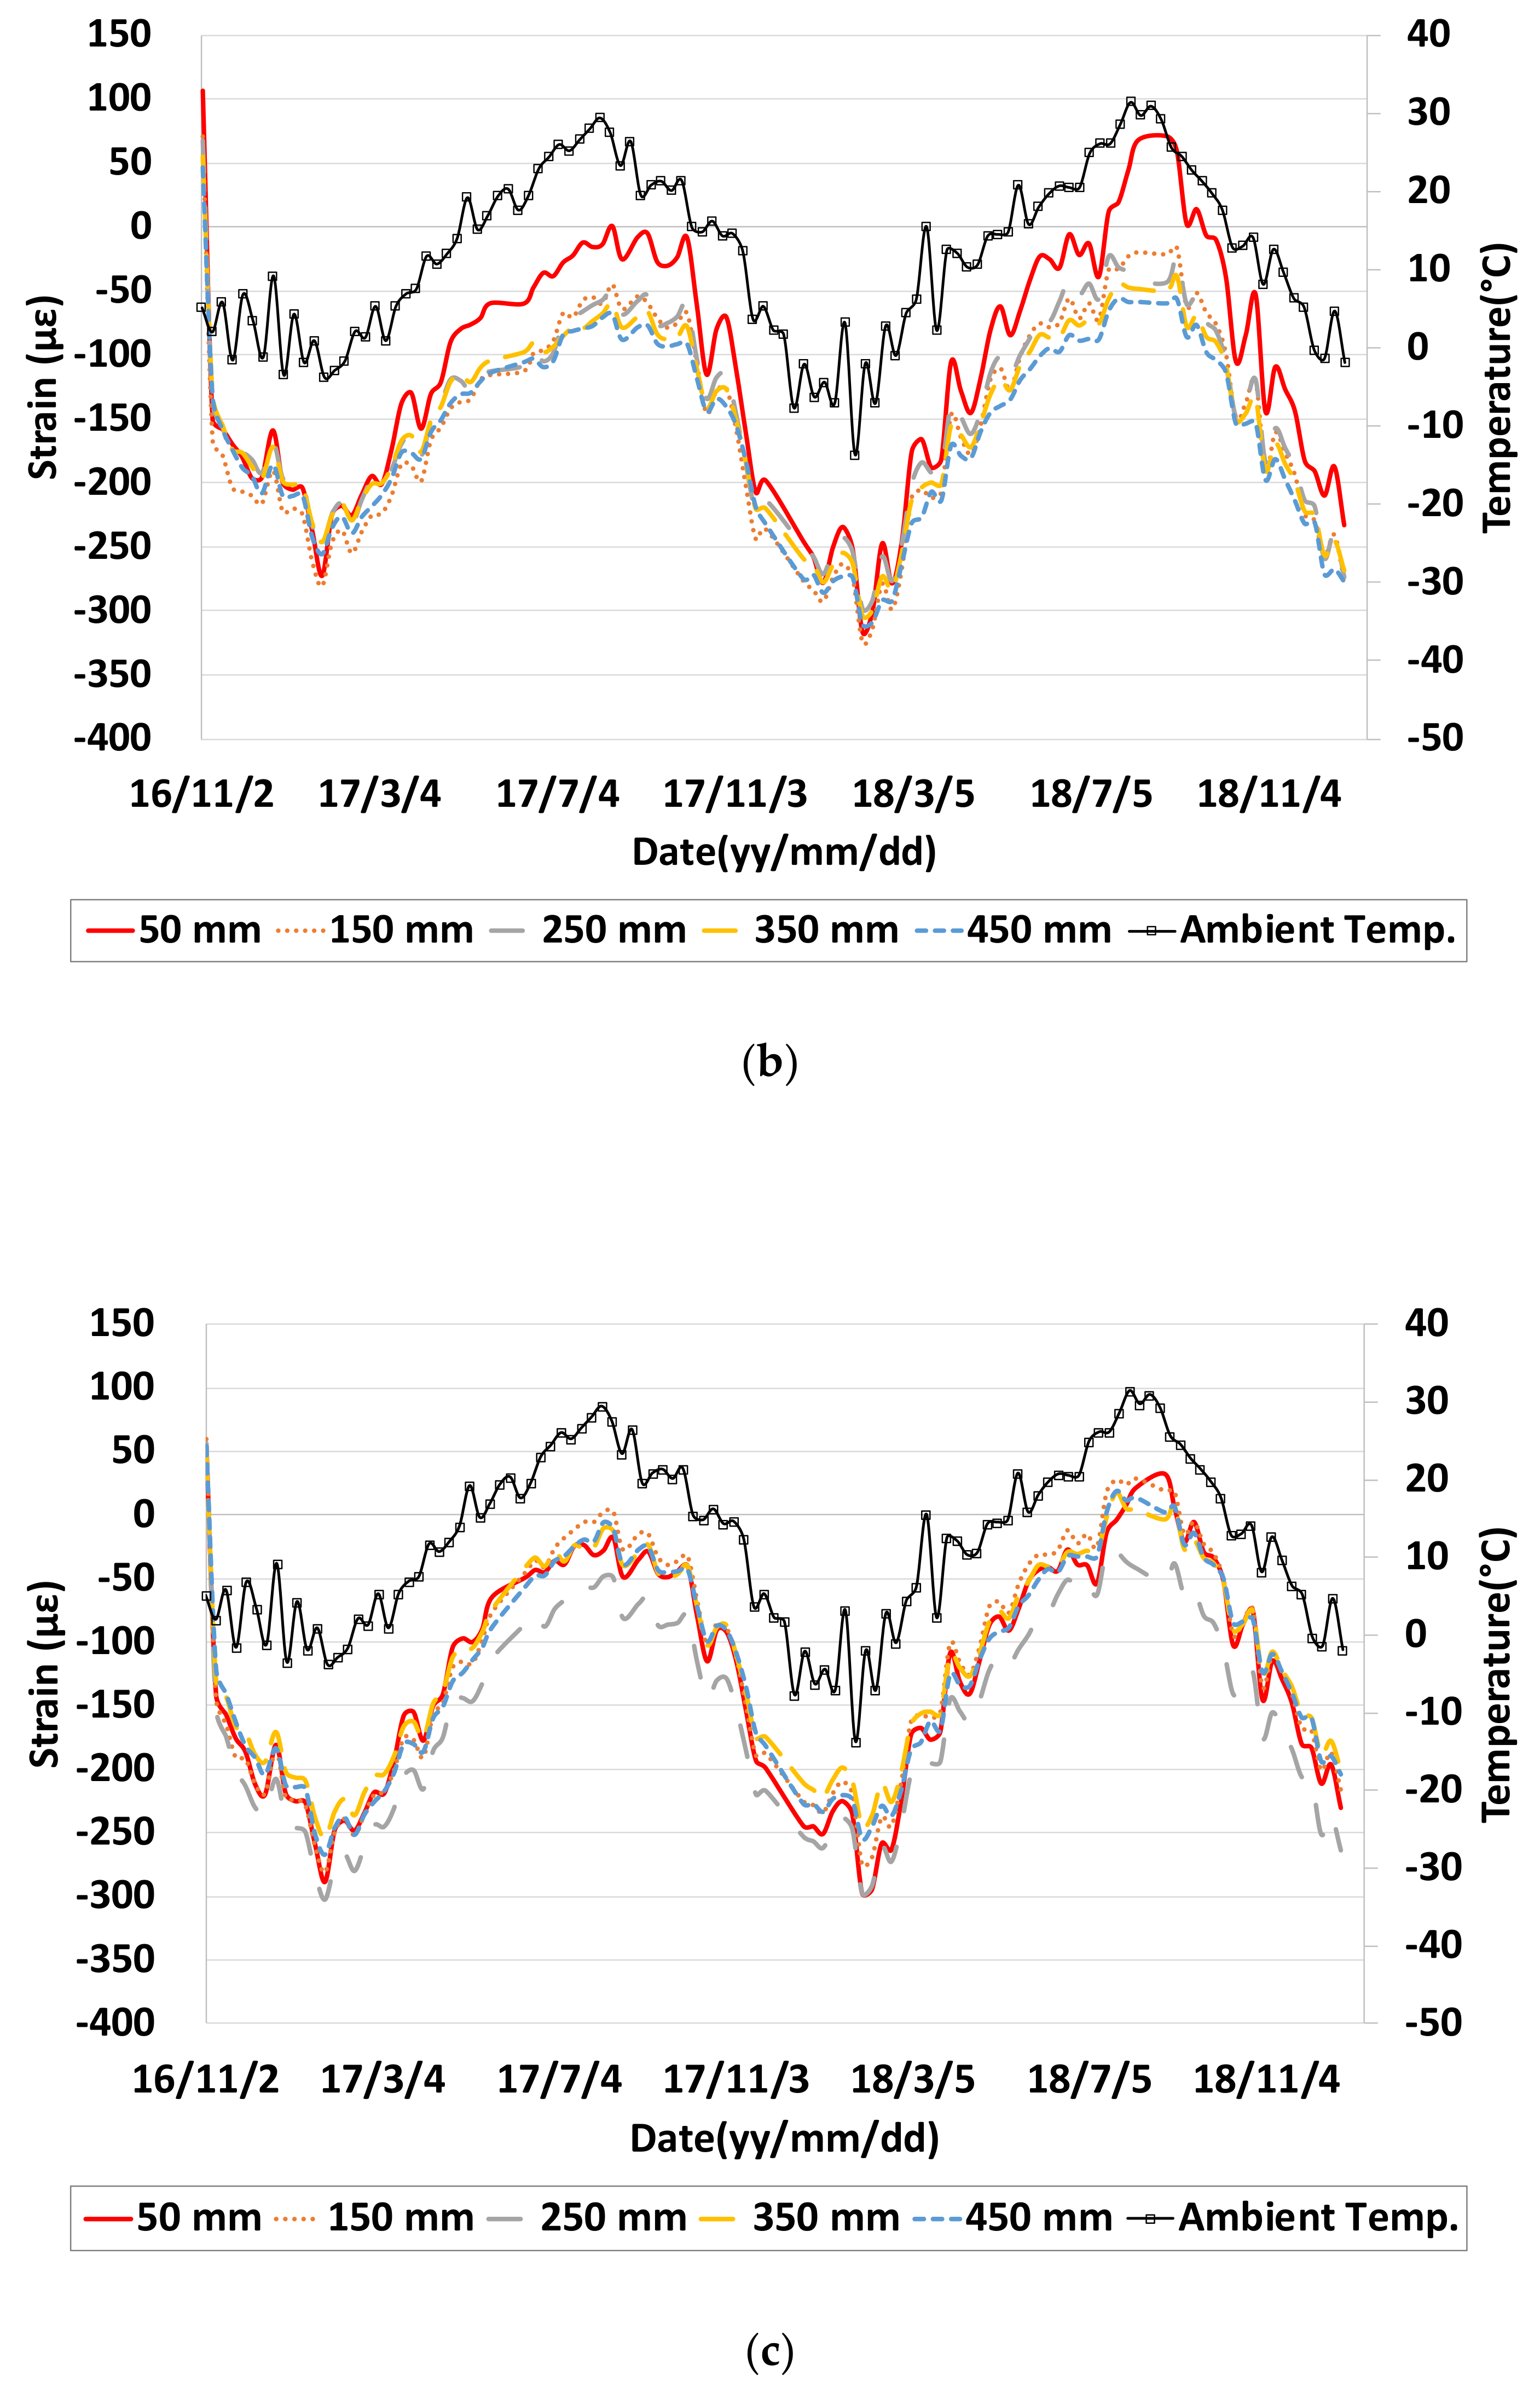
The ambient temperature and real strain were measured according to the concrete slab position and depth over a two-year period, as shown in Figure 16. The concrete slab contracted in winter and expanded in summer throughout the slab depth, as shown in Figure 17, due to variations in the ambient temperature. The shrinkage strain according to the slab position and depth was also measured over a two-year period, as shown in Figure 18. The shrinkage strain at the top of the slab was more than that at the bottom of the slab for the first month due to differential shrinkage between the top and bottom. Upward slab curling occurred, as shown in Figure 19a. The two-year upward slab curling has also been reported before, whereas the influence of differential shrinkage was not clearly verified [8].
The difference in strain due to differential drying shrinkage between the top and bottom of the slab was the clearest at the corners. After the first month, the concrete slab contracted throughout its depth and then expanded in the summer, maintaining a certain difference in strain between the top and bottom of the slab, as shown in Figure 19b. The shrinkage strain included the strain resulting from the constraints of the slab behavior caused by environmental load factors such as friction with the sublayer, weight of the slab, and dowel bars, and also by the strain due to the creep of the slab. Therefore, it was estimated that the shrinkage strain could increase in the expansion direction in the summer.
5. Conclusions
The behavior of concrete slabs was measured over a two-year period from the time of their placement using temperature sensors and strain gauges in IIA. The effects of the environmental loading were analyzed using the collected data. The results are summarized below.
In the case of real strain, the expansion strain increased in the daytime when the ambient temperature was high, whereas the contraction strain increased at night when the ambient temperature was low. The variations in the daily expansion and contraction strain cycles were more evident near the top surface of the slab, where the ambient temperature affects it directly. Accordingly, it was estimated that downward curling occurred in the daytime when the top of the slab expanded more than the bottom, and upward curling occurred at night when the top of the slab contracted more than the bottom. The increase in the expansion strain immediately after the placement of the concrete slab was substantial at each position and depth because of the heat of hydration of the concrete. Furthermore, the contraction strain increased at all positions and depths of the slab as the heat of hydration disappeared and the ambient temperature decreased.
In the case of shrinkage strain, the concrete slab expanded at night when the ambient relative humidity was high and contracted in the daytime when it was low. The variations in the daily expansion and contraction strains were more evident near the top of the slab. Downward and upward curling were estimated to occur at night and day, respectively. The concrete slab contracted gradually at shallow depths of 50–150 mm, where moisture evaporation and drying shrinkage were relatively large, and it expanded from a depth of 250 mm. Upward slab curling increased during the first seven days.
The concrete slab contracted in winter and expanded in summer throughout the slab depth due to the ambient temperature variations and the differential shrinkage between the top and bottom of the slab. The upward slab curling increased for the first month because more drying shrinkage occurred at the top of the slab than at the bottom. After the first month, the concrete slab contracted throughout its depth and then expanded in the summer, maintaining a certain difference in strain between the top and bottom of the slab. The shrinkage strain could increase in the expansion direction in summer due to the constrained slab behavior resulting from the environmental load and due to strain because of the creep of the concrete slab.
The behavior of airport concrete pavement slab caused by temperature and moisture can be predicted using the strain results shown in this study. Based on the strain results, the models such as differential drying shrinkage, transfer function, etc., which are necessary to the design method, will be developed in the following studies.
Author Contributions
H.-W.P. and J.-H.J. conceived and designed the experiments and performed the analysis; H.-W.P. and D.-H.K. wrote the paper; C.-S.S. and J.-H.J. contributed to the preparation of the paper. All authors have read and agreed to the published version of the manuscript.
Funding
This study was funded by Incheon International Airport Corporation, BEX00625. This study was also financially supported by Inha University, 61646-01.
Acknowledgments
This Paper was based on the research project “Development of Airport Pavement Design Method by Analyzing the Characteristics of Long Term Behavior of Airport Pavement (Rigid) (I)” of following Incheon International Airport Corporation and the research project “Development of Transfer Function for Airport Concrete Pavement Design Method” of Inha university.
Conflicts of Interest
The Authors declare no conflict of interest.
References
- Power, T.C. Causes and control of volume change. J. PCA Res. Dev. Lab. 1959, 1, 29–39. [Google Scholar]
- Bazant, Z.P.; Najjar, L.J. Nonlinear water diffusion in non-saturated concrete. Mater. Struct. 1972, 5, 3–20. [Google Scholar] [CrossRef]
- Lim, J.S.; Jeong, J.H.; Zollinger, D.G. Moisture profiles and shrinkage in early-age concrete pavement. Int. J. Pavement Eng. 2009, 10, 29–38. [Google Scholar] [CrossRef]
- Heath, A.C.; Roesler, J.R. Top-down cracking of rigid pavements constructed with fast-setting hydraulic cement concrete. Transp. Res. Rec. 2000, 1712, 3–12. [Google Scholar] [CrossRef]
- Burnham, T.; Koubaa, A. A New Approach to Estimate the In-situ Thermal Coefficient and Drying Shrinkage for Jointed Concrete Pavement. In Proceedings of the 7th International Conference on Concrete Pavement 2001, Orlando, FL, USA, 9–13 September 2001; Volume 1, pp. 313–332. [Google Scholar]
- Jeong, J.H.; Lim, J.S.; Sun, R.J.; Zollinger, D.G. Modelling of differential shrinkage of pavement slabs. Proc. Inst. Civ. Eng. Transp. 2012, 165, 3–14. [Google Scholar] [CrossRef]
- Jeong, J.H.; Zollinger, D.G. Early-age curling and warping behavior insights from a fully instrumented test-slab system. Transp. Res. Rec. 2004, 1896, 66–74. [Google Scholar] [CrossRef]
- Jeong, J.H.; Zollinger, D.G. Environmental effects on the behavior of jointed plain concrete pavements. J. Transp. Eng. 2005, 131, 140–148. [Google Scholar] [CrossRef]
- Park, J.Y.; Yeom, W.S.; Kim, S.H.; Jeong, J.H. Environmental load for design of airport concrete pavements. Proc. Inst. Civ. Eng. Transp. 2015, 168, 139–149. [Google Scholar] [CrossRef]
- Huang, Y.H. Pavement Analysis and Design; Prentice Hall: Englewood Cliffs, NJ, USA, 2004. [Google Scholar]
- Kim, S.H.; Park, J.Y.; Jeong, J.H. Effect of temperature-induced load on airport concrete pavement behavior. KSCE J. Civ. Eng. 2014, 18, 182–187. [Google Scholar] [CrossRef]
- Gao, X.; Wei, Y.; Huang, W. Strain-based equivalent temperature gradient in concrete pavement and comparison with other quantification methods. Road Mater. Pavement Des. 2017, 18, 1460–1472. [Google Scholar] [CrossRef]
- Joshi, A.P.; Mehta, Y.A.; Cleary, D. Load transfer efficiency of rigid airfield pavement relationship to design thickness and temperature curling. Transp. Res. Rec. 2012, 2300, 68–74. [Google Scholar] [CrossRef]
- FAA AC 150/5320-6D. Standards for Airport Pavement Design and Evaluation; Office of Airport Safety and Standards, Federal Aviation Administration, US Department of Transportation: Washington, DC, USA, 1995.
- FAA AC 150/5320-6E. Standards for Airport Pavement Design and Evaluation; Office of Airport Safety and Standards, Federal Aviation Administration, US Department of Transportation: Washington, DC, USA, 2009.
- FAA AC 150/5320-6F. Standards for Airport Pavement Design and Evaluation; Office of Airport Safety and Standards, Office of Airport Safety and Standards, Federal Aviation Administration, US Department of Transportation, US Department of Transportation: Washington, DC, USA, 2016.
- ARA, Inc. Guide for Mechanistic-Empirical Design of New and Rehabilitated Pavement Structures; National Cooperative Highway Research Program, NCHRP 1-37A; ARA, Inc.: Washington, DC, USA, 2004. [Google Scholar]
- KMA. ASOS (Automated Surface Observing System) Data; Korea Meteorological Administration: Seoul, Korea, 2018.
- ASTM. C 469: Standard Test Method for Static Modulus of Elasticity and Poisson’s Ratio of Concrete in Compression; ASTM Standards: West Conshohocken, PA, USA, 2014. [Google Scholar]
- ASTM. C 78: Standard Test Method for Flexural Strength of Concrete; ASTM Standards: West Conshohocken, PA, USA, 2016. [Google Scholar]
- TEX-428-A. Test Procedure for Determining the Coefficient of Thermal Expansion of Concrete; TxDOT Designation; Texas Department of Transportation: Austin, TX, USA, 2011.
- MOLIT. Road Pavement Structure Design Guide; Korea Ministry of Land, Infrastructure and Transport: Sejong City, Korea, 2011.
- ASTM. C 403: Standard Test Method for Time of Setting of Concrete Mixture by Penetration Resistance; ASTM Standards: West Conshohocken, PA, USA, 2016. [Google Scholar]
- Jeong, J.H. Characterization of Slab Behavior and Related Material Properties due to Temperature and Moisture Effects. Ph.D. Thesis, Texas A&M University, College Station, TX, USA, 2003. [Google Scholar]
- Nassiri, S.; Vandenbossche, J.M.; Janssen, D.J. Methodology for identifying zero-stress time for jointed plain concrete pavements. Transp. Res. Rec. 2014, 2441, 62–71. [Google Scholar] [CrossRef]
- Park, H.W.; Kim, D.H.; Lim, J.S.; Shim, C.S.; Jeong, J.H. Prediction of differential drying shrinkage of airport concrete pavement slabs. Int. J. Pavement Eng. 2019. online published. [Google Scholar] [CrossRef]
- Sokki Kenkyujo Co. Ltd. Strain Gage (KM-100B) Instruction Manual; Sokki Kenkyujo Co., Ltd.: Tokyo, Japan, 2015. [Google Scholar]
- Jeong, J.H.; Zollinger, D.G.; Lim, J.S.; Park, J.Y. Age and moisture effects on thermal expansion of concrete pavement slabs. J. Mater. Civ. Eng. 2012, 24, 8–15. [Google Scholar] [CrossRef]
Figure 1.
Flow chart of the study.

Figure 2.
Location of the instrumented slabs: (a) location and (b) instrumented slabs.


Figure 3.
Positions of gauges in the slabs of zone A: (a) plane and (b) section A-A.

Figure 4.
Construction situation on the paving date of zone A.

Figure 5.
Weather data for the first seven days: (a) ambient temperature and ambient relative humidity and (b) solar radiation and wind speed.
Figure 5.
Weather data for the first seven days: (a) ambient temperature and ambient relative humidity and (b) solar radiation and wind speed.

Figure 6.
Weather data over a two-year period: (a) ambient temperature and ambient relative humidity and (b) solar radiation and wind speed.
Figure 6.
Weather data over a two-year period: (a) ambient temperature and ambient relative humidity and (b) solar radiation and wind speed.

Figure 7.
Maturity at final setting obtained by the mortar penetration test.

Figure 8.
Temperature gradient according to the slab depth at the final setting time.

Figure 9.
Ambient and concrete temperature for the first seven days.

Figure 10.
Concrete temperature and real strain according to slab position for the first seven days: (a) 50 mm depth, (b) 150 mm depth, (c) 250 mm depth, (d) 350 mm depth, and (e) 450 mm depth.
Figure 10.
Concrete temperature and real strain according to slab position for the first seven days: (a) 50 mm depth, (b) 150 mm depth, (c) 250 mm depth, (d) 350 mm depth, and (e) 450 mm depth.


Figure 11.
Relationship between the real strain and concrete temperature at the slab corner for the first seven days: (a) 50 mm depth, (b) 150 mm depth, (c) 250 mm depth, (d) 350 mm depth, and (e) 450 mm depth.
Figure 11.
Relationship between the real strain and concrete temperature at the slab corner for the first seven days: (a) 50 mm depth, (b) 150 mm depth, (c) 250 mm depth, (d) 350 mm depth, and (e) 450 mm depth.


Figure 12.
Real strain according to the slab depth for the first seven days: (a) corner, (b) mid-edge, and (c) center.
Figure 12.
Real strain according to the slab depth for the first seven days: (a) corner, (b) mid-edge, and (c) center.


Figure 13.
Early age behavior of concrete slab estimated by the real strain: (a) due to daily temperature variation and (b) due to generation and dissipation of heat of hydration.
Figure 13.
Early age behavior of concrete slab estimated by the real strain: (a) due to daily temperature variation and (b) due to generation and dissipation of heat of hydration.


Figure 14.
Shrinkage strain according to the slab depth for the first seven days: (a) corner, (b) mid-edge, and (c) center.
Figure 14.
Shrinkage strain according to the slab depth for the first seven days: (a) corner, (b) mid-edge, and (c) center.


Figure 15.
Early age behavior of concrete slab estimated by the shrinkage strain: (a) due to daily humidity variation and (b) due to differential drying shrinkage between top and bottom of slab.
Figure 15.
Early age behavior of concrete slab estimated by the shrinkage strain: (a) due to daily humidity variation and (b) due to differential drying shrinkage between top and bottom of slab.

Figure 16.
Real strain according to the slab depth over a two-year period: (a) corner, (b) mid-edge, and (c) center.
Figure 16.
Real strain according to the slab depth over a two-year period: (a) corner, (b) mid-edge, and (c) center.


Figure 17.
Long-term behavior of concrete slab estimated by the real strain.

Figure 18.
Shrinkage strain according to the slab depth over a two-year period: (a) corner, (b) mid-edge, and (c) center.
Figure 18.
Shrinkage strain according to the slab depth over a two-year period: (a) corner, (b) mid-edge, and (c) center.


Figure 19.
Long-term behavior of concrete slab estimated from the shrinkage strain: (a) for the first month and (b) after the first month.
Figure 19.
Long-term behavior of concrete slab estimated from the shrinkage strain: (a) for the first month and (b) after the first month.


Table 1.
Mixture proportions of a concrete slab.
| Mixture Characteristics | Criteria | ||
|---|---|---|---|
| Design flexural strength (MPa) | 4.5 | ||
| Max. size of coarse aggregate (mm) | 40 | ||
| Slump (mm) | 60 | ||
| Air content (%) | 4.5 | ||
| Water-cement ratio (%) | 41.7 | ||
| Fine aggregate modulus (%) | 35.9 | ||
| Unit quantity (kg/m3) | Water | 143 | |
| Cement | 405 | ||
| Fine aggregate | Washed aggregate | 320 | |
| Crushed aggregate | 325 | ||
| Coarse aggregate | 1116 | ||
| AE water reducer (1:4 dilution) | 4.05 | ||
Table 2.
Material properties of a concrete slab.
| Test Item | Test Method | Test Results | Criteria/General Range | Note | |
|---|---|---|---|---|---|
| 28 Days | 90 Days | ||||
| Flexural strength (MPa) | ASTMC78 | 4.94 | 5.10 | 4.50 | Satisfied |
| Elastic modulus (GPa) | ASTM C469 | 26.2 | 28.1 | 28.0~30.0 | |
| Poisson’s ratio | ASTM C469 | 0.178 | 0.193 | 0.176~0.182 | |
| CTE (/°C) | TEX-428-A | 9.92 × 10⁻⁶ | (8.6–12.3) × 10−6 | ||
© 2020 by the authors. Licensee MDPI, Basel, Switzerland. This article is an open access article distributed under the terms and conditions of the Creative Commons Attribution (CC BY) license (http://creativecommons.org/licenses/by/4.0/).
Share and Cite
MDPI and ACS Style
Park, H.-W.; Kim, D.-H.; Shim, C.-S.; Jeong, J.-H. Behavior of Airport Concrete Pavement Slabs Exposed to Environmental Loadings. Appl. Sci. 2020, 10, 2618. https://0-doi-org.brum.beds.ac.uk/10.3390/app10072618
AMA Style
Park H-W, Kim D-H, Shim C-S, Jeong J-H. Behavior of Airport Concrete Pavement Slabs Exposed to Environmental Loadings. Applied Sciences. 2020; 10(7):2618. https://0-doi-org.brum.beds.ac.uk/10.3390/app10072618
Chicago/Turabian StylePark, Hae-Won, Dong-Hyuk Kim, Cha-Sang Shim, and Jin-Hoon Jeong. 2020. "Behavior of Airport Concrete Pavement Slabs Exposed to Environmental Loadings" Applied Sciences 10, no. 7: 2618. https://0-doi-org.brum.beds.ac.uk/10.3390/app10072618
Note that from the first issue of 2016, this journal uses article numbers instead of page numbers. See further details here.