Effect of Micropiles on Clean Sand Liquefaction Risk Based on CPT and SPT


1
Department of Civil and Environmental Engineering and Construction, University of Nevada, Las Vegas, NV 89154, USA
2
Natural Resource Operations and Rural Development, British Columbia, Ministry of Forests, Lands, Prince George, BC V2L 1R5, Canada
*
Author to whom correspondence should be addressed.
Appl. Sci. 2020, 10(9), 3111; https://0-doi-org.brum.beds.ac.uk/10.3390/app10093111
Submission received: 3 April 2020
/
Revised: 24 April 2020
/
Accepted: 25 April 2020
/
Published: 29 April 2020
(This article belongs to the Section Civil Engineering)
Abstract
:Liquefaction is a hazardous seismic-based phenomenon, which causes an abrupt decrease in soil strength properties and can result in the massive destruction of the built environment. This research presents a novel approach to reduce the risk of soil liquefaction using jet-grouted micropiles in clean sands. The saturated soil profile of the study project mainly contains clean sands, which are suitable to more reliably employ simplified soil liquefaction analyses. The grouting is conducted using 420 micropiles to increase the existing soil properties. The effect of jet grouting on reducing the potential of liquefaction is assessed using the results of the cone penetration test (CPT) and the standard penetration test (SPT), which were conducted before and after jet grouting by implementing micropiles in the project sites. According to three CPT-based liquefaction analyses, the Juang method predicts the most effective improvement range of the factor of safety in the clean sand. The Boulanger and Idriss, and Eurocode methods show comparable evaluations. Results of the SPT-based analyses show the most considerable increase of the factor of safety following the Boulanger and Idriss, and NCEER approaches in the SP soil. CPT- and SPT-based analyses confirm the effectiveness of jet grouting by micropiles on enhancing soil properties and reducing the risk of liquefaction.
1. Introduction
Liquefaction can occur by cyclic seismic loadings and causes an unexpected decrease in soil strength properties. Undrained saturated or moderately saturated sandy soils in areas with a high risk of earthquakes are prone to liquefaction. Such soils commonly exist in coastal regions with water levels close to the ground surface. During liquefaction, the pore water pressure peaks, and the effective stress of the soil is quickly reduced to almost zero. These abrupt changes in the soil stress properties result in massive destruction of the built environment, such as overturning of buildings. Since liquefaction happens suddenly and unexpectedly during seismic-based ground motion, the response time for building residents to get to safety is very short, which can cause considerable death tolls in large magnitude quakes. For instance, liquefaction was the main reason for the destruction of the buildings in 1964 Nigata, 2010 Canterbury, and 2011 Christchurch [1,2,3]. As a more recent example, liquefaction was the major cause of damages in the 2018 Central Sulawesi, Indonesia, earthquake [4].
In the past, traditional soil improvement techniques have been developed to increase soils’ effective stress such as soil dynamic and vibro compaction [5] permanent dewatering [6], blast densification [7,8], deep soil mixing [9,10], and post-liquefaction dissipation of pore pressure [11], along with the gravel vertical drain method [12]. The stone column stabilization technique is also used for decreasing liquefaction potential [13,14]. The combined soil stabilization with vertical columns (CSV) method has gained a reputation for liquefaction control. The CSV method is preferred over the stone column method in residential projects due to economic considerations [15]. Presently, environmentally friendly approaches have been developed to mitigate the risk of liquefaction. The aim of such approaches, which are known as passive soil stabilization methods, is to cause minimum disruption to the soil during the geotechnical practices of strengthening the soil against liquefaction. In the passive soil stabilization method, biological soil remediation, such as biogas and biocementation, and cementitious composite [16] have made considerable advances. As an innovative environment-friendly approach, the use of recycled materials, such as tire chips and fiber-reinforced material, are used to enhance the structural capacity of pile foundations [17,18]. Such a recyclable material is also useful to reduce the risk of liquefaction. Tire shreds (chips) absorb seismic vibration and decrease pore water pressure, which in respect reinforces the soil against liquefaction [19].
Using the jet grouting method for soil stabilization is a preferable method to decrease liquefaction potential by improving the shear strength of the soil. This method is constantly developing and has received wide attention over the years [20]. The jet grouting method enhances the mechanical properties of the soil using slurry grout that includes a mixture of Portland cement and water. The grouted material is applied to the soil using high-pressure jets, which penetrate through the soil by collapsing its existing structure. As a result, the soil is mixed and reinforced with the cement grout material. The high-pressure grouting also leads to filling the available cracks or cavities in the soil [21]. The stiffness and strength properties of the grouted materials are important factors in controlling the soil deformation during earthquakes. The reinforced soil, with high-strength grouted material, has an enhanced capacity against overturning under seismic loads.
Micropiles have gained attention widely in the geotechnical applications for settlement control, and improvement of the bearing capacity of soil [22]. The structural capacity of the micropile elements, along with their soil reinforcement capability, are significant factors in the design and construction of many projects following the Federal Highway Administration (FHWA-NHI) guideline [23]. A micropile is a type of drilled shaft with a diameter in the range of 75 to 300 mm. Micropile elements can be installed in areas with limited geometrical conditions, and with various length or installation angles [24]. The installation of micropile elements requires relatively light equipment, compared to the traditional pile installation methods which accelerates the construction rate [25]. High-strength steel bars, or steel tubes, increase the capacity of the micropile element against buckling, and enhance the punching shear resistance of the connected concrete slab [26]. The bond between the micropile and the soil develops using the high-velocity jet grouting method.
The FHWA-NHI guideline classified two cases regarding the design and implementation of micropiles. In Case 1, the structural capacity of the micropile is used to bear the axial or lateral load applications. Case 1 micropiles are designed individually, and are commonly employed in almost all of the micropile projects in North America [23]. Many research investigations have been conducted on the structural responses of the micropile elements [27,28]. Case 2 micropiles are designed as a reticulated network. In this case, both the structural and soil reinforcing capacities of the group of micropiles are used to increase the soil-bearing resistance and control the settlement [29]. Few research studies have investigated the use of micropiles to enhance the mechanical properties of the soil together with the high-pressure grouting method, to reduce the risk of liquefaction [30].
Methods of evaluating liquefaction risk are based on the semi-empirical results following case-history data [31,32]. These methods have been developed through the years, using the latest available seismic data, and are commonly used in the design and construction process of infrastructures. The first simplified procedure for measuring the liquefaction potential was developed by Seed and Idriss [33], and has been widely adopted in practices of geotechnical engineering. However, recent studies show that such simplified liquefaction assessment methods are only reliable for soil profiles that mainly contain clean sands, with fines contents of less than 5%. The outcomes of the simplified method are not well founded for problematic soil [34]. Problematic soil layers mostly include interbedded layers of sand and gravel with high percentages of fines contents and plasticity variations. Silty sand, clayey sand, silty gravel, and clayey gravel with more than 12% of fines are categorized as problematic soils [35].
Many researchers have investigated the potential of the liquefaction following the results of cone penetration test (CPT) and the standard penetration test (SPT) [36,37]. These studies were conducted based on the case history database of the major earthquakes throughout the world. However, to the knowledge of the authors, there has been a lack of investigation on the effects of using jet-grouted micropiles on mitigating the risk of liquefaction. Moreover, simplified soil liquefaction assessment methods are only reliable for clean sands. The existence of a saturated soil profile with the majority of clean sand layers creates a unique opportunity to use the simplified liquefaction assessment method to further evaluate the effectiveness of soil remediation practices on decreasing the risk of soil liquefaction.
This study presents a novel approach to reduce the risk of soil liquefaction using jet-grouted micropiles in a case study research. The investigated project is located in a long coastal area in the southwest of Iran, and adjacent to the Persian Gulf. The soil profile mainly includes interbedded layers of clean sands. Since the majority of the soil is clean sand, the simplified liquefaction evaluation method was used to assess the liquefaction potential. Improvement of the soil after using jet-grouted micropiles was evaluated and compared to the native existing soil. CPT and SPT are the most reliable indices for assessing the liquefaction specifications of soils. [31]. This research used the results of both CPT and SPT in the procedure of liquefaction analyses.
2. Material and Methods
2.1. Study Site Description and Design
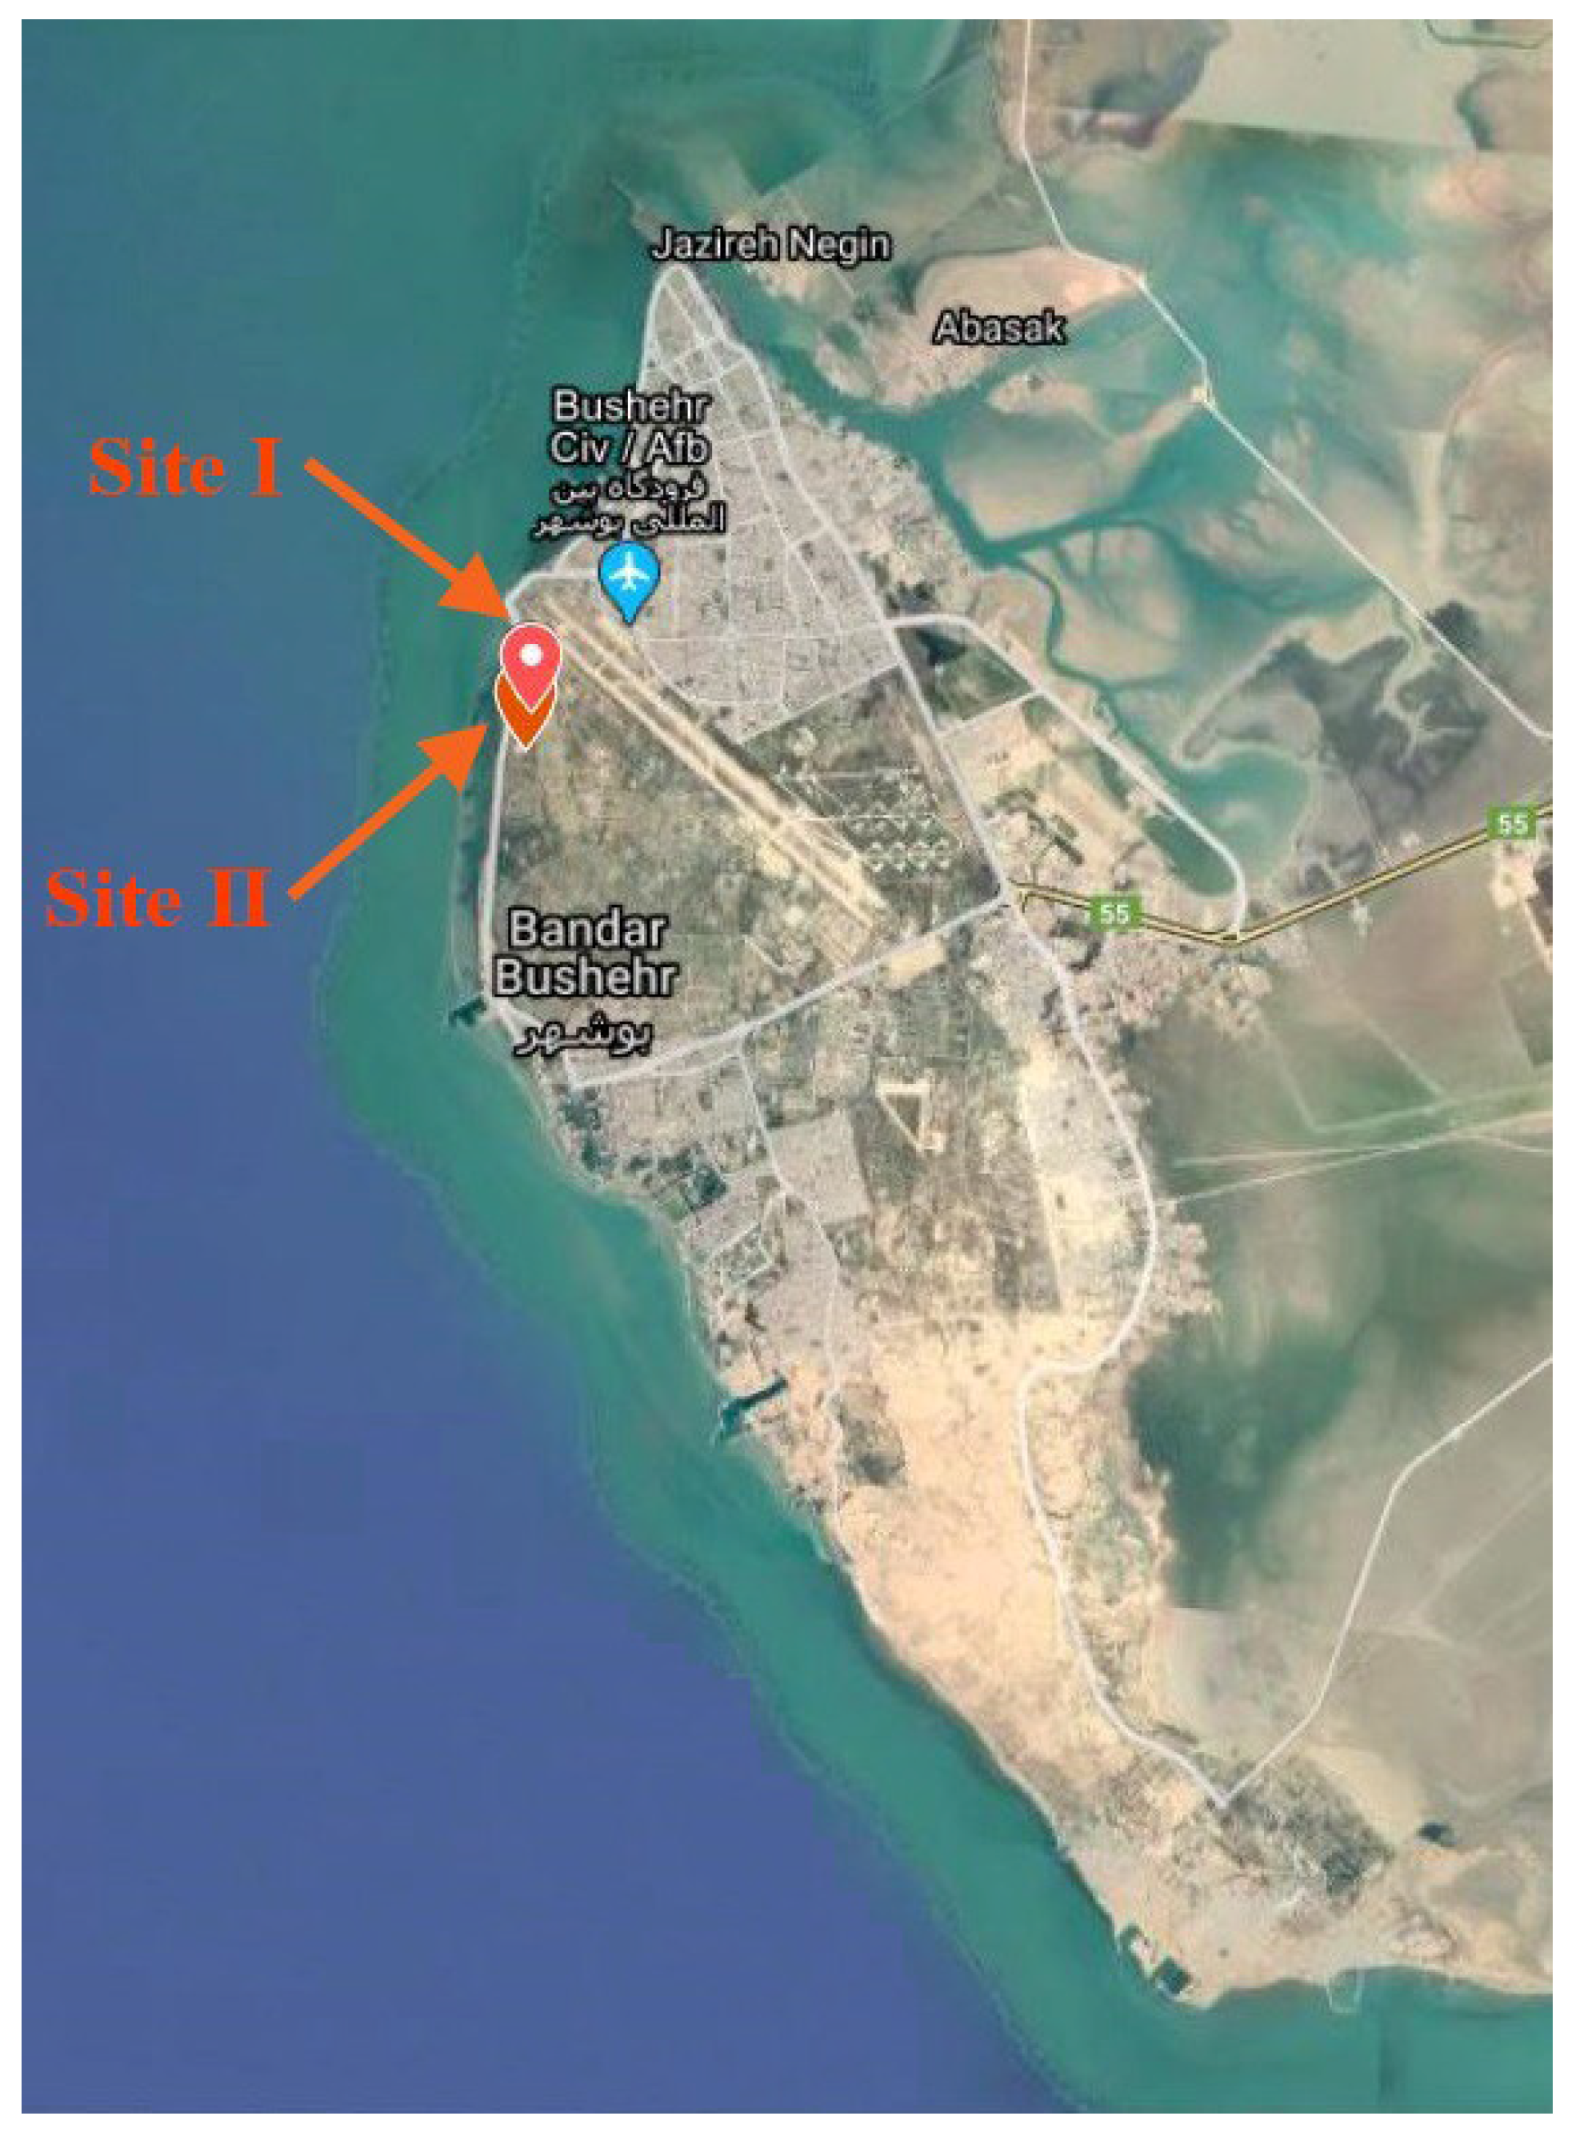
The research case study project was located in the seismically active city of Bushehr, southwest Iran at the seaside of the Persian Gulf (Figure 1). The region has a record of high-magnitude earthquakes. For instance, in April 2013, an earthquake occurred with a moment magnitude of 6.4, and with the epicenter 90 km from Bushehr [38]. The most recent earthquake near the Persian Gulf was recorded on 15 March 2020, with a magnitude of 5.3 and a distance of 95 km from Bandar ‘Abbas, on the southern coast of the Persian Gulf [39].
The soil profiles are characterized by thick layers of clean, saturated sand. Geotechnical properties of the soil in the site project were determined by performing in situ and laboratory tests in two project sites. To specify the stratigraphy of the soil, a rotary drilling technique was employed to drill 10 boreholes to approximate depths of 30 m in two sites of the project. In each site, the mechanical, physical, and chemical properties of the soil were evaluated by drilling five additional boreholes. Soil boring logs include the classification of soil layers, identification of CPT or SPT values, groundwater levels, moisture contents, and unit weights. Based on the borehole logs, most of the interbedded layers were thick layers of poorly graded sand (SP), as clean sand. In addition to the SP layers, the soil also consisted of layers of poorly graded sand along with clay and silt (SP-SC, SP-SM) clayey sand (SC), or silty sand (SM). Based on the bore log data from the boreholes in site I, almost 81% of the soil layers SP were clean sand. In the site II, 76% of soil layers were clean sand (SP).
In this research, a jet-grouting method is performed using 420 micropiles, with a length of 24 m and casing outside diameter (OD) of 140 mm (5.5 inches), to enhance the existing soil properties. The effect of jet grouting using micropiles on reducing the potential of liquefaction was assessed using the results of CPT and SPT tests at two adjacent sites, which were conducted prior to and after jet grouting using micropiles. The factor of safety against the liquefaction was measured using the results of CPT and SPT, following the procedures of Eurocode 8, NCEER-97, Boulanger and Idriss 2014, and Juang 2006 [40,41,42]. At site I, CPT was carried out following the ASTM D3441-16 specifications [43] to delineate soil stratigraphy and measure the geotechnical properties. The CPT tests were conducted before and after the soil improvement employing jet grouted micropiles. At site II, SPT tests were performed based on the ASTM D1586/D1586M standard [44] to specify the soil layers and measure the geotechnical properties of the soil before and after using micropiles.
Sites I and II had 220 and 200 micropile elements installed, respectively. These micropiles were porous steel tubes with a casing outer diameter (OD) of 140 mm (5.5 inches) and wall thickness of 12.7 mm (0.50 inch). The elements were reinforced with a single steel bar, with a diameter of 32 mm (10 inches), and an outer diameter of 36 mm (1.43 inch) over threads. The reinforcement steel was made of 520 steel grade with a yield stress of 520 MPa and an ultimate stress of 690 MPa, following A615/A615M-18e1 [46] specifications. Micropile elements were installed as an arrangement of 2.5 × 2.5 m, center-to-center element distances, in a plan at site I, and a 2.3 × 2.3 cm grid at site II. The distance between micropile elements was selected based on previous records of micropile installation in adjacent sites. In situ tests indicated factors such as leakage control around the micropile casing and, as soil hydrofracture affects the efficiency of the post grouting, using different geometrical arrangements of micropiles.
The type C-C1 post grouting procedure, based on the FHWA-NHI guideline, was used in the project. In this method, the grout is placed using micropile elements in two phases. First, the neat cement grout is placed under the gravity head for 20 min. In the second phase, before the hardening of the primary grout, global pressure of 1.2 MPa is applied using a preinstalled sleeved grout pipe with a pressure of 1.3 MPa. Figure 2 shows the excavated micropile tube element after the first phase of the pressure grout. Type II cement according to the ASTM C150/AASHTO M85 with the design compressive strength of 32 MPa was used in the grout material. The water/cement ratio of the grout mix was 0.45. Chemically compatible additives were used in the grout material to enhance the grouting efficiency in long distances from the core of micropile elements, and to improve the pumping range. The Type C post-grouting method is usually expected to inject the grout up to the rate of 50 L/min, per the FHWA-NHI guideline [23]. At sites I and II, the grouting rate was recorded between 260 to 290 L/min. This considerably higher range of grout delivery was almost five to six times the expected rate and shows the porosity of the soil profile in the project, which mainly consisted of SP clean sands. The micropile elements were spaced in a 2.5 × 2.5 m center-to-center grid.
At site I, CPT measurements were carried out prior to and after performing type C-C1 jet grouting using micropiles. The CPT values before and after micropile installation were measured in a single boring at the same location, based on logging the data of five boreholes, (BH-I-1,5). The risk of liquefaction triggering is evaluated by analyzing the measured CPT values, such as cone penetration resistance () and sleeve resistance (). In order to enhance the precision and accuracy of outcomes in this research, the CPT-based simplified liquefaction triggering was assessed following the specifications and recommendations of Boulanger and Idriss 2014 [31] and Eurocode 8 [42], along with the Juang 2006 [41] method. The peak ground acceleration at the ground level of site I was measured as . The calculations were performed based on the moment magnitude . According to the bore log data at the site I, the groundwater level (GWL) during the CPT test was 1.2 m. The GWL during the earthquake was assumed to be 1.7 m.
At site II, SPT was performed before and after jet grouting by micropiles. The soil liquefaction potential was evaluated by using values. To shed further light on the accuracy of the analyses, specifications and recommendations by Boulanger and Idriss 2014, NCEER (1997), and Eurocode 8 were followed for the SPT-based liquefaction assessment. In the calculation procedure, and values were used. According to the bore log data at site II, the groundwater level (GWL) during the CPT test was 1.5 m. The GWL during the seismic loading was assumed to be 2.0 m.
2.2. CPT-Based Simplifeid Liquefaction Assessment (Site I)
At site I, CPT, as the most reliable site tool for soil liquefaction characterization [31], was used. In this regard, the cyclic resistance of the soil against the liquefaction (CRR) was compared to the seismic-based cyclic shear stress (CSR). The factor of safety for predicting the risk of liquefaction triggering (FS) is defined as the ratio of CRR to CSR [31]. Liquefaction is triggered if the FS value is more than 1. The CSR value is presented in Equation (1).
where is the maximum seismic induced shear stress, and are the vertical effective and total stress at the specified depth, is the peak horizontal ground acceleration, and is the shear stress reduction coefficient, which is the function of the specified depth of soil layers (z) and moment magnitude () [47]. In Equation (1), CSR and are not functions of developed excess pore pressure during the seismic loadings.
Empirical curves to evaluate the resistance capacity of soil against the liquefaction were developed using the CPT case history database of clean sands in the site I. The database was collected from sites with the earthquake history, noting if liquefaction was triggered or not. In these deterministic empirical curves, the CRR quantities were correlated to laboratory test indices. The curves act as boundary lines by separating the case histories to determine if liquefaction occurs or not. All available case history data were revised to reference effective stress and moment magnitude to present a single graph to determine the liquefaction manifestation. The measured CPT penetration resistance values were corrected to include the effect of fines contents (FC) and overburden stress. For the correction, the available data were categorized in different bins of existing soils (clean sand, sandy silts, and silty sands) and compared to the equivalent clean sand cone penetration resistance (). The resulting graph to evaluate CPT-based liquefaction determination is presented as versus in the following sections.
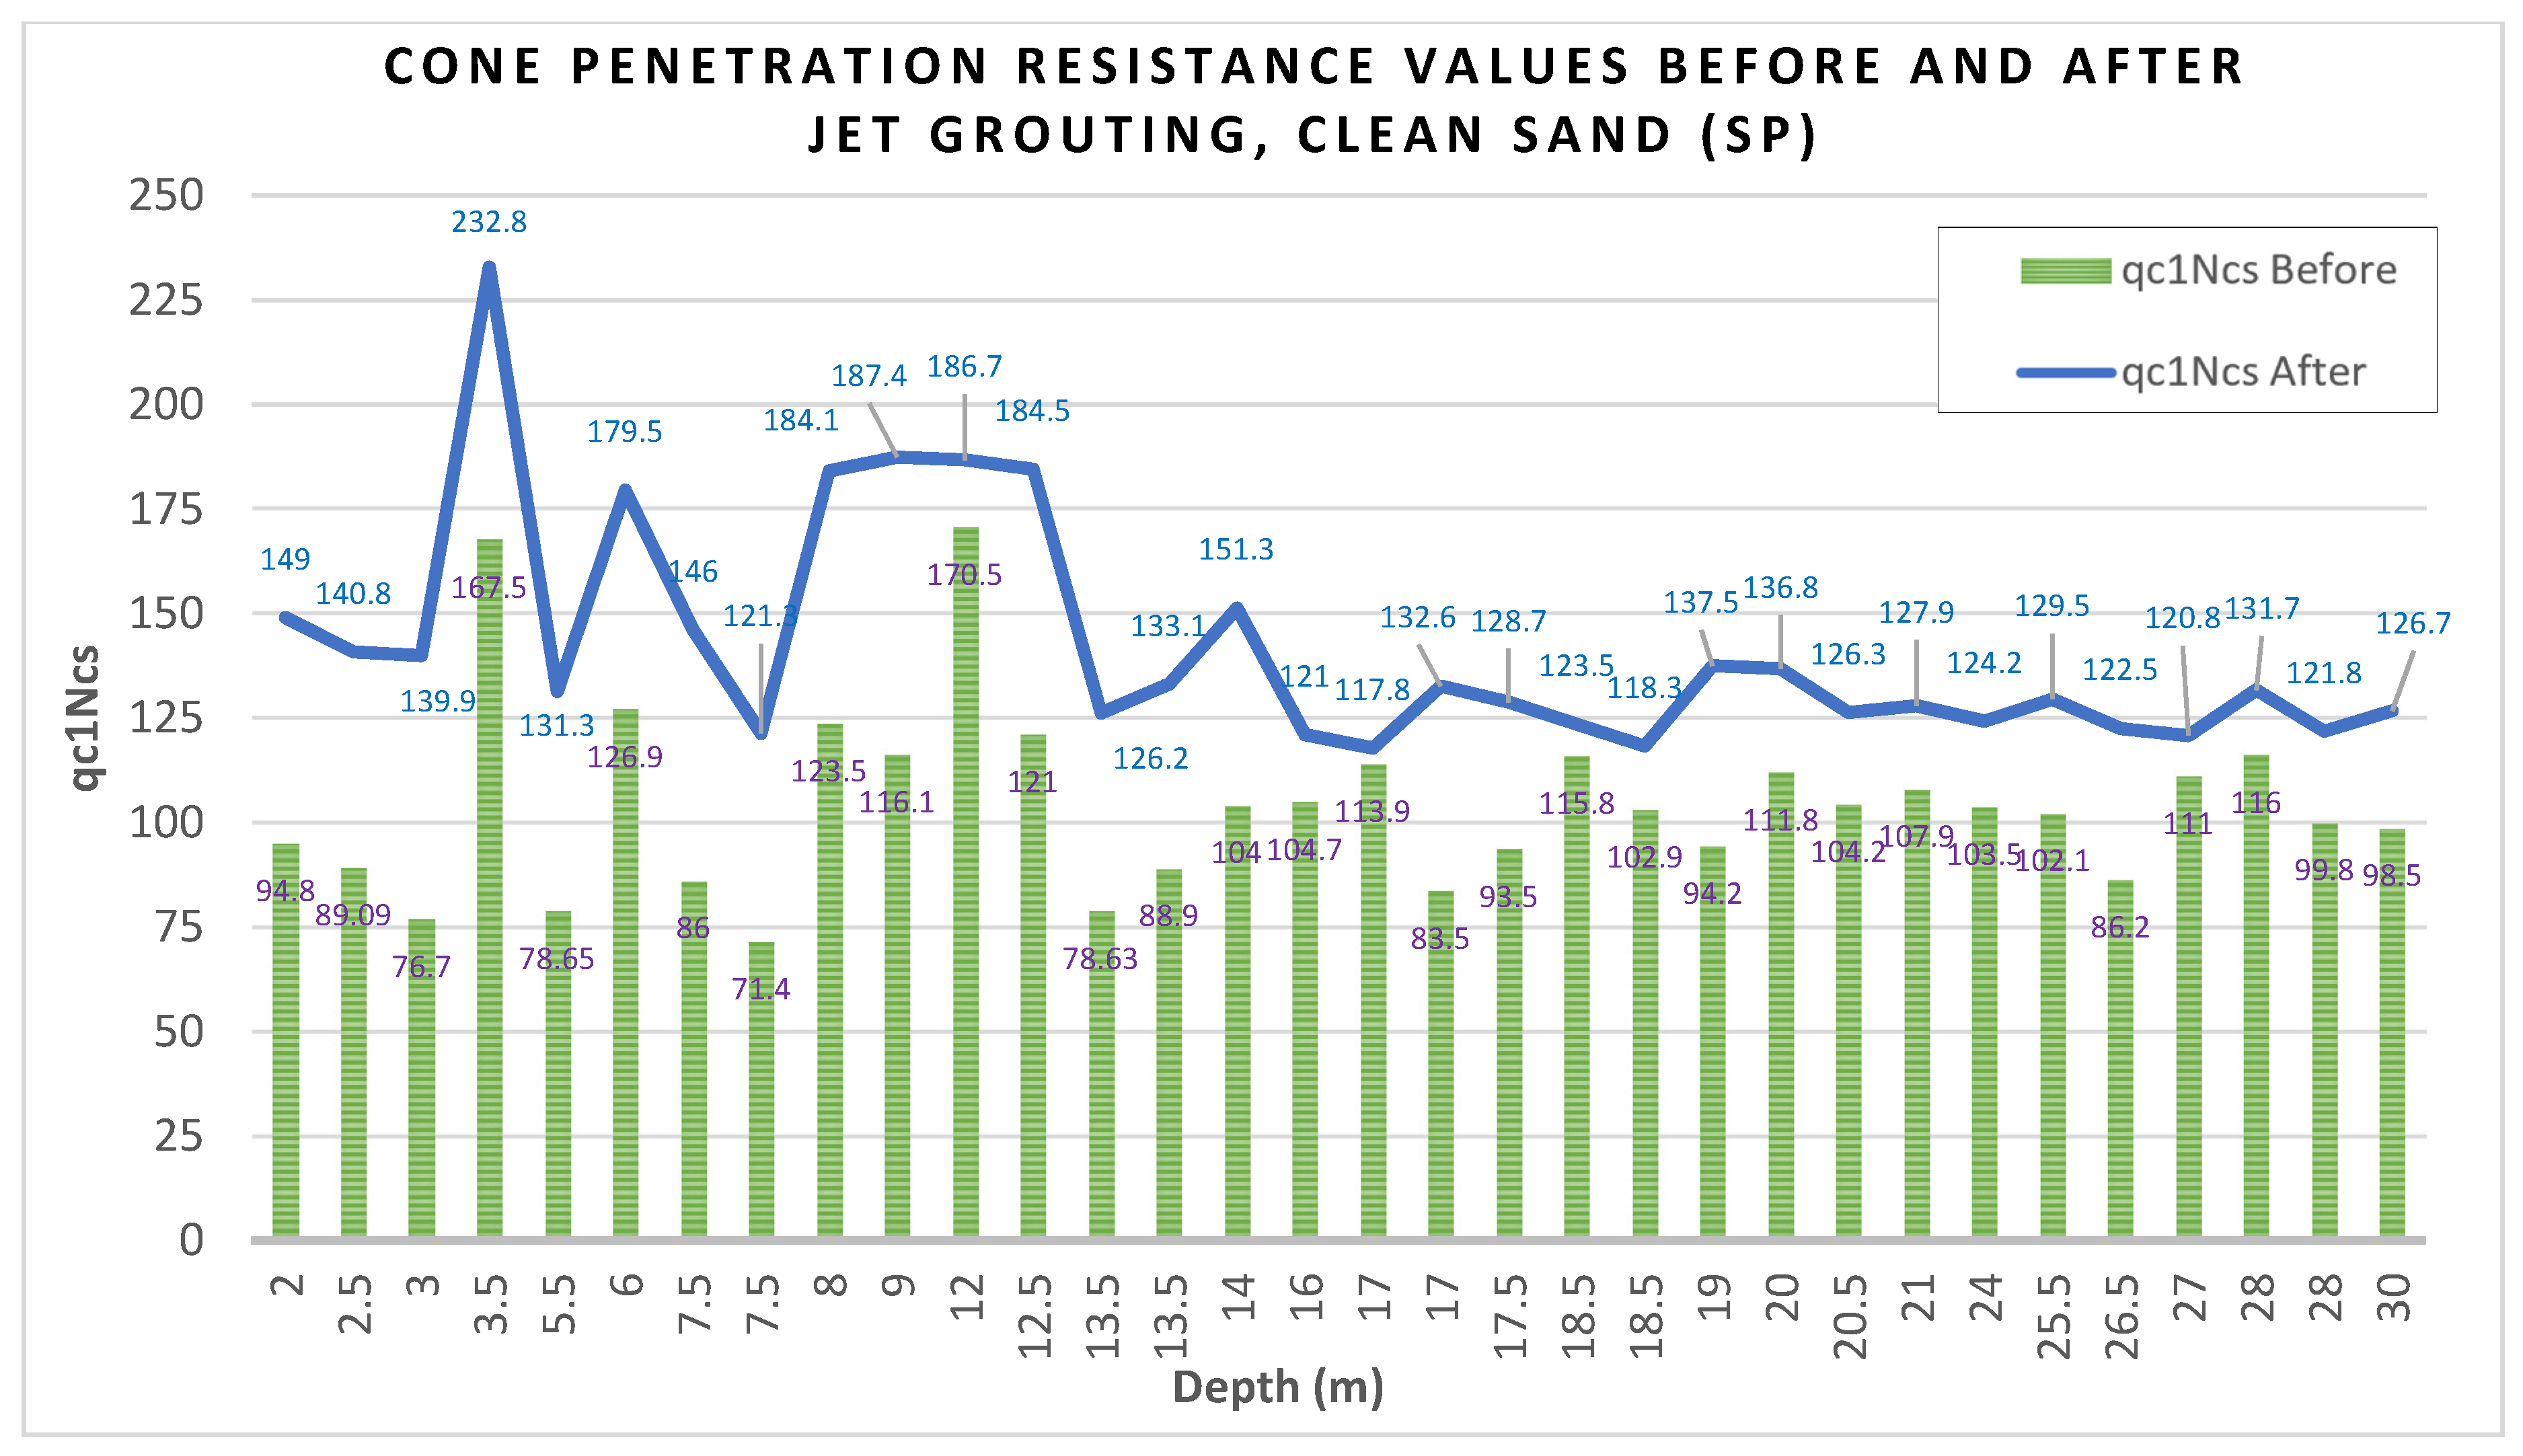
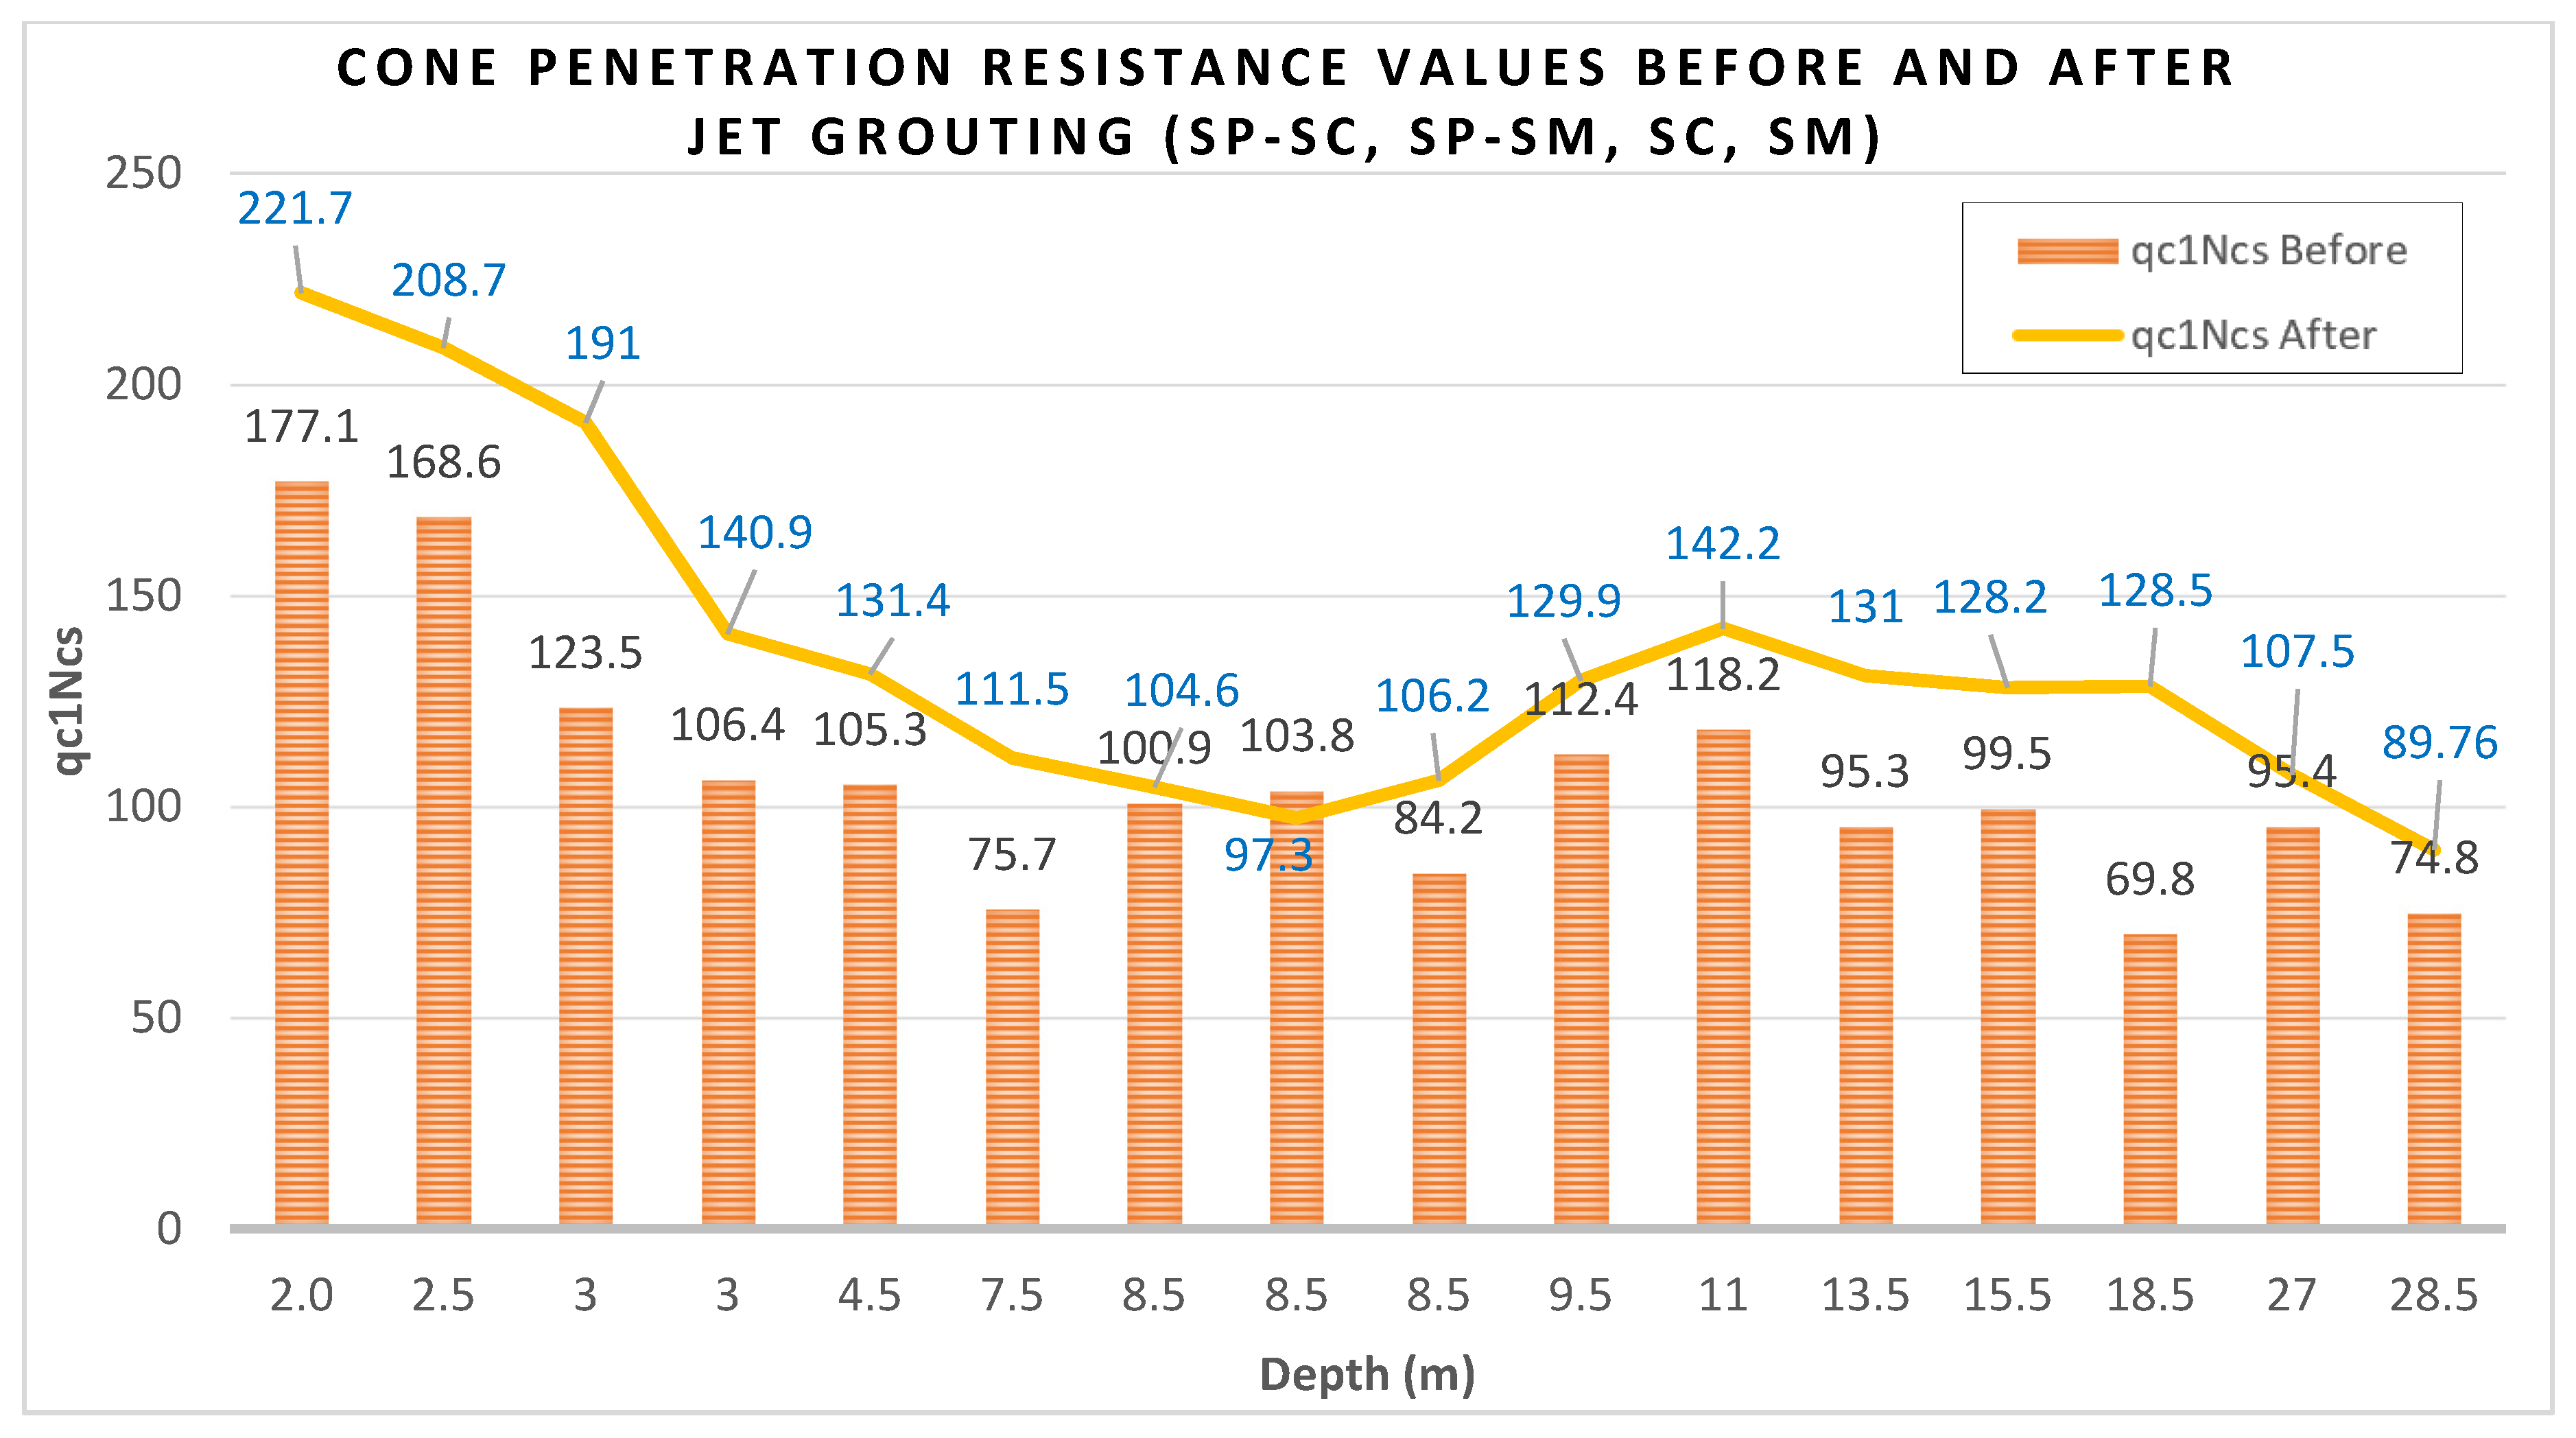
Table 1 presents the soil profile and liquefaction risk assessment using the Boulanger and Idriss 2014 method [31]. Following this method, a new recommended magnitude scaling factor (MSF) and an updated procedure for including the effect of fines contents (FC) is used in the calculating procedure. Adjustments by the rd coefficient for various depths of soil layers are included in the calculations. In Table 1, parameters such as , CRR, and FS indicate soil improvement against liquefaction after jet grouting using micropiles. Figure 3 illustrates the effect of jet grouting on the improvement of the parameter in clean sands. In this figure, the values of at different depths for five boreholes are presented for the soil profile containing only SP clean sand soil. Similar depth values are related to different borehole numbers, as specified in Table 1. The average rate of increase for the values in the clean sand was 38%. The highest increase rate of the was measured as 82% at a 3 m depth related to the borehole BH-I-5. Figure 4 displays measurements before and after grouting in soil layers including SP-SC, SP-SM, SC, and SM. The average improvement rate of the value in these soils was 28.5% and the highest rate of change was recorded as 84% for the clayey sand at depth of 18.5 m, BH-I-5. The higher improvement rate of in clean sand (SP), compared to the soil containing silt and clay, was because of the higher porosity of the SP soil.
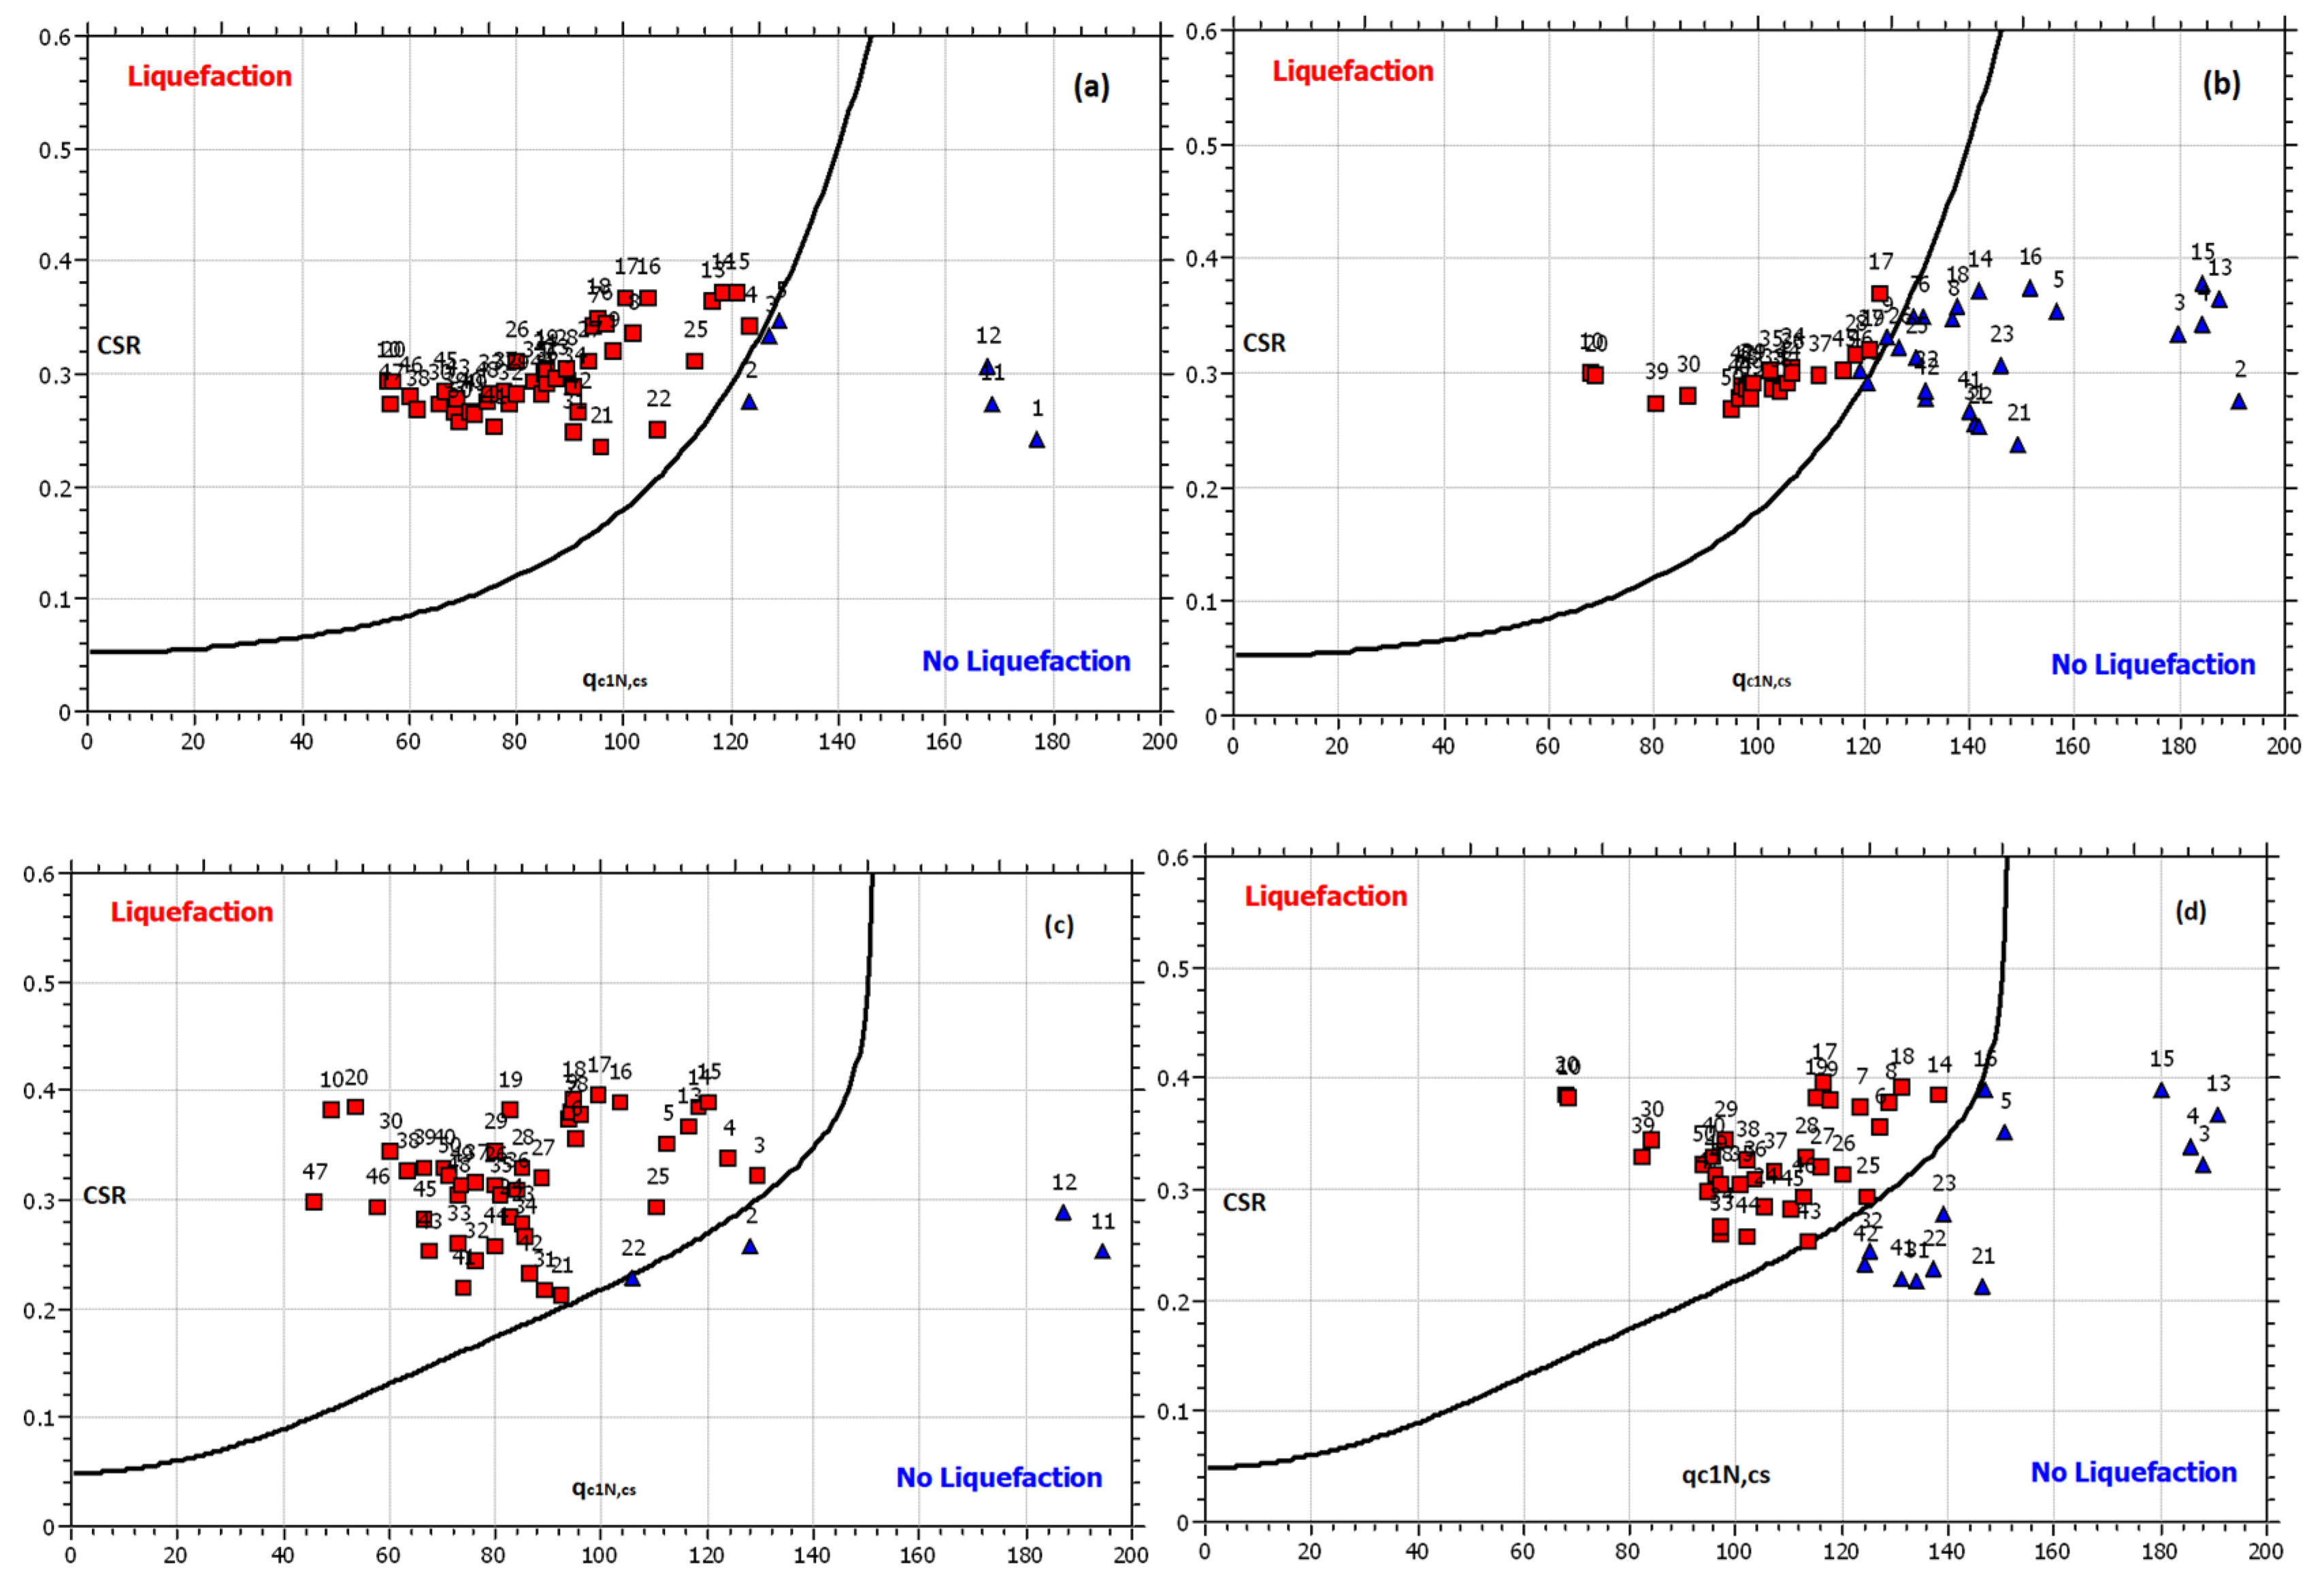
CPT-based liquefaction potential analysis for site I was performed following the recommendations of Juang 2006. The Juang method was developed based on a case history from the Chi-Chi earthquake in Taiwan. In the liquefaction assessment procedure of site I using the Juang method with Robertson’s criteria [48] was included. Robertson adjusted the effect of fines contents in the liquefaction assessment correlations based on the measured cone penetration resistance and sleeve friction values. The rd modifications following Liao and Whitman’s relationship [49] were included in the calculations. The MSF was calculated using NCEER-97 recommendations. Other parameters and assumptions remained the same, as used for the Idriss CPT-based liquefaction method. Figure 5 illustrates the effect of using jet-grouted micropiles on enhancing the resistance of the soil against liquefaction based on the Juang and Eurocode 8 methods. In these methods, the base curve for evaluation of liquefaction triggering is developed for and . This curve is used for the liquefaction triggering evaluation based on the CSR and values. Figure 5a shows the liquefaction analysis of the existing soil, before the jet grouting. Figure 5b illustrates the liquefaction condition of the soil improved by grouting. After the soil remediation using micropiles, the number of blue points in the “No Liquefaction” area was increased by 36%. This improvement against the liquefaction risk sheds light on the significance of soil stabilization using micropiles in clean sands.
In the third attempt, the CPT-based liquefaction assessment for site I was conducted in accordance with the Eurocode 8 specifications. Deposits of dense and medium dense sand in this site were categorized as type C subsoil in the analysis procedure. The fines contents’ corrections referring to NCEER-97 recommendations were used in the calculation. Other parameters such as GWL (before and during the earthquake), , , and MSF coefficients remained the same, as mentioned in the analysis procedure by the Boulanger and Idriss 2014 method [31]). The results of the liquefaction analysis prior to and after micropile installation are shown in Figure 5. The number of cases in the safe “No Liquefaction” region was increased from 4 cases (Figure 5c) to 13 cases (Figure 5d) after performing soil remediation by jet grouting.
2.3. SPT-Based Simplifeid Liquefaction Assessment (Site II)
At site II, SPT, as one of the popular tools in soil liquefaction assessment, was used. The first simplified liquefaction correlation was developed based on the SPT results [31]. Similar to the CPT-based simplified analysis, CRR and CSR quantities and Equation (1) were used for the liquefaction assessment in site II, which mainly contains clean sand (SP) soils. A factor of safety of 1 was considered in the calculations. Empirical base curves to assess the soil liquefaction potential were developed based on the SPT database of clean sands in the site II. The database includes the case histories of major earthquakes, with or without the liquefaction triggering. The database outcomes were adopted for the and moment magnitude to be presented as a single base curve. The effects of fines contents and overburden stress were considered in the liquefaction analysis. In this regard, the available data of fine-grained soils were categorized and compared to the equivalent corrected SPT blow count values for the clean sand. The finalized base curve for the SPT-based liquefaction triggering analysis is presented as versus .
Table 2 shows the soil profile and SPT-based liquefaction risk results using the Boulanger and Idriss 2014 method [31] before and after jet grouting by implementing micropiles. Revised MSF and FC quantities, based on the new SPT-based case histories by Boulanger [50], were used in the liquefaction triggering analysis. The effect of the different depth values of soil layers was adjusted in the calculations using the rd coefficient. Using the logging data of five boreholes (BH-II-1,5), the SPT values were measured in a single boring at the same location prior to and after the grouting. In Table 2, analyzing the as , CRR, and FS parameters before and after using jet-grouted micropiles indicates improvement of soil strength against liquefaction.
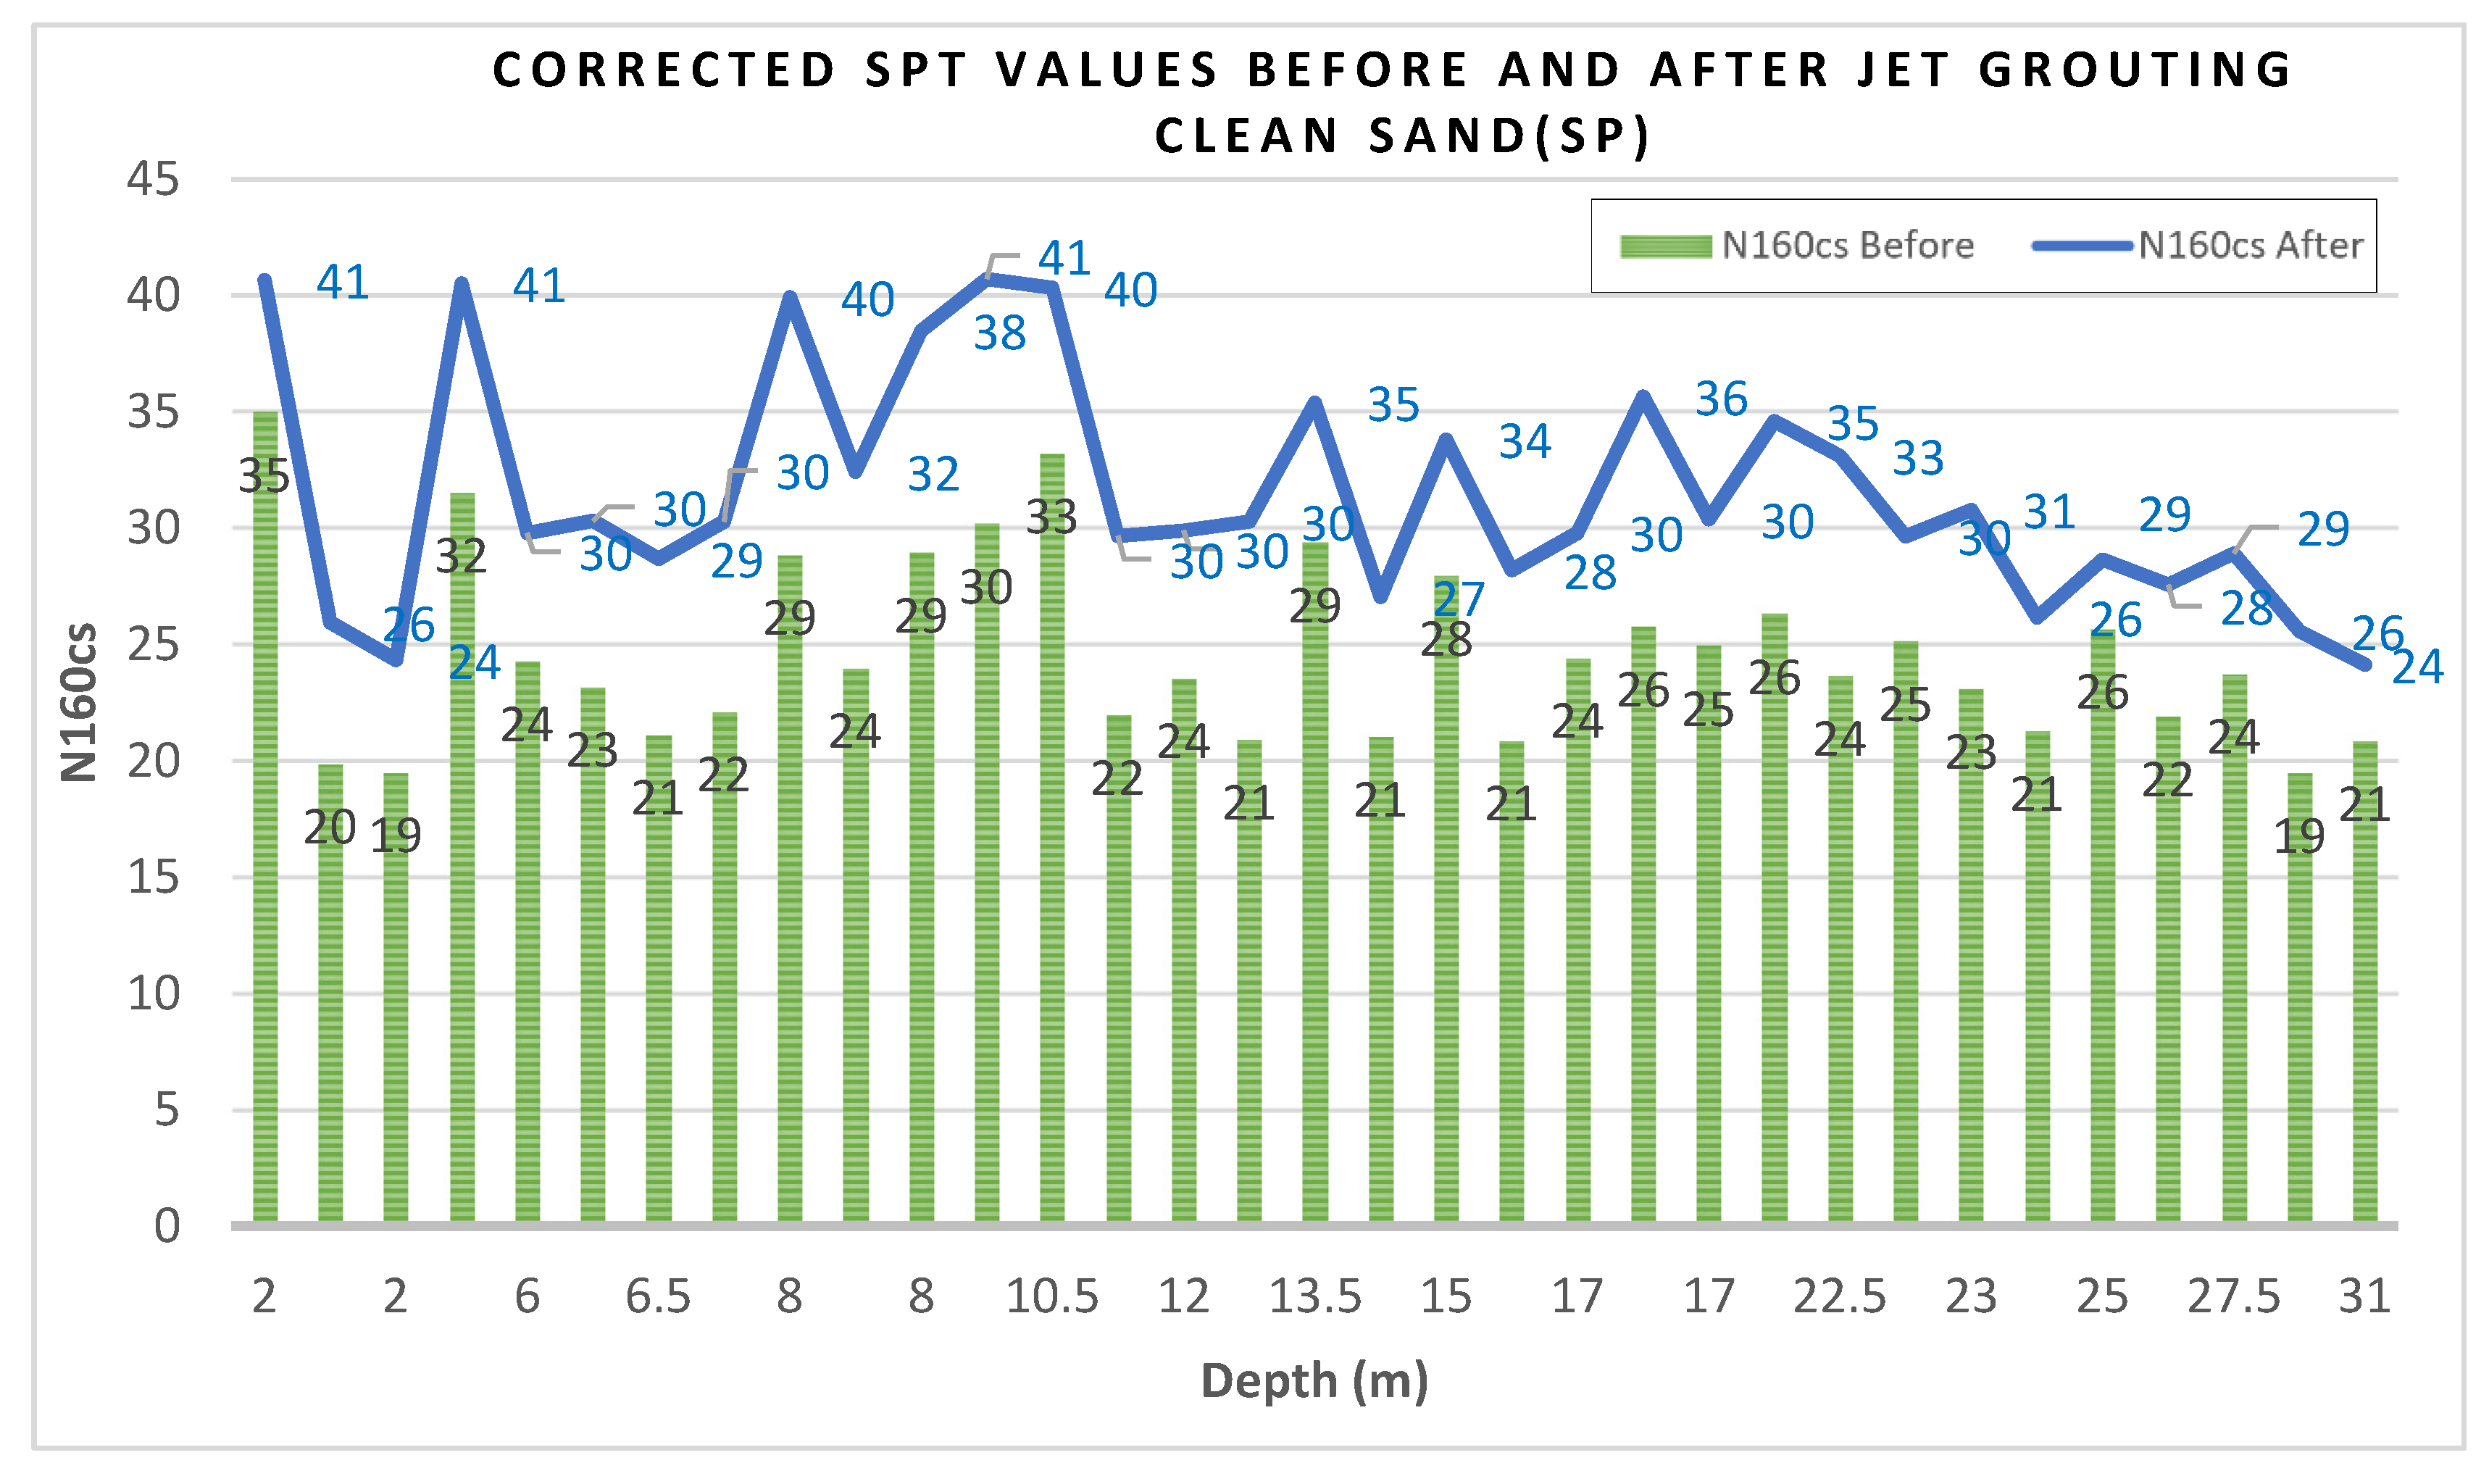
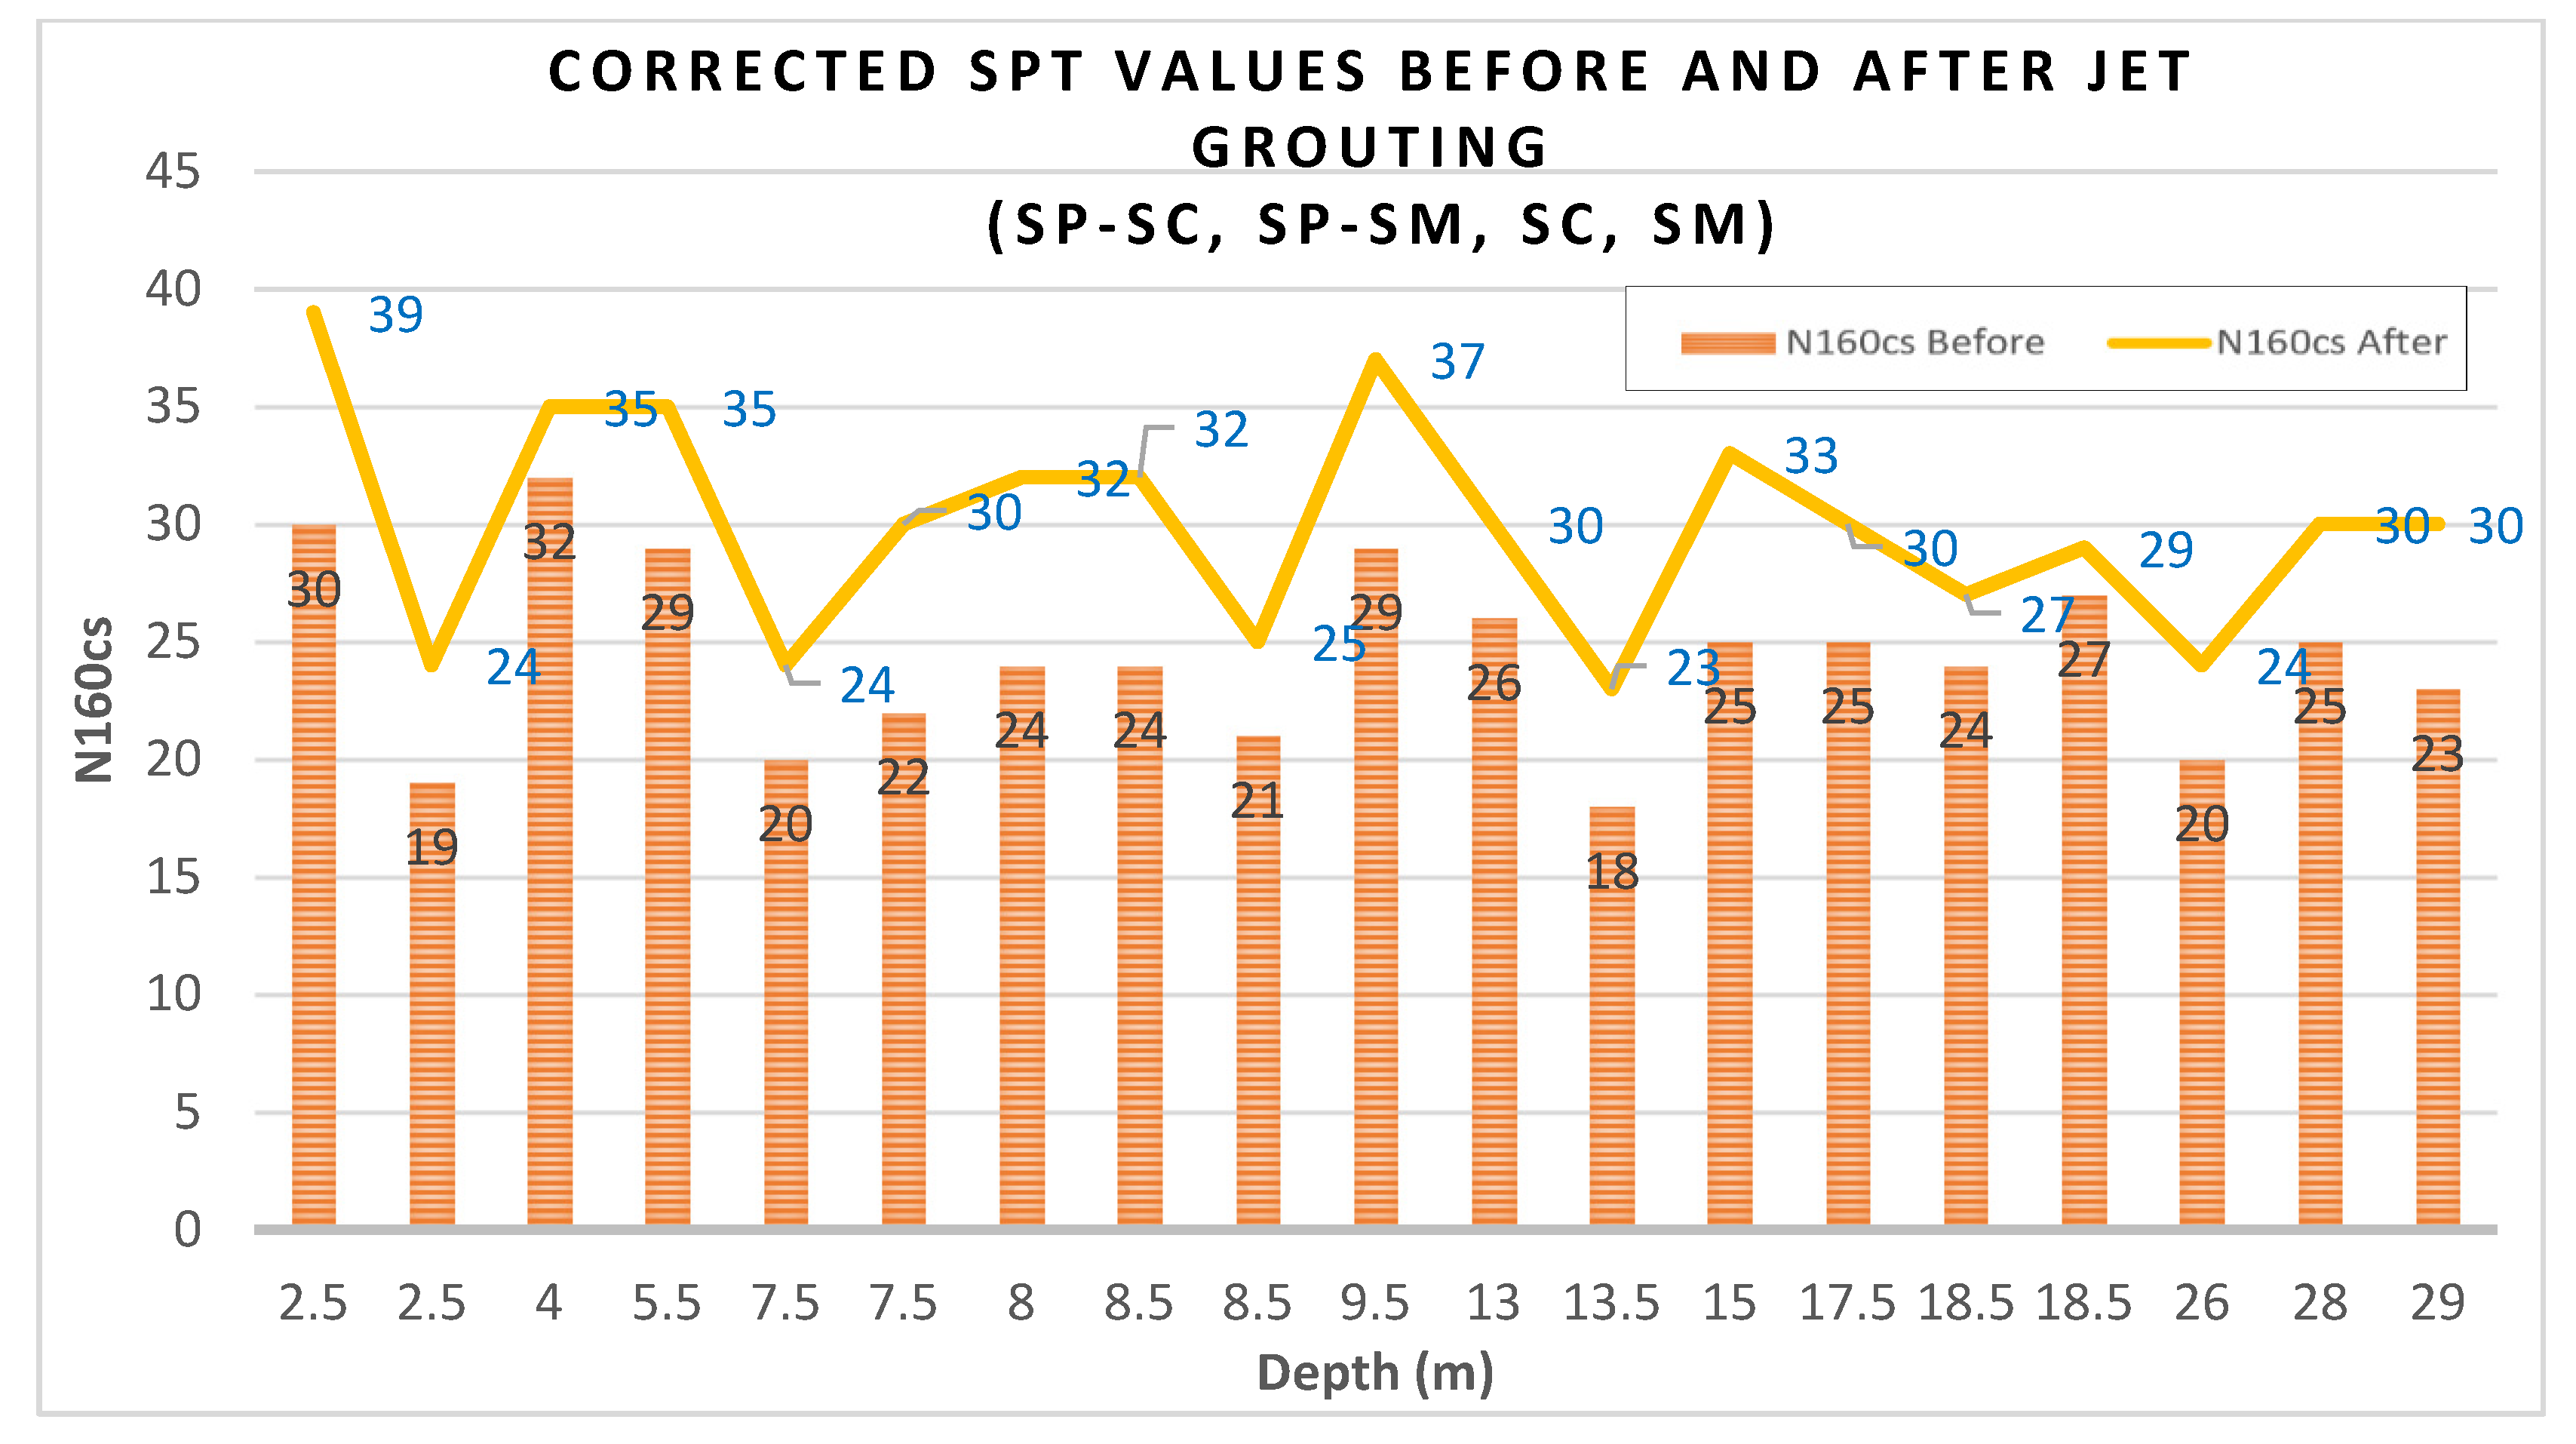
Figure 6 presents the effect of jet grouting on the improvement of the values in only SP clean sand layers. The values were measured at various depths based on the results from five drilled boreholes. The same depth values are related to different borehole numbers, as identified in the Table 2. The average rate of improvement for in the clean sand was 29%. The highest increase rate of the was reported as 45% at a 12 m depth belonging to the borehole BH-II-3. Figure 7 indicates the measurements before and after soil remediation by micropiles in SP-SC, SP-SM, SC, and SM soil layers. The value for these soils increased with an average rate of 23%, and the maximum rate of change was measured as 36% for the SC soil at a depth of 7.5 m, BH-II-5. The slightly higher improvement rate of in clean sand (SP), compared to the soil containing silt and clay, was due to the higher porosity of the SP soil.
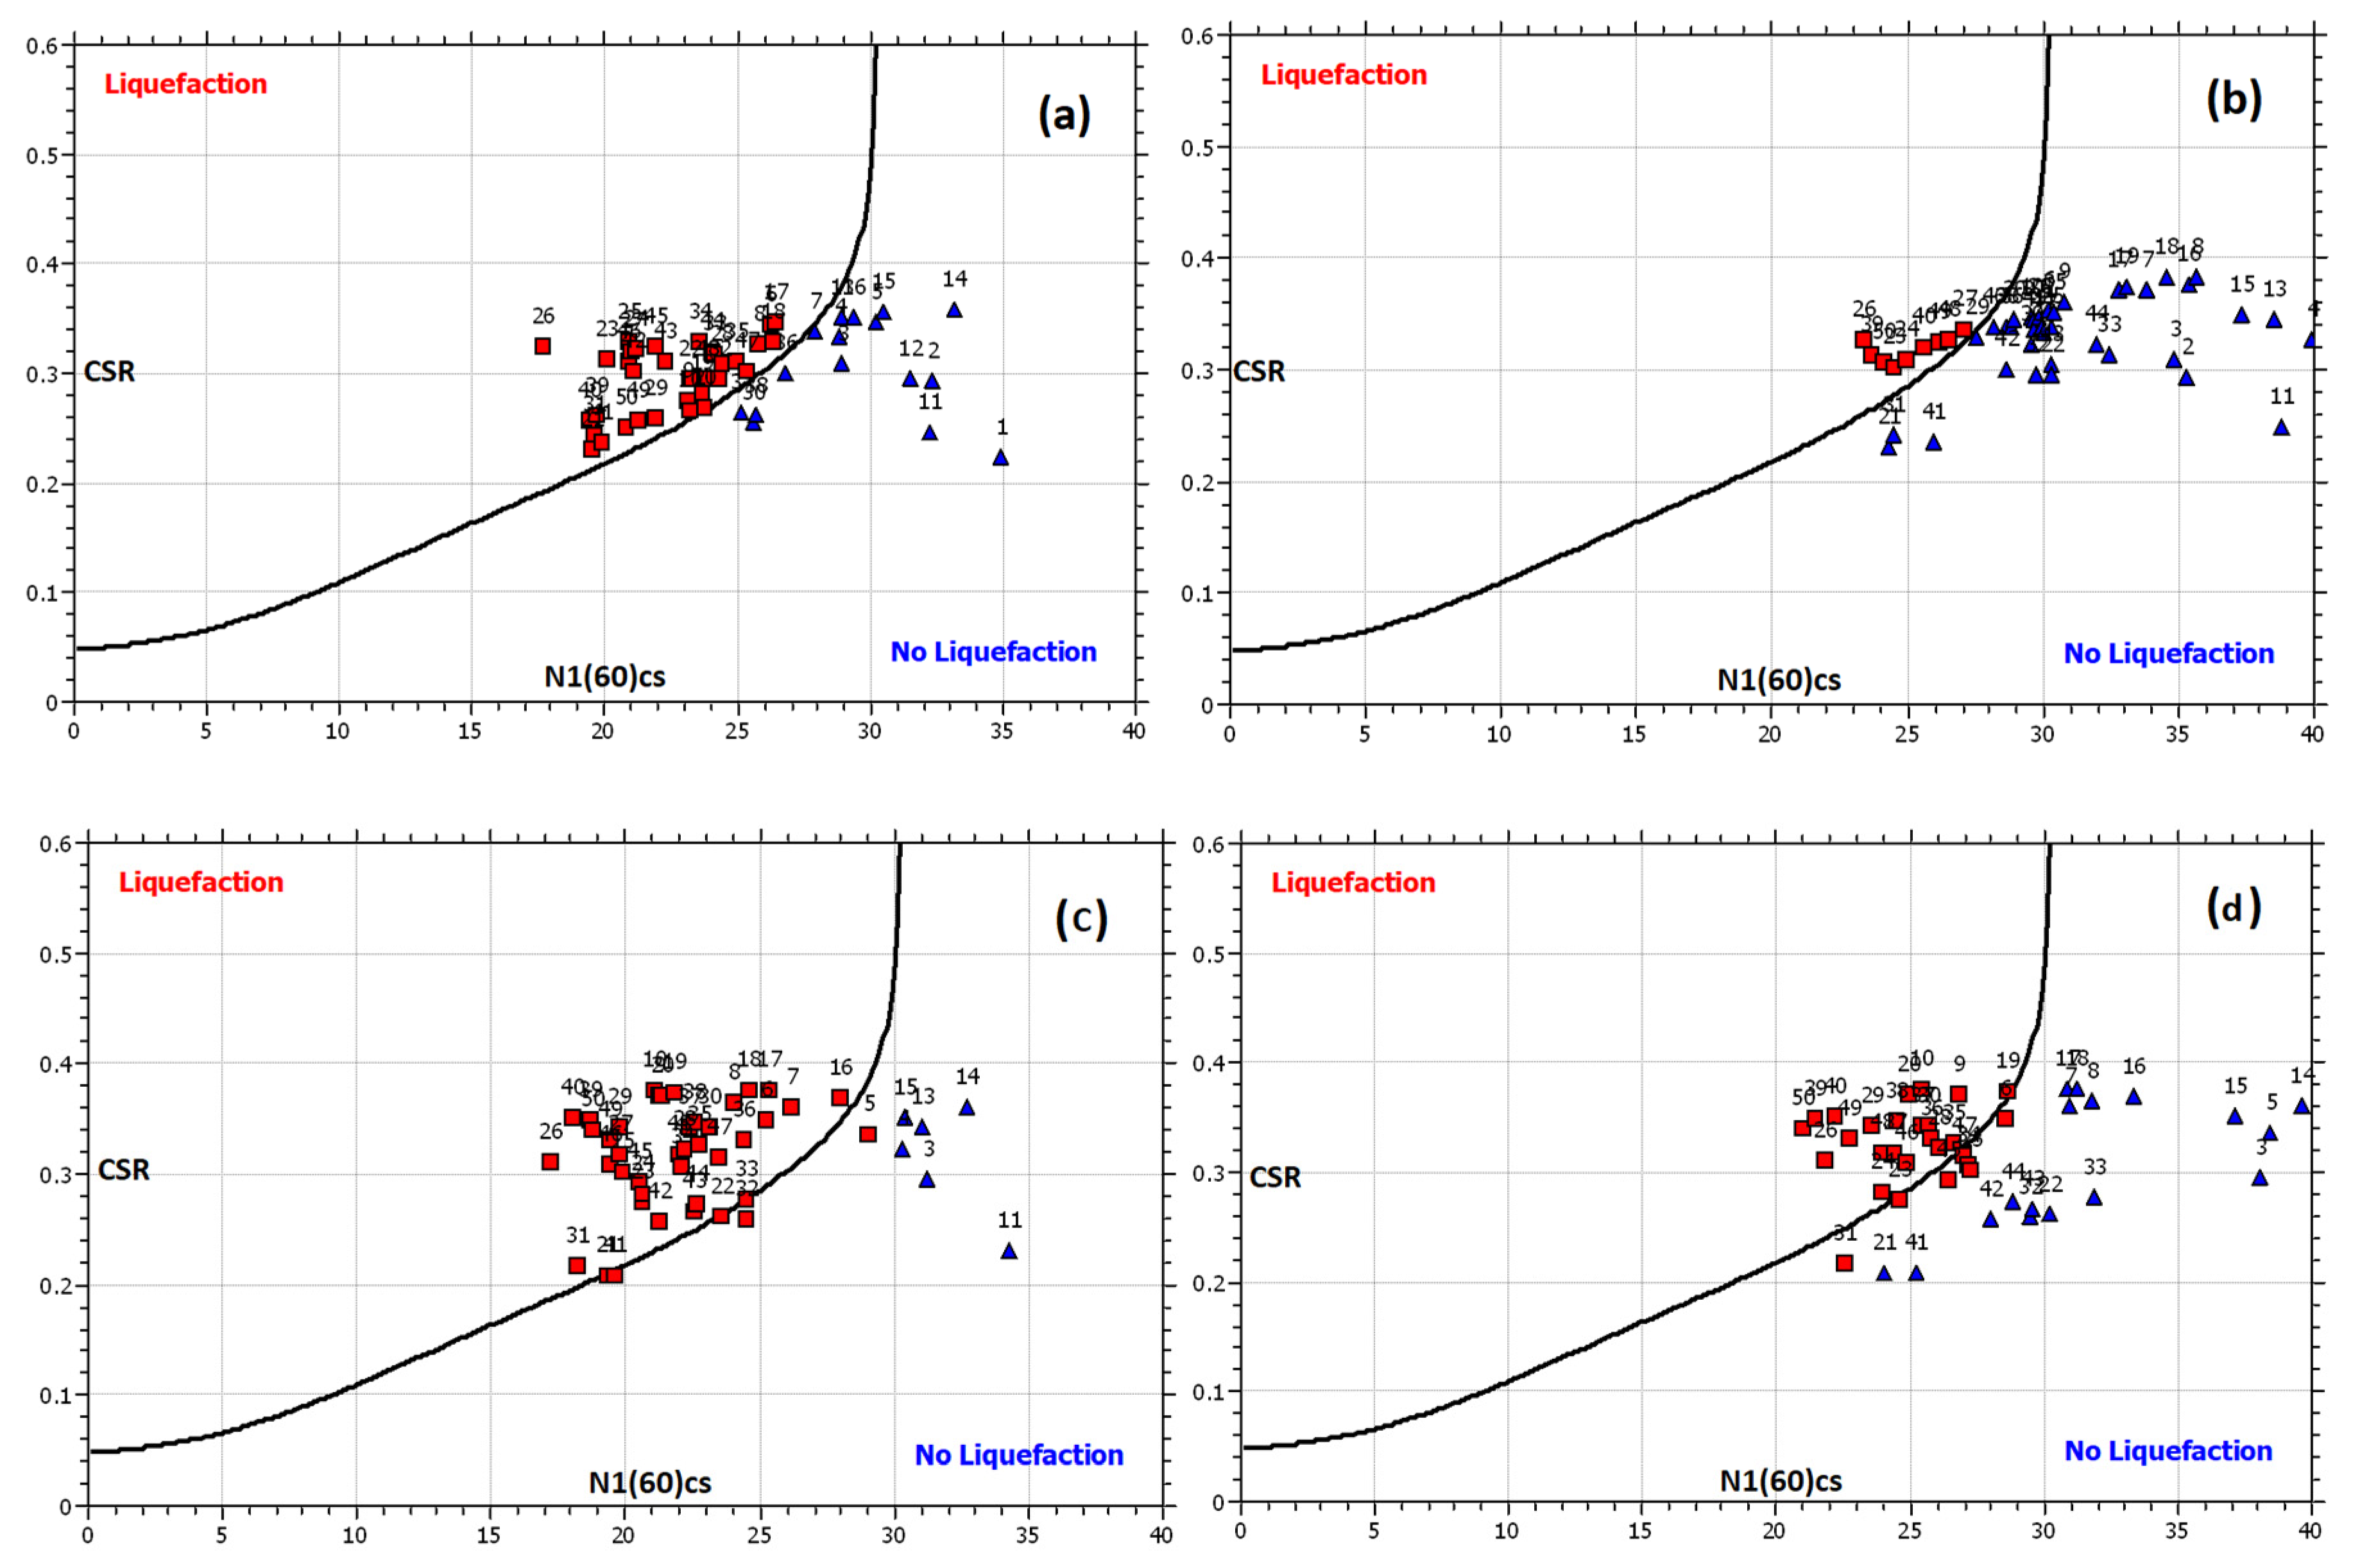
The SPT-based liquefaction assessment in site II was also carried out according to the NCEER-97 specifications. The calculation was performed by applying MSF and correction factors by NCEER and Liao and Whitman, respectively. Other parameters and assumptions are similar to the Boulanger and Idriss 2014 method. Figure 8 highlights the effect of using micropiles to reinforce soil against liquefaction following the NCEER and Eurocode 8 procedures. In these procedures, the base curve liquefaction assessment is adjusted for and . This curve predicts the liquefaction triggering using the CSR and quantities. Figure 8a reports the liquefaction assessment of the existing soil, before installing micropiles based on the NCEER methods. Figure 8b shows the liquefaction potential of the improved soil layers after grouting using the NCEER. After the soil remediation using micropiles, the cases without the potential of liquefaction triggering were increased from 32% to 82%.
In the third liquefaction analysis, the SPT-based liquefaction assessment for site I was conducted as specified by the Eurocode 8. The existing sandy soil in this site was categorized as the type C subsoil in the liquefaction analysis. The fines contents’ corrections were performed referring to the NCEER. Parameters such as GWL (before and during the seismic movement), , while and MSF factors remain constant, similar to the performed analysis based on Boulanger and Idriss 2014. The results of the liquefaction analysis before and after micropile implementation based on the Eurocode 8 approach are presented in Figure 8c,d. The number of cases in the safe “No Liquefaction” region increased by 22% after soil improvement by grouting.
3. Discussion and Results
In this section, the effect of jet grouting using micropiles to enhance soil properties, based on the results of CPT and SPT tools, is analyzed. Linear equations are presented for simplicity purposes, along with practical considerations by geotechnical engineers to assess the effect of soil remediation to enhance soil properties. Furthermore, improvement of the factor of safety against soil liquefaction, before and after soil remediation, is investigated following three methods, and specifications for each of the CPT- and SPT-based analyses are discussed.
3.1. Correlations of CPT and SPT Values Before and After Jet Grouting
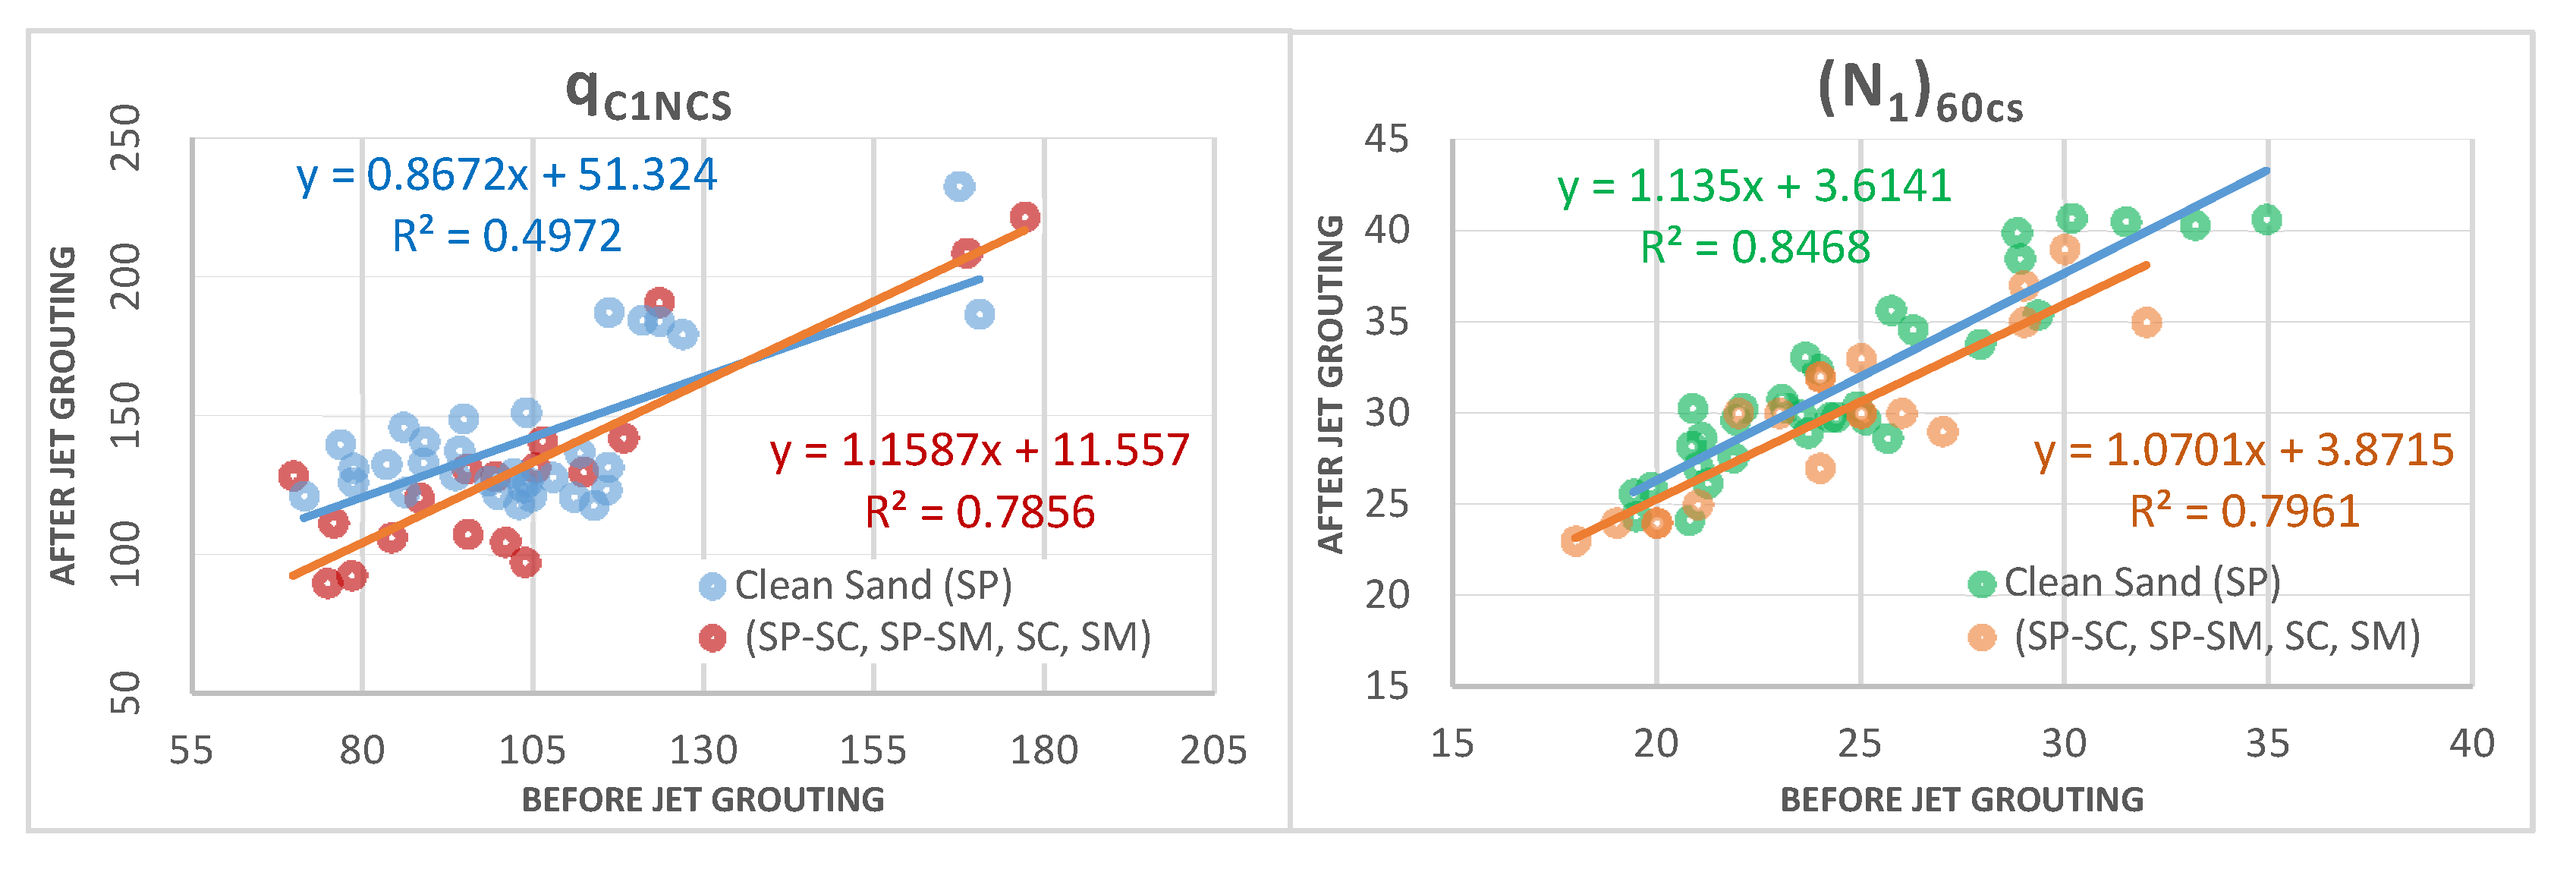
Figure 9 highlights correlations of and indices before and after jet grouting for SP clean sands and soil layers containing SP-SC, SP-SM, SC, and SM. For each correlation process, the soil is categorized if it includes SP layers. The results are based on a total of 10 boreholes, five for each of the CPT and SPT tests. The combined results are presented in a single analysis for each test and based on the soil profile. The R-squared coefficient of determination was used to analyze the relationships between the improved , and among the enhanced indices. In general, a correlation coefficient closer to 1 shows a stronger relationship between the measured values. Previous studies preferred as a more consistent index over the sleeve friction index to analyze the outcome of the CPT [51].
The left graph in Figure 9 aims to show the effect of jet grouting to improve the index in the CPT. This graph includes a total of 50 data pairs, before and after jet grouting: 32 pairs as coarse-grained clean sand SP, and the remaining 18 pairs as fine-grained soils. The index before the soil remediation in the SP layers ranged between 71.4 and 170.5. The lower and upper values of the after SP soil stabilization were measured as 117.8 and 232.8, respectively. The clean sand soil had relatively higher R-squared values compared to the fine-grained soils. The effects of jet grouting by micropiles to increase the values were noteworthy for both types of soils. The figure indicates a moderate linear relationship between values before and after jet grouting for the clean sand with . There was a strong linear correlation between values for the fine-grained soil, , based on the CPT.
The correlation between values before and after jet grouting is presented in the right graph in Figure 9. Thirty-one pairs of data belong to the SP soil, and the other 19 data pairs are related to the fine-grained soil in the project. The values for the SP soil before the jet grouting measured between 19 and 35. The improved values ranged from 24 to 41. The R-squared values showed comparable and strong correlations between for both coarse-grained and fine-grained soils. The indicated a stronger correlation between the values in the SP compared to the soil containing clay and silt with .
The soil profiles at both sites I and II mainly contained clean sand SP layers, and both CPT and SPT results showed positive linear relationships between and among indices before and after the jet grouting method using micropiles. Such an improvement in soil properties emphasizes the effectiveness of this method in soil including clean sands with relatively thin layers of fine-grained soil.
3.2. Comparative Analyses of Factor of Safety Against Liquefaction in Clean Sands
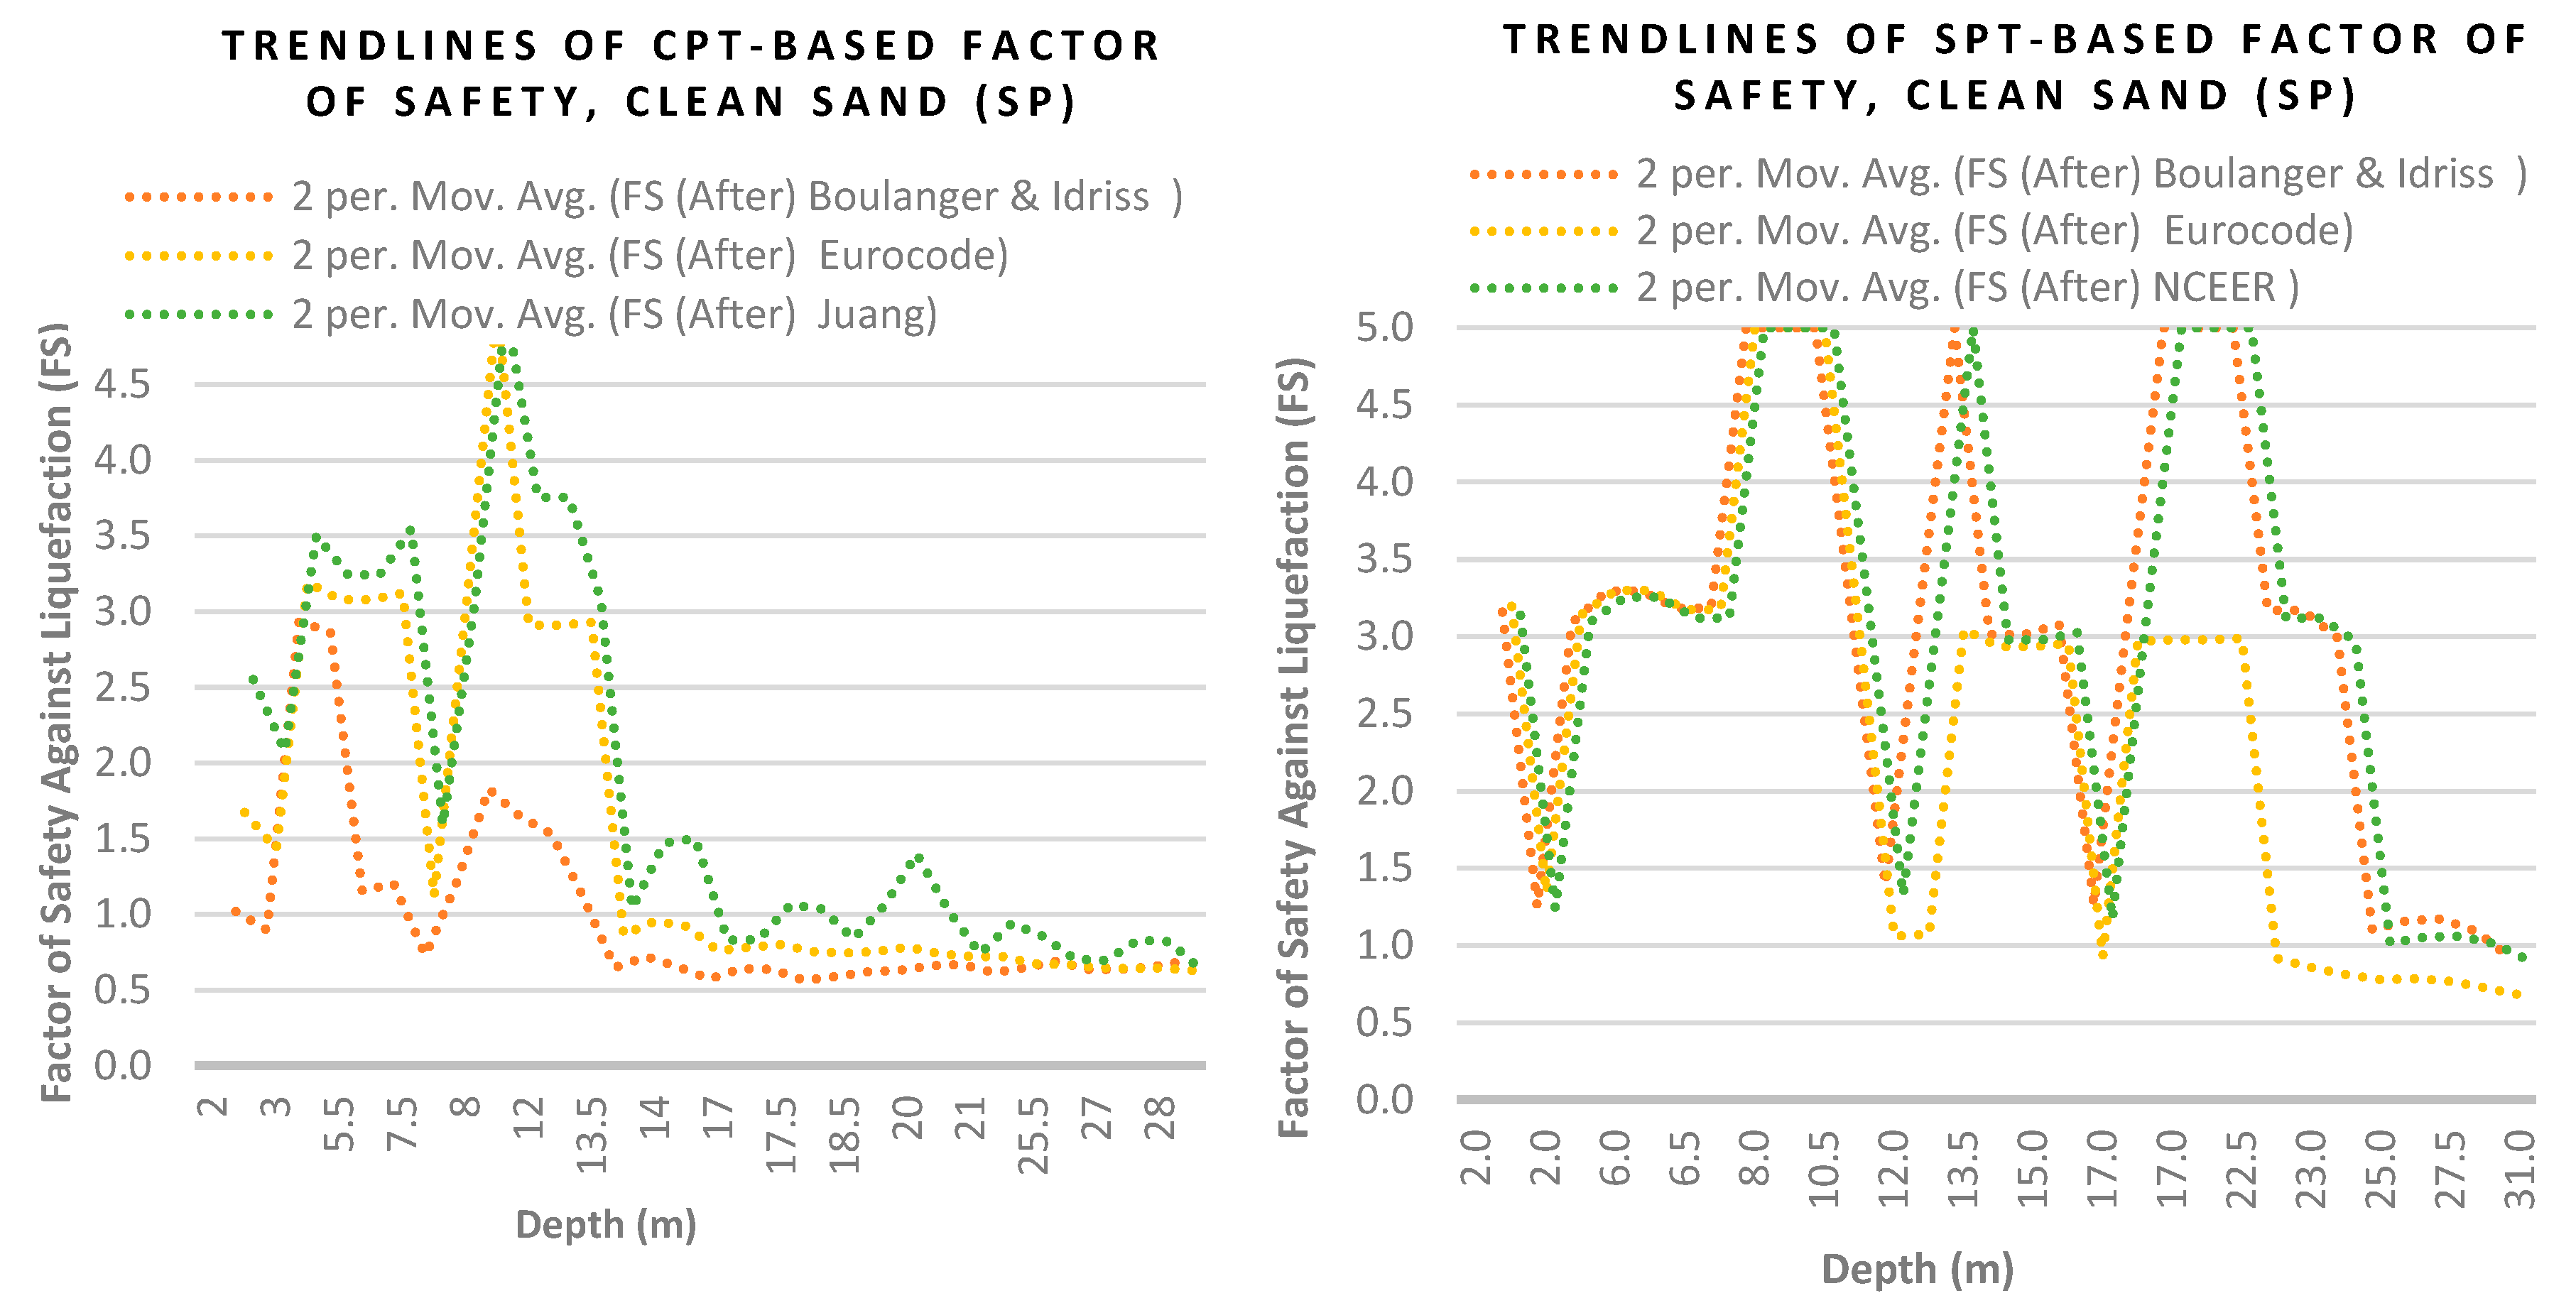
In this section, improvements of the factor of safety against liquefaction in soil layers containing only SP clean sands is analyzed following CPT-based and SPT-based approaches. Figure 10 highlights the results of the factor of safety before and after soil remediation using micropiles at various depths in the SP soil based on the CPT method as a stacked column chart. Similar depth values belong to different borehole numbers in site I. The Juang method predicts the most improvement rate for the factor of safety, whereas the Boulanger and Idriss method reports the most conservative factor of safety assessment. These two methods, along with the Eurocode specifications, showed similar trends in enhancing the factor of safety based on the CPT results after jet grouting, as is illustrated by the dashed lines in the Figure 11 (left). A maximum factor of safety value of 5 after jet grouting was recorded for SP soil layers at depths of 6, 8, 9, and 12.5 m according to the Juang and Eurocode criteria, and for a 3.5 m depth based on the Boulanger and Idriss approach. The average percentage change of the factor of safety in clean sand following the Boulanger and Idriss approach was 77%, after jet grouting. This value increased to 110 and 178% in accordance with the Eurocode and Juang methods, respectively.
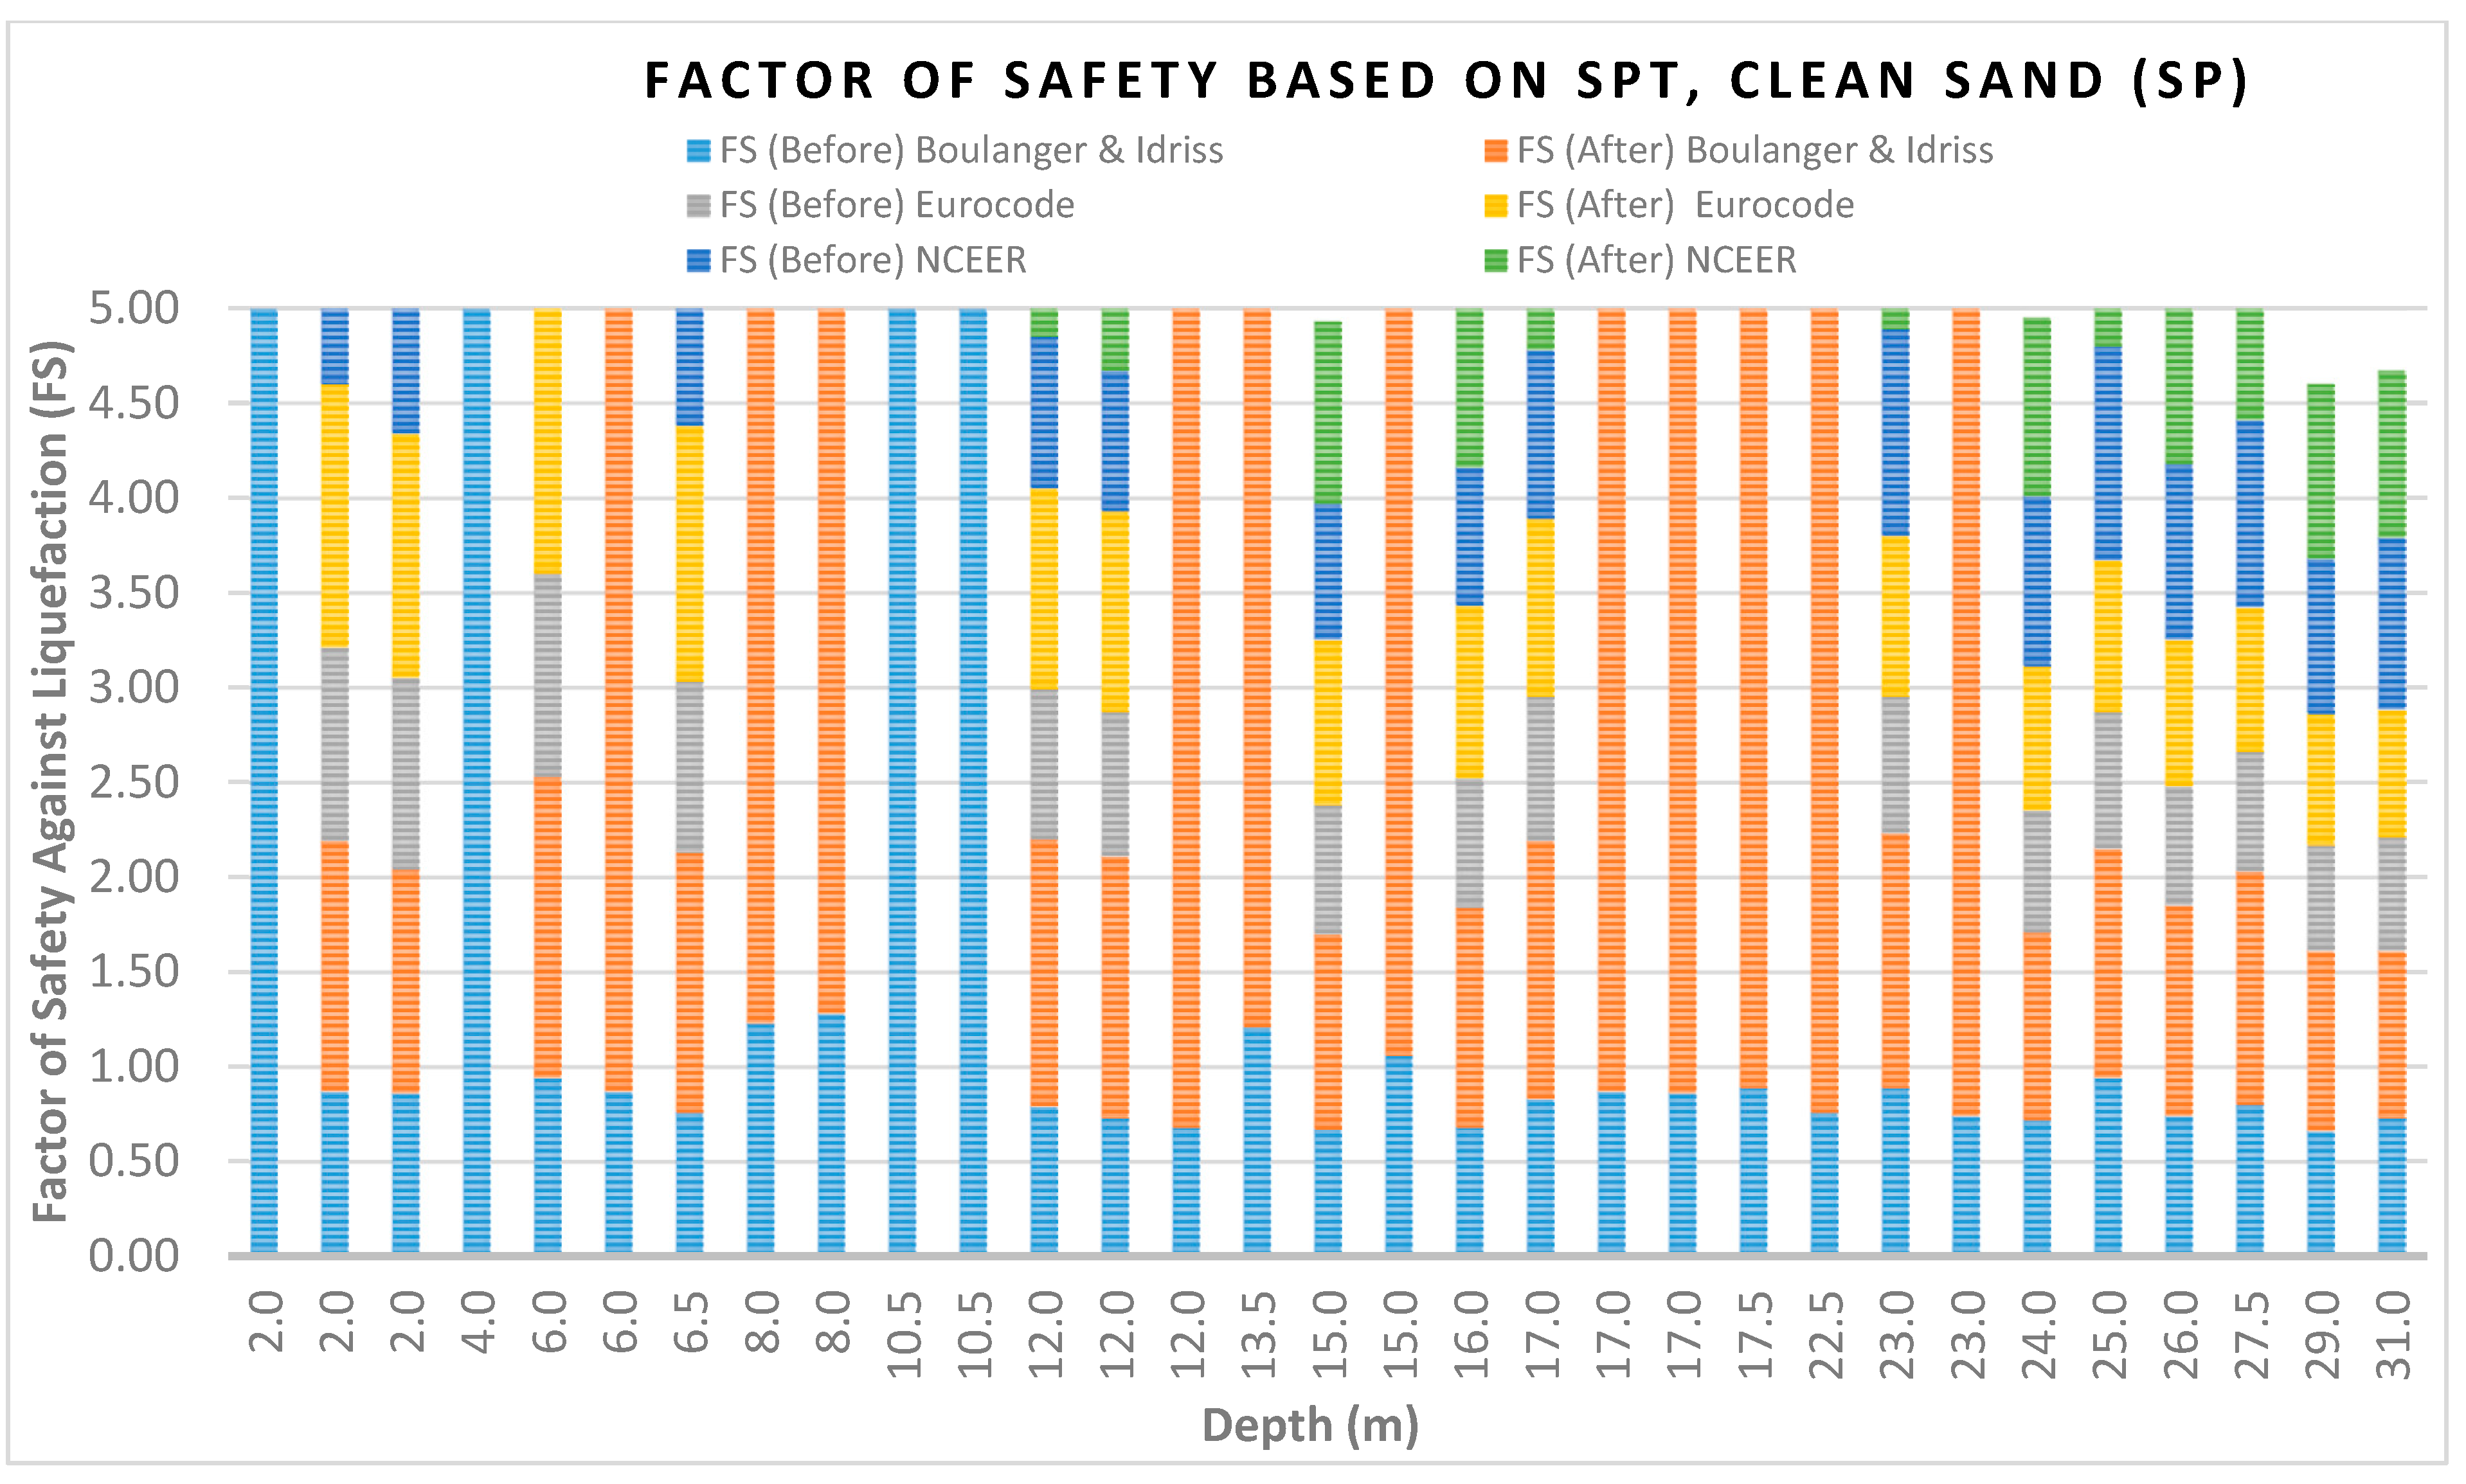
Figure 12 reports the factor of safety values based on SPT results prior to and after jet grouting by micropiles at different depths of SP layers in site II. The same depth values in the chart are related to different borehole numbers in site II. Three SPT-based approaches to assess the potential of liquefaction were used in the analysis procedure. Boulanger and Idriss, Eurocode, and NCEER methods showed equal factors of safety of 5 at depths of 6 m (BH-II-3), 15 m, and 17 m (BH-II-1), along with 13.5 and 17.5 m (BH-II-2), after soil remediation. The dramatic increase of the factor of safety to 5 was also reported at other depths. However, the results may vary based on the methods used, as shown in the Figure 12. The trend lines of average values for the factor of safety using the three SPT-based methods are shown separately in Figure 11 (right). In this Figure, all three methods are comparable and indicate an increase of the factor of safety after soil remediation. The average percentage changes based on the Boulanger and Idriss and NCEER methods are 187 and 169%, respectively. Eurocode conservatively predicts 110% of improvement after the jet grouting.
3.3. Results
The degree of effectiveness of jet grouting using micropiles to mitigate liquefaction risk is a significant factor to be studied. This degree measures the efficacy of soil improvement by micropiles, as well as its practical merits. This section aimed to gauge the effectiveness of the soil improvement by micropiles based on the changes in the factor of safety. Comparisons of three CPT-based methods, along with three SPT-based approaches, for the prediction of soil strength after jet grouting against liquefaction risk, are presented herein. Table 3 demonstrates the effectiveness of soil improvement following CPT-based Boulanger and Idriss, Eurocode, and Juang methods. The effectiveness is evaluated based on four criteria from the smallest to the greatest improvement of the factor of safety. Criterion C-1 is defined as . In addition, C-2, and C-3 criteria indicate and , respectively. The is categorized as the C-4 criterion, as the most effective degree of soil improvement. According to Table 3, the CPT-based Juang method reports the most stringent changes of the factor of safety in SP soil (34.4%), as shown in the C-4 criterion. It includes 11 cases out of 32 evaluated SP layers in five boreholes of site I. The C-1 criterion for clean sand using Boulanger and Idriss and Eurocode methods are comparable, but show the least improvement of the SP soil, which, respectively, belongs to 50 and 53.1% of the total SP layers. The C-2 criterion highlights the most comparable FS improvements in the SP soil according to the three CPT-based methods. Only 19% of the soil layers in site I is categorized as fine-grained soil; however, the CPT-based FS analysis results are presented. In this soil, the C-1 criterion had the highest percentages of cases compared to other criteria, which were, respectively, measured as (66.7, 83.3 and 38.9) according to the three methods. Inclusion of the highest case numbers in the C-1 criterion, as the lowest range of improvement for the fine-grained soil, is due to its low porosity characteristic compared to the SP soil.
Table 4 illustrates the effectiveness of the soil remediation by micropiles following the SPT-based Boulanger and Idriss, Eurocode, and NCEER approaches. The same C-1 to C-4 criteria was used to measure the effectiveness based on the range of FS values after micropile installation and jet grouting. The most considerable improvement of FS for the SP soil (35.5%) was recorded in the C-4 criterion following both the Boulanger and Idriss and NCEER methods. It is shown that the FS improved dramatically from the C-2 to C-4, as there was no recorded case in the C-3 criteria, based on all three SPT-based methods or in both coarse-grained and fine-grained soil layers of site 2. Almost 24% of the soil layers in site II were fine-grained soil. Similar to the CPT-based results, the highest number of the fine-grained soil cases fit into the C-1 criterion.
4. Concluding Remarks
The effect of jet grouting using micropiles to mitigate the risk of liquefaction on soil mainly containing clean sand was investigated. The resulting factor of safety values based on CPT and SPT simplified liquefaction analyses showed soil improvement against liquefaction after soil remediation.
In addition, the R-squared values showed a comparable correlation between the values in the coarse-grained soil () and the fine-grained soil layers (). The correlations between indices in fine-grained soil were stronger than the among the clean sands . These R-squared values based on the SPT and CPT methods highlight the considerable effect of using jet-grouted micropiles on improvement of the existing soils.
According to three CPT-based liquefaction analyses, the Juang method predicts the most effective soil improvement by micropiles in that the factor of safety in 34.4% of clean sand layers was improved considerably (). Boulanger and Idriss and Eurocode methods showed comparable and more conservative evaluations with 12.5% improvement in this range of factor of safety. Results of the SPT-based analyses showed the most stringent improvement of the factor of safety after jet grouting (), in 35.5% of the SP soil, following both Boulanger and Idriss and NCEER approaches.
The average trend lines of the factor of safety are quite comparable for all three SPT-based liquefaction assessment methods. The highest improvement range against the liquefaction (), which was achieved in various depths of clean sand layers, highlights the effectiveness of jet grouting by micropiles based on both CPT-based and SPT-based approaches. The trend lines show consistent values of factor of safety in SPT analysis compared to abrupt changes of these values in the CPT-based approach. Such a consistency emphasizes more reliability of SPT method compared to the CPT procedure in the liquefaction risk analyses.
Robust and comprehensive analyses using the three CPT-based methods, along with the three SPT-based approaches, show improvement of factor of safety and confirm the effectiveness of jet grouting by micropiles on enhancing soil properties and reducing the risk of the hazardous liquefaction phenomenon.
Future studies using additional CPT and SPT databases in SP soil are recommended to further assess the outcomes of this research. In addition, the effect of jet grouting by battered micropiles to mitigate the potential of liquefaction can be investigated. Different geometric configurations of micropile installations, as well as the use of new procedures and enhanced material in jet grouting, are other research topics to reduce liquefaction risks.
Author Contributions
Conceptualization, V.F.; data curation, V.F.; methodology, V.F.; formal analysis, V.F. and M.K.; writing—original draft preparation, V.F. and M.K.; writing—review and editing, V.F., M.K. and M.G.; supervision, M.K. All authors have read and agreed to the published version of the manuscript.
Funding
The APC was funded by Ministry of Forests, Lands, Natural Resource Operations & Rural Development (FLNRORD).
Conflicts of Interest
The authors declare no conflict of interest.
References
- Potter, S.H.; Becker, J.S.; Johnston, D.M.; Rossiter, K.P. An overview of the impacts of the 2010–2011 Canterbury earthquakes. Int. J. Disaster Risk Reduct. 2015, 14, 6–14. [Google Scholar] [CrossRef] [Green Version]
- Morgenroth, J.; Almond, P.; Scharenbroch, B.C.; Wilson, T.M.; Sharp-Heward, S. Soil profile inversion in earthquake-induced liquefaction-affected soils and the potential effects on urban trees. Geoderma 2014, 213, 155–162. [Google Scholar] [CrossRef]
- Chiaro, G.; Koseki, J.; Kiyota, T. An Investigation on the Liquefaction-Induced Sloped Ground Failure During the 1964 Niigata Earthquake. In Geotechnical Hazards from Large Earthquakes and Heavy Rainfalls; Springer: Tokyo, Japan, 2017; pp. 133–143. [Google Scholar]
- Sassa, S.; Takagawa, T. Liquefied gravity flow-induced tsunami: First evidence and comparison from the 2018 Indonesia Sulawesi earthquake and tsunami disasters. Landslides 2019, 16, 195–200. [Google Scholar] [CrossRef] [Green Version]
- Sawicki, A.; Mierczyński, J.; Sławińska, J. Compaction/liquefaction properties of some model sands. Arch. Hydroeng. Environ. Mech. 2015, 63, 121–133. [Google Scholar] [CrossRef] [Green Version]
- Chen, B.S.; Jensen, R.E. Case Studies of Dewatering and Foundation Design: Retail Warehouses in Taiwan. In Proceedings of the International Conference on Case Histories in Geotechnical Engineering, Chicago, IL, USA, 29 April–4 May 2013. [Google Scholar]
- Finno, R.J.; Gallant, A.P.; Sabatini, P.J. Evaluating ground improvement after blast densification: Performance at the Oakridge Landfill. J. Geotech. Geoenviron. Eng. 2016, 142, 04015054. [Google Scholar] [CrossRef]
- Shakeran, M.; Eslami, A.; Ahmadpour, M. Geotechnical Aspects of Explosive Compaction. Shock Vib. 2016, 2016, 6719271. [Google Scholar] [CrossRef] [Green Version]
- Tong, B.; Schaefer, V.; Liu, Y.; Han, B. Optimization of deep mixing design for seismic liquefaction mitigation of Caisson walls. Geomat. Nat. Hazards Risk 2019, 10, 287–313. [Google Scholar] [CrossRef]
- Satvati, S.; Cetin, B.; Ashlock, J.C.; Ceylan, H.; Rutherford, C. Binding capacity of quarry fines for granular aggregates. In Proceedings of the ASCE Geo-Congress 2020, Minneapolis, MN, USA, 25–28 February 2020. [Google Scholar]
- Huang, B.; Liu, J.; Lin, P.; Ling, D. Uplifting behavior of shallow buried pipe in liquefiable soil by dynamic centrifuge test. Sci. World J. 2014, 2014, 838546. [Google Scholar] [CrossRef]
- García-Torres, S.; Madabhushi, G.S.P. Performance of vertical drains in liquefaction mitigation under structures. Bull. Earthq. Eng. 2019, 17, 5849–5866. [Google Scholar] [CrossRef] [Green Version]
- Kumari, S.; Sawant, V.A.; Mehndiratta, S. Effectiveness of Stone Column in Liquefaction Mitigation; Geotechnical Earthquake Engineering and Soil Dynamics V: Austin, TX, USA, 2018; pp. 207–216. [Google Scholar]
- Huang, C.; Sui, Z.; Wang, L.; Liu, K. Mitigation of Soil Liquefaction Using Stone Columns: An Experimental Investigation. Mar. Georesour. Geotechnol. 2016, 34, 244–251. [Google Scholar] [CrossRef]
- Kannan, R.C. Deep Soil Densification for Shallow Foundations. In Advances in Shallow Foundations; Geo-Denver: Denver, CO, USA, 2007; p. 2. [Google Scholar] [CrossRef]
- Jazaei, R.; Karakouzian, M.; O’Toole, B.; Moon, J.; Gharehdaghi, S. Energy Absorption of Cementitious Composites Incorporating Carbon Nanotubes Subjected to Low-Velocity Impact Tests. In Proceedings of the Eighth Congress on Forensic Engineering, Austin, TX, USA, 29 November–2 December 2018; pp. 717–725. [Google Scholar]
- Farhangi, V.; Karakouzian, M. Effect of fiber reinforced polymer tubes filled with recycled materials and concrete on structural capacity of pile foundations. Appl. Sci. 2020, 10, 1554. [Google Scholar] [CrossRef] [Green Version]
- Jarrah, M.; Najafabadi, E.P.; Khaneghahi, M.H.; Oskouei, A.V. The effect of elevated temperatures on the tensile performance of GFRP and CFRP sheets. Constr. Build. Mater. 2018, 190, 38–52. [Google Scholar] [CrossRef]
- Mittal, R.K.; Gill, G. Recent developments in utilizing waste tires to reduce seismic earth pressures and liquefaction potential. Int. J. Adv. Struct. Geotech. Eng. 2016, 5, 107–114. [Google Scholar]
- Kumari, D.; Xiang, W.N. Review on biologically based grout material to prevent soil liquefaction for ground improvement. Int. J. Geotech. Eng. 2019, 13, 48–53. [Google Scholar] [CrossRef]
- Azeiteiro, L.C.; Velosa, A.; Paiva, H.; Mantas, P.Q.; Ferreira, V.M.; Veiga, R. Development of grouts for consolidation of old renders. Constr. Build. Mater. 2014, 50, 352–360. [Google Scholar] [CrossRef]
- Farhangi, V.; Karakouzian, M. Design of Bridge Foundations Using Reinforced Micropiles. In Proceedings of the International Road Federation Global R2T Conference & Expo, Las Vegas, NV, USA, 19–22 November 2019; pp. 78–83. [Google Scholar]
- FEDERAL HIGHWAY ADMINISTRATION (FHWA). Micropile Design and Construction; FHWA—NHI-05-039; FHWA: Washington, DC, USA, 2005.
- Hwang, T.H.; Kim, K.H.; Shin, J.H. Effective installation of micropiles to enhance bearing capacity of micropiled raft. Soils Found. 2017, 57, 36–49. [Google Scholar] [CrossRef]
- Sakhakarmi, S.; Choi, J.; Park, J. Business Case Process for Accelerated Bridge Construction. In Proceedings of the International Road Federal Global Road Conference, Las Vegas, NV, USA, 7–10 November 2018. [Google Scholar]
- Zhang, C.; Ma, W.; Liu, X.; Tian, Y.; Orton, S.L. Effects of high temperature on residual punching strength of slab-column connections after cooling and enhanced post-punching load resistance. Eng. Struct. 2019, 199, 109580. [Google Scholar] [CrossRef]
- Valentino, R.; Stevanoni, D. Behaviour of reinforced polyurethane resin micropiles. Proc. Inst. Civ. Eng. Geotech. Eng. 2016, 169, 187–200. [Google Scholar] [CrossRef] [Green Version]
- Arshad, M.; O’Kelly, B.C. Reducing monopile rotation under lateral loading in sandy soils. Geomech. Geoeng. 2017, 12, 14–27. [Google Scholar] [CrossRef]
- Hussain, Z.; Sharma, B.; Rahman, T. Micropile group behaviour subjected to lateral loading. Innov. Infrastruct. Solut. 2019, 4, 22. [Google Scholar] [CrossRef]
- GuhaRay, A.; Mohammed, Y.; Harisankar, S.; Gowre, M.S. Effect of micropiles on liquefaction of cohesionless soil using shake table tests. Innov. Infrastruct. Solut. 2017, 2, 13. [Google Scholar] [CrossRef]
- Boulanger, R.; Idriss, I.M. CPT and SPT Based Liquefaction Triggering Procedures; Report No. UCD/CGM-14/01; Ce.Memphis.Edu: Davis, CA, USA, 2014. [Google Scholar]
- Ntritsos, N.; Cubrinovski, M. A CPT-based effective stress analysis procedure for liquefaction assessment. Soil Dyn. Earthq. Eng. 2020, 131, 106063. [Google Scholar] [CrossRef]
- Seed, H.B.; Idriss, I.M. Simplified procedure for evaluating soil liquefaction potential. ASCE J. Soil Mech. Found. Div. 1971, 97, 1249–1273. [Google Scholar]
- Sassa, S.; Yamazaki, H. Simplified liquefaction prediction and assessment method considering waveforms and durations of earthquakes. J. Geotech. Geoenviron. Eng. 2017, 143, 04016091. [Google Scholar] [CrossRef]
- Cubrinovski, M. Some Important Considerations in the Engineering Assessment of Soil Liquefaction. Available online: https://www.nzgs.org/library/some-important-considerations-in-the-engineering-assessment-of-soil-liquefaction/ (accessed on 12 February 2020).
- Kayabasi, A.; Gokceoglu, C. Liquefaction potential assessment of a region using different techniques (Tepebasi, Eskişehir, Turkey). Eng. Geol. 2018, 246, 139–161. [Google Scholar] [CrossRef]
- Xu, C.; Feng, C.; Du, X.; Zhang, X. Study on liquefaction mechanism of saturated sand considering stress redistribution. Eng. Geol. 2020, 264, 105302. [Google Scholar] [CrossRef]
- Berberian, M. Earthquake history of Iran. Developments in Earth Surface Processes; Elsevier: Amsterdam, The Netherlands, 2014; pp. 519–628. [Google Scholar]
- United States Geological Survey. Latest Earthquakes, M 5.3–95km WNW of Bandar ’Abbas, Iran. Available online: https://earthquake.usgs.gov/earthquakes/eventpage/us60008g7m/origin/detail (accessed on 15 March 2020).
- Youd, T.L.; Idriss, I.M. Liquefaction resistance of soils: Summary report from the 1996 NCEER and 1998 NCEER/NSF workshops on evaluation of liquefaction resistance of soils. J. Geotech. Geoenviron. Eng. 2001, 127, 817–833. [Google Scholar] [CrossRef] [Green Version]
- Juang, C.H.; Fang, S.Y.; Khor, E.H. First-order reliability method for probabilistic liquefaction triggering analysis using CPT. J. Geotech. Geoenviron. Eng. 2006, 132, 337–350. [Google Scholar] [CrossRef]
- Raoul, J.; Sedlacek, G.; Tsionis, G.; Raoul, J.; Sedlacek, G.; Tsionis, G. Eurocode 8: Seismic Design of Buildings Worked Examples; Publications Office of the European Union: Ispra, Italy, 2012. [Google Scholar]
- Standard Test Method for Mechanical Cone Penetration Testing of Soils; ASTM International: West Conshohocken, PA, USA, 2016.
- Standard Test Method for Standard Penetration Test (SPT) and Split-Barrel Sampling of Soils; ASTM International: West Conshohocken, PA, USA, 2018.
- Courtesy of Google Map. Available online: google.com/maps (accessed on 1 March 2020).
- Standard Specification for Deformed and Plain Carbon-Steel Bars for Concrete Reinforcement; ASTM A615/A615M-18e1; ASTM: West Conshohocken, PA, USA, 2018; Available online: www.astm.org (accessed on 10 February 2020).
- Idriss, I.M.; Boulanger, R.W. Soil Liquefaction During Earthquakes. Monograph; Earthquake Engineering Research Institute: Oakland, CA, USA, 2008; 261p. [Google Scholar]
- Nguyen, T.V.; Shao, L.; Gingery, J.; Robertson, P. Proposed Modification to CPT-Based Liquefaction Method for Post-Vibratory Ground Improvement; ASCE; Geo-Congress: Atlanta, GA, USA, 2014; pp. 1120–1132. [Google Scholar]
- Liao, S.S.; Veneziano, D.; Whitman, R.V. Regression models for evaluating liquefaction probability. J. Geotech. Eng. 1988, 114, 389–411. [Google Scholar] [CrossRef]
- Boulanger, R.W.; Wilson, D.W.; Idriss, I.M. Examination and reevalaution of SPT-based liquefaction triggering case histories. J. Geotech. Geoenviron. Eng. 2012, 138, 898–909. [Google Scholar] [CrossRef]
- Lunne, T.; Andersen, K.H. Soft clay shear strength parameters for deepwater geotechnical design. In Proceedings of the 6th International Offshore Site Investigation and Geotechnics Conference: Confronting New Challenges and Sharing Knowledge, London, UK, 11–13 September 2007; pp. 151–176. [Google Scholar]
Figure 1.
Research study sites [45].
Figure 1.
Research study sites [45].

Figure 2.
Single bar reinforced micropile after the first phase of pressure grouting using a sleeve pipe.
Figure 2.
Single bar reinforced micropile after the first phase of pressure grouting using a sleeve pipe.

Figure 3.
Cone penetration resistance values before and after jet grouting using micropiles in soil profile containing only poorly graded sand.
Figure 3.
Cone penetration resistance values before and after jet grouting using micropiles in soil profile containing only poorly graded sand.

Figure 4.
Cone penetration resistance values before and after jet grouting using micropiles in soil profile containing (SP-SC, SP-SM, SC, and SM).
Figure 4.
Cone penetration resistance values before and after jet grouting using micropiles in soil profile containing (SP-SC, SP-SM, SC, and SM).

Figure 5.
CPT-based liquefaction analysis of clean sand for and , following Juang 2006 recommendations: (a) Liquefaction evaluation before jet grouting, (b) liquefaction assessment after jet grouting by micropiles and based on the Eurocode 8 specifications, (c) liquefaction evaluation before jet grouting, (d) liquefaction evaluation after jet grouting using micropiles.

Figure 6.
Corrected SPT values before and after jet grouting using micropiles in the soil profile containing only poorly graded sand.
Figure 6.
Corrected SPT values before and after jet grouting using micropiles in the soil profile containing only poorly graded sand.

Figure 7.
Corrected SPT values before and after jet grouting using micropiles in the soil profile containing SP-SC, SP-SM, SC, and SM.
Figure 7.
Corrected SPT values before and after jet grouting using micropiles in the soil profile containing SP-SC, SP-SM, SC, and SM.

Figure 8.
SPT-based liquefaction analysis of clean sand for and , following NCEER recommendations for: (a) Liquefaction assessment before jet grouting, (b) liquefaction evaluation after jet grouting using micropiles and according to Eurocode 8, (c) liquefaction assessment before jet grouting, (d) liquefaction evaluation after jet grouting using micropiles.

Figure 9.
Relationships between values (left) and values (right) before and after jet grouting using micropiles for coarse-grained clean sands (SP) and fine-grained soil SP-SC, SP-SM, SC, SM.
Figure 9.
Relationships between values (left) and values (right) before and after jet grouting using micropiles for coarse-grained clean sands (SP) and fine-grained soil SP-SC, SP-SM, SC, SM.

Figure 10.
Improvement of the factor of safety against liquefaction triggering based on CPT, before and after jet grouting using micropiles in soil layers containing only poorly graded sand (clean sand).
Figure 10.
Improvement of the factor of safety against liquefaction triggering based on CPT, before and after jet grouting using micropiles in soil layers containing only poorly graded sand (clean sand).

Figure 11.
Comparison of the factor of safety values based on two-point moving averages, according to three CPT-based method (left) along with three SPT-based approaches (right) for assessing the improvement of the clean sand soil against the liquefaction, after jet grouting by micropiles.
Figure 11.
Comparison of the factor of safety values based on two-point moving averages, according to three CPT-based method (left) along with three SPT-based approaches (right) for assessing the improvement of the clean sand soil against the liquefaction, after jet grouting by micropiles.

Figure 12.
Improvement of the factor of safety against liquefaction triggering based on SPT, before and after jet grouting using micropiles in soil layers containing only poorly graded sand (clean sand).
Figure 12.
Improvement of the factor of safety against liquefaction triggering based on SPT, before and after jet grouting using micropiles in soil layers containing only poorly graded sand (clean sand).


Table 1.
CPT-based liquefaction triggering assessment prior to and after jet grouting using micropiles following the Boulanger and Idriss method.
Table 1.
CPT-based liquefaction triggering assessment prior to and after jet grouting using micropiles following the Boulanger and Idriss method.
| BH # | Point ID | Depth (m) | USCS | (KN/m2) | FC % | (KPa) | (KPa) | CSR | Before Grouting | After Grouting | ||||
|---|---|---|---|---|---|---|---|---|---|---|---|---|---|---|
| CRR | FS | CRR | FS | |||||||||||
| BH-I-1 | 1 | 2.0 | SP-SC | 21 | 10.5 | 42.0 | 34.15 | 0.24 | 177.1 | 0.49 | 2.03 | 221.7 | 2.00 | 5.00 |
| 2 | 3.0 | SP-SC | 25 | 11 | 67.0 | 49.3 | 0.28 | 123.5 | 0.19 | 0.68 | 191.0 | 0.78 | 2.83 | |
| 3 | 6.0 | SP | 17.5 | 3.5 | 119.5 | 72.4 | 0.33 | 126.9 | 0.20 | 0.58 | 179.5 | 0.53 | 1.58 | |
| 4 | 8.0 | SP | 20.5 | 4 | 160.5 | 93.8 | 0.34 | 123.5 | 0.19 | 0.55 | 184.1 | 0.61 | 1.79 | |
| 5 | 12.0 | SP | 22 | 5 | 248.5 | 142.5 | 0.35 | 170.5 | 0.41 | 1.19 | 186.7 | 0.51 | 1.43 | |
| 6 | 13.5 | SP-SC | 20.5 | 10.5 | 279.3 | 158.6 | 0.34 | 95.30 | 0.14 | 0.39 | 131.0 | 0.21 | 0.59 | |
| 7 | 17.5 | SP | 18 | 4 | 351.3 | 191.3 | 0.34 | 93.5 | 0.13 | 0.39 | 128.7 | 0.20 | 0.57 | |
| 8 | 20.0 | SP | 20 | 4.5 | 401.2 | 216.8 | 0.34 | 111.8 | 0.16 | 0.49 | 136.8 | 0.22 | 0.64 | |
| 9 | 24.0 | SP | 20.5 | 4 | 483.3 | 259.6 | 0.32 | 103.5 | 0.15 | 0.46 | 124.2 | 0.19 | 0.57 | |
| 10 | 28.5 | SP-SM | 21 | 9 | 577.8 | 309.9 | 0.29 | 74.8 | 0.11 | 0.36 | 89.76 | 0.13 | 0.42 | |
| BH-I-2 | 11 | 2.5 | SP-SC | 20.5 | 11 | 44.75 | 32.0 | 0.27 | 168.6 | 0.39 | 1.45 | 208.7 | 1.77 | 5.00 |
| 12 | 3.5 | SP | 19 | 4.5 | 63.75 | 41.19 | 0.31 | 167.5 | 0.38 | 1.25 | 232.8 | 2.00 | 5.00 | |
| 13 | 9 | SP | 18.5 | 5 | 165.5 | 88.98 | 0.37 | 116.1 | 0.17 | 0.47 | 187.4 | 0.68 | 1.87 | |
| 14 | 11 | SP-SC | 17 | 10 | 199.5 | 103.4 | 0.37 | 118.2 | 0.18 | 0.47 | 142.2 | 0.24 | 0.65 | |
| 15 | 12.5 | SP | 19 | 2.5 | 228.0 | 117.1 | 0.37 | 121.0 | 0.18 | 0.49 | 184.5 | 0.62 | 1.63 | |
| 16 | 14 | SP | 21 | 4 | 259.5 | 133.9 | 0.37 | 104.0 | 0.15 | 0.41 | 151.3 | 0.28 | 0.74 | |
| 17 | 15.5 | SP-SM | 18 | 10.5 | 286.5 | 146.2 | 0.37 | 99.5 | 0.14 | 0.39 | 128.2 | 0.20 | 0.54 | |
| 18 | 19 | SP | 22 | 5 | 363.5 | 188.9 | 0.35 | 94.2 | 0.13 | 0.38 | 137.5 | 0.22 | 0.62 | |
| 19 | 28 | SP | 22.5 | 4.5 | 566.0 | 303.1 | 0.30 | 116.0 | 0.17 | 0.56 | 131.7 | 0.21 | 0.65 | |
| 20 | 29 | SP-SC | 20 | 11 | 586.0 | 313.3 | 0.29 | 78.4 | 0.11 | 0.38 | 92.6 | 0.13 | 0.44 | |
| BH-I-3 | 21 | 2 | SP | 17 | 4 | 127.0 | 119.1 | 0.23 | 94.8 | 0.13 | 0.57 | 149.0 | 0.27 | 1.12 |
| 22 | 3 | SP-SM | 19 | 8.5 | 146.0 | 128.3 | 0.25 | 106.4 | 0.15 | 0.61 | 140.9 | 0.24 | 0.93 | |
| 23 | 7.5 | SP | 18.5 | 3 | 229.2 | 167.4 | 0.30 | 86.0 | 0.12 | 0.41 | 146.0 | 0.25 | 0.83 | |
| 24 | 8.5 | SP-SM | 19.5 | 11 | 248.7 | 177.2 | 0.30 | 84.2 | 0.12 | 0.39 | 106.2 | 0.15 | 0.50 | |
| 25 | 9.5 | SP-SM | 18 | 6.5 | 266.8 | 185.3 | 0.31 | 112.4 | 0.16 | 0.53 | 129.9 | 0.20 | 0.64 | |
| 26 | 13.5 | SP | 20 | 2 | 346.8 | 226.1 | 0.31 | 78.63 | 0.11 | 0.36 | 126.2 | 0.19 | 0.60 | |
| 27 | 16 | SP | 21.5 | 4.5 | 400.5 | 255.3 | 0.31 | 104.7 | 0.15 | 0.48 | 121.0 | 0.18 | 0.57 | |
| 28 | 18.5 | SP | 20.5 | 3 | 451.7 | 282.0 | 0.30 | 102.9 | 0.15 | 0.48 | 118.3 | 0.18 | 0.56 | |
| 29 | 27 | SP | 21 | 3.5 | 630.2 | 377.1 | 0.28 | 111.0 | 0.16 | 0.57 | 120.8 | 0.18 | 0.62 | |
| 30 | 28 | SM | 22 | 13 | 652.3 | 389.3 | 0.27 | 88.3 | 0.12 | 0.46 | 120.6 | 0.18 | 0.64 | |
| BH-I-4 | 31 | 2.5 | SP | 18 | 4.5 | 193.2 | 180.5 | 0.25 | 89.09 | 0.13 | 0.51 | 140.8 | 0.23 | 0.92 |
| 32 | 5.5 | SP | 19 | 4 | 250.2 | 208.1 | 0.27 | 78.65 | 0.11 | 0.41 | 131.3 | 0.21 | 0.73 | |
| 33 | 7.5 | SP-SM | 20 | 10.5 | 290.2 | 228.4 | 0.28 | 75.70 | 0.11 | 0.38 | 111.5 | 0.16 | 0.57 | |
| 34 | 8.5 | SP-SM | 19.5 | 10 | 309.8 | 238.1 | 0.29 | 103.8 | 0.15 | 0.52 | 97.3 | 0.14 | 0.47 | |
| 35 | 17 | SP | 19.5 | 4.5 | 475.5 | 320.5 | 0.29 | 113.9 | 0.17 | 0.57 | 117.8 | 0.17 | 0.58 | |
| 36 | 18.5 | SP | 20.5 | 5 | 506.3 | 336.5 | 0.29 | 115.8 | 0.17 | 0.59 | 123.5 | 0.19 | 0.62 | |
| 37 | 21 | SP | 21 | 3.5 | 558.8 | 364.5 | 0.28 | 107.9 | 0.16 | 0.55 | 127.9 | 0.20 | 0.66 | |
| 38 | 26.5 | SP | 20.5 | 4.5 | 671.5 | 423.3 | 0.27 | 86.2 | 0.12 | 0.45 | 122.5 | 0.19 | 0.65 | |
| 39 | 27 | SP-SM | 19.5 | 11 | 681.2 | 428.1 | 0.27 | 95.4 | 0.14 | 0.51 | 107.5 | 0.16 | 0.57 | |
| 40 | 28 | SP | 20.5 | 3.5 | 239.2 | 438.8 | 0.27 | 99.8 | 0.14 | 0.53 | 121.8 | 0.18 | 0.66 | |
| BH-I-5 | 41 | 3 | SP | 18.5 | 3.5 | 447.8 | 221.6 | 0.25 | 76.7 | 0.11 | 0.43 | 139.9 | 0.23 | 0.87 |
| 42 | 4.5 | SP-SC | 18 | 8 | 266.3 | 233.9 | 0.27 | 105.3 | 0.15 | 0.57 | 131.4 | 0.21 | 0.75 | |
| 43 | 7.5 | SP | 21 | 3 | 329.2 | 267.4 | 0.28 | 71.4 | 0.10 | 0.37 | 121.3 | 0.18 | 0.63 | |
| 44 | 8.5 | SP-SM | 18.5 | 2.5 | 347.7 | 276.1 | 0.28 | 100.9 | 0.14 | 0.51 | 104.6 | 0.15 | 0.52 | |
| 45 | 13.5 | SP | 20 | 4 | 447.7 | 327.1 | 0.29 | 88.9 | 0.13 | 0.44 | 133.1 | 0.21 | 0.70 | |
| 46 | 17 | SP | 20.5 | 3.5 | 519.5 | 364.5 | 0.28 | 83.5 | 0.12 | 0.42 | 132.6 | 0.21 | 0.70 | |
| 47 | 18.5 | SC | 19.5 | 14 | 548.7 | 379.0 | 0.27 | 69.8 | 0.10 | 0.36 | 128.5 | 0.20 | 0.69 | |
| 48 | 20.5 | SP | 20 | 5 | 588.8 | 399.4 | 0.28 | 104.2 | 0.15 | 0.54 | 126.3 | 0.19 | 0.68 | |
| 49 | 25.5 | SP | 21 | 4.5 | 693.8 | 455.4 | 0.27 | 102.1 | 0.15 | 0.55 | 129.5 | 0.20 | 0.73 | |
| 50 | 30 | SP | 20.5 | 5 | 786.0 | 503.5 | 0.26 | 98.5 | 0.14 | 0.54 | 126.7 | 0.19 | 0.72 | |
Table 2.
SPT-based liquefaction triggering estimation prior to and after jet grouting using micropiles, following the Boulanger and Idriss method.
Table 2.
SPT-based liquefaction triggering estimation prior to and after jet grouting using micropiles, following the Boulanger and Idriss method.
| BH # | Point ID | Depth (m) | USCS | (KN/m3) | FC % | (KPa) | (KPa) | CSR | Before Grouting | After Grouting | ||||
|---|---|---|---|---|---|---|---|---|---|---|---|---|---|---|
| CRR | FS | CRR | FS | |||||||||||
| BH-II-1 | 1 | 2.0 | SP | 18 | 4 | 36.00 | 31.09 | 0.23 | 35 | 2.00 | 5.00 | 41 | 2.00 | 5.00 |
| 2 | 4.0 | SP-SM | 22 | 11 | 80.0 | 55.48 | 0.29 | 32 | 2.00 | 5.00 | 35 | 2.00 | 5.00 | |
| 3 | 5.5 | SP-SM | 24 | 12 | 116.0 | 76.76 | 0.31 | 29 | 0.41 | 1.33 | 35 | 2.00 | 5.00 | |
| 4 | 8.0 | SP | 20 | 3 | 166.0 | 102.2 | 0.33 | 29 | 0.42 | 1.28 | 40 | 2.00 | 5.00 | |
| 5 | 10.5 | SP | 21.5 | 5 | 219.7 | 131.5 | 0.35 | 30 | 2.00 | 5.00 | 41 | 2.00 | 5.00 | |
| 6 | 13.0 | SP-SC | 19.5 | 10 | 268.5 | 155.7 | 0.35 | 26 | 0.32 | 0.90 | 30 | 2.00 | 5.00 | |
| 7 | 15.0 | SP | 17.5 | 4.5 | 303.5 | 171.1 | 0.36 | 28 | 0.38 | 1.06 | 34 | 2.00 | 5.00 | |
| 8 | 17.0 | SP | 20.5 | 5 | 344.5 | 192.4 | 0.36 | 26 | 0.31 | 0.87 | 36 | 2.00 | 5.00 | |
| 9 | 23.0 | SP | 21 | 3.5 | 470.5 | 259.6 | 0.34 | 23 | 0.25 | 0.74 | 31 | 2.00 | 5.00 | |
| 10 | 29.0 | SP-SM | 20.5 | 8 | 593.5 | 323.7 | 0.32 | 23 | 0.25 | 0.77 | 30 | 0.46 | 1.32 | |
| BH-II-2 | 11 | 2.5 | SP-SM | 20.5 | 12 | 50.25 | 40.44 | 0.25 | 30 | 2.00 | 5.00 | 39 | 2.00 | 5.00 |
| 12 | 4 | SP | 18.5 | 5 | 78.00 | 53.48 | 0.30 | 32 | 2.00 | 5.00 | 41 | 2.00 | 5.00 | |
| 13 | 8 | SP | 18 | 4 | 150.0 | 86.23 | 0.35 | 29 | 0.42 | 1.23 | 38 | 2.00 | 5.00 | |
| 14 | 10.5 | SP | 19 | 3.5 | 197.5 | 109.2 | 0.36 | 33 | 2.00 | 5.00 | 40 | 2.00 | 5.00 | |
| 15 | 9.5 | SP-SC | 16.5 | 11 | 181.0 | 102.5 | 0.35 | 29 | 2.00 | 5.00 | 37 | 2.00 | 5.00 | |
| 16 | 13.5 | SP | 19.5 | 2 | 259.0 | 141.3 | 0.37 | 29 | 0.45 | 1.21 | 35 | 2.00 | 5.00 | |
| 17 | 15 | SP-SC | 18.5 | 10 | 286.8 | 154.3 | 0.36 | 25 | 0.32 | 0.88 | 33 | 2.00 | 5.00 | |
| 18 | 17.5 | SP | 21.5 | 4.5 | 340.5 | 183.5 | 0.36 | 26 | 0.32 | 0.89 | 35 | 2.00 | 5.00 | |
| 19 | 22.5 | SP | 22.5 | 4 | 453.0 | 247.0 | 0.34 | 24 | 0.26 | 0.76 | 33 | 2.00 | 5.00 | |
| 20 | 27.5 | SP | 23 | 5 | 568.0 | 312.9 | 0.33 | 24 | 0.26 | 0.80 | 29 | 0.42 | 1.23 | |
| BH-II-3 | 21 | 2 | SP | 17.5 | 4.5 | 121.8 | 116.9 | 0.23 | 19 | 0.20 | 0.86 | 24 | 0.28 | 1.18 |
| 22 | 6 | SP | 18 | 3.5 | 193.8 | 149.6 | 0.29 | 23 | 0.25 | 0.87 | 30 | 2.00 | 5.00 | |
| 23 | 7.5 | SP-SC | 19.5 | 9 | 223.0 | 164.1 | 0.30 | 20 | 0.20 | 0.68 | 24 | 0.28 | 0.91 | |
| 24 | 8.5 | SP-SM | 19 | 12 | 242.0 | 173.3 | 0.31 | 21 | 0.22 | 0.72 | 25 | 0.29 | 0.93 | |
| 25 | 12 | SP | 20.5 | 2 | 313.8 | 210.8 | 0.32 | 21 | 0.22 | 0.68 | 30 | 2.00 | 5.00 | |
| 26 | 13.5 | SP-SM | 18 | 7 | 340.8 | 223.0 | 0.32 | 18 | 0.18 | 0.56 | 23 | 0.26 | 0.78 | |
| 27 | 15 | SP | 21 | 4 | 372.3 | 239.8 | 0.32 | 21 | 0.22 | 0.67 | 27 | 0.35 | 1.03 | |
| 28 | 17 | SP | 21.5 | 2.5 | 415.2 | 263.2 | 0.33 | 24 | 0.28 | 0.83 | 30 | 0.47 | 1.36 | |
| 29 | 26 | SP | 21 | 2 | 604.2 | 363.9 | 0.31 | 22 | 0.23 | 0.74 | 28 | 0.37 | 1.11 | |
| 30 | 28 | SM | 22.5 | 14 | 649.2 | 389.3 | 0.31 | 25 | 0.30 | 0.96 | 30 | 0.46 | 1.41 | |
| BH-II-4 | 31 | 2.5 | SP-SC | 20 | 8 | 139.2 | 129.4 | 0.24 | 19 | 0.20 | 0.82 | 24 | 0.28 | 1.14 |
| 32 | 6 | SP | 17.5 | 5 | 200.5 | 156.3 | 0.29 | 24 | 0.27 | 0.94 | 30 | 0.47 | 1.59 | |
| 33 | 8 | SC | 17 | 14 | 234.5 | 170.8 | 0.30 | 24 | 0.27 | 0.88 | 32 | 2.00 | 5.00 | |
| 34 | 12 | SP | 18 | 3.5 | 306.5 | 203.5 | 0.33 | 24 | 0.26 | 0.79 | 30 | 0.48 | 1.41 | |
| 35 | 17 | SP | 19.5 | 4 | 404.0 | 251.9 | 0.33 | 25 | 0.29 | 0.86 | 30 | 2.00 | 5.00 | |
| 36 | 18.5 | SP-SM | 20.5 | 11 | 434.8 | 267.9 | 0.33 | 27 | 0.33 | 0.99 | 29 | 0.42 | 1.23 | |
| 37 | 23 | SP | 20 | 5 | 524.8 | 313.8 | 0.33 | 25 | 0.29 | 0.89 | 30 | 0.46 | 1.34 | |
| 38 | 25 | SP | 21.5 | 3 | 567.8 | 337.2 | 0.33 | 26 | 0.31 | 0.94 | 29 | 0.41 | 1.21 | |
| 39 | 26 | SP-SM | 19 | 10 | 586.8 | 346.4 | 0.31 | 20 | 0.20 | 0.66 | 24 | 0.26 | 0.83 | |
| 40 | 29 | SP | 20.5 | 4 | 648.2 | 378.5 | 0.30 | 19 | 0.20 | 0.66 | 26 | 0.30 | 0.95 | |
| BH-II-5 | 41 | 2 | SP | 19 | 3 | 135.2 | 130.3 | 0.23 | 20 | 0.20 | 0.87 | 26 | 0.31 | 1.32 |
| 42 | 6.5 | SP | 21.5 | 4 | 232.0 | 182.9 | 0.29 | 21 | 0.22 | 0.76 | 29 | 0.41 | 1.37 | |
| 43 | 7.5 | SC | 18 | 14 | 250.0 | 191.1 | 0.30 | 22 | 0.23 | 0.79 | 30 | 2.00 | 5.00 | |
| 44 | 8.5 | SP-SC | 18.5 | 7 | 268.5 | 199.8 | 0.31 | 24 | 0.27 | 0.86 | 32 | 2.00 | 5.00 | |
| 45 | 12 | SP | 20 | 4 | 338.5 | 235.5 | 0.32 | 22 | 0.23 | 0.73 | 30 | 0.46 | 1.38 | |
| 46 | 16 | SP | 20.5 | 3.5 | 420.5 | 278.2 | 0.32 | 21 | 0.22 | 0.68 | 28 | 0.39 | 1.16 | |
| 47 | 17.5 | SC | 19 | 15 | 449.0 | 292.0 | 0.32 | 25 | 0.29 | 0.91 | 30 | 2.00 | 5.00 | |
| 48 | 18.5 | SP-SM | 18.5 | 11 | 467.5 | 300.7 | 0.32 | 24 | 0.26 | 0.82 | 27 | 0.33 | 1.01 | |
| 49 | 24 | SP | 21 | 4.5 | 583.0 | 362.3 | 0.31 | 21 | 0.22 | 0.72 | 26 | 0.32 | 0.99 | |
| 50 | 31 | SP | 21.5 | 5 | 733.5 | 444.1 | 0.30 | 21 | 0.22 | 0.73 | 24 | 0.27 | 0.88 | |
Table 3.
Comparative estimation of factor of safety improvements for CPT-based liquefaction triggering assessment according to Boulanger and Idriss, Eurocode, and Juang methods and specifications, after jet grouting using micropiles.
Table 3.
Comparative estimation of factor of safety improvements for CPT-based liquefaction triggering assessment according to Boulanger and Idriss, Eurocode, and Juang methods and specifications, after jet grouting using micropiles.
| Boulanger and Idriss | Eurocode | Juang | ||||||||||
|---|---|---|---|---|---|---|---|---|---|---|---|---|
| Clean Sand (SP) | SP-SC, SP-SM, SC, SM | Clean Sand (SP) | SP-SC, SP-SM, SC, SM | Clean Sand (SP) | SP-SC, SP-SM, SC, SM | |||||||
| Criterion | Number of Cases | Case (%) | Number of Cases | Case (%) | Number of Cases | Case (%) | Number of Cases | Case (%) | Number of Cases | Rate (%) | Number of Cases | Case (%) |
| C-1 | 16 | 50.0 | 12 | 66.7 | 17 | 53.1 | 15 | 83.3 | 3 | 9.4 | 7 | 38.9 |
| C-2 | 9 | 28.1 | 3 | 16.7 | 11 | 34.4 | 1 | 5.6 | 9 | 28.1 | 7 | 38.9 |
| C-3 | 3 | 9.4 | 1 | 5.6 | 0 | 0.0 | 1 | 5.6 | 9 | 28.1 | 3 | 16.7 |
| C-4 | 4 | 12.5 | 2 | 11.1 | 4 | 12.5 | 1 | 5.6 | 11 | 34.4 | 1 | 5.6 |
Table 4.
Comparative evaluation of factor of safety improvements for SPT-based liquefaction triggering assessment following Boulanger and Idriss, Eurocode, and NCEER methods and specifications after jet grouting by micropiles.
Table 4.
Comparative evaluation of factor of safety improvements for SPT-based liquefaction triggering assessment following Boulanger and Idriss, Eurocode, and NCEER methods and specifications after jet grouting by micropiles.
| Boulanger and Idriss | Eurocode | NCEER | ||||||||||
|---|---|---|---|---|---|---|---|---|---|---|---|---|
| Clean Sand (SP) | SP-SC, SP-SM, SC, SM | Clean Sand (SP) | SP-SC, SP-SM, SC, SM | Clean Sand (SP) | SP-SC, SP-SM, SC, SM | |||||||
| Criterion | Number of Cases | Case (%) | Number of Cases | Case (%) | Number of Cases | Case (%) | Number of Cases | Case (%) | Number of Cases | Case (%) | Number of Cases | Case (%) |
| C-1 | 9 | 29.0 | 11 | 57.9 | 23 | 74.2 | 15 | 78.9 | 16 | 51.6 | 12 | 63.2 |
| C-2 | 11 | 35.5 | 1 | 5.3 | 2 | 6.5 | 2 | 10.5 | 4 | 12.9 | 0 | 0.0 |
| C-3 | 0 | 0.0 | 0 | 0.0 | 0 | 0.0 | 0 | 0.0 | 0 | 0.0 | 0 | 0.0 |
| C-4 | 11 | 35.5 | 7 | 36.8 | 6 | 19.4 | 2 | 10.5 | 11 | 35.5 | 7 | 36.8 |
© 2020 by the authors. Licensee MDPI, Basel, Switzerland. This article is an open access article distributed under the terms and conditions of the Creative Commons Attribution (CC BY) license (http://creativecommons.org/licenses/by/4.0/).
Share and Cite
MDPI and ACS Style
Farhangi, V.; Karakouzian, M.; Geertsema, M. Effect of Micropiles on Clean Sand Liquefaction Risk Based on CPT and SPT. Appl. Sci. 2020, 10, 3111. https://0-doi-org.brum.beds.ac.uk/10.3390/app10093111
AMA Style
Farhangi V, Karakouzian M, Geertsema M. Effect of Micropiles on Clean Sand Liquefaction Risk Based on CPT and SPT. Applied Sciences. 2020; 10(9):3111. https://0-doi-org.brum.beds.ac.uk/10.3390/app10093111
Chicago/Turabian StyleFarhangi, Visar, Moses Karakouzian, and Marten Geertsema. 2020. "Effect of Micropiles on Clean Sand Liquefaction Risk Based on CPT and SPT" Applied Sciences 10, no. 9: 3111. https://0-doi-org.brum.beds.ac.uk/10.3390/app10093111
Note that from the first issue of 2016, this journal uses article numbers instead of page numbers. See further details here.