Article

Methods for the Characterization of Polyetherimide Based Materials Processed by Fused Deposition Modelling

Department of Civil Engineering and Architecture, University of Catania, Viale Andrea Doria 6, 95125 Catania, Italy
*
Author to whom correspondence should be addressed.
Submission received: 20 April 2020 / Revised: 29 April 2020 / Accepted: 30 April 2020 / Published: 3 May 2020
(This article belongs to the Special Issue Materials Development by Additive Manufacturing Techniques)

Abstract

:

Featured Application

The present work aims to provide an insight into characterization techniques for Fused Deposition Modelling. The outcomes can guide the development of novel standards for FDM™.

Abstract

Fused deposition modelling (FDM™) is one of the most promising additive manufacturing technologies and its application in industrial practice is increasingly spreading. Among its successful applications, FDM™ is used in structural applications thanks to the mechanical performances guaranteed by the printed parts. Currently, a shared international standard specifically developed for the testing of FDM™ printed parts is not available. To overcome this limit, we have considered three different tests aimed at characterizing the mechanical properties of technological materials: tensile test (ASTM D638), flexural test (ISO 178) and short-beam shear test (ASTM D2344M). Two aerospace qualified ULTEMTM 9085 resins (i.e., tan and black grades) have been used for printing all specimens by means of an industrial printer (Fortus 400mc). The aim of this research was to improve the understanding of the efficiency of different mechanical tests to characterize materials used for FDM™. For each type of test, the influence on the mechanical properties of the specimen’s materials and geometry was studied using experimental designs. For each test, 22 screening factorial designs were considered and analyzed. The obtained results demonstrated that the use of statistical analysis is recommended to ascertain the real pivotal effects and that specific test standards for FDM™ components are needed to support the development of materials in the additive manufacturing field.

Graphical Abstract

1. Introduction

Additive manufacturing (AM) is a layer-by-layer building technique that allows complex shapes to be obtained without the use of a mold. AM is a promising area for manufacturing of components from prototypes to functional structures. The application of AM covers different sectors such as aerospace, automotive, semiconductor and biomedical applications.
Fused filament fabrication (FFF), also known as fused deposition modeling (FDM™), is one of the most popular AM techniques. FDM™ is based on the melting of a thermoplastic filament that is laid on a platform to create each layer on top of the other. The FDM™ process is controlled by many parameters which range from material type to several machine settings such as the nozzle diameter and temperature, printing speed, feed rate, bed temperature, raster angle and width [1].
Several detailed studies are reported in the literature about the influence of the printing settings on the mechanical properties of 3D-printed parts. Es-Said et al. [2] showed that polymer chain alignment occurs during the filament deposition. As a result, the tensile, flexural and impact resistance varies with different raster orientations. Similar results were obtained by Ahn et al. [3]. In their study, the effects of the raster orientation, air gap, bead width, color and model temperature parameters on the tensile strength were evaluated. Results showed that the air gap and raster orientation influence the tensile strength; conversely, the bead width, model temperature and color do not have a significant effect. In another study, Lee et al. [4] concluded that the layer thickness, the raster angle and the air gap influence the elastic performance of 3D-printed ABS (Acrylonitrile Butadiene Styrene) Parts.
The ASTM D638 tensile test and the ASTM D790 or ISO 178 flexural test are both widely used standards for testing polymeric materials processed by injection or compression molding. Thus, practitioners might be interested in extending their implementation to the characterization of the mechanical properties of FDM™ printed parts. Unfortunately, these standards do not account for the presence of voids that are unavoidable in FDM™. In addition, they were not specifically developed to characterize the interlayer bonding which influences the mesostructures of FDM™ printed parts. Tronvoll et al. [5] showed that voids found in FDM™ printed parts significantly impact the tensile properties. According to Sun et al. [6], the chamber temperature and variations in the convection coefficient have a strong effect on the cooling temperature profiles, as well as on the mesostructure and overall quality of the bonding between filaments. However, they did not measure the interlayer strength since the performed flexural tests yielded large variation in the results.
Only a few papers in the AM literature have been focused on the study of the bonding quality between layers and rasters printed by FDM™. Recently, interlaminar bonding has been measured by using the short-beam strength (SBS) test. This test is commonly used for fiber reinforced composites [7,8,9,10]. A study of the interlaminar bonding performance of continuous fiber reinforced thermoplastics printed by FDM™ showed a correlation between porosity and the interlaminar shear strength (ILSS) [7]. O’ Connor [9] confirmed these findings working with similar materials. In a recent paper, SBS tests indicated improved sensitivity to measure interlaminar bonding effects for different materials compared to tensile or flexural tests [10]. However, all these papers lacked in terms of the statistical analysis of the measured data. Some research tried to rationalize the results of mechanical testing using the design of experiment (DoE) toolbox of statistical techniques [3,11,12,13,14,15]. Vicente et al. [15] showed that the interlayer cooling time can influence the ultimate tensile strength (UTS) because of different bonding properties between the layers. The effect was more pronounced for the shorter Type V sample rather than for the longer Type I sample. However, the effect of the sample type on the interlayer bonding was not systematically discussed by measuring the interlayer bonding. Additionally, tensile testing based on the ASTM D638 has been criticized for dog bone specimens because of the large stress concentrations caused by the termination of the longitudinal roads [3]. ASTM D3039 was proposed to overcome this problem.
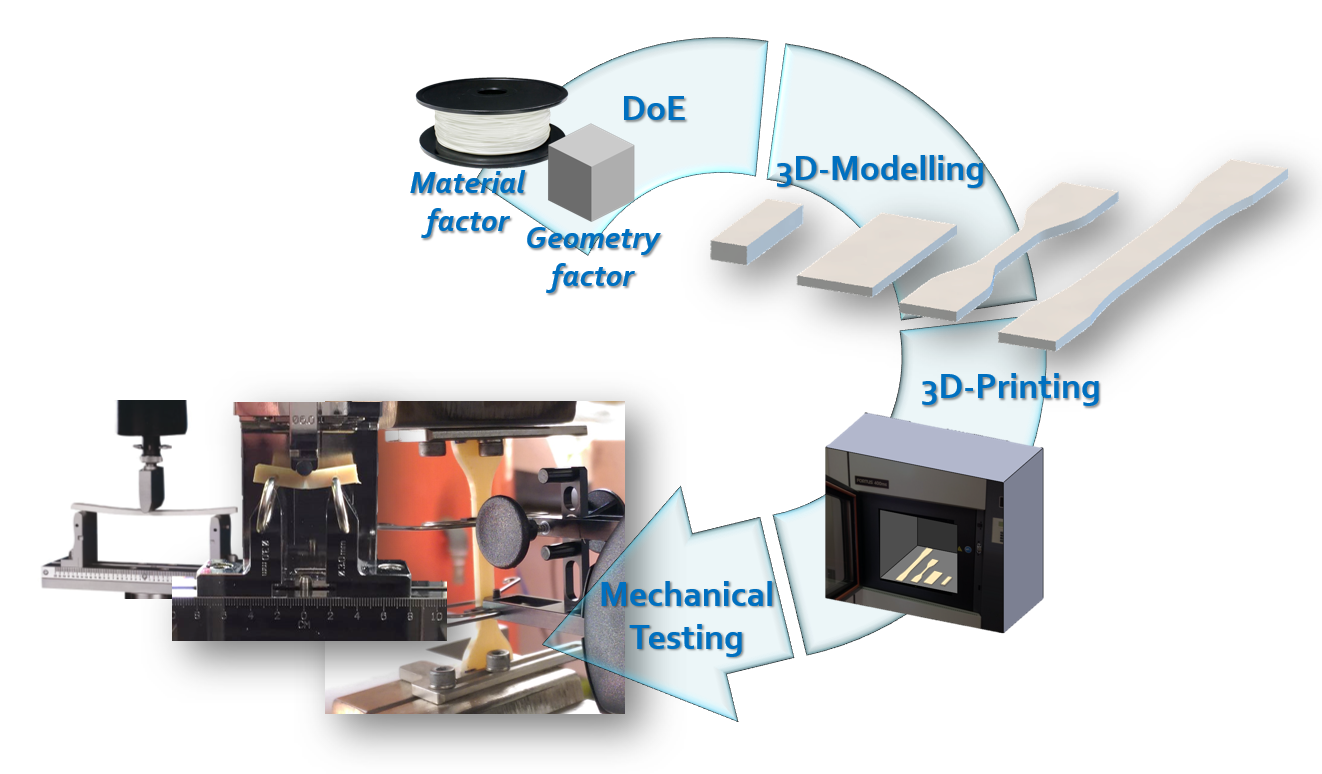
In this paper the mechanical properties of two commercial grades of polyetherimides (PEI) are discussed. The paper is organized as follows: first, the two as-received filaments were characterized by thermal analysis to determine differences in the material behavior. Secondly, subsequently printed specimens were analyzed by different mechanical tests ranging from tensile to flexural and SBS. For each material type, the sample dimensions were varied to unveil their effect on the mechanical properties. All results obtained by the tests were statistically analyzed as 22 replicated screening designs.

2. Materials and Methods

ULTEMTM 9085, a high temperature thermoplastic blend consisting of PEI and a copolymer to improve the flow, was used in this study. ULTEMTM 9085 is excellent for FDM™ as it shows improved rheology for processing over standard PEI [16]. ULTEMTM 9085 is qualified for aerospace applications. Two ULTEM
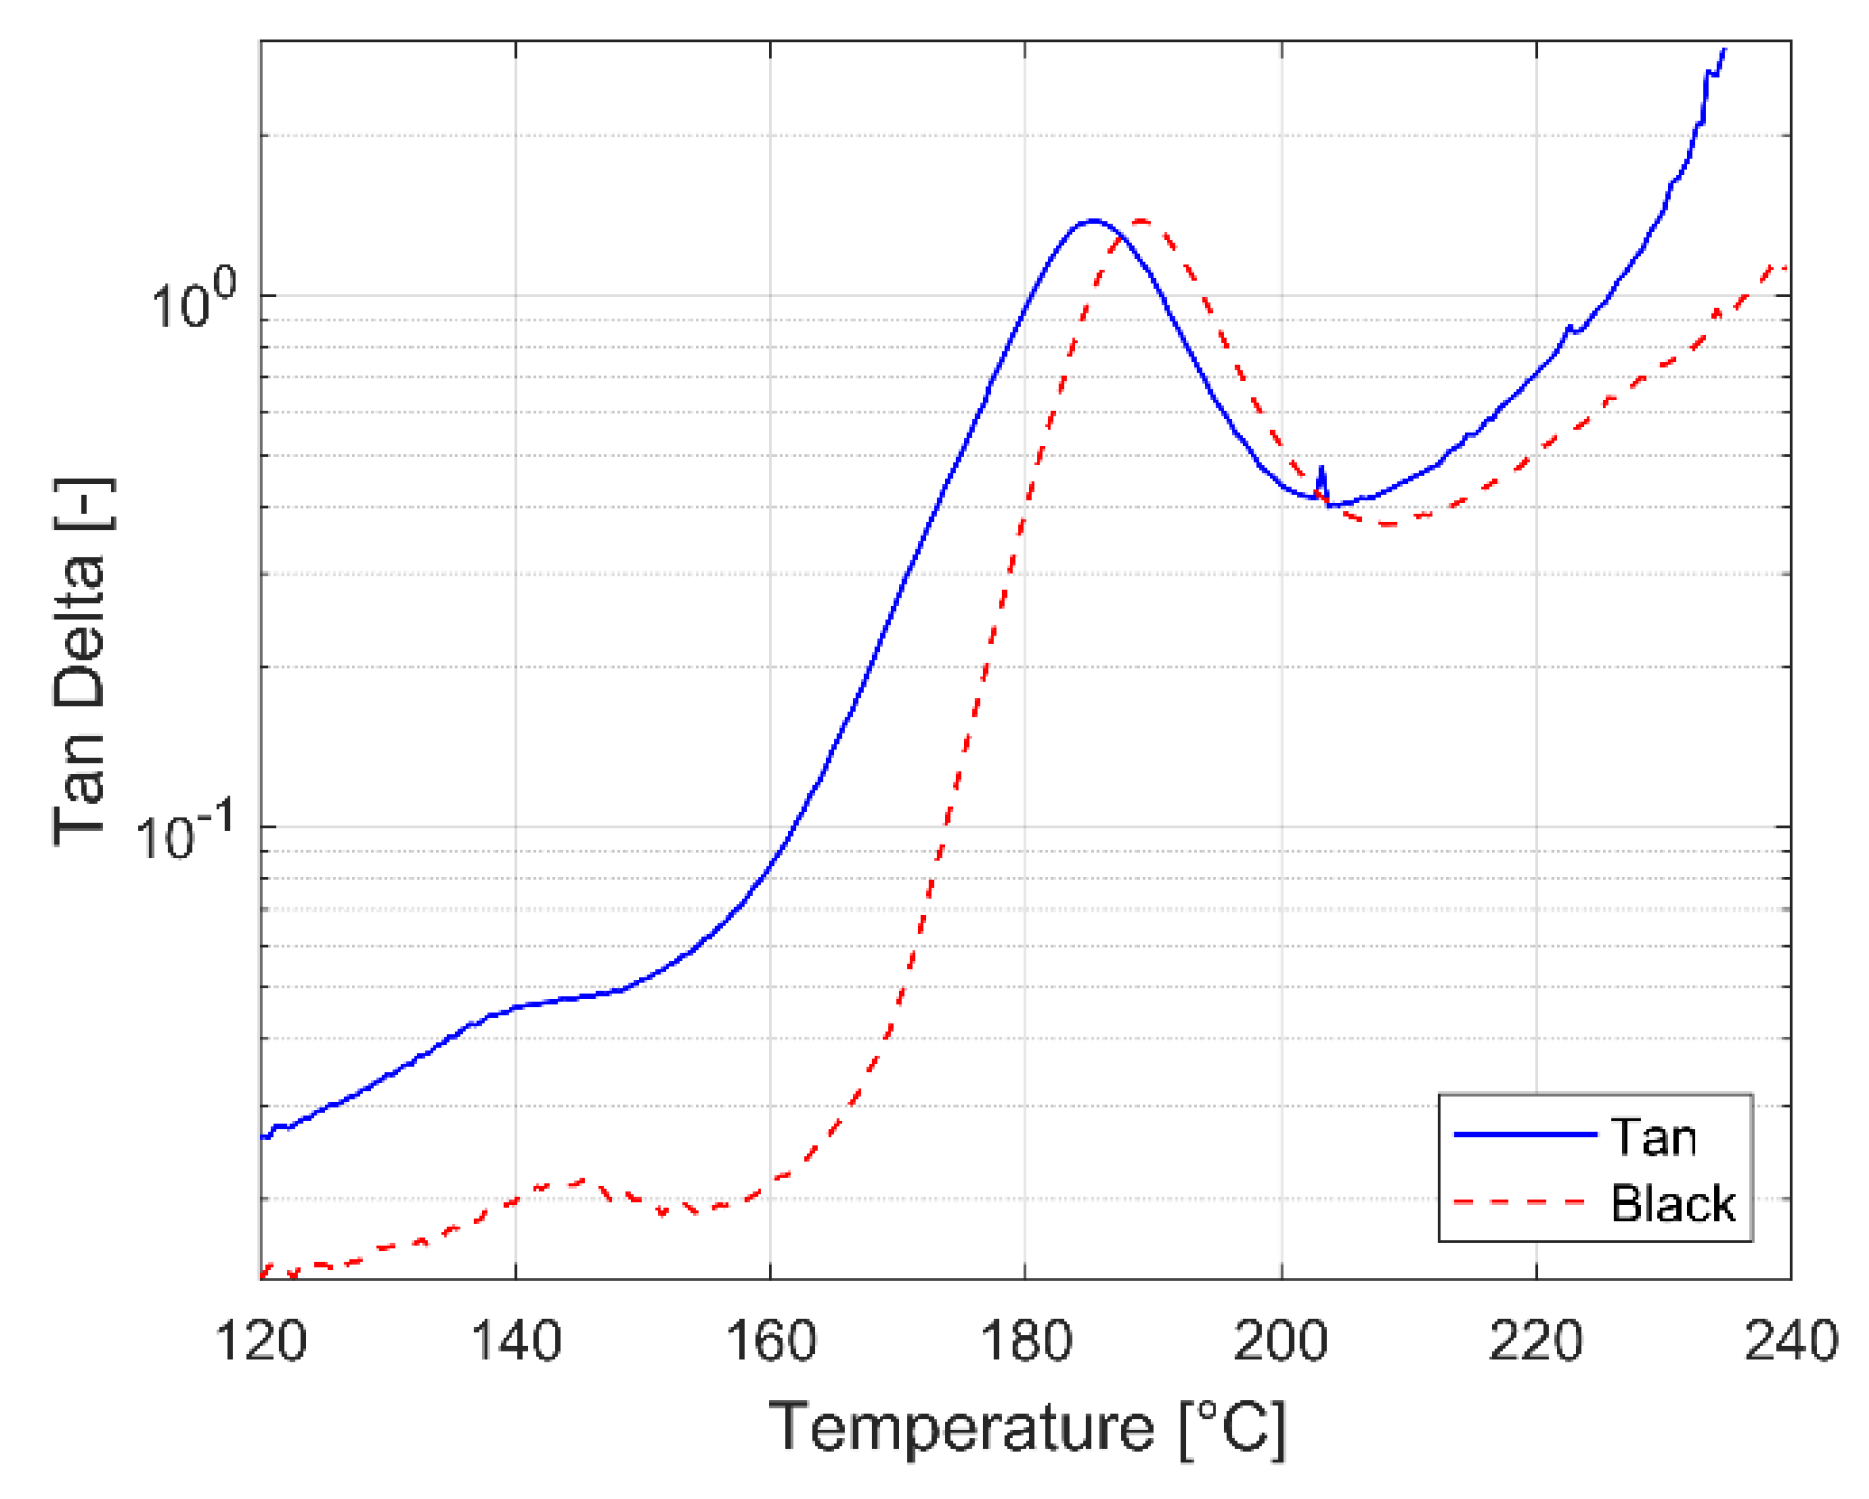
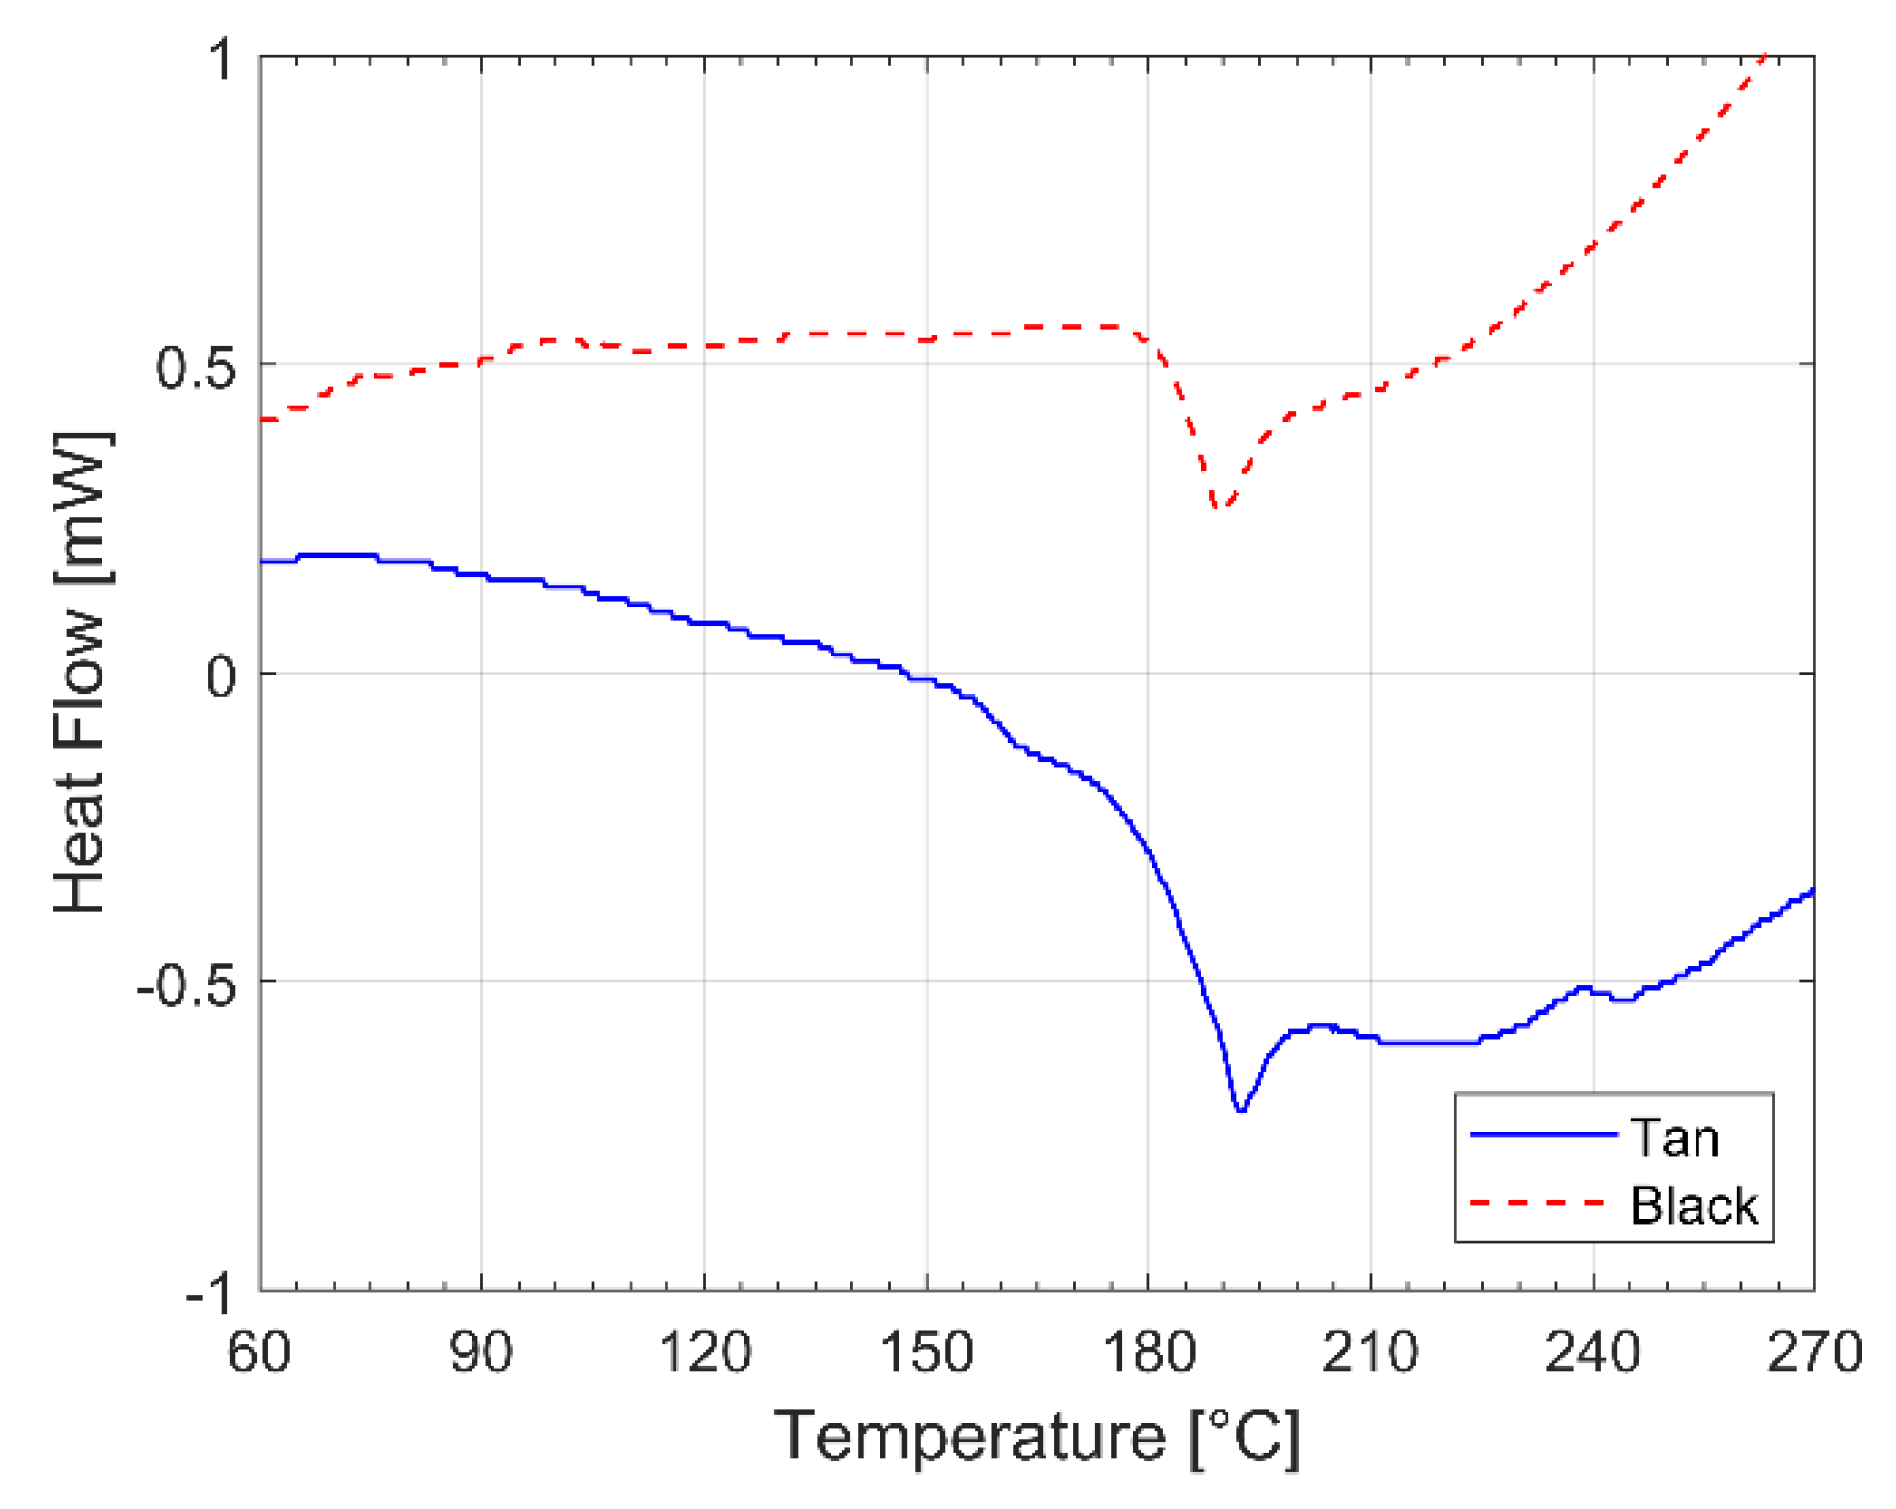
TM 9085 grades are available from Stratasys classified as tan and black. Additionally, the specifications of the materials differ based on the color itself. The study of the two materials started with thermal characterization. By means of thermal analyses, which are based on the viscoelastic behavior study and the calorimetric glass transition temperature (Tg) determination, we wanted to find out if the two materials show different material properties in general. Based on this finding, in the second step of the investigation a mechanical characterization of the two materials was performed.
To characterize the mechanical behavior of the two ULTEM
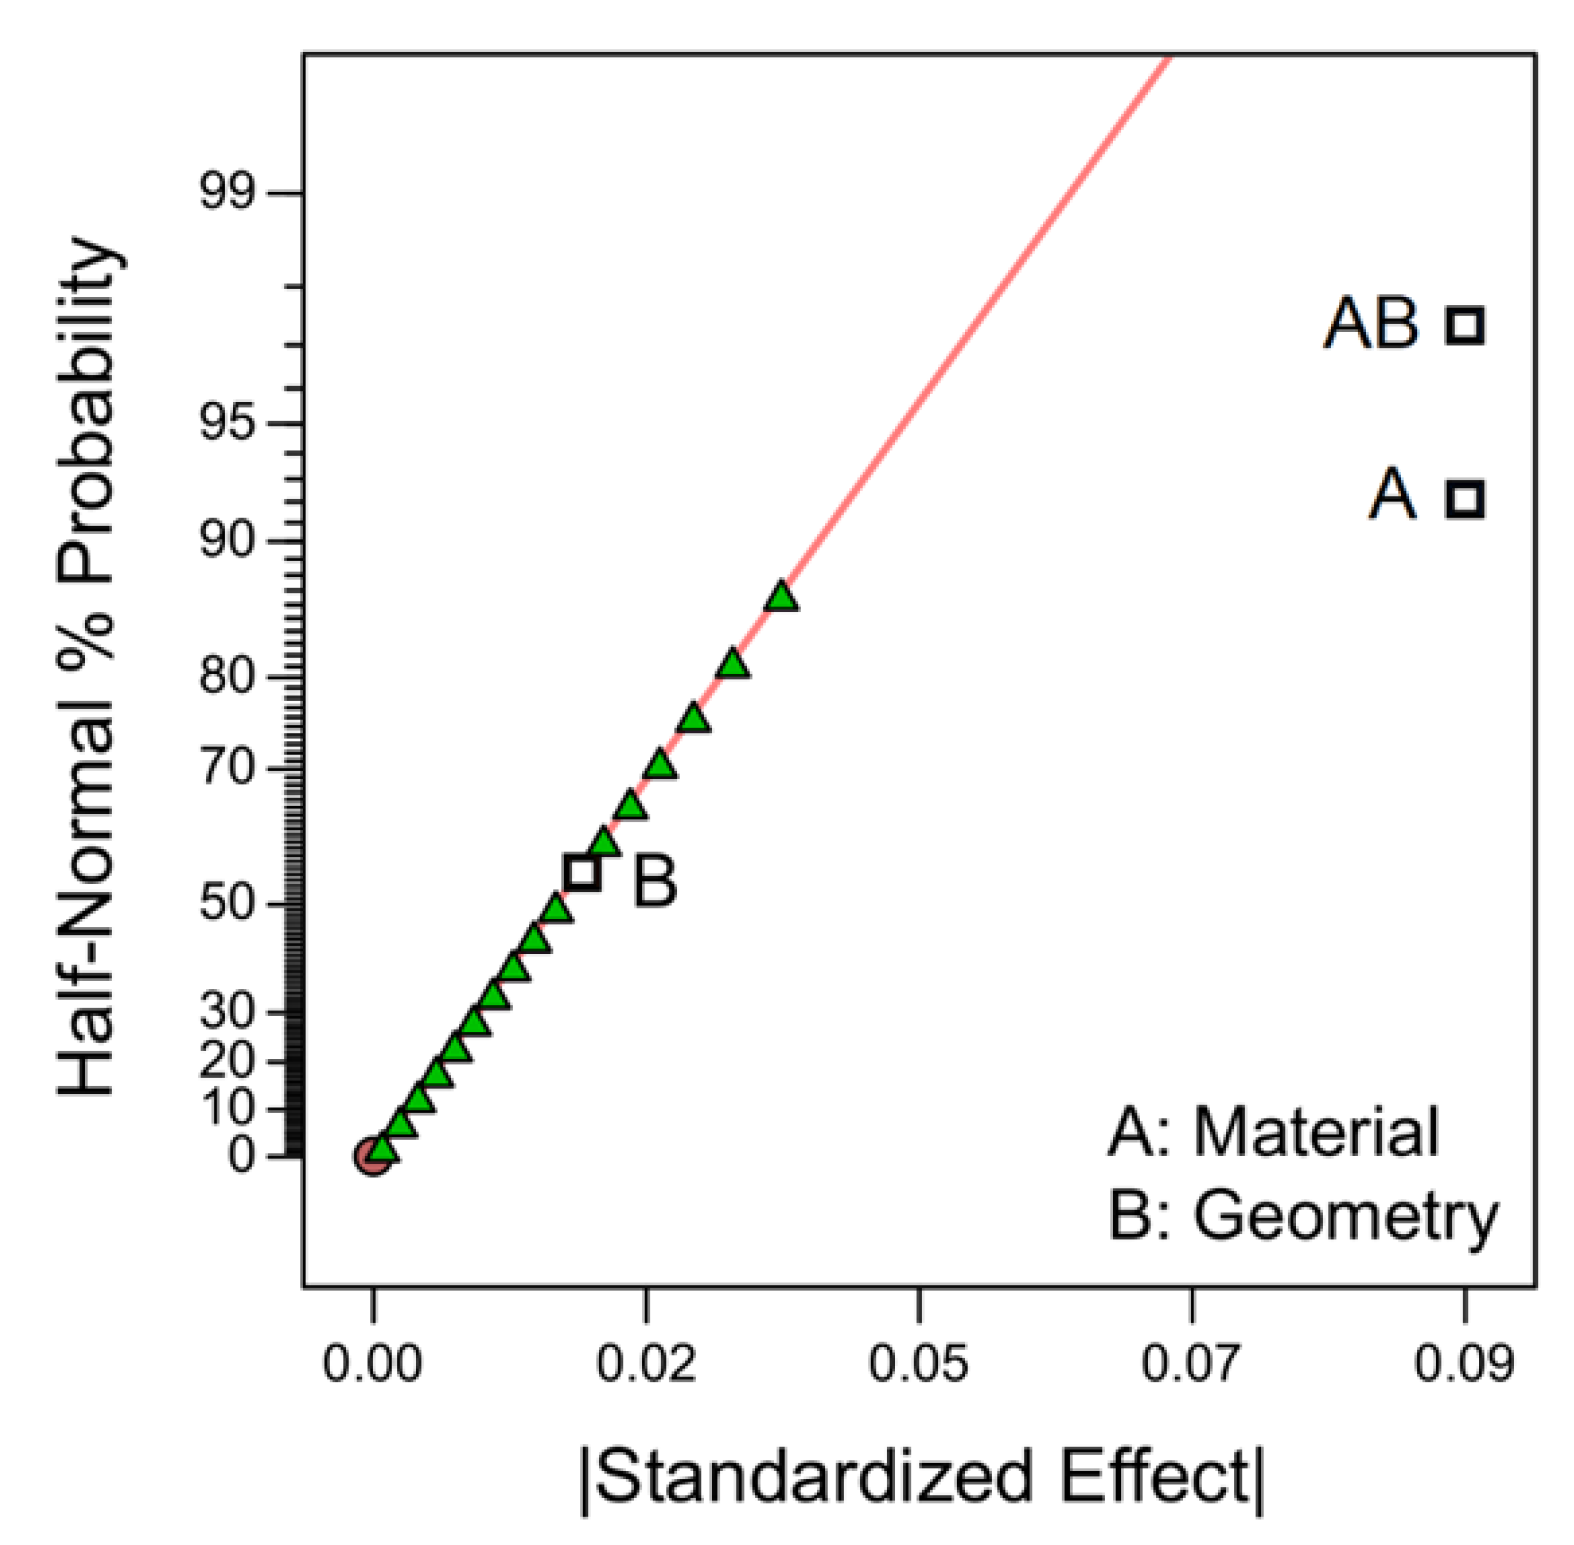
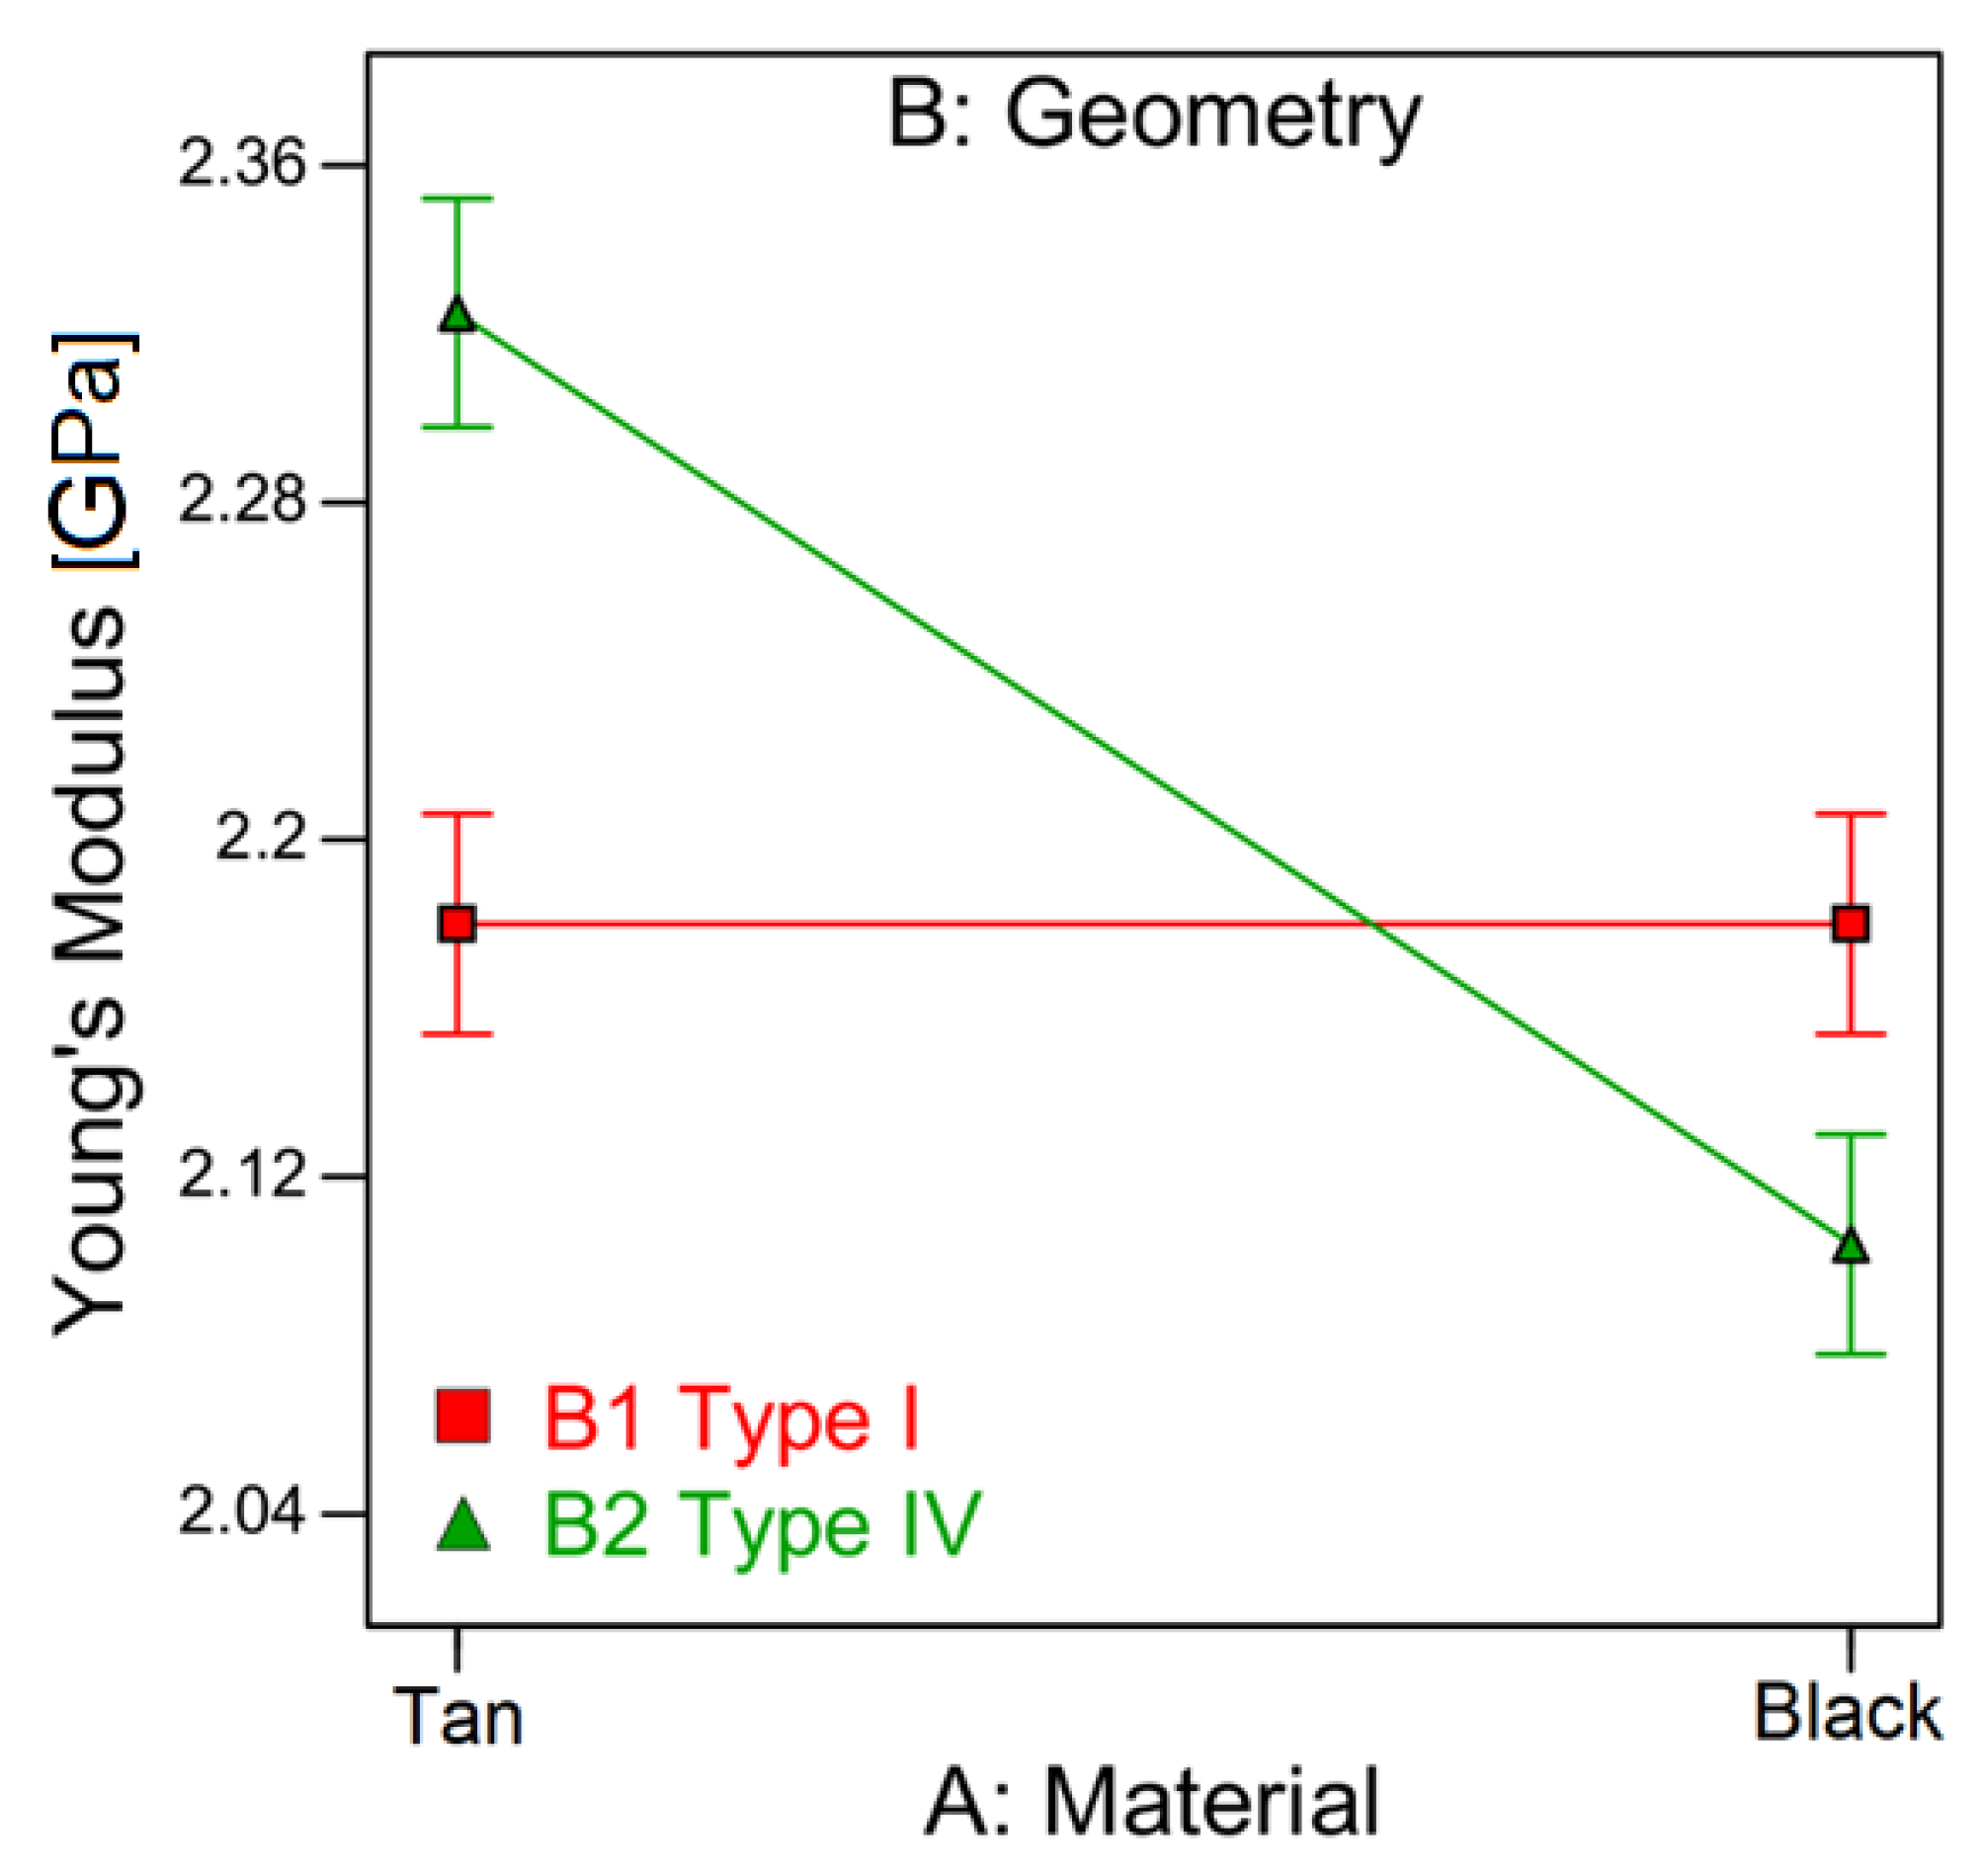
TM 9085 grades and to understand which mechanical test can be properly used for this kind of FDM™ printed, the combined effect of the material and specimen geometry on the results of different mechanical tests was investigated in our experimental study. To this end, replicated 22 screening designs were analyzed for each testing methodology. Two independent variables (factors) were considered in the study: material (factor A) and specimen geometry (factor B). Both factors were varied on two levels. The material is varied at 2 levels by printing either tan or black ULTEM
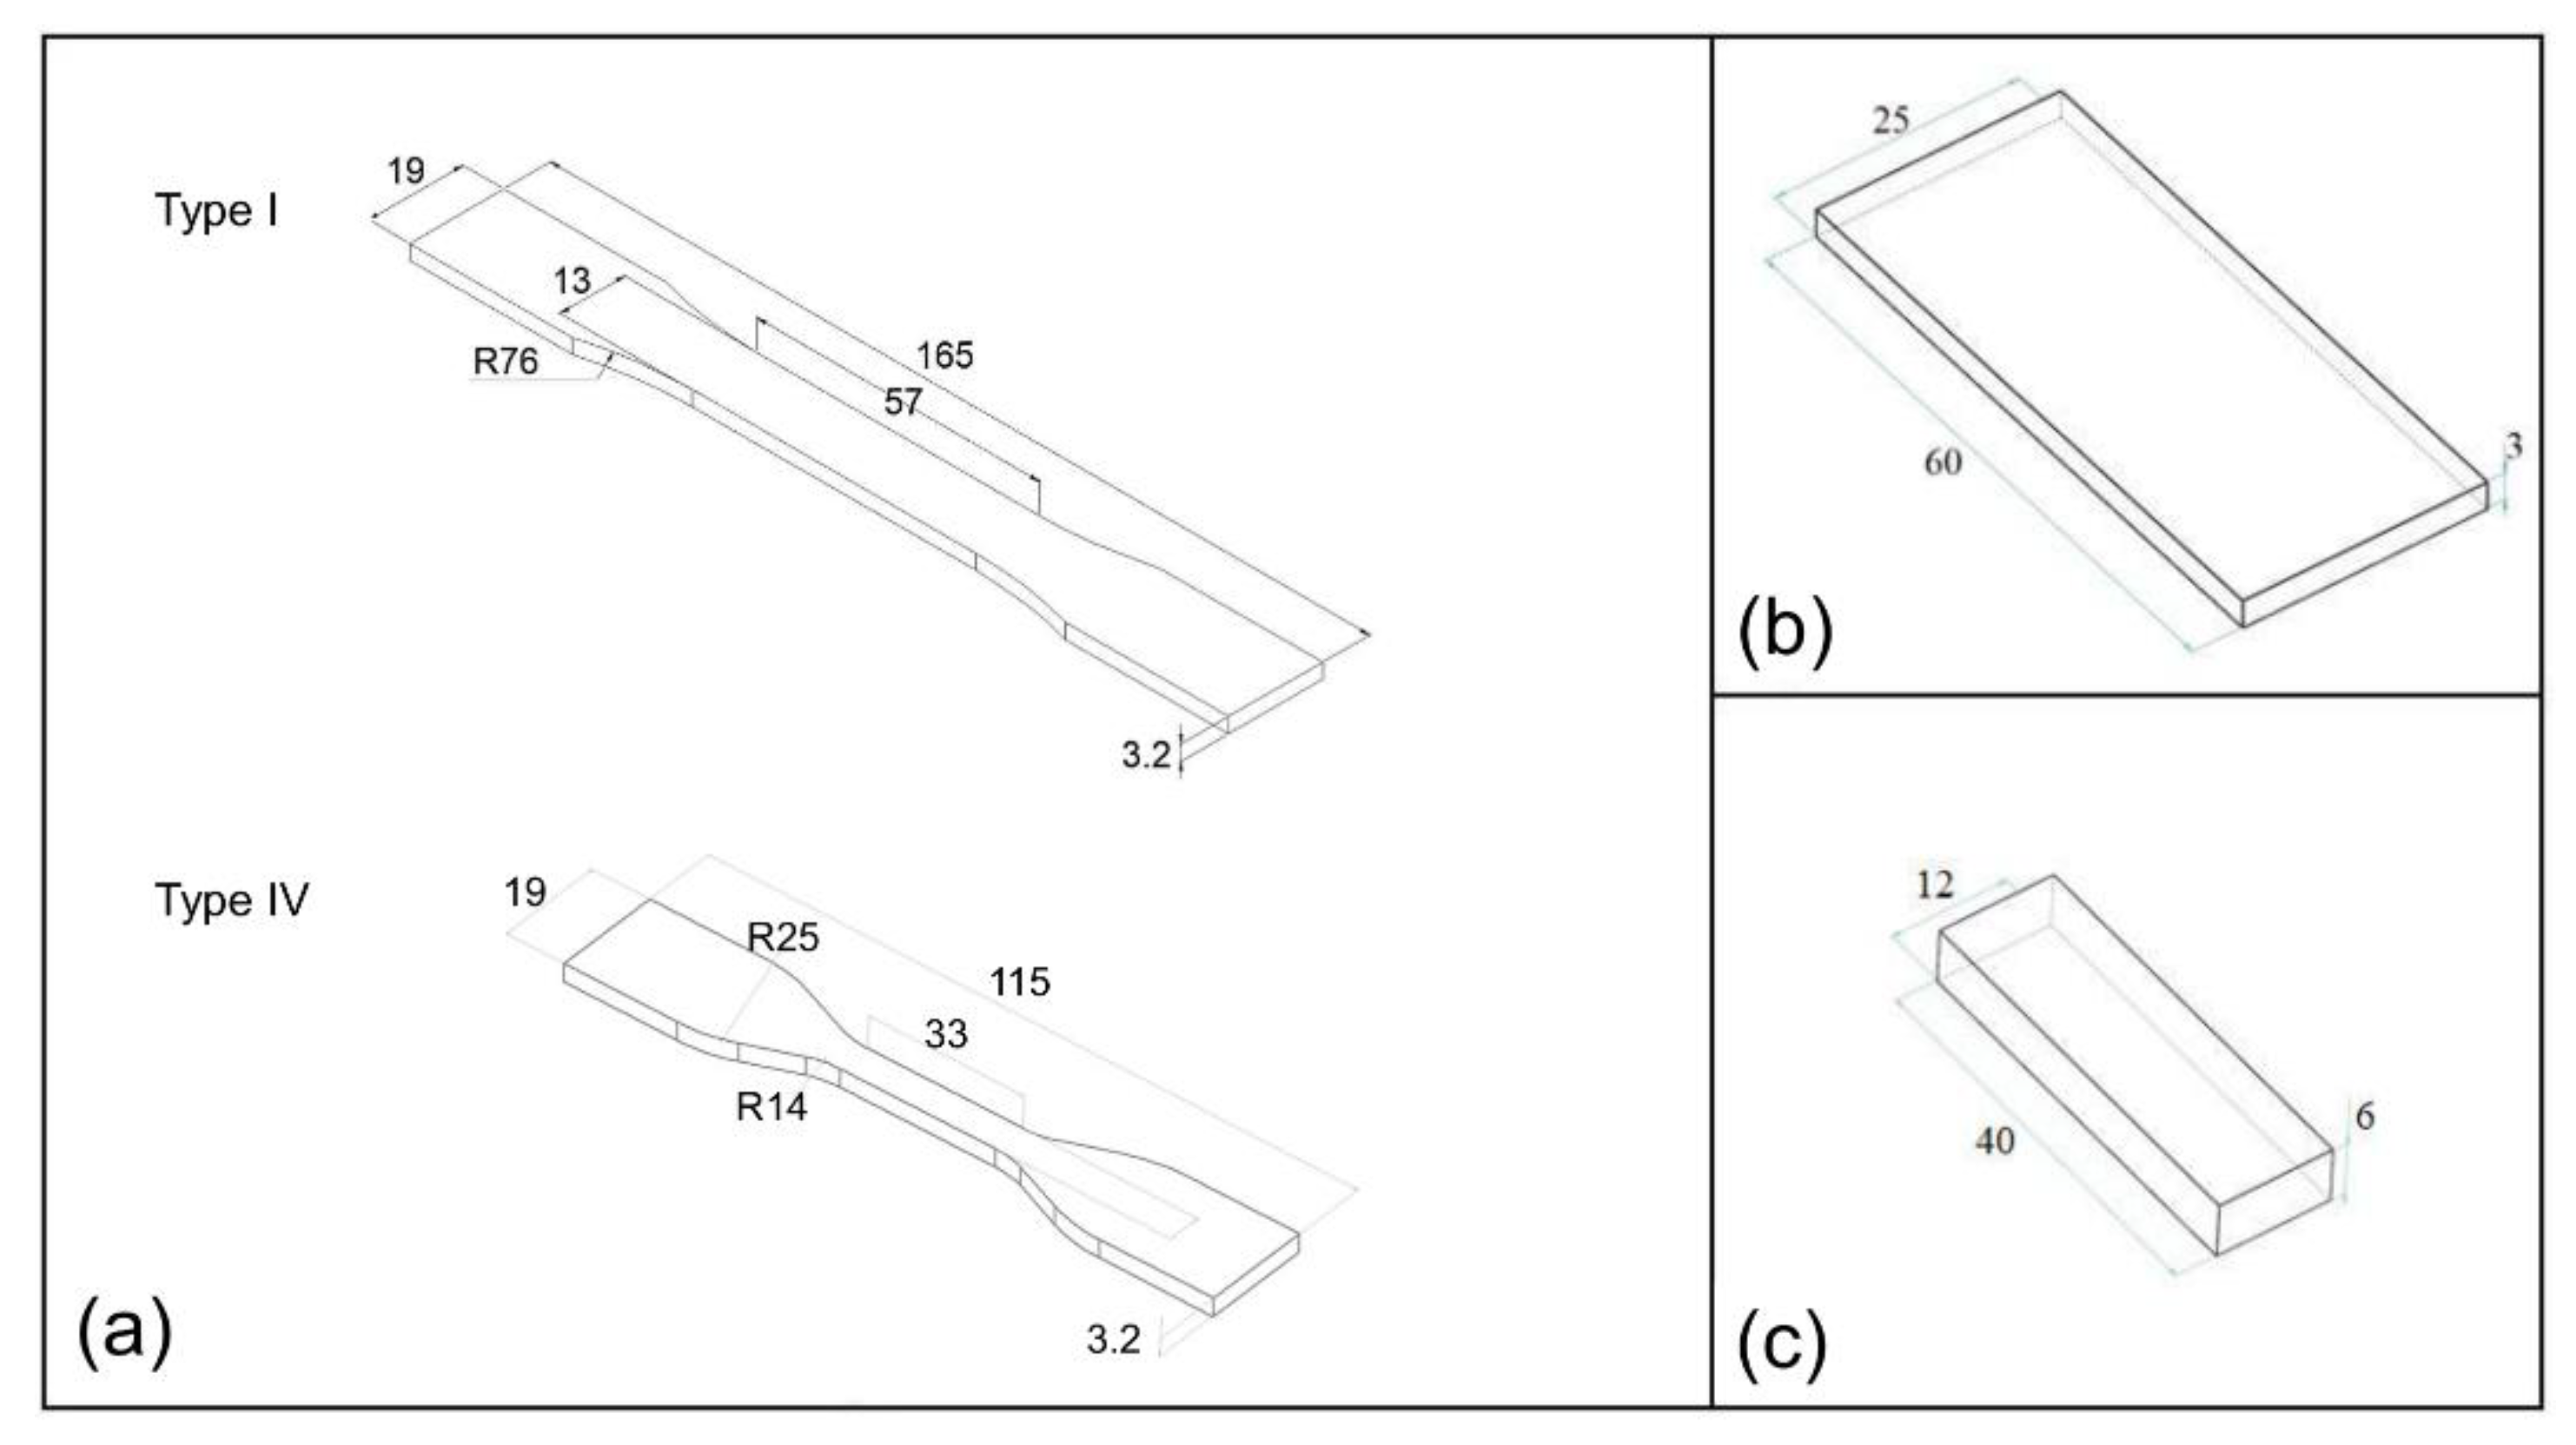
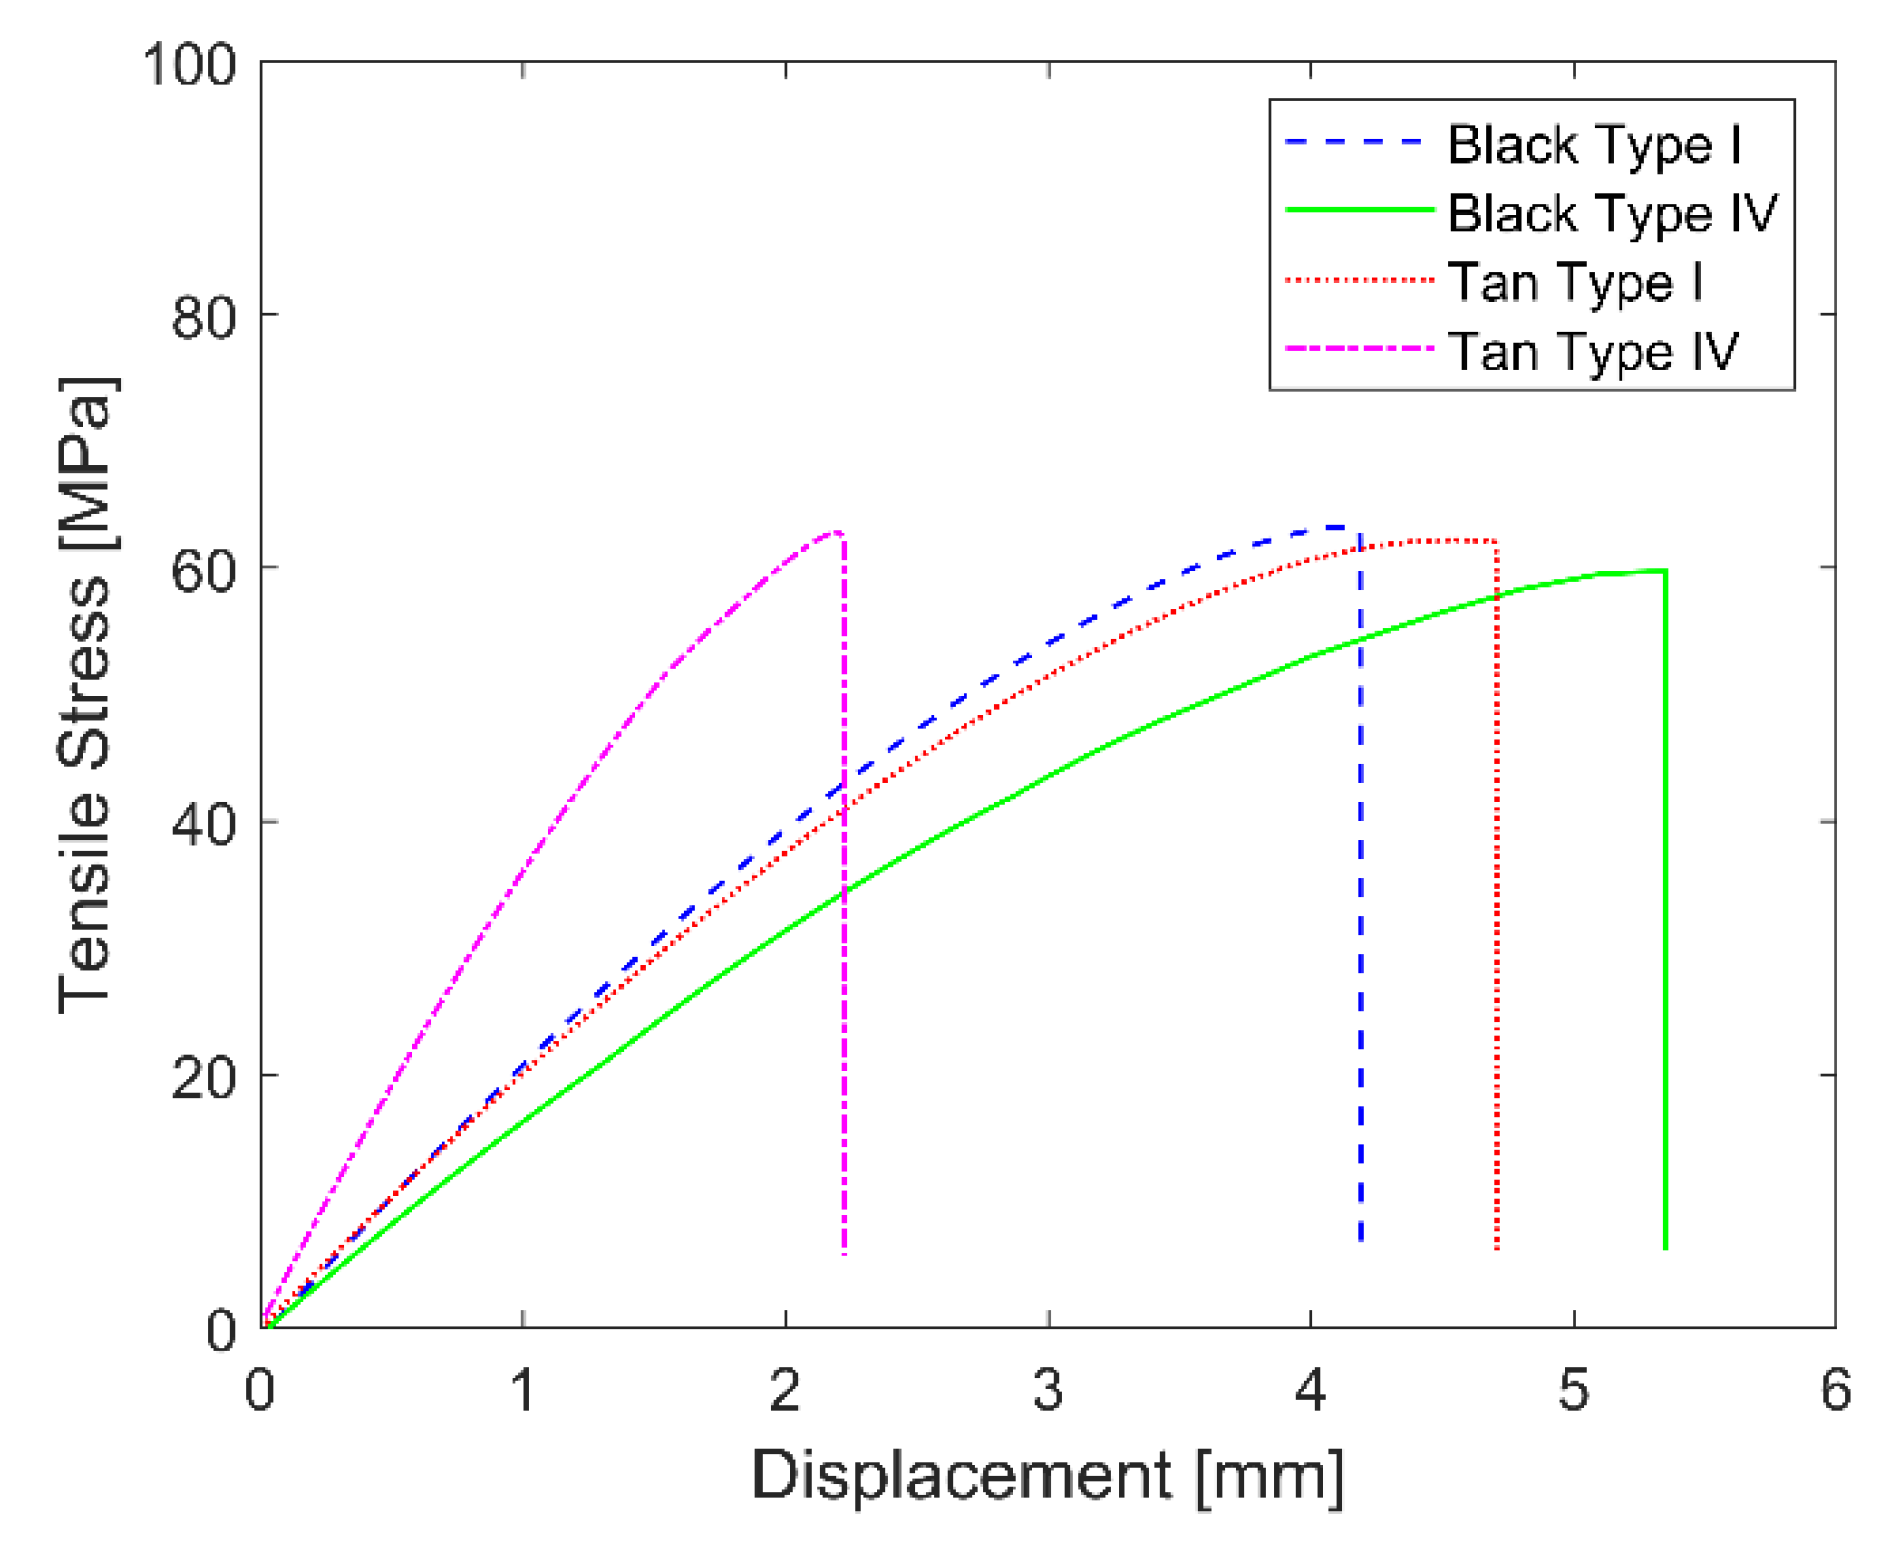
TM 9085. The b = 2 levels for the specimen geometry were selected depending on the test used to get the mechanical properties. For the tensile test (ASTM D638), the b = 2 levels correspond to the Type I and Type IV as defined by the standard. For the flexural (ISO 178) test and the short beam strength (SBS) (ASTM D2344M) test, the b = 2 levels were obtained by printing bars with different lengths (L) (i.e., L1 = 122 mm and L2 = 165 mm). The choice of these two values for L was motivated by achieving a right trade-off between the specimen length required by the tensile test and the specimen length fixed by the flexural or SBS test. The reason why we decided to investigate the effect of the specimen geometry was to consider the effect of interlayer cooling. In fact, as reported by the literature, the weld temperature decreases at a rate of approximately 100 °C/s and it remains above the glass transition temperature for about 1 s [17]. As a consequence of this cooling process, printing samples with different lengths can lead to a different temperature profile within the printed parts and, therefore, to a different interlayer bonding strength. This phenomenon is shown in [
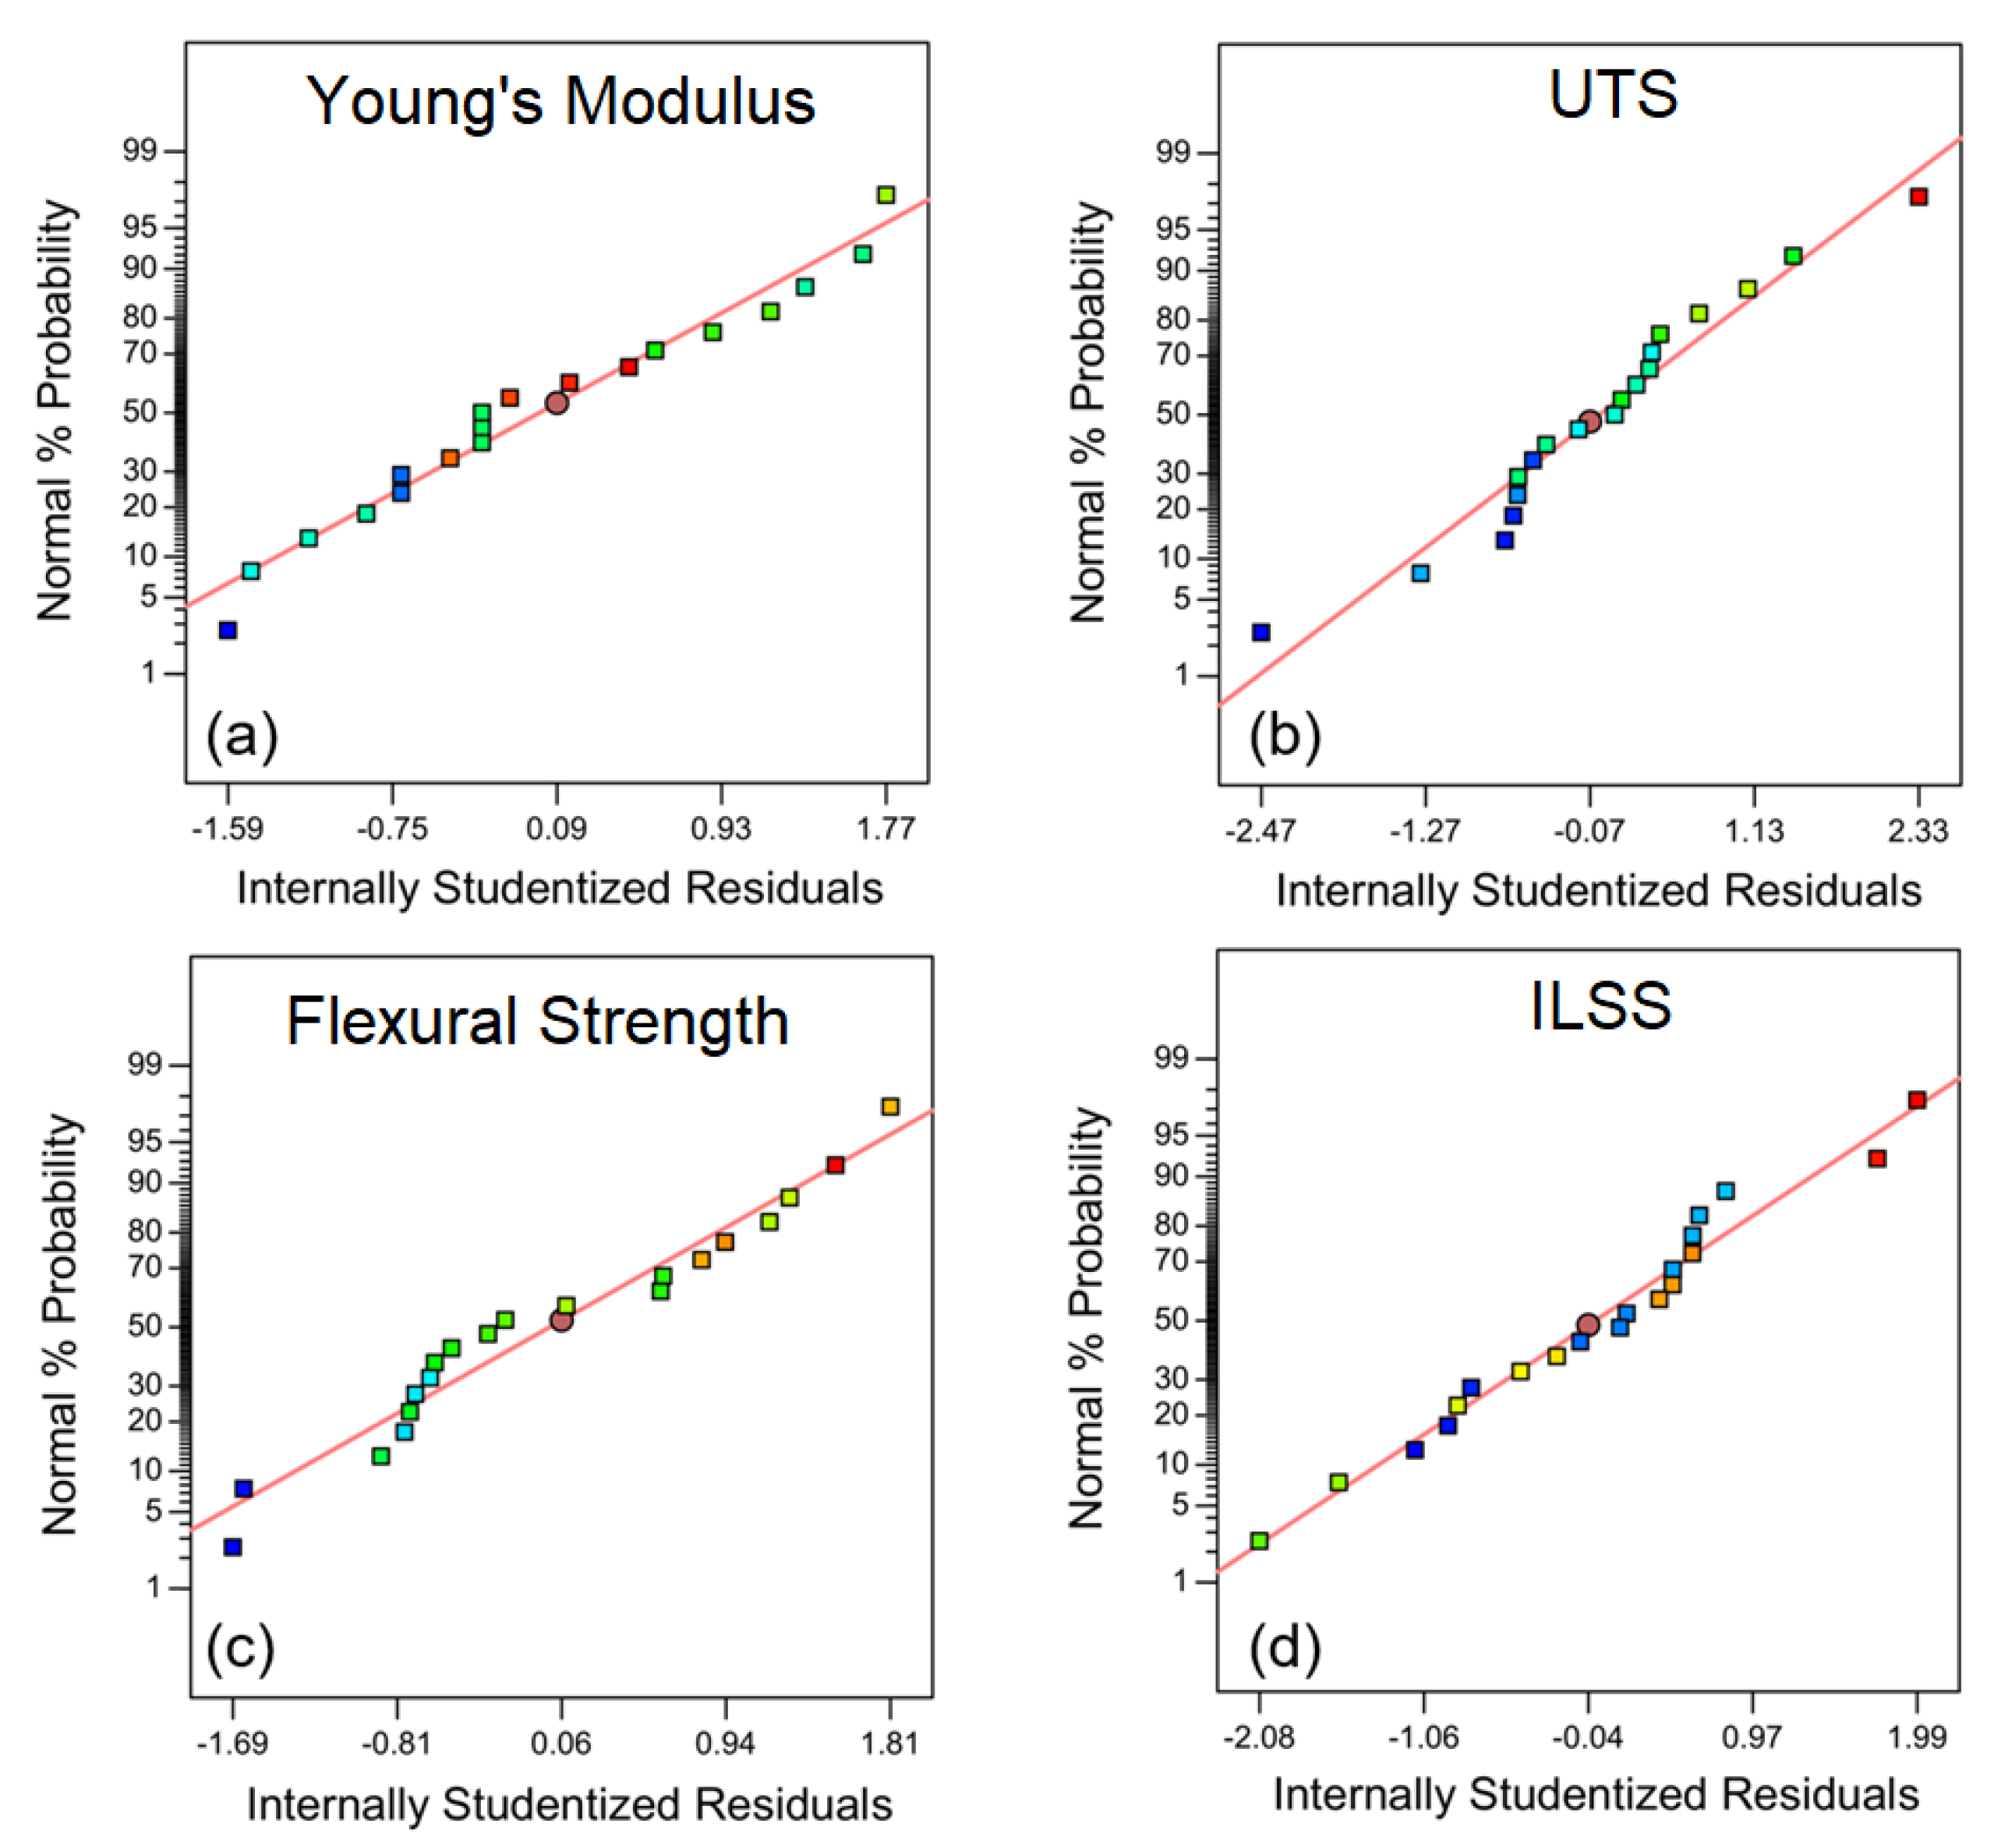
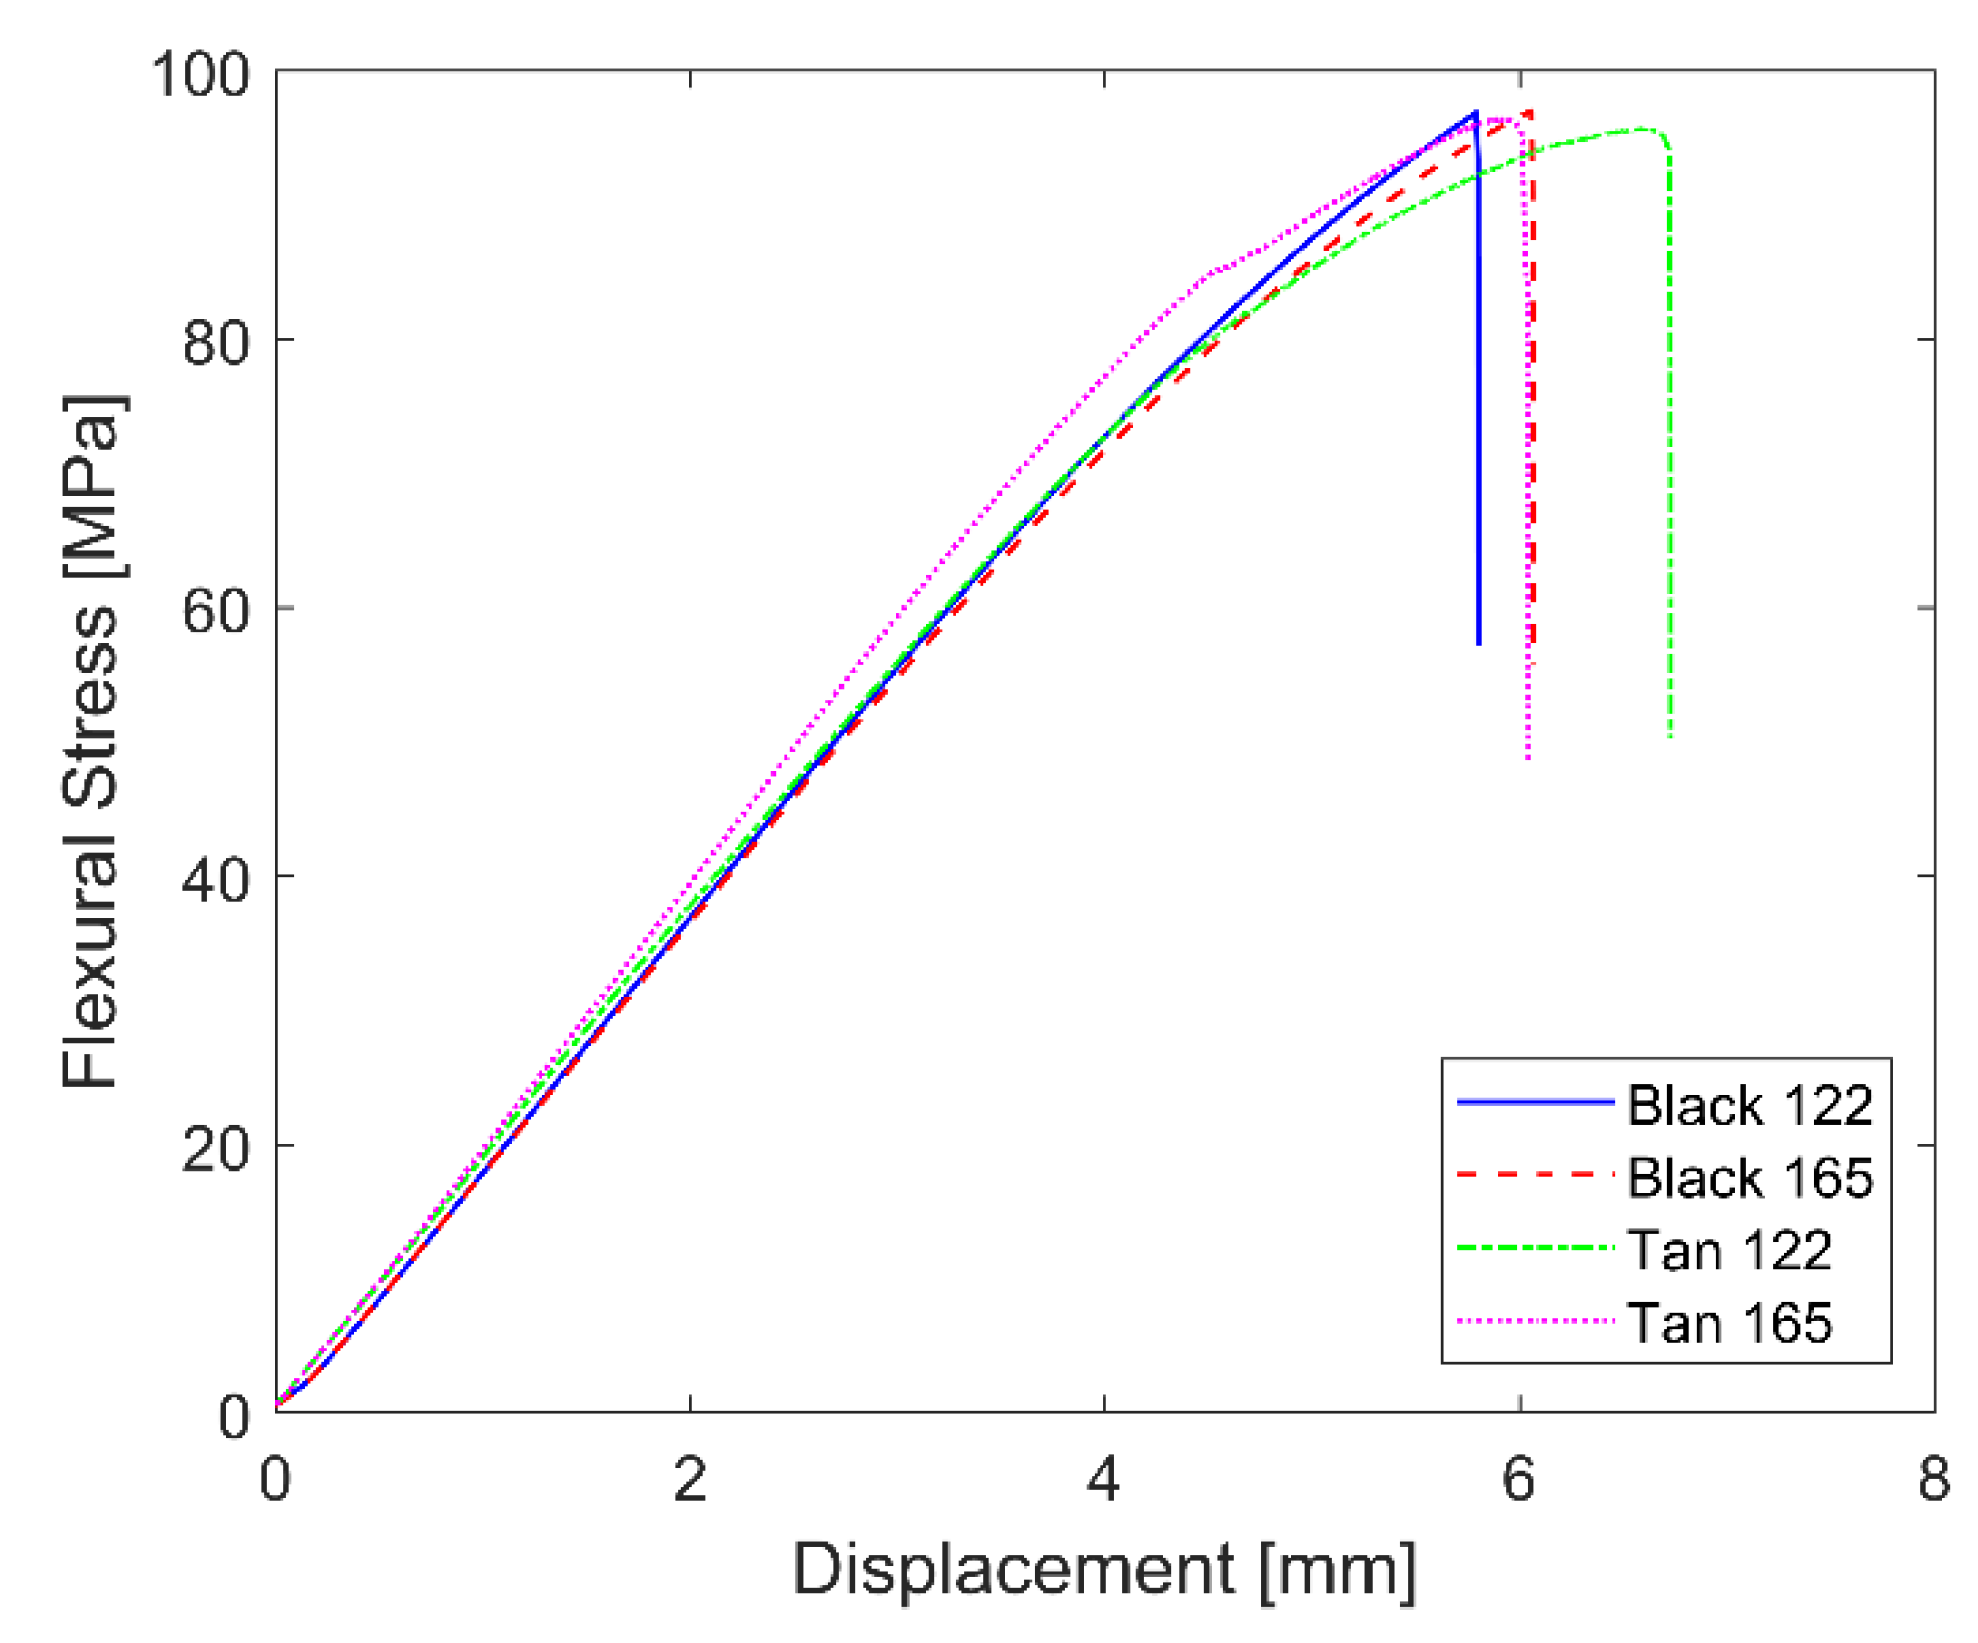
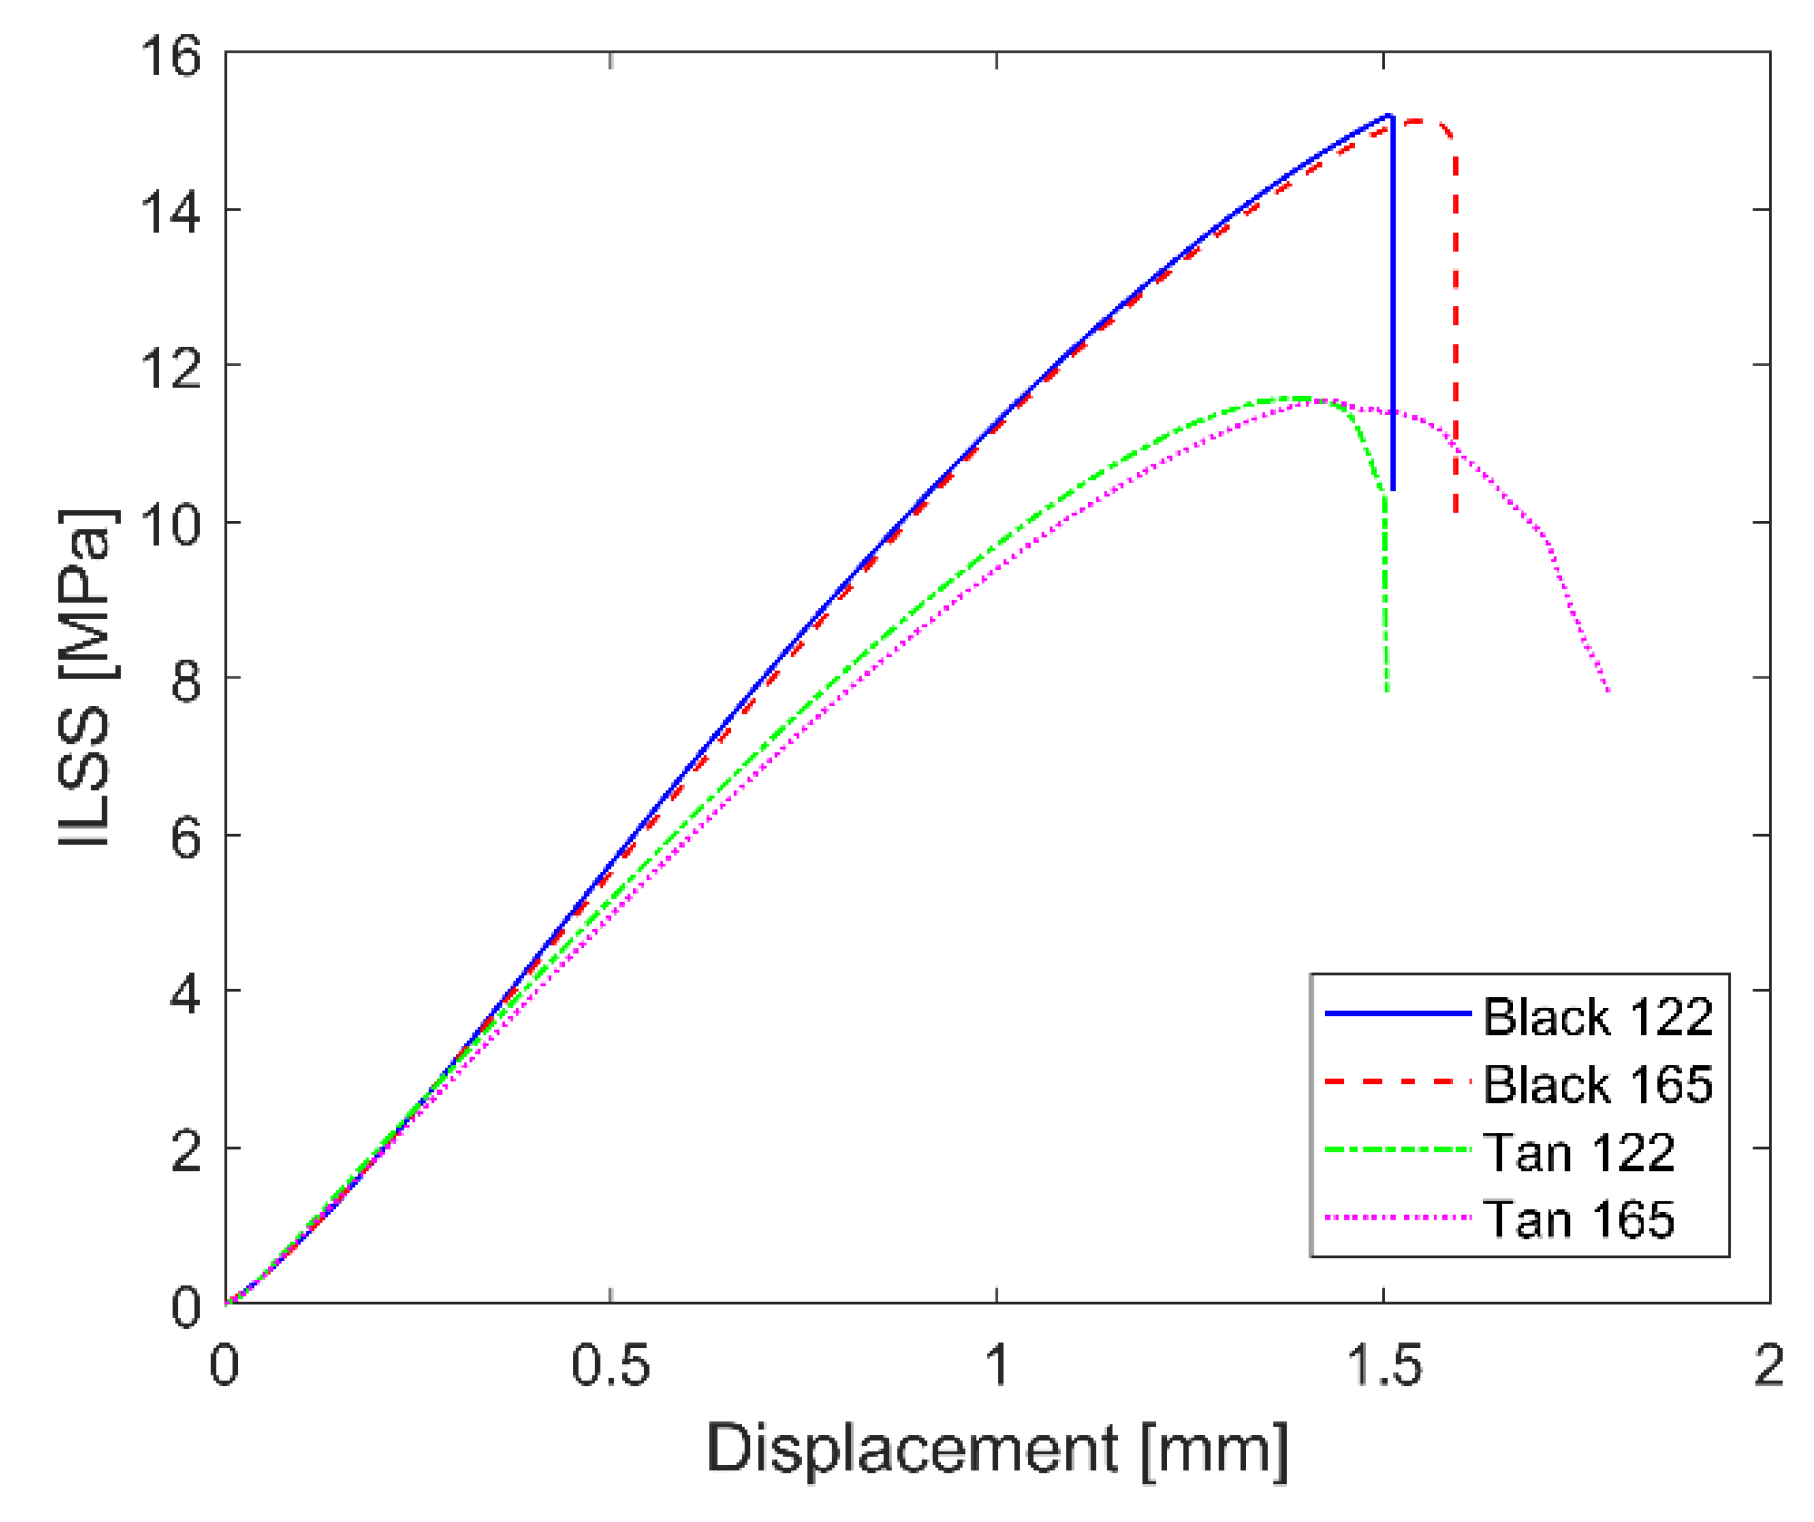
18], where the part length significantly influences the warpage due to thermal induced stresses. Once the factors (independent variables) were identified in the experimental plan, the dependent variables (responses) were selected. For the tensile test, we considered the UTS and the Young’s modulus as the responses to be investigated. Similarly, we took the flexural stress and the ILSS as responses for the flexural and SBS test, respectively. For each experimental study, the number of replications were set equal to n = 5. Therefore, N = a ⋅ b ⋅ n = 20 runs were carried out for each experimental plan. The statistical analysis of the experimental plan was performed by using the commercial Design-Expert software (Stat-Ease, Minneapolis, US). Table 1 summarizes the information about the three experimental plans.
The specimens were printed on the FDM™ machine trademarked as Fortus 400mc (Stratasys, Los Angeles, CA, USA). The printing volume is (406 · 356 · 406) mm3. The chamber is heated when printing engineering polymers such as PEI to minimize the thermal distortion.
The specimen’s geometry was printed according to the different mechanical testing standards used throughout the manuscript (Figure 1).
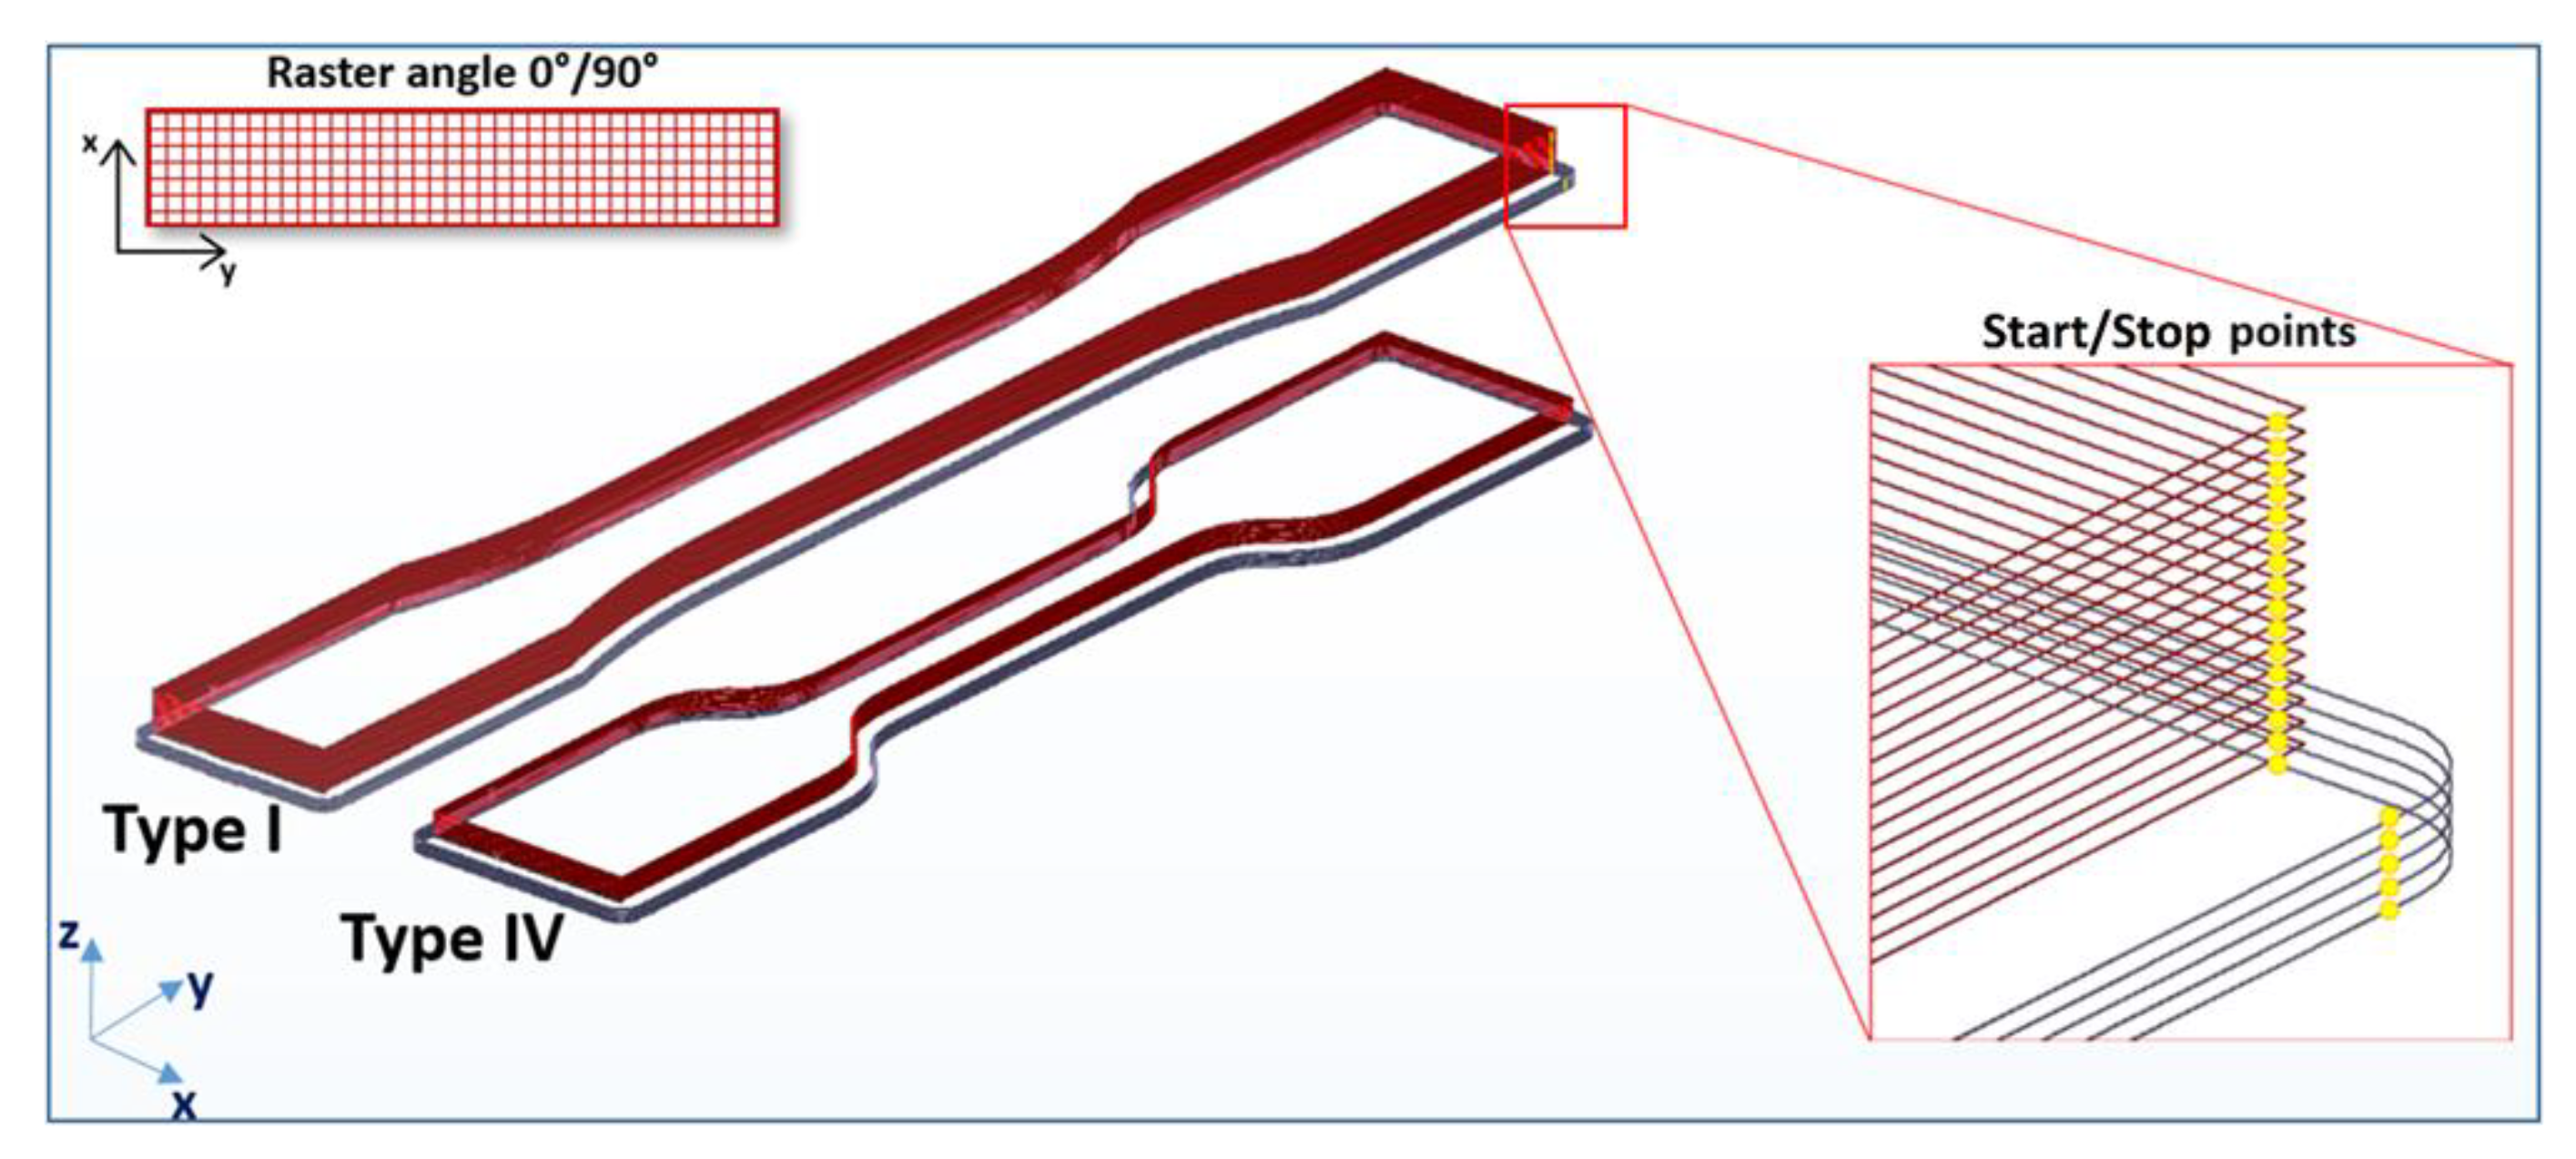
The selected printing settings are summarized in Table 2. These parameters were selected according to past experience to minimize the presence of internal voids [19]. All the specimens were oriented flatwise on the XY plane. To avoid negative notch effects leading to premature failure, as reported in some previous research [3], the start and stop positions for printing the tensile specimens were set in one corner in the grip zone (Figure 2).
The viscoelastic behavior of the two material types was investigated using a DMA Tritec 2000 (Triton Technology Ltd., Nottinghamshire, UK) by single cantilever geometry and sample size (10 · 5 · 2) mm3. The tests were carried out at 1 and 10 Hz with 2 °C/min heating rate from 25 °C to 250 °C.
A Shimadzu DSC 60 (Shimadzu, Kyoto, Japan) was used for calorimetric glass transition temperature (Tg) determinations. The apparatus was calibrated in enthalpy and temperature by following the procedure discussed in [20]. Afterwards, the enthalpy calibration was checked by the melting of fresh indium, showing an agreement with the literature standard within 0.25% [21]. This happened while the temperature calibration was checked by several scans with fresh indium and tin, showing an agreement within 0.08% with respect to the literature values [21]. The DSC scans have been performed on samples of about 6.0 · 10−3 g, held in sealed aluminum crucibles at a heating rate of 10 °C/min and static air atmosphere. The investigations were carried out in a range of temperatures from room temperature up to 300 °C and each scan was performed in triplicate. The considered values were averaged from those of three runs, the maximum difference between the average and the experimental values being within ±1 °C.
The mechanical properties of printed specimens were measured by using an Instron 5985 universal testing machine (Instron, Milan, Italy) equipped with a load cell of 10 kN. For each test, the tools required for the various standard tests were installed. System control and data collection were performed using the Blue Hill 3.61 software (Instron, MA, USA). Following the DoE method, we randomized the testing order for all samples and test types.
Tensile specimens were tested according to ASTM D638. The test was carried out in strain control mode at a speed of 2 mm/min, using a clip extensometer with 25 mm useful length. Tensile specimens were printed with Type I and Type IV geometry, as specified in the ASTM D638 standard (Figure 1a).
The flexural test (ISO 178) was performed with (60 · 25 · 3) mm3 samples (Figure 1b) and a span length (distance between supports) equal to 48 mm. The tests were conducted at a speed of 2 mm/min. The flexural samples were obtained by cutting bars with length equal to 122 mm and 165 mm in pieces having a standard length of 60 mm.
For the ILSS (ASTM D2344M), samples of size (40 · 12 · 6) mm3 were considered, with a span length of 24 mm (Figure 1c). ILSS tests were carried out at a speed of 1 mm/min. The ILSS samples were obtained by cutting bars having length equal to 122 mm and 165 mm in pieces with a standard length of 40 mm.
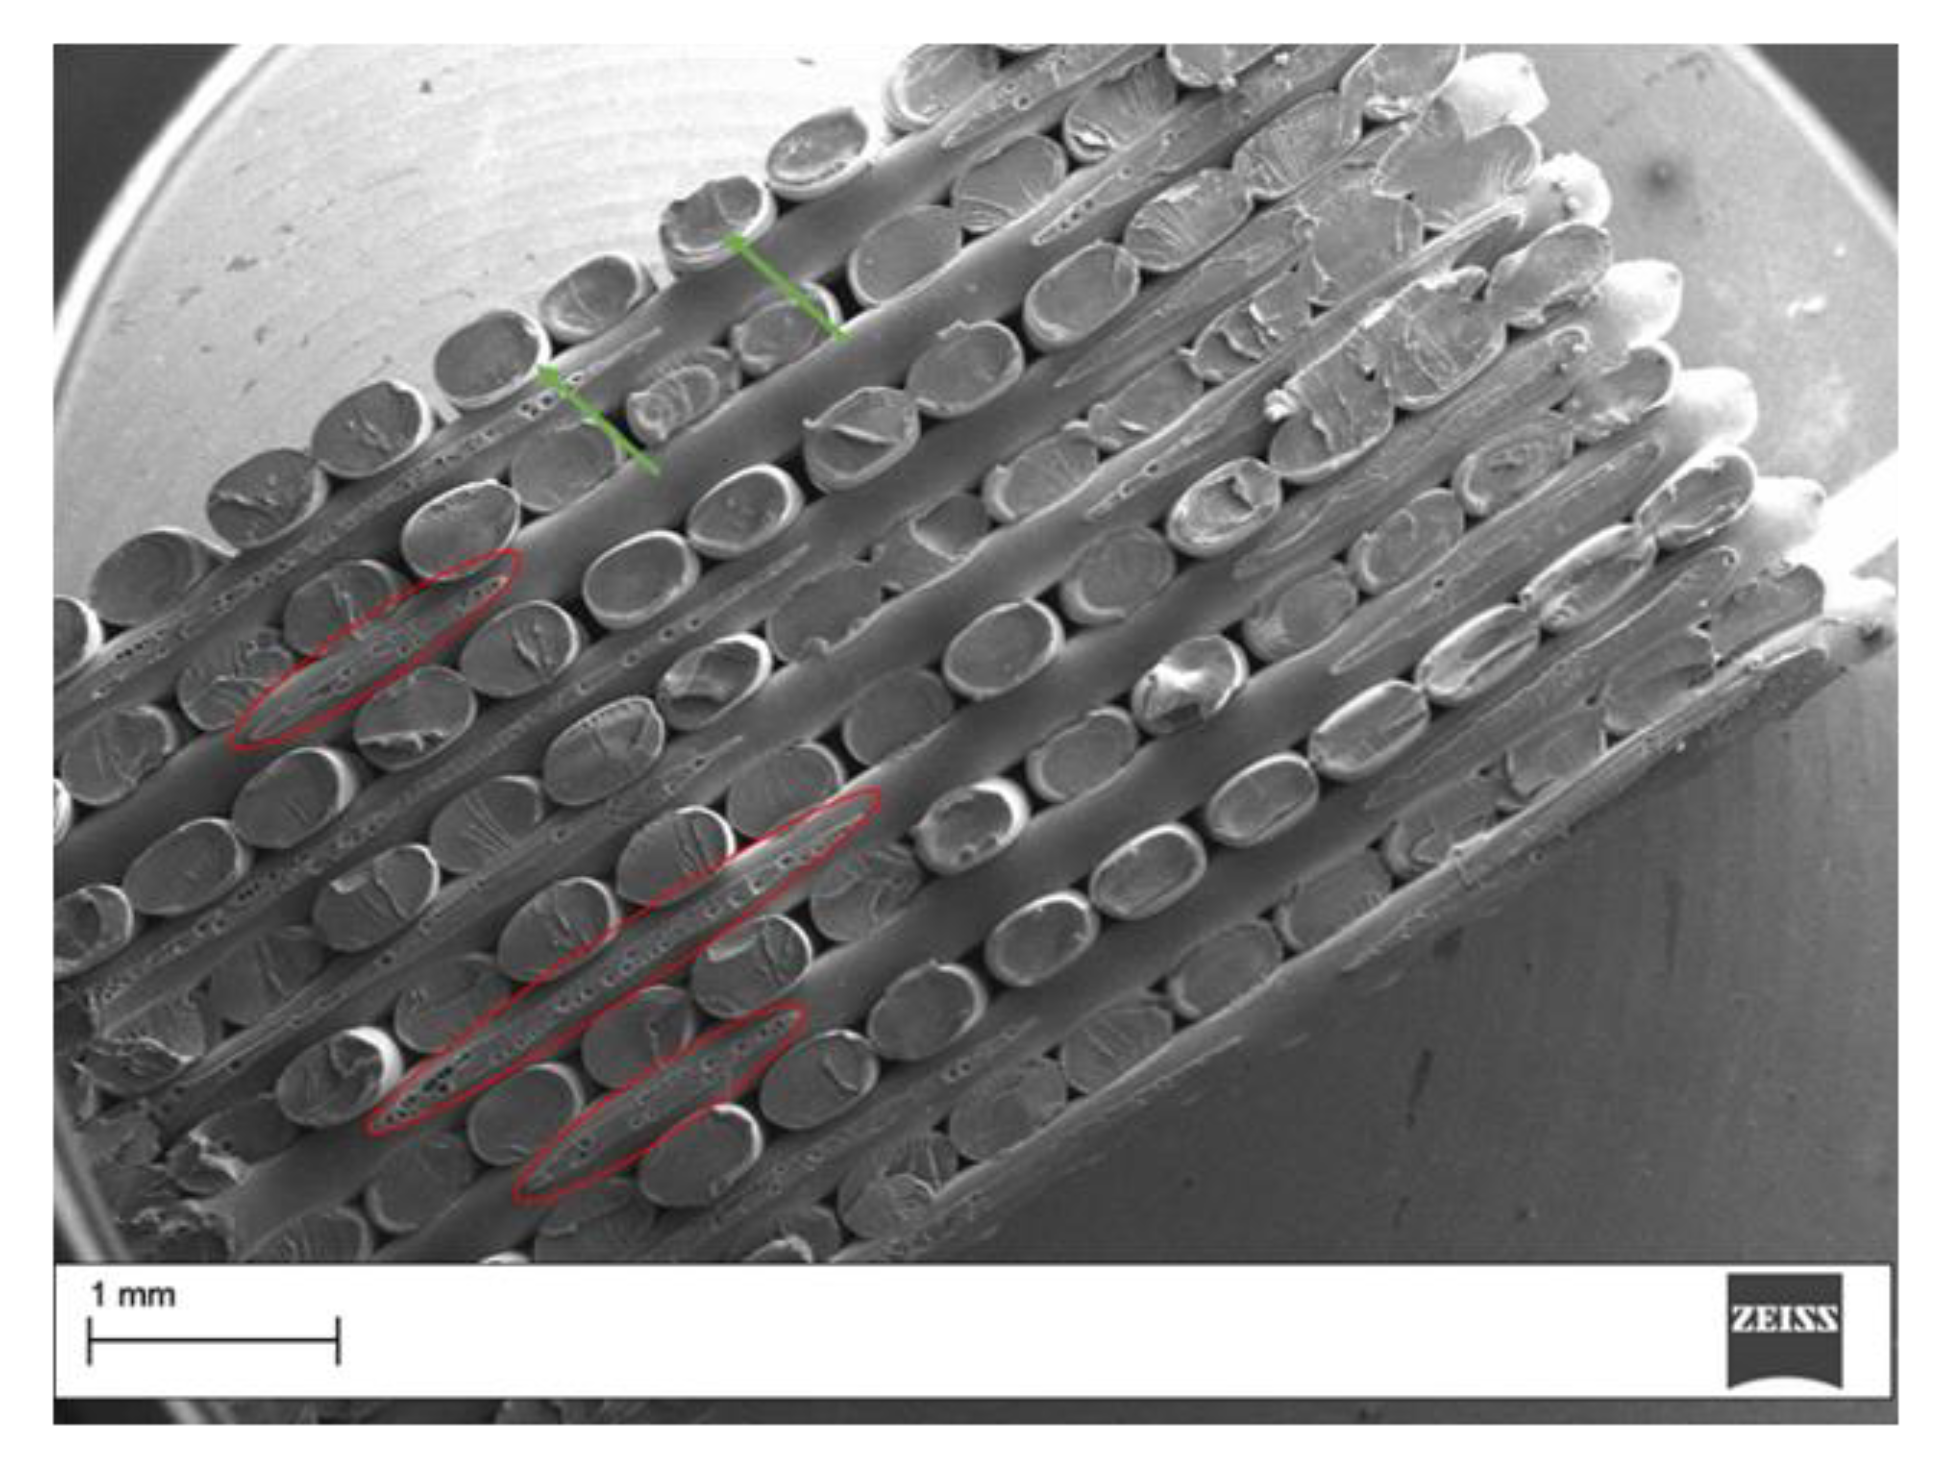
Scanning electron microscopy micrographs were obtained with a SEM EVO-MA15 by Zeiss, Cambridge (UK). The fractured surfaces were sputter coated with gold before the SEM micrograph was taken.

3. Results and Discussion

3.1. Thermal Characterization

A preliminary study on tan and black ULTEMTM 9085 materials was carried out to define the difference in terms of viscoelastic and thermocalorimetric behavior. Previous tests on ULTEMTM 9085 have shown that it is a PEI modified polymer containing a copolymer for improved flow [16]. The tan versus temperature plot is reported in Figure 3 for both polymers. A wide peak at 185 °C and a shoulder at 140 °C were observed for the tan sample. For the black sample, the peak and the shoulder shifted to 195 °C and 148 °C, respectively.
DSC data showed similar results for tan and black materials, with a glass transition observed at around 180 °C (Figure 4). The tan sample showed two distinct thermal transitions while only one was observed for the black resin. Similar results for PEI blends were observed in the past [22]. However, the DSC test seems unable to clearly resolve the thermal transitions as observed in the DMA test, despite the fact that the behavior is also different for the two grades for this analysis.
The thermal analyses reported here show that the two materials have a different behavior despite being quite similar in composition. Filament pigmentation was reported to impact on the finish and the mechanical behavior of PLA based filaments [23,24,25,26]. However, similar data were not reported previously for PEI based filaments. Therefore, the study was continued by characterizing the mechanical behavior of the printed parts with the two materials.

3.2. Mechanical Characterization

The mechanical characterization of the investigated materials requires the implementation of a proper test. Unfortunately, an accepted international standard specifically developed for the testing of the mechanical properties of FDM™ printed parts is not available yet. For this reason, we considered and compared the performance of three well-known mechanical tests available in the literature for other fields of application. The objective was finding a proper test for characterizing the two 3D-printed ULTEM™ XY material types by analyzing different experimental plans.

3.2.1. Tensile Testing

After generating the experimental plan and collecting the response observations (Table S1) of the tensile test according to the ASTM D638 standard (UTS and Young’s modulus), an ANOVA study was performed using the Design-Expert software. Randomization was used for the testing sequence, as reported in Table S1 in the Supplementary Material. The average tensile stress of the five tested samples versus displacement curves are shown in Figure 5. All the tested specimens showed brittle failure with no yielding. The UTS varied in the range between 48.99 MPa and 61.98 MPa for the two materials. Young’s modulus varied in the range between 2.05 GPa and 2.34 GPa. The measured tensile properties were similar to those reported in other papers focusing on ULTEMTM 9085 [16,27,28,29]. Zaldivar et al. [29] showed tensile strength values varying from 46.83 MPa for flat samples to 71.03 MPa for on-edge samples. The tensile modulus varied from 1.77 GPa to 2.48 GPa. In this study, the raster orientation varied from 90° to 0°. Similarly, Byberg et al. [28] reported tensile strength values from 31.30 MPa to 70.60 MPa. FDM™ samples show lower mechanical properties, in particular the UTS reduction ranges between 20–40% and the strain of about 2% [30]. These findings depend on the presence of voids and on the thermal history of the printed samples when compared to injection molded specimens.
The Analysis of Variance (ANOVA) table for Young’s modulus response is shown in Table 3. Model adequacy checking on the residuals from the analysis did not show any anomaly, as shown in Figure 6 The material type (factor A) is an influential factor (p-value < 0.001) on Young’s modulus (Figure 7, Table 3) and it is involved in a significant interaction AB (p-value < 0.001) with the geometry (factor B) (Figure 8). The model appears to have a good robustness to define the observed response with a high R-squared value of 0.8368. Conversely, when the UTS response is considered as the response variable, the ANOVA analysis shows that the material and the geometry factors do not influence it (Table 4). The tensile test is actually unable to characterize the ultimate tensile strength (UTS) for the two materials, as revealed by the very low R-squared value of 0.0764 We explain this finding by considering that the tensile test for flatwise printed specimens is not as sensitive to the interlayer bonding as it is for the upright orientation case where interlayers are directly loaded. In fact, for flatwise samples the longitudinally oriented rasters can sustain applied loads.
ULTEMTM 9085 displayed a structure with a clear distinction of the deposited filaments that are not completely bonded and melted together (Figure 9). Therefore, testing methods that account for the interlayer bonding resistance should be used to fully characterize the mechanical behavior of the material. The morphological analysis of the fractured specimen reveals other features. The longitudinal rasters that were aligned along the tensile load show a deformed cross section with some yielding before failure (see green arrows), and the transverse rasters were not deformed and there were some zones where adhesive failures occurred (see red ellipses). It is important to notice that the yielding occurs locally and for the longitudinal raster only. This is not reflected in the macroscopic behavior of the samples as shown in Figure 6. Compared to other studies, the level of fiber-to-fiber fusion seems lower for the analyzed specimen [29]. Crack propagation seems to also depend on the raster orientation [31]. This analysis highlights the importance of characterizing the interlayer bonding for these samples.

3.2.2. Flexural Testing

The ISO 178 flexural test is considered as a testing method allowing some of the limitations of tensile testing to be overcome because of the absence of severe constraints due to the clamping of the samples [32]. The flexural test investigated in this study was not applied to a tubular geometry as in Kuznetson et al. [32], but it was performed according to the standard ISO 178. The reason for this choice is that the tubular geometry limits the possibility of varying raster orientation in the printed sample. Therefore, the standard ISO 178 geometry was used, as reported in Figure 1, allowing us to use the same raster orientation as for the samples subjected to tensile load. The experimental curves obtained from the flexural test do not show any significant differences between specimens obtained from bars printed with different lengths (Figure 10). The readings of maximum flexural stress varied in the range between 77.48 MPa and 108.02 MPa for the two materials (Table S2). Gebisa et al. [27] in their study reported flexural stresses varying from 52.89 MPa to 126.30 MPa. Although the material type seems to be the only relevant factor (p-value = 0.0379) in this experimental study (Table 5), the small R-squared = 0.22 and adjusted R-squared = 0.17 values obtained from the ANOVA analysis shows that only a small fraction of total variability measured in the flexural stress is due to the investigated factors. Similarly to the tensile test, this reveals a high level of noise affecting the flexural stress which dramatically affects the test sensitivity when applied to FDM™ printed specimens. This result can be explained by the fact that the shear stresses developing within the specimen during a flexural test can influence its results. For this reason, its effect is minimized in the ISO 178 standard by fixing the ratio (r) of support length (LS) to the specimen height (h) to be equal to 16 [33]. Clearly, this condition is not favorable for the purpose of the mechanical characterization of FDM™ samples where the interlaminar bonding—whose resistance can be tested by the presence of shear stress—plays a relevant role on the mechanical properties of the specimens.

3.2.3. Short-Beam Shear Testing

Among the different test options typically used to characterize fiber-reinforced polymers, the SBS test is a valid option to easily determine the ILSS. For this test, the span-to-thickness ratio is fixed at values in the order that the occurring shear stresses within the specimen are high compared to the normal stresses generated by the bending moment [33]. The average ILSS versus displacement curves obtained for the ULTEMTM 9085 samples are shown in Figure 11 (also see Table S3). From these curves, it is immediately evident the effect of the material type, with the black resin showing higher SBS than the tan resin. For all the tested specimens, the readings of SBS varied in the range between 11.82 MPa and 16.74 MPa. The results of the ANOVA analysis for the experimental plan and the normal probability plot of the effects are shown in Table 6 and Figure 12, respectively. Model adequacy checking on the residuals from the analysis did not show any anomaly. As expected, the material type is clearly the influent factor (p-value < 0.0001) on the ILSS. Neither the geometry nor the second-order interaction between the material type and geometry were significant. However, a very high portion of variability (more than 90%), is found for the material type with R-squared = 0.92 and adjusted R-squared = 0.92. The main effects diagram shown in Figure 13 on the material type factor clearly shows its influence. The two black square points and the intervals on the diagram correspond to the average of the ILSS observations and the 95% confidence intervals for the mean ILSS for tan and black, respectively. The same result was obtained when plotting the main effects diagram for level 165 mm (not shown here).

4. Conclusions

This paper focused on the characterization of two grades of commercial PEI-based filaments used for FDM™, which are tan and black aerospace qualified ULTEMTM 9085. The study of the two materials included both their thermal and mechanical characterization. From the thermal analyses (dynamic mechanical analysis and differential scanning calorimetry) we found that the two material types show a significantly different temperature-dependent behavior. Regarding the mechanical characterization, the absence of a proper test for FDM™ printed specimens led us to the comparison of three different tests: tensile, flexural and short-beam shear. Design of experiment techniques were used to perform the experimental study. An industrial machine (Fortus 400mc) was used for printing high quality specimens. Among the three investigated tests, only the short-beam shear test was able to sufficiently discriminate between the material types. This result strictly depends on the test configuration that privileges the effect of the shear stress internal to the specimen under the loading condition, and the key role played by the interlaminar bonding in the mechanical properties of FDM™ printed parts.
More research is needed to address the correlation between printing parameters and the mechanical properties of printed materials. The need for improving the understanding of correlations and for enlightening the anisotropic behavior is of utmost importance in view of the increased use of reinforced materials in FDM™ to satisfy the need for structural components. Mechanical tests such as double cantilever beam (DCB) or end-notched flexure (ENF) test could also be considered in future research in view of designing a new test standard for FDM™. Additional improved tensile testing with geometries specifically designed to account for material’s orthotropy and FDM™ building procedures should be developed. Tapped tensile specimens normally used for fiber reinforced samples could be a solution worth investigating. In terms of future applications, properly developed testing methods would allow for data sets that are useful for easy design of available parts. A standardized test is also needed to have robust techniques for the validation of materials for FDM™ under development.

Supplementary Materials

The following are available online at https://0-www-mdpi-com.brum.beds.ac.uk/2076-3417/10/9/3195/s1: Table S1, Table S2 and Table S3.

Author Contributions

Conceptualization, G.C. (Giovanni Celano) and G.C. (Gianluca Cicala); methodology, G.C. (Giovanni Celano); software, C.T.; investigation, C.T, L.S., I.B. and E.P.; writing—original draft preparation, G.C. (Giovanni Celano), G.C. (Gianluca Cicala), C.T.; writing—review and editing, G.C. (Giovanni Celano) and C.T.; supervision, G.C. (Gianluca Cicala); project administration, G.C. (Gianluca Cicala). All authors have read and agreed to the published version of the manuscript.

Funding

This research was funded by MIUR, grant number 20179SWLKA Project Title Multiple Advanced Materials Manufactured by Additive technologies (MAMMA) under the PRIN funding Scheme, Project Coordinator G.C.2 and under the funding scheme Change supported by the University of Catania Project Coordinator G.C.2. Claudio Tosto acknowledge the funding of his PhD by MIUR within the PON Ricerca e Innovazione 2014–2020 Asse I “Investimenti in Capitale Umano” -Azione I.1 “Dottorati Innovativi Con Caratterizzazione Industriale” Project Title “Advanced Materials by Additive manufacturing” (AMA).

Conflicts of Interest

The authors declare no conflict of interest. The funders had no role in the design of the study; in the collection, analyses, or interpretation of data; in the writing of the manuscript, or in the decision to publish the results.

Abbreviations

Additive manufacturing(AM)
American Society for Testing and Materials(ASTM)
Analysis of variance(ANOVA)
Design of experiments(DoE)
Fused deposition modeling(FDM™)
Fused filament fabrication(FFF)
Interlaminar shear strength(ILSS)
International Organization for Standardization(ISO)
Polyetherimide(PEI)
Short-beam strength(SBS)
Ultimate tensile strength(UTS)

References

  1. Harris, M.; Potgieter, J.; Archer, R.; Arif, K.M. Effect of material and process specific factors on the strength of printed parts in fused filament fabrication: A review of recent developments. Materials 2019, 12, 1664. [Google Scholar] [CrossRef] [PubMed] [Green Version]
  2. Es-Said, O.S.; Foyos, J.; Noorani, R.; Mendelson, M.; Marloth, R.; Pregger, B.A. Effect of Layer orientation on mechanical properties of rapid prototyped samples. Mater. Manuf. Process. 2000, 15, 107–122. [Google Scholar] [CrossRef]
  3. Ahn, S.H.; Montero, M.; Odell, D.; Roundy, S.; Wright, P.K. Anisotropic material properties of fused deposition modeling ABS. Rapid Prototyp. J. 2002, 8, 248–257. [Google Scholar] [CrossRef] [Green Version]
  4. Lee, B.H.; Abdullah, J.; Khan, Z.A. Optimization of rapid prototyping parameters for production of flexible ABS object. J. Mater. Process. Technol. 2005, 169, 54–61. [Google Scholar] [CrossRef]
  5. Tronvoll, S.A.; Welo, T.; Elverum, C.W. The effects of voids on structural properties of fused deposition modelled parts: A probabilistic approach. Int. J. Adv. Manuf. Technol. 2018, 97, 3607–3618. [Google Scholar] [CrossRef] [Green Version]
  6. Lin, B.; Sundararaj, U. Visualization of polyetherimide and polycarbonate blending in an internal mixer. J. Appl. Polym. Sci. 2004, 92, 1165–1175. [Google Scholar] [CrossRef]
  7. Caminero, M.A.; Chacón, J.M.; García-Moreno, J.M.R.I. Interlaminar bonding performance of 3D printed continuous fibre reinforced thermoplastic using FDM. Polym. Test. 2018, 68, 415–423. [Google Scholar] [CrossRef]
  8. Zhang, W.; Cotton, C.; Sun, J.; Heider, D.; Gu, B.; Sun, B.; Chou, T.W. Interfacial bonding strength of short carbon fiber/acrylonitrile-butadiene-styrene composites fabricated by fused deposition modeling. Compos. Part B Eng. 2018, 137, 51–59. [Google Scholar] [CrossRef]
  9. O’Connor, H.J.; Dowling, D.P. Low-pressure additive manufacturing of continuous fiber-reinforced polymer composites. Polym. Compos. 2019, 40, 4329–4339. [Google Scholar] [CrossRef]
  10. Caminero, M.Á.; Chacón, J.M.; García-Plaza, E.; Núñez, P.J.; Reverte, J.M.; Becar, J.P. Additive manufacturing of PLA-based composites using fused filament fabrication: Effect of graphene nanoplatelet reinforcement on mechanical properties, dimensional accuracy and texture. Polymers 2019, 11, 799. [Google Scholar] [CrossRef] [Green Version]
  11. Mercado-Colmenero, J.M.; Rubio-Paramio, M.A.; la Rubia-Garcia, M.D.; Lozano-Arjona, D.; Martin-Doñate, C. A numerical and experimental study of the compression uniaxial properties of PLA manufactured with FDM™™ technology based on product specifications. Int. J. Adv. Manuf. Technol. 2019, 103, 1893–1909. [Google Scholar] [CrossRef]
  12. Zaman, U.K.; Boesch, E.; Siadat, A.; Rivette, M.; Baqai, A.A. Impact of fused deposition modeling (FDM) process parameters on strength of built parts using Taguchi’s design of experiments. Int. J. Adv. Manuf. Technol. 2019, 101, 1215–1226. [Google Scholar] [CrossRef]
  13. Motaparti, K.P.; Taylor, G.; Leu, M.C.; Chandrashekhara, K.; Castle, J.; Matlack, M. Experimental investigation of effects of build parameters on flexural properties in fused deposition modelling parts. Virtual Phys. Prototyp. 2017, 12, 1–14. [Google Scholar] [CrossRef]
  14. Jiang, S.; Liao, G.; Xu, D.; Liu, F.; Li, W.; Cheng, Y.; Li, Z.; Xu, G. Mechanical properties analysis of polyetherimide parts fabricated by fused deposition modeling. High Perform. Polym. 2019, 31, 97–106. [Google Scholar] [CrossRef]
  15. Vicente, C.M.S.; Martins, T.S.; Leite, M.; Ribeiro, A.; Reis, L. Influence of fused deposition modeling parameters on the mechanical properties of ABS parts. Polym. Adv. Technol. 2020, 31, 501–507. [Google Scholar] [CrossRef]
  16. Cicala, G.; Ognibene, G.; Portuesi, S.; Blanco, I.; Rapisarda, M.; Pergolizzi, E.; Recca, G. Comparison of Ultem 9085 used in fused deposition modelling (FDM) with polytherimide blends. Materials 2018, 11, 258. [Google Scholar] [CrossRef] [PubMed] [Green Version]
  17. Seppala, J.E.; Migler, K.D. Infrared thermography of welding zones produced by polymer extrusion additive manufacturing. Addit. Manuf. 2016, 12, 71–76. [Google Scholar] [CrossRef] [Green Version]
  18. Armillotta, A.; Bellotti, M.; Cavallaro, M. Warpage of FDM™™ parts: Experimental tests and analytic model. Robot Comput. Integr. Manuf. 2018, 50, 140–152. [Google Scholar] [CrossRef]
  19. Cicala, G.; Latteri, A.; Del Curto, B.; Lo Russo, A.; Recca, G.; Farè, S. Engineering thermoplastics for additive manufacturing: A critical perspective with experimental evidence to support functional applications. J. Appl. Biomater. Funct. Mater. 2017, 15, 10–18. [Google Scholar] [CrossRef] [Green Version]
  20. Blanco, I.; Oliveri, L.; Cicala, G.; Recca, A. Effects of novel reactive toughening agent on thermal stability of epoxy resin. J. Therm. Anal. Calorim. 2012, 108, 685–693. [Google Scholar] [CrossRef]
  21. Della Gatta, G.; Richardson, M.J.; Sarge, S.M.; Stølen, S. Standards, calibration, and guidelines in microcalorimetry. Part 2. Calibration standards for differential scanning calorimetry* (IUPAC Technical Report). Pure Appl. Chem. 2006, 78, 1455–1476. [Google Scholar] [CrossRef] [Green Version]
  22. Blanco, I.; Cicala, G.; Ognibene, G.; Rapisarda, M.; Recca, A. Thermal properties of polyetherimide/polycarbonate blends for advanced applications. Polym. Degrad. Stab. 2018, 154, 234–238. [Google Scholar] [CrossRef]
  23. Valerga, A.P.; Batista, M.; Salguero, J.; Girot, F. Influence of PLA filament conditions on characteristics of FDM parts. Materials 2018, 11, 1322. [Google Scholar] [CrossRef] [PubMed] [Green Version]
  24. Breda, S.J.; João, F.; Pinto, S.F.; Liane, R.; Henrique, C.L. Analysis of the influence of polylactic acid (PLA) colour on FDM™™ 3D printing temperature and part finishing. Rapid Prototyp. J. 2018, 24, 1305–1316. [Google Scholar] [CrossRef]
  25. Wittbrodt, B.; Pearce, J.M. The effects of PLA color on material properties of 3-D printed components. Addit. Manuf. 2015, 8, 110–116. [Google Scholar] [CrossRef] [Green Version]
  26. Cicala, G.; Giordano, D.; Tosto, C.; Filippone, G.; Recca, A.; Blanco, I. Polylactide (PLA) filaments a biobased solution for additive manufacturing: Correlating rheology and thermomechanical properties with printing quality. Materials 2018, 11, 1191. [Google Scholar] [CrossRef] [PubMed] [Green Version]
  27. Gebisa, A.W.; Lemu, H.G. Investigating effects of Fused-deposition modeling (FDM) processing parameters on flexural properties of ULTEM 9085 using designed experiment. Materials 2018, 11, 500. [Google Scholar] [CrossRef] [Green Version]
  28. Byberg, K.I.; Gebisa, A.W.; Lemu, H.G. Mechanical properties of ULTEM 9085 material processed by fused deposition modeling. Polym. Test. 2018, 72, 335–347. [Google Scholar] [CrossRef]
  29. Zaldivar, R.J.; Witkin, D.B.; McLouth, T.; Patel, D.N.; Schmitt, K.; Nokes, J.P. Influence of processing and orientation print effects on the mechanical and thermal behavior of 3D-Printed ULTEMTM 9085 Material. Addit. Manuf. 2017, 13, 71–80. [Google Scholar] [CrossRef]
  30. El-Gizawy, A.S.; Corl, S.; Graybill, B. Process-induced properties of FDM™™ products. In Proceedings of the 2011 International Conference on Mechanical Engineering and Technology (ICMET 2011), London, UK, 24–25 November 2011. [Google Scholar]
  31. Torrado, A.R.; Roberson, D.A. Failure analysis and anisotropy evaluation of 3D-printed tensile test specimens of different geometries and print raster patterns. J. Fail. Anal. Prev. 2016, 16, 154–164. [Google Scholar] [CrossRef]
  32. Kuznetsov, V.E.; Solonin, A.N.; Urzhumtsev, O.D.; Schilling, R.; Tavitov, A.G. Strength of PLA components fabricated with fused deposition technology using a desktop 3D printer as a function of geometrical parameters of the process. Polymers 2018, 10, 313. [Google Scholar] [CrossRef] [PubMed] [Green Version]
  33. Grellmann, W.; Seidler, S. Polymer Testing; Springer: Berlin/Heidelberg, Germany, 2013. [Google Scholar]
Figure 1. Dimensions (in mm) of the specimens. (a) Tensile test specimens (ASTM D638 type I, IV); (b) flexural test specimens; (c) short-beam shear specimens.
Applsci 10 03195 g001
Figure 2. Slice and toolpath for tensile test specimens.
Applsci 10 03195 g002
Figure 3. Tanδ versus temperature for ULTEMTM 9085 tan and black.
Applsci 10 03195 g003
Figure 4. Differential scanning calorimetry for ULTEMTM 9085 tan and black.
Applsci 10 03195 g004
Figure 5. Average tensile stress versus displacement curves.
Applsci 10 03195 g005
Figure 6. Normal probability plot for: (a) Young’s modulus; (b) ultimate tensile strength; (c) flexural strength; and (d) interlaminar shear strength.
Applsci 10 03195 g006
Figure 7. Normal probability plot for tensile test (Young’s modulus).
Applsci 10 03195 g007
Figure 8. Effects diagram for tensile test.
Applsci 10 03195 g008
Figure 9. Fracture surface morphology for a tensile sample (tan resin). Red ellipse highlights the adhesive failure on the transverse rasters. The green arrow highlights the yielded longitudinal rasters.
Applsci 10 03195 g009
Figure 10. Average flexural stress versus displacement curves.
Applsci 10 03195 g010
Figure 11. Average ILSS versus displacement curves.
Applsci 10 03195 g011
Figure 12. Normal probability plot for SBS test.
Applsci 10 03195 g012
Figure 13. Effects diagram for SBS test.
Applsci 10 03195 g013
Table 1. Experimental plans. Factors, levels and responses for each investigated test.
TestStandardFactorSymbolTypeUnitLow Level (−1)High Level (+1)
MaterialACategorical-ULTEMTM 9085 TanULTEMTM 9085 Black
TensileASTM D638
GeometryBCategorical-Type IType IV
MaterialACategorical-ULTEMTM 9085 TanULTEMTM 9085 Black
FlexuralISO 178
GeometryBCategoricalmm122165
MaterialACategorical-ULTEMTM 9085 TanULTEMTM 9085 Black
SBSASTM D2344M
GeometryBCategoricalmm122165
Table 2. Printing conditions for the preparation of the specimens.
ParametersUnitValue
Infill%100
Infill type Solid
Support type ULTEM Support
Raster angledeg0/90
Layer heightµm254
Tip T16
Shrink factor (x) 1.01
Shrink factor (y) 1.01
Shrink factor (z) 1.0097
Contours widthmm0.508
Part raster widthmm0.508
Raster to raster air gap 0
Contour to raster air gap 0
Contour to contour air gap 0
Table 3. ANOVA table for tensile test (response is Young’s modulus).
SourceSum of SquaresdfMean SquareF Valuep-Value
Model0.110930.037025.6417<0.0001
A–Material0.057510.057539.8659<0.0001
B–Geometry0.005610.00563.88610.0674
AB0.057510.057539.8659<0.0001
Pure Error0.0216150.0014
Cor. Total0.132518
Std. Dev.0.038R-squared0.8368
Mean2.19Adj. R-squared0.8042
C.V. %1.73Pred. R-squared0.7442
Table 4. ANOVA table for tensile test (response: UTS).
SourceSum of SquaresdfMean SquareF Valuep-Value
Model12.492534.16420.44130.7266
A–Material1.738711.73870.18430.6735
B–Geometry2.056312.05630.21790.6469
AB8.697518.69750.92180.3513
Pure Error150.9726169.4358
Cor. Total163.465219
Std. Dev.3.0718R-squared0.0764
Mean59.1469Adj. R-squared−0.0967
C.V. %5.1935Pred. R-squared−0.4430
Table 5. ANOVA table for flexural test (response: flexural strength).
SourceSum of SquaresdfMean SquareF Valuep-Value
Model385.271385.275.020.379
A–Material385.271385.275.020.379
Residual1381.041876.72
Lack of Fit72.47236.240.440.6497
Pure Error1308.561681.79
Cor. Total1766.3019
Std. Dev.8.76R-squared0.2181
Mean95.89Adj. R-squared0.1747
C.V. %9.13Pred. R-squared0.0347
Table 6. ANOVA table for ILSS test (response: short-beam strength).
SourceSum of SquaresdfMean SquareF Valuep-Value
Model57.83157.83217.84<0.0001
A–Material57.83157.83217.84<0.0001
Residual4.78180.27
Lack of Fit0.7520.371.480.2569
Pure Error4.03160.25
Cor. Total62.6119
Std. Dev.0.52R-squared0.9237
Mean14.07Adj. R-squared0.9194
C.V. %3.66Pred. R-squared0.9058

