Non-REM Sleep Marker for Wearable Monitoring: Power Concentration of Respiratory Heart Rate Fluctuation

 ,
,
Abstract
:Featured Application
Abstract
1. Introduction
2. Materials and Methods
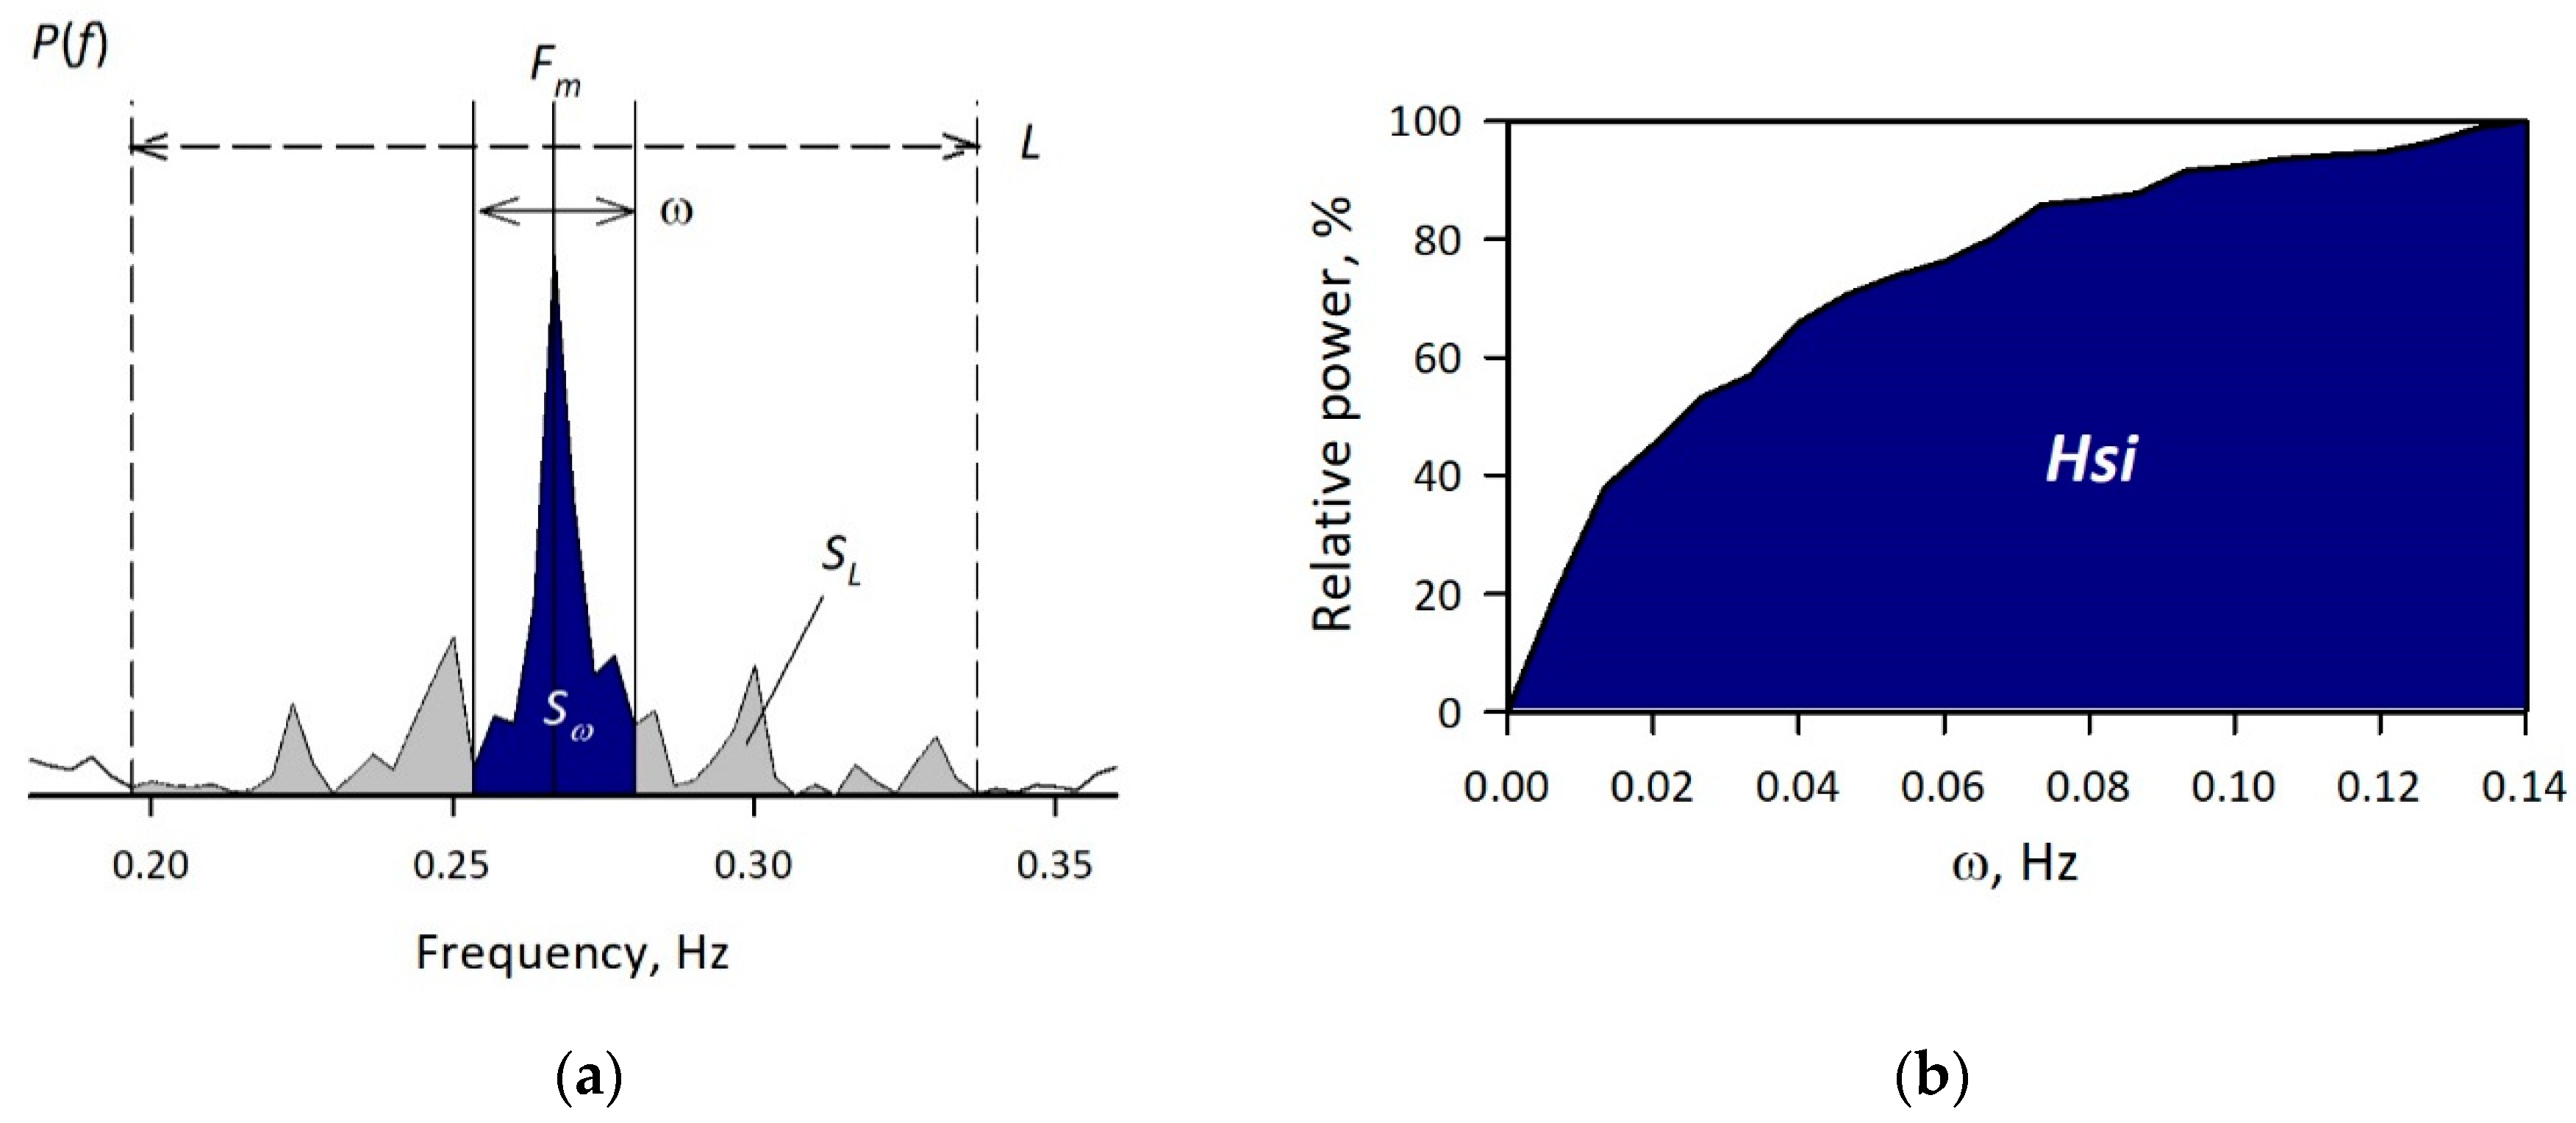
2.1. Measurement of HF Power Concentration
2.2. Subjects’ Characteristics
2.3. Measurements
2.4. Data Analysis
2.5. Statistical Analysis
3. Results
4. Discussion
5. Conclusions
6. Patents
Supplementary Materials
Author Contributions
Funding
Conflicts of Interest
References
- Bonnet, M.H.; Arand, D.L. Heart rate variability: Sleep stage, time of night, and arousal influences. Electroencephalogr. Clin. Neurophysiol. 1997, 102, 390–396. [Google Scholar] [CrossRef]
- Vanoli, E.; Adamson, P.B.; Ba, L.; Pinna, G.D.; Lazzara, R.; Orr, W.C. Heart rate variability during specific sleep stages: A comparison of healthy subjects with patients after myocardial infarction. Circulation 1995, 91, 1918–1922. [Google Scholar] [CrossRef] [PubMed]
- Elsenbruch, S.; Harnish, M.J.; Orr, W.C. Heart rate variability during waking and sleep in healthy males and females. Sleep 1999, 22, 1067–1071. [Google Scholar] [CrossRef] [Green Version]
- Villa, M.P.; Calcagnini, G.; Pagani, J.; Paggi, B.; Massa, F.; Ronchetti, R. Effects of sleep stage and age on short-term heart rate variability during sleep in healthy infants and children. Chest 2000, 117, 460–466. [Google Scholar] [CrossRef] [PubMed]
- Guilleminault, C.; Connolly, S.; Winkle, R.; Melvin, K.; Tilkian, A. Cyclical variation of the heart rate in sleep apnoea syndrome. Mechanisms, and usefulness of 24 h electrocardiography as a screening technique. Lancet 1984, 1, 126–131. [Google Scholar] [CrossRef]
- Hayano, J.; Watanabe, E.; Saito, Y.; Sasaki, F.; Fujimoto, K.; Nomiyama, T.; Kawai, K.; Kodama, I.; Sakakibara, H. Screening for obstructive sleep apnea by cyclic variation of heart rate. Circ. Arrhythm Electrophysiol. 2011, 4, 64–72. [Google Scholar] [CrossRef] [Green Version]
- Kantelhardt, J.W.; Ashkenazy, Y.; Ivanov, P.; Bunde, A.; Havlin, S.; Penzel, T.; Peter, J.H.; Stanley, H.E. Characterization of sleep stages by correlations in the magnitude and sign of heartbeat increments. Phys. Rev. E Stat. Nonlinear Soft Matter Phys. 2002, 65, 051908. [Google Scholar] [CrossRef] [Green Version]
- Penzel, T.; Kantelhardt, J.W.; Grote, L.; Peter, J.H.; Bunde, A. Comparison of detrended fluctuation analysis and spectral analysis for heart rate variability in sleep and sleep apnea. IEEE Trans. Biomed. Eng. 2003, 50, 1143–1151. [Google Scholar] [CrossRef] [Green Version]
- Adane, M.; Jiang, Z.; Yan, Z. Sleep–wake stages classification and sleep efficiency estimation using single-lead electrocardiogram. Expert Syst. Appl. 2012, 39, 1401–1413. [Google Scholar] [CrossRef]
- Fonseca, P.; Long, X.; Radha, M.; Haakma, R.; Aarts, R.M.; Rolink, J. Sleep stage classification with ECG and respiratory effort. Physiol. Meas. 2015, 36, 2027–2040. [Google Scholar] [CrossRef] [Green Version]
- Singh, J.; Sharma, R.K.; Gupta, A.K. A method of REM-NREM sleep distinction using ECG signal for unobtrusive personal monitoring. Comput. Biol. Med. 2016, 78, 138–143. [Google Scholar] [CrossRef] [PubMed]
- Cole, R.J.; Kripke, D.F.; Gruen, W.; Mullaney, D.J.; Gillin, J.C. Automatic sleep/wake identification from wrist activity. Sleep 1992, 15, 461–469. [Google Scholar] [CrossRef] [PubMed]
- Kushida, C.A.; Chang, A.; Gadkary, C.; Guilleminault, C.; Carrillo, O.; Dement, W.C. Comparison of actigraphic, polysomnographic, and subjective assessment of sleep parameters in sleep-disordered patients. Sleep Med. 2001, 2, 389–396. [Google Scholar] [CrossRef]
- Long, X.; Fonseca, P.; Foussier, J.; Haakma, R.; Aarts, R.M. Sleep and wake classification with actigraphy and respiratory effort using dynamic warping. IEEE J. Biomed. Health Inform. 2014, 18, 1272–1284. [Google Scholar] [CrossRef]
- Nam, Y.; Kim, Y.; Lee, J. Sleep monitoring based on a tri-axial accelerometer and a pressure sensor. Sensors 2016, 16, 750. [Google Scholar] [CrossRef] [Green Version]
- Coleman, R.M.; Bliwise, D.L.; Sajben, N.; Boomkamp, A.; de Bruyn, L.M.; Dement, W.C. Daytime sleepiness in patients with periodic movements in sleep. Sleep 1982, 5 (Suppl 2), S191–S202. [Google Scholar] [CrossRef] [Green Version]
- Peng, C.K.; Buldyrev, S.V.; Havlin, S.; Simons, M.; Stanley, H.E.; Goldberger, A.L. Mosaic organization of DNA nucleotides. Phys. Rev. E Stat. Phys. Plasmas Fluids Relat. Interdiscip. Topics 1994, 49, 1685–1689. [Google Scholar] [CrossRef] [Green Version]
- Iyengar, N.; Peng, C.K.; Morin, R.; Goldberger, A.L.; Lipsitz, L.A. Age-related alterations in the fractal scaling of cardiac interbeat interval dynamics. Am. J. Physiol. 1996, 271, R1078–R1084. [Google Scholar] [CrossRef] [Green Version]
- Hanley, J.A.; McNeil, B.J. A method of comparing the areas under receiver operating characteristic curves derived from the same cases. Radiology 1983, 148, 839–843. [Google Scholar] [CrossRef] [Green Version]
- Shannon, D.C.; Carley, D.W.; Benson, H. Aging of modulation of heart rate. Am. J. Physiol. 1987, 253, H874–H877. [Google Scholar] [CrossRef]
- Hayano, J.; Mukai, S.; Sakakibara, M.; Okada, A.; Takata, K.; Fujinami, T. Effects of respiratory interval on vagal modulation of heart rate. Am. J. Physiol. 1994, 267, H33–H40. [Google Scholar] [CrossRef] [PubMed]
- Camm, A.J.; Malik, M.; Bigger, J.T., Jr.; Breithardt, G.; Cerutti, S.; Cohen, R.J.; Coumel, P.; Fallen, E.L.; Kleiger, R.E.; Lombardi, F.; et al. Task force of the European Society of Cardiology and the North American Society of Pacing and Electrophysiology. Heart rate variability, Standards of measurement, physiological interpretation and clinical use. Circulation 1996, 93, 1043–1065. [Google Scholar]
- Berntson, G.G.; Cacioppo, J.T.; Quigley, K.S. Respiratory sinus arrhythmia: Autonomic origins, physiological mechanisms, and psychophysiological implications. Psychophysiology 1993, 30, 183–196. [Google Scholar] [CrossRef] [PubMed]


| N | 141 |
|---|---|
| Age, year | 46 (33–58) |
| Male/female | 103/38 |
| Time in bed (TIB), min | 475 (460–485) |
| Sleep period time (SPT), min | 460 (428–472) |
| Total sleep time (TST), min | 376 (318–410) |
| Sleep latency, min | 10 (6–20) |
| Non-REM period, min | 301 (261–322) |
| REM period, min | 73 (52–96) |
| REM latency after sleep onset, min | 95 (70–137) |
| Wake period during SPT, min | 79 (44–107) |
| Sleep efficiency, % | 83 (74–90) |
| AHI (TIB) | 0.8 (0.1–6.9) |
| AHI (TST) | 1.0 (0.1–9.5) |
| AHI (TIB) > 15/h | 19 (13%) |
| Hsi > 65% period, min | 290 (180–340) |
| Mean Hsi, % | 67 (62–70) |
| HRV Indices | Stage W N = 2261 17.1% | Stage NREM N = 6891 52.2% | Stage REM N = 2484 18.8% | Transitional N = 1578 11.9% | p |
|---|---|---|---|---|---|
| Heart rate, bpm | 67.7 ± 10.3 | 60.7 ± 9.2 | 62.1 ± 8.8 | 63.6 ± 9.4 | <0.0001 |
| VLF power, ln(ms2) | 6.80 ± 1.45 | 6.03 ± 1.33 | 7.48 ± 1.19 | 7.29 ± 1.39 | <0.0001 |
| LF power, ln(ms2) | 5.54 ± 1.43 | 5.61 ± 1.28 | 6.17 ± 1.22 | 6.15 ± 1.25 | <0.0001 |
| HF power, ln(ms2) | 4.73 ± 1.45 | 5.77 ± 1.34 | 5.41 ± 1.39 | 5.47 ± 1.31 | <0.0001 |
| HF peak power, ln(ms2) | 8.03 ± 1.57 | 9.75 ± 1.48 | 8.75 ± 1.53 | 8.88 ± 1.46 | <0.0001 |
| LF/HF | 3.36 ± 3.35 | 1.30 ± 1.54 | 3.21 ± 3.42 | 2.86 ± 2.73 | <0.0001 |
| α30–60 | 1.25 ± 0.27 | 0.96 ± 0.30 | 1.28 ± 0.27 | 1.26 ± 0.27 | <0.0001 |
| α60–300 | 0.99 ± 0.34 | 0.77 ± 0.26 | 1.01 ± 0.29 | 0.91 ± 0.32 | <0.0001 |
| Hsi of respiration, % | 67.6 ± 9.2 | 78.7 ± 7.9 | 66.4 ± 7.7 | 68.9 ± 8.8 | <0.0001 |
| Variable | AUC (SE) | 95%CI | P vs. Hsi | Cut off | Sens % | Spec % | Acc |
|---|---|---|---|---|---|---|---|
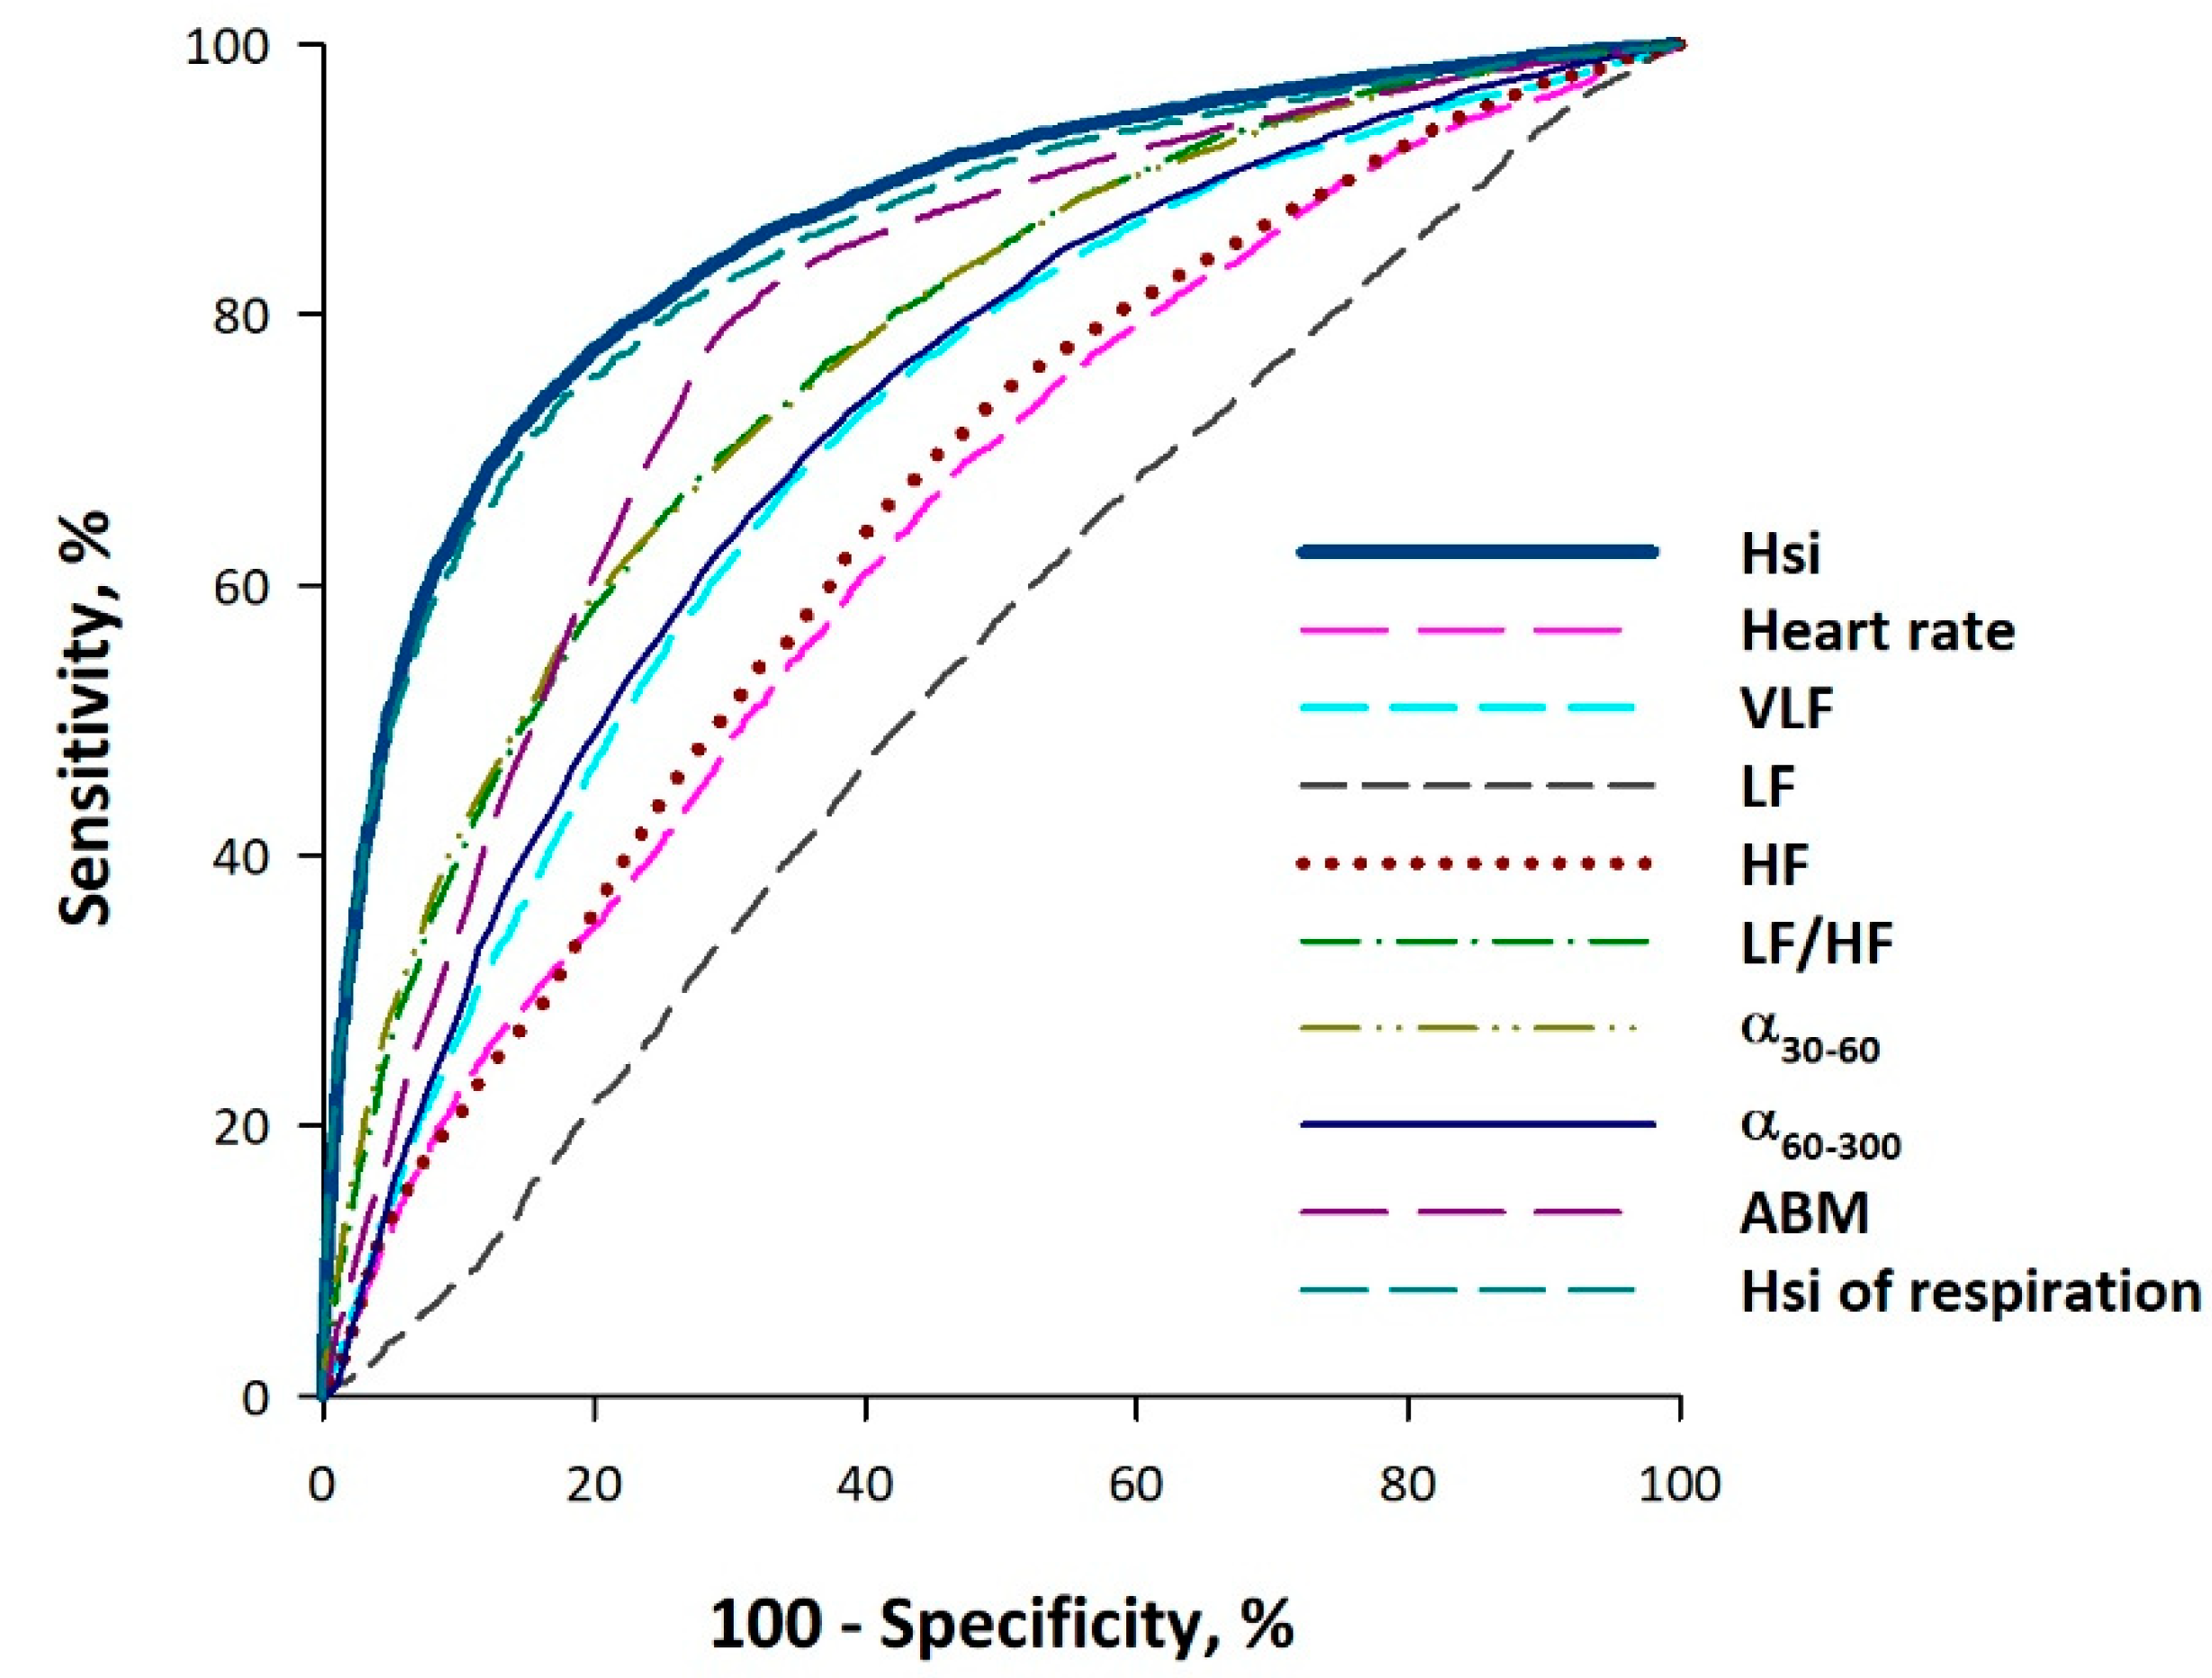
| Hsi | 0.86 (0.0034) | 0.86–0.87 | - | >70% | 77 | 80 | 79 |
| Heart rate | 0.64 (0.0051) | 0.63–0.65 | <0.0001 | <64 bpm | 69 | 53 | 62 |
| VLF power | 0.71 (0.0048) | 0.70–0.72 | <0.0001 | <6.57 ln(ms2) | 68 | 65 | 67 |
| LF power | 0.54 (0.0054) | 0.53–0.55 | <0.0001 | <6.16 ln(ms2) | 65 | 43 | 56 |
| HF power | 0.66 (0.0051) | 0.65–0.66 | <0.0001 | >5.18 ln(ms2) | 70 | 55 | 64 |
| HF peak power | 0.75 (0.0047) | 0.75–0.76 | <0.0001 | >9.16 ln(ms2) | 69 | 70 | 69 |
| LF/HF | 0.77 (0.0043) | 0.76–0.78 | <0.0001 | <1.27 | 68 | 72 | 70 |
| α30–60 | 0.77 (0.0044) | 0.76–0.78 | <0.0001 | <1.13 | 70 | 70 | 70 |
| α60–300 | 0.72 (0.0078) | 0.71–0.73 | <0.0001 | <0.88 | 71 | 64 | 68 |
| ABM | 0.79 (0.0043) | 0.78–0.79 | <0.0001 | <0.6 a.u. | 80 | 70 | 76 |
| Hsi of respiration | 0.85 (0.0043) | 0.85–0.86 | 0.45 | >70% | 76 | 81 | 78 |
| Variable | AUC (SE) | 95%CI | p vs. Hsi |
|---|---|---|---|
| his | 0.79 (0.0031) | 0.78–0.79 | - |
| Heart rate | 0.54 (0.0036) | 0.53–0.55 | <0.0001 |
| VLF power | 0.69 (0.0032) | 0.68–0.69 | <0.0001 |
| LF power | 0.56 (0.0036) | 0.56–0.57 | <0.0001 |
| HF power | 0.61 (0.0036) | 0.61–0.62 | <0.0001 |
| HF peak power | 0.70 (0.0035) | 0.69–0.70 | <0.0001 |
| LF/HF | 0.74 (0.0030) | 0.73–0.74 | <0.0001 |
| α30–60 | 0.76 (0.0029) | 0.76–0.77 | <0.0001 |
| α60–300 | 0.63 (0.0034) | 0.63–0.64 | <0.0001 |
| ABM | 0.76 (0.0028) | 0.76–0.77 | <0.0001 |
© 2020 by the authors. Licensee MDPI, Basel, Switzerland. This article is an open access article distributed under the terms and conditions of the Creative Commons Attribution (CC BY) license (http://creativecommons.org/licenses/by/4.0/).
Share and Cite
Hayano, J.; Ueda, N.; Kisohara, M.; Yoshida, Y.; Tanaka, H.; Yuda, E. Non-REM Sleep Marker for Wearable Monitoring: Power Concentration of Respiratory Heart Rate Fluctuation. Appl. Sci. 2020, 10, 3336. https://0-doi-org.brum.beds.ac.uk/10.3390/app10093336
Hayano J, Ueda N, Kisohara M, Yoshida Y, Tanaka H, Yuda E. Non-REM Sleep Marker for Wearable Monitoring: Power Concentration of Respiratory Heart Rate Fluctuation. Applied Sciences. 2020; 10(9):3336. https://0-doi-org.brum.beds.ac.uk/10.3390/app10093336
Chicago/Turabian StyleHayano, Junichiro, Norihiro Ueda, Masaya Kisohara, Yutaka Yoshida, Haruhito Tanaka, and Emi Yuda. 2020. "Non-REM Sleep Marker for Wearable Monitoring: Power Concentration of Respiratory Heart Rate Fluctuation" Applied Sciences 10, no. 9: 3336. https://0-doi-org.brum.beds.ac.uk/10.3390/app10093336