Article

Development of a Unified Geotechnical Database and Data Processing on the Example of Nur-Sultan City

by
Askar Zhussupbekov
1,
Nurgul Alibekova
1,
Sungat Akhazhanov
2 and
Assel Sarsembayeva
1,*
1
Geotechnical Institute, L.N. Gumilyov Eurasian National University, Nur-Sultan 010008, Kazakhstan
2
Department of Algebra, Mathematical Logic and Geometry, Buketov Karaganda State University, Karaganda 100028, Kazakhstan
*
Author to whom correspondence should be addressed.
Submission received: 28 November 2020 / Revised: 19 December 2020 / Accepted: 22 December 2020 / Published: 30 December 2020
(This article belongs to the Section Civil Engineering)

Abstract

:
Development of a geotechnical database for the young capital of Kazakhstan, Nur-Sultan city, became a paramount concern of both the scientific community and industry. The creation of the Kazakhstan model of the geotechnical database was based on a fixed dataset which included a city map with determined X, Y, and H coordinates and the user generated data obtained from the materials of engineering and geological surveys from more than 2000 boreholes. Based on the assessment of the built-up area of the city, six main engineering-geological elements (EGE) were identified. The territory of the city was regrouped into eight zones instead of the previous six based on the geological origin and stratigraphy interposition of the EGE. Engineering properties of the soils were considered for physical and mechanical characteristics, where the plasticity limits demonstrated an accurate correlation to the elasticity modulus E and distribution boundaries between the alluvial and eluvial types of the soil on the graph. So, the increased liquid and plastic limits are replicated by higher values of elasticity modulus E, and hence better strength characteristics of a particular soil layer and vice versa, while the moisture content and soil density did not show any obvious pattern and requires additional verification on the construction site. Finally, a geotechnical map was built for the driven piles and the optimal variations in the pile length for each zone were determined.

1. Introduction

The first studies on engineering-geological mapping based on field surveys and intrusive sampling technologies have been developed since the early 1950s [1,2]. In 1990s geotechnical mapping was facilitated with air- and space-borne optical imagery (e.g., Corona, Landsat series, Aster, Ikonos, and QuickBird) and microwave data (e.g., ERS, Radarsat, Envisat, and Shuttle Radar Topography Mission) [3,4] and extended by Geographical Information Systems (GIS) technologies after the 2000s [5,6]. The objectives of the studies included monitoring and modelling mapping of complex thermal and geomorphological processes such as permafrost and periglacial zones [7], volcanic monitoring [8], hydrocarbons deposits, agricultural development [9], areas affected by natural hazards and technogenic risks, like seismic or land sliding micro zonation, etc. [10]. Extensive development of advanced technologies in digital mapping system has contributed to the creation of detailed geotechnical maps of major cities in France, Portugal, Japan, USA, and many other countries [7,9,11,12].
The fundamental works of the USSR in the field of engineering-geological mapping were presented by I.V. Popov, F.V. Kotlov, N.V. Kolomensky, N.F. Kolotilin, and other researchers [13,14,15,16,17]. So, in the work of I.V. Popov in 1950 developed a method of engineering-geological zoning, which consists in the sequential division of the territory into separate parts, which are characterized by increasingly homogeneous engineering-geological conditions [13]. F.V. Kotlov, in the period of 1967–1983, developed methods of engineering geology for mapping urban areas, underground urbanism and urban planning assessment of the developed territories [15]. A very important fact is noted in them, indicating that in engineering geology there has been a lag in the development of the theory and methodology of issues related to the engineering-geological substantiation of the design and construction of foundations. N.V. Kolomensky in 1968 proposed to draw up unified engineering and geological maps, on which it is necessary to show the most important factors for all types of construction, tectonic conditions, lithological composition of rocks, the maximum level of the first aquifer from the earth’s surface, physical and geological phenomena, and physical and technical properties of rocks [16]. Specific details for certain types of construction were displayed on additional engineering-geological maps. N.F. Kolotilin in 1977 made significant contributions to the development of engineering-geological mapping of cities in Kazakhstan [17]. In the above works, the specificity inherent in the main projected city or region was used. In this case, the considered territory (city or district) is subdivided into regions, each of which is characterized by a geological structure inherent only in it and the geological and genetic complex of rocks that composes it. Then the regions are divided into areas, which, according to the nature of geomorphological conditions, are divided into areas that differ from each other in composition and engineering-geological properties. The formation of these maps is based on the formation and lithological-genetic principle proposed by I.V. Popov in 1956, and which was adopted as the basis for the classification of rocks [13,14].
In Kazakhstan, during the Soviet period, engineering survey materials were provided by a large state organization Kazakh Geotechnical Research Institute (KazGIIZ), which was founded in 1964 in Almaty and had its own regional expeditions, departments, and branches in all regions of the country. At the same time, KazGIIZ pursued a unified technical policy in the field of engineering surveys for construction. During the restructuring period 1985–1991, the well-established system for collecting, storing, and providing materials for engineering surveys was destroyed in Kazakhstan because of absence of the local construction engineering research trust. The entire accumulated archive of geological surveys was transferred to private companies that did not want to share information. Since 2007, N. Alibekova, under the supervision of A. Zhussupbekov, began to collect together all the data on engineering and geological surveys for the city of Nur-Sultan, which at that time was experiencing a construction boom and was in dire need of geotechnical data [18].
When developing a geological map for the major cities on the territory of Kazakhstan, it was necessary to take into account its climatic and engineering-geological features. The climate of Kazakhstan is a moderate continental one, with dry hot summers and severe cold and windy winters [19]. The temperature of the northern and central part of the country in winter time often reaches to −35 °C and sometimes even −40 °C. The snow cover period in the youngest and the second coldest capital of the world, Nur-Sultan, lasts for 111 days, while the number of days with negative temperatures is up to 160–170 days. The Nur-Sultan region is classified as a III-climate zone with a minimum day temperature of –41 °C in winter and a record low temperature −52 °C. The average annual humidity is 59% [19].
The new capital of Kazakhstan was moved to Nur-Sultan, a regional city in the center of the republic, in December 1997. This led to intensive internal migration to the new capital and there was an urgent need for large-scale construction of the residential sector, business and industrial buildings and structures. According to [20] within 23 years, the population of Nur-Sultan has almost tripled and the building area of the city exceeded 797.33 km2. In terms of the geological characteristics of the Nur-Sultan soils pertaining to the Kazakh Steppe. As a result of chemical and physical weathering, an irregular layer of residual soil mantle has been formed, which exhibits a progressive downwards transition to the weathered rock [21]. These are underlain by ancient sedimentary rocks of Paleozoic undivided sediments in the northern part and mid-Quaternary sediments in the southern and western parts, including claystone, siltstone, and sandstone. The general vertical sequence of the soils consists of about 1 m of alluvium over fine-grained residual soils on the left embankment of the Esil River, the newly built business center of Nur-Sultan city. The hydrographic network of the city is represented not only by the only Ishim River, but also by its insignificant right tributaries—Sarybulak and Akbulak. Within a radius of 25–30 km around the city there are numerous fresh and salt lakes. Therefore the ground water level is typically relatively high, being between 0.5 and 0.8 m of the existing ground surface [21,22].
The predominant type of geomorphological origin of the Nur-Sultan city and adjacent areas are the plain terrains separated by river water. In the south-western part there are two types of upper and lower valleys. In accordance with the geomorphological characteristics of the study area, geomorphological zoning was carried out as a topological unit by dividing the river valley into areas depending on the structure of the terrain [23]. The study area, according to V. Popov, was divided into five zones (Table 1), the boundary of which is the main landforms in Figure 1.
I-terrace over the first floodplain valley-a(QII-III) middle and upper quaternary geological period sands, clayey sands, sandy clays, and clays (Table 1).
II-the watershed plain is composed of Carboniferous e(C1) and Jurassic e(J1) rocks, with an average of modern quaternary geological period a(QII-IV) with upper layers of sand, clayey sands, sandy clays, and clays of different particle sizes over sandy clays and clays.
III-small hill-Carboniferous e(C1) rocks, covered with a layer of sand, sandstones, and loams of various sizes a(QII-III).
IV-high floodplain valley-reduction of natural outflow of “SaryBulak” and “TuzdyZhyra” streams-layering of sands, clayey sands, and sands a(QII-IV).
V-Lower floodplain valley-canals, quarries, pits-sands, and sedimentary clays a(QII-IV).
Recent experience in the construction of pile foundations in Nur-Sultan and the results of their research show the presence of excessive strength in the design of foundations, not taking into account the unreasonable costs of material and labor resources, funds, previous construction experience in these areas and the work of surface structures [24,25]. Insufficient information about the soil, incorrect choice of the type of piles, their length and horizontal dimensions, and failure to use the maximum load-bearing capacity of the foundation to the required level leads to structure failures [26]. As a result, the reduction of the design loads on the piles, the fact that the piles are not immersed to the design marks, requires the use of additional piles. In order to determine the above reasons and soil characteristics, it is often necessary to conduct additional soil examinations, which in general will lead to an increase in the cost of construction and exploration work [27]. In this case, it became necessary to create a geotechnical base for the city of Nur-Sultan, which allows digitalizing the existing data of engineering and geological surveys to this day and is able to preliminarily determine the vertical profiles of soil layers using existing boreholes data [28,29]; thus, contribute to a more accurate determination of the pile length and its sufficient bearing capacity.

2. Development of a Geoinformation Database

The most crucial tasks in the creation of a database are the recording, processing and systematization of the results of previously performed engineering and survey works. The quality of these processes determines the degree of reliability of the database in the future. The main components of the assessment of base soils are:
(1)
clarification of the physical-geographical, geological, geomorphological and lithological conditions;
(2)
qualitative and quantitative characteristics of the structure, composition, state and properties of genetic, age and petrographic types of soils and mapping the spatial variability of their indicators;
(3)
identification of soil layering conditions and their location;
(4)
establishing the nature and intensity of development of modern geological and engineering-geological processes and phenomena.
The control system of the developed Geoinformation Database (DIG-system) program was developed by the scientists of the L.N. Gumilyov Eurasian National University in Nur-Sultan, Kazakhstan, and has a hierarchical structure consisting of two levels and includes the following main four functions:
(1)
General management function (Host DB).
(2)
Input control data function (Local DB).
(3)
Function of data extraction and processing (AP).
(4)
Data augmentation function (Layer DB).
The general management function is responsible for the first level of the hierarchical structure, which carries out the general management and organization of the graphical process.
The second level of the hierarchy includes the other three functions that carry out preliminary processing of the initial information and ensure the organization of the graphic process.
In this case, the initial information used in the program is divided into two main sections:
Fixed datasets that form a local program database.
Initial data prepared directly by the user and entered during program execution.
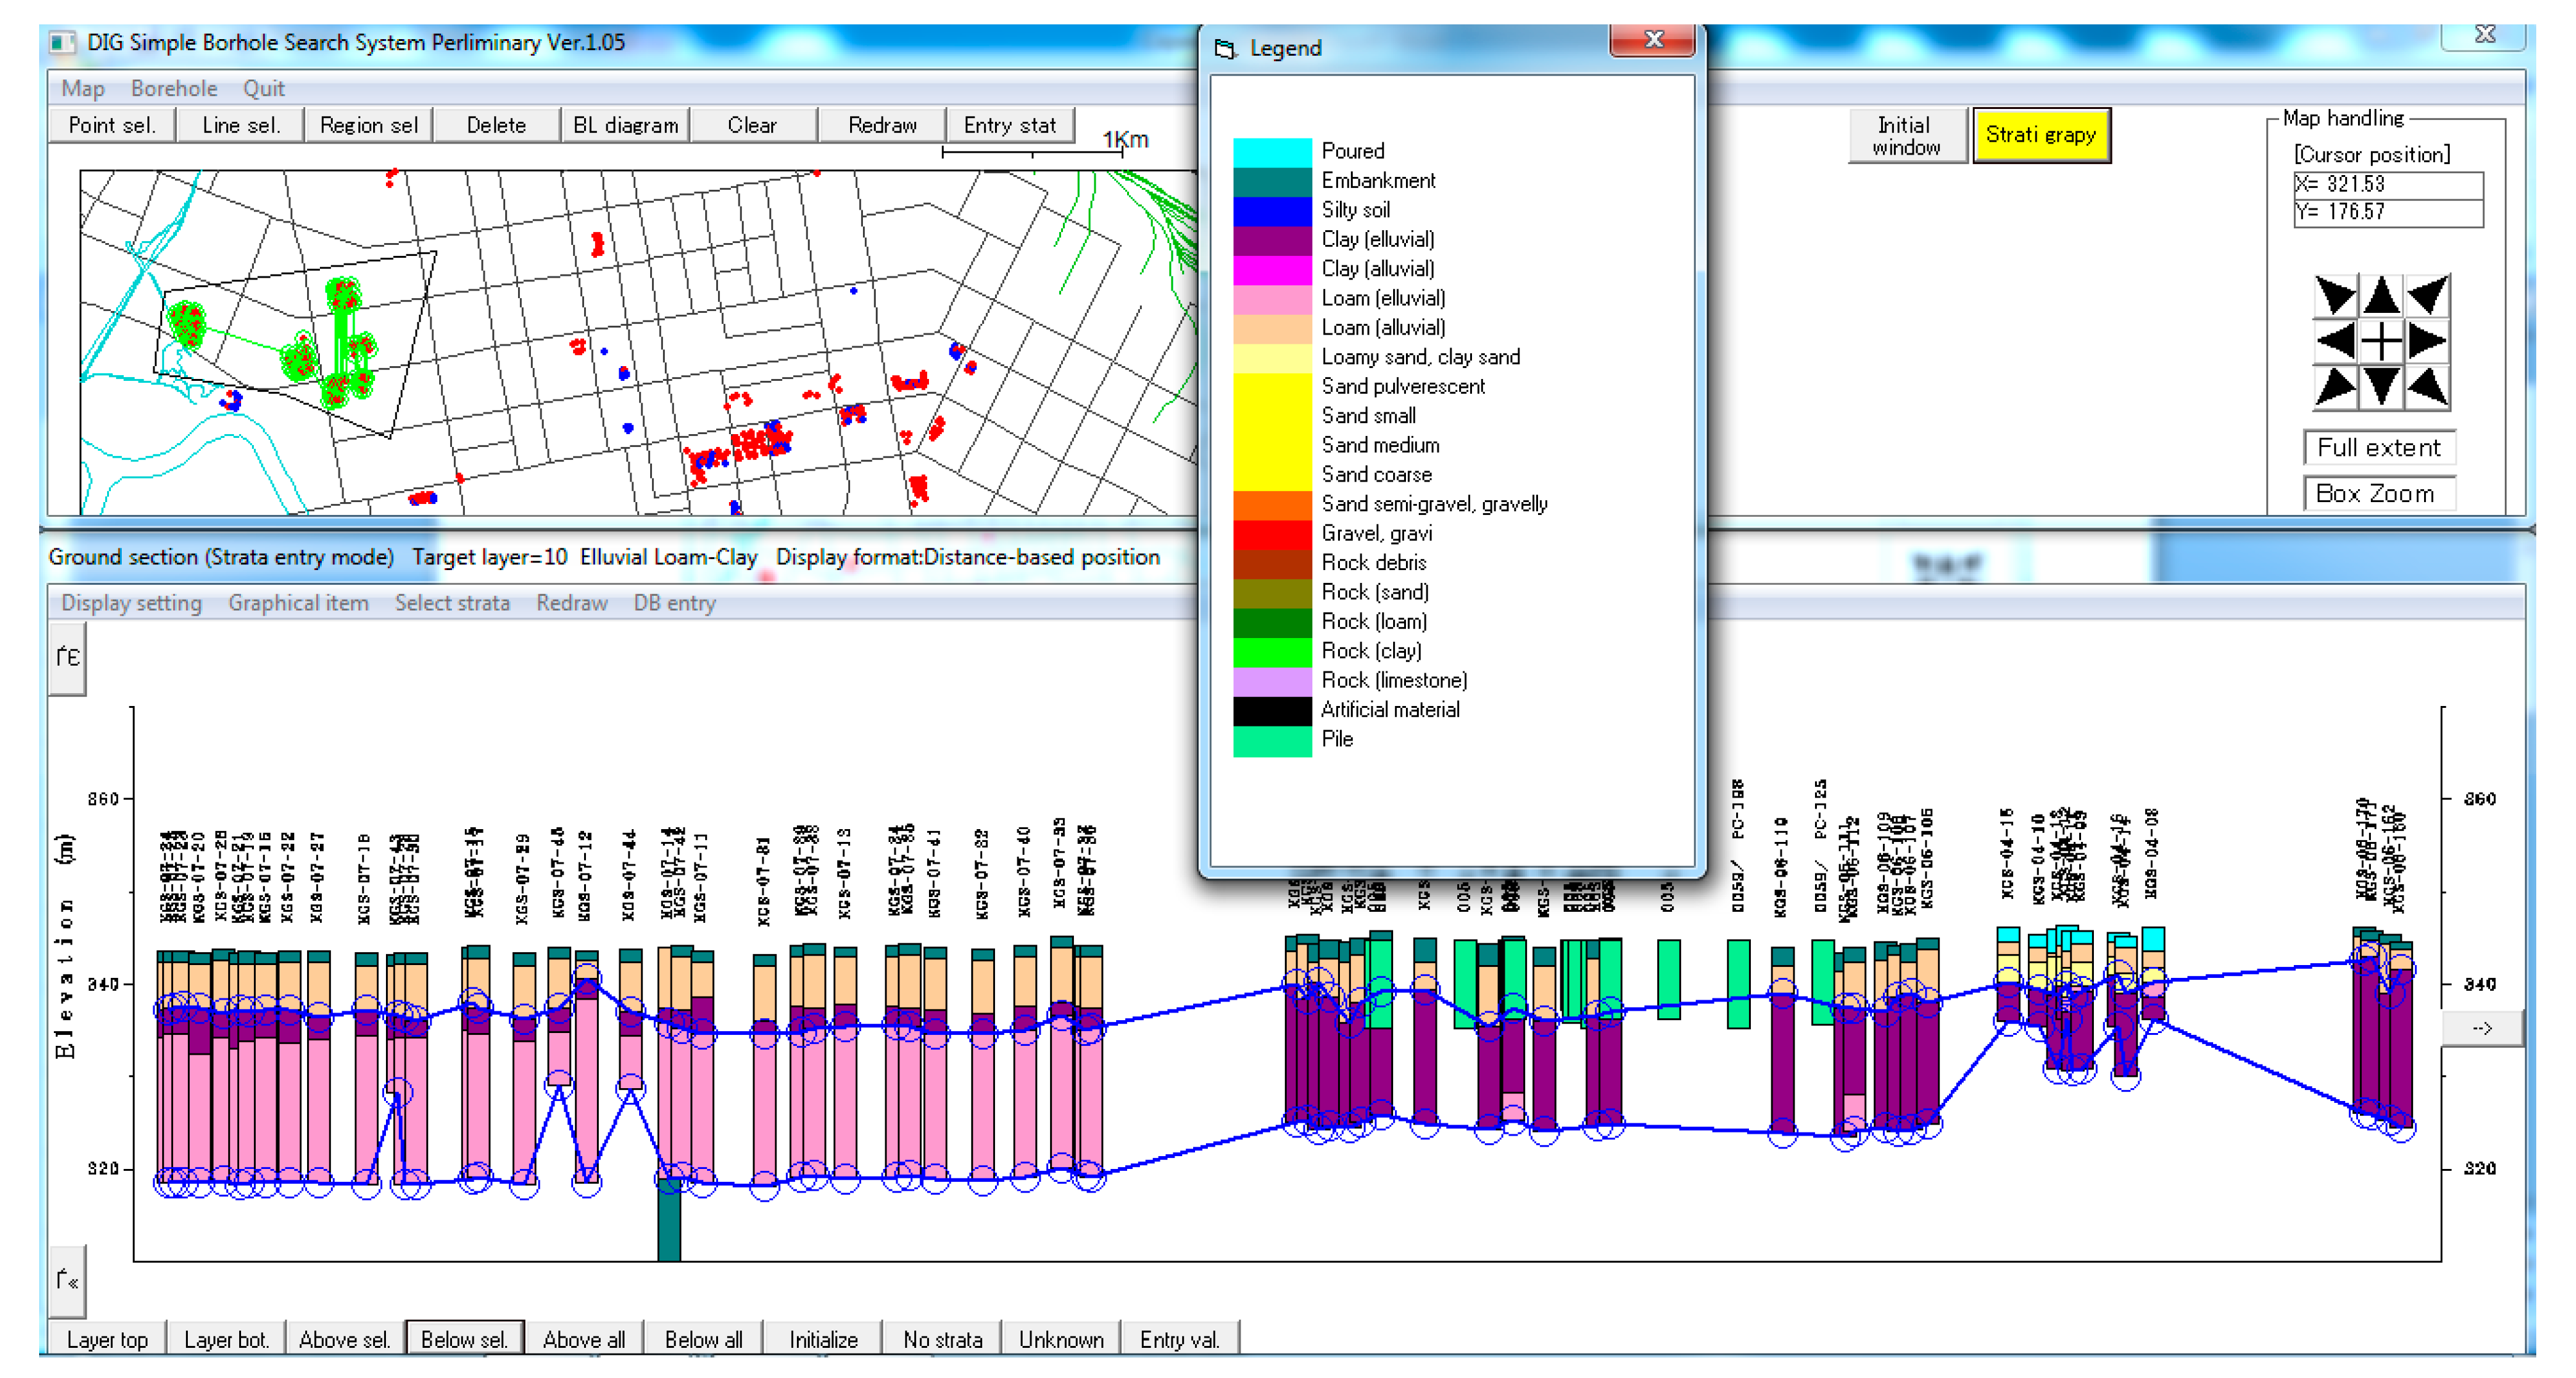
The first section (fixed data) is informational material included directly in the program set. This includes a city map, city coordinates and characteristics for obtaining graphic files.
The second section is the sets of initial data was generated by the user. It includes data obtained from the materials of engineering and geological surveys. Sequence of data input to the second section:
(a)
The survey area was determined and a map of the survey area is created in CAD program, i.e., AutoCAD.
(b)
The location of each borehole was indicated and labeled on the survey area map.
(c)
The exact X and Y coordinates were determined for each borehole.
(d)
A set of data was collected in the Excel table to log the information about each borehole and the location of Static pile load tests which were reflected in the geological-lithological columns:
each borehole was assigned an identification code of the borehole and the coordinates were entered according to X and Y, the level of the ground surface H, the depth of borehole and the level of groundwater,
the same way data were applied for each point of Static pile load test with a link to a nearby borehole location,
for each associated borehole the geological-lithological columns were inserted, which include the depth of the deposit, the age and name of the soil that ensures the stratigraphy subsequent location of the layers, as well as the coded state or if (if loose soil then the code is equal to zero, if half-rock or rock is 1,2,3,4 depends to the type of the rock soils),
the data of previously performed Static pile load tests were recorded according to their passport,
after this the processing of all data was performed and their reliability were verified.
With the help of this program it was possible to build up the conditions for the settlement and the soils stratigraphy in each part of the city (Figure 2).

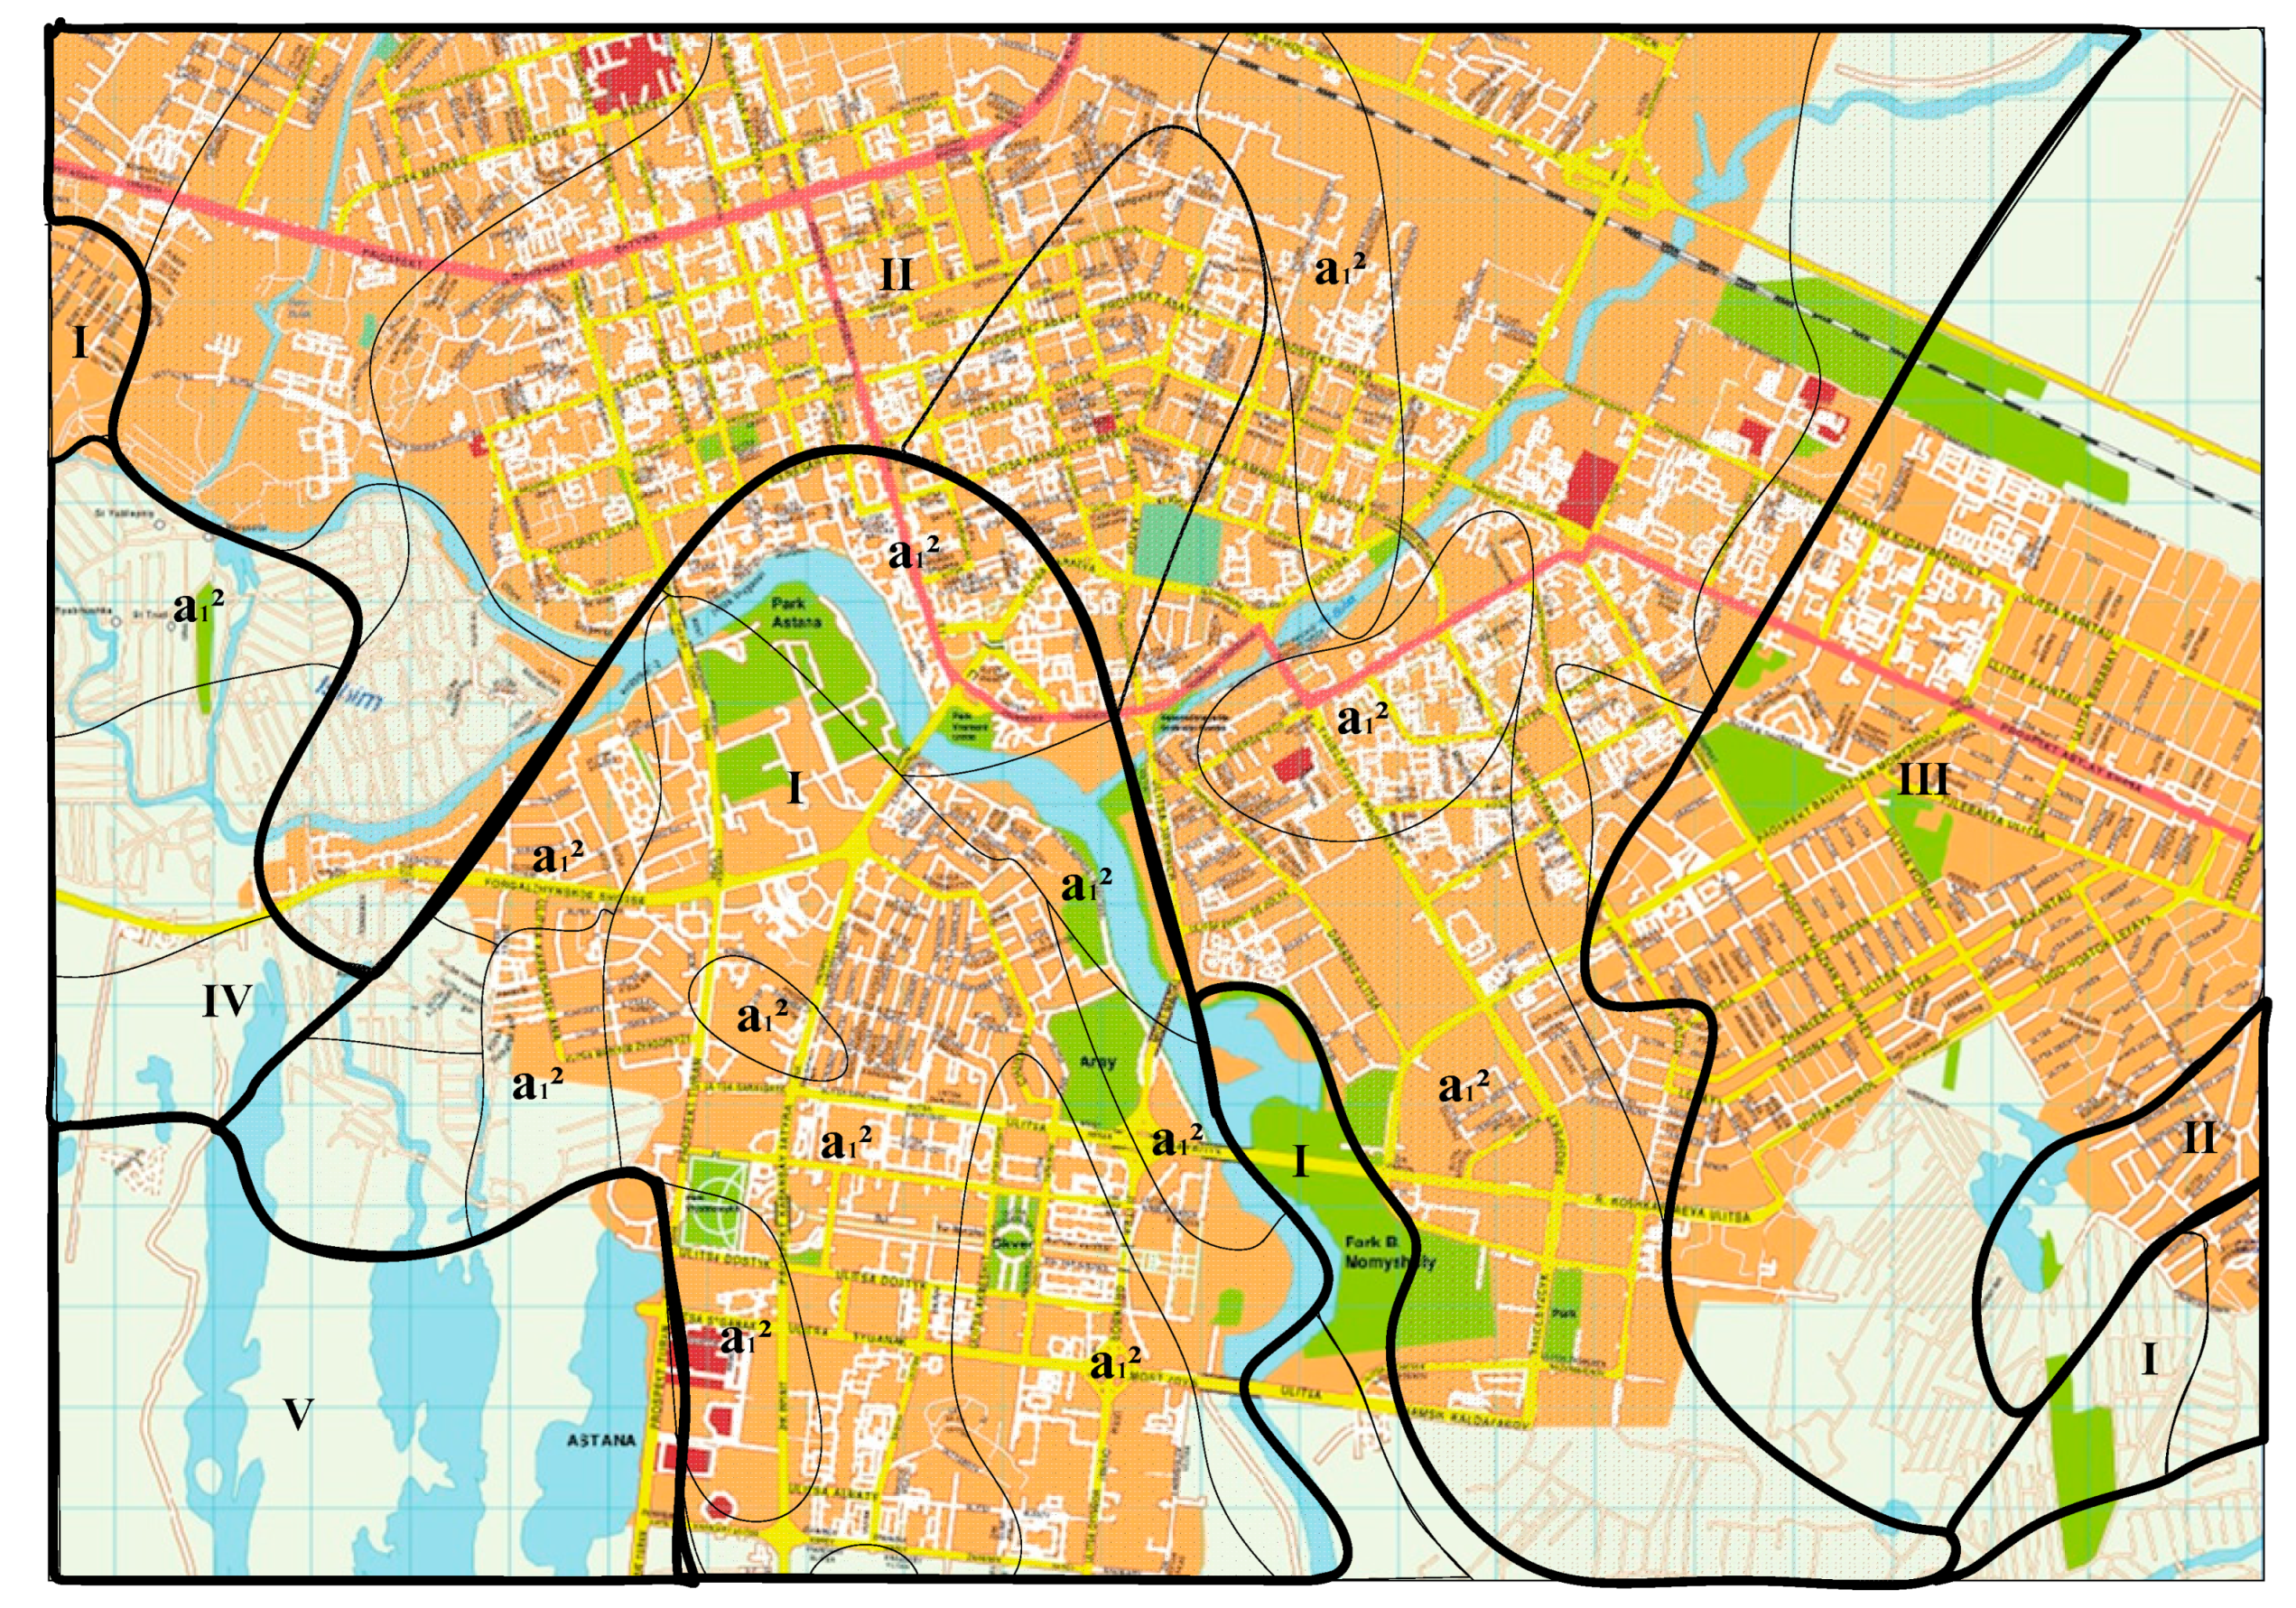
3. Subdivision of the City Territory into Conditionally Homogeneous Geological Zones

To analyze the heterogeneity of the considered types of sediments within a significant area of their distribution, we used the data of laboratory studies of soil samples from more than 2000 boreholes, carried out during engineering and geological surveys at construction sites in Nur-Sultan city. For determining the engineering properties of soils further characteristics of the soils include:
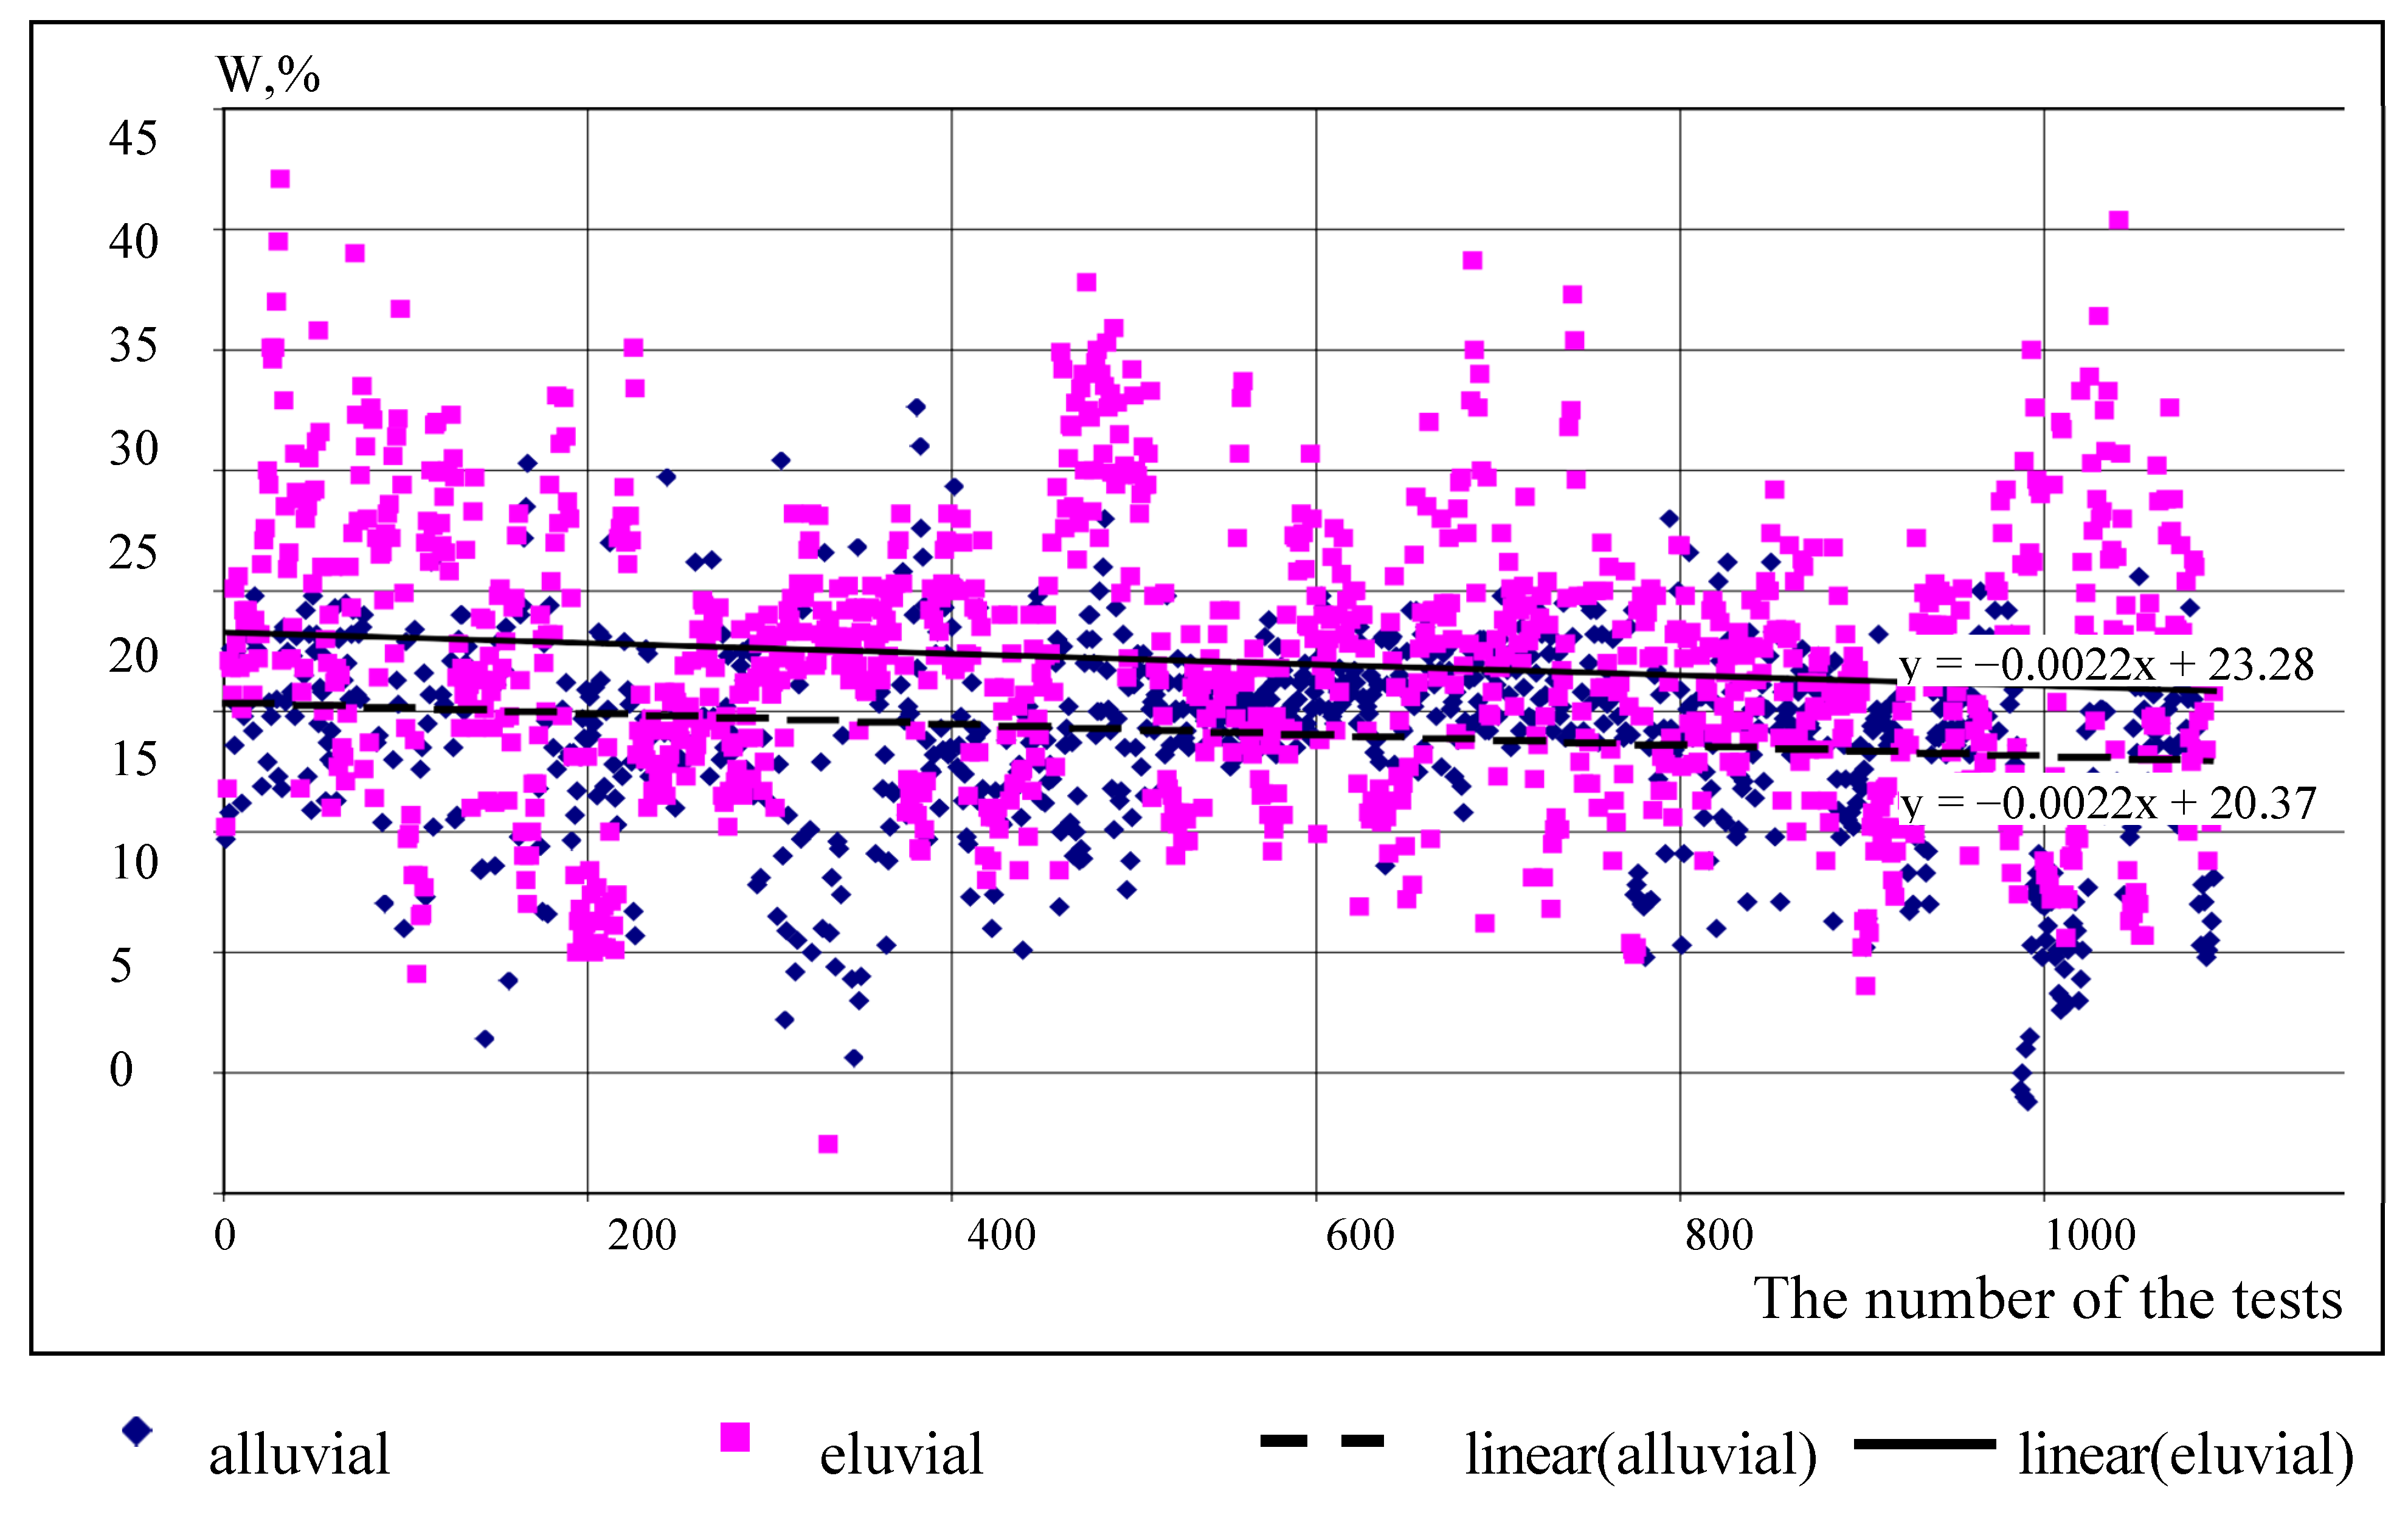
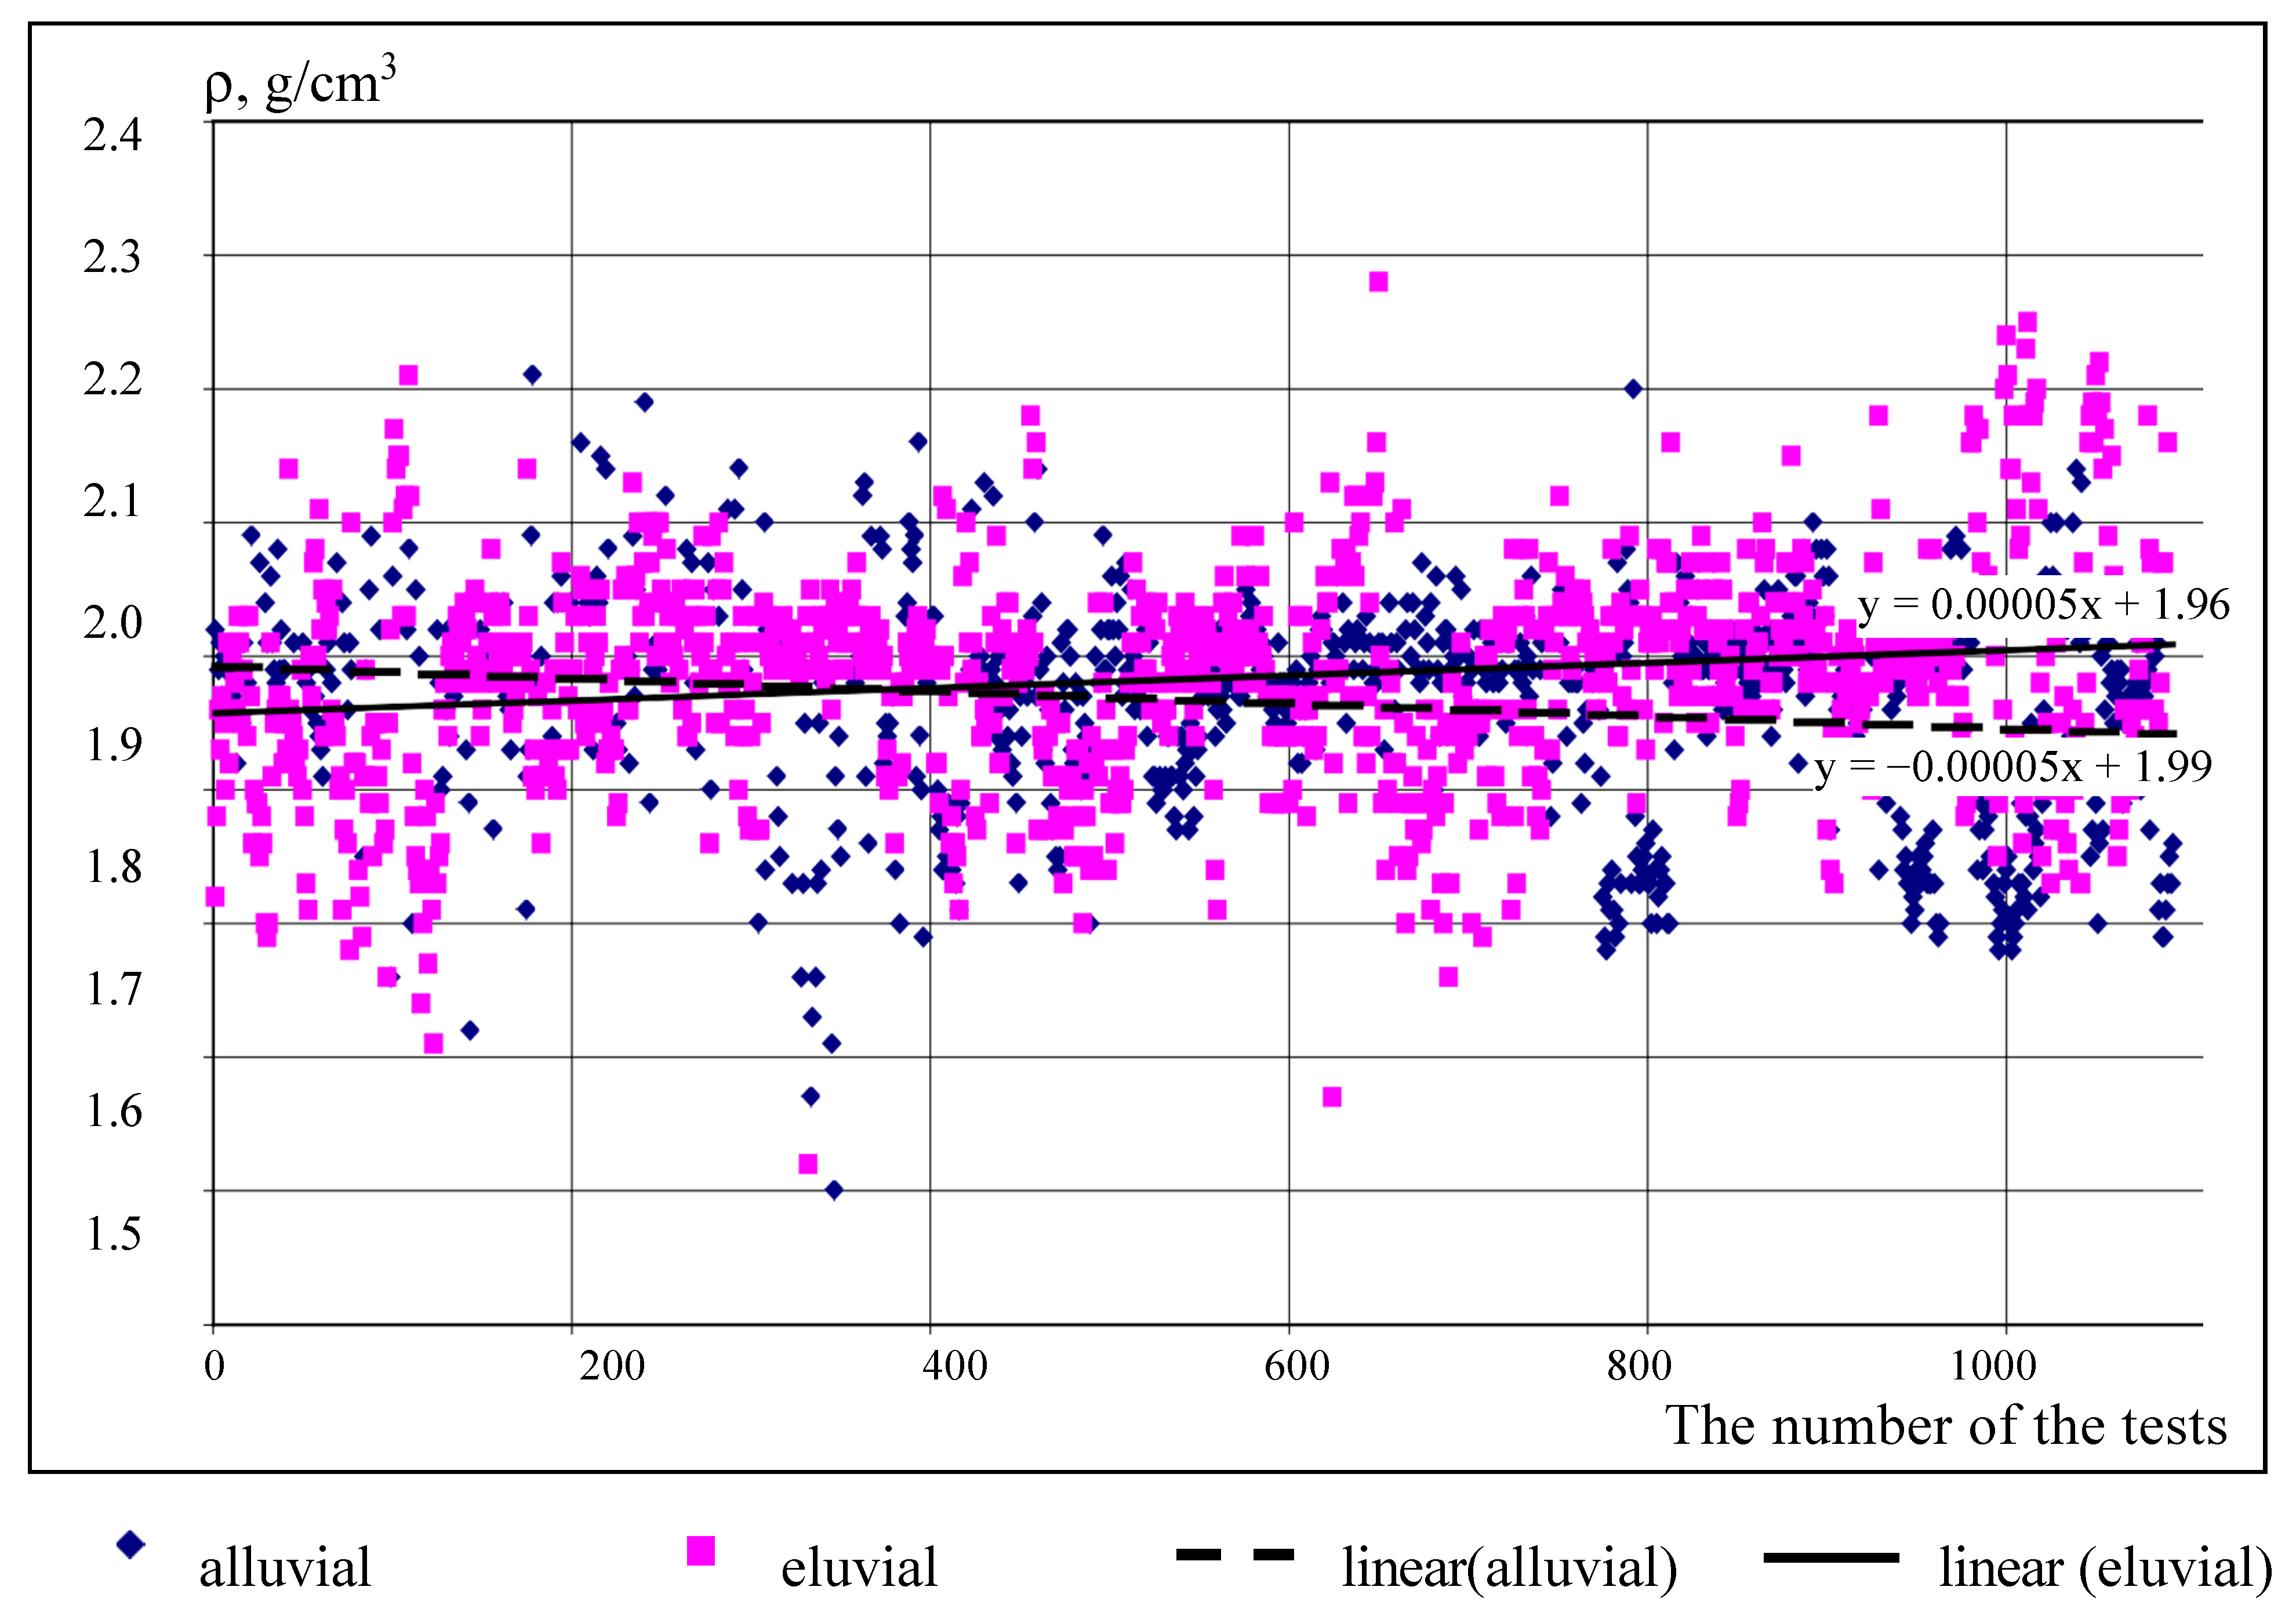
  • physical characteristics: particle size distribution, specific and volumetric weight, volumetric weight of the skeleton, moisture, plasticity and consistency, porosity and coefficient of porosity, water permeability, and other indicators.
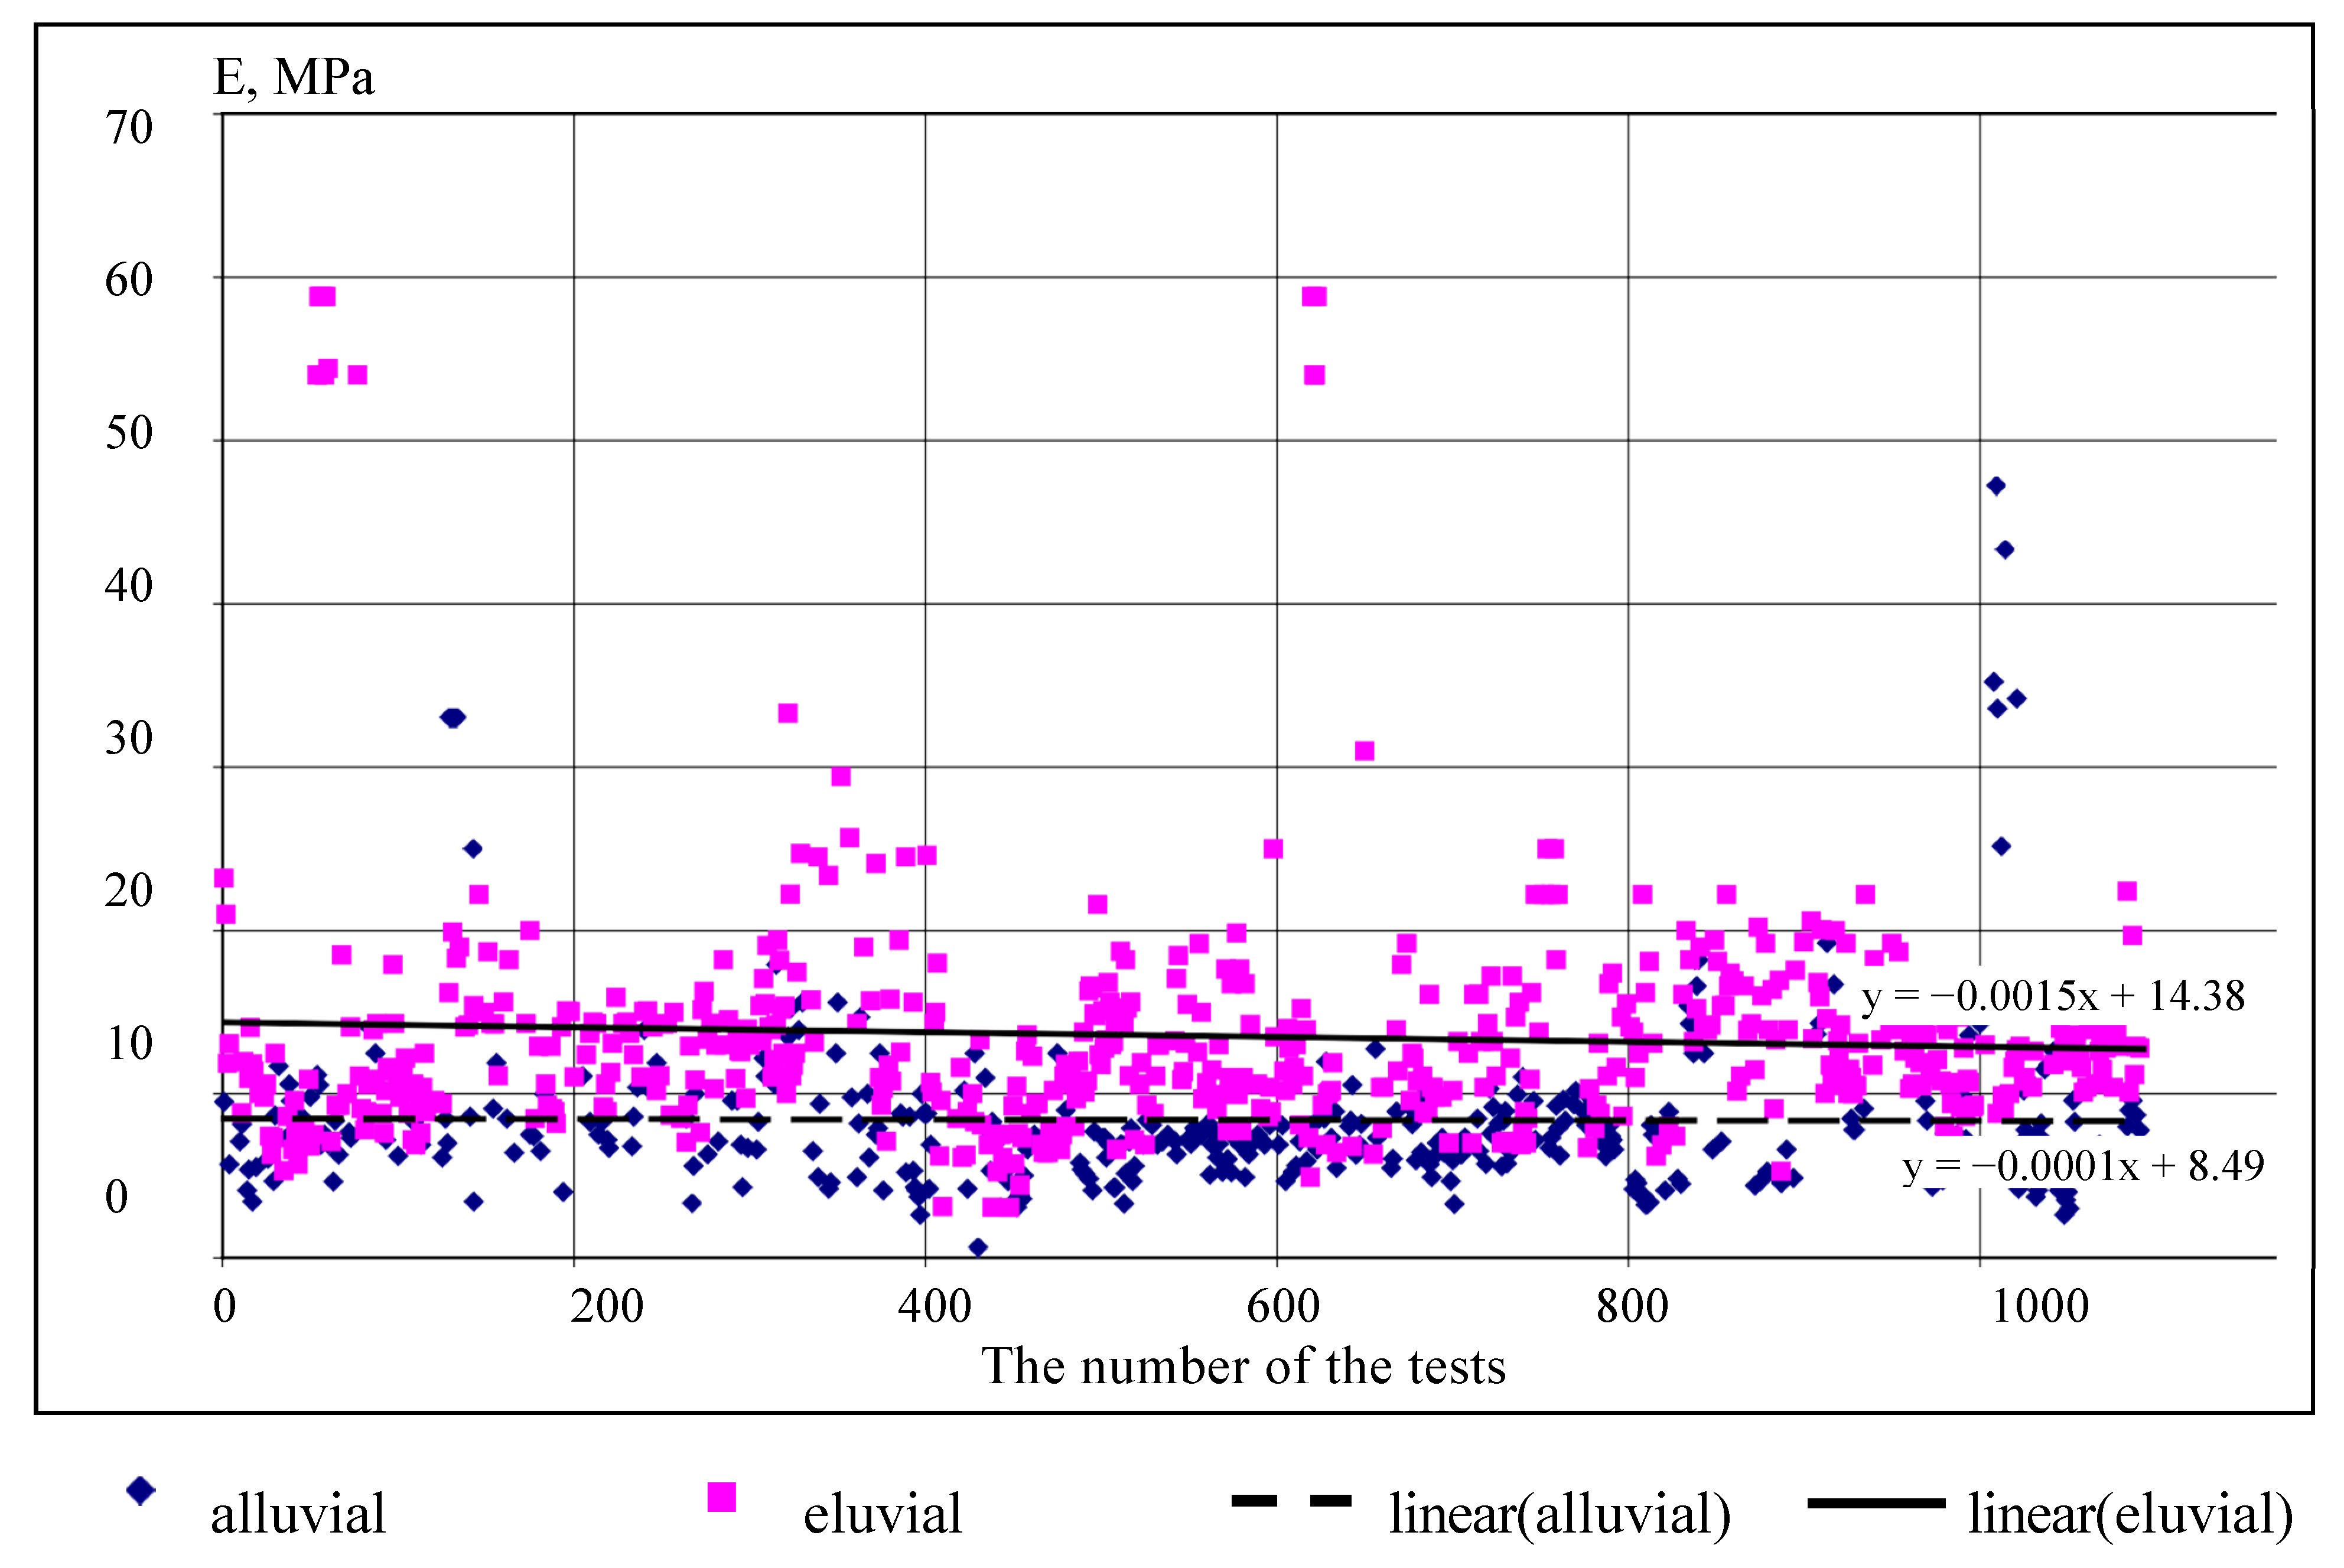
  • mechanical characteristics, which allow assessing the behavior of soils under the influence of external forces: deformation modulus E, which is associated with compressibility of the soils and their bearing capacity.
Figure 3, Figure 4 and Figure 5 show scatter plots of such physical characteristics as plasticity characteristics, natural soil moisture contentand soil density, while Figure 6 represents the enigineering property of the soil on example of deformation modulus E, which consists of elastic and plastic settlements. As we can see from Figure 3a Liquid and Plastic Limits for eluvial soils are higher than for alluvial and visually the boundary is distinguished between these types of soils on the scatter plot. Normal distribution of the Liquid Limit shows the greatest repeatability of LL values between 21 and 26, with a peak at 25–26% water content for alluvial soils. The LL indices for eluvial soil are much higher and the peak here is 39–41%, which indicates the best physical and mechanical properties of the soil, for the liquefaction of which a higher percentage of water is required. We see a similar scatter in Figure 3b with PL, here in alluvial soils the PL values are within 12–25%, with a clear peak concentrated in a group of 14–15%. In eluvial soils, the PL values are obviously higher, and the maximum value falls on 24–25%. Again, on the scatter graph in Figure 3b, the values of eluvial and alluvial soils are visually separated, which cannot be said about the moisture content in Figure 4. This means that the moisture content, despite the fact that the eluvial soils located under the alluvial, is distributed within the same range, although in some areas there is a tendency for a higher percentage of water in the deep eluvial layers of soils.
Bulk density distribution of the eluvial soils in Figure 5 is correspondent to the moisture content in Figure 4, means increased moisture content of the first 170 tests reduced the bulk density values in Figure 5. Further, the data on the bulk density of alluvial and eluvial soils are superimposed on the other, and the bulk density spread is within 1.8–2.2 g/cm3.
Deformation modulus E was obtained by Plate load tests during site investigation, and Static load tests for driven piles during construction (Figure 6). Eluvial soils show a higher deformation modulus E in comparison with alluvial soils and vary within 7–20 MPa and higher. While the majority of alluvial samples vary from 3 to 12 MPa with rare exceptions above these values. This is due to the higher strength properties of eluvial soils compared to alluvial ones, formed by unconsolidated soil or sediment that has been eroded, reshaped by water in some form, and redeposited in a non-marine setting.
Analysis of the scatter plots in Figure 3, Figure 4, Figure 5 and Figure 6 made it possible to divide soil layers into geological elements, i.e., on taxonomic units of mapping, as well as to assess the behavior of soils on the site under the impact of structures on the geological environment. Based on the assessment of the built-up area of the city, in which six main engineering-geological elements (EGE) were identified and the analysis of the physical and mechanical properties of soils was performed, it can be noted that the created program “Geoinformation database” also allows the built-up area to be divided into conditionally homogeneous zones by type of base (Table 2).
EGE-1 includes technogenic deposits (tIV) represented by the topsoil (EGE-1a) and backfill (EGE-1b) layers throughout the construction site. The topsoil mainly consists of sandy clay loam and sandy loam, construction and household waste, which cannot serve as a reliable foundation soil for construction.The thickness varies from 0.2 to 2.0 m. The density of the topsoil and backfill layers fluctuates within 1.87 g/cm3.
EGE-2 is represented by alluvial mid-Quaternary modern deposits a(QII-IV) with a thickness of 0.9 to 10.0 m, consisting of sandy clay loam (EGE-2a) with interlayering loamy sands and sandy loam soils (EGE-2b), clays (EGE-2c) and silty soils (EGE-2d). Over their entire thickness, they have lenses and inter layers of sands of various sizes up to 1–3 cm, sometimes up to 10 cm. EGE-2 is located directly under the EGE-1 and is a part of the stratum of weak water-saturated soils spread over the territory of Nur-Sultan in a medium plastic, highly plastic, and liquid state and can be considered as a highly compressible base.
EGE-3 is located at the depth of 2, 5–8, and 0 m and consists of sands of various sizes (EGE-3a), gravelly sands (EGE-3b) and gravel soils (EGE-3c), belonging to alluvial medium-Quaternary sand and gravel formations a(QII-IV). The thickness of sands of various sizes varies from 0.4 to 6.3 m, gravelly sands from 0.5 to 6.5 m, gravel soils from 1.0 to 9.2 m. According to the field description, all sand and gravel soils are similar in color, some presence of clayey lenses and differ only in the amount of the determining fraction. All these deposits have a horizontal stratification.
EGE-4 eluvial formations of the weathering crust e(C1) are presented in the form of sandy clay loams and located beneath the sand and gravel alluvial formations at a depth of 6.0–10.0 m. They are mainly presented in the form of gray, greenish-gray and yellowish-gray clays and loams, ferruginous, manganese, with the inclusion of coarse material up to 25%, and in some intervals up to 40%.
EGE-5 includes gravelly, gruss and rubble soils of eluvial formations of the weathering crust e(C1). EGE-5 is widespread on the site and have been found at a depth of 7.0 to 23.0 m. The thickness of rubble-gravel soils varies from 1.7 to 9.0 m. According to the particle size analysis, grit-crushed gruss and rubble soils are characterized by the content of the defining fraction (particles larger than 2.0 mm) from 81.3% to 98.5% with an average value of 92.3%. The density of the soil is 2.14 g/cm3.
EGE-6 is consists of sedimentary rocks of the Lower Carboniferous (C1) that are represented mainly by sandstones, which are inter bedded with siltstones and mudstones of the same age throughout their entire thickness. They occur at depths from 11.6 to 26.2 m, the thickness of which varies from 3.8 to 23.0 m. Sandstones and siltstones are gray, dark gray and greenish gray, fractured, along the fractures ferruginous and manganese, weathered.
In accordance with the above sequence of constructing a map of the first group, using the “Geographic Information Database” program, engineering-geological sections were built, which made it possible to assess the conditions of soil occurrence. Based on the analysis of the obtained sections, it was revealed that these elements form about eight types of bases before the bedrock (Figure 7).
So, according to Figure 7b, there are three soil layers in Zone 1. The first soil type represented by the topsoil (EGE-1a) with the thickness most often less than 1 m, cannot serve as a foundation soil for construction (Table 3). Beneath there are sandy clay loams a(QII-IV) designated as EGE-2a. Below the alluvial layer there is eluvia layer of sandy clay loams e(C1) (EGE-4).
Investigating the engineering and geological characteristics of the soil foundations of many objects in Nur-Sultan, on the basis of the field description of the soils and the results of laboratory tests, an assessment was made on the built-up area of the city. On the territory of Nur-Sultan, there are soils of various origin and age.

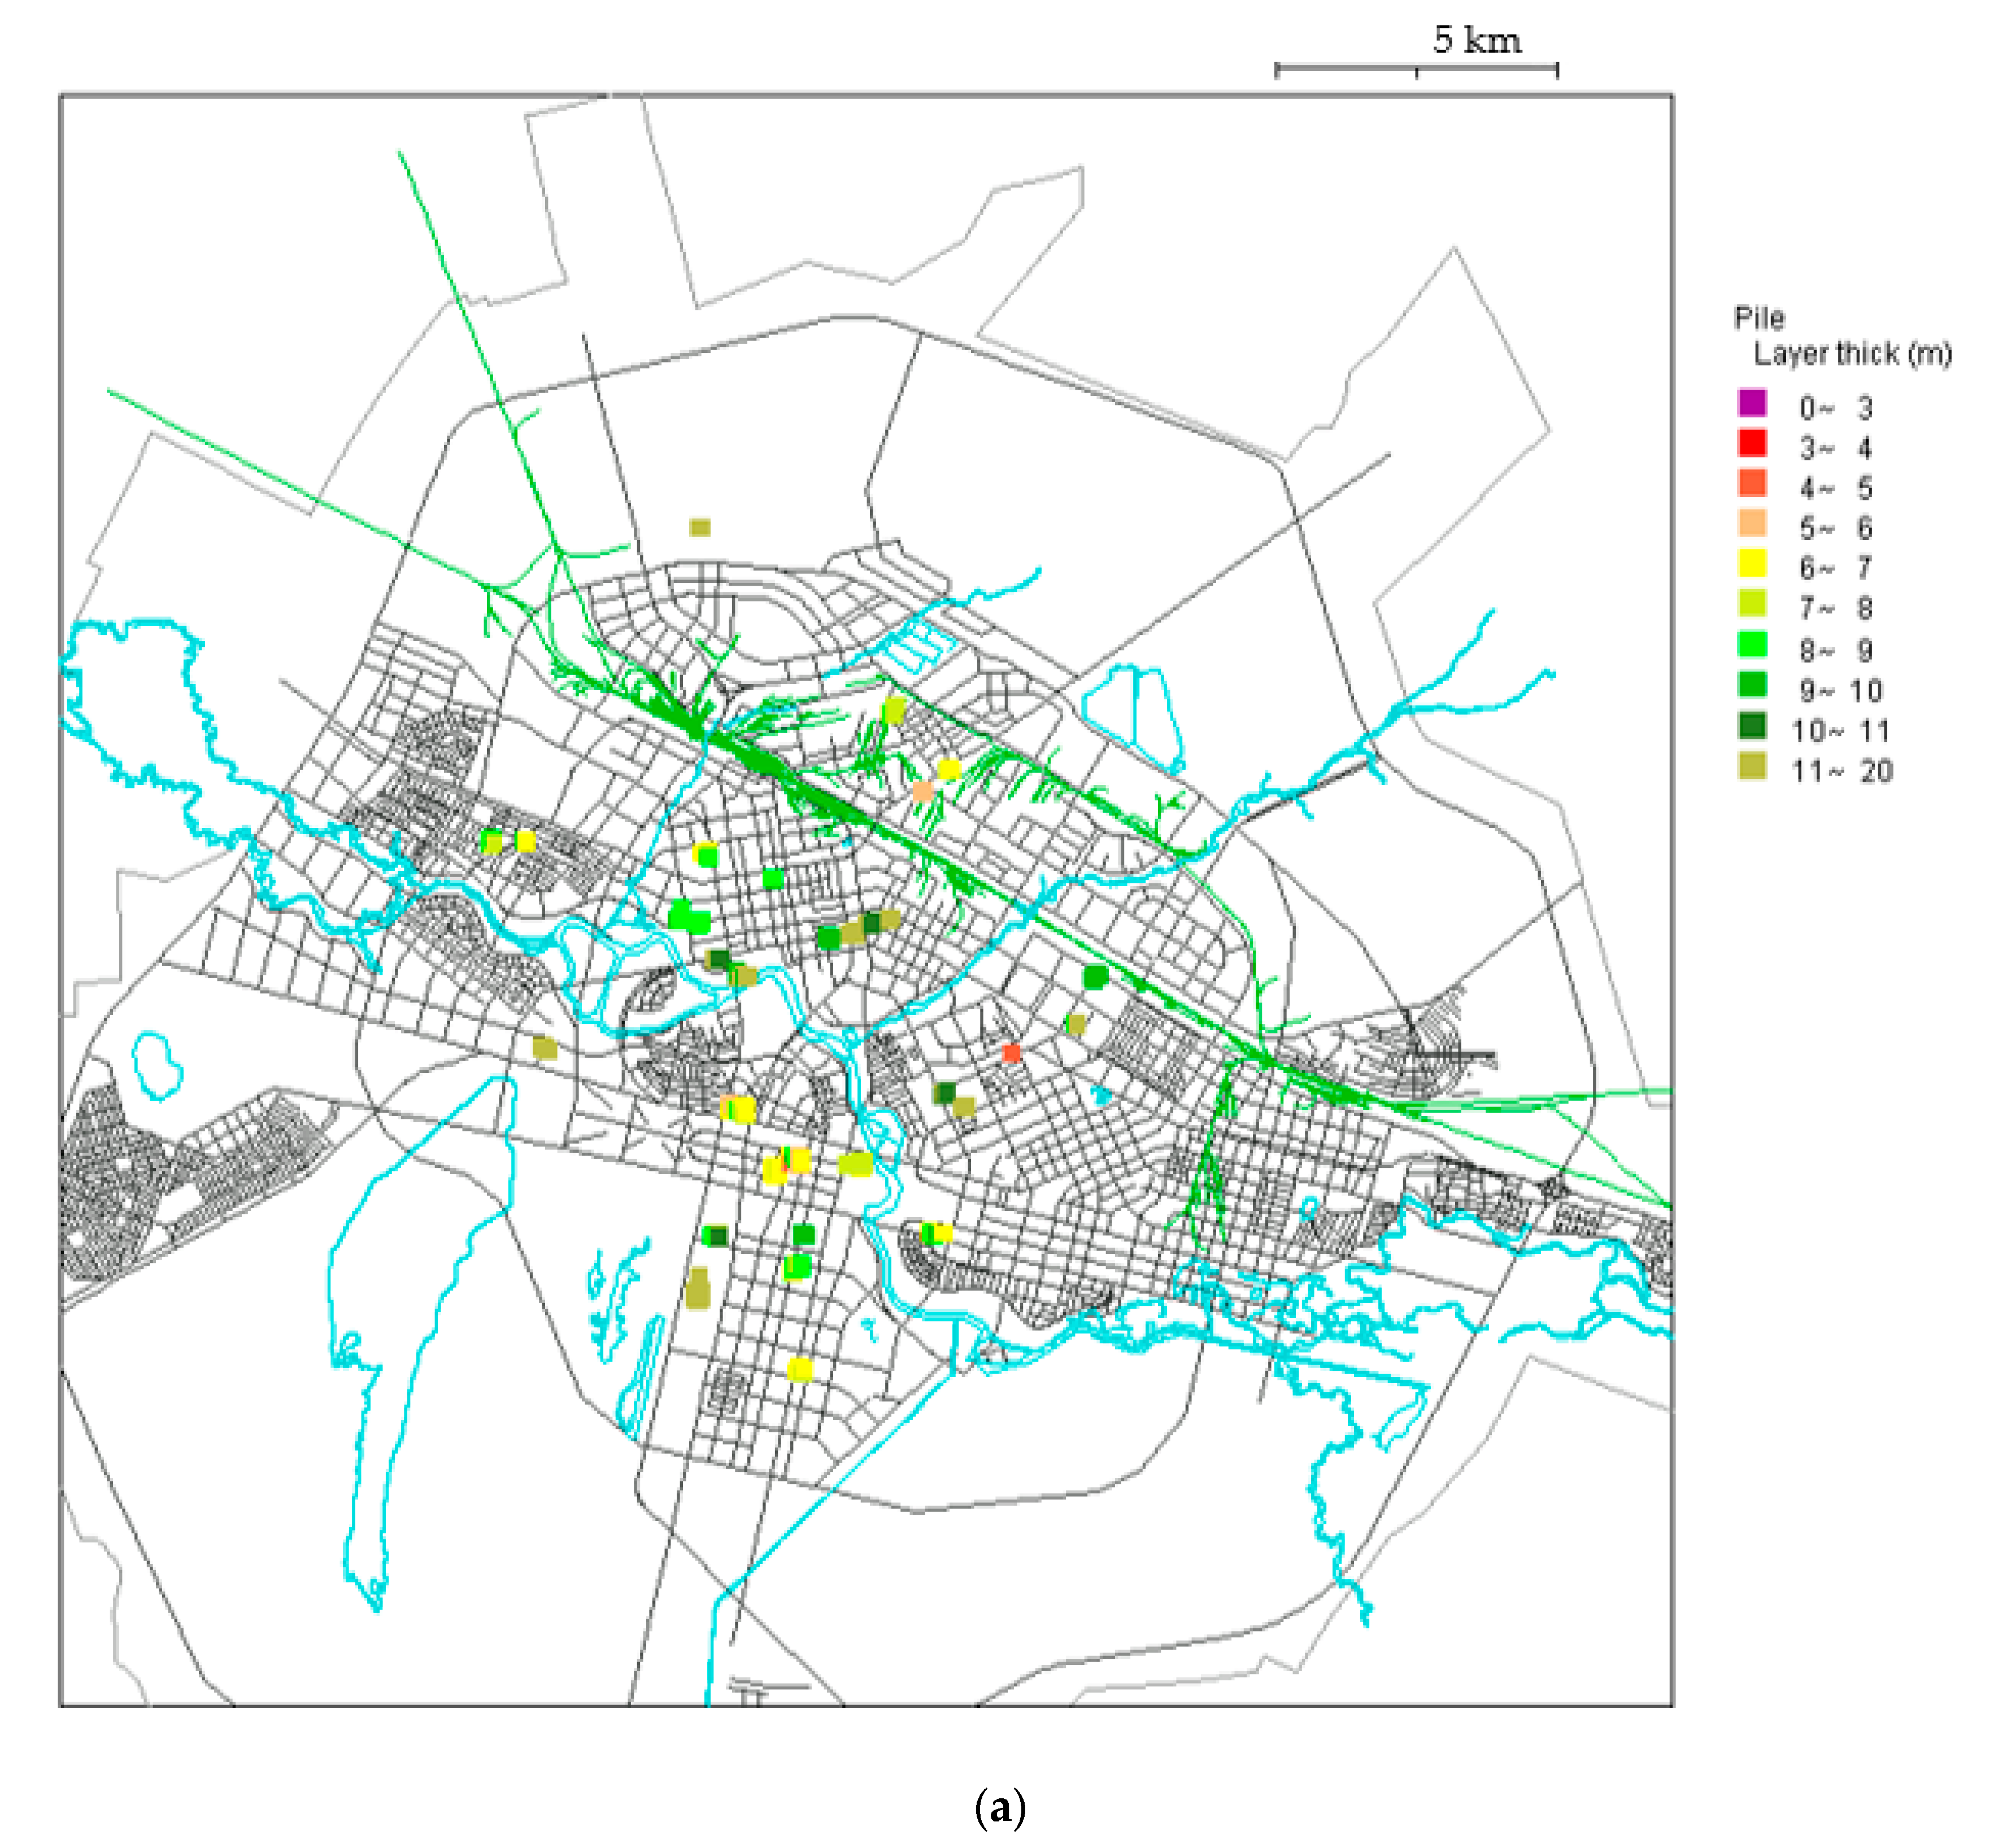
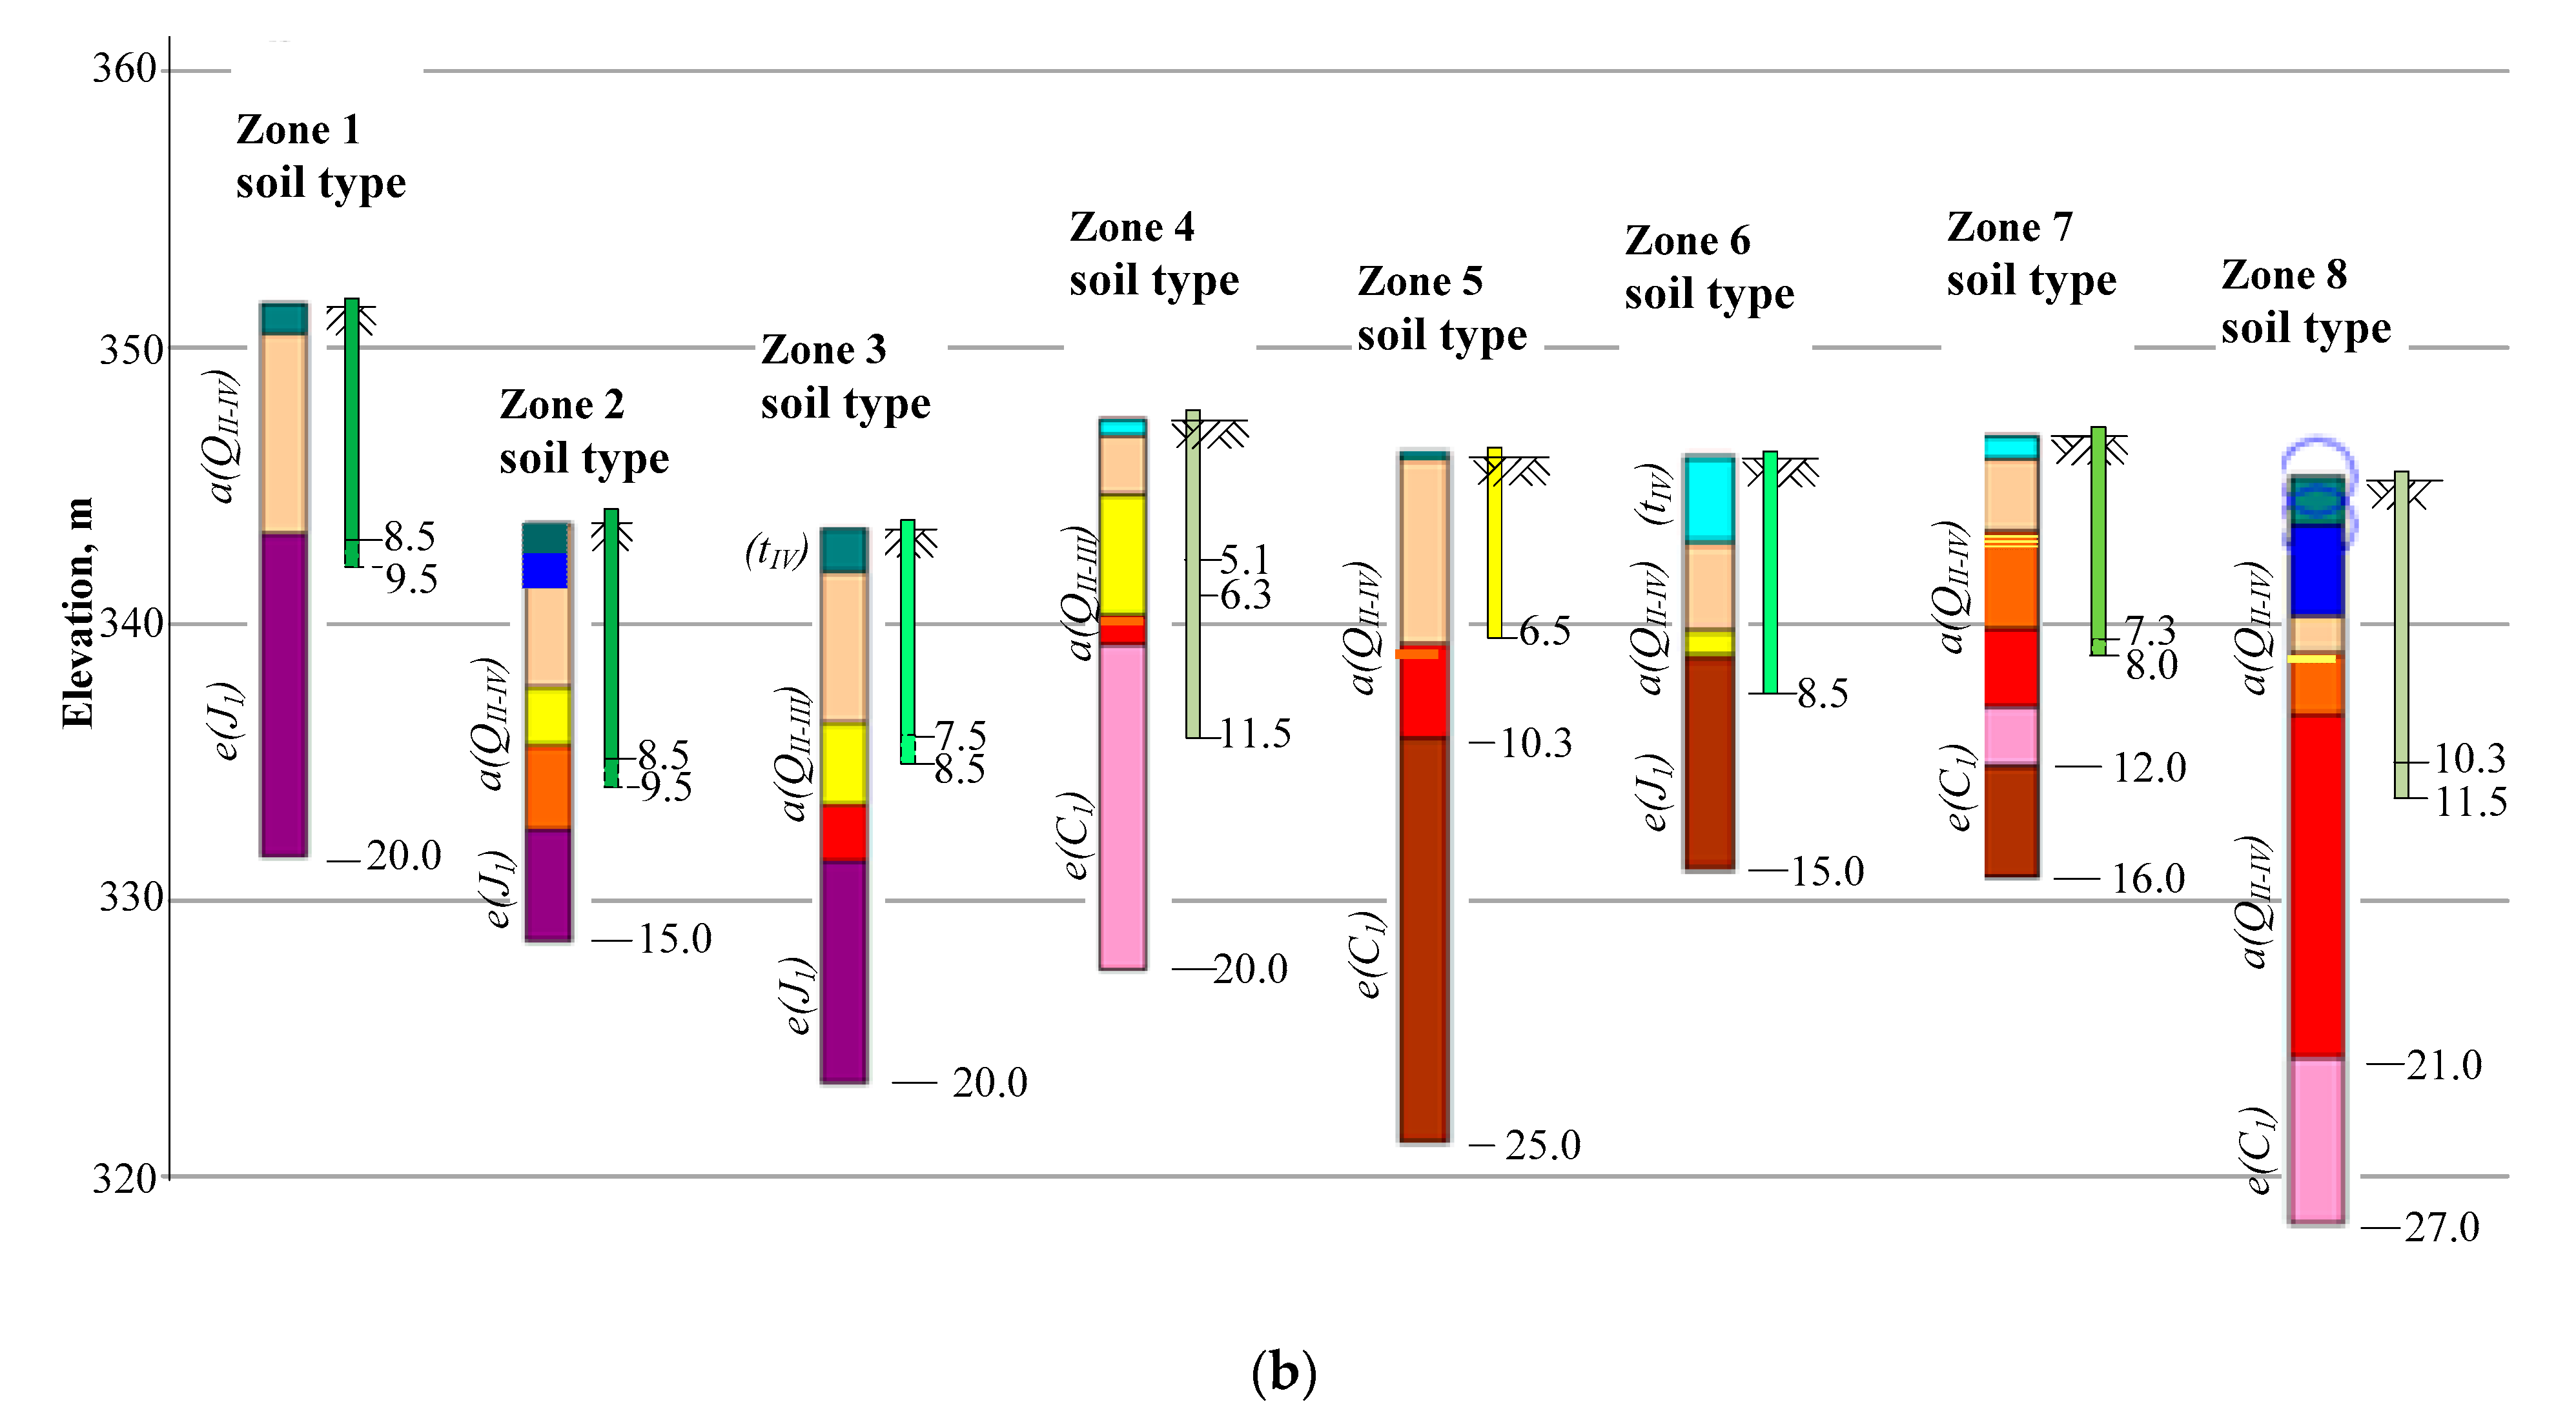
4. Construction of a Special Geotechnical Zoning Map in Order to Optimize the Length of the Piles

With the help of the Geoinformation Database program, contour maps of optimal pile lengths were built, taking into account field observations under similar engineering and geological conditions. This made it possible to build a map of engineering-geological zoning to optimize the lengths of driven piles for buildings of a standard level of responsibility, taking into account the type of foundation. The previously performed Static pile load test results were recorded in the geotechnical database and taken as a basis for creating an optimization map for the length of piles in various zones of the city. The Static load tests (SLT) of the driven piles were carried out with the addition of a load of 120 kN for each step during the first five loading steps. The settlement was recorded until it stabilized at each stage, i.e., until the sediment per hour did not exceed 0.1 mm. Then there were seven steps with an addition of 60 kN. The maximum load was 680 kN. Unloading run by 120 kN every 15 min for three steps, then 180 kN and 240 kN. The bearing capacity of the driven piles according to Standard SNIP RK 5.01–03.2002 [30] and based on the test results is presented for each zone in Table 4.
According to Figure 8, in zones 1 and 2 pile driving to the required depth, i.e., when the base of the support firmly rests on its deep layers of high density, it varies within 8.5, 9.0, and 9.5 m. In zone 3, due to the underlying gravelly soils, the length of the driven pile is reduced to 7.5, 8.0, and 8.5 m. In zone 4 above gravelly soils there is a sufficiently reliable sand layer in some places and in this case the length of the driven pile is reduced to 5.1, 5.6, and 6.3 m in its different points. While in other places the designed length of the driven piles has been extended to 11.5 m, due to the lower occurrence of soils with sufficient bearing capacity. The similar stratification is in zone 5 where weak soils comprise top the 6.5 m. Following geographical location of zone 4 and 5, they occupy practically the entire Left Bank of the Esil River. Optimal pile length for zone 6 is 8.5 m, although it is possible that the best stratification in terms of engineering and geological properties was represented for zone 6 in Figure 8. It is necessary to take into account that stratification and the placement of rock debris changes with depth varies as it approaches the Esil River. Due to the alluvial composition of soils, zone 7 is mainly allocated for parks, green zones, or reinforced with additional measures for use for engineering structures: bridges and overpasses. State construction projects, the house of ministries are also located there, and therefore obtaining detailed data on the depth of the pile was obstructed. Zone 8 is the territory of the famous architectural complex Khan-Shatyr as well as residential areas of Zhagalau. The territory is complicated by frequent seasonal flooding, but thanks to restorative procedures, it was drained and represents silty soils, alluvial loam layers over gravely soils. The optimal pile length starts from 10.3 m and lower depending on the results of field research methods on the site.

5. Discussion

Analysis of a similar interposition of the EGE with a related geological origin made it possible to recreate a 3D model of soils of the foundations of the city of Nur-Sultan. Firstly, it was possible to regroup the territory of the city into eight zones instead of the previous five [23]. Moreover, although the physical-mechanical and engineering-geological properties in the EGE varied within certain limits, this somehow helped to generalize soil stratification and make an overall assessment of the bearing capacity.
From the analysis of the scatter plot graphs of physical characteristics, it follows that the scattering ranges, as well as the limiting values of indicators of various soil properties, reflect their dependence not only on the conditions of formation, but also on genetic characteristics. This is most evident when comparing the limiting values of indicators of physical properties and, in particular, such as liquid limit (Figure 3a), the maximum values of which for alluvial deposits almost coincide with the minimum values for eluvial loams and clays. In terms of mechanical properties, such accurate distribution of the data is somewhat confirmed for compressibility values (Figure 6).
From the data considered above, the most likely outcome is the probable and significant scattering of soil properties indicators, which leads to the need to take this into account when solving issues related to the assessment of engineering-geological conditions for the construction of various buildings and structures. An objective analysis of these issues can be implemented only if the scattering, with its discernible chaos, will be distributed according to certain regularity. So, the increased liquid and plastic limits replicates to higher values of deformation modulus E, and hence better strength characteristics of a particular soil layer and vice versa.
The values of indicators of any soil property in these cases represent a statistical set obtained in the study of a certain number of samples. When considering the indicators of a series of the same type, a statistical population is formed that corresponds to an empirical or experimental distribution, representing the distribution of indicators in certain groups identified during research. Establishing patterns of empirical distribution was necessary to obtain a general assessment of the indicator of the studied soil layer or part of it. Such variation in the tested physical characteristics of alluvial soils like in Figure 3a–d indicates frequent layering of soil varieties both horizontally and in depth.
However, these distributions, in particular those concerning engineering characteristics, often did not obey any obvious pattern and required additional verification on the construction site.
Secondly, the main distinguishing feature of this work from the previous studies [10,11,24,25,29,31] is the creation of a geotechnical map that was built for the driven piles. According to the geological structure of the foundations, the optimal variations in the pile length for each city zone were determined. As can be seen from Figure 7, the optimal pile length varies from 6 to 8 m in the most stable soils of the city to 12 m near the coast of the Ishim River, in occasionally reaching 16 m of the length necessary to ensure the bearing capacity of the pile–soil system in an area with a large thickness of alluvial soils. In the right coast of the city (upper zone in Figure 7), stronger soils or a shallow location of eluvial soils are noted near the railway line in the area of the old city. The increased depth of piles of 16 m and more in the lower left part of Figure 7 is justified by swampy areas and a high level of groundwater of zone 8 in Figure 6, a high content of subspecies of alluvial soils, which have low rates compared to deeply buried eluvium soils.
Although analytical methods for assessing the bearing capacity of piles are significantly inferior in reliability to experimental research methods and do not provide sufficient accuracy in determining the design load allowed on a pile, zoning map of the pile length provides the big picture of the foundation capacity for the city. The improvement of methods for calculating pile foundations should be carried out taking into account the results of long-term field observations and static processing of pile test results.

6. Conclusions

Based on the analysis of physical and mechanical characteristics, the territory of the city of Nur-sultan was subdivided into eight zones where zones 4, 7, and 8 have stratification into several types of alluvial soils in the geological column, and therefore are considered the most difficult in the design of buildings and structures on them. The above zones are located on the left bank of the Ishim River, where in recent years the significant landmarks, business center of the capital as well as extensive park areas have been built. Vice versa, the districts of the old city are located in zones 3 and 1, where there is practically no engineering-geological element 3, belonging to alluvial medium-Quaternary sand and gravel formations a(QII-IV).
Summarizing main research findings, the following main points can be highlighted:
(1)
The algorithm for collecting geoinformation data to create a single data set is presented.
(2)
The program “Geoinformation Database “ was developed for
creating engineering and geological maps of construction sites,
study and analyze the results of engineering and geological surveys;
identify the main engineering and geological elements;
to build special geotechnical maps of Quaternary deposits and bedrocks for the city.
(3)
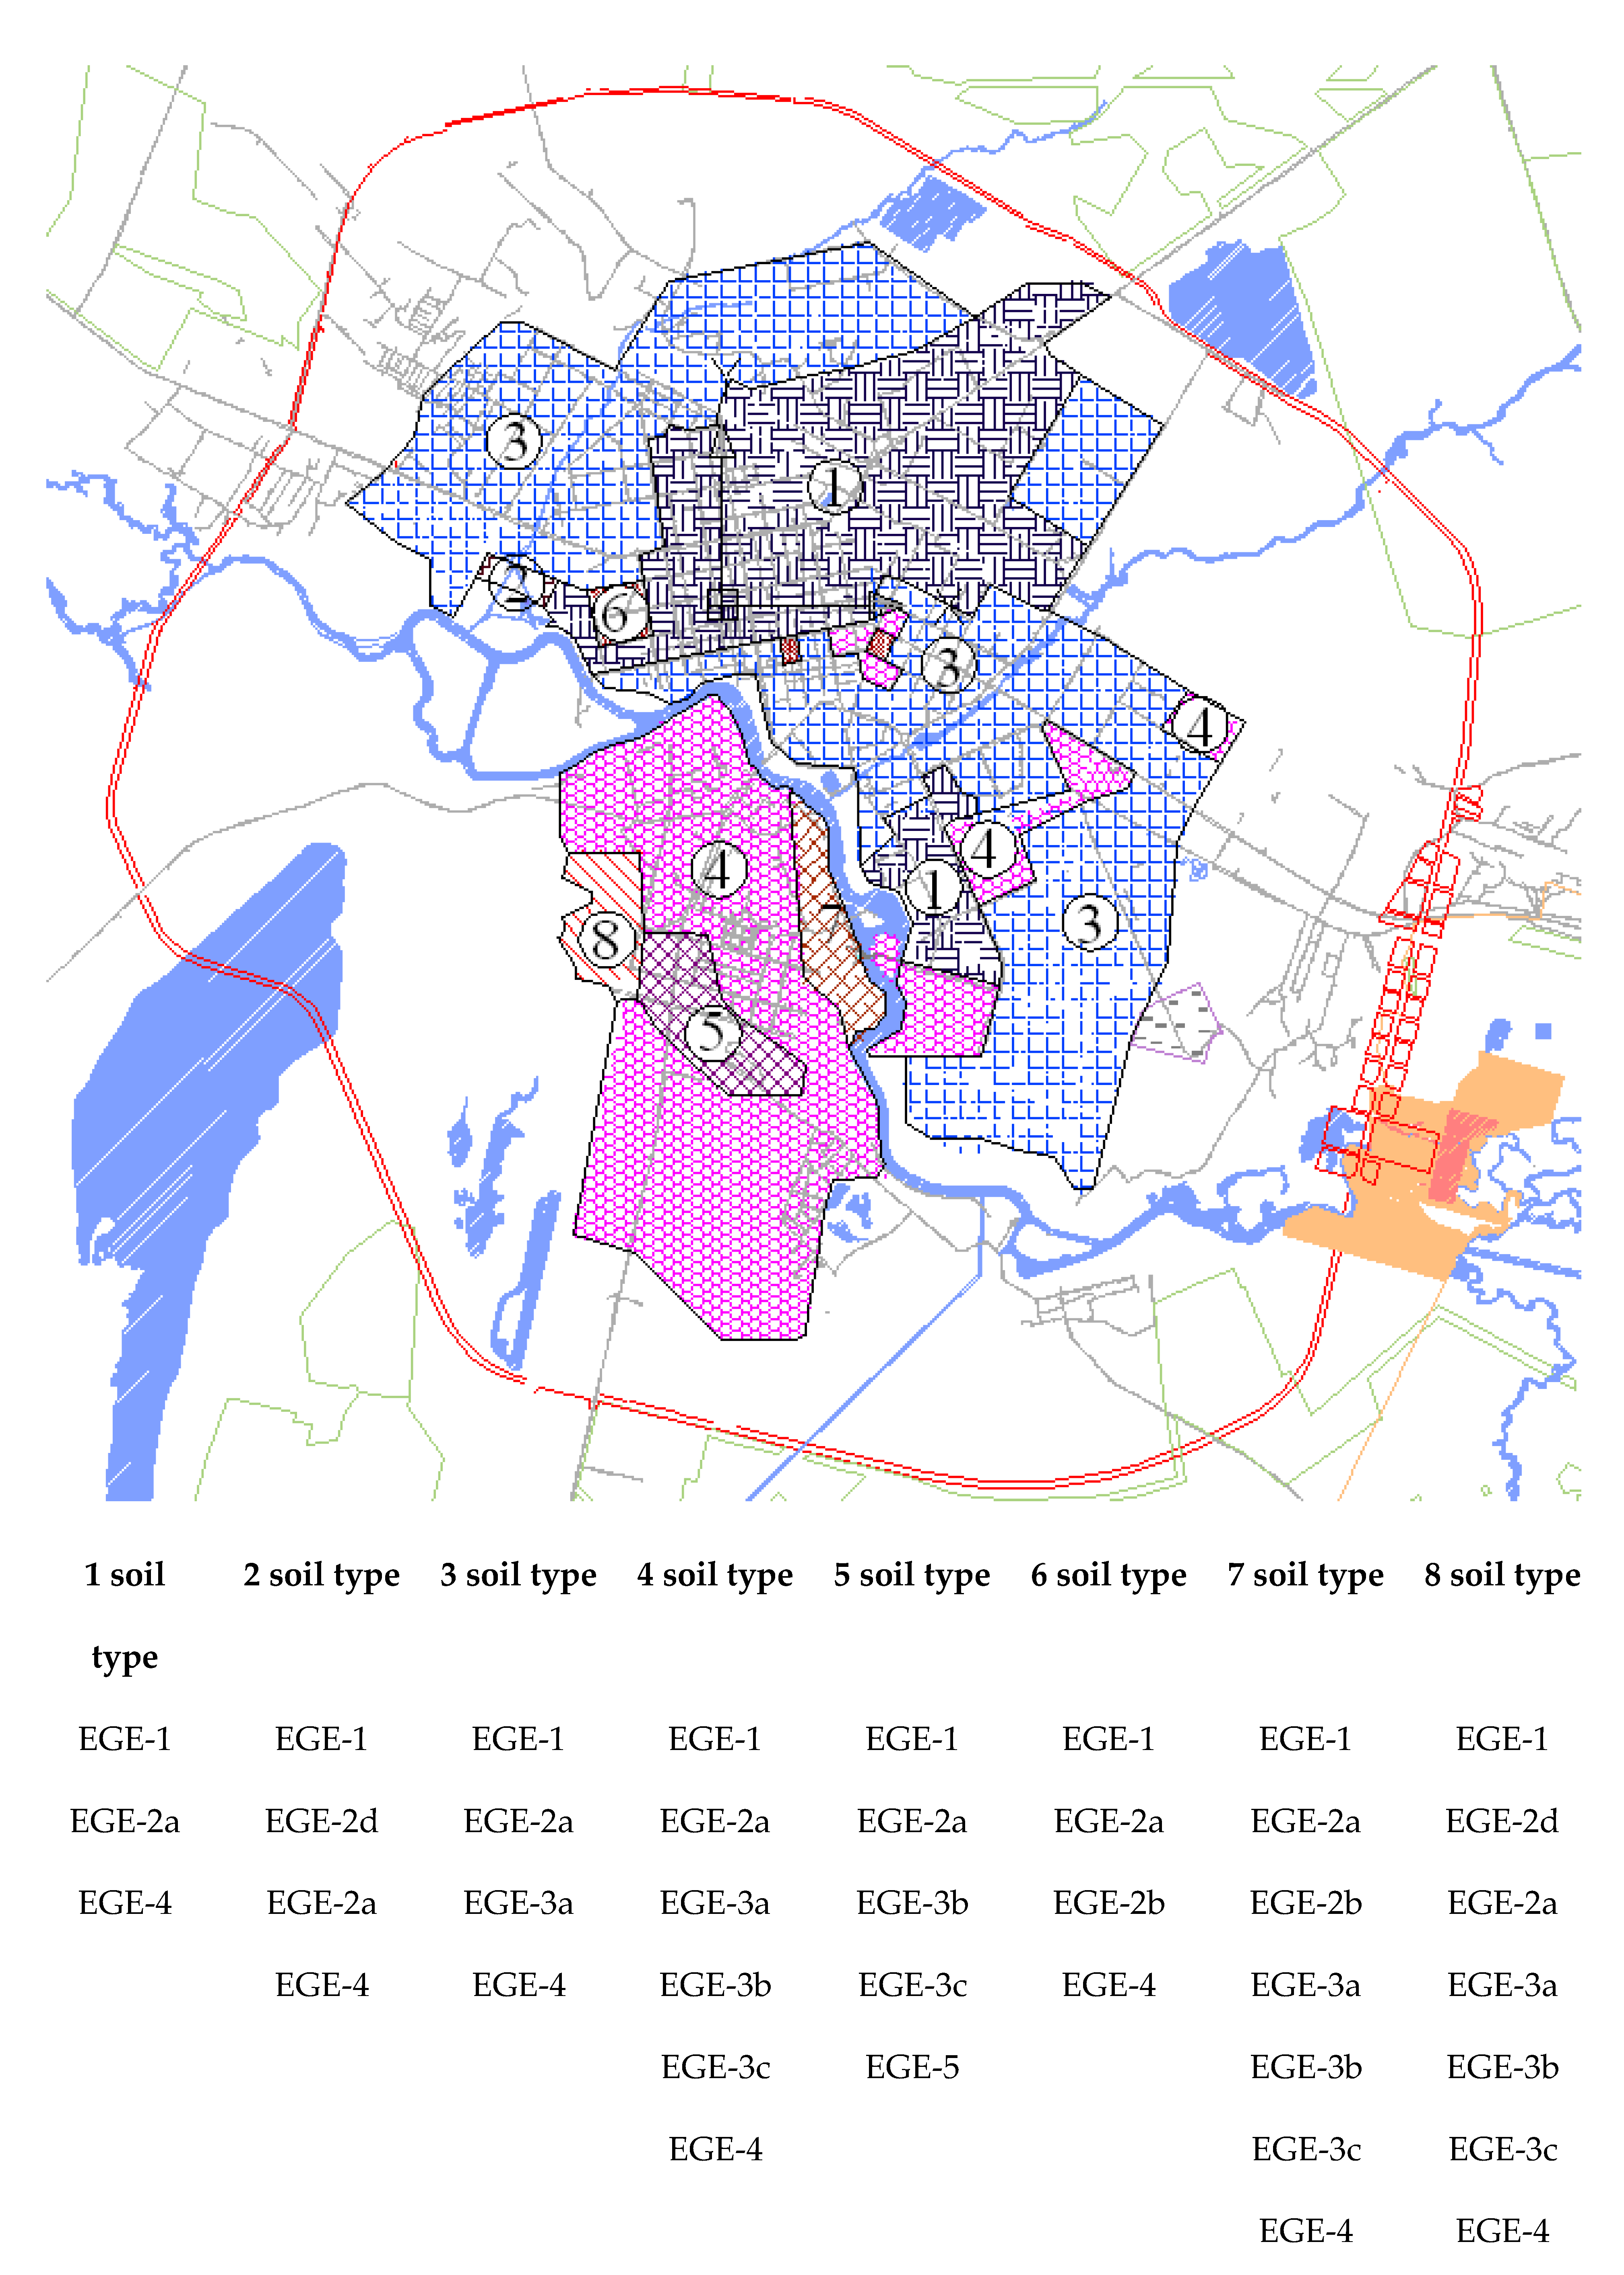
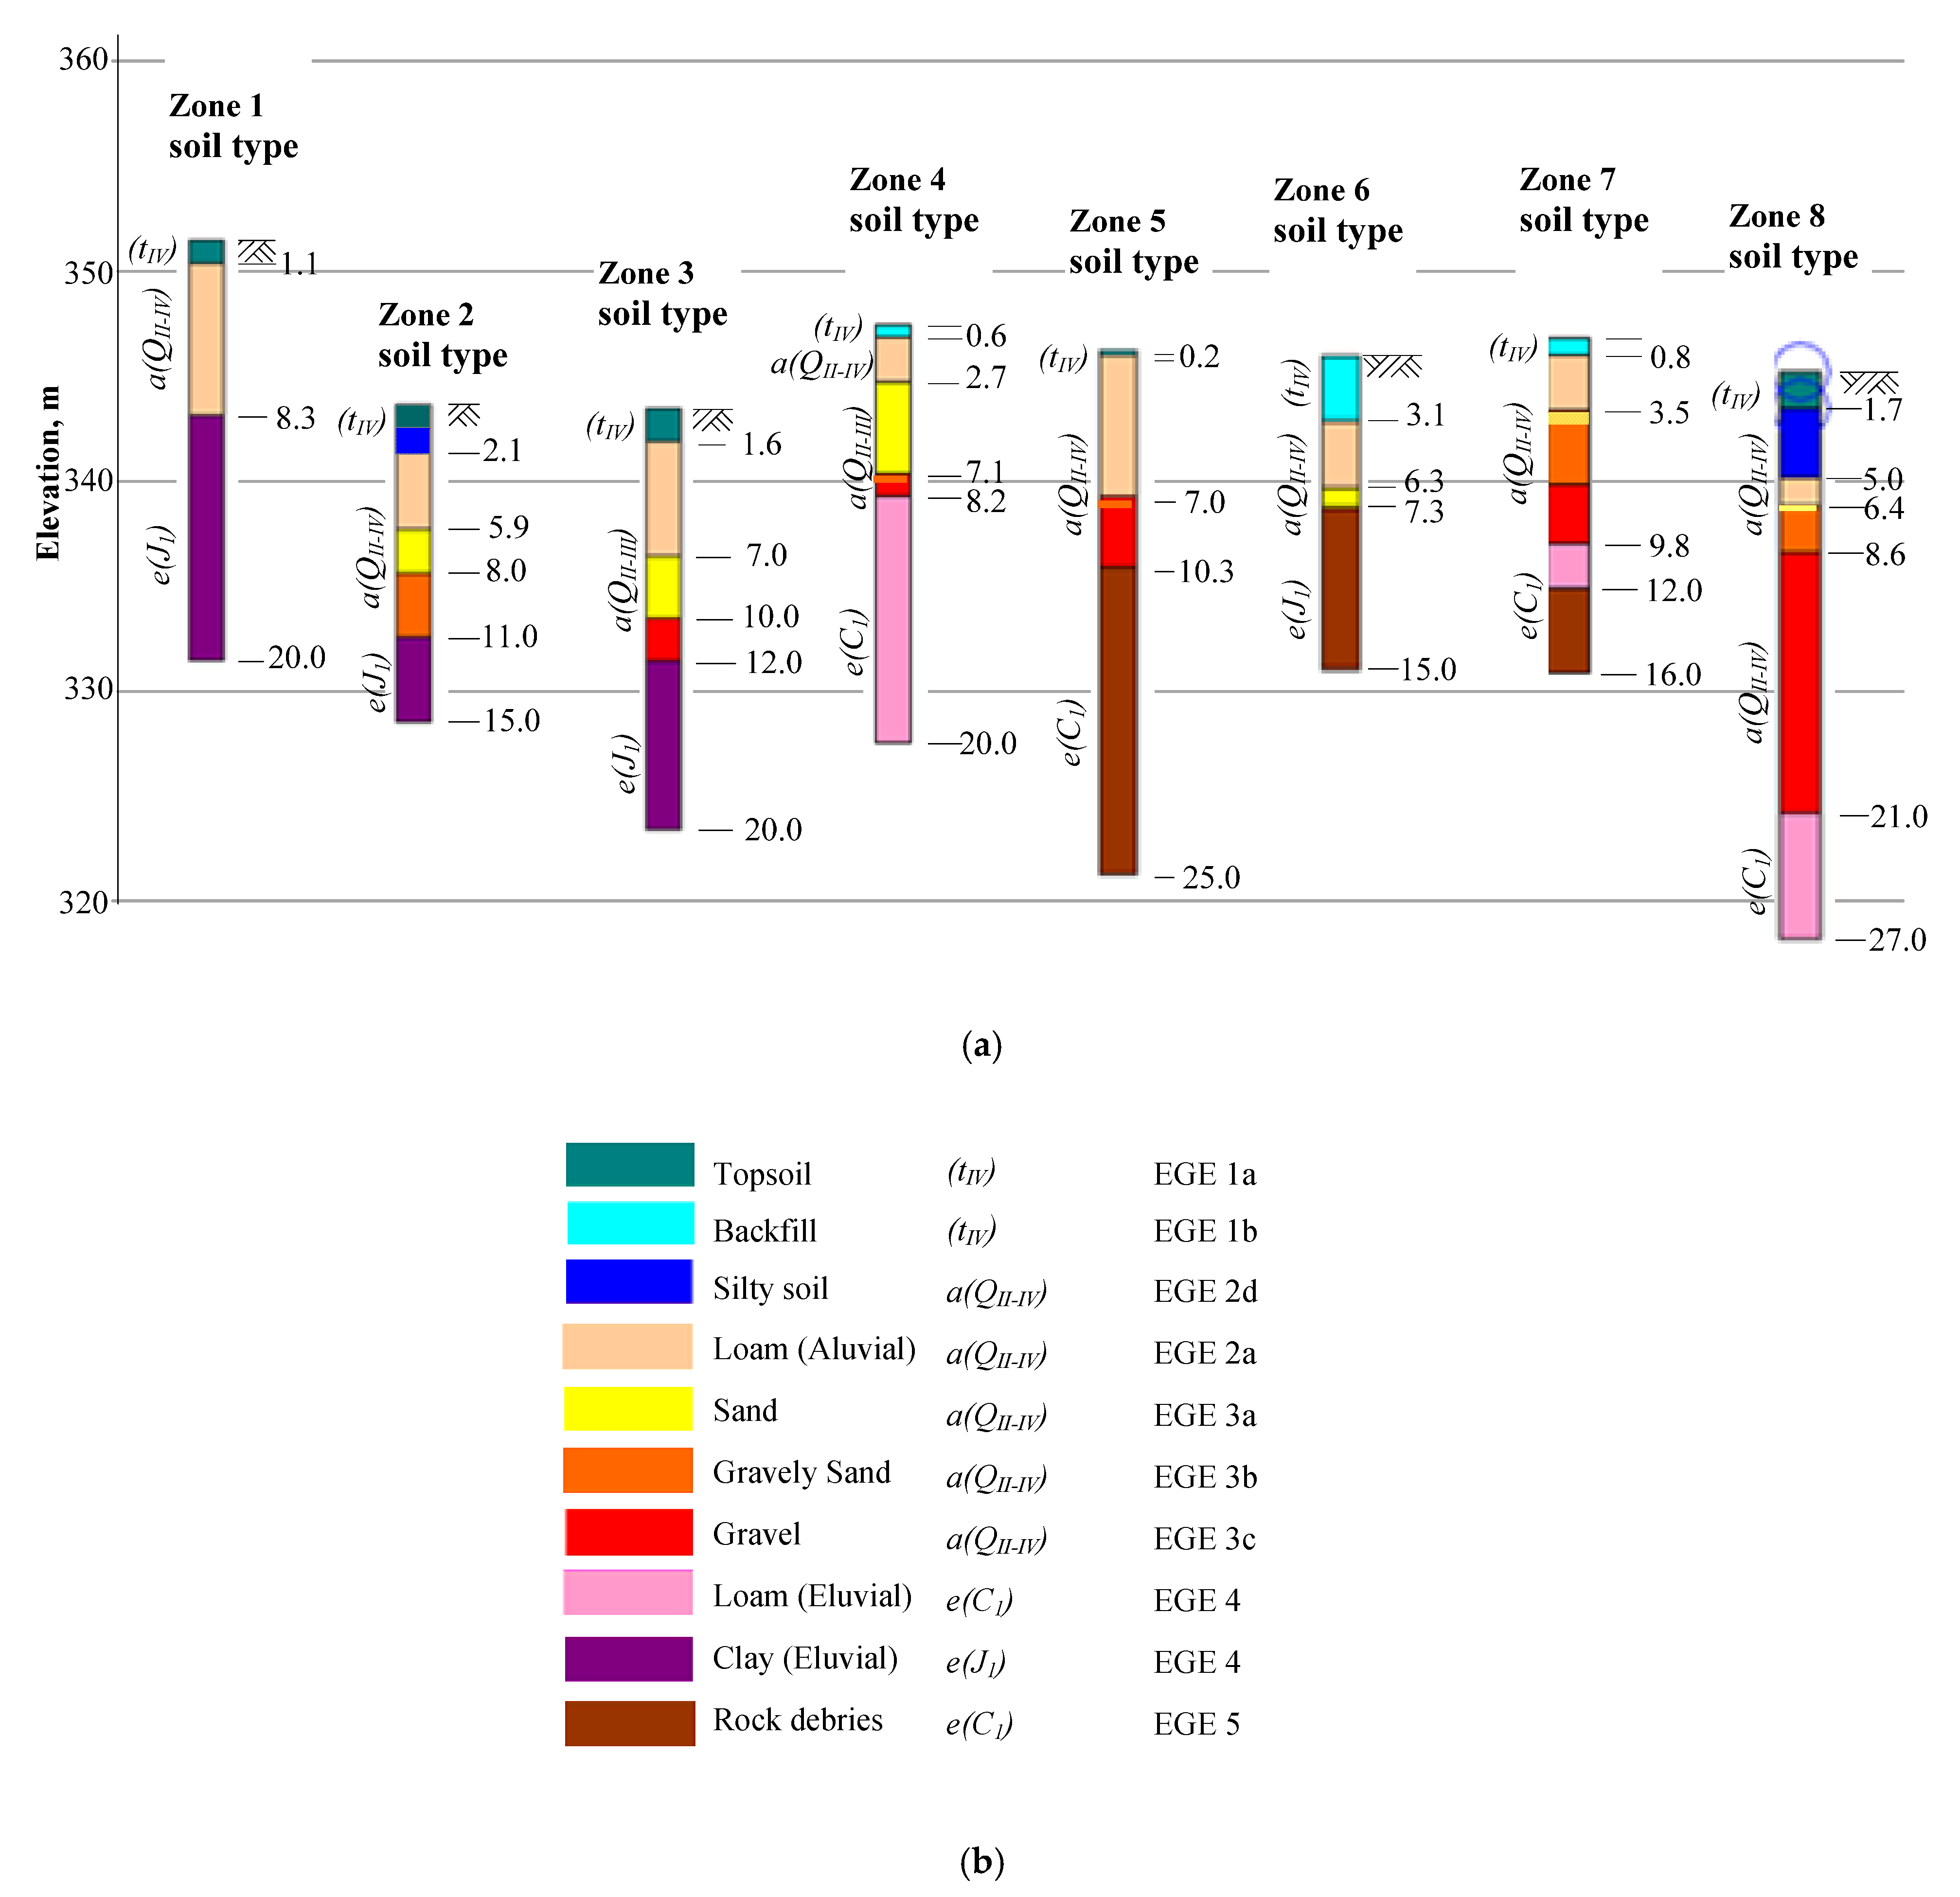
The territory of the city of Nur-Sultan was regrouped into eight zones instead of the previous six, based on the geological origin and stratigraphy interposition of the six main engineering-geological elements (EGE).
(4)
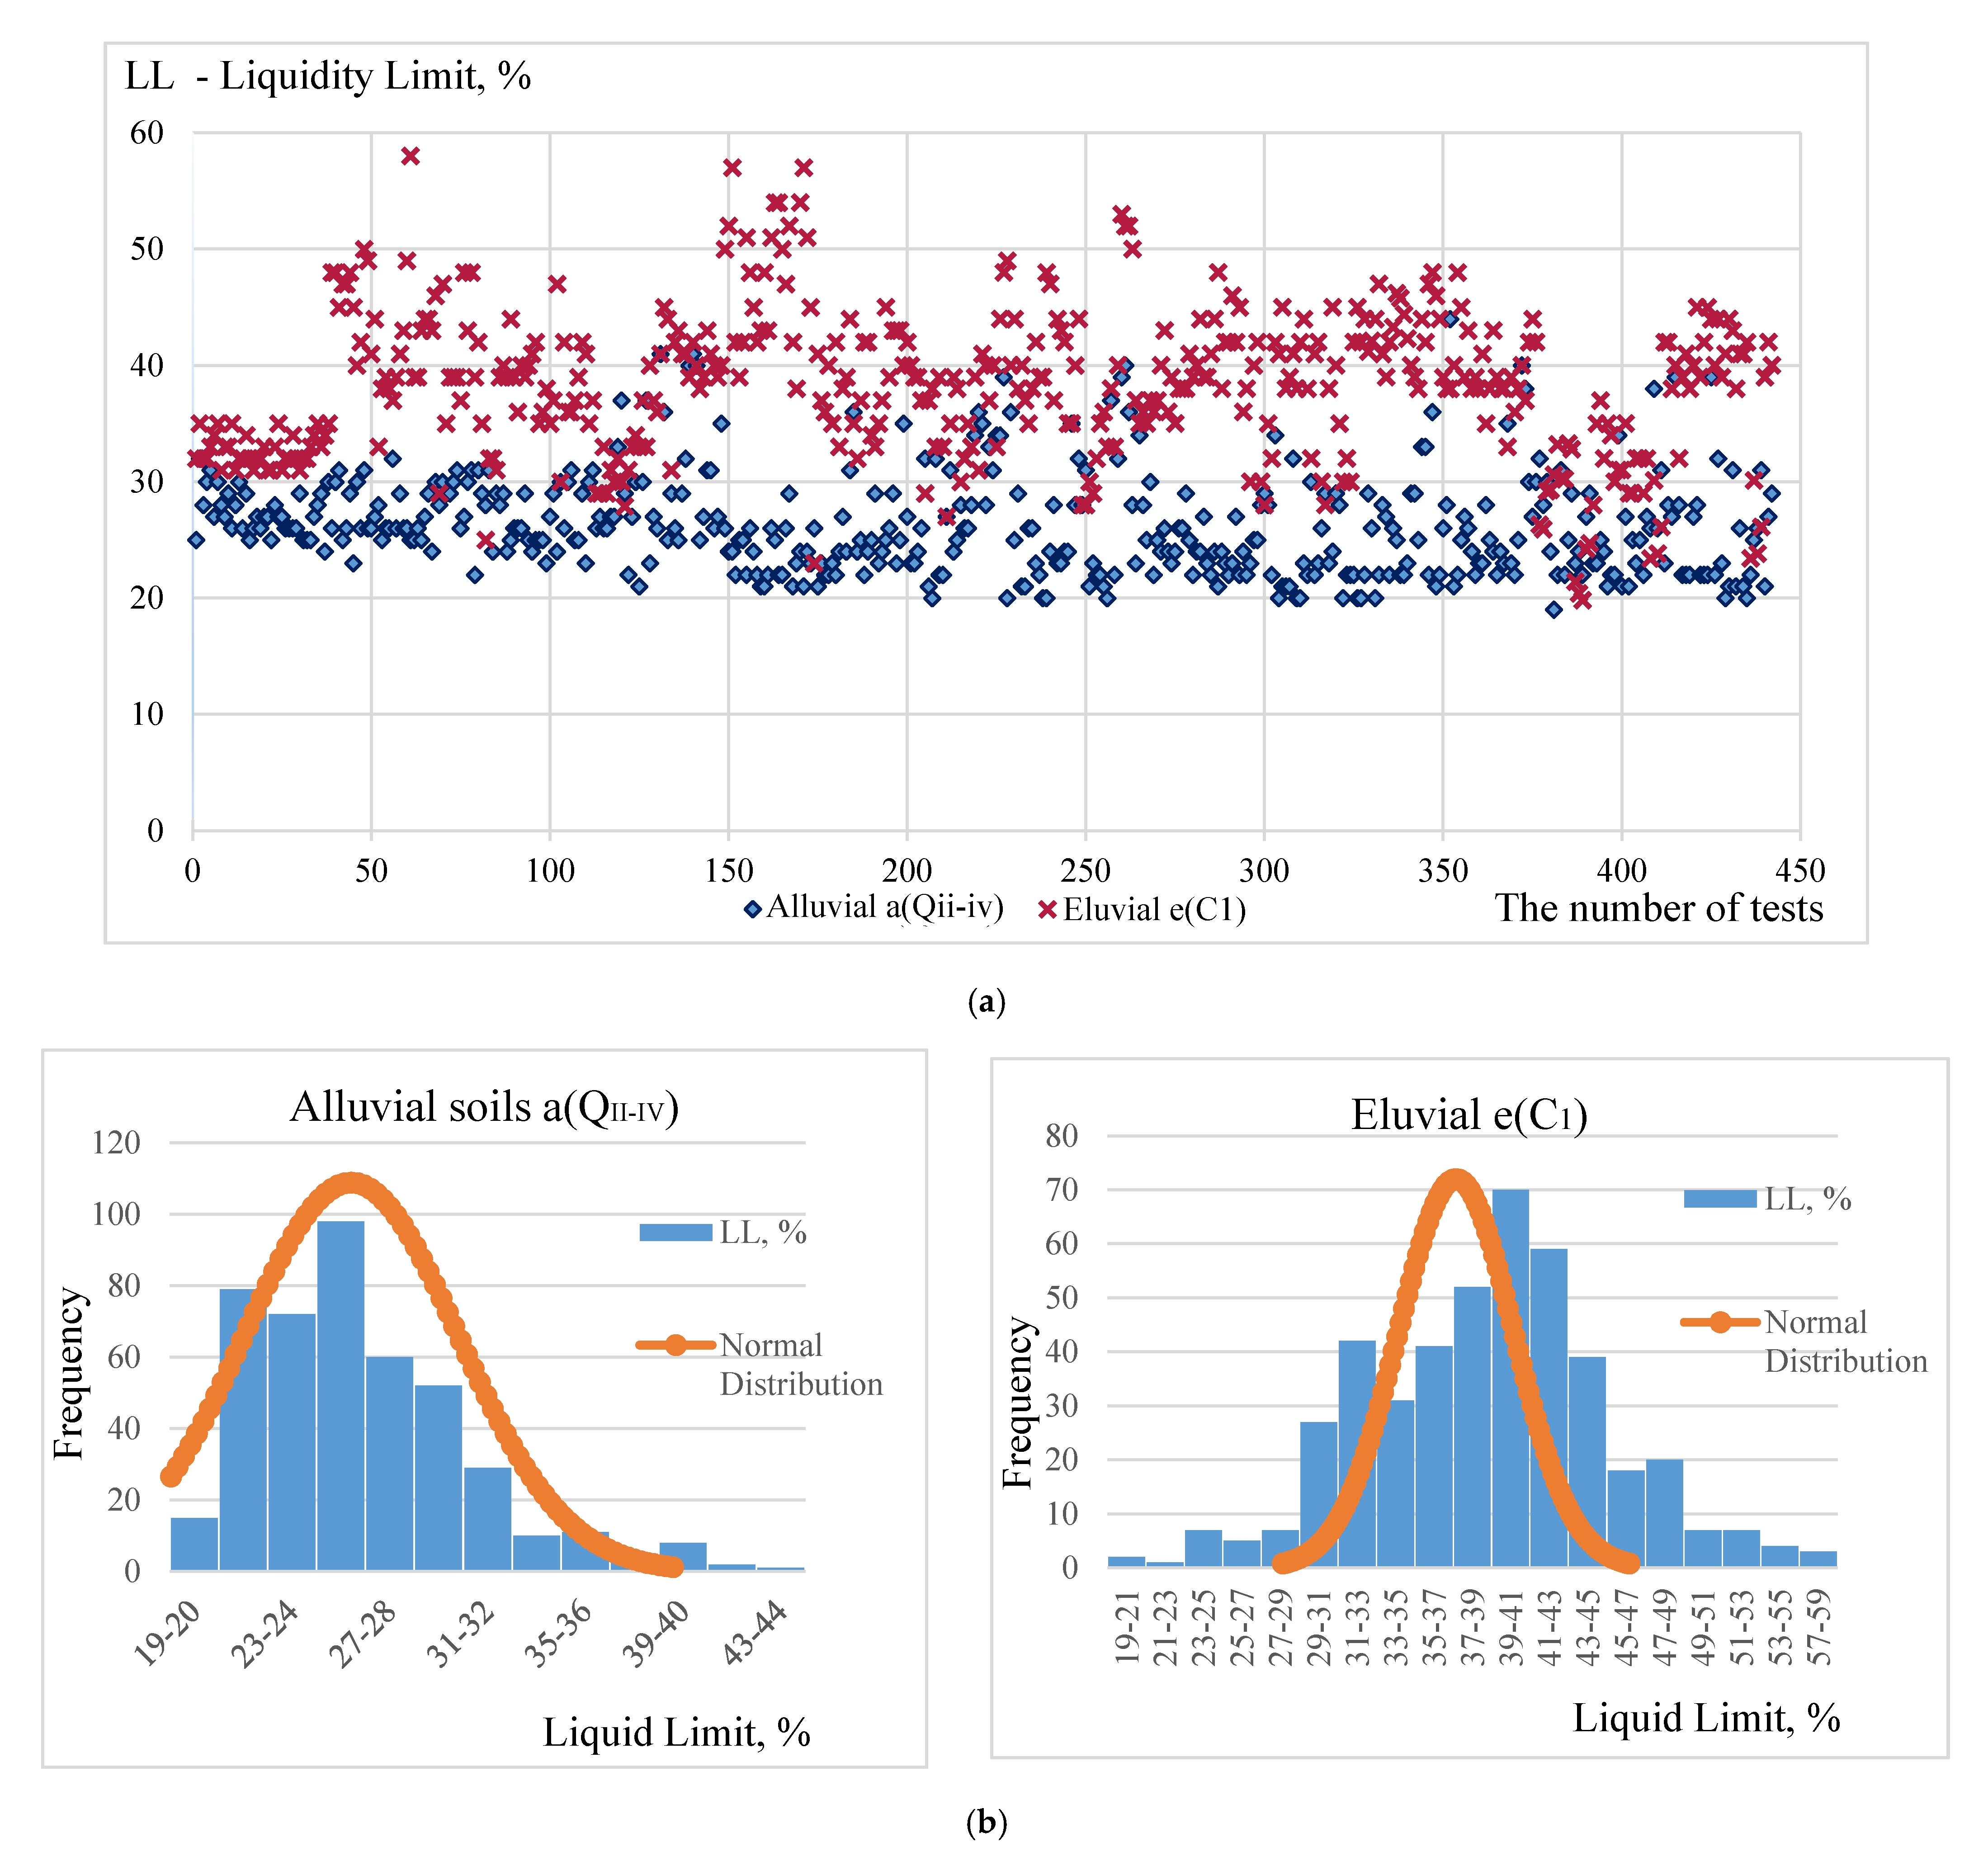
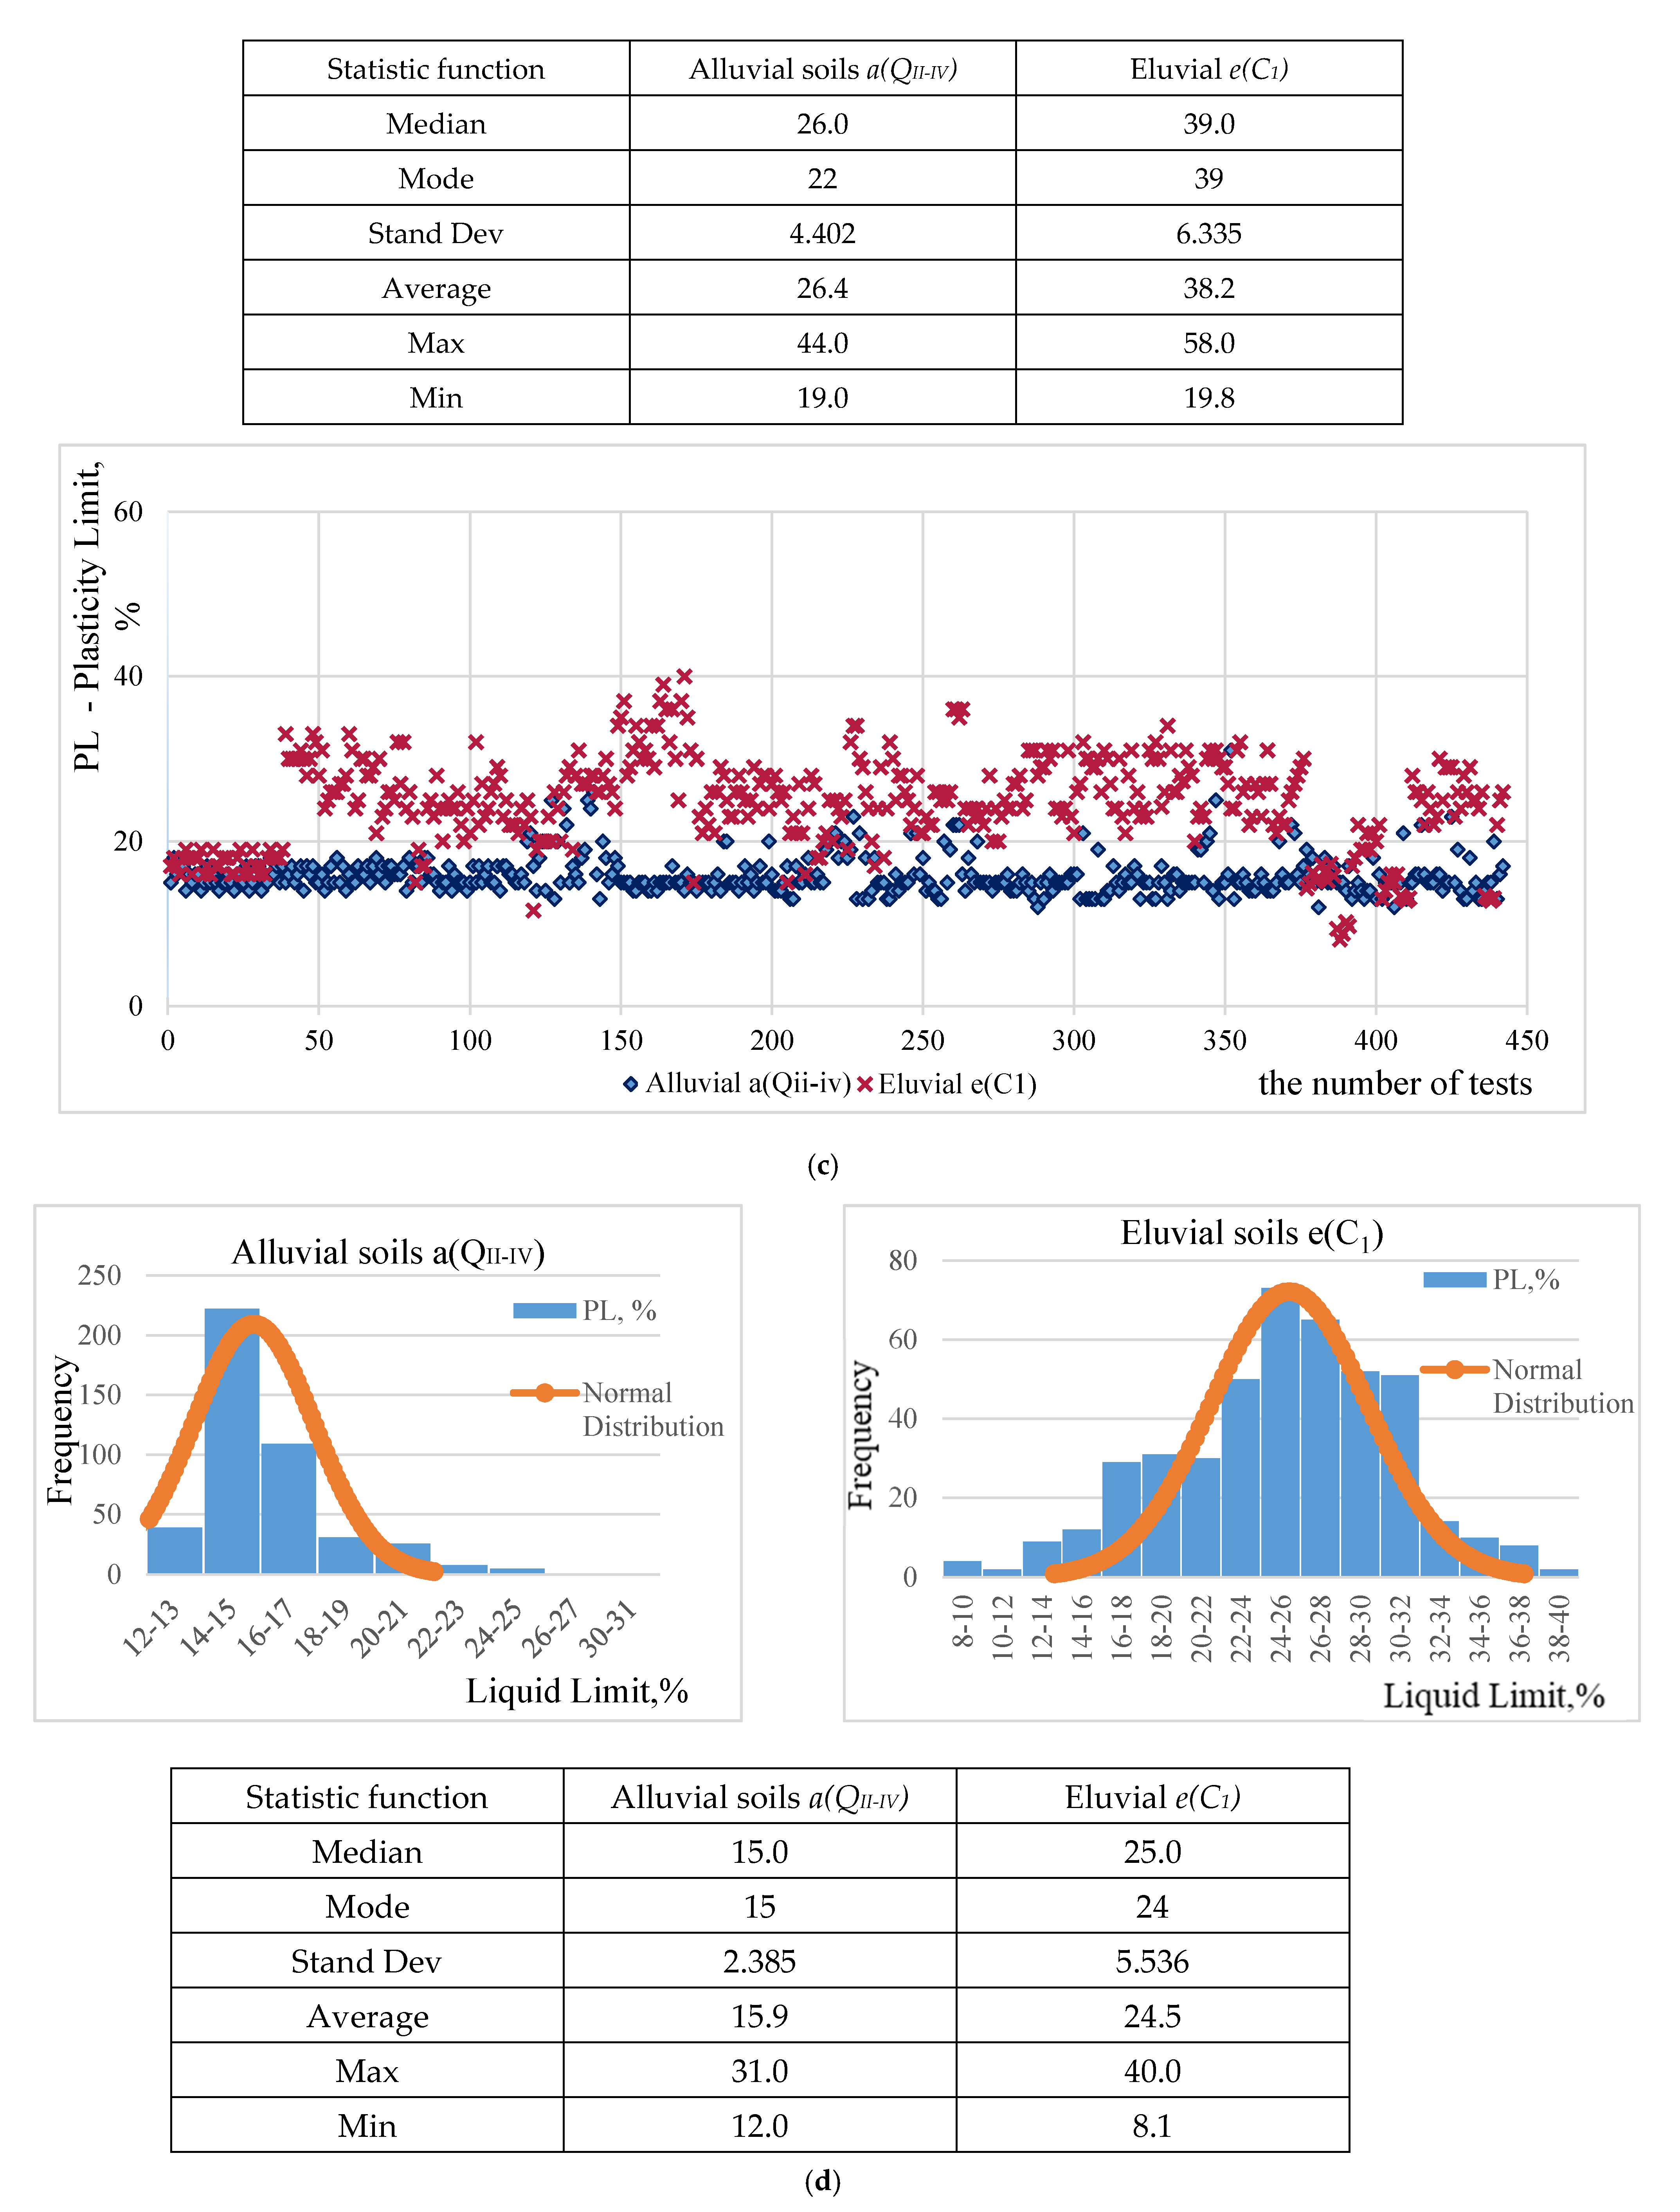
The analysis of physical and mechanical properties of the soil located in the territory of the city of Nur-Sultan signified that the increased liquid and plastic limits are replicated by higher values of elasticity modulus E, and hence better strength characteristics of a particular soil layer and vice versa, while the moisture content and soil density did not show any obvious pattern and requires additional verification on the construction site.
(5)
The scatter of the soils properties observed during the research and reflected in the scatter plot graph corresponds to the patterns established by the methods of mathematical statistics.
(6)
The zoning map for optimization of pile lengths was designed depending on the type of underlying soil, i.e., zoning and previously performed Static pile load test results recorded in the geotechnical database.
For today, the geoinformation database is in use by engineering and survey organizations and design and construction companies, such as OO Kazakhstan Geotechnical Association, LLC Sakhalin Center, LLC Geotechnical Center, LLP Astana Geostroy, LLP KGS, “LLP” KGS-Astana, and “LLP” “MG-Build”. The information provided in the geographic information system is necessary for these organizations in the feasibility study of projects in which they participate during tenders. Since the geoinformation database reduces the period of the feasibility study and enables the contract application to approximately calculate the cost of the projects in which they are aiming to participate.

Author Contributions

Conceptualization, A.Z and N.A.; methodology, N.A.; software, N.A.; validation, A.S. and N.A.; formal analysis, A.S.; investigation, S.A. and A.S.; resources, A.S.; data curation, A.S.; writing—original draft preparation, A.S.; writing—review and editing, A.S.; visualization, A.S.; supervision, A.Z.; project administration, A.Z.; funding acquisition, A.Z. All authors have read and agreed to the published version of the manuscript.

Funding

This research was funded by the targeted state program “The Geoinformation System and Technology of its Introduction in Geotechnics”, grant number AP05132828 from the Ministry of Education and Science of the Republic of Kazakhstan for 2018–2020.

Data Availability Statement

The data presented in this study are available on request from the corresponding author. The data are not publicly available due to maintaining the secrecy of geographic coordinates of the construction objects.

Acknowledgments

The authors are grateful to the colleagues of Geotechnical Institute of the L.N. Gumilyov Eurasian National University and "KGS-Astana” for the provided support in the processing and systematization of the results of previously completed engineering and geological surveys to form the unified geoinformation database.

Conflicts of Interest

The authors declare no conflict of interest.

References

  1. Smith, A.; Ellison, R. Applied geological maps for planning and development: A review of examples from England and Wales, 1983 to 1996. Q. J. Eng. Geol. 1999, 32, S1–S44. [Google Scholar] [CrossRef]
  2. Soil Survey Division Staff, Soil Survey Manual; Soil Conservation Service U.S. Department of Agriculture Handbook; USDA: Washigton, DC, USA, 1993; p. 18.
  3. Guenther, O.; Buchmann, A. Research Issues in Spatial Databases; Directions for Future Database Research & Development, Ed.; ACM SIGMOD Record: Nashville, TN, USA, 1990; Volume 19, pp. 61–68. [Google Scholar] [CrossRef]
  4. Laurini, T.; Thompson, D. Fundamentals of Spatial Information Systems; Academic Press: London, UK, 1992; 680p. [Google Scholar]
  5. Penninga, F.; van Oosterom, P.J.M. A simplicial complex-based DBMS approach to 3D topographic data modelling. Int. J. Geogr. Inf. Sci. 2008, 22, 751–779. [Google Scholar] [CrossRef]
  6. Minasny, B.; McBratney, A.B. Digital soil mapping: A brief history and some lessons. Geoderma 2016, 264, 301–311. [Google Scholar] [CrossRef]
  7. Harris, C.; Arenson, L.U.; Christiansen, H.H.; Etzelmuller, B.; Frauenfelder, R.; Gruber, S.; Haeberli, W.; Hauck, C.; Hoelzle, M.; Humlum, O.; et al. Permafrost and climate in Europe: Monitoring and modelling thermal, geomorphological and geotechnical responses. Earth-Sci. Rev. 2009, 92, 117–171. [Google Scholar] [CrossRef] [Green Version]
  8. Werner-Allen, G.; Johnson, J.; Ruiz, M.; Lees, J.; Welsh, M. Monitoring volcanic eruptions with a wireless sensor network. In Proceedings of the Second European Workshop on Wireless Sensor Networks (EWSN); IEEE: Istanbul, Turkey, 2005; p. 13. [Google Scholar]
  9. Meersmans, J.; Martin, M.P.; Lacarce, E.; De Baets, S.; Jolivet, C.; Boulonne, L.; Lehmann, S.; Saby, N.P.A.; Bispo, A.; Arrouays, D. A high resolution map of French soil organic carbon. Agron. Sustain. 2012, 32, 841–851. [Google Scholar] [CrossRef]
  10. Smith, K. Environmental Hazards: Assessing Risk and Reducing Disaster, 4th ed.; Routledge: New York, NY, USA, 2004; 383p. [Google Scholar]
  11. Aldefae, A.H.; Mohammed, J.; Saleem, H.D. Digital maps of mechanical geotechnical parameters using GIS. Cogent Eng. 2020, 7, 1779563. [Google Scholar] [CrossRef]
  12. Arshid, M.U.; Kamal, M.A. Regional Geotechnical Mapping Employing Kriging on Electronic Geodatabase. Appl. Sci. 2020, 10, 7652. [Google Scholar] [CrossRef]
  13. Popov, I.V. Engineering Geology; Textbook; Gosgeolizdat: Moscow, Russia, 1951; 444p. [Google Scholar]
  14. Popov, I.V. Engineering Geology. USSR. Part V. Kazakhstan. Average Asia; State University Publishing House: Moscow, Russia, 1974; 431p. [Google Scholar]
  15. Kotlov, F.V.; Snobkova, A.I. Production of Complex Engineering-Geological Surveys for Underground Civil and Industrial Construction. Review; Publishing House PNIIIS: Moscow, Russia, 1980; 37p. [Google Scholar]
  16. Kolomensky, N.V. General Method of Engineering and Geological Research; Nedra: Moscow, Russia, 1968; 344p. [Google Scholar]
  17. Dmitrovsky, V.I. (Ed.) Engineering Geology of the USSR, Vol. 6. Kazakhstan; Publishing House of Moscow University: Moscow, Russia, 1977; 296p. [Google Scholar]
  18. Alibekova, N.T.; Zhussupbekov, A.Z. GIS Technology in Engineering and Geological Surveys; Lap Lambert Academic Publishing: Beau Bassin, Mauritius, 2018; 188p. [Google Scholar]
  19. SNIP RK 2.04-01-2010 Building Climatology; RGP "Kazakh Research and Design Experimental Institute of Earthquake Engineering and Architecture: Almaty, Kazakhstan, 2010.
  20. In 23 Years, the Population of Nur-Sultan has Almost Tripled. Available online: https://www.inform.kz/ru/za-23-goda-naselenie-nur-sultana-vyroslo-pochti-v-tri-raza_a3665670 (accessed on 24 June 2020).
  21. Tulebekova, A.S.; Zhusupbekov, A.Z.; Shakhmov, Z.A.; Yenkebayev, S.B. Experience of testing according to international standard ASTM on problematical soil ground of Astana. Bull. L.N. Gumilyov Eurasian Natl. Univ. 2012, 2, 126–131. [Google Scholar]
  22. Zhussupbekov, A.Z.; Omarov, A.R.; Zhukenova, G.A.; Tanyrbergenova, G.K. Geotechnical Infrastructures of New Capital Astana on Problematical Soil Ground. In Proceedings of the 17th Nordic Geotechnical Meeting, Challenges in Nordic Geotechnic, Reykjavik, Iceland, 25–28 May 2016; pp. 923–930. [Google Scholar]
  23. Popov, V.N. Geotechnical Problems of Foundation Engineering in Conditions of Activation of Natural and Man-Made Processes and Ways to Solve Them. Ph.D. Thesis, Eurasian National University, Astana, Kazakhstan, 2004; p. 270. [Google Scholar]
  24. Vershin, V.P. Foundation design—From engineering surveys to scientific and technical support of construction. Secur. Technol. Eng. Syst. 2005, 6, 26–28. [Google Scholar]
  25. Zhusupbekov, A.; Morev, I.; Iwasaki, Y.; Mimura, M. Geotechnical issues of geodata base of soil ground of new capital Astana. In International Symposium on Advances in Ground Technology and Geo-Information (IS-AGTG); Advan GES in Ground Technology and Geoinformation: Singapore, 2011; pp. 175–181. [Google Scholar]
  26. Zhussupbekov, A.Z.; Alibekova, N.T.; Akhazhanov, S.B.; Shakirova, N.; Alpyssova, A. Development Geoinformation database for optimization length of driving and boring piles. In Proceedings of the International Conference on GIS and Geoinformation Zoning for Disaster Mitigation (GIZ 2018), Auckland, New Zealand, 15–17 November 2018; pp. 97–99. [Google Scholar]
  27. Alibekova, N.; Zhussupbekov, A.; Mimura, M.; Akhazhanov, S. Geoinformation Database for Installation of Driving and Boring Piles in Astana /16th Asian Regional Conference on Soil Mechanics and Geotechnical Engineering; Geotechnical Special Publication, ARC 2019: Taipei, Taiwan, 2020. [Google Scholar]
  28. Mimura, M.; Yamamoto, K. Development of Geoinformatic Databases and their Application to Geotechnical Problems; No 83 Genting Lane, #08-01; Genting Building: Singapore; Research Publishing Services: Singapore, 2012. [Google Scholar]
  29. Zhussupbekov, A.Z.; Alibekova, N.T.; Akhazhanov, S.B.; Shakirova, N.U.; Alpyssova, A.B. Geotechnical Geo-Information System of Astana. Soil Mech. Found. Eng. 2019, 55, 420–424. [Google Scholar] [CrossRef]
  30. Official (Ed.) SNIP RK 5.01-03.2002 Pile Foundations; Committee on Construction Affairs of the Ministry of Industry and Trade of the Republic of Kazakhstan: Nur-Sultan, Kazakhstan, 2002; 44p.
  31. Reddy, N.N.; Chakraborty, P.; Roy, S.; Singh, K.; Minasny, B.; McBratney, A.B.; Biswas, A.; Das, B.S. Legacy data-based national-scale digital mapping of key soil properties in India. Geoderma 2021, 381. [Google Scholar] [CrossRef]
Figure 1. Main landforms of Nur-Sultan city by V. Popov [23].
Applsci 11 00306 g001
Figure 2. Obtaining a geologic cross section by the designated points.
Applsci 11 00306 g002
Figure 3. Scatter plot of the Liquid (a) and Plastic (c) Limits for alluvial and eluvial clay soils, normal distribution for the Liquid (b) and Plastic (d) Limits data and their statistical analysis.
Applsci 11 00306 g003aApplsci 11 00306 g003b
Figure 4. Scatter plot of the natural moisture content for alluvial and eluvial clay soils.
Applsci 11 00306 g004
Figure 5. Scatter plot of the bulk density for alluvial and eluvial clay soils.
Applsci 11 00306 g005
Figure 6. Deformation modulus E scatter plot for alluvial and eluvial clay deposits.
Applsci 11 00306 g006
Figure 7. Zoning of the territory of Nur-Sultan city by types of the soil bases: (a) city map with differentiation by soil type zones, (b) vertical profiles of boreholes for each type of soil zones with decoding.
Applsci 11 00306 g007aApplsci 11 00306 g007b
Figure 8. Zoning map for optimization of pile lengths (a) and representative borehole profiles (b) for each city zone.
Applsci 11 00306 g008aApplsci 11 00306 g008b
Table 1. Explanatory notes on the geotechnical map of Nur-Sultan.
The Shape of the TerrainGenetic Type of TerrainAreaLandmarks
HorizontalVertical
AccumulationTerrace over the first floodplainvalley-a(QII-III) middle and upper quaternary geological period sands, clayey sands, sandy clays and claysIWidely observed on the left and right banks of river Ishim and in direct contact with the riverbed. Its width is up to 1–3 kmThe height of the edge of the terrace varies from 1.5 to 4 m above the surface of the valley. The slope of the terrace is often precipitous.
SculpturedThe watershed plain is composed of Carboniferous e(C1) and Jurassic e(J1) rocks, with an average of modern quaternary geological period a(QII-IV) with upper layers of sand, clayey sands, sandy clays and clays of different particle sizes over sandy clays and claysIISculptural terraceThe ledge of the plain to the first floodplain terrace from the shallow sand is slightly flat.The slope of the surface is from northeast to southwest.
SculpturedSmall hills-Carboniferous e(C1) rocks, covered with a layer of sand, sandstones, loams of various sizes a(QII-III).IIILocated north and northeast of the Ishim River, and in the south-east along the river valley.Its development strip is up to 5 km widerepresented by low hillsand hillocks, their height is 10–20 m above the valley surface.
AccumulationHigh floodplain valley- reduction of natural outflow of “SaryBulak” and “TuzdyZhyra” streams-layering of sands, clayey sands, sands a(QII-IV). IVObserved in small areas on the left and right banks. Its width varies from 100 to 500 m.The upper surface of the valley is not smooth and consists of many old canals with a depth of 2–2.5 m.
AccumulationLower floodplain valley-canals, quarries, pits-sands, sedimentary clays a(QII-IV)VObserved in the western part of the left bank of the river.Above the floodplain water rises 0.2–1.0 m
Table 2. Engineering geological stratification in Nur-Sultan city.
Engineering-Geological Element (EGE)Geological Index (Age)Average Column of SoilsLimits of Changes in Layer Thickness, mElastic Modulus (Young’s Modulus)E, MPa
EGE-1tIVEGE-1a0.3–1.4
EGE-2a(QII-IV)EGE-2a1.7–4.44.3
EGE-2b0.3–0.74.3
EGE-3a(QII-IV)EGE-3b1.3–3.521.2
EGE-3c2.8–5.2>30
EGE-4e(C1)EGE-42.2–3.310.75
EGE-5e(C1)EGE-5>4>30
EGE-6(C1)EGE-63.3–23.0
Table 3. Physical and mechanical characteristics of the soil layers in Zone 1.
The Name of IndicatorsSandy Clay Loams a(QII-IV) 1
(EGE-2a)
Sandy Clay Loams e(C1) (EGE-4)
Natural moisture W, %19.1 (10.2–27.7)24.1 (11.7–37.4)
Liquid Limit WL, %30.0 (21.0–48.0)39.0 (28.0–58.0)
Plastic Limit WP, %18.0 (14.0–32.0)27.0 (20.0–38.0)
Plastic index PI, %12.0 (7.0–16.0)22.0 (8.0–30.0)
Liquid index, LI0.39 (<0–1.0)<0
Particle density ρs, г/cm32.71 (2.67–2.74)2.74 (2.71–2.78)
Bulk density ρ, г/cm31.98 (1.84–2.09)1.96 (1.90–2.12)
Void ratio e0.63 (0.50–0.68)0.70 (0.59–0.80)
Degree of saturation S0.74 (0.50–1.11)0.96 (0.81–1.08)
Cohesion c, kPa1527
Angle of internal friction φ, grad2229
Elasticity modulus E, MPa710
1 The first number is an exact value for the presented borehole, and the maximum and minimum values for soils in Zone 1 are indicated in brackets.
Table 4. Bearing capacity of the driven piles according to the performed tests.
Soil Type Pile Depth Variation Within Each Zone, mBearing Capacity of the Driven Piles, kN
Based on Test Results(Maximum and Minimum Values), kNCalculated According to SNIP RK 5.01–03.2002 [28] (Upper and Lower Reading Limits)
Under the Lower End of the PileFrictional Resistance of the PileTotal Bearing Capacity
Zone 18.5–9.5 1026.0–1270.0450.0–977.00–465.0882.4–1054.2
Zone 28.5–9.5660.0–846.0360.0–439.5360.0–439.5498.7–710.0
Zone 37.0–8.5673.0–746.0326.3–873.0121.1–324.4454.1—1197.4
Zone 46.0–11.50705.0–1192.0369.5–466.2395.5–463.3865.3–1039.2
Zone 55.7–8.5490.0–975.0434.7–900.00–129.5434.7–949.8
Zone 68.5–8.6606.0–938.0362.7–643.5186.5–438.1555.9–898.9
Zone 77.3–8.0637.0–1020.0875.7–885.50875.7–885.5
Zone 810.3–11.5533.0–910.0432.0–460.80–457.1432.0–944.8
Publisher’s Note: MDPI stays neutral with regard to jurisdictional claims in published maps and institutional affiliations.

