
Fuzzy Evaluation Model of Process Improvement Capability with Costs Consideration

1
Department of Industrial Engineering and Management, National Chin-Yi University of Technology, Taichung 41170, Taiwan
2
Department of Business Administration, Chaoyang University of Technology, Taichung 413310, Taiwan
3
Institute of Innovation and Circular Economy, Asia University, Taichung 41354, Taiwan
4
Department of Finance, National Taichung University of Science and Technology, Taichung 40401, Taiwan
5
Department of Digital Content Application and Management, Wenzao Ursuline University of Languages, Kaohsiung 807, Taiwan
*
Author to whom correspondence should be addressed.
Appl. Sci. 2021, 11(10), 4344; https://0-doi-org.brum.beds.ac.uk/10.3390/app11104344
Submission received: 25 April 2021
/
Revised: 7 May 2021
/
Accepted: 7 May 2021
/
Published: 11 May 2021
(This article belongs to the Special Issue Applications of Fuzzy Optimization)
Abstract
:The Taguchi capability index, which reflects the expected loss and the yield of a process, is a useful index for evaluating the quality of a process. Several scholars have proposed a process improvement capability index based on the expected value of the Taguchi loss function as well as the corresponding cost of process improvement. There have been a number of studies using the Taguchi capability index to develop suppliers’ process quality evaluation models, whereas models for evaluating suppliers’ process improvement potential have been relatively lacking. Thus, this study applies the process improvement capability index to develop an evaluation model of the supplier’s process improvement capability, which can be provided to the industry for application. Besides, owing to the current need to respond quickly, coupled with cost considerations and the limits of technical capabilities, the sample size for sampling testing is usually not large. Consequently, the evaluation model of the process improvement capability developed in this study adopts a fuzzy testing method based on the confidence interval. This method reduces the risk of misjudgment due to sampling errors and improves the testing accuracy because it can incorporate experts and their accumulated experiences.
1. Introduction
According to Chen et al. [1], there are two main reasons for process loss. One is the loss caused by insufficient process accuracy, and the other is the loss caused by insufficient process precision (too much variation). The value of the Taguchi capability index proposed by Chan et al. [2] will vary with the magnitude of these two losses. When these two losses are smaller, the Taguchi capability index value of the process will be higher, and vice versa; when these two losses are larger, the value of the Taguchi capability index is lower, which indicates that the process capability is insufficient. Chen [3] pointed out that the Taguchi capability index can be used to evaluate the process loss. In addition, Wu et al. [4] suggested that when the value of this index is large enough, it can also reflect the process yield. Obviously, the Taguchi capability index reflects not only the process loss but also the process yield, which makes it a good indicator for evaluating the process capability [5,6,7,8]. It is expressed as follows:
where . USL and LSL are the upper and lower limits of the process specification, respectively. is the process mean, and is the process variance. Let be the process precision index; the smaller the value is, the smaller the process standard deviation is, which means the process accuracy is higher. Let be the process accuracy index. When its value gets close to 0, it means the process mean is moving close to the target value T. Meanwhile, the expected loss of the process is lower, indicating the process accuracy is higher. Then, the Taguchi capability index can be rewritten as follows:
Numerous studies have pointed out that the current era is one of supply chain versus supply chain. How manufacturers choose suppliers and contract outsourcers has always been a very important task in supply chain management [9,10,11,12,13]. Chen and Yang [14] have discussed the problems regarding the emergence of the concept of build-to-order (BTO), which accelerates the multinational operation of domestic manufacturers. The cooperation of components has become a key factor in managing the supply chain. The improvement of product quality is no longer just a problem for the manufacturer itself, but it also involves the quality of the components produced by its upstream suppliers and outsourcers. Therefore, how to carefully select and evaluate suppliers and outsourcers has become the most important issue. Chen et al. [1] pointed out that the Taguchi capability index, which reflects not only the expected process loss but also the process yield, is a suitable index for evaluating the process quality. Thus, the Taguchi capability index can be used to evaluate the quality of a supplier’s product. For example, when a good supplier is unable to supply sufficient goods, choosing another supplier with the potential to improve the process is an important in order to maintain stable supply. Hence, Chen et al. [1] regarded the expected value of the Taguchi loss function as a basis and considered the corresponding cost of the process improvement to propose a process improvement capability index as follows:
Figure 1 is a schematic diagram of the Taguchi loss function L(x) = k(x − T)2, the expected loss ( = k) with tolerances for processes A, B and C, respectively as follows:
Process A~: = k =
Process B~: = k =
Process C~: = k =
In the equation, is the ratio of the improvement cost () of process precision to the improvement cost () of process accuracy, that is . Chen et al. [1] believe that the main reason for a lack of accuracy is the deviation of machine parameters. Therefore, to solve this problem, what we just need to do is to adjust the machine parameters to improve the quality, so the required investment cost is quite low. Additionally, a lack of accuracy may result from the high turnover rate, poor homogeneity caused by unstable material supply, or old machinery. Since the cost of improvement is relatively high, the value is usually less than 1.0.
Besides, Chen et al. [1] claimed that the Taguchi capability index can be used to measure and evaluate the original supplier’s process capability. When the supplier’s process capability is insufficient, we can assess whether to improve its accuracy or precision based on the cost of process improvement. Next, the process improvement capability index can be employed to evaluate the supplier’s process improvement capability. By means of these two indexes, not only capable suppliers but also potential suppliers can be selected. Also, they can assist suppliers with long-term partnerships to reduce their process improvement costs as well as improve their process quality, resulting in a win-win situation for both sides, and thus, the entire supply chain’s competitiveness can be improved.
Subsequently, given the cost considerations and the need for timely, quick responses, many studies have also pointed out that the sample size of sampling testing is usually not large. At the same time, the confidence interval-based fuzzy testing method can be applied because this method, which incorporates experts and their accumulated experiences, can not only reduce the risk of misjudgment due to sampling errors but also improve the testing accuracy [15,16,17,18]. In view of this, this study proposes a fuzzy testing method based on the upper confidence limit to evaluate whether the supplier’s process improvement ability is above the average level. Thus, this study applies the process improvement capability index to construct an evaluation model of the supplier’s process improvement capability, which can be provided to the industry for application.
In the second section, this study introduces the process improvement capability index, applies the methods of Chen and Yang [19] and Chen et al. [20], takes the process improvement capability index as the objective function, regards the joint confidence region of accuracy index and precision index as a constraint, and obtains the upper confidence limit of the process improvement capability index through mathematical planning. Next, in the third section, a fuzzy membership function is constructed according to the upper confidence limit of the index. After applying the fuzzy membership function testing method, a fuzzy testing method is proposed to evaluate whether the supplier’s process improvement capability is above the average level. In the fourth section, this study takes an application example and proposes fuzzy evaluation rules to illustrate how to apply the fuzzy testing method proposed in the third section. Last, in the fifth section, conclusions are made.
2. Upper Confidence Limit
Suppose is a random sample from a normal random variable with mean and variance , i.e., . Let , distributed as , where is the mean of Y and is the standard deviation of Y. Then, the sample mean and sample standard deviation can be obtained as follows:
Therefore, the estimator of is .
Furthermore, we let
and
Under the assumption of normality, Z and K are distributed as and , respectively. Therefore,
and
where . is the upper quintile of , is the lower quintile of , and represents the confidence level. Since and are mutually independent, then Z and K are also mutually independent. From these relationships, we can further obtain the following equation:
Equivalently,
Let be the observed value of . Then, and are the observed values of and , respectively, as follows:
and
Therefore, the confidence region can be shown as follows:
Obviously, is the function of . Based on the above results, this study refers to the mathematical programming (MP) method of Chen et al. [21]. Based on two conditions, 0 CI and 0 CI, is seen as the objective function, and the confidence region (CR) is regarded as the feasible solution region to obtain the upper confidence limit of , as illustrated below:
where
and
Case 1: 0 CI
In case 1, we can conclude . Then, the objective function is , and
Then, the MP model can be rewritten as follows:
Apparently, when 0 CI, the maximum value will be generated at the coordinate point.
The maximum value of at this time is expressed as follows:
Case 2: 0 CI
In case 2, similarly to case 1, we can conclude . The MP model can be rewritten as follows:
Obviously, the feasible region is a trapezoid-like convex set with a wide top and a narrow bottom. The closer is to the origin, the greater the value of is. Therefore, when 0, the maximum value () will be generated in the lower-left corner. Its coordinate point is seen as follows:
When 0, the maximum value () will be generated in the lower-right corner. Its coordinate point is seen as follows:
Therefore,
According to Equations (17) and (22), then
3. Fuzzy Testing for Process Improvement Capability Index
If we want to determine whether the supplier’s improvement potential is above the average level, we can evaluate it through the fuzzy test of the process improvement capability index. If the value of the process improvement capability index is at least VL, which indicates that its potential reaches the required level, then the null hypothesis is : ≥ VL, versus the alternative hypothesis, H1: VL. If the upper confidence limit with a significance level at 0.05 is applied, we can obtain the following statistical test rules:
- (1)
- If VL, then do not reject and conclude VL.
- (2)
- If VL, then reject and conclude VL.
can be shown as follows:
According to Chen et al. [22] and Li et al. [23], the of the half-triangle-like shaped fuzzy number can be expressed below:
where
Recall the of , for are all equal to . The half-triangle-like shaped fuzzy number is , where (see Equation (29)) and
Let , then the fuzzy membership function of is:
where is determined by either of the following equations:
or
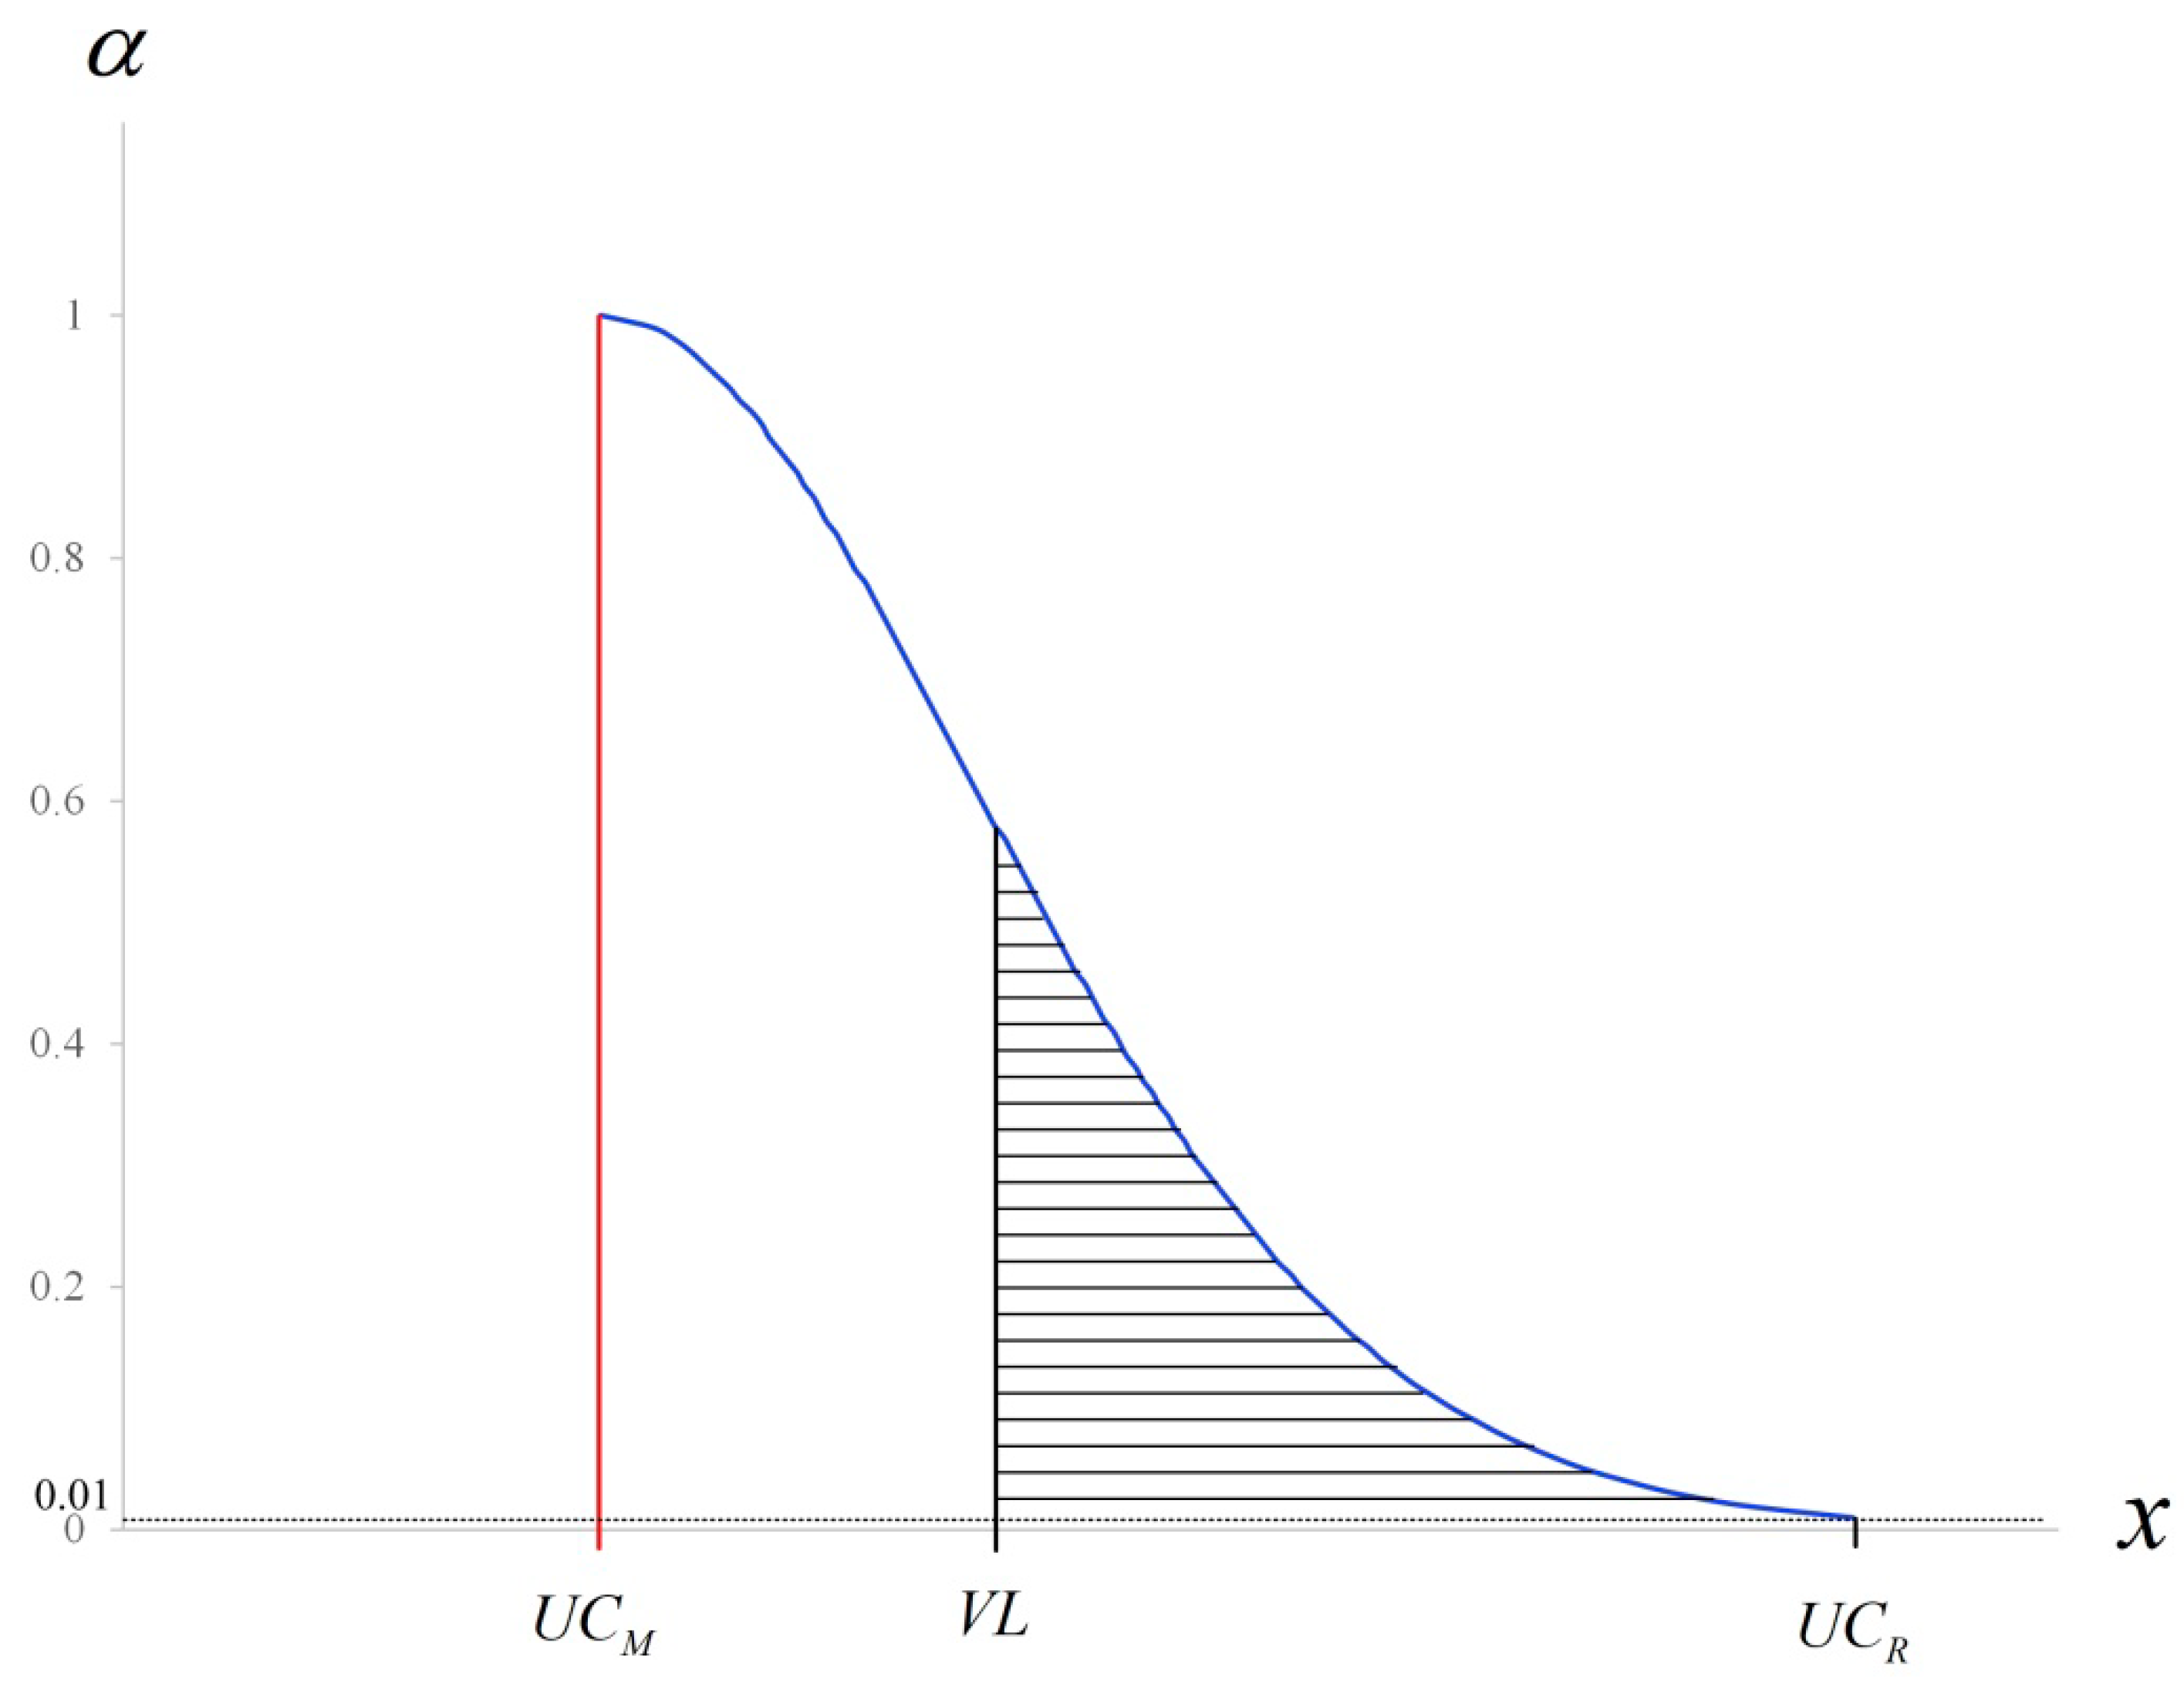
Figure 2 presents a diagram of membership function with vertical line VL.
Based on Chen [24], let set be the area in the graph of and set be the area in the graph of , but to the right of the vertical line VL., then
and
where . According to Equations (26) and (30), the length of the bottom can be shown as follows:
or
Similarly, according to Equations (29) and (30), the length of the bottom can be expressed below:
or
Therefore, we let .The values of and were decided by experts and their accumulated experiences, it can improve the testing precision [15,16,18]. As noted by Yu et al. [25], we may obtain the following fuzzy test rules:
- (1)
- If , then reject and conclude VL.
- (2)
- If , then make no decision on whether to reject/not to reject .
- (3)
- If , then do not reject and conclude VL.
4. An Application Example
In this section, we use an application example to illustrate the fuzzy testing method outlined in Section 3. Since central Taiwan is the center of the tool machines and machining industry, the method was applied to an important component produced by a machinery processing factory in central Taiwan. It is presented as relative values due to business privacy considerations.
As mentioned earlier, since the value is usually less than 1.0 ( 1.0), at this time, . If the process is capable ( 1.0), then 1.0. Obviously, usually . Therefore, when the process is incapable ( 1.0), then the value can be requested to exceed 1.0. If the value of the process improvement capability index is at least 1.0 (VL 1.0), it means that the potential reaches the required level. Next, this study, based on the model established in Section 3, uses the following steps to complete the fuzzy test, as displayed below:
Step 1: Establish the null hypothesis and the alternative hypothesis as follows:
null hypothesis : 1.0
versus
alternative hypothesis : 1.0
Step 2: According to the calculation ratio of the improvement cost () of the process precision and the improvement cost () of the process accuracy, that is,
0.4
Step 3: Based on the sample data with a sample size n 36, we calculate the observed values of and , respectively, as follows:
0.31
and
0.26
Step 4: Based on Equations (16), (17) and (26), we calculate the values of and with 0.05, respectively, as follows:
0.265
Step 5: Based on step 4 and Equation (26), we calculate the values of and with 0.05, respectively, as follows:
0.95
Therefore, we can obtain for 0.2410, as follows:
In particular, with 0.05 is
1.053
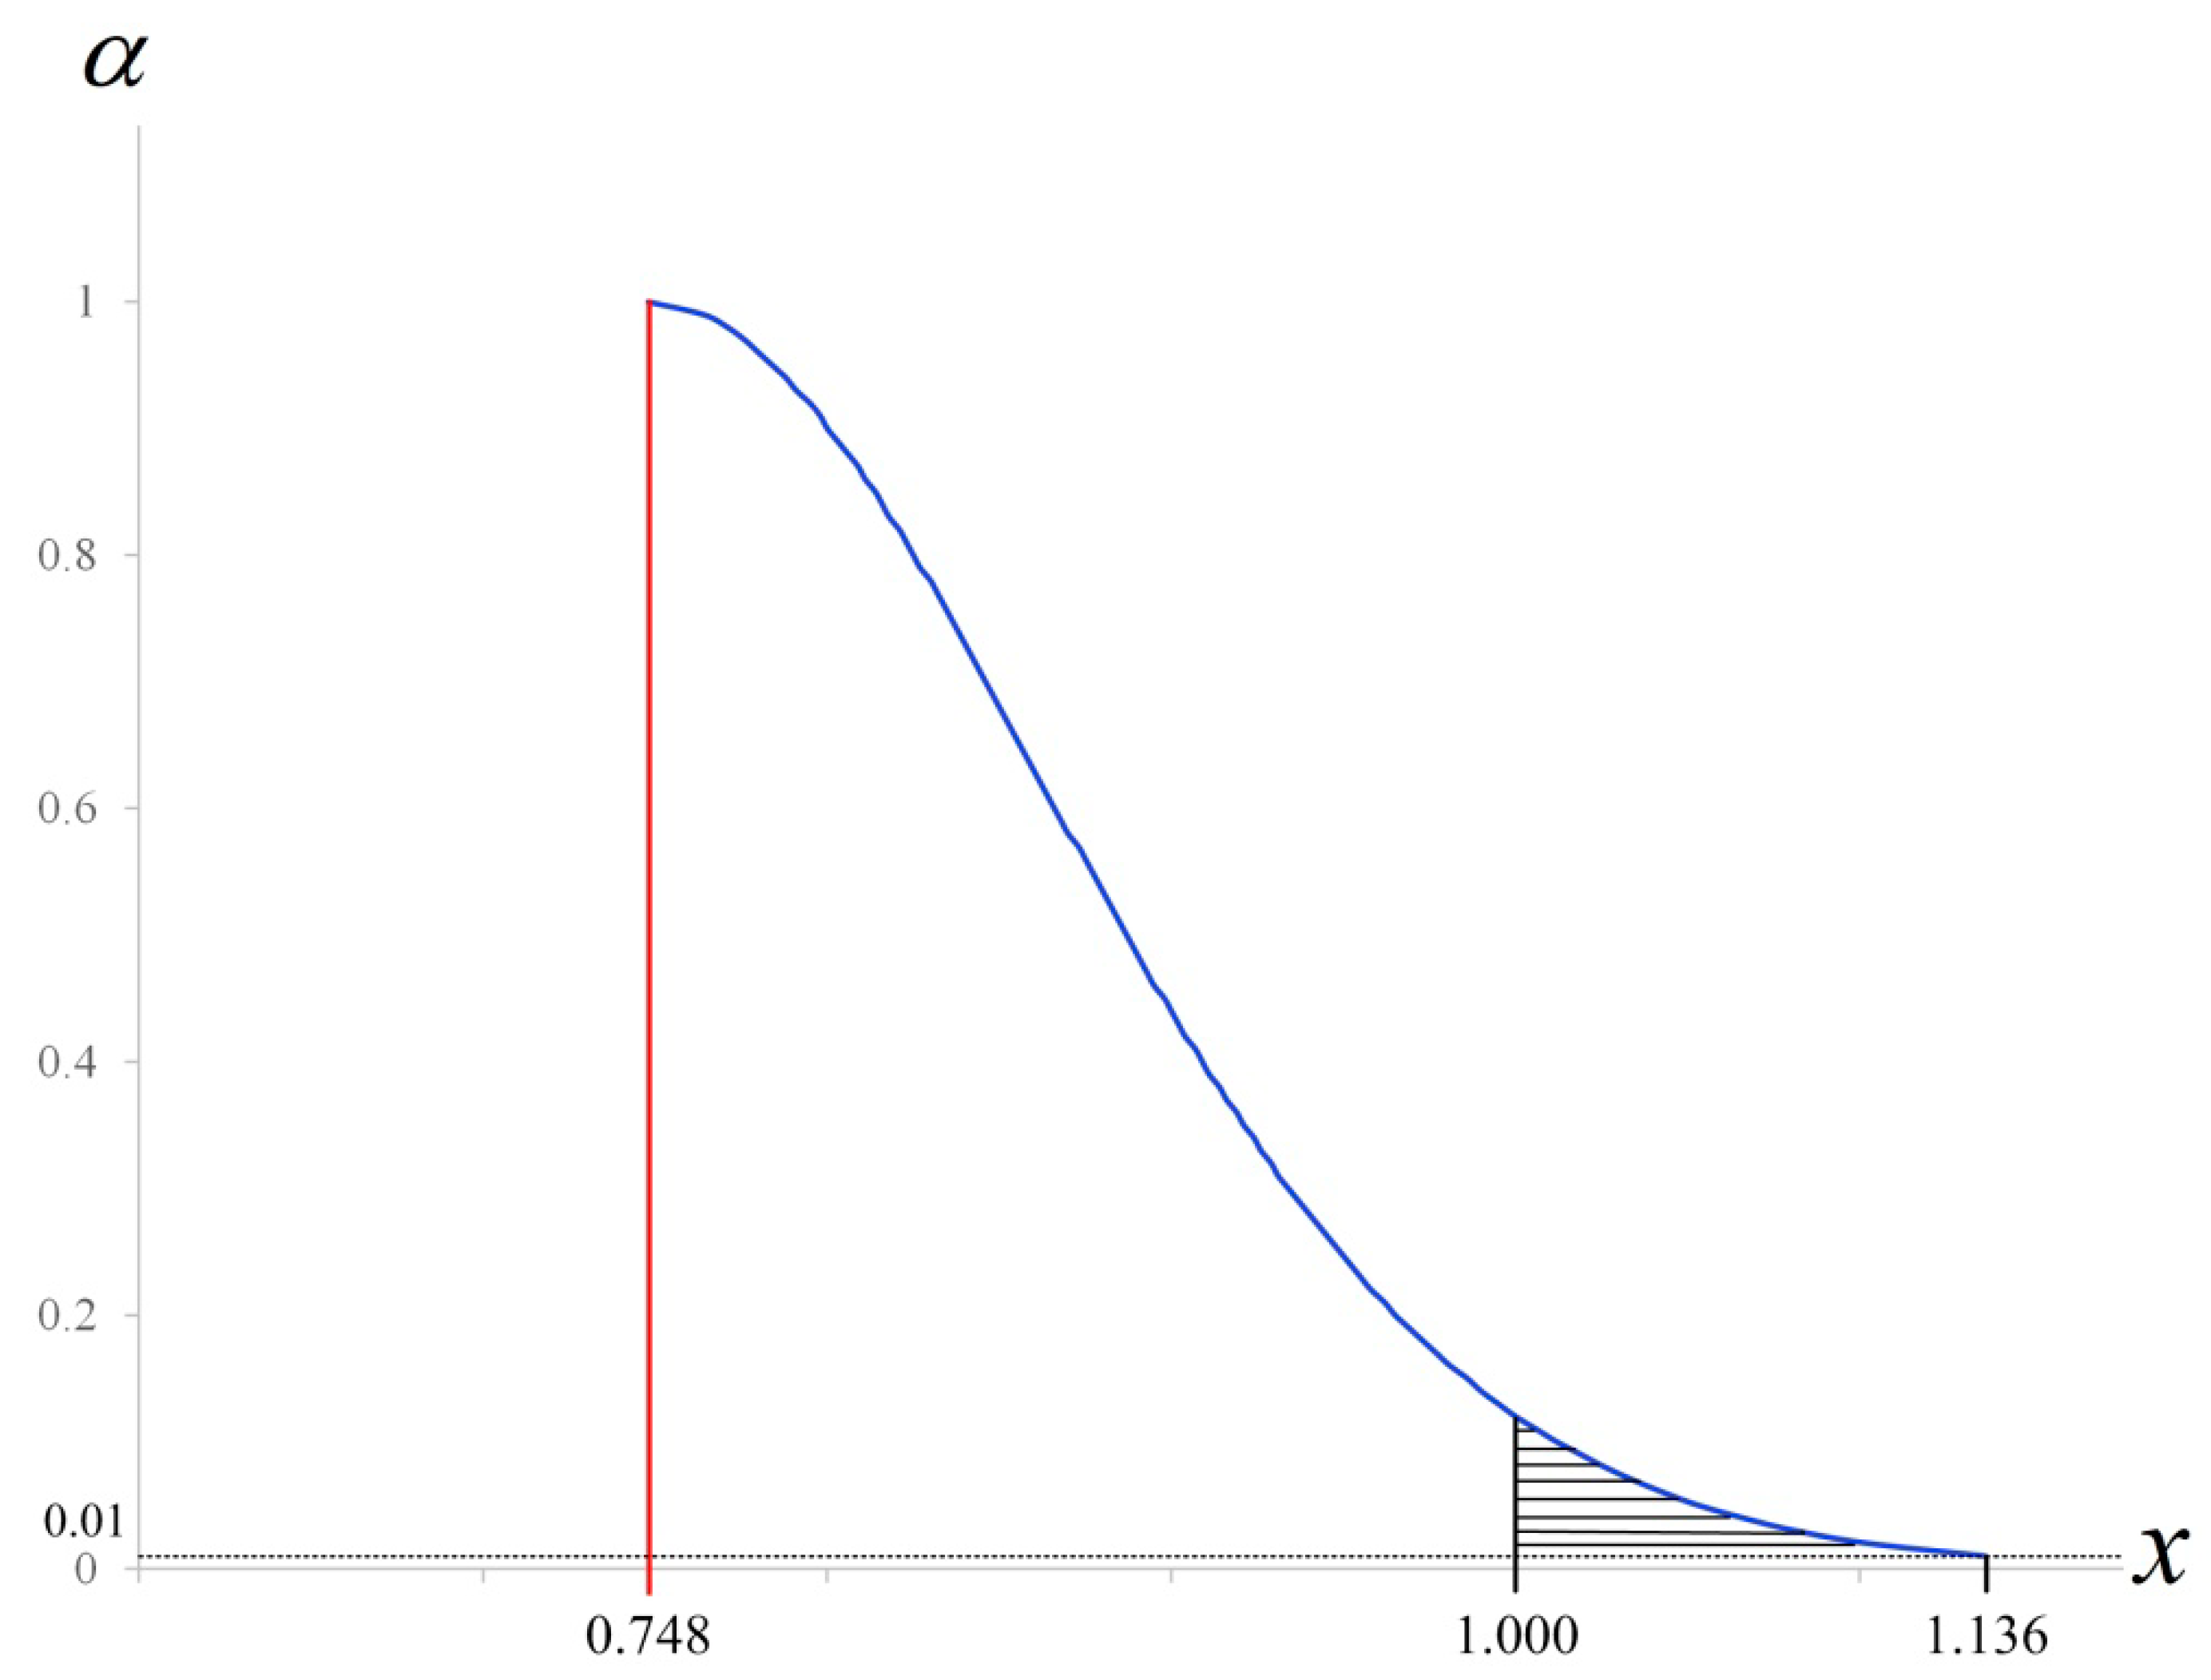
Step 6: According to the Equations (29) and (30) we calculate the value, and use VL 1.000 to draw the membership function. Then, based on Equations (37) and (39), we calculate the values of , and , respectively, as follows:
1.136
0.748
Figure 3 presents a diagram of membership function with , VL 1.000 and .
VL 1.136 1.0 0.136
1.136 0.748 0.388
0.175
Step 7: Decision and discussion
Let 0.2 and 0.4. According to the fuzzy test rules, if < 0.20, then reject and conclude 1.0. In fact, when 0.95, the value of with 0.05 is 1.053. If the result of the statistical inference is 1.0, it is obvious that the fuzzy evaluation model proposed by this study seems to be more reasonable than the statistical inference.
5. Conclusions
The Taguchi capability index is an excellent tool for evaluating a supplier’s process capability. When the supplier’s process capability is insufficient, the process improvement capability index can be used to evaluate the supplier’s process improvement capability. Since the process improvement capability index includes the improvement cost of process accuracy as well as that of process precision, it can help suppliers to review their various capabilities and consider the corresponding costs of improving their processes. Therefore, it helps to reduce the improvement costs and enhance the process quality to achieve a win-win situation and promote the competitiveness of the entire supply chain. In addition, given the cost considerations and the need for timely, quick responses, the sample size for sampling testing is usually not large. At this time, the fuzzy testing method proposed by this study can be adopted. This method is based on the upper confidence limit, which can reduce the risk of misjudgment caused by sampling errors. Because this method incorporates experts and their accumulated experiences, it can improve the testing precision. Last, a case study is provided to explain how to apply the model proposed in this study. It is obvious from the case study that the fuzzy evaluation model proposed here seems to be more satisfactory than the statistical inference. Moreover, this study offers an evaluation procedure to facilitate its application for the industry.
This study used one important component of tool machines as an application example, although future studies could apply the proposed method to products or important components in various fields, such as the IC industry and TFT LCD, etc. Furthermore, it is recommended that this proposed model be applied to the selection of multiple suppliers or the comparison of the process performance of multiple products.
Author Contributions
Conceptualization, K.-S.C.; S.-C.C. and T.-H.H.; methodology, K.-S.C.; S.-C.C. and T.-H.H.; software, M.-Y.L. and C.-F.W.; validation, M.-Y.L. and C.-F.W.; formal analysis, K.-S.C. and T.-H.H.; resources, T.-H.H.; data curation, S.-C.C. and C.-F.W.; writing—original draft preparation, K.-S.C., S.-C.C., T.-H.H., M.-Y.L. and C.-F.W.; writing—review and editing, K.-S.C., S.-C.C. and T.-H.H.; visualization, M.-Y.L. and C.-F.W.; supervision, K.-S.C.; project administration, T.-H.H. All authors have read and agreed to the published version of the manuscript.
Funding
This research received no external funding.
Institutional Review Board Statement
Not applicable.
Informed Consent Statement
Not applicable.
Data Availability Statement
Not applicable.
Conflicts of Interest
The authors declare no conflict of interest.
References
- Chen, K.S.; Yang, S.L.; Chen, H.T. Process improvement capability index with cost—A modeling method of mathematical pro-gramming. Appl. Math. Model. 2015, 39, 1577–1586. [Google Scholar] [CrossRef]
- Chan, L.K.; Cheng, S.W.; Spiring, F.A. A New Measure of Process Capability:Cpm. J. Qual. Technol. 1988, 20, 162–175. [Google Scholar] [CrossRef]
- Chen, K. Estimation of the process incapability index. Commun. Stat. Theory Methods 1998, 27, 1263–1274. [Google Scholar] [CrossRef]
- Wu, C.H.; Hsu, Y.C.; Pearn, W.L. An improved measure of quality loss for notching processes. Qual. Reliab. Eng. Int. 2021, 37, 108–122. [Google Scholar] [CrossRef]
- Chen, K.-S.; Chang, T.-C. Construction and fuzzy hypothesis testing of Taguchi Six Sigma quality index. Int. J. Prod. Res. 2019, 58, 3110–3125. [Google Scholar] [CrossRef]
- Chen, K.S.; Wang, K.J.; Chang, T.C. A novel approach to deriving the lower confidence limit of indices Cpu, Cpl, and Cpk in as-sessing process capability. Int J. Prod. Res. 2017, 55, 4963–4981. [Google Scholar] [CrossRef]
- Chang, T.-C.; Wang, K.-J.; Chen, K.-S. Sputtering Process Assessment of ITO Film for Multiple Quality Characteristics with One-Sided and Two-Sided Specifications. J. Test. Eval. 2014, 42. [Google Scholar] [CrossRef]
- Dharmasena, L.S.; Zeephongsekul, P. A new process capability index for multiple quality characteristics based on principal components. Int. J. Prod. Res. 2015, 54, 4617–4633. [Google Scholar] [CrossRef]
- Yu, C.-M.; Chen, K.-S.; Lai, K.-K.; Hsu, C.-H. Fuzzy Supplier Selection Method Based on Smaller-The-Better Quality Characteristic. Appl. Sci. 2020, 10, 3635. [Google Scholar] [CrossRef]
- Yang, C.M.; Chen, K.S.; Hsu, T.H.; Hsu, C.H. Supplier selection and performance evaluation for high voltage power film ca-pacitors in fuzzy environment. Appl. Sci. 2019, 9, 5253. [Google Scholar] [CrossRef] [Green Version]
- Chen, K.-S.; Yu, C.-M. Dual dimensional fuzzy testing based on upper confidence limits for supplier selection. J. Intell. Fuzzy Syst. 2021, 1–14, Pre-press. [Google Scholar] [CrossRef]
- Toloo, M.; Ebrahimi, B.; Amin, G.R. A Dynamic Decision Support System for Sustainable Supplier Selection in Circular Econo-my. Eur. J. Oper. Res. 2021, 292, 1037–1050. [Google Scholar] [CrossRef]
- Tayyab, M.; Sarkar, B. An interactive fuzzy programming approach for a sustainable supplier selection under textile supply chain management. Comput. Ind. Eng. 2021, 155, 107164. [Google Scholar] [CrossRef]
- Chen, K.S.; Yang, H.H. Evaluation of supplier delivery performance. J. Chin. Inst. Eng. 1999, 16, 681–688. [Google Scholar]
- Chen, K.-S.; Yu, C.-M. Fuzzy test model for performance evaluation matrix of service operating systems. Comput. Ind. Eng. 2020, 140, 106240. [Google Scholar] [CrossRef]
- Luo, W.J.; Chen, K.S.; Yu, C.M.; Hsu, T.H. The fuzzy process quality evaluation model for the STB quality characteristic of ma-chining. Appl. Sci. 2020, 10, 8272. [Google Scholar] [CrossRef]
- Chen, K.-S.; Chang, T.-C. A fuzzy approach to determine process quality for one-sided specification with imprecise data. Proc. Inst. Mech. Eng. Part B J. Eng. Manuf. 2020, 234, 1198–1206. [Google Scholar] [CrossRef]
- Chen, K.-S. Fuzzy testing decision-making model for intelligent manufacturing process with Taguchi capability index. J. Intell. Fuzzy Syst. 2020, 38, 2129–2139. [Google Scholar] [CrossRef]
- Chen, K.-S.; Yang, C.-M. Quality Capability Assessment for Thin-Film Chip Resistor. IEEE Access 2019, 7, 92511–92516. [Google Scholar] [CrossRef]
- Chen, K.-S.; Huang, C.-T.; Chang, T.-C. Decision-Making for the Selection of Suppliers Based on the Process Quality Assessment. Int. J. Reliab. Qual. Saf. Eng. 2020, 27, 2050016-1-19. [Google Scholar] [CrossRef]
- Chen, K.S.; Huang, C.F.; Chang, T.C. A mathematical programming model for constructing the confidence interval of process capability index Cpm in evaluating process performance: An example of five-way pipe. J. Chin. Inst. Eng. 2017, 40, 126–133. [Google Scholar] [CrossRef]
- Chen, K.-S.; Wang, C.-H.; Tan, K.-H. Developing a fuzzy green supplier selection model using six sigma quality indices. Int. J. Prod. Econ. 2019, 212, 1–7. [Google Scholar] [CrossRef]
- Li, M.; Chen, K.-S.; Yu, C.-M.; Yang, C.-M. A Fuzzy Evaluation Decision Model for the Ratio Operating Performance Index. Mathematics 2021, 9, 262. [Google Scholar] [CrossRef]
- Chen, K.-S. Two-tailed Buckley fuzzy testing for operating performance index. J. Comput. Appl. Math. 2019, 361, 55–63. [Google Scholar] [CrossRef]
- Yu, C.-M.; Lai, K.-K.; Chen, K.-S.; Chang, T.-C. Process-Quality Evaluation for Wire Bonding With Multiple Gold Wires. IEEE Access 2020, 8, 106075–106082. [Google Scholar] [CrossRef]
Figure 1.
Process loss distribution chart.

Figure 2.
Membership function with vertical line = VL.

Figure 3.
Membership function with , VL 1.000 and .

Publisher’s Note: MDPI stays neutral with regard to jurisdictional claims in published maps and institutional affiliations. |
© 2021 by the authors. Licensee MDPI, Basel, Switzerland. This article is an open access article distributed under the terms and conditions of the Creative Commons Attribution (CC BY) license (https://creativecommons.org/licenses/by/4.0/).
Share and Cite
MDPI and ACS Style
Chen, K.-S.; Chen, S.-C.; Hsu, T.-H.; Lin, M.-Y.; Wu, C.-F. Fuzzy Evaluation Model of Process Improvement Capability with Costs Consideration. Appl. Sci. 2021, 11, 4344. https://0-doi-org.brum.beds.ac.uk/10.3390/app11104344
AMA Style
Chen K-S, Chen S-C, Hsu T-H, Lin M-Y, Wu C-F. Fuzzy Evaluation Model of Process Improvement Capability with Costs Consideration. Applied Sciences. 2021; 11(10):4344. https://0-doi-org.brum.beds.ac.uk/10.3390/app11104344
Chicago/Turabian StyleChen, Kuen-Suan, Shui-Chuan Chen, Ting-Hsin Hsu, Min-Yi Lin, and Chih-Feng Wu. 2021. "Fuzzy Evaluation Model of Process Improvement Capability with Costs Consideration" Applied Sciences 11, no. 10: 4344. https://0-doi-org.brum.beds.ac.uk/10.3390/app11104344
Note that from the first issue of 2016, this journal uses article numbers instead of page numbers. See further details here.