
Performance-Based Ranking of Existing Road Bridges


Department of Structures, Faculty of Civil Engineering, University of Zagreb, 10000 Zagreb, Croatia
*
Author to whom correspondence should be addressed.
Appl. Sci. 2021, 11(10), 4398; https://0-doi-org.brum.beds.ac.uk/10.3390/app11104398
Submission received: 2 April 2021
/
Revised: 29 April 2021
/
Accepted: 10 May 2021
/
Published: 12 May 2021
(This article belongs to the Special Issue Monitoring, Assessment, and Interventions on Existing Bridges: From Physical Methods to Machine Learning-Based Applications)
Abstract
:Bridge condition assessment in most European countries is based on visual inspection in combination with damage assessment of bridge components. For adequate bridge management, the assessment needs to be further developed to move from the bridge component level to the system functionality level and finally to the priority ranking level for repairs in the network. Although visual inspection provides only qualitative insights into bridge condition and cannot predict load-carrying capacity, it is still very often the only way to collect data on existing bridges and can provide very important information for evaluating structural safety, traffic safety, durability, and overall bridge condition. Therefore, this paper presents a unique procedure that establishes a relationship between a country-specific bridge condition assessment procedure based on visual inspection and the systematization of key bridge performance indicators developed within the European integrated management approach at three complementary and interrelated levels—component, system, and network levels. The assessment procedure for existing bridges initiates with damage assessment based on visual inspection of bridge components and runs through weighting at component, system, and network levels to the six most important key performance indicators (KPIs) for road bridges, which are organized as graphical and numerical inputs for ranking priority maintenance. These are bridge condition assessment, structural safety, traffic safety, durability indicator, availability, and the importance of the bridge in the network. The procedure is validated on a case study set of five real bridges, using the decision-making process as an example for the small sample size. The case study bridges differ in cross-section, type, and span (which vary from 9.5 to 72 m). The bridges were built between 1958 and 2001 and are located either on state or municipal roads in Croatia. The results, in terms of condition classification and priorities of future interventions within the representative group of bridges, justify the application of the described assessment procedure. Additional digitization efforts could easily implement the described assessment approach at the infrastructure network level.
1. Introduction
Condition assessment and optimal maintenance of existing road bridges, as critical parts of the transport infrastructure network, are key to its functioning. Most of the bridges in the European road network, built as part of the reconstruction after the Second World War, are close to, or have already, reached their designed lifetimes and require major investments to ensure future smooth use. This is due to the fact that major highway construction took place in the 1960s, when most European countries started building what is now known as the Trans European Transportation network (TEN-T roads). Originally, highway construction in Europe began much earlier, in Italy in the 1920s and Germany in the 1930s, when more than 4000 km of Autobahn were built, but the major expansion occurred after World War II and continued through the 1960s [1,2].
Most of these bridges are built of reinforced and prestressed concrete, as shown in the database developed by the research project SERON (Security of Road Transport Net-works) [3]. Since these structures were designed and built according to old codes, in which the design of durability and service life of concrete was not developed as it is in current codes, a number of these bridges are experiencing severe deterioration. Moreover, the design life for the majority of these bridges is 50 years, which has been reached by almost half of the approximately one million European bridges, based on data from the European Union Road Federation [4]. The safety of these bridges has also been questioned due to inadequate maintenance, especially after several recent dramatic bridge collapses around the world that have raised public awareness of crumbling European infrastructure.
A summary report of the main EU countries was published in the article “After Italy Collapse, Europe Asks: How Safe are our Bridges” [5]. The general conclusion of the above report is that more efforts and resources need to be focused on the maintenance and inspection of aging infrastructure. This same issue was taken up by the European Commission as part of a discussion report on transport infrastructure maintenance [6], which revisits the research carried out on the subject of bridge maintenance. The report suggests that the EU could play a greater role in improving infrastructural maintenance, with the overall conclusion that there has been a lack of investment in recent years. The safety of road users on selected bridges was also considered, as the higher risk of road accidents in the EU arises from road conditions rather than from vehicle conditions.
The assessment of bridges as part of bridge management networks has been the subject of a number of European research projects and actions [7]. BRIME (Bridge Management in Europe) [8] focused on the development of a framework for bridge management in Europe at a network level, also focusing on the development of deterioration models. ARCHES (Assessment and Rehabilitation of Central European Highway Structures) [9] is a research project focused on structural assessment and monitoring of highway bridges, load testing, and dynamic actions. SUSTAINABLE BRIDGES [10] is focused on the improvement of existing railway bridges, as their poor condition can have serious consequences, but they also developed a flow chart for the assessment of road bridges.
In the Russian Federation, about 75% of the road network is located in the Asian part of the country, and about 70% of the capital bridges were built between the 1970s and 1990s. With an average projected superstructure lifetime of 43 years, the majority of these bridges need to be assessed and rehabilitated or replaced. For this reason, a new bridge management system was developed, based on the modern analytical information system (AIS) ISSO-N, intended for the monitoring, long-term planning, and development of infrastructure. Specifically, for bridges, AIS ISSO-N contains basic bridge data, including drawings, reports of previous assessments, data on structural elements, defects, and other bridge characteristics, along with an automatic engineering condition assessment module [11].
In the USA, the majority of highway bridges were also built in the 1960s, during a period when approximately 60,000 km of new highways were constructed [1]. Awareness of the inspection and maintenance of these bridges increased in the 1980s, as these activities had not been performed regularly until then, resulting in an overall poor condition of the transportation infrastructure. Therefore, the Federal Highway Administration (FHWA) initiated the development of the first national bridge management system (BMS), called PONTIS, in the mid-1980s [12]. Shortly after the formation of PONTIS, another BMS called BRIDGIT [13] was developed under NCHRP Project 12–28. Both BRIDGIT and PONTIS are used to input basic visual inspection data, incorporate Markov chain process-based deterioration prediction, and are used to guide bridge network performance optimization. Nonetheless, the current condition of more than 600,000 highway bridges in the U.S. is alarming and has been the subject of an extensive report by both Homeland Security [14] and the American Society of Civil Engineers (ASCE), which estimates that more than $100 billion is needed for bridge rehabilitation alone [15].
In Australia and New Zealand, the transport infrastructure, consisting of approximately 50,000 road bridges, is relatively new compared to the US and EU. The road agencies of these two countries defined the key performance objectives for road bridge networks as functionality, safety, aesthetics, sustainability, and economic aspect [16]. However, in practice, the procedures are not uniform, as each of the regional road directorates has a different approach to bridge maintenance and management. For example, in Australia, the US-based BMS is implemented, while, in New Zealand, such an approach is not considered suitable due to the smaller number of bridges and a top-down approach to BMS is used [16].
In China, due to the increasing number of long-span bridges, a number of authors have addressed the issues of bridge assessment and maintenance in recent decades. For example, the work of Xu et al. [17] develops a theoretical framework for the evaluation of suspension bridges based on various sources of inspection data, including visual inspection, non-destructive testing, and SHM tools. Standardization of condition assessment of long-span bridges is the subject of a paper by Chen et al. [18], as part of a three-stage project addressing the standardization, assessment, and finally preservation of these bridges. The basic approach of the performance assessment method presented in this paper is the weighted sum method, which is used to evaluate the individual bridge elements and their contribution to the overall performance of the bridge. When using the weighted sum method, it is recommended that the factor-based or age-based variable weighting method be considered to account for the weight distribution in the performance evaluation of bridge systems, as described in the work of Ren et al. [19].
The success of management systems applied to bridges within a given road network exposed to various phenomena depends on the ability to maintain satisfactory performance of these bridges during their service life. On the other hand, the evaluation of bridge performance depends on its safety (e.g., load-bearing capacity), stability, functionality (e.g., traffic safety and free circulation), durability, serviceability, cost efficiency (e.g., maintenance costs, traffic closure costs), and environmental impact.
An overview of current measurement approaches and methods, as well as the most critical aspects of bridge performance, is presented in the Federal Highway Administration’s Long-Term Bridge Performance (LTBP) Program Report—Bridge Performance Primer [20,21]. In addition, an overview of bridge performance measures in relation to bridge project objectives can be found in the University of Wisconsin project report [21,22].
At the European level, the International Organization for Economic Co-Operation and Development conducted a survey of performance indicators for the roads sector, starting in 1995, and identified 15 performance indicators among those used by road administrations around the world [23]. Most of them are related to road-user satisfaction and asset management and can be considered as indicators of the socio-economic performance of a bridge.
Later, other studies [24,25,26] were conducted to evaluate the performance of infrastructures and bridges using sustainability criteria that integrate environmental, economic, and social criteria over the life cycle. In addition, the COST Action C25 [27,28] was carried out, aiming to promote a scientific understanding of life cycle engineering and to advance the science-based development of sustainable construction in Europe. The results are mainly construction-oriented, although some examples of LCA (life cycle assessment) of bridges can be found. The results of another COST Action 354 [29], dealing with performance indicators for road pavements, are a good example of a level-based approach, the development of combination methods, and weighting factors. It starts with the single performance indicator (PI), which refers to only one characteristic; through combined performance indicators (CPI), which refer to two or more different characteristics. Finally, it reaches the level of general performance indicators (GPI), which include various aspects, such as safety, structure, ride comfort, and environmental aspects.
Furthermore, aspects of bridge performance have been analyzed in the recently completed COST Action TU 1406 (quality specifications for roadway bridges, standardization at a European level). The main objective was to develop a guideline for the preparation of quality control plans for road bridges [7,30,31,32]. This action addressed an integrated approach based on the state-of-the-art of bridge performance at the European level by considering (a) technical, (b) sustainability, and (c) socio-economic aspects at three complementary and interrelated levels—(a) component, (b) system and (c) network level [21].
The study of assessment and inspection documents from different European countries [32] revealed that the most commonly used performance indicator at present is the condition index, condition rating, deterioration index, or other nomenclature used by different countries and operators, mainly obtained from visual inspection. Visual inspection as a bridge assessment tool is the first stage of the bridge assessment process and provides fundamental information about the bridge condition and defines the need for further assessment [33]. A number of authors use visual inspection data as input to bridge management systems, e.g., Quirk et al. [34], Gattulli and Chiaramonte [35], while Estes and Frangopol use visual inspection data for bridge reliability updating [36]. The comparison of basic visual inspection and more sophisticated Structural Health Monitoring (SHM) as bridge assessment methods is performed by Agdas et al. [37]. In Croatia, visual inspection of several bridges of a road network is used as a basis for evaluation of existing assessment methods and the results are presented in the following study [38].
In all countries studied, there is a performance indicator related to this topic. In many countries, this is the only performance indicator used in practice by bridge owners and operators [32]. However, some countries, such as Denmark [39] and the Netherlands [40], have started to use other relevant indicators related to the concepts of remaining service life, safety index or reliability, vulnerability, robustness, availability, and maintainability. The reliability index is of particular interest, but still mainly at the research level. For example, according to Ghosn et al. [41], Strauss et al. [42], and Zambon et al. [43], target reliability levels are set based on experience with the performance of existing structures, the consequences of component failures, and construction costs.
Having presented in the previous text the diversity of bridge assessment and management procedures around the world, the research presented in this paper aimed to establish the relationship between (a) the current condition assessment procedures in Croatian bridge maintenance practice based on visual inspection and (b) the systematization of key performance indicators (KPIs) theoretically established in COST Action TU 1406 to (c) a unique road bridge performance assessment procedure for priority repair ranking.
The methodology is as follows. Existing documentation and guidelines applicable in Croatian practice are reviewed. Furthermore, the available scientific and professional documentation within the COST Action TU 1406 is surveyed and analyzed in order to discover the possibilities for further improvement of the existing practical methods. Based on the available data, the analysis method for bridge assessment within the Excel software interface is developed leading to a graphical and tabular presentation of the assessment results.
Following an integrated approach, a unique bridge assessment procedure is developed and presented in Section 2. The presented research establishes a relationship between a country-specific bridge condition assessment procedure based on visual inspection and the systematization of key bridge performance indicators developed in the European research, as presented in Section 2.1. The assessment starts at the component damage level (condition of the bridge element), as described in Section 2.2, moves from the component to the system level, as presented in Section 2.3, ascends to the system functionality level (assessment of the whole bridge), as described in Section 2.4, and finally ends at the network priority level (maintenance schedule of all bridges in an infrastructure network), as elaborated in Section 2.5.
Based on assessment by visual inspection and weighting analysis over the component, system, and network levels, a set of the six most important key performance indicators (KPISS,SY structural safety indicator, KPITS,SY traffic safety indicator, KPID,SY durability indicator, KPIBCA,SY the general bridge condition indicator, KPIAV,SY bridge availability indicator, and KPIBI,NET bridge importance indicator) are disclosed as the assessment result in Section 2.6 and are presented in the form of a colored spider diagram, accompanied by a tabular overview of the performance indicators.
The suitability of the assessment procedure is verified on a group of real bridges. The experimental part of this research consists of on-site inspections based on visual inspection and knowledge of damage (extent, intensity, location, significance) and its impact on the bridge structure. Visual inspection is carried out based on guidelines developed for the course Durability of Structures from the graduate study program of civil engineering at the Faculty of Zagreb, which are based on operational guidelines of Croatian roads [44] and Croatian highways [45,46].
Within Section 3, the assessment procedure was applied and confirmed on the set of bridges representing the diversity of the national network in a small sample. The set of five bridges is described in Section 3.1. The bridges are built according to different historical design codes, they include different structural types and corresponding construction methods, and they are located on either state or local roads with different total lengths. Their data and damages, which are crucial for the assessment procedure, are explained in Section 3.2. and then the assessment itself follows. Section 3.3. discusses how the assessment results can be thoughtfully and effectively used to prioritize the repair sequence of individual bridge components, but more importantly, to prioritize the maintenance plan for the entire network.
The above case study can be easily adapted to a group of bridges on a particular road section or a particular bridge network managed by a particular infrastructure operator. This is highlighted in Section 4.2.
Further research, as presented in Section 4.1, should include the digitization of the whole process and the time evolution of key performance indicators. The time dependency of key performance indicators and their interdependence will depend on the maintenance strategy chosen. The feasibility of the proactive strategy will depend on the resources available for the specific interventions within the whole observed group of bridges.
2. Assessment Procedure
2.1. Introduction
Bridge inspections are generally performed on bridge components, which form the three main subsystems of the bridge: substructure, superstructure, and roadway. There is a large list of damages that can be observed during visual inspections. A reduced list of terms related to the performance indicators served as a good basis for the extraction of important damage indicators. This list was established by the analysis of the database of European operators [47], by Working Group 1.
In collecting the available knowledge on bridge assessment from practical experience, a total of 100 of the most relevant (or noticeable or frequent or crucial or influencing) component damage indicators are identified as the most relevant and influencing indicators of visual inspection (Table 1, based on [46]). These are used to establish a link between visual inspection grading and key performance indicators through the assessment procedure presented in this paper.
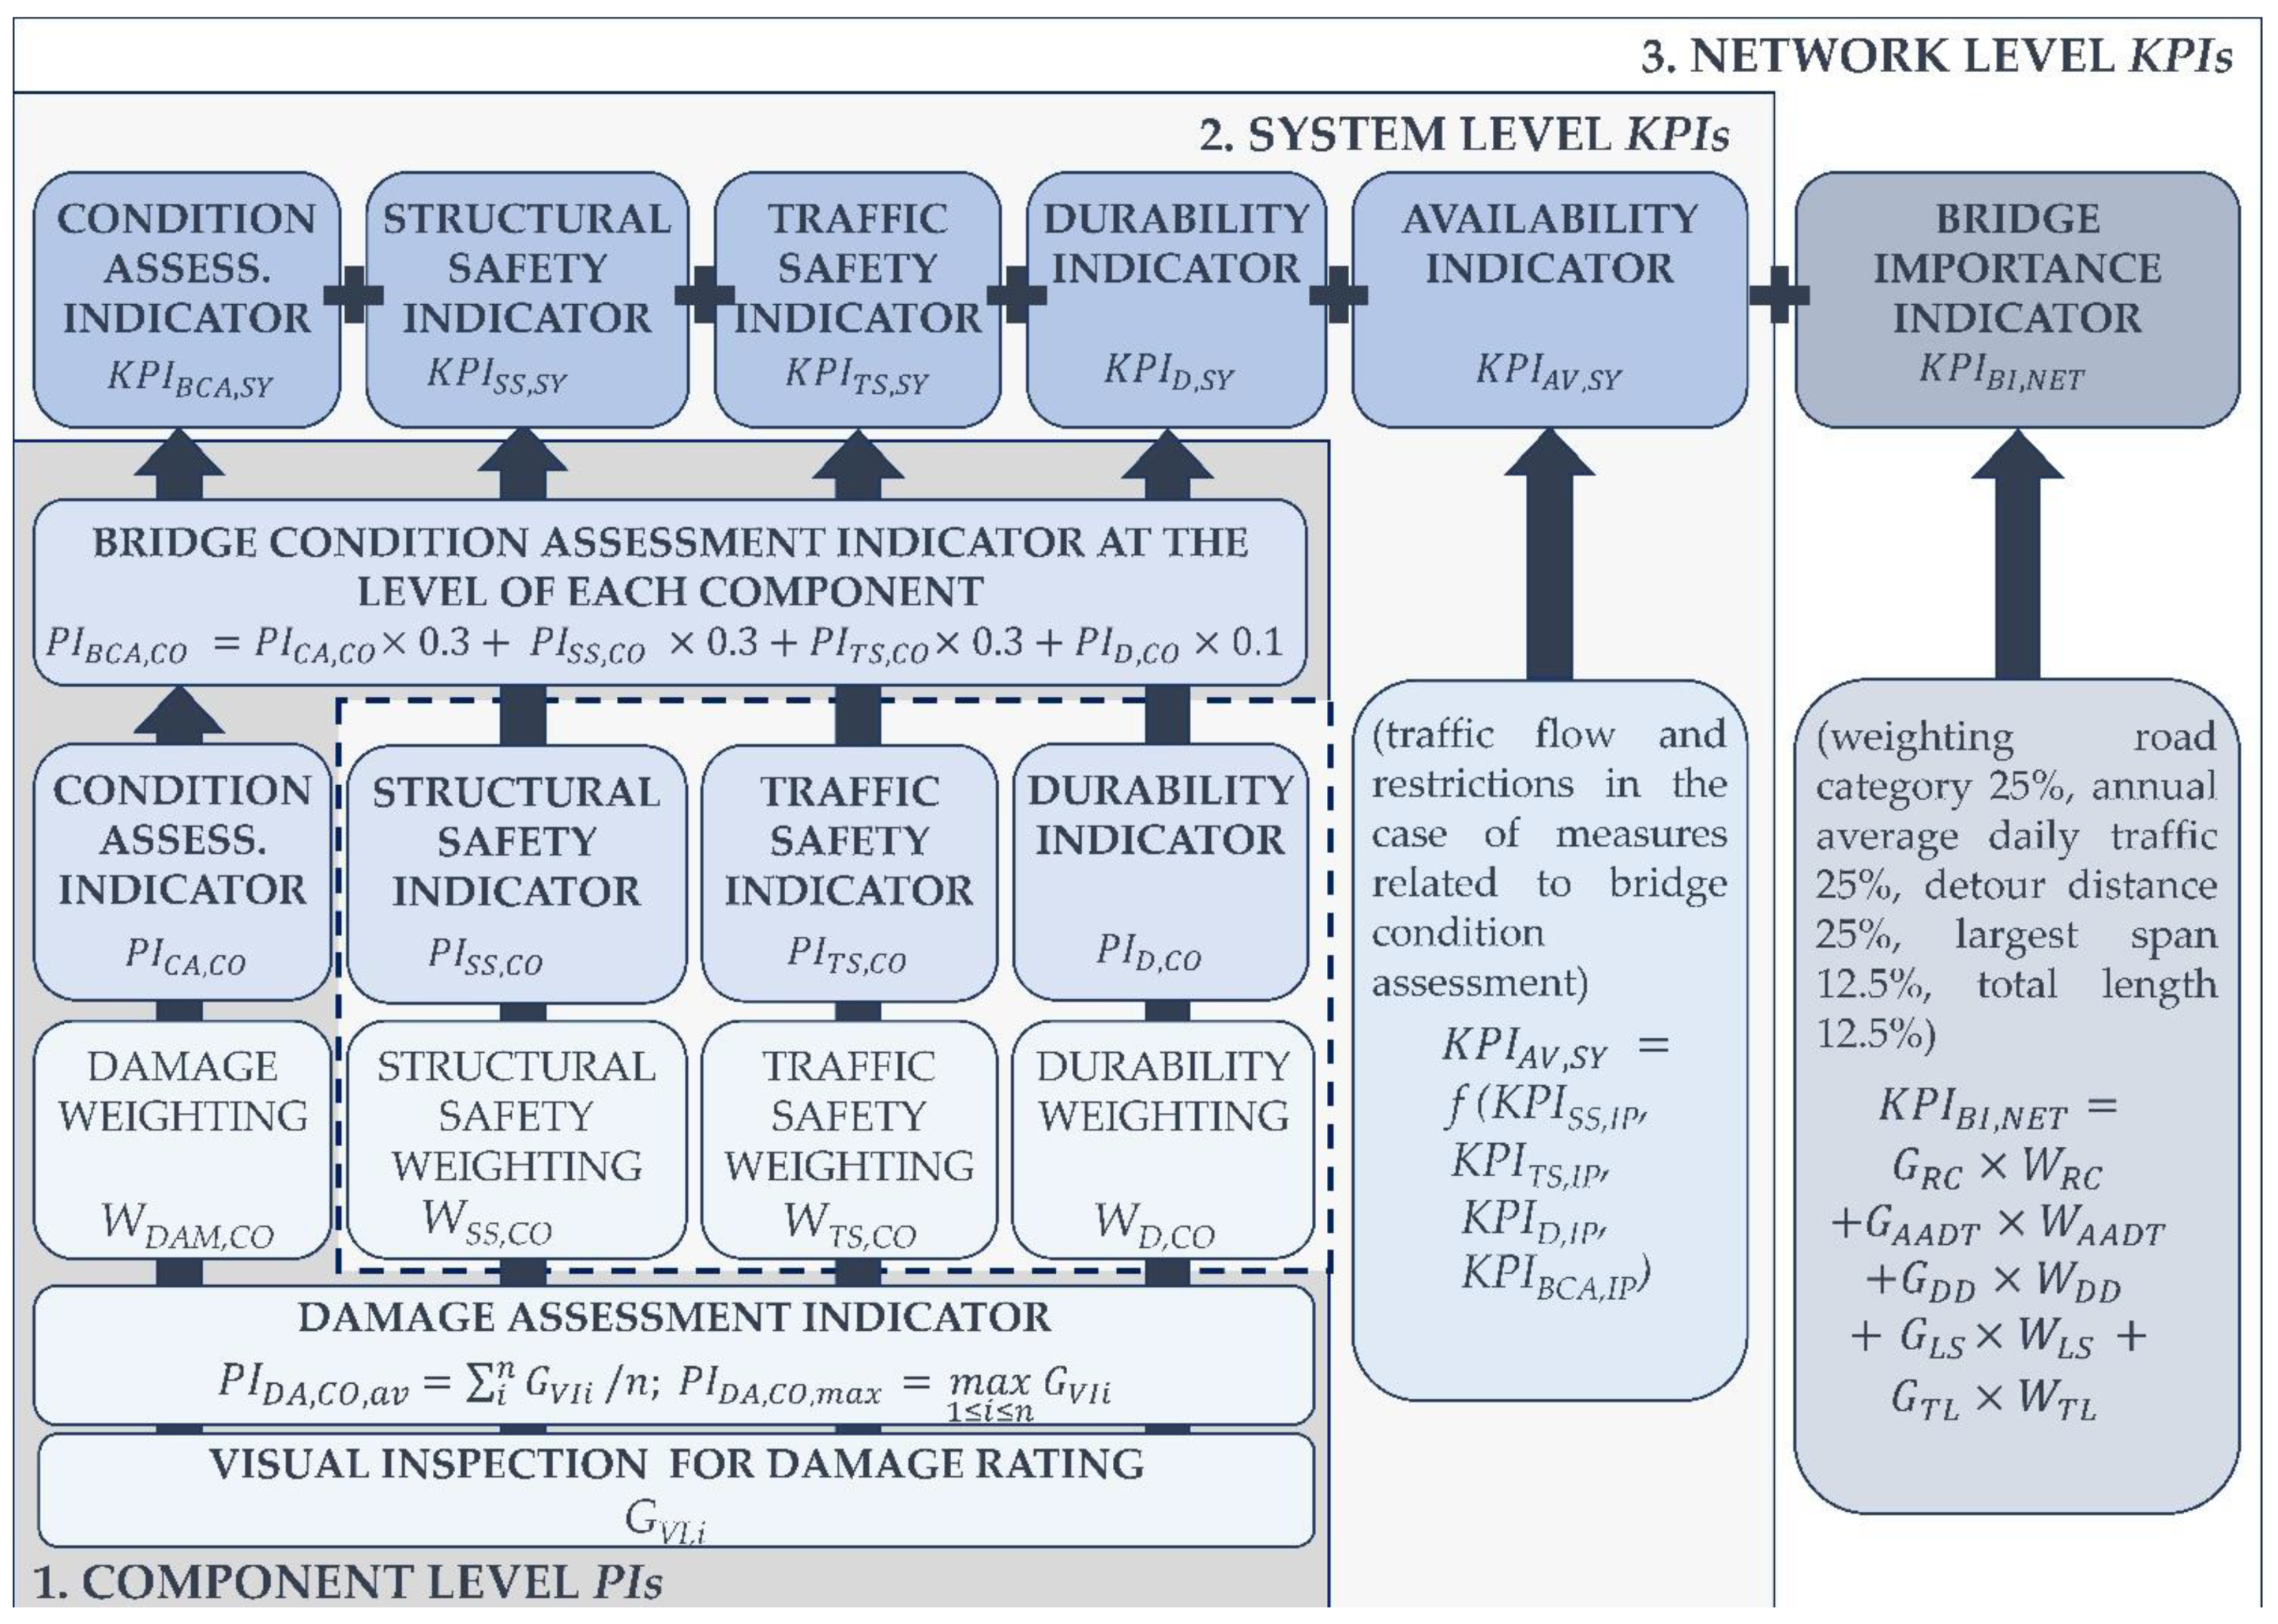
The assessment procedure follows the weighting of the performance indicators from the components (structural element) to the system (bridge structure), up to the network level (all bridges that are part of the infrastructure network). An overview is presented in the form of a flowchart in Figure 1. The performance of bridges can be analyzed at different levels, starting with the analysis of the individual bridge elements–components. At this level, the basic objective is damage assessment, which implies the detection of damage, but also its identification and evaluation. In order to evaluate the impact of each damaged component on the overall condition of the bridge, it is necessary to determine the impact of the damage on the structural safety, traffic safety, and durability of the bridge in addition to the condition assessment at the component level [7]. Based on visual inspection and engineer’s judgment, this is a qualitative approach but can be quantified to some extent using the assessment procedure described in this study. Furthermore, at the system level, the key performance indicators of the bridge as a structural system should be revealed as maximum values among the component’s performance indicators. Additional key performance indicators at the system level describe the availability of the bridge in case certain measures are required due to the bridge condition. At the final network level, the bridge is evaluated to assess its importance within the overall infrastructure network. The assessment at this level, together with the data from the previous levels, enable the achievement of the primary performance objective—the ranking of priority of repair of selected bridges [7].
A detailed description of the individual steps of the assessment procedure is described in the following subsections.
2.2. Component Level
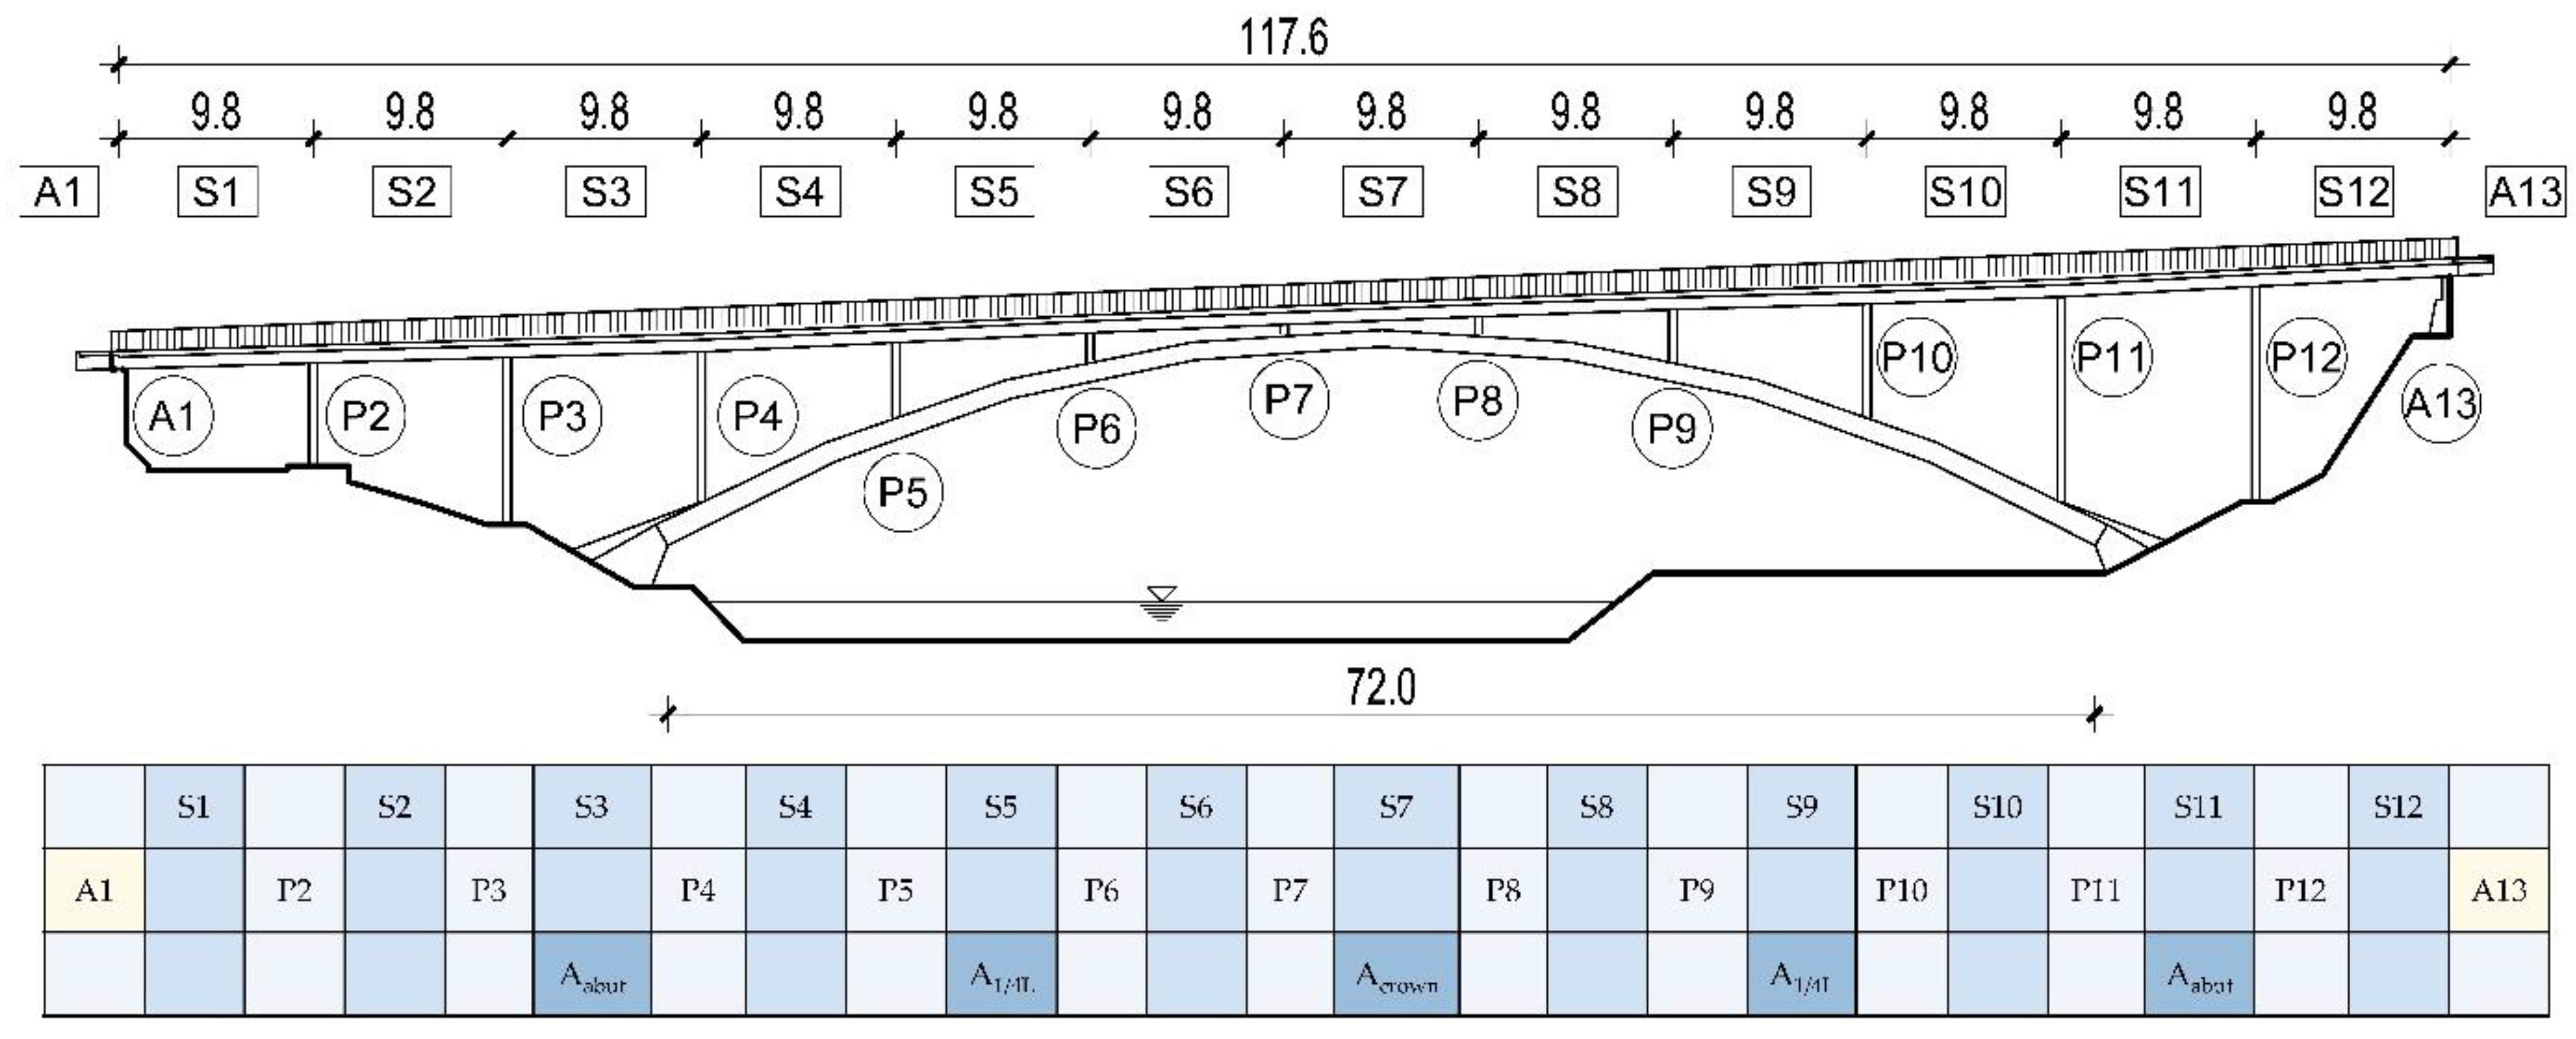
The degree of damage and extension must be observed and evaluated throughout the entire longitudinal layout of the bridge according to critical cross-sections i (Figure 2). This part of the supporting Excel document must be adapted to the longitudinal layout of the bridge. A damage assessment rating (GVI,i) is performed according to the grading system shown in Table 2.
Average damage grade, comprising all critical locations 1 < i < n based on visual inspection, (GVI,i) is proposed by Mandić et al. [48] as a damage assessment indicator at the level of certain components:
The damages of all components of the same component type (i.e., all piers or both abutments, or both pedestrian fences) are included in the average damage assessment indicator of a certain bridge component.
The other solution (as per [48]) is to use maximum damage grade as a damage assessment indicator at the component level. This is used to discover the most problematic location of the bridge which is important for statically determinate structures without reserves (robustness) or where the damage location and severity is affecting the structural safety. Equation (2) is introduced in order to avoid the discount of the impact of severe or critical damages with the averaged value as per Equation (1).
Upon assessing damage indicator at the component level, PIDA,CO, the damaged component condition assessment indicator PICA,CO [48] is evaluated by employing damage weighting for relevant component WD,CO.
Damage weighting WDAM,CO is calculated as a ratio between the damage importance IDAM,CO, and the maximum overall damage level IDAM,CO,max = 4. Damage importance IDAM,CO refers to the maximum damage level that may be reached on a certain component and affect its functionality. Damage importance level IDAM,CO = 1 means that the damaged component will still have the best functionality. Damage importance IDAM,CO = 2 refers to the initially damaged component with undoubted functionality. Damage importance IDAM,CO = 3 stands for a moderately damaged component whose function is not yet compromised. Finally, damage level IDAM,CO = 4 means that the severely damaged component is out of function or has a highly questionable functionality. Table 1 shows the damage importance levels for each critical damage in relation to all inspected components. The table is based on the guideline for bridge evaluation [46].
In order to assess the impact of the damaged component on the overall structure, the importance of the bridge component could be evaluated according to the following criteria: structural safety and serviceability, traffic safety, and durability [49].
After evaluating the damage assessment indicator at the component level, PIDA,CO, the component structural safety, traffic safety, and durability indicators PISS,CO, PITS,CO, and PID,CO [48] are evaluated by using an appropriate weighting for the corresponding component, respectively, WSS,CO,WTS,CO, and WD,CO.
The structural safety weighting WSS,CO is calculated from the ratio of the structural safety importance ISS,CO, and the highest structural safety importance level ISS,CO,max = 3. This value is defined on the basis of structural safety criteria (highest importance level 3), which states that the collapse of a particular component does not affect the safety and serviceability of the bridge (importance level 1), affect a part of the bridge structure (importance level 2) or affect the entire bridge structure (importance level 3).
The traffic safety weighting WTS,CO is calculated as the ratio of the traffic safety importance of the damaged component ITS,CO and highest traffic safety importance level ITS,CO,max = 4. The traffic safety criterion (highest importance level 4) is expressed in terms of the amount of traffic obstruction or congestion caused by the damage to a particular component: The functional failure of a given element does not affect the traffic flow (importance level 1), causes a speed restriction (importance level 2), causes local traffic redirection (importance level 3) or a complete traffic closure (importance level 4).
The durability weighting WD,CO is calculated as the ratio of the durability importance ID,CO of a given damaged component, and the highest durability importance level ID,CO,max = 2. Based on the durability criteria (highest importance level 2), it can be decided that the collapse of a certain component does not affect the durability of other components (importance level 1) or on the contrary that the collapse of a certain component causes reduced durability of other components (importance level 2).
2.3. Transition from Component to System Level
The bridge condition is assessed on the basis of four criteria: (i) general bridge condition, (ii) structural safety and serviceability, (iii) traffic safety, and (iv) durability [50,51]. Before upgrading to the system level, it is necessary to establish bridge condition assessment indicators at the level of each component. The weights for the four bridge condition assessment criteria were established based on the study of priority repair ranking and practical experience in bridge management. Their values are as follows: general condition assessment 30%, structural safety 30%, traffic safety 30%, and durability 10% [51]. Namely three criteria: (i) general bridge condition assessed based on the visual inspection and damage rating, (ii) structural safety of the bridge, and (iii) safety of the traffic at the bridge are considered as equally important for the decision on bridge condition. Additionally, the fourth criteria (iv), durability criteria, relates to the progression of a particular damage until the next inspection and is therefore not considered as equally important, but important enough to overtake 10% in the overall bridge condition assessment.
Therefore, the bridge condition assessment indicator at the level of each component is given by the following equation, with WCA,SY = WSS,SY = WTS,SY = 0.3 and WD,SY = 0.1 as proposed by Mandić et al. [48]:
2.4. System Level
Furthermore, after the disclosure of indicators at the level of each component (1 < co < n), the Key Performance Indicators (KPI) of the overall bridge as a system are proposed by Mandić et al. [48] as maximum values among the component indicators.
Bridge structural safety is indicated with:
Bridge traffic safety is indicated with:
Bridge durability is indicated with:
Bridge condition assessment is indicated with:
An additional key performance indicator shows the bridge availability KPIAV,SY in case of necessary restrictive measures related to the bridge condition assessment. The quantitative scale of the values of the KPIAV,SY is presented in Table 4, depending on the traffic type and the expected traffic restrictions.
If among the previous KPIs (Equations (8)–(11)), the one related to traffic safety KPITS,SY is the most relevant (onerous, the highest value), the assessment of KPIAV,SY refers to the expected measures in the areas of the bridge reserved for traffic (and must not be chosen with a value of 1). If other KPIs have the greatest influence on maintenance or repair measures, KPIAV,SY should be carefully selected considering the expected and necessary traffic restrictions. In this sense, the evaluation of separate maximum indicators for each part of the structure may be useful. Equations (8)–(11) should be used, but not for a complete bridge structure, but for the components that make up each individual part IP, (KPISS,IP, KPITS,IP, KPID,IP, KPIBCA,IP). For example, for the girder structure (see Table 3) only roadway slab, cantilever, main longitudinal girders, secondary longitudinal girders, and cross girders are considered.
The case study bridges are road bridges, but in the case of combined road and rail traffic, the weight of each KPI should be taken with half weight, WSY,road = 0.5 and WSY,rail = 0.5:
If no rails are provided at the bridge, WSY,road = 1.0 and WSY,rail = 0; if no road traffic is foreseen, then WSY,road = 0 and WSY,rail = 1.0.
2.5. Network Level
The bridge importance in the network indicates the bridge value and is based on five criteria: (i) road category, (ii) annual average daily traffic, (iii) detour distance, (iv) largest span, and (v) total length [21,51,52]. The first three criteria related to bridge importance—(i) road category, (ii) annual average daily traffic, and (iii) detour distance—are independent of each other and equally important for the decision on bridge importance. The criteria of the (iv) longest span and criteria of the (v) total length describe the common requirements for construction and property value, and therefore their weighting factors can be considered equal in sum to the factor of each of the first three criteria. Therefore, the following relative weightings are proposed in relation to the ranking of repair or intervention measures: road category 25% (WRC); annual average daily traffic 25% (WAADT); detour distance 25% (WDD); longest span 12.5% (WLS) and total length 12.5% (WTL).
Finally, the bridge importance indicator at the network level can be represented by the following equation:
where GRC, GAADT, GDD, GLS, GTL are graded for road category, annual average daily traffic, detour distance, largest span, and total length respectively according to the qualitative scale of values as proposed by Mandić et al. [48] and presented in Table 5 based on local data for Croatia.
2.6. Overall Performance Assessment for Priority Repair Ranking
The entire assessment procedure (described in Section 2.1, Section 2.2, Section 2.3, Section 2.4 and Section 2.5) is systematized in the flowchart in Figure 1. Based on the assessment by visual inspection and weighting across the component, system, and network levels, a set of the six most important key performance indicators is revealed. The graphical representation in the form of a colored spider is constructed (see Figure 3). Green areas related to structural safety, traffic safety, durability, or bridge condition assessment represent the most favorable rate and red areas should alert the bridge operator and require immediate intervention [47]. Green or red regions related to availability and importance indicators become relevant as soon as the bridge needs maintenance. The green color for the availability indicator KPIAV,SY means that “no problem is expected” or “good performance is expected during maintenance” while the red color, in this case, indicates that availability issues will occur during the maintenance of a particular bridge. Colors related to the importance indicator KPIBI,NET are not crucial for a particular bridge, but later on, when compared with the importance indicators for other bridges in the network, may influence the decision on the priority of repair. In addition to the radar diagram, a tabular representation of the most influential individual parts for the overall bridge KPIs is anticipated.
The performance assessment of the example bridge shows that the most unfavorable indicator of the bridge is structural safety (higher value of KPISS,SY = 3.45), the cause of which is the condition of the piers. This part of the bridge requires the earliest intervention. Moderate to severe impairment of durability (KPID,SY = 3.00) is assumed due to the condition of the sidewalk, which also has a slight to moderate influence on traffic safety (KPITS,SY = 2.25). The overall bridge condition rating (KPIBCA,SY = 2.68) is good, indicating a moderate impact on bridge performance.
The bridge availability indicator KPIAV,SY should be selected with caution considering necessary and expected repair activities. In this case, since only minor traffic disruptions are expected for the repair of the sidewalks and piers of the bridge (slowed traffic flow but still operating in both directions, KPIAV,SY = 2), the bridge availability indicator indicates very good performance during the maintenance work.
Finally, the importance of the bridge in the network (for this example KPIBI,NET with the value below 3) indicates the priority of the actions to be taken on this bridge. However, this can only be properly decided if the example bridge is compared with other bridges in the network. This should be done within the total resources available until the next assessment.
3. Application of the Assessment Procedure on Case Study Bridges
3.1. Case Study Bridges—Description
An example of priority repair ranking based on the bridge key performance indicators is presented in the following section. A sample of five existing bridges and the results of their visual inspections is used to establish the relationship between the condition assessment and the key performance indicators. The selected bridges (Table 6) represent a very good statewide network diversity with a small sample size. The bridges were built between 1958 and 2001 based on different historic design codes. They have different main superstructures: two reinforced concrete arch bridges, but one with a solid cross-section and the other with hollowed cross-section; one integral bridge with V-shaped piers; one precast slab overpass consisting of simply supported girders on classic vertical piers; and one continuous bridge with atypical Y type piers. Therefore, different structural types of the arch, frame, simply supported and continuous girders are covered, as well as different construction methods, i.e., precast and in-situ method and corresponding procedures applied to bridges with spans ranging from 9.5 to 72 m. In addition, some of the bridges are located on state roads and some are on municipal roads with total lengths ranging from 22 to 120 m.
The inspection was carried out within the practical part of the course Durability of Structures of the graduate studies department at the Faculty of Civil Engineering, University of Zagreb. Ten master students [53,54], were involved in this project. The students have very similar previous knowledge, e.g., about bridge structures, effects of traffic loads, structural systems, material deterioration, and durability issues. They were divided into groups and supervised by a professor (AMI), an assistant professor (MKM), and postdoctoral researchers (DS and MS), all of whom are experienced engineers in both bridge design and bridge assessment. The visual inspection is carried out based on the guidelines provided at the course, which are based on operational guidelines [44,45,46], following a strict protocol and using extreme caution, avoiding exit to the roadway, descending and climbing in unsecured places, and only mentioning inaccessible parts in the report. The students had no prior practical knowledge of bridge inspection but were thoroughly briefed on bridge inspection guidelines before going on site to perform the actual inspections. It should be mentioned that visual inspection by an engineer always presents the potential for subjective judgments. However, by involving people (in this case masters students) with very similar prior knowledge and providing the same and adequate, comprehensive, and detailed step-by-step guidelines and approach to recording the damage type, extent, and grading system, this was kept to a minimum. The assessment of selected case study bridges, previously overviewed in a conference paper [48], is elaborated in more detail in this paper.
3.2. Bridge Data and Most Significant Damages
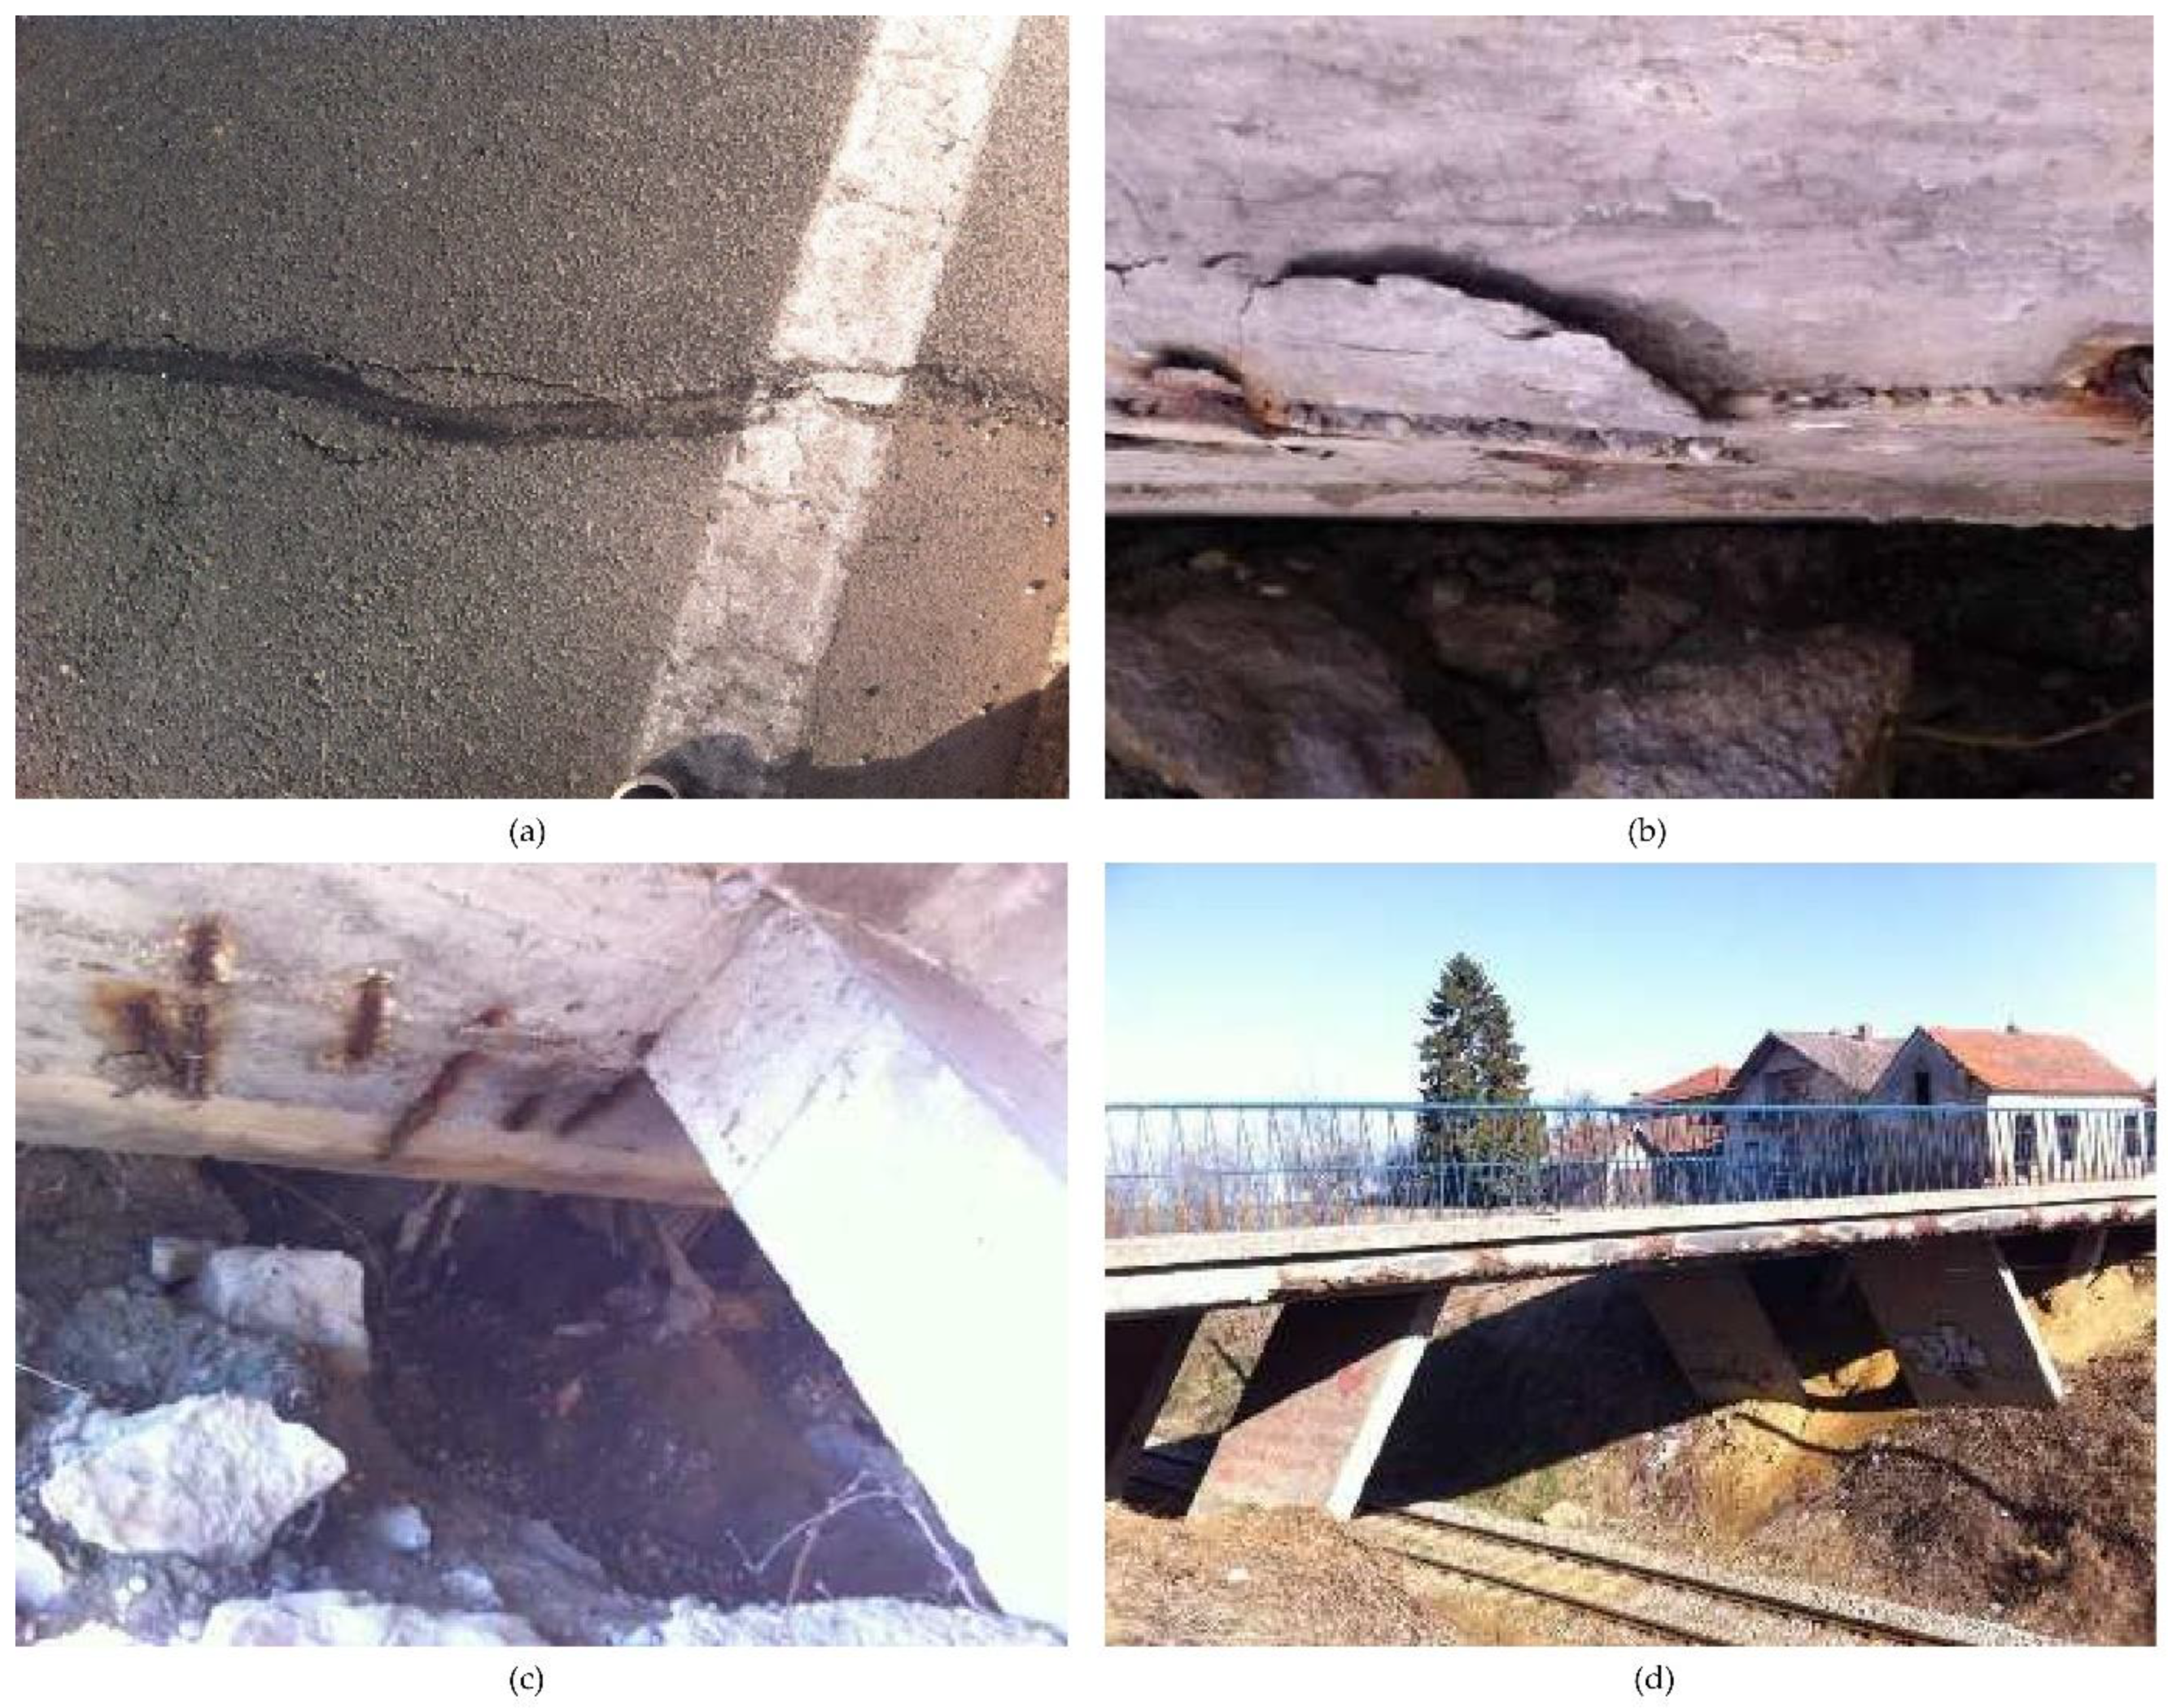
Pier foundations and abutments are largely hidden in the ground or embankment and are not accessible for visual inspection, but when some of their parts are exposed, certain signs of deterioration are noted. In addition, waterproofing damage below the pavement is rarely visible, but wetting and efflorescence on the lower portions of the superstructure deck may indicate this type of damage.
The first case study bridge is the reinforced concrete arch bridge over the Slunjčica River in Slunj (Figure 4) on the D1 Croatian national road, built in 1961. The main supporting elements of this bridge are double reinforced concrete arches with a span of 72 m and a height of 10 m with massive cross-sections, 1.2 m deep at the arch abutments, and only 0.85 m deep at the arch crown. The bridge superstructure consists of a standard reinforced concrete slab with a constant depth of 65 cm in the central, 6.05 m wide part of the cross-section and becomes thinner towards the transverse ends of the cross-section. The superstructure is supported by vertical columns longitudinally spaced 9.8 m apart. Each vertical column consists of two 200-cm-wide columns with a dovetailed cross-section. The bridge was designed and built according to the 1960s design regulations. For the Slunjčica Bridge, the right bridge abutment, the arch abutment, and the lower parts of the end pier were not accessible during this visual inspection due to vegetation. In addition, piers P7, P8, and P9 were not accessible for inspection.
The Rastoke Bridge (Figure 5) is a continuous structure spanning eight spans from 15 to 18.6 m in length. The superstructure consists of a standard reinforced concrete slab with a constant depth of 85 cm. The bridge piers are specially shaped space jet structures. The bridge is located on the national road D1 in a horizontal curve with a radius of 71 m. It was built in 1958 and repaired after the war damage. Except for the pier base in the water and the expansion joints, all elements were accessible for a visual inspection. An additional inspection should be carried out for the pier base to check the condition and signs of scouring. Expansion joints hidden beneath the asphalt pavement should be inspected and replaced if necessary during the planned resurfacing.
The Bjelovar Bridge (Figure 6) is located on State Road D43, which connects the northern and southern parts of the Bjelovar city. It was built in the 1960s as an integral reinforced concrete bridge with V-shaped piers to cross the railroad. The superstructure consists of a massive slab spanning two side spans of approximately 4.4 m and the main span of 9.7 m. The V-shaped piers have wall-like sections that are 30 cm thick. There are no special access-related challenges for this bridge.
The bridge over the Korana River (Figure 7), on the local access road to the city of Karlovac, was built in the 1960s. The bridge is a reinforced concrete double arch with circular cavities, with spans of 55 m and a height of 9 m. The superstructure is a reinforced concrete double arch. The superstructure is a reinforced concrete slab with spans of 12.5 and 15 m, consisting of two 436 cm wide and 58 cm thick slabs with rectangular cavities. The superstructure is supported by vertical columns consisting of two trapezoidal cross-sections. The central part of the Korana Bridge, the arch, and the superstructure spans above the arch were not accessible for inspection under the bridge during this visual inspection. However, the superstructure elements of the approach bridges and the arch abutment were inspected.
The Gradna overpass (Figure 8) was built in 2001 on the local road between Gradna and Celine over the A3 motorway. The superstructure consists of a set of four longitudinally simply supported girders, which in cross-section consist of four precast hollow girders. The spans are either 15.3 or 21 m and the depth of the girders is 75 cm. As the Gradna Bridge is located above the motorway, the girders of the middle span and the pier in the separation zone were not accessible during this visual inspection.
3.3. Analysis of the Assessment Results for Decisions on the Priority Ranking
After visual inspection and damage grading the previously described assessment procedure was applied to the bridge group. The graphical representation of the six most important bridge KPIs for each bridge (Table 7) and the tabular representation of the most influential individual parts for the overall bridge indicators are compared with each other and summarized [48].
All bridges have a similar importance indicator KPIBI,NET between 3 and 2, indicating average network importance in general, but more importantly, all bridges have almost the same importance within the group. The exception is the Slunjčica Bridge with a value of 3.13 due to its larger span and location, which gives this bridge the advantage in the priority repair ranking over bridges with similar or higher system performance indicators. In this case, taking the following considerations into account, the repair of the Slunjčica Bridge should be carried out only before the repair of the Gradna Bridge.
The worst overall condition indicator KPIBCA,SY = 3.60 is determined for the Korana Bridge. Although the structural safety indicator KPISS,SY = 2.46 is rated better (lower value) than the previous three bridges with 3.38–3.45, the traffic safety KPITS,SY = 4.0, and the durability problems KPID,SY = 4.0 of this bridge are close to the alarming red zone. Therefore, the most important bridge to perform maintenance is the Korana Bridge, which requires urgent intervention at both expansion joints to ensure their replacement and the correct positioning of the waterproofing.
The next bridge on the maintenance list is the Rastoke Bridge, due to its alarming durability problems associated with the bridge cornice and sidewalk, given as KPID,SY = 4.5. Although this is the lowest value in this group of case studies, it has less impact on the overall condition of the bridge than structural or traffic safety. This is the reason why the Korana Bridge is still the first on the repair list.
The third bridge should be the Bjelovar Bridge, with all system performance indicators KPISS,SY, KPITS,SY, KPID,SY, KPIBCA,SY, between 3 and 4, mainly influenced by soil erosion at the embankment cone and the poor condition of the superstructure slab. The progression of erosion could adversely affect the bridge substructure and subsequently the superstructure and additionally the railway line below the bridge.
Performance evaluation of other bridges indicates more favorable conditions. The following bridge is the Slunjčica Bridge, where the first measure is the repair of the piers, as their unsuitable concrete cover, concrete delamination, and corrosion of the reinforcement may further reduce the structural safety of the bridge. The last bridge is the Gradna Bridge, where the main action is the repair of piers and abutments. An additional key performance indicator shows the availability of the bridge for required actions related to the bridge condition assessment. As all bridges currently have a sidewalk or carriageway condition rating of 2.5 or higher, the current minimum performance indicator showing bridge availability KPIAV,SY may not be rated 1. The selected value for all bridges KPIAV,SY = 2.0 indicates that traffic flow is currently slowed and congested due to the bridge pavement condition, but both lanes are still functioning (see Table 4). However, when deciding on the repair priority, the value of this indicator depends on the traffic restrictions following necessary repair work.
The replacement of the expansion joint on the Korana Bridge requires the closure of the bridge to traffic and causes the immediate increase of KPIAV,SY to the highest value of 5.0. The repair of the cornice and sidewalk element on the Rastoke Bridge requires traffic from both directions in the same lane and speed restrictions. This increases the availability indicator to the value of KPIAV,SY = 3.0. Repairing the superstructure bottom at Bjelovar Bridge would likely require traffic restrictions for heavy vehicles, increasing the availability indicator to the value of KPIAV,SY = 4.0. For Slunjčica and Gradna Bridge, where substructure element repairs are expected, the availability performance indicator value would likely be maintained at KPIAV,SY = 2.0.
These results could change the priorities in terms of shifting the order of maintenance of the Bjelovar and Rastoke bridges in order to reduce possible cost increases due to later response and extension of the unavailability period.
4. Discussion and Conclusions
4.1. Recommendations for Future Research
Further research should include digitizing the entire process and the development of the time-dependent key performance indicators. This way, up to now developed time-wise-one-dimensional spider (Figure 3 and Table 7), would be extended into the timeline spider for the remaining lifetime of the bridge following the intervals between inspections and sequence of intervention measures. However, such an extension again requires knowledge of the costs of different repair solutions and strategies for different types of bridges and the associated costs for the degraded availability of the bridge.
In this sense, the first steps are carried out by applying two maintenance strategies in analyzing the time dependence of key performance indicators and their interdependence for each of the bridges considered above. In this paper, the results for one of the bridges—Bjelovar Bridge (Figure 9)—are presented for two different strategies in order to give an example for further research.
The main difference between the two maintenance strategies is that the first strategy aims to intervene whenever there is a major deterioration in the assessment of the key performance indicators, while the second strategy aims to delay the intervention as much as possible. In the first strategy, intervention is made as soon as one of the KPIs reaches a value of 3.5, which means that maintenance and repair actions should start as soon as possible to maintain serviceability and lifetime expectancy. In the second strategy, intervention would be made when the KPI reaches a value of 4. In exceptional situations, intervention would be made when the KPI reaches a value of 4.5, which means that repair and maintenance actions should be carried out immediately. For both strategies, structural deterioration is expected through a decline in bridge performance indicator values.
For both strategies 1 and 2, based on the initial results (t = 0), the key to intervention is the durability performance indicator, followed by other indicators, i.e., bridge condition assessment, structural safety, and traffic safety. The order of intervention is shown in Table 8. At the end of strategy 1 (t = 50), the ranking of indicators is changed, the worst graded are traffic safety and durability, followed by structural safety and bridge condition assessment. For strategy 2, for t = 50, the order is also reversed, the worst-rated indicator is that for traffic safety, followed by durability and bridge condition rating and finally the best graded is that for structural safety. This clearly shows the divergence of the two strategies and the different ranking of the performance indicators in the same year during the observed period. In summary, the first strategy is more progressive, but whether it is feasible depends on the resources available for the specific interventions within the whole observed group of bridges.
4.2. Conclusions and the Contribution of the Assessment Procedure
After collecting the existing knowledge on bridge assessment from practical experience, the damage indicators (e.g., cracks, concrete layer delamination, deformation, etc.) are determined in relation to a specific bridge component (e.g., roadway as part of the traffic surface, main girder, and slab as parts of the bridge superstructure and piers and abutments as parts of the bridge substructure, etc.). The damages are assigned with the corresponding maximum importance associated with the functionality of the corresponding bridge component.
At the component level, damage assessment indicator PIDA,CO of each damage for each component is established, and, by employing weighting of particular damage for relevant component, it is raised to the level of the whole component condition assessment indicator PICA,CO. Further on, at the level of each component, component indicators of (a) structural safety PISS,CO, (b) traffic safety PITS,CO, and (c) durability PID,CO are calculated.
Then, a transition is made from the component to the system level by adequately weighting each indicator at the component level. The weighting of the four bridge condition assessment criteria PIBCA,CO, based on practical experience in bridge management, is considered as follows: general condition assessment 30%, structural safety 30%, durability 10%, and traffic safety 30%.
Furthermore, the key performance indicators of the whole bridge as a system should be revealed as the maximum values among the component indicators: structural safety indicator KPISS,SY, traffic safety indicator KPITS,SY, durability issues indicator KPID,SY, and the general bridge condition indicator KPIBCA,SY. An additional key performance indicator is the bridge availability indicator KPIAV,SY, which considers the traffic restrictions that are necessary with respect to the assessed bridge performance.
This method also takes into account the importance of the bridge in the network which indicates bridge value KPIBI,NET and is based on five criteria: road category (weight 25%), annual average daily traffic (25%), detour distance (25%), longest span (12.5%), and total length (12.5%).
Based on the assessment by visual inspection and weighting at the component, system, and network levels, a set of the six most important key performance indicators is disclosed. It is recommended that the results are presented graphically in the form of a colored spider diagram, accompanied by a tabular overview of the performance indicators. Such a representation can be used in a very descriptive and efficient way for prioritizing the repair of each bridge, but more importantly within the whole network.
The unique procedure for assessing bridges from the level of element damage to the level of system functionality and finally to the level of priority in the network combines current procedures in Croatian bridge assessment practice with the theoretically based systematization of key bridge performance indicators from research at the European level. The whole procedure was applied and validated on several case study bridges in Croatia, which represent a group within which priorities of future actions and interventions are revealed. This example can be adapted to a group of bridges on a specific road section or area managed by a specific infrastructure manager [48].
Author Contributions
Conceptualization, A.M.I. and D.S.; methodology, A.M.I., M.K.M. and D.S.; software, A.M.I. and D.S.; validation, A.M.I., M.K.M., M.S. and D.S.; formal analysis, A.M.I.; investigation, A.M.I., D.S. and M.K.M.; resources, A.M.I., M.K.M., M.S. and D.S.; data curation A.M.I. and D.S.; writing—original draft preparation, A.M.I.; writing—review and editing A.M.I., M.K.M. and D.S.; visualization, D.S. and M.S.; supervision, A.M.I.; project administration, A.M.I. and D.S. All authors have read and agreed to the published version of the manuscript.
Funding
This research received no external funding.
Institutional Review Board Statement
Not applicable.
Informed Consent Statement
Not applicable.
Data Availability Statement
The data presented in this study are available on request from the corresponding author. The data are not publicly available due to privacy restrictions.
Acknowledgments
This paper is based on the work carried out in the scope of the Croatian national project “Key performance indicators of existing bridges” under the short financial support of the University of Zagreb. Cost Action TU1406, Quality Specifications for Roadway Bridges—Standardization at a European Level, has provided valuable networking support.
Conflicts of Interest
The authors declare no conflict of interest. The funders had no role in the design of the study; in the collection, analyses, or interpretation of data; in the writing of the manuscript, or in the decision to publish the results.
References
- Calvi, G.M.; Moratti, M.; O’Reilly, G.J.; Scattarreggia, N.; Monteiro, R.; Malomo, D.; Calvi, P.M.; Pinho, R. Once upon a Time in Italy: The Tale of the Morandi Bridge. Struct. Eng. Int. 2019, 29, 198–217. [Google Scholar] [CrossRef]
- Skokandić, D.; Mandić Ivanković, A. Value of Additional Traffic Data in the Context of Bridge Service-Life Management. Struct. Infrastruct. Eng. 2020. [Google Scholar] [CrossRef]
- SeRON. Security of Road Networks: Final Report of the Research Project; European Commission: Karlsruhe, Germany, 2012. [Google Scholar]
- ERF. Road Statistics—Yearbook 2017; ERF: Brussels, Belgium, 2017; p. 93. [Google Scholar]
- Pérez-Peña, R. After Italy Collapse, Europe Asks: How Safe Are Our Bridges? New York Times, 21 August 2018. [Google Scholar]
- European Commission. Discussion Paper—“State of Infrastructure Maintenance”; European Commission: Brusells, Belgium, 2019; pp. 1–17. [Google Scholar]
- Mandić Ivanković, A.; Skokandić, D.; Žnidarič, A.; Kreslin, M. Bridge Performance Indicators Based on Traffic Load Monitoring. Struct. Infrastruct. Eng. 2019, 15, 899–911. [Google Scholar] [CrossRef]
- Woodward, R.J. Guidelines for Assessing Load Carrying Capacity—Final Report of BRIME Project; BRIME: Brussels, Belgium, 2001. [Google Scholar]
- ARCHES Assessment and Rehabilitation of Central European Highway Structures—Executive Summary Report of the Project; European Commission: Brussels, Belgium, 2009; Available online: http://arches.fehrl.org (accessed on 10 March 2021).
- Bien, J.; Elfgren, L.; Olofsson, J. Sustainable Bridges—Assessment for Future Traffic Demands and Longer Lives; Dolnośląskie Wydawnictwo Edukacyjne: Wroclaw, Poland, 2007; ISBN 9788371251610. [Google Scholar]
- Paeglitis, A.; Matos, J.C.; Stipanović, I.; Hajdin, R.; Kedar, A.; Pakrashi, V. (Eds.) COST TU1406 Quality Specifications for Roadway Bridges, Standardization at a European Level—EBook for the 5th Workshop Meeting; Riga Technical University, Faculty of Civil Engineering: Riga, Latvia, 2017; ISBN 978-9934-22-067-8. [Google Scholar]
- Thompson, P.D.; Small, E.P.; Johnson, M.; Marshall, A.R. The Pontis Bridge Management System. Struct. Eng. Int. J. Int. Assoc. Bridg. Struct. Eng. 1998, 8, 303–308. [Google Scholar] [CrossRef]
- Hawk, H.; Small, E.P. The BRIDGIT Bridge Management System. Struct. Eng. Int. J. Int. Assoc. Bridg. Struct. Eng. 1998, 8, 309–314. [Google Scholar] [CrossRef]
- Homeland Security Aging Infrastructure: Issues, Research, and Technology; U.S. Department of Homeland Security: Washington, DC, USA, 2010; Volume 1.
- ASCE Infrastructure Report Card; American Society of Civil Engineers (ASCE): Reston, Virginia, VA, USA, 2017; Volume 53.
- Melhem, M.M.; Caprani, C.; Ng, A. Bridge Management in Australia and New Zealand: Current Approaches and Future Needs. In Proceedings of the 9th International Conference on Bridge Maintenance, Safety and Management, IABMAS 2018, Mel-bourne, Australia, 9–13 July 2018; pp. 1844–1845. [Google Scholar]
- Xu, X.; Huang, Q.; Ren, Y.; Zhao, D.Y.; Zhang, D.Y.; Sun, H. Bin Condition Evaluation of Suspension Bridges for Maintenance, Repair and Rehabilitation: A Comprehensive Framework. Struct. Infrastruct. Eng. 2019, 15, 555–567. [Google Scholar] [CrossRef]
- Chen, A.; Wang, D.; Ma, R.; Pan, Z. Standardization of Life-Cycle Performance Evaluation and Application to Suspension Bridge with Multiple Pylons. Struct. Infrastruct. Eng. 2020, 16, 567–582. [Google Scholar] [CrossRef]
- Ren, Y.; Xu, X.; Liu, B.; Huang, Q. An Age- and Condition-Dependent Variable Weight Model for Performance Evaluation of Bridge Systems. KSCE J. Civ. Eng. 2021, 25, 1816–1825. [Google Scholar] [CrossRef]
- Hooks, J.; Frangpool, D.M. Bridge Performance Primer, Report of the Long-Term Bridge Performance (LTBP) Program of the Federal Highway Administration FHWA. 2013. Available online: https://www.fhwa.dot.gov/publications/research/infrastructure/structures/ltbp/13051/13051.pdf (accessed on 15 February 2021).
- Mandić Ivanković, A.; Strauss, A.; Sousa, H. European Review of Performance Indicators towards Sustainable Road Bridge Management. Proc. Inst. Civ. Eng. Eng. Sustain. 2019, 1–16. [Google Scholar] [CrossRef]
- Adams, T.M.; Kang, M.K. Sensitivity Analysis of Bridge Health Index by Various Element Failure Costs and Element Conditions; Midwest Regional University Transportation Center, The University of Wisconsin-Madison: Madison, WI, USA, 2009. [Google Scholar]
- OECD. Performance Indicators for the Road Sector Summary of the Fiel Tests; OECD: Paris, France, 2001; Volume 26. [Google Scholar]
- Gervásio, H.; da Silva, L.S. Life-Cycle Social Analysis of Motorway Bridges. Struct. Infrastruct. Eng. 2013, 9, 1019–1039. [Google Scholar] [CrossRef]
- Serpell, J. Sustainability Assessment of Road Bridges. Univrsity of Bradford: Bradford, UK, 2015; Volume 18. [Google Scholar]
- Ugwu, O.O.; Kumaraswamy, M.M.; Wong, A.; Ng, S.T. Sustainability Appraisal in Infrastructure Projects (SUSAIP). Autom. Constr. 2006, 15, 239–251. [Google Scholar] [CrossRef]
- Bragança, L.; Mateus, R.; Koukkari, H. Building Sustainability Assessment. Sustainability 2010, 2, 2010–2023. [Google Scholar] [CrossRef] [Green Version]
- COST. Action C25 Integrated Approach towards Sustainable Construction; Final Report, ed., Braganaca, L., Eds.; University of Minho: Braga, Portugal, 2011. [Google Scholar]
- COST. Action 345 The Way Forward for Pavement Performance Indicators across Europe—Final Report of the COST Action 354 Performance Indicators for Road Pavements; FSV—Austrian Transportation Research Association: Vienna, Austria, 2008. [Google Scholar]
- Casas, J.R. European Standardization of Quality Specifications for Roadway Bridges: An Overview. In Proceedings of the 8th International Conference on Bridge Maintenance, Safety and Management, Foz do Iguaçu, Brazil, 26–30 June 2016; Taylor and Francis: Foz do Iguaçu, Brazil, 2016. [Google Scholar]
- Matos, J.C.; Casas, J.R.; Fernandes, S. Quality Specifications for Roadway Bridges (Bridge Spec). In Proceedings of the 8th International Conference on Bridge Maintenance, Safety and Management, Foz do Iguaçu, Brazil, 26–30 June 2016; Taylor and Francis: Foz do Iguaçu, Brazil, 2016. [Google Scholar]
- Strauss, A.; Mandić-Ivanković, A.; Matos, J.C.; Casas, J.R. Performance Indicators for Roadway Bridges, Technical Report of the Working Group 1: Performance Indicators (COST Action TU1406); University of Mingho: Guimaraes, Portugal, 2016; ISBN 978-3-900932-41-1. [Google Scholar]
- Graybeal, B.A.; Phares, B.M.; Rolander, D.D.; Moore, M.; Washer, G. Visual Inspection of Highway Bridges. J. Nondestruct. Eval. 2002, 21, 67–83. [Google Scholar] [CrossRef]
- Quirk, L.; Matos, J.; Murphy, J.; Pakrashi, V. Visual Inspection and Bridge Management. Struct. Infrastruct. Eng. 2018, 14, 320–332. [Google Scholar] [CrossRef]
- Gattulli, V.; Chiaramonte, L. Condition Assessment by Visual Inspection for a Bridge Management System. Comput. Civ. Infrastruct. Eng. 2005, 20, 95–107. [Google Scholar] [CrossRef]
- Estes, A.C.; Frangopol, D.M. Updating Bridge Reliability Based on Bridge Management Systems Visual Inspection Results. J. Bridg. Eng. 2003, 8, 374–382. [Google Scholar] [CrossRef] [Green Version]
- Agdas, D.; Rice, J.A.; Martinez, J.R.; Lasa, I.R. Comparison of Visual Inspection and Structural-Health Monitoring as Bridge Condition Assessment Methods. J. Perform. Constr. Facil. 2016, 30, 04015049. [Google Scholar] [CrossRef] [Green Version]
- Tenžera, D.; Puž, G.; Radić, J. Visual Inspection in Evaluation of Bridge Condition. J. Croat. Assoc. Civ. Eng. 2012, 64, 717–726. [Google Scholar] [CrossRef]
- DRD. Guideline for Probability-Based Assessment of Bridges (In Danish); The Danish Road Directorate (DRD): Copenhagen, Denmark, 2003. [Google Scholar]
- Rijkswaterstaat Leidraad RAMS—Sturen Op Prestaties van Systemen; Rijkswaterstaat, Ministry of Infrastructure and Water Management: Hague, The Netherlands, 2012.
- Ghosn, M.; Frangopol, D.M.; McAllister, T.P.; Shah, M.; Diniz, S.M.C.; Ellingwood, B.R.; Manuel, L.; Biondini, F.; Catbas, N.; Strauss, A.; et al. Reliability-Based Performance Indicators for Structural Members. J. Struct. Eng. 2016, 142, F4016002. [Google Scholar] [CrossRef]
- Strauss, A.; Wan-Wendner, R.; Vidovic, A.; Zambon, I.; Yu, Q.; Frangopol, D.M.; Bergmeister, K. Gamma Prediction Models for Long-Term Creep Deformations of Prestressed Concrete Bridges. J. Civ. Eng. Manag. 2017, 23, 681–698. [Google Scholar] [CrossRef]
- Zambon, I.; Vidovic, A.; Strauss, A.; Matos, J.; Amado, J. Comparison of Stochastic Prediction Models Based on Visual Inspections of Bridge Decks. J. Civ. Eng. Manag. 2017, 23, 553–561. [Google Scholar] [CrossRef]
- Croatian Roads Ltd. Handbook of Damages on Bridge Elements; Croatian Roads Ltd.: Zagreb, Croatia, 2014. [Google Scholar]
- Croatian Highways Ltd. Handbook of Damages on Bridge Elements; Croatian Highways Ltd.: Zagreb, Croatia, 2010. [Google Scholar]
- Croatian Highways Ltd. Guideline for Bridge Evaluation; Croatian Highways Ltd.: Zagreb, Croatia, 2010. [Google Scholar]
- Strauss, A.; Mandić Ivanković, A.; Matos, J.C.; Casas, J.R. Performance Indicators for Road Bridges—Overview of Findings and Future Progress. In Proceedings of the Joint COST TU1402–COST TU1406–IABSE WC1 Workshop: The Value of SHM for the reliable Bridge Management, Zagreb, Croatia, 2–3 March 2017. [Google Scholar]
- Mandić Ivanković, A.; Kušter Marić, M.; Skokandić, D.; Njirić, E.; Šiljeg, J. Finding the Link between Visual Inspection and Key Performance Indicators for Road Bridges. In Proceedings of the Report on IABSE SYMPOSIUM—GUIMARÃES 2019: “Towards a Resilient Built Environment Risk and Asset Management”; IABSE: Guimaraes, Portugal, 2019; Volume 1, pp. 737–744. [Google Scholar]
- Deutsches Institut für Normung DIN 1976; German institute for standardization (DIN): Berlin, Germany, 1999.
- Bleiziffer, J.; Jurić, J.; Kuvačić, B. Current Developments in Asset Management System for Croatian Motorways. In Proceedings of the 8th central European Congress on Concrete Engineering: Durability of Concrete Structures, Plitvice Lakes, Croatia, 4–6 October 2012. [Google Scholar]
- Croatian Highways Ltd. Bridge Management Planning; Croatian Highways Ltd.: Zagreb, Croatia, 2008. [Google Scholar]
- Kuvačić, B.; Jurić, J. Bridge Management System—Determining and Monitoring of the Bridge Condition and Defining Priorities and Maintenance Costs. Ceste Most. 2005, 51, 24–30. [Google Scholar]
- Frklić, M.; Lacković, V.; Maleta, A.; Maleta, T.; Njirić, E.; Papac, M.; Pezelj, D.; Sačarić, D.; Slišković, A. Quantitative Condition Assessment of Bridges; Student Seminar Durability of Structures Graduate Study; University of Zagreb: Zagreb, Croatia, 2018. [Google Scholar]
- Njirić, E.; Šiljeg, J. Performance Assessment of Roadway Bridges for Priority Repair Ranking; Student Scientific Work Awarded with the Rector’s Prize (Mentor Mandić Ivanković, A.); University of Zagreb: Zagreb, Croatia, 2018. [Google Scholar]
Figure 1.
Flowchart of the assessment procedure from the component and system levels up to the network level. Reprinted with permission from ref. [48]. 2019. IABSE.
Figure 1.
Flowchart of the assessment procedure from the component and system levels up to the network level. Reprinted with permission from ref. [48]. 2019. IABSE.

Figure 2.
Critical cross-section-related locations for a visual inspection of an arch bridge example, reproduced from [48]. Reprinted with permission from ref. [48]. 2019. IABSE.

Figure 3.
Example graphical representation of the six most important bridge KPIs (left); table representation of most influencing individual part for the overall bridge KPIs (right). Reprinted with permission from ref. [48]. 2019. IABSE.
Figure 3.
Example graphical representation of the six most important bridge KPIs (left); table representation of most influencing individual part for the overall bridge KPIs (right). Reprinted with permission from ref. [48]. 2019. IABSE.

Figure 4.
Most significant damages to Slunjčica Bridge [48]: (a) concrete cover fraction and reinforcing steel corrosion at the pier due to the insufficient concrete cover and poor construction; (b) sidewalk block cracking probably due to vibration and poor construction concrete; (c) cover fraction and reinforcing steel corrosion at the slab bottom due to insufficient concrete cover and efflorescence appearance due to wetting and probable damage in waterproofing. Reprinted with permission from ref. [48]. 2019. IABSE.

Figure 5.
Most significant damages to Rastoke Bridge [48]: (a) degradation of corrosion protection coating of the pedestrian fence due to poor protection and lack of maintenance; (b) breakage of the concrete cover and reinforcing steel corrosion of the cornice due to freezing and thawing; (c) segregation due to poor concreting and reinforcing steel corrosion leading to a concrete spalling at the bottom slab next to the abutment; (d) delamination of the concrete cover and efflorescence at the bottom of the slab due to wetting and probable damage in waterproofing. Reprinted with permission from ref. [48]. 2019. IABSE.

Figure 6.
Most significant damages to Bjelovar Bridge [48]: (a) repaired cracks in asphalt pavement on the transfer location from the bridge to the approach road; (b) concrete cover fraction and (c) reinforcement steel corrosion on the underside of the superstructure slab near the junction with the side legs of the V-shaped piers; (d) soil erosion at the embankment cone. Reprinted with permission from ref. [48]. 2019. IABSE.

Figure 7.
Most significant damages to Korana Bridge [48]: (a) mechanical damage and corrosion of the pedestrian fence due to poor protection and lack of maintenance; (b) construction joint, concrete wetting, and efflorescence on the main slab girders below (c); (c) cracks in the asphalt pavement and dilatation in connections with the construction joint in the 8th field of the superstructure deck close to the pier; (d) cornice delamination. Reprinted with permission from ref. [48]. 2019. IABSE.

Figure 8.
Most significant damages to Gradna Bridge [48]: (a) corrosion of the pedestrian fence; (b) sidewalk plucking out due to inadequate pavement mixture and curb erosion along the bridge due to poor construction and vibrations; (c) wetting of the prefabricated cornice; (d) wetting and delamination of the concrete of the pier due to improper drainage execution and performance; (e) leakage, wetting, and delamination of the abutment due to water leaking at the expansion joint. Reprinted with permission from ref. [48]. 2019. IABSE.

Figure 9.
Evolution of key performance indicators (KPIs) in time for two maintenance strategies—Bjelovar Bridge example. Reprinted with permission from ref. [48]. 2019. IABSE.
Figure 9.
Evolution of key performance indicators (KPIs) in time for two maintenance strategies—Bjelovar Bridge example. Reprinted with permission from ref. [48]. 2019. IABSE.


Table 1.
List of observed damages related to components and adequate highest damage importance (IDAM,CO,max) related to component functionality. Reprinted with permission from ref. [48]. 2019. IABSE.
Table 1.
List of observed damages related to components and adequate highest damage importance (IDAM,CO,max) related to component functionality. Reprinted with permission from ref. [48]. 2019. IABSE.
| Bridge Subsystem | Individual Part | Component | Damage | IDAM,CO,max |
|---|---|---|---|---|
| Traffic-Reserved Areas and Equipment | SIDEWALK | PEDESTRIAN FENCE | weld crack | 3 |
| degradation of corrosion protection coating | 2 | |||
| concrete cover fracture | 3 | |||
| BUFFER FENCE | weld crack | 3 | ||
| degradation of corrosion protection coating | 2 | |||
| SIDEWALK | block cracking | 2 | ||
| cracks due to temperature change or shrinkage | 2 | |||
| mix rutting | 3 | |||
| asphalt cracks | 3 | |||
| concrete cover fracture | 4 | |||
| CORNICE | concrete wetting and efflorescence | 3 | ||
| concrete cover fracture | 4 | |||
| rock pocket | 2 | |||
| PAVEMENT | CARRIAGEWAY STRUC. | mix rutting | 3 | |
| asphalt cracks | 3 | |||
| EXPANSION JOINT | accumulation of dirt | 4 | ||
| leakage | 3 | |||
| Bridge Superstructure | GIRDER STRUCTURE | ROADWAY SLAB | vibration | 4 |
| deflection | 4 | |||
| concrete wetting and efflorescence | 3 | |||
| unclassified cracks | 3 | |||
| concrete cover fracture | 4 | |||
| reinforcing steel corrosion | 4 | |||
| reinforcement bar collapse | 4 | |||
| corrosion of cables for longitudinal prestressing | 4 | |||
| leakage through concrete and cracks | 2 | |||
| CANTILEVER | vibration | 4 | ||
| deflection | 4 | |||
| concrete wetting and efflorescence | 3 | |||
| unclassified cracks | 3 | |||
| concrete cover fracture | 4 | |||
| reinforcement steel corrosion | 4 | |||
| reinforcement bar collapse | 4 | |||
| MAIN (LONGITUDINAL) GIRDERS | vibration | 4 | ||
| deflection | 4 | |||
| concrete wetting and efflorescence | 3 | |||
| unclassified cracks | 3 | |||
| concrete cover fracture | 4 | |||
| reinforcement steel corrosion | 4 | |||
| reinforcement bar collapse | 4 | |||
| corrosion of anchors for longitudinal prestressing | 4 | |||
| CROSS GIRDER | vibration | 4 | ||
| deflection | 4 | |||
| concrete wetting and efflorescence | 3 | |||
| unclassified cracks | 3 | |||
| concrete cover fracture | 4 | |||
| reinforcement steel corrosion | 4 | |||
| reinforcement bar collapse | 4 | |||
| corrosion of anchors for longitudinal prestressing | 4 | |||
| ARCH STRUCTURE | ARCH | vibration | 4 | |
| deflection | 4 | |||
| concrete wetting and efflorescence | 3 | |||
| unclassified cracks | 3 | |||
| concrete cover fracture | 4 | |||
| reinforcing steel corrosion | 4 | |||
| reinforcement bar collapse | 4 | |||
| Substructure | ABUTMENT | BEARING | fall out possibility due to displacement | 3 |
| overdrawn allowed displacement | 4 | |||
| missing bolt or bolt rapture | 4 | |||
| BEARING PAD | block cracking | 2 | ||
| constructive joint | 4 | |||
| concrete cover fracture | 4 | |||
| reinforcing steel corrosion | 4 | |||
| ABUTMENT WALL | rock pocket | 2 | ||
| leakage through concrete and cracks | 2 | |||
| concrete cover fracture | 4 | |||
| reinforcing steel corrosion | 4 | |||
| graffiti | 1 | |||
| concrete efflorescence | 3 | |||
| FOUNDATION | rotation | 4 | ||
| foundation undermining | 4 | |||
| unclassified cracks | 3 | |||
| concrete erosion | 3 | |||
| EMBANKMENT CONE | sliding | 3 | ||
| settlement of soil | 3 | |||
| soil erosion | 3 | |||
| PILLAR | BEARING | fall out possibility due to displacement | 3 | |
| overdrawn allowed displacement | 4 | |||
| missing bolt or bolt rapture | 4 | |||
| BEARING PAD | block cracking | 2 | ||
| constructive joint | 4 | |||
| concrete cover fracture | 4 | |||
| reinforcing steel corrosion | 4 | |||
| HEAD BEAM | rock pocket | 2 | ||
| leakage through concrete and cracks | 2 | |||
| concrete cover fracture | 4 | |||
| unclassified cracks | 3 | |||
| reinforcing steel corrosion | 4 | |||
| PILLAR, PIER | buckling | 4 | ||
| concrete cover fracture | 4 | |||
| reinforcing steel corrosion | 4 | |||
| graffiti | 1 | |||
| unclassified cracks | 3 | |||
| FOUNDATION | rotation | 4 | ||
| foundation undermining | 4 | |||
| unclassified cracks | 3 | |||
| concrete erosion | 3 | |||
| Drainage | SURFACE DRAINAGE | CURB | mechanical damage | 3 |
| concrete erosion | 3 | |||
| WATER INLET | clogged drains | 4 |
Table 2.
Damage assessment grading based on visual inspection [21]. Reprinted with permission from ref. [48]. 2019. IABSE.
| Grade GVI | Damage Description | Measures Required |
|---|---|---|
| 1 | No or very minor damage, normal age-related wear and tear, aesthetic damage. No impairment of load-carrying capacity, serviceability, and predicted service life. | No measures are required. |
| 2 | Minor damage, production defects with no evidence of further deterioration. No impairment of load capacity and serviceability. | If appropriate action is not taken, the predicted service life will be reduced. Repair measures are required in the course of the next maintenance action. |
| 3 | Moderate to severe damage with no decrease in load carrying capacity and serviceability. There are signs of deterioration in the load-carrying capacity and serviceability. | Medium-term maintenance and repair measures are required to maintain the serviceability and the predicted service life of the structure. |
| 4 | Severe damage, without deterioration of the load-carrying capacity. Deterioration with regard to serviceability and expected service life can already be observed. | Maintenance actions are to be initiated as soon as possible to maintain serviceability and expected service life. Such measures may be replaced by additional special inspections within a defined time frame. |
| 5 | Extreme damage with effects on the load-carrying capacity of the structure. | Repair and maintenance measures must be carried out immediately. |
Table 3.
Importance of bridge components [46] for structural safety ISS,CO, traffic safety ITS,CO and durability ID,CO. Reprinted with permission from ref. [48]. 2019. IABSE.
| Bridge Subsystem | Individual Part | Component | ISS,CO | ITS,CO | ID,CO |
|---|---|---|---|---|---|
| Traffic-Reserved Areas and Equipment | SIDEWALK | PEDESTRIAN FENCE | 1 | 4 | 1 |
| BUFFER FENCE | 1 | 4 | 1 | ||
| PROTECTIVE NET | 1 | 3 | 1 | ||
| WINDBREAK | 1 | 3 | 1 | ||
| LIGHTING | 1 | 3 | 1 | ||
| NOISE BARRIER (WALL) | 1 | 1 | 1 | ||
| SIDEWALK | 2 | 3 | 2 | ||
| CORNICE | 2 | 1 | 2 | ||
| PAVEMENT | CARRIAGEWAY STRUCTURE | 1 | 4 | 2 | |
| EXPANSION JOINT | 1 | 4 | 2 | ||
| OVERBURDEN | 1 | 3 | 1 | ||
| Bridge Superstructure | GIRDER STRUCTURE | ROADWAY SLAB | 3 | 4 | 1 |
| CANTILEVER | 2 | 4 | 1 | ||
| MAIN (LONGITUDINAL) GIRDERS | 3 | 1 | 1 | ||
| SECONDARY (LONGITUDINAL) GIRDERS | 2 | 1 | 1 | ||
| CROSS GIRDER | 2 | 1 | 1 | ||
| ARCH STRUCTURE | ARCH | 3 | 1 | 1 | |
| FRONTAL WALL | 2 | 4 | 1 | ||
| CROWN WALL | 2 | 4 | 1 | ||
| Substructure | ABUTMENT | BEARING | 2 | 1 | 1 |
| BEARING PAD | 2 | 1 | 1 | ||
| HEAD BEAM | 3 | 1 | 1 | ||
| PILLAR, PIER | 3 | 1 | 1 | ||
| ABUTMENT WALL | 2 | 4 | 1 | ||
| FOUNDATION | 3 | 1 | 1 | ||
| EMBANKMENT CONE | 1 | 3 | 2 | ||
| PILLAR | BEARING | 2 | 1 | 1 | |
| BEARING PAD | 2 | 1 | 1 | ||
| HEAD BEAM | 3 | 1 | 1 | ||
| PILLAR, PIER | 3 | 1 | 1 | ||
| LINING | 2 | 1 | 2 | ||
| FOUNDATION | 3 | 1 | 1 | ||
| BARRIER | 1 | 1 | 2 | ||
| DRAINAGE | SURFACE DRAINAGE | CURB | 1 | 3 | 2 |
| WATER INLET (DRAIN) | 1 | 3 | 2 | ||
| INTERCEPTING PIPE | 1 | 3 | 2 | ||
| SEWERAGE | MAIN SEWER | 1 | 3 | 1 | |
| SHAFT | 1 | 3 | 1 |
Table 4.
Availability key performance indicator for road and rail bridges (updated from [48]). Reprinted with permission from ref. [48]. 2019. IABSE.
| Road Traffic | KPIAV,SY,road |
|---|---|
| Traffic flow on the bridge is flowing smoothly, without the need for slowing down | 1 |
| Traffic flow is slowed down and jammed due to bridge pavement condition; both lanes are functioning | 2 |
| Traffic from both directions is in the same lane, along with speed restrictions | 3 |
| Traffic restrictions for heavy vehicles, trucks, etc. | 4 |
| A bridge is closed for traffic | 5 |
| Railway (Train, Trams) Traffic | KPIAV,SY,rail |
| Railroad traffic is flowing smoothly | 1 |
| Traffic is slowed down due to rails conditions | 2 |
| Traffic is flowing only on one rail track-separately from both directions | 3 |
| Traffic restriction for trams/trains | 4 |
| A bridge is closed for all the rail tracks | 5 |
Table 5.
Grades for assessment of bridge importance in the network level according to five criteria [48]. Reprinted with permission from ref. [48]. 2019. IABSE.
| Road Category (1) | GRC | Annual Average Daily Traffic (2) (N Vehicles) | GAADT | Detour Distance (3) (km) | GDD | Longest Span (4) (m) | GLS | Total Length (5) (m) | GTL |
|---|---|---|---|---|---|---|---|---|---|
| unknown road | 1 | <500 | 1 | adjacent traffic lane | 1 | <5 | 1 | <20 | 1 |
| local road | 2 | 500–15.000 | 2 | <5 km | 2 | 5–20 | 2 | 20–80 | 2 |
| inter–state road | 3 | 15,000–50.000 | 3 | 5–20 km | 3 | 20–50 | 3 | 80–200 | 3 |
| state road | 4 | 50,000–500.000 | 4 | 20–60 km | 4 | 50–100 | 4 | 200–500 | 4 |
| highway | 5 | >500.000 | 5 | >60 km | 5 | >100 | 5 | >500 | 5 |
(1, 2, 3) It should be noted that the gradation of road category, annual average daily traffic volume, and detour distance should be adjusted to the size of the road network under consideration. (2) In Croatia, for example, more than 50,000 vehicles would be expected only on the detour route of the capital. Looking at the total Croatian traffic intensity, the gradations 1 to 5 could be used for AADT < 500; 500–3000; 3000–10.000, 10.000–30.000, and 30.000–50.000, respectively. (3) The detour route is graded according to the time lost due to (i) slowing down in adjacent traffic line, (ii) time lost of up to 10 min, (iii) up to half of the hour, (iv) up to one hour and (v) more than one hour, respectively. (4) The gradation of the longest span depends on the type of bridge structure, the material used, and the complexity of the structure. Bridges with spans up to 5 m are small crossings made of reinforced concrete. Spans up to 20 m are often overcome with simple reinforced concrete girders or slabs. Above the span range of 20 to 50 m, bridges can be considered as medium-sized bridges where prestressed concrete and composite structures can be used, but even less sophisticated construction methods are possible. Above the 50 m span range, more complex construction types (e.g., arch bridges), more complex cross-sections (beam-type sections, variable height sections), and more sophisticated construction methods (longitudinal launching, cantilever methods). Above the span range of 100 m, it is justified to consider the bridge as a structure of high importance. (5) The total length of the bridge affects maintenance and management costs. Therefore, an appropriate gradation is proposed in terms of span gradation and the most common bridge layouts. The first group represents a small bridge with one or two spans and the second group will include overpasses over the local road to overpasses over the highway. Continuing with medium-sized continuous bridges in the third group. The fourth group includes either more complex structural types of the main bridge with multiple approach spans or long bridges with numerous similar spans. Finally, grade 5 belongs to the main bridges with large spans that have multiple approach spans or to the particularly long bridges.
Table 6.
Main data and schematic layout of case study bridges. Reprinted with permission from ref. [48]. 2019. IABSE.
Table 6.
Main data and schematic layout of case study bridges. Reprinted with permission from ref. [48]. 2019. IABSE.
| Bridge Name | Bridge Type | Largest Span (m) | Overall Length (m) | Road Category | Detour Distance |
|---|---|---|---|---|---|
| Slunjčica | Twin solid RC arch with RC deck slab | 72 | 118.6 | State road | 5–20 km |
 | |||||
| Rastoke | Continuous RC slab on Y type piers | 18.6 | 142.6 | State road | 5–20 km |
 | |||||
| Bjelovar | Integral bridge with an RC slab on V shape piers | 9.5 | 26.7 | State road | 5–20 km |
 | |||||
| Korana | Twin hollowed RC arch with RC hollowed slab superstructure. | 56.0 | 167.5 | Local road | 5–20 km |
 | |||||
| Gradna | Simply supported bridge with hollow precast girders | 21.0 | 80.6 | Local road/highway | 5–20 km |
 | |||||
Table 7.
Overview of the results of the performance evaluation for the set of five bridges [48]. Reprinted with permission from ref. [48]. 2019. IABSE.
| Slunjčica Bridge | Priority ranking:4th |  |
| ||||||||||||||||||||||||||||||||||||||||||||||||||
| Rastoke Bridge | Priority ranking: 2nd |  |
| ||||||||||||||||||||||||||||||||||||||||||||||||||
| Bjelovar Bridge | Priority ranking: 3rd |  |
| ||||||||||||||||||||||||||||||||||||||||||||||||||
| Korana Bridge | Priority ranking: 1st |  |
| ||||||||||||||||||||||||||||||||||||||||||||||||||
| Gradna Bridge | Priority ranking:5th |  |
|
Table 8.
Scheduled interventions on the bridge for two different maintenance strategies. Reprinted with permission from ref. [48]. 2019. IABSE.
Table 8.
Scheduled interventions on the bridge for two different maintenance strategies. Reprinted with permission from ref. [48]. 2019. IABSE.
| t (Year) | 5 | 10 | 15 | 20 | 25 | 30 | 35 | 40 | 45 | 50 |
|---|---|---|---|---|---|---|---|---|---|---|
| Strategy 1 | ||||||||||
| 1. | Slab damage repair | Roadway cracks repair | Drain cleaning | |||||||
| 2. | Embankment repair | Piers damages repair | Roadway cracks repair | |||||||
| 3. | Abutment damages repair | |||||||||
| Strategy 2 | ||||||||||
| 1. | Slab damage repair | Roadway cracks repair | Roadway cracks repair | |||||||
| 2. | Embankment repair | Piers damages repair | ||||||||
| 3. | Abutment damages repair | |||||||||
Publisher’s Note: MDPI stays neutral with regard to jurisdictional claims in published maps and institutional affiliations. |
© 2021 by the authors. Licensee MDPI, Basel, Switzerland. This article is an open access article distributed under the terms and conditions of the Creative Commons Attribution (CC BY) license (https://creativecommons.org/licenses/by/4.0/).
Share and Cite
MDPI and ACS Style
Mandić Ivanković, A.; Skokandić, D.; Kušter Marić, M.; Srbić, M. Performance-Based Ranking of Existing Road Bridges. Appl. Sci. 2021, 11, 4398. https://0-doi-org.brum.beds.ac.uk/10.3390/app11104398
AMA Style
Mandić Ivanković A, Skokandić D, Kušter Marić M, Srbić M. Performance-Based Ranking of Existing Road Bridges. Applied Sciences. 2021; 11(10):4398. https://0-doi-org.brum.beds.ac.uk/10.3390/app11104398
Chicago/Turabian StyleMandić Ivanković, Ana, Dominik Skokandić, Marija Kušter Marić, and Mladen Srbić. 2021. "Performance-Based Ranking of Existing Road Bridges" Applied Sciences 11, no. 10: 4398. https://0-doi-org.brum.beds.ac.uk/10.3390/app11104398
Note that from the first issue of 2016, this journal uses article numbers instead of page numbers. See further details here.