
Comparison of Analytical Methods for Determining Methylesterification and Acetylation of Pectin


Abstract
:
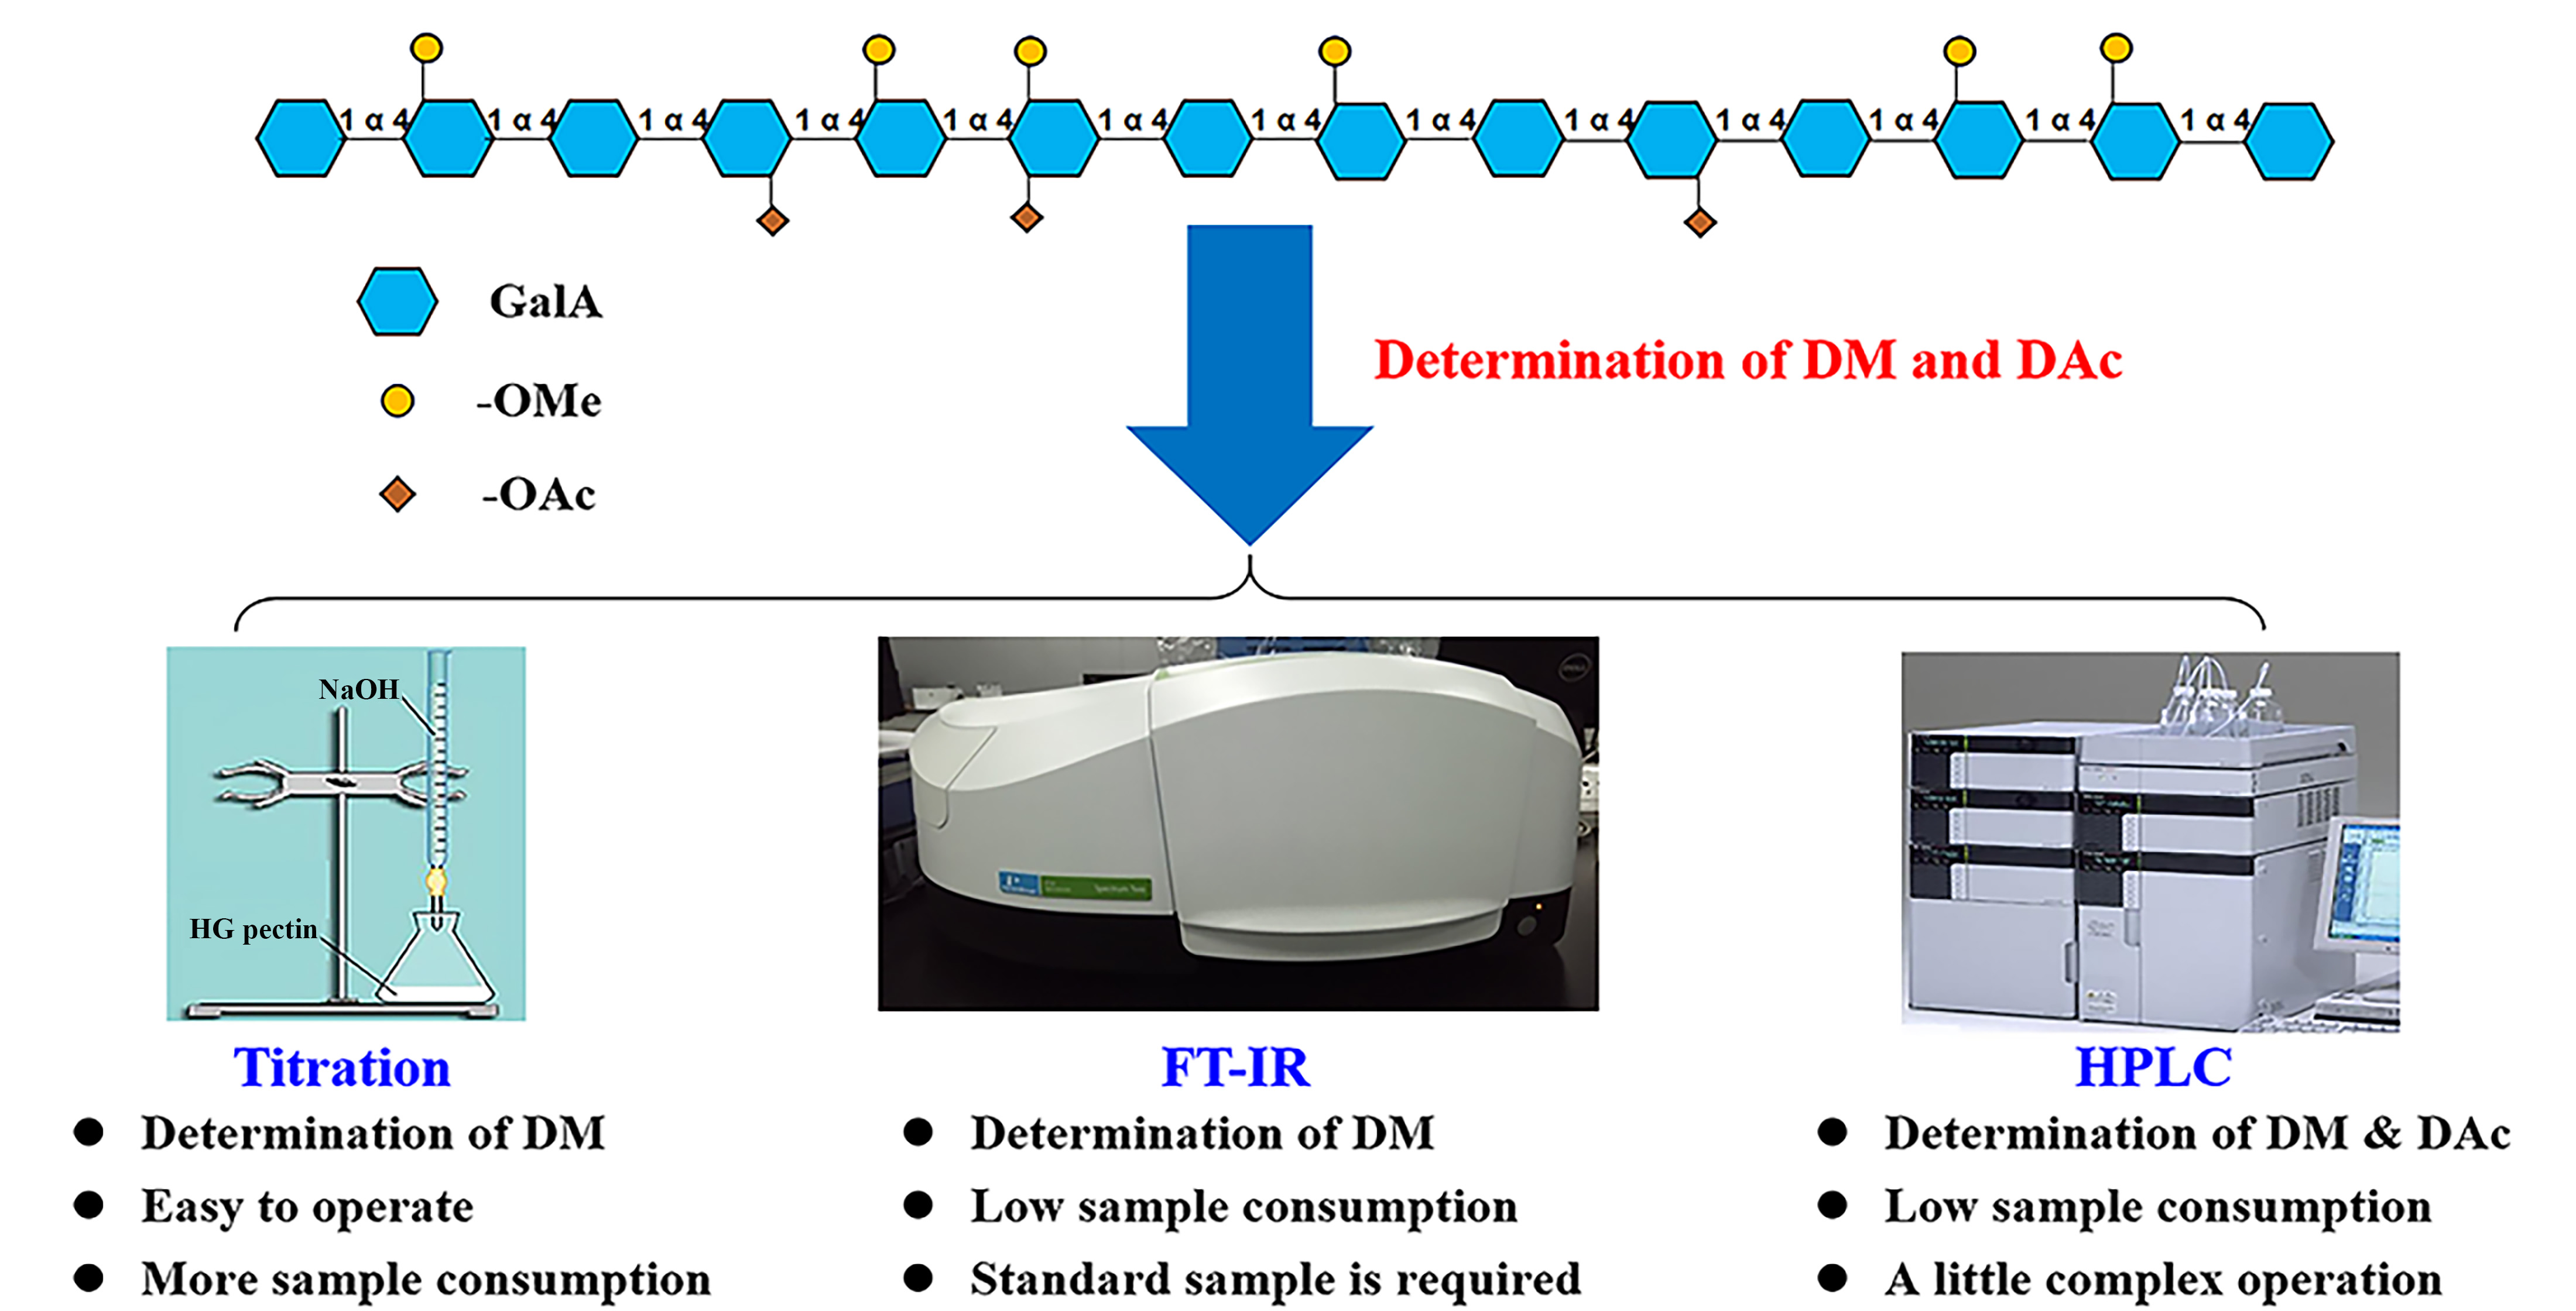
1. Introduction
2. Materials and Methods
2.1. Materials
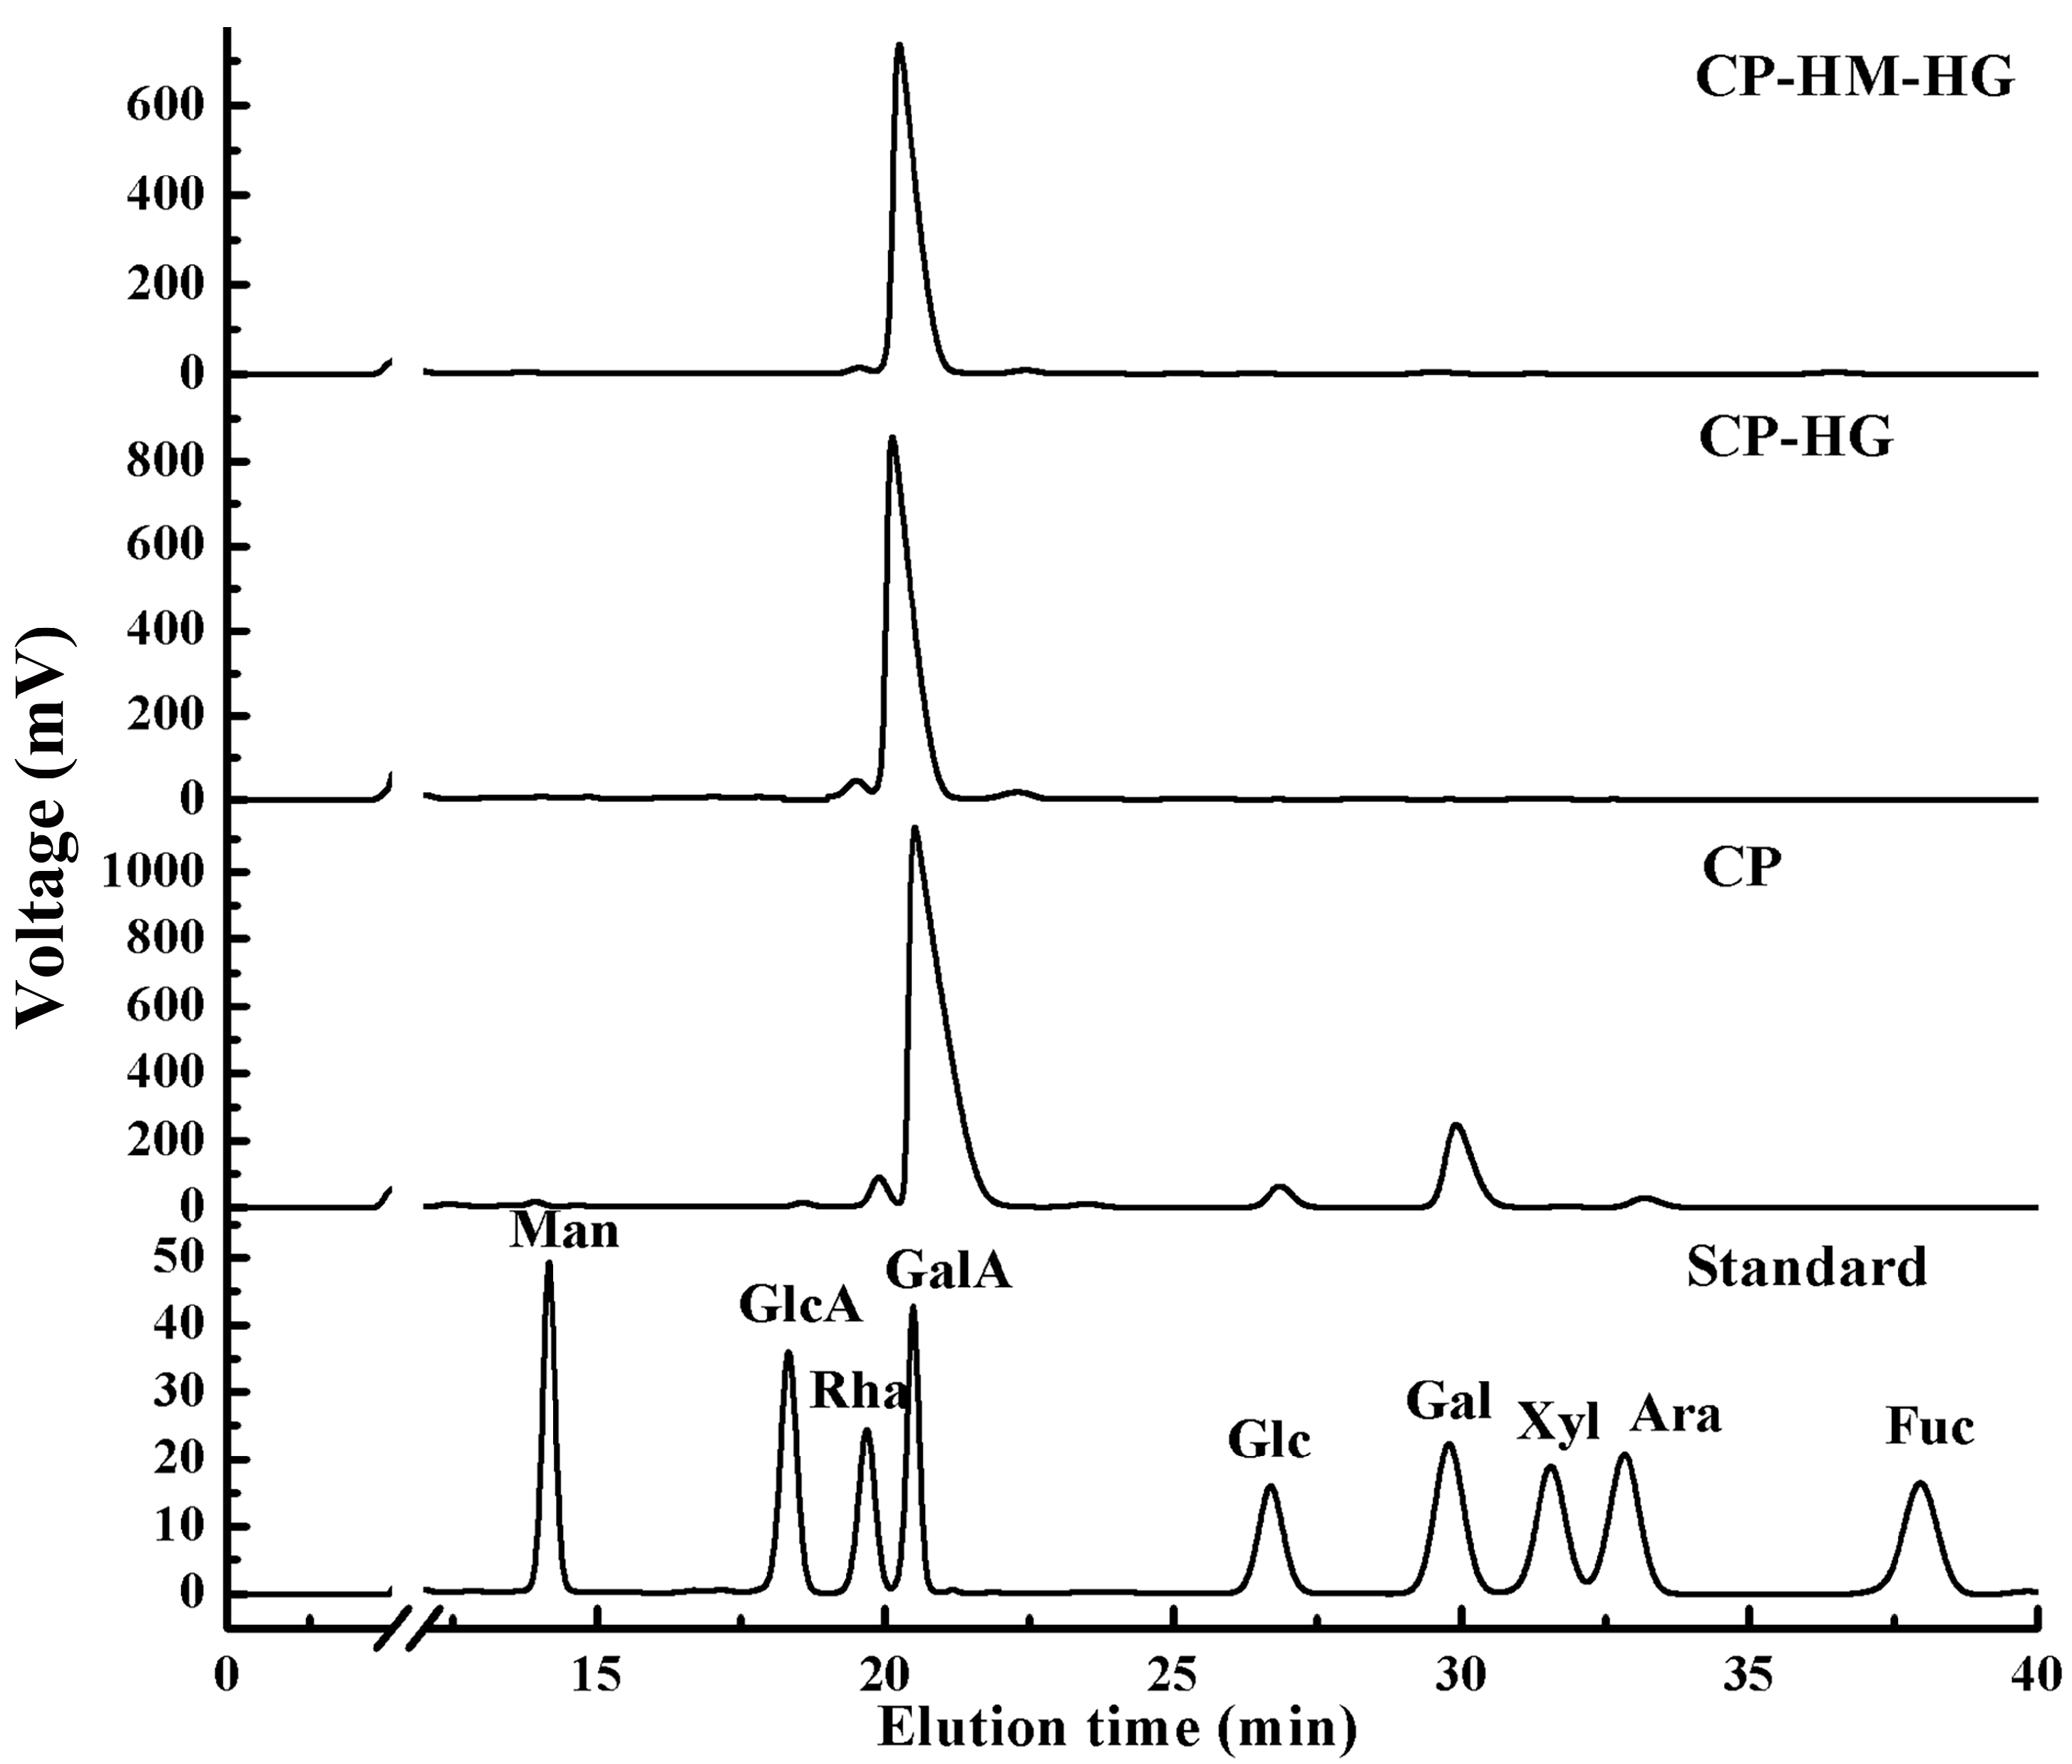
2.2. Monosaccharide Composition Analysis
2.3. Preparation of Pectin Standards with Different DM
2.4. Determination of DM by Titration
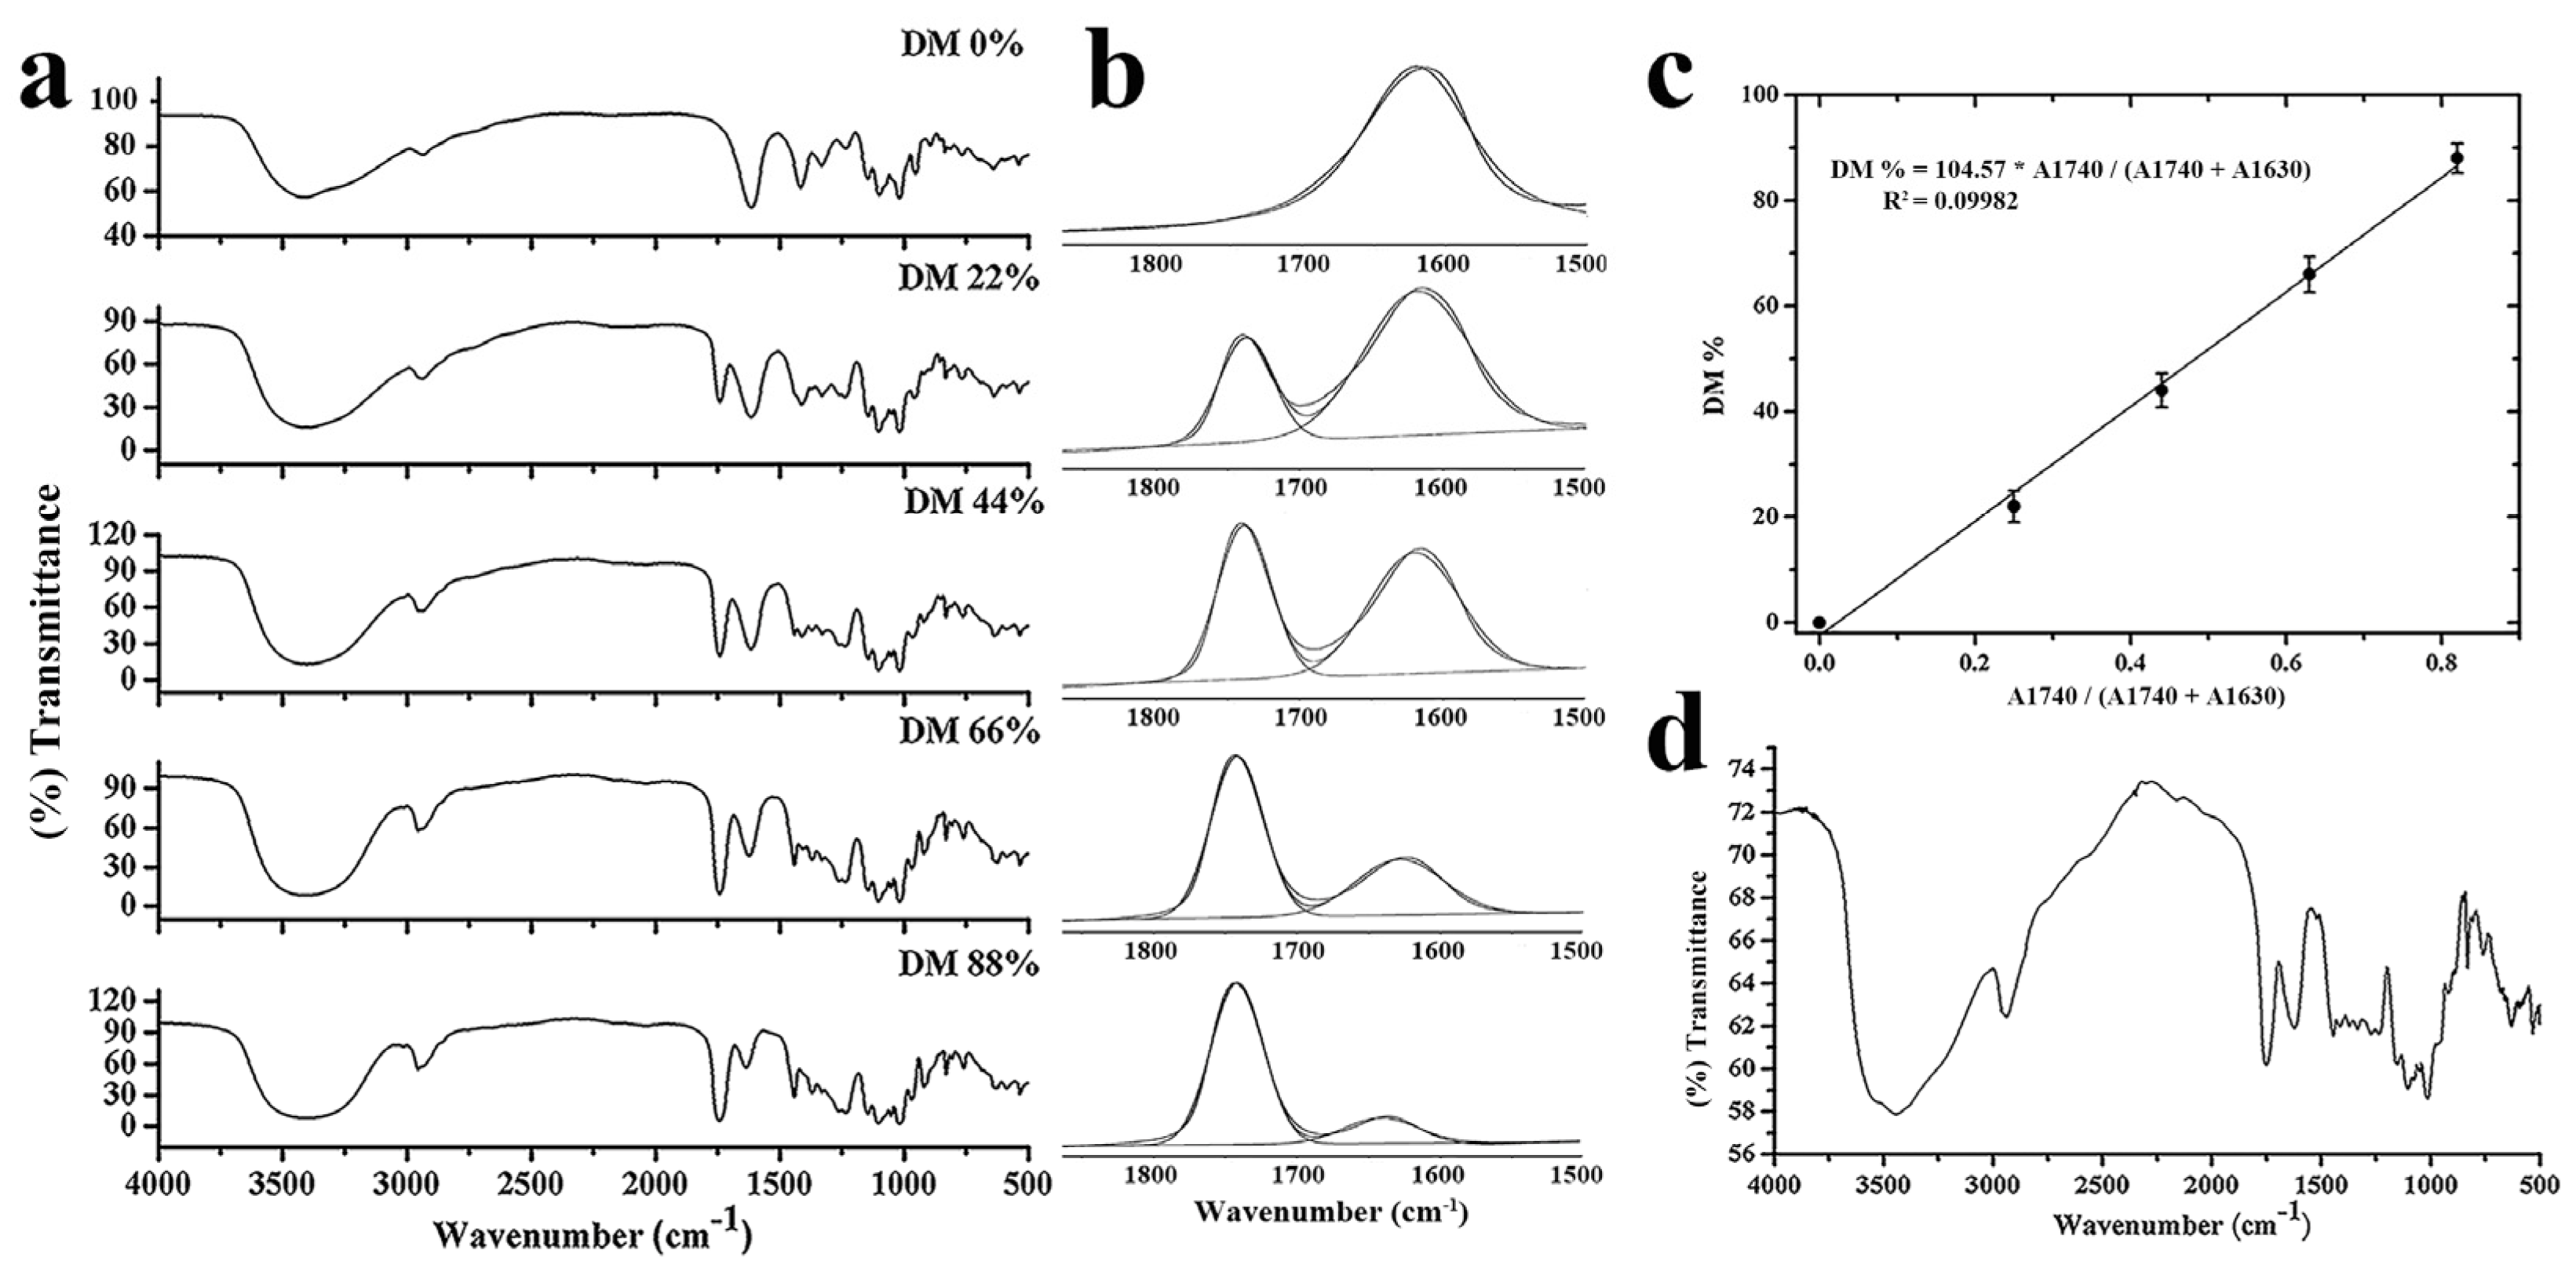
2.5. Determination of DM by FT-IR
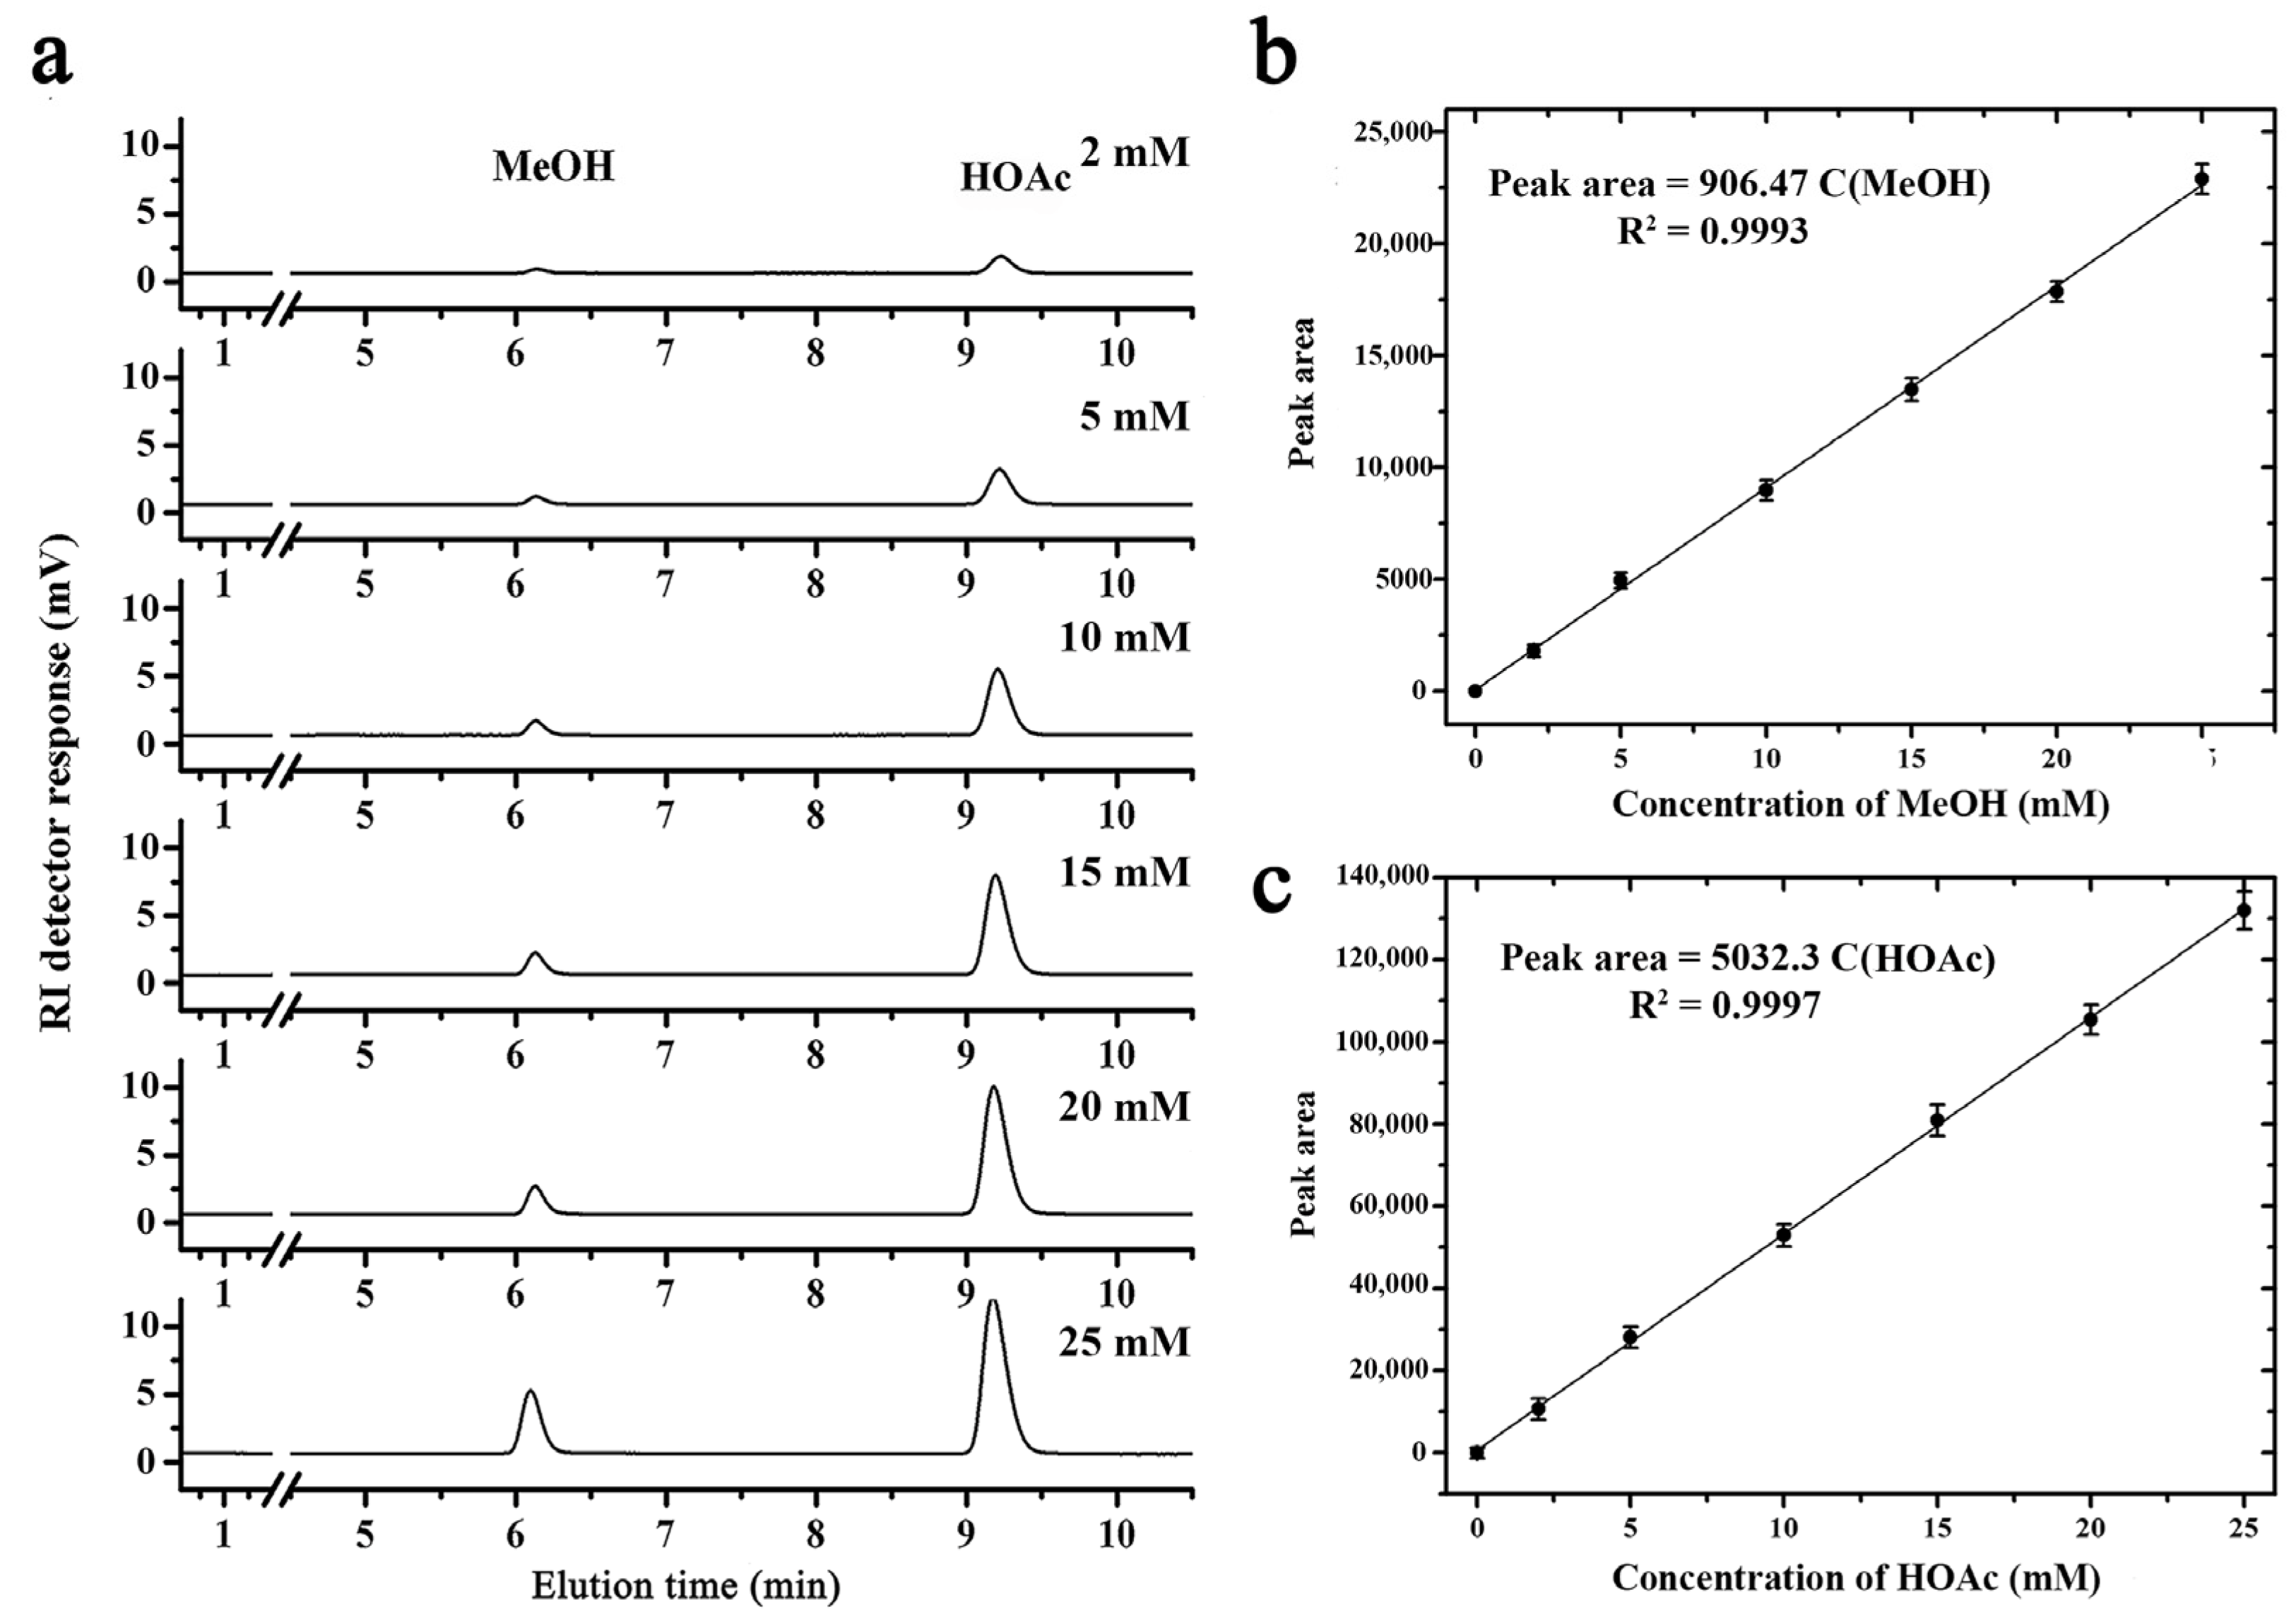
2.6. Determination of DM and DAc by HPLC
2.7. Statistical Analysis
3. Results and Discussion
3.1. Preparation of Standard Pectin Samples
3.2. Determination of DM by Titration
3.3. Determination of DM by FT-IR
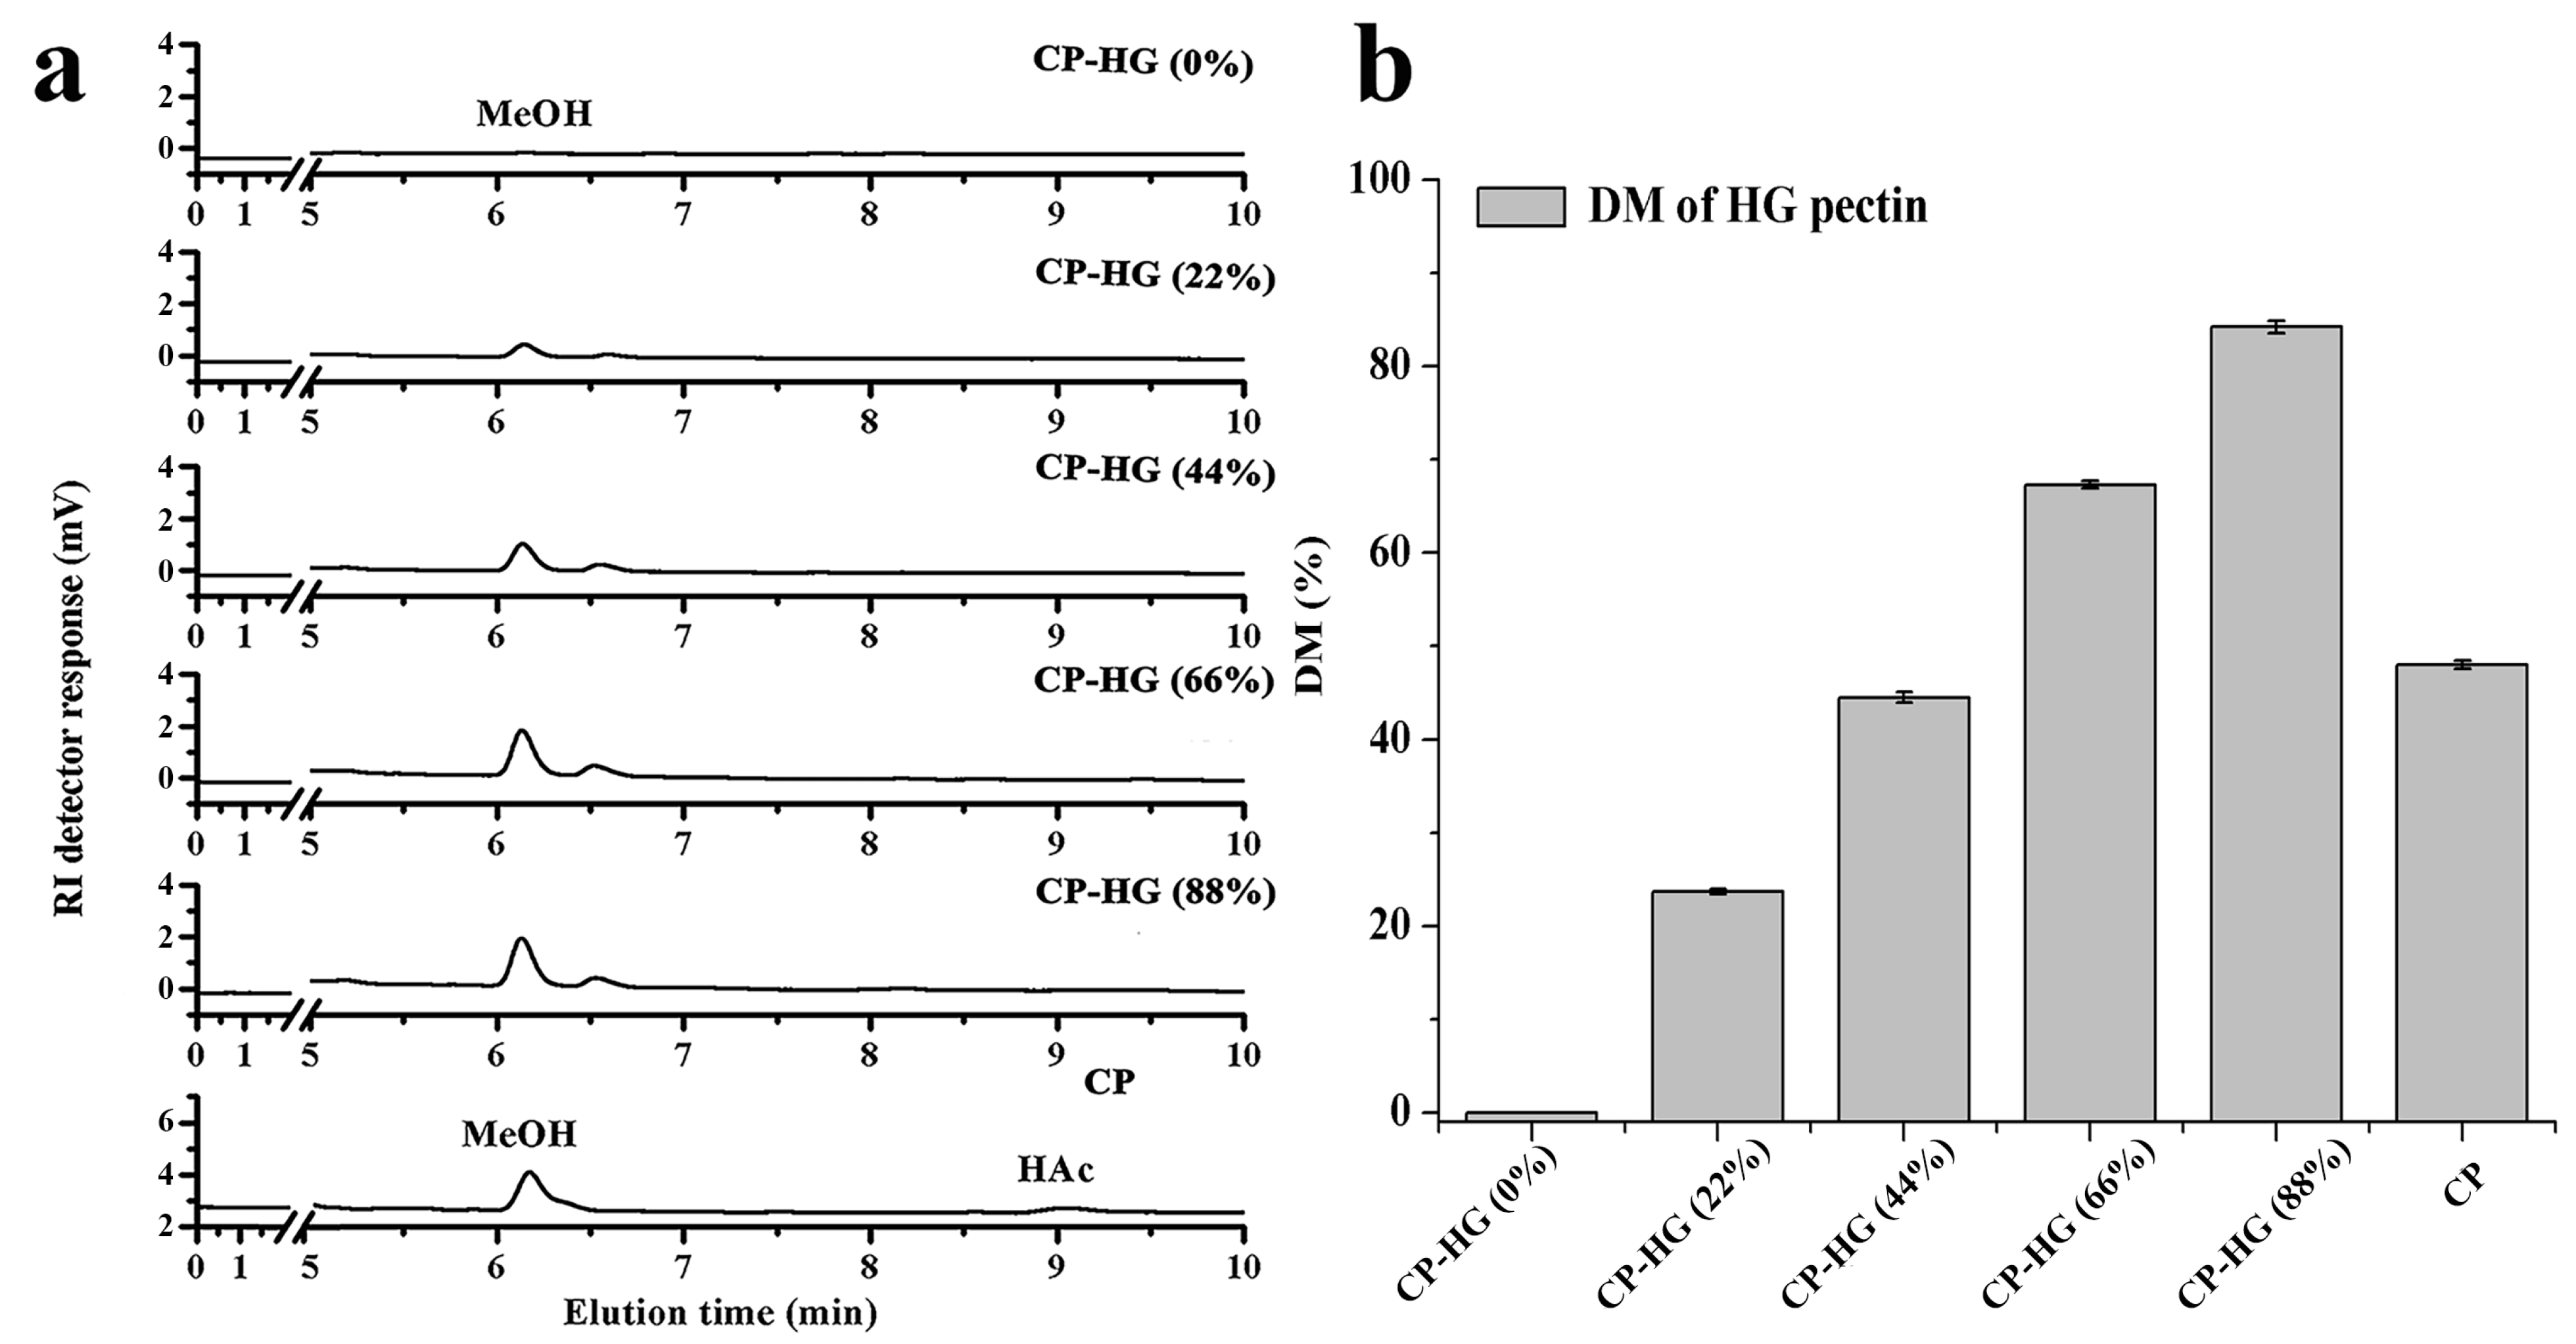
3.4. Determination of DM and DAc by HPLC
4. Conclusions
Author Contributions
Funding
Institutional Review Board Statement
Informed Consent Statement
Data Availability Statement
Conflicts of Interest
References
- Ridley, B.L.; O’Neill, M.A.; Mohnen, D. Pectins: Structure, biosynthesis, and oligogalacturonide-related signaling. Phytochemistry 2001, 57, 929–967. [Google Scholar] [CrossRef]
- May, C.D. Industrial Pectins-Sources, Production and Applications. Carbohydr. Polym. 1990, 12, 79–99. [Google Scholar] [CrossRef]
- Willats, W.G.T.; McCartney, L.; Mackie, W.; Knox, J.P. Pectin: Cell biology and prospects for functional analysis. Plant Mol. Biol. 2001, 47, 9–27. [Google Scholar] [CrossRef]
- Remoroza, C.; Cord-Landwehr, S.; Leijdekkers, A.G.; Moerschbacher, B.M.; Schols, H.A.; Gruppen, H. Combined HILIC-ELSD/ESI-MS(n) enables the separation, identification and quantification of sugar beet pectin derived oligomers. Carbohydr Polym. 2012, 90, 41–48. [Google Scholar] [CrossRef] [PubMed]
- Ralet, M.C.; Williams, M.A.; Tanhatan-Nasseri, A.; Ropartz, D.; Quemener, B.; Bonnin, E. Innovative enzymatic approach to resolve homogalacturonans based on their methylesterification pattern. Biomacromolecules 2012, 13, 1615–1624. [Google Scholar] [CrossRef] [PubMed]
- Kyomugasho, C.; Christiaens, S.; Shpigelman, A.; Van Loey, A.M.; Hendrickx, M.E. FT-IR spectroscopy, a reliable method for routine analysis of the degree of methylesterification of pectin in different fruit- and vegetable-based matrices. Food Chem. 2015, 176, 82–90. [Google Scholar] [CrossRef]
- Manrique, G.D.; Lajolo, F.M. FT-IR spectroscopy as a tool for measuring degree of methyl esterification in pectins isolated from ripening papaya fruit. Postharvest Biol. Technol. 2001, 25, 99–107. [Google Scholar] [CrossRef]
- Ralet, M.C.; Crepeau, M.J.; Buchholt, H.C.; Thibault, J.F. Polyelectrolyte behaviour and calcium binding properties of sugar beet pectins differing in their degrees of methylation and acetylation. Biochem. Eng J. 2003, 16, 191–201. [Google Scholar] [CrossRef]
- Vithanage, C.R.; Grimson, M.J.; Wills, P.R.; Harrison, P.; Smith, B.G. Rheological and Structural Properties of High-Methoxyl Esterified, Low-Methoxyl Esterified and Low-Methoxyl Amidated Pectin Gels. J. Texture Stud. 2010, 41, 899–927. [Google Scholar] [CrossRef]
- Terpstra, A.H.; Lapre, J.A.; de Vries, H.T.; Beynen, A.C. Dietary pectin with high viscosity lowers plasma and liver cholesterol concentration and plasma cholesteryl ester transfer protein activity in hamsters. J. Nutr. 1998, 128, 1944–1949. [Google Scholar] [CrossRef] [PubMed] [Green Version]
- Ralet, M.C.; Bonnin, E.; Thibault, J.F. Chromatographic study of highly methoxylated lime pectins deesterified by different pectin methyl-esterases. J. Chromatogr. B. 2001, 753, 157–166. [Google Scholar] [CrossRef]
- Bochek, A.Z.; Zabivalova, N.M.; Petropavlovskii, G.A. Determination of the esterification degree of polygalacturonic acid. Russ. J. Appl. Chem. 2001, 74, 796–799. [Google Scholar] [CrossRef]
- Mizote, A.; Odagiri, H.; Tôei, K.; Tanaka, K. Determination of residues of carboxylic acids (mainly galacturonic acid) and their degree of esterification in industrial pectins by colloid titration with Cat-Floc. Analyst 1975, 100, 822–826. [Google Scholar] [CrossRef]
- Chatjigakis, A.K.; Pappas, C.; Proxenia, N.; Kalantzi, O.; Rodis, P.; Polissiou, M. FT-IR spectroscopic determination of the degree of esterification of cell wall pectins from stored peaches and correlation to textural changes. Carbohydr. Polym. 1998, 37, 395–408. [Google Scholar] [CrossRef]
- Fellah, A.; Anjukandi, P.; Waterland, M.R.; Williams, M. Determining the degree of methylesterification of pectin by ATR/FT-IR: Methodology optimisation and comparison with theoretical calculations. Carbohydr. Polym. 2009, 78, 847–853. [Google Scholar] [CrossRef]
- Ognyanov, M.; Remoroza, C.; Schols, H.A.; Georgiev, Y.; Kratchanova, M.; Kratchanov, C. Isolation and structure elucidation of pectic polysaccharide from rose hip fruits (Rosa canina L.). Carbohydr. Polym. 2016, 151, 803–811. [Google Scholar] [CrossRef] [PubMed]
- Levigne, S.; Thomas, M.; Ralet, M.C.; Quemener, B.; Thibault, J.F. Determination of the degrees of methylation and acetylation of pectins using a C18 column and internal standards. Food Hydrocoll. 2002, 16, 547–550. [Google Scholar] [CrossRef]
- Guillotin, S.E.; Van Loey, A.; Boulenguer, P.; Schols, H.A.; Voragen, A.G.J. Rapid HPLC method to screen pectins for heterogeneity in methyl-esterification and amidation. Food Hydrocoll. 2007, 21, 85–91. [Google Scholar] [CrossRef]
- Bartolome, L.G.; Hoff, J.E. Gas-chromatographic methods for the assay of pectin methylesterase, free methanol, and methoxy groups in plant tissues. J. Agric. Food Chem. 1972, 20, 262–266. [Google Scholar] [CrossRef]
- Savary, B.J.; Nuñez, A. Gas chromatography–mass spectrometry method for determining the methanol and acetic acid contents of pectin using headspace solid-phase microextraction and stable isotope dilution. J. Chromatogr. A. 2003, 1017, 151–159. [Google Scholar] [CrossRef]
- Grasdalen, H.; Barkoy, O.E.; Larsen, B. Determination of the degree of esterification and the distribution of methylated and free carboxyl groups in pectins by 1H-N.M.R. spectroscopy. Carbohydr. Res. 1988, 184, 183–191. [Google Scholar] [CrossRef]
- Bedouet, L.; Courtois, B.; Courtois, J. Rapid quantification of O-acetyl and O-methyl residues in pectin extracts. Carbohydr. Res. 2003, 338, 379–383. [Google Scholar] [CrossRef]
- Shulga, O.; Lystopad, V.; Shulga, S.; Yurchuk, L. Method of pectin esterification determination degree by titrated acidity. Ukr. Food J. 2020, 9, 383–393. [Google Scholar] [CrossRef]
- Luzio, G.A.; Cameron, R.G. Determination of degree of methylation of food pectins by chromatog raphy. J. Sci. Food Agric. 2013, 93, 2463–2469. [Google Scholar] [CrossRef]
- Judith, M.M.; Augusta, C.; Tullia, T.; Kathy, E.; Stefano, S. Simple and validated quantitative 1H NMR method for the determination of methylation, acetylation, and feruloylation degree of pectin. J. Agric. Food Chem. 2014, 62, 9081–9087. [Google Scholar]
- Yang, X.; Zhao, Y.; Wang, Q.; Wang, H.; Mei, Q. Analysis of the monosaccharide components in Angelica polysaccha rides by high performance liquid chromatography. Anal. Sci. 2005, 21, 1177–1180. [Google Scholar] [CrossRef] [Green Version]
- Andersen, A.K.; Larsen, B.; Grasdalen, H. Sequential structure by 1H NMR as a direct assay for pectinesterase activity. Carbohyd. Res. 1995, 273, 93–98. [Google Scholar] [CrossRef]
- Dominiak, M.; Søndergaard, K.M.; Wichmann, J.; Vidal-Melgosa, S.; Willats, W.G.T.; Meyer, A.S.; Mikkelsen, J.D. Application of enzymes for efficient extraction, modification, and development of functional properties of lime pectin. Food Hydrocoll. 2014, 40, 273–282. [Google Scholar] [CrossRef]
- Peng, X.; Yang, G.; Fan, X.; Bai, Y.; Ren, X.; Zhou, Y. Controlled methyl-esterification of pectin catalyzed by cation exchange resin. Carbohydr. Polym. 2016, 137, 650–656. [Google Scholar] [CrossRef]


| Pectin | V1 (mL) | V2 (mL) | DM (%) |
|---|---|---|---|
| CP | 12.7 ± 0.12 | 11.3 ± 0.20 | 47.0 ± 0.63 |
| CP-HG | 26.3 ± 0.32 | 0.0 ± 0.01 | 0.0 ± 0.01 |
| CP-HM-HG | 3.3 ± 0.15 | 24.3 ± 0.24 | 88.0 ± 0.59 |
| Titration | FT-IR | HPLC | |
|---|---|---|---|
| Determination of DM | Yes | Yes | Yes |
| Determination of DAc | No | No | Yes |
| Sample amount | 500 mg | 2 mg | 5 mg |
| Instrument | Burette | Infrared spectrometer | HPLC |
| Operation | Simple | Simple | Complicated |
| Sample recyclability | No | Yes | No |
| Standard sample required | No | Pectin with known DM | MeOH and HOAc with known concentration |
Publisher’s Note: MDPI stays neutral with regard to jurisdictional claims in published maps and institutional affiliations. |
© 2021 by the authors. Licensee MDPI, Basel, Switzerland. This article is an open access article distributed under the terms and conditions of the Creative Commons Attribution (CC BY) license (https://creativecommons.org/licenses/by/4.0/).
Share and Cite
Yu, Y.; Wang, Y.; Liu, X.; Liu, Y.; Ji, L.; Zhou, Y.; Sun, L. Comparison of Analytical Methods for Determining Methylesterification and Acetylation of Pectin. Appl. Sci. 2021, 11, 4461. https://0-doi-org.brum.beds.ac.uk/10.3390/app11104461
Yu Y, Wang Y, Liu X, Liu Y, Ji L, Zhou Y, Sun L. Comparison of Analytical Methods for Determining Methylesterification and Acetylation of Pectin. Applied Sciences. 2021; 11(10):4461. https://0-doi-org.brum.beds.ac.uk/10.3390/app11104461
Chicago/Turabian StyleYu, Yang, Yuwen Wang, Xianbin Liu, Ying Liu, Li Ji, Yifa Zhou, and Lin Sun. 2021. "Comparison of Analytical Methods for Determining Methylesterification and Acetylation of Pectin" Applied Sciences 11, no. 10: 4461. https://0-doi-org.brum.beds.ac.uk/10.3390/app11104461