
fNIRS Signal Classification Based on Deep Learning in Rock-Paper-Scissors Imagery Task


1
Centre for Optical and Electromagnetic Research, National Engineering Research Center for Optical Instruments, College of Optical Science and Engineering, Zhejiang University, Hangzhou 310058, China
2
Centre for Optical and Electromagnetic Research, South China Academy of Advanced Optoelectronics, South China Normal University, Guangzhou 510006, China
3
Optoelectronics Lab, Ningbo Research Institute, Zhejiang University, Ningbo 315100, China
*
Author to whom correspondence should be addressed.
†
These authors contributed equally to this work.
Appl. Sci. 2021, 11(11), 4922; https://0-doi-org.brum.beds.ac.uk/10.3390/app11114922
Submission received: 24 April 2021
/
Revised: 21 May 2021
/
Accepted: 24 May 2021
/
Published: 27 May 2021
(This article belongs to the Special Issue State-of-the-Art Laser Measurement Technologies)
Abstract
:To explore whether the brain contains pattern differences in the rock–paper–scissors (RPS) imagery task, this paper attempts to classify this task using fNIRS and deep learning. In this study, we designed an RPS task with a total duration of 25 min and 40 s, and recruited 22 volunteers for the experiment. We used the fNIRS acquisition device (FOIRE-3000) to record the cerebral neural activities of these participants in the RPS task. The time series classification (TSC) algorithm was introduced into the time-domain fNIRS signal classification. Experiments show that CNN-based TSC methods can achieve 97% accuracy in RPS classification. CNN-based TSC method is suitable for the classification of fNIRS signals in RPS motor imagery tasks, and may find new application directions for the development of brain–computer interfaces (BCI).
1. Introduction
The brain–computer interface (BCI) is a hardware and software communication system that enables people to interact with the surrounding environment by using control signals generated by the brain without the involvement of peripheral nerves and muscles [1]. BCI has created a new non-muscle channel for communicating human intentions to external devices such as computers, speech synthesizers, auxiliary devices, and neuroprostheses. Such a system can be used as a means of communicating and restoring motor function (through neuroprostheses), helping patients with amyotrophic lateral sclerosis (ALS) and spinal cord injuries to move around, such as by controlling prosthetic limbs [2]. This is particularly attractive for people with severe movement disorders. Such tools will improve their quality of life while reducing the cost of intensive care [3].
BCI is an artificial intelligence system that interacts with brain signals in five steps: signal acquisition, preprocessing or signal enhancement, feature extraction, classification and control interface [4]. The signal acquisition phase uses appropriate brain imaging methods to capture brain signals. Generally speaking, the collected physiological signals are relatively weak and contain noise and artifacts, so noise reduction and artifact correction are required. In the preprocesnsing stage, the signal is further processed by a suitable method. The feature extraction stage extracts the features of the signal. The collected brain signal will be mixed with other signals, and the signal is usually not fixed. In order to reduce the complexity of the feature extraction stage without losing relevant information, the feature vector should have low dimensionality. The classification stage considers the feature vector to classify the signal. Therefore, choosing good discriminative features is essential to achieving effective pattern recognition in order to decipher the user’s intention. Finally, the control interface stage converts the classified signals into control commands for any connected devices (such as wheelchairs or computers).
A variety of modes have been used for brain electrical signal acquisition, including electroencephalography (EEG) [5], magnetoencephalography (MEG) [6], functional magnetic resonance imaging (fMRI) [7] and functional near infrared spectroscopy (fNIRS) [8]. Among them, EEG can provide excellent time resolution, making it an ideal choice for real-time applications, but the technology is still limited by its poor spatial resolution and inherent sensitivity to motion artifacts [9]. Motion artifacts may affect the spectral content of EEG in the frequency range below 20 Hz, and may cause large spikes in the signal that are difficult to correct for [10]. Functional near-infrared spectroscopy (fNIRS) is a promising alternative because it can achieve a good balance between spatial and temporal resolution. It uses near-infrared light to measure oxygenated hemoglobin (HbO), deoxygenated hemoglobin (HbR), and total hemoglobin (HbT) [11]. There are many activation tasks used in the BCI applied research, including motor imagination, mental arithmetic, working memory and other mental activities [12,13].
fNIRS’s main advantages are its relatively low-cost, portability, safety and insensitivity to electrical noise. This technique is based on the strong penetration of red light in biological tissues, and hemoglobin is the predominant light-absorbing substance in the near infrared region (650–950 nm). Since hemoglobin is a kind of oxygen carrier, changes in the concentration of HbO and HbR after neuron activation may be related to the discharge of neurons. fNIRS uses near-infrared (NIR) light emission–detector pairs that operate at two or more wavelengths. The near-infrared light is emitted to the scalp and diffuses through the brain tissue, causing multiple photon scattering. Some of these photons return to the surface of the scalp after absorption and scattering by the tissue and are detected by the detection optical fiber. Since HbO and HbR have different absorption spectra, by applying the Modified Beer–Lambert Law, the change in the optical density can be converted into the change in the concentration of HbO and HbR.
Motor execution and motor imagery involve the motor function control area of the cerebral cortex. The research usually focuses on measuring motor imagery activities to extract commands from the brain to control limbs. The prefrontal cortex (PFC) is closely related to cognition, decision-making and working memory. Introducing the PFC area into BCI research helps to solve the control command extraction of patients with impaired brain motor function. Obrig et al., believed that the change in PFC blood flow was related to the movement commands sent by the advanced cognitive system [14]. In 2013, Tarkka et al., discovered the functional connectivity between the left dorsal prefrontal lobe and the motor area [15]. In the same year, Kanthack et al. explored the gender differences in blood flow changes in the PFC area of finger tapping [16]. Sitaram et al. found that the average 5-fold cross-validation accuracy of the NIRS-based BCI using time-domain features was 87.5% using the linear support vector machine (SVM), and the average 5-fold cross-validation accuracy using the hidden Markov model was 93.4% [17]. On the same dataset, Niide et al. improved these data. The classification accuracy of linear SVM was 93.4%, and the classification accuracy of Gaussian SVM was 93.9% [18]. In a study of 40 patients with amyotrophic lateral sclerosis (ALS) (including 17 fully locked-in), patients were asked to answer “yes” by performing mental calculations and “no” by staying relaxed. A total of 70% of ALS patients who were not fully locked and 40% of ALS patients who were fully locked could successfully decode, and the classification accuracy was about 80% [19]. Peng et al. carried out a study in which 10 healthy subjects were asked to imagine moving objects. The average accuracy of the SVM classifier in four directions, up-down selection and left-right selection were 40.55%, 73.05% and 70.7%, respectively [20]. Classification technology is used to identify the different brain signals produced by the subjects. The most commonly used classification methods are Random Forest (RF) for fNIRS-BCI, and SVM, HMM and Artificial Neural Network (ANN) for the hybird EEG-fNIRS BCI motor imaging classification. In 2018, Chiarelli et al., applied deep learning and achieved an average accuracy of 83.28% [21]. However, their deep learning method has certain limitations, because they only used a very simple neural network as a classifier, and did not fully consider the relevant information in the time dimension. Trakoolwilaiwan et al., used SVM, ANN, and Convolutional Neural Network (CNN) to classify right-hand and left-hand motor execution tasks on eight healthy subjects, and the classification accuracy of SVM, ANN, and CNN were 86.19%, 89.35%, and 92.68%, respectively. The CNN-based scheme provided up to 6.49% and 3.33% higher accuracy over SVM and ANN [22]. Chhabra et al., demonstrated that CNN performs better with respect to classification accuracy in the classification of four motor imagery tasks (right-fist clenching, left-fist clenching, right- and left-foot tapping) compared to SVM and Multi-Layer Perceptron (MLP) neural network [23]. Ma et al. [24] classified the finger tapping task (task duration is 10 s) of left and right hand motion imagery using CNN-based deep learning methods. In this paper, we tried to use a shorter (task duration is 5 s) task, with more classes (rock–paper–scissors is a three-classification problem, while finger tapping of the left and right hand is a two-classification problem), which is more complex (rock–paper–scissors task is more complex than the finger tapping task) task to verify the performance of the deep learning classification methods, and achieved good results.
Rock–paper–scissors (RPS) is a two-player game. The purpose of playing RPS is usually (but not always) to trick the opponent. The actions that each player can use are rock, scissors and paper. During each period, two players simultaneously choose an action. If both choose the same action, the game moves to the next time period. When the actions are different, the game ends. In this case, the winner is determined by the following rules: rock beats scissors, scissors beats paper, and paper beats rock. Due to the widespread existence of RPS games, it has been used in many studies. For example, Schreiber and Killingback studied the impact of a general meta-community structure on the coexistence of strategies in RPS games, showing that dispersion in a spatially heterogeneous environment can change the dynamic results [25]. Kirkup and Riley show that three strands of E. colibacteria compete in an RPS fashion to reach an evolutionary stable distribution [26]. RPS games appear in economic, social, and biological systems [27]. Various evolution properties of population behaviour for the RPS games have been analysed based on evolutionary dynamics. Therefore, it is of great research significance to classify and predict RPS games.
Machine learning has made significant progress, and there are many classification algorithms based on deep neural networks represented by convolutional neural networks (CNN). Machine learning is widely used in the medical field and can be used to distinguish mental disorders [28]. In the field of inverse problem solving, deep learning has played an important role, which makes the traceability problem easily solvable [29,30]. One-dimensional CNN is predominantly in extracting time series features, such as utilizing convolution kernel sliding-window to extract features and then performing a classification based on the obtained features. Therefore, one-dimensional CNN is suitable for application in time series classification (TSC) tasks and will significantly improve the accuracy of the classification on fNIRS signals. In this paper, we performed an RPS motor imagery task and combined a near-infrared brain recording with various deep learning classification programs. We estimated the classification accuracy of various CNN-based TSC methods for rock, scissors, and paper. We also compared the TSC method based on deep learning with traditional statistical learning methods (such as support vector machine), and found that the method based on deep learning has higher classification accuracy.
2. Experiment Method
2.1. Participants
This study was approved by the Institutional Review Committee Board of South China Normal University. This study recruited twenty-two healthy subjects (right-handed, thirteen males and nine females, age 23 to 26, average age 24.6 years), each subject provided written informed consent before doing the experiment. Exclusion criteria included history of neurological trauma or mental illness or any known movement disorders.
2.2. Experimental Procedure
The motor imagery task is to play RPS with the right hand. Before the experiment began, the participants were informed of the experimental process and were asked to sit on a chair with the armrest in a comfortable position. They were given a few minutes to adjust their posture and relax, and then data recording began. After the data recording was started, first, a resting state was performed for about 90 s, and then RPS movements or imagination with the right hand, under the guidance of audio prompts without any physical movements. In order for participants to successfully complete the motor imagination task, the motor execution task is arranged before the motor imagination task.
In the experiment, we adopted a block design, which requires the subjects to complete one task in one phase of the experiment and another task in another phase of the experiment. As shown in Figure 1, the experimental program includes six blocks, alternating between making the motion and imagining the motion. Each block includes 10 trials, and each trial includes a 5-s task and a 15-s rest. The execution and imagination of one of the actions is completed in one stage. There is a 40-s rest between the two blocks. All subjects completed all tasks. We only use motor imagery data to train and test the classifier, because this is more useful for the BCI system.
2.3. fNIRS Measurements
In this study, the commercial continuous-wave (CW) fNIRS image system (FOIRE-3000, Shimadzu Corporation, Kyoto, Japan) was used to measure the cortical activity at three wavelengths of 780 nm, 805 nm and 830 nm. The sampling rate was 7.14 Hz. The three output hemodynamic parameters for each subject are the concentration changes of oxyhemoglobin (HbO), deoxyhemoglobin (HbR) and total hemoglobin (HbT), which were converted from the changes in optical intensity according to the Modified Beer–Lambert Law. The optical probe is composed of 10 light sources and 10 detectors, forming 31 channels. The area for the arrays of optodes is 9 cm × 12 cm, and the distance between the optodes is 3 cm. The detector positions were determined by an EEG cap, referring to the international 10-10 system and 3D digitizer (FASTRAK-Polhemus, Polhemus, VT, USA). The measured brain regions are shown in Figure 2. Cz was located at channel 16.
3. CNN-Based Classification Method
The fNIRS signal has the property of time series because it measures the signal for a period of time. In recent years, a large number of TSC methods based on machine learning have emerged [31], including the Inception network [32] and Residual network (ResNet) [33]. In this paper, we applied these CNN-based TSC methods to the fNIRS signal classification field and achieved excellent results.
3.1. TSC Problem
The goal of the TSC problem is to fit a model based on the input time series dataset to map the input space (time series) to the corresponding output space (one-hot label) with minimal loss.
3.2. Residual Network
ResNet [34] was originally proposed in the image recognition field; the difference between Resnet and conventional methods is that a linear shortcut is added to link the output of the residual block to its input, so that the gradient stream can flow directly through these connections, which can alleviate the problems (vanishing or exploding) in gradient propagation and can also improve the learning efficiency of deeper networks [34]. In 2017, Wang et al. [33] introduced it to the TSC area. Resnet for TSC is a deep neural network with 11 layers, in which the first nine layers are convolutional layers with Batch Normalization and ReLU activation function, and the last two layers include a Global Average Pooling (GAP) layer and a softmax layer that outputs the probability scores of rock, paper and scissors. As Figure 3 shows, all the convolutional layers are divided into three residual blocks (each residual block contains three convolutional layers), and a linear identity connection links the output of this residual block to its own input.
3.3. Inception Network
The Inception module can significantly improve the performance of the deep neural network by expanding the width of the receptive field [35]. The two-dimensional Inception module achieved excellent classification performancein the ImageNet Challenge. In one-dimensional data processing, Inception has also made great achievements. Fawaz et al. [32] introduced it to TSC field, and the proposed Inception network achieved state-of-the-art classification performance in the University of California, Riverside (UCR) Time Series Classification Archive [36].
3.3.1. Network Architecture
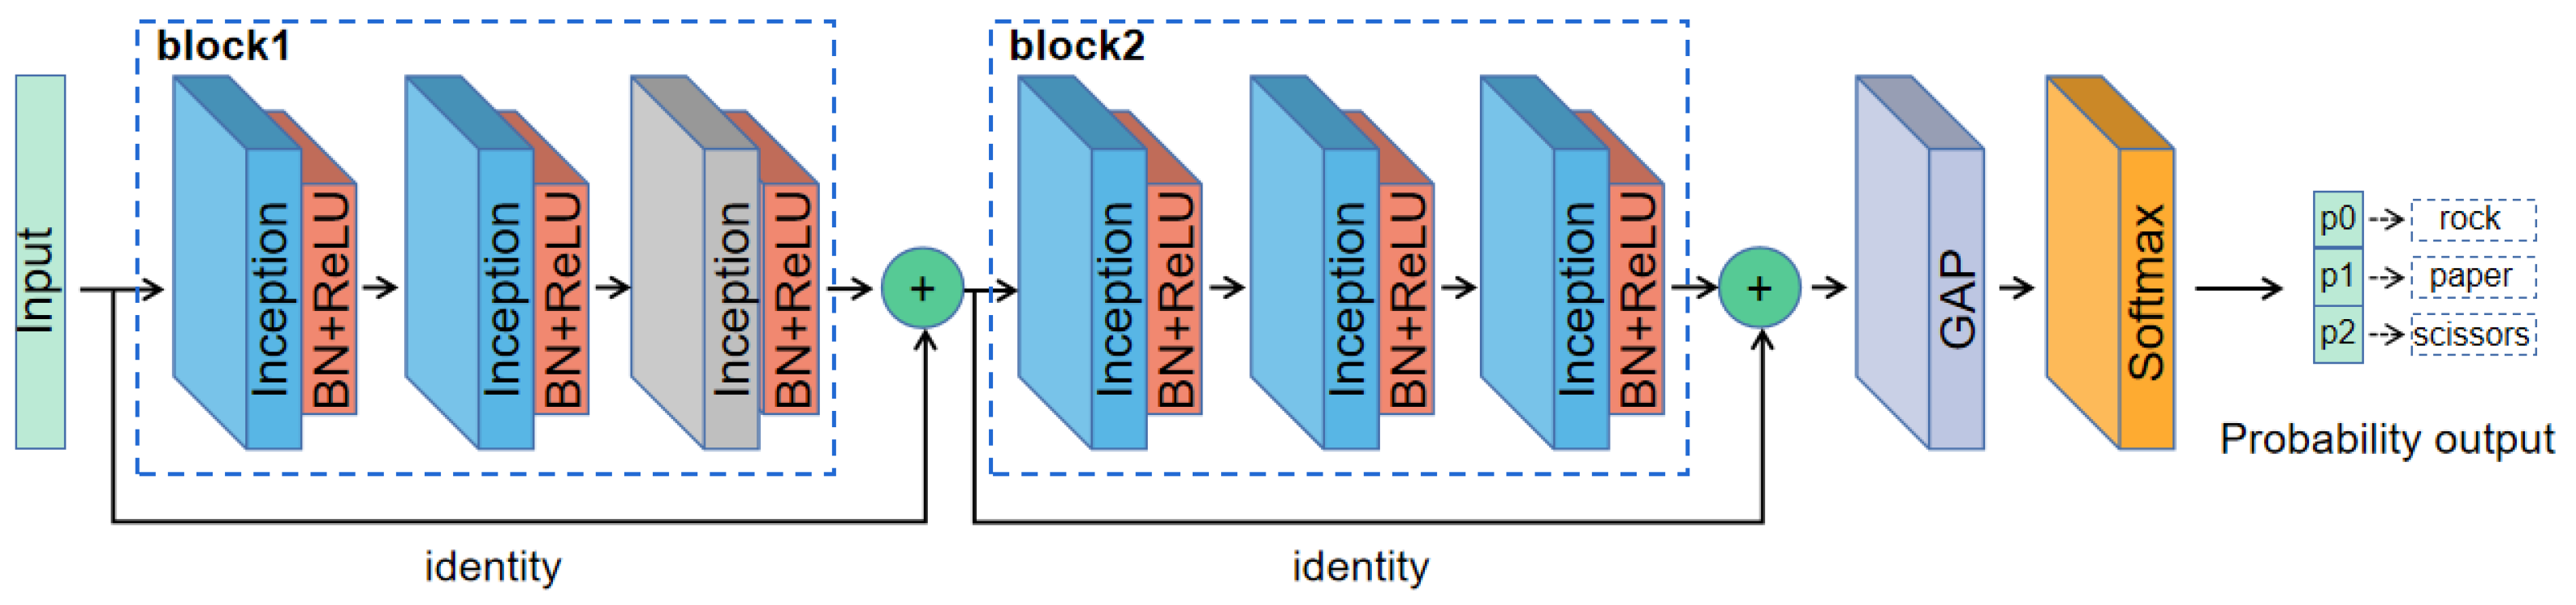
The inception network includes multiple one-dimensional Inception modules. As shown in Figure 4, the network includes two residual blocks (each block contains three one-dimensional Inception modules with Batch Normalization and ReLU activation function) in total, where, in each residual block, a linear identity connection links the output of this block to its own input. After these two blocks is a global average pooling (GAP) layer and a softmax layer; the output of the softmax layer is the probability scores of rock, paper and scissors.
3.3.2. Inception Module
The process of one-dimensional convolution is shown in Figure 5a, a filter with a kernel length of three slides along the input time series data, which computes the convolution values, and outputs a time series which has the same length as the input data. As shown in Figure 5b, the process of max pooling is similar to that of convolution, except that the calculation of the convolution value is changed to the maximum value.
According to the description of Fawaz et al. [32], the structure of the one-dimensional Inception module has two branches (bottleneck branch and maximum pooling branch), which are shown in Figure 6. The module includes multiple filters of different lengths, which enable the network to extract useful pattern features from both long-term and short-time series at the same time [32]. In bottleneck branch, the input time series first passes through a bottleneck layer which is composed of one-dimensional convolution with kernel length of 1. This reduces the dimensionality of the input time series, keeps the network model at a reasonable size and helps alleviate the overfitting problem [32]. Then, the pattern information of different time scales is extracted through one-dimensional convolution. Fawaz et al. set the default kernel length to 10, 20, and 40, while the length of the rock–paper–scissors fNIRS time series is 36 (7.14 Hz with 5 s), which is shorter than the length of the time series used by Fawaz et al., so the kernel lengths of 5, 10 and 20 are more suitable for extracting both long-term and short-term patterns from rock–paper–scissors fNIRS data.
In the maximum pooling branch, an input time series first passes through a maximum pooling layer whose kernel length is 3, and then passes a one-dimensional convolution whose kernel length is 1 to obtain pooled value. Finally, the results of three convolutional layers in the bottleneck branch and one pooled result in the maximum pooling branch are concatenated, and the result after concatenating is the final output of the entire Inception module.
4. Classification Experiment
4.1. Data Preprocessing
4.1.1. Only Using Task Part of the fNIRS Data
Since the resting state in rock–paper–scissors fNIRS data have very little useful pattern information related to the RPS task itself, we only use the task part (5 s) of each trial as the input of the classifier. This can maintain a suitable length of time series input, which could speed up the training process of neural networks. The time series of each trial includes 36 points (7.12 Hz × 5 s) from 31 channels with three different hemodynamic parameters (HbO, HbR and HbT). Thus, we use three matrices to represent the fNIRS data of each trial, and the size of each matrix is 36 × 31.
4.1.2. Baseline Correction
We used the following method to perform a baseline correction on the raw fNIRS task data: the task part data in the raw fNIRS are subtracted from the mean value of its corresponding resting state data.
4.1.3. Data Normalization
We used two data normalization methods and compared their effects in classification. One method is Min–Max Normalization, as shown in Equation (1), which is a linear transformation of the original data, so that the resulting value is mapped to [0, 1], where max is the maximum value of the sample data, and min is the minimum value of the sample data. Another one is Zero-mean normalization (Z-normalization), as shown in Equation (2), where the processed data conform to the standard normal distribution, where is the mean value of all sampling data in time dimension, and is the standard deviation, respectively. We first apply normalization to the whole raw data, and then only take the task part as the normalization dataset.
4.1.4. Denoising with Band-Pass Filter
We used a Finite Impulse Response (FIR) band-pass filter (1000-order, 0.01–0.09 Hz) and a Butterworth filter (4-order, 0.01–0.1 Hz) to filter the raw fNIRS data [37,38]. This could reduce the influence of heartbeat (1–1.5 Hz for adults), breathing (about 0.4 Hz for adults) and Mayer oscillations (about 0.1 Hz). We compared the effects with or without this filter in classification.
4.2. Training and Validation
We recruited 22 subjects; each subject completed 30 motor imagery trials (repeat 10 times for rock, paper and scissors, respectively). Therefore, we obtained a total of 660 trials as our dataset. The algorithm read all trial fNIRS data, took the task part and randomly shuffled them, then selected 80%, a total of 528 trials, as the training set, and the remaining 20%, a total of 132 trials, as the test set. We built the networks based on tensorflow1.14 and trained them using a training set on Nvidia RTX2080Ti GPU, Intel i9 9900 K CPU and tested this on the completely independent test set. The parameters of ResNet we set were a batch size is 64, learning rate of 0.0001, training epochs of 600 and Adam as the optimizer. The parameters of Inception were set as follows: batch size is 64, learning rate is 0.005, training epochs are 600 and optimizer is Adam.
We inputted the HbO, HbR, and HbT matrices into the CNN-based TSC algorithm, respectively, evaluated and compared their performance. We also performed four data-preprocessing operations on the raw fNIRS data, including Min–Max Normalization, Z-normalization, FIR band-pass filter and Butterworth band-pass filter, and similarly evaluated and compared their performance. Traditional machine learning methods (such as SVM) were evaluated as well, and we compared their results with the CNN-based TSC methods.
5. Results and Discussion
For each channel, we averaged the data of all subjects and displayed the waveform. Figure 7 shows the averaged responses of raw data for the different tasks, and Figure 8 shows the responses after four kinds of data preprocessing. In each subfigure, the horizontal axis represents the time range (15 s for resting state, 5 s for task state), and the vertical axis represents the relative concentration change in HbO. Red lines represent the motor imagery task of Paper, green lines represent the task of Rock, and blue lines represent the task of Scissors. Figure 8a–d show the averaged responses after Z-normalization, max–min normalization, FIR filter and Butterworth filter, respectively. In the raw data, the 24th and 28th channels showed the strongest activation signals. They correspond to the somatosensory motor cortex (SMC) area of brain [39]. Preparing a system with only a few channels could potentially reduce the cost of the BCI system. In addition, although exercise-related BCI usually focuses on the primary motor cortex, the channels with the best classification result are located in the SMC, which may indicate that SMC is an active area in sports imaging tasks. In the Z-normalization data, the 27th channel, which originally had a very weak signal, become very strong. For this channel, Z-normalizaiton amplifies the noise and suppresses the useful signal. Thus, Z-normalizaiton may not be a good data-preprocessing method. In the max–min normalization preprocessing method, the data are normalized to a range between 0 and 1, which may lose activation intensity information and may affect the classification. In the FIR and Butterworth band-pass filter methods, the signal has a significant amplitude attenuation, and it becomes very smooth, which may lead to the loss of a large part of the detailed information that originally existed in the raw signal.
In order to check the robustness of the algorithm, we independently trained and evaluated the network 10 times, and calculated the accuracy of the classification each time. Figure 9 shows the accuracy box plot of the classification using HbO, HbR and HbT matrices, where each blue rhombus represents the average of 10 independent experiments, each red point represents an outlier, and the orange bar represents the result of Inception classifier, while the gray bar represents the result of ResNet.
Figure 9a shows the classification of Inception and ResNet classifiers on the raw data, Figure 9b shows the classification on the data after Z-normalization, Figure 9c shows the classification on the data after max–min normalization, the classification of Inception and ResNet classifiers on the data after FIR band-pass filter and Butterworth band-pass filter are shown in Figure 9d–f shows the classification of the data after baseline correction.
In order to find the best band-pass cut-off frequency of FIR filter, we took a different band-pass upper cut-off frequency of the FIR filter and evaluated their classification performance using Inception and HbT; the results are shown in Table 1. We evaluated eight different band-pass frequencies (0.01–0.09 Hz, 0.01–0.1 Hz, 0.01–0.2 Hz, 0.01–0.3 Hz, 0.01–0.5 Hz, 0.01–0.8 Hz, 0.01–0.1 Hz and 0.01–0.3 Hz, in which 0.01–0.09 Hz is default setting), and found that different band-pass cut-off frequencies of the FIR filter did not significantly impact the classification performance. This showed that even if the FIR filter has a wide band-pass range, it may filter out the useful feature patterns (such as activation intensity) due to other parameter problems, and cause the classification performance to decrease.
We compared the classification of raw data and four preprocessing methods, and found that raw data have the best classification, and can reach 97%. The baseline correction is the second, whose highest accuracy is 94%, and the max–min normalization followed by 92%. The classification of FIR band-pass filter, Butterworth band-pass filter and Z-normalization are relatively poor. Although both FIR and Butterworth band-pass filters are effective methods to remove fNIRS noise, in a specific task, it is often necessary to choose different filtering methods and set different filtering parameters to obtain good results [37,38]. The deep learning methods have achieved good classification results in the rock–paper–scissors task, which proves that the neural network extracts useful pattern features from the input signal. These useful pattern features may be extracted from the noise between different tasks. If this is so, then these noises are actually crucial information for classification, and we should not use filters to remove them. However, we are more convinced that these useful pattern features are extracted from the activation signal, because the three tasks typically have different activation patterns, and the noise interference they received was almost the same. In the task of classifying fNIRS signals based on deep learning neural networks, the neural network could fit a filter that removes noise (that is not related to pattern features) better than the traditional (such as FIR or Butterworth) filter. The filter obtained by learning from task-specific data is more suitable for the fNIRS signal itself. We found that applying the baseline correction slightly degraded the classification performance compared to the raw fNIRS data input. That is because the important pattern feature extracted by neural network is that different channels have different activation intensity in the three tasks. Baseline correction would irreversibly break this pattern feature, and degraded the classification performance. As far as the classification method is concerned, the classification accuracy of Inception is higher than that of ResNet. As far as the three hemodynamic parameters (HbO, HbR and HbT) are concerned, the classification accuracy of HbT is higher than that of HbR or HbO. As shown in Figure 9c, the classification accuracy of Inception on HbT is 22% higher than that on HbO. In some previous studies, most of the researchers used HbO as input data [40]. This may be because HbO has a relatively pure signal, but for fNIRS classification problems, HbT may be a better choice. In addition, some traditional classifiers (such as Perceptron, Linear Discriminant Analysis (LDA), K-Nearest Neighbor (KNN), Adaboost, Decesion tree, Random Forest (RF), SVM and MLP) with raw data input (HbO, HbR and HbT) were evaluated. Table 2 shows the average accuracy of 10 independent experiments for each classifier. It can be found that the TSC method Inception with the HbT matrix achieved the best result of all the classifiers and hemodynamic matrices.
CNN-based TSC methods (Inception and ResNet) obtained a higher classification accuracy than non-TSC methods (SVM etc.), which shows that the CNN-based TSC methods have a huge advantage in fNIRS classification. Compared with the TSC method in the finger tapping task of left and right hand-motion imagery [28], the CNN-based method can also achieve good classification results for shorter duration, more classes and more complex tasks. This is because the TSC methods have the ability to make full use of the rich pattern features contained in the time series through convolution, and these useful pattern features are an important basis for accurate classification. For shorter tasks, the information contained in each moment is very valuable, so we use a more appropriate kernel length of one-dimensional convolutional neural network (a shorter time series should use a shorter convolution kernel), so that it can better adapt to the length of the input time series. When the dataset contains more classes, it will be more difficult to classify. The CNN-based TSC methods still achieved good results in three classifications due to their powerful feature-extraction abilities. More complex tasks correspond to more complex fNIRS signals. If the difference between these signals is small, the TSC methods will pay more attention to the main pattern features, so more complex tasks will make classification more difficult; if these signals have a very big difference, this is conducive to the extraction of feature patterns to some extent and helps to improve the classification effect.
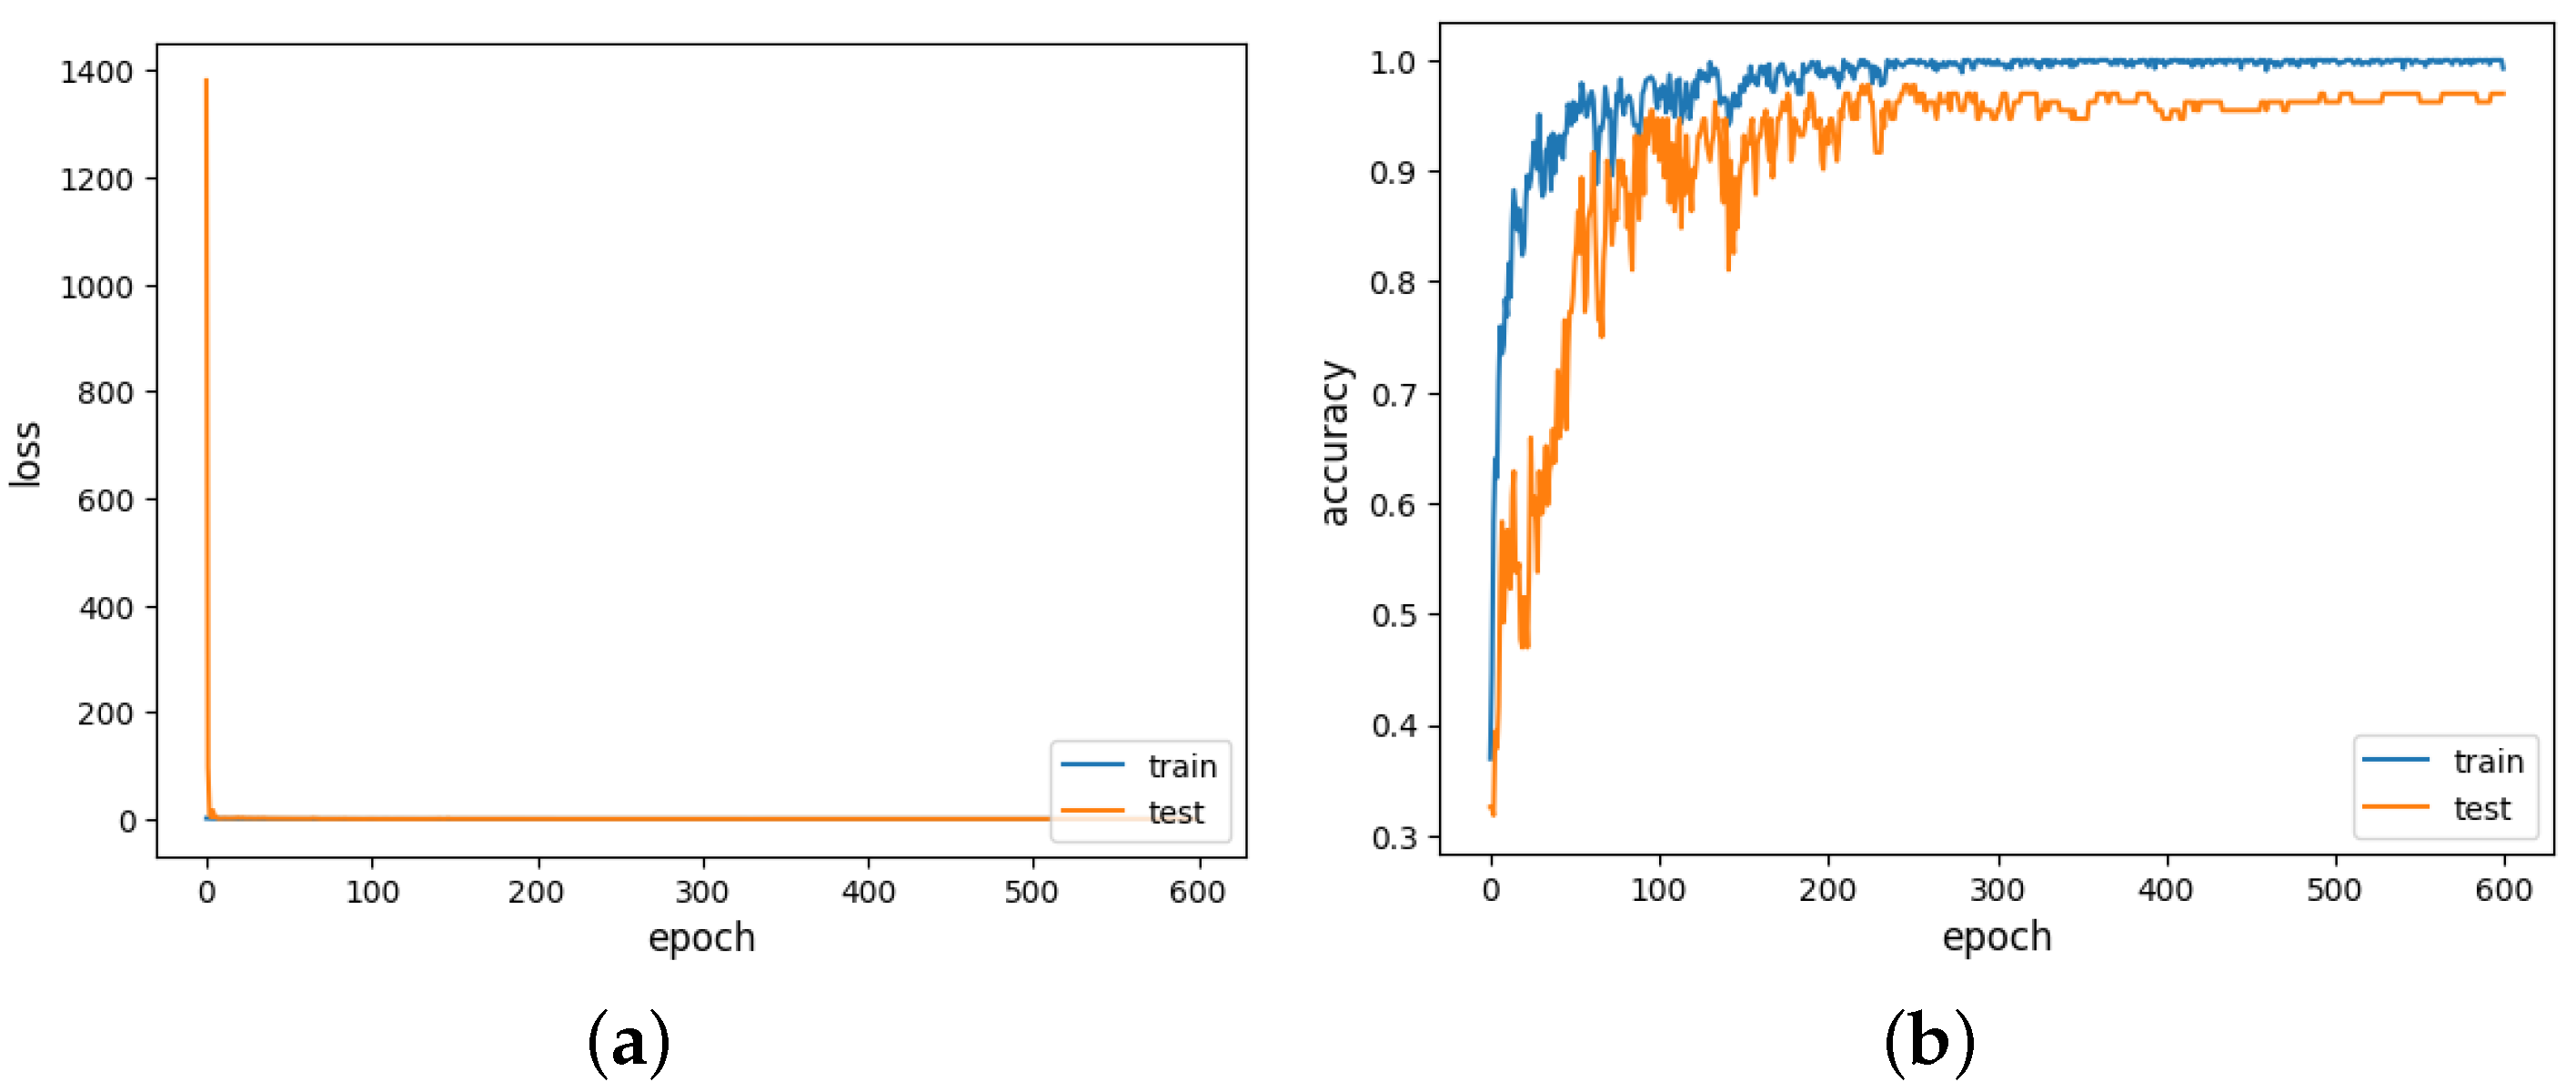
The cross-entropy loss of Inception with HbT matrix input (which achieved the best classification result) training process is shown in Figure 10a, and the test accuracy changes are shown in Figure 10b. After 300 epochs, the classification model converged to a stable point.
Table 3 shows the confusion matrix of Inception result when the HbT matrix is input. The testset contains 132 trials in total, and only three trials were predicted to fail. It can be seen that rock and scissors are more difficult to distinguish, compared with other task classifications. This may be related to the similar motion imagery of making a fist in both rock and scissors.
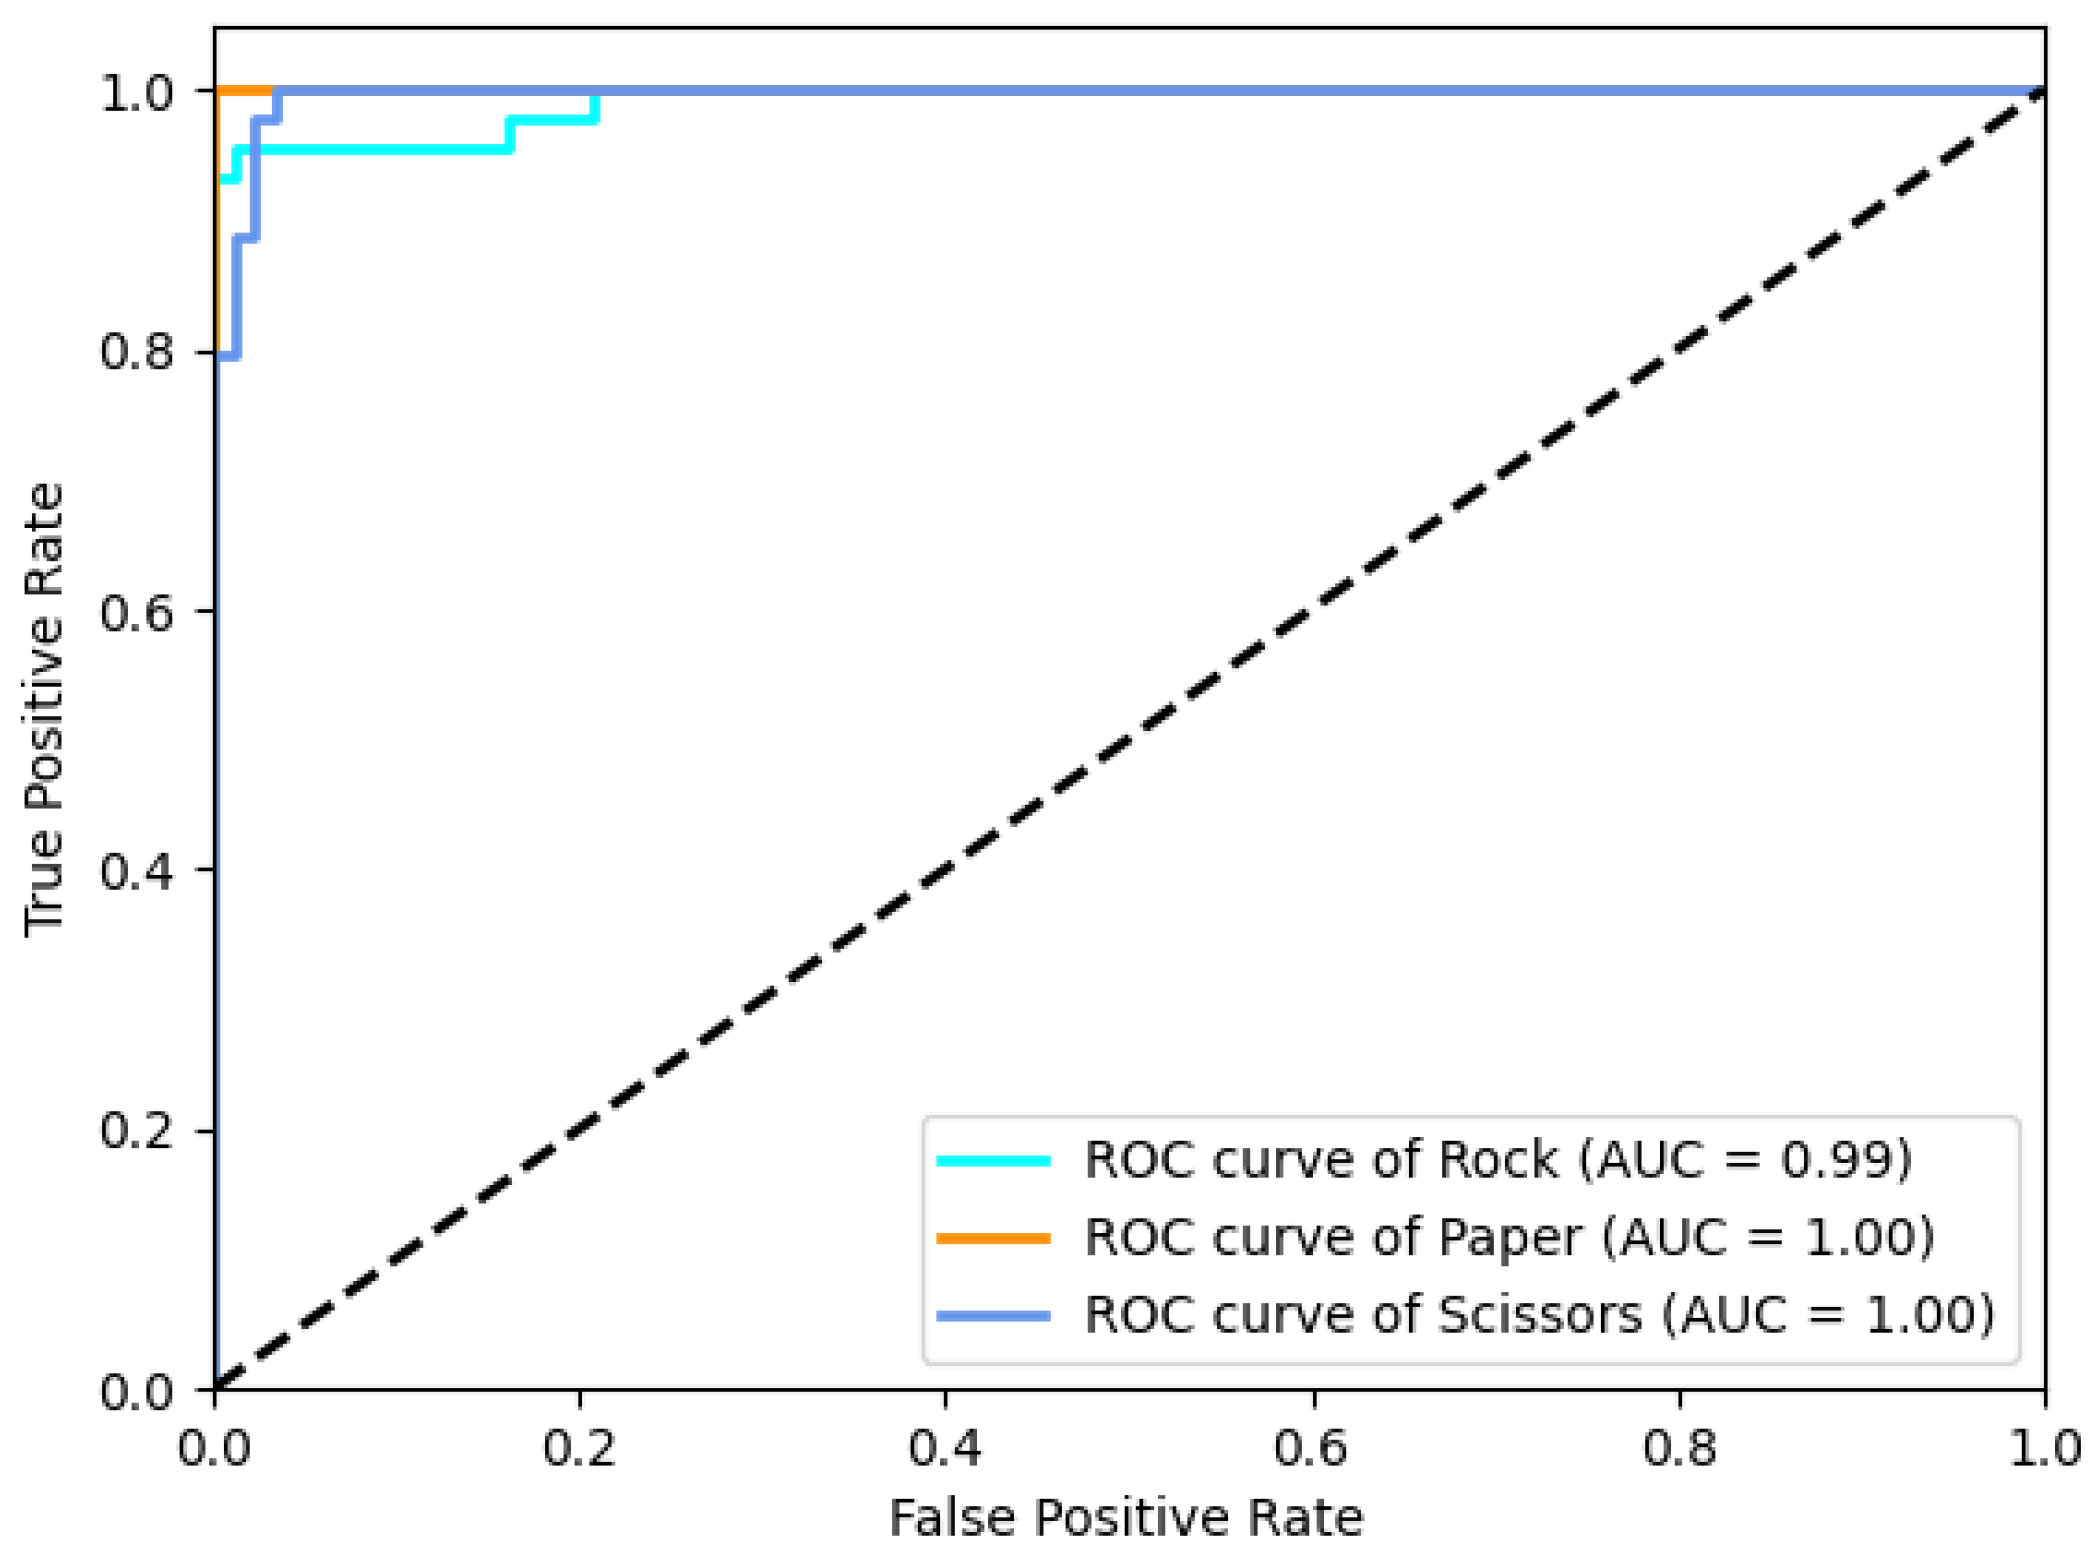
Figure 11 shows the Receiver Operating Characteristic (ROC) curve and its Area Under Curve (AUC) of Inception result when the HbT matrix is input. There are three curves in Figure 11, each of which is an ROC curve and its AUC calculated by taking one class as a positive class and the other two classes as the negative class. It can be seen that the three curves are very close to the upper left corner, and all of their AUCs tend to be 1. This indicates that Inception achieved an excellent classification performance on fNIRS signal with the rock–paper–scissors task.
It took about 2 days to train the ResNet and Inception network with different data preprocessing methods and different input types (HbO, HbR, Hbt), 10 individual times on Intel i9 9900 K CPU, Nvidia RTX2080Ti GPU. Once the model is trained, we can test new samples in very little time. For Inception, it only takes about 0.07 s (on Nvidia RTX2080Ti GPU, Intel i9 9900 K CPU) to obtain prediction results for one HbO matrix input.
6. Conclusions
In the present work, we recruited 22 subjects, designed an RPS task with a total duration of 25 min and 40 s, and then collected the fNIRS data of all subjects under this task. Since fNIRS data have typical time series properties, we applied a TSC method. With the development of deep learning, at present, the CNN-based TSC method achieved a great performance. We applied two top CNN-based TSC methods, Inception and ResNet, to the task. Among them, the Inception method achieved the best classification on fNIRS data with RPS, and its classification accuracy reached 97%. We also evaluated the classification of fNIRS data in the RPS task of traditional classifiers (such as SVM). The experimental results have shown that deep-learning-based methods have more powerful classification abilities than traditional methods. Before classification, we also performed three kinds of data preprocessing. The experiments found that, in the deep learning method, data preprocessing degrades the classification. We compared the performance of HbO, HbR and HbT as inputs, and found that HbT has the best classification, which may be related to the fact that it contains more useful information. In short, since the deep learning method can theoretically approximate any function, it has natural noise suppression capabilities, and data preprocessing can be omitted without reducing the classification performance. The experimental results show that we should input as much information as possible to the algorithm to improve the accuracy of classification.
Author Contributions
Conceptualization and supervision S.H.; methodology, T.M. and W.C.; software, T.M.; validation, Y.X., X.L. and X.Z.; formal analysis, T.M. and W.C.; investigation, T.M., W.C. and X.L.; resources, W.C. and X.L.; data curation, W.C. and X.L.; writing—original draft preparation, T.M. and W.C.; writing—review and editing, T.M., W.C., X.Z. and S.H.; visualization, Y.X.; project administration, T.M.; funding acquisition, S.H. All authors have read and agreed to the published version of the manuscript.
Funding
This work was partially funded by the Key Research and Development Program of Zhejiang Province (2021C03107), the National Key Research and Development Program of China (No. 2018YFC1407506), Ningbo Science and Technology Project (2020Z077), Ningbo Science and Technology Plan Project-Key Core Technology Emergency Tackling Plan Project (2020G012), the National Natural Science Foundation of China (No. 11621101), the Fundamental Research Funds for the Central Universities (Zhejiang University NGICS Platform), and Guangdong Innovative Research Team Program. The authors are grateful to Julian Evans for valuable discussion.
Institutional Review Board Statement
Ethical approval was obtained from the South China Normal University’s Ethical Review Board.
Informed Consent Statement
Informed consent was obtained from all subjects involved in the study.
Data Availability Statement
Data sharing not applicable.
Conflicts of Interest
The authors declare no conflict of interest. The funders had no role in the design of the study; in the collection, analyses, or interpretation of data; in the writing of the manuscript; or in the decision to publish the results.
References
- Nicolas-Alonso, L.F.; Gomez-Gil, J. Brain computer interfaces, a review. Sensors 2012, 12, 1211–1279. [Google Scholar] [CrossRef] [PubMed]
- Mak, J.N.; Wolpaw, J.R. Clinical applications of brain-computer interfaces: Current state and future prospects. IEEE Rev. Biomed. Eng. 2009, 2, 187–199. [Google Scholar] [CrossRef] [PubMed] [Green Version]
- Kober, S.E.; Wood, G.; Kurzmann, J.; Friedrich, E.V.; Stangl, M.; Wippel, T.; Väljamäe, A.; Neuper, C. Near-infrared spectroscopy based neurofeedback training increases specific motor imagery related cortical activation compared to sham feedback. Biol. Psychol. 2014, 95, 21–30. [Google Scholar] [CrossRef]
- Khalid, M.B.; Rao, N.I.; Rizwan-i Haque, I.; Munir, S.; Tahir, F. Towards a brain computer interface using wavelet transform with averaged and time segmented adapted wavelets. In Proceedings of the 2009 2nd International Conference on Computer, Control and Communication, Karachi, Pakistan, 17–18 February 2009; pp. 1–4. [Google Scholar]
- Soekadar, S.R.; Witkowski, M.; Garcia Cossio, E.; Birbaumer, N.; Cohen, L. Learned EEG-based brain self-regulation of motor-related oscillations during application of transcranial electric brain stimulation: Feasibility and limitations. Front. Behav. Neurosci. 2014, 8, 93. [Google Scholar] [CrossRef]
- Hajipour Sardouie, S.; Shamsollahi, M.B. Selection of efficient features for discrimination of hand movements from MEG using a BCI competition IV data set. Front. Neurosci. 2012, 6, 42. [Google Scholar] [CrossRef] [PubMed] [Green Version]
- van der Heiden, L.; Liberati, G.; Sitaram, R.; Kim, S.; Jaśkowski, P.; Raffone, A.; Olivetti Belardinelli, M.; Birbaumer, N.; Veit, R. Insula and inferior frontal triangularis activations distinguish between conditioned brain responses using emotional sounds for basic BCI communication. Front. Behav. Neurosci. 2014, 8, 247. [Google Scholar] [CrossRef] [Green Version]
- Santosa, H.; Jiyoun Hong, M.; Kim, S.P.; Hong, K.S. Noise reduction in functional near-infrared spectroscopy signals by independent component analysis. Rev. Sci. Instrum. 2013, 84, 073106. [Google Scholar] [CrossRef] [PubMed]
- Padfield, N.; Zabalza, J.; Zhao, H.; Masero, V.; Ren, J. EEG-based brain-computer interfaces using motor-imagery: Techniques and challenges. Sensors 2019, 19, 1423. [Google Scholar] [CrossRef] [Green Version]
- Mihajlović, V.; Patki, S.; Grundlehner, B. The impact of head movements on EEG and contact impedance: An adaptive filtering solution for motion artifact reduction. In Proceedings of the 2014 36th Annual International Conference of the IEEE Engineering in Medicine and Biology Society, Chicago, IL, USA, 26–30 August 2014; pp. 5064–5067. [Google Scholar]
- Hong, K.S.; Nguyen, H.D. State-space models of impulse hemodynamic responses over motor, somatosensory, and visual cortices. Biomed. Opt. Express 2014, 5, 1778–1798. [Google Scholar] [CrossRef] [Green Version]
- Naseer, N.; Hong, K.S. fNIRS-based brain-computer interfaces: A review. Front. Hum. Neurosci. 2015, 9, 3. [Google Scholar] [CrossRef] [Green Version]
- Rupawala, M.; Dehghani, H.; Lucas, S.J.; Tino, P.; Cruse, D. Shining a light on awareness: A review of functional near-infrared spectroscopy for prolonged disorders of consciousness. Front. Neurol. 2018, 9, 350. [Google Scholar] [CrossRef] [PubMed]
- Obrig, H.; Hirth, C.; Junge-Hulsing, J.; Doge, C.; Wolf, T.; Dirnagl, U.; Villringer, A. Cerebral oxygenation changes in response to motor stimulation. J. Appl. Physiol. 1996, 81, 1174–1183. [Google Scholar] [CrossRef]
- Tarkka, I.; Stokic, D. Left prefrontal cortex contributes to motor imagery: A pilot study. Res. Neurosci. 2013, 2, 19–23. [Google Scholar]
- Kanthack, T.F.D.; Bigliassi, M.; Altimari, L.R. Equal prefrontal cortex activation between males and females in a motor tasks and different visual imagery perspectives: A functional near-infrared spectroscopy (fNIRS) study. Motriz Rev. Educ. Fís. 2013, 19, 627–632. [Google Scholar] [CrossRef] [Green Version]
- Sitaram, R.; Zhang, H.; Guan, C.; Thulasidas, M.; Hoshi, Y.; Ishikawa, A.; Shimizu, K.; Birbaumer, N. Temporal classification of multichannel near-infrared spectroscopy signals of motor imagery for developing a brain–computer interface. NeuroImage 2007, 34, 1416–1427. [Google Scholar] [CrossRef] [PubMed]
- Niide, W.; Tsubone, T.; Wada, Y. Identification of moving limb using near infrared spectroscopic signals for brain activation. In Proceedings of the 2009 International Joint Conference on Neural Networks, Atlanta, GA, USA, 14–19 June 2009; pp. 2264–2271. [Google Scholar]
- Naito, M.; Michioka, Y.; Ozawa, K.; Ito, Y.; Kiguchi, M.; Kanazawa, T. A communication means for totally locked-in ALS patients based on changes in cerebral blood volume measured with near-infrared light. IEICE Trans. Inf. Syst. 2007, 90, 1028–1037. [Google Scholar] [CrossRef]
- Peng, H.; Chao, J.; Wang, S.; Dang, J.; Jiang, F.; Hu, B.; Majoe, D. Single-trial classification of fNIRS signals in four directions motor imagery tasks measured from prefrontal cortex. IEEE Trans. Nanobiosci. 2018, 17, 181–190. [Google Scholar] [CrossRef]
- Chiarelli, A.M.; Croce, P.; Merla, A.; Zappasodi, F. Deep learning for hybrid EEG-fNIRS brain–computer interface: Application to motor imagery classification. J. Neural Eng. 2018, 15, 036028. [Google Scholar] [CrossRef]
- Trakoolwilaiwan, T.; Behboodi, B.; Lee, J.; Kim, K.; Choi, J.W. Convolutional neural network for high-accuracy functional near-infrared spectroscopy in a brain–computer interface: Three-class classification of rest, right-, and left-hand motor execution. Neurophotonics 2017, 5, 011008. [Google Scholar] [CrossRef]
- A, J.; M, S.; Chhabra, H.; Shajil, N.; Venkatasubramanian, G. Investigation of deep convolutional neural network for classification of motor imagery fNIRS signals for BCI applications. Biomed. Signal Process. Control 2020, 62, 102133. [Google Scholar]
- Ma, T.; Wang, S.; Xia, Y.; Zhu, X.; Evans, J.; Sun, Y.; He, S. CNN-based classification of fNIRS signals in motor imagery BCI system. J. Neural Eng. 2021, 18, 056019. [Google Scholar] [CrossRef]
- Schreiber, S.J.; Killingback, T.P. Spatial heterogeneity promotes coexistence of rock–paper–scissors metacommunities. Theor. Popul. Biol. 2013, 86, 1–11. [Google Scholar] [CrossRef] [Green Version]
- Kirkup, B.C.; Riley, M.A. Antibiotic-mediated antagonism leads to a bacterial game of rock–paper–scissors in vivo. Nature 2004, 428, 412–414. [Google Scholar] [CrossRef]
- Wang, L.; Huang, W.; Li, Y.; Evans, J.; He, S. Multi-AI competing and winning against humans in iterated Rock-Paper-Scissors game. Sci. Rep. 2020, 10, 1–8. [Google Scholar] [CrossRef] [PubMed]
- Ma, T.; Lyu, H.; Liu, J.; Xia, Y.; Qian, C.; Evans, J.; Xu, W.; Hu, J.; Hu, S.; He, S. Distinguishing Bipolar Depression from Major Depressive Disorder Using fNIRS and Deep Neural Network. Prog. Electromagn. Res. 2020, 169, 73–86. [Google Scholar] [CrossRef]
- Chen, X.; Wei, Z.; Li, M.; Rocca, P. A review of deep learning approaches for inverse scattering problems (invited review). Prog. Electromagn. Res. 2020, 167, 67–81. [Google Scholar] [CrossRef]
- Fajardo, J.E.; Galván, J.; Vericat, F.; Carlevaro, C.M.; Irastorza, R.M. Phaseless microwave imaging of dielectric cylinders: An artificial neural networks-based approach. Prog. Electromagn. Res. 2019, 166, 95–105. [Google Scholar] [CrossRef] [Green Version]
- Fawaz, H.I.; Forestier, G.; Weber, J.; Idoumghar, L.; Muller, P.A. Deep learning for time series classification: A review. Data Min. Knowl. Discov. 2019, 33, 917–963. [Google Scholar] [CrossRef] [Green Version]
- Fawaz, H.I.; Lucas, B.; Forestier, G.; Pelletier, C.; Schmidt, D.F.; Weber, J.; Webb, G.I.; Idoumghar, L.; Muller, P.A.; Petitjean, F. Inceptiontime: Finding alexnet for time series classification. Data Min. Knowl. Discov. 2020, 34, 1936–1962. [Google Scholar] [CrossRef]
- Wang, Z.; Yan, W.; Oates, T. Time series classification from scratch with deep neural networks: A strong baseline. In Proceedings of the 2017 International Joint Conference on Neural Networks (IJCNN), Anchorage, AK, USA, 14–19 May 2017; pp. 1578–1585. [Google Scholar]
- He, K.; Zhang, X.; Ren, S.; Sun, J. Deep residual learning for image recognition. In Proceedings of the IEEE Conference on Computer Vision and Pattern Recognition, Las Vegas, NV, USA, 27–30 June 2016; pp. 770–778. [Google Scholar]
- Szegedy, C.; Ioffe, S.; Vanhoucke, V.; Alemi, A. Inception-v4, inception-resnet and the impact of residual connections on learning. arXiv 2016, arXiv:1602.07261. [Google Scholar]
- Dau, H.A.; Keogh, E.; Kamgar, K.; Yeh, C.C.M.; Zhu, Y.; Gharghabi, S.; Ratanamahatana, C.A.; Yanping, B.H.; Begum, N.; Bagnall, A.; et al. The UCR Time Series Classification Archive. 2018. Available online: https://www.cs.ucr.edu/~eamonn/time_series_data_2018/ (accessed on 6 April 2021).
- Pinti, P.; Scholkmann, F.; Hamilton, A.; Burgess, P.; Tachtsidis, I. Current status and issues regarding pre-processing of fNIRS neuroimaging data: An investigation of diverse signal filtering methods within a general linear model framework. Front. Hum. Neurosci. 2019, 12, 505. [Google Scholar] [CrossRef] [PubMed] [Green Version]
- Khan, R.A.; Naseer, N.; Saleem, S.; Qureshi, N.K.; Noori, F.M.; Khan, M.J. Cortical tasks-based optimal filter selection: An fNIRS study. J. Healthc. Eng. 2020, 2020, 9152369. [Google Scholar] [CrossRef]
- Corbetta, M.; Burton, H.; Sinclair, R.J.; Conturo, T.E.; Akbudak, E.; McDonald, J.W. Functional reorganization and stability of somatosensory-motor cortical topography in a tetraplegic subject with late recovery. Proc. Natl. Acad. Sci. USA 2002, 99, 17066–17071. [Google Scholar] [CrossRef] [Green Version]
- Zimmermann, R.; Marchal-Crespo, L.; Edelmann, J.; Lambercy, O.; Fluet, M.C.; Riener, R.; Wolf, M.; Gassert, R. Detection of motor execution using a hybrid fNIRS-biosignal BCI: A feasibility study. J. Neuroeng. Rehabil. 2013, 10, 1–15. [Google Scholar] [CrossRef] [Green Version]
Figure 1.
Experiment design (RPS motor imagery task).

Figure 2.
The optical probes are arranged in channels on the surface of the standard human cortex.

Figure 3.
The structure of ResNet.

Figure 4.
Inception network structure.

Figure 5.
One-dimensional convolution and and max pooling process. (a) One-dimensional convolution process, (b) One-dimensional max pooling process.
Figure 5.
One-dimensional convolution and and max pooling process. (a) One-dimensional convolution process, (b) One-dimensional max pooling process.

Figure 6.
One-dimensional Inception module.

Figure 7.
The averaged responses of raw fNIRS data for the different tasks among all subjects.

Figure 8.
The averaged responses for the different tasks among all subjects after four kinds of data preprocessing. (a) The averaged
responses after Z-normalization, (b) The averaged responses after Max-min normalization, (c) The averaged responses after FIR band-pass filter, (d) The averaged responses after Butterworth band-pass filter.


Figure 9.
The accuracy box plot of the classification using HbO, HbR and HbT matrices. (a) The classification of raw data, (b) The classification of data after Z-normalization, (c) The classification of data after Max-min normalization, (d) The classification of data after FIR band-pass filter, (e) The classification of data after Butterworth band-pass filter, (f) The classification of data after baseline correction.

Figure 10.
The loss and accuracy of Inception in training process. (a) Loss convergence of Inception, (b) Accuracy convergence of Inception.
Figure 10.
The loss and accuracy of Inception in training process. (a) Loss convergence of Inception, (b) Accuracy convergence of Inception.

Figure 11.
Three ROC curve and its AUC in one experiment. Each ROC curve and its AUC is calculated by taking one class as a positive class and the other two classes as a negative class.
Figure 11.
Three ROC curve and its AUC in one experiment. Each ROC curve and its AUC is calculated by taking one class as a positive class and the other two classes as a negative class.


Table 1.
Comparison results of FIR band-pass filter with different upper cut-off frequency.
| Band (Hz) | 0.01–0.09 | 0.01–0.1 | 0.01–0.2 | 0.01–0.3 | 0.01–0.5 | 0.01–0.8 | 0.01–1 | 0.01–3 |
|---|---|---|---|---|---|---|---|---|
| 0.4697 | 0.4697 | 0.4242 | 0.3940 | 0.4091 | 0.4242 | 0.4545 | 0.4545 | |
| 0.4015 | 0.4697 | 0.3940 | 0.4091 | 0.3636 | 0.4545 | 0.4015 | 0.4470 | |
| 0.4394 | 0.4924 | 0.4394 | 0.3636 | 0.4015 | 0.4015 | 0.4167 | 0.4091 | |
| 0.4015 | 0.4773 | 0.4091 | 0.3561 | 0.3788 | 0.3864 | 0.4242 | 0.4091 | |
| The accuracy of | 0.3788 | 0.4167 | 0.4394 | 0.3788 | 0.3561 | 0.3939 | 0.5152 | 0.4318 |
| 10 independent | 0.4470 | 0.4848 | 0.3939 | 0.3939 | 0.4242 | 0.4697 | 0.4091 | 0.4167 |
| experiments | 0.4167 | 0.4848 | 0.4318 | 0.3864 | 0.4091 | 0.4470 | 0.4242 | 0.4470 |
| 0.3864 | 0.4091 | 0.4091 | 0.4242 | 0.3864 | 0.4167 | 0.4394 | 0.4318 | |
| 0.4015 | 0.5076 | 0.3636 | 0.3712 | 0.3788 | 0.4318 | 0.4697 | 0.4242 | |
| 0.4091 | 0.5227 | 0.4773 | 0.4167 | 0.3939 | 0.4318 | 0.4242 | 0.4545 | |
| Average | 0.4152 | 0.4735 | 0.4182 | 0.3894 | 0.3902 | 0.4258 | 0.4379 | 0.4326 |
Table 2.
Comparison results of different classification methods (traditional and deep learning) with three different hemodynamic matrices. The TSC method Inception achieved the best result in HbT matrix.
Table 2.
Comparison results of different classification methods (traditional and deep learning) with three different hemodynamic matrices. The TSC method Inception achieved the best result in HbT matrix.
| HbO | HbR | HbT | Average | |
|---|---|---|---|---|
| Perceptron | 0.38 | 0.33 | 0.44 | 0.38 |
| LDA | 0.43 | 0.45 | 0.49 | 0.46 |
| KNN | 0.81 | 0.77 | 0.87 | 0.82 |
| Adaboost | 0.65 | 0.63 | 0.67 | 0.65 |
| DecisionTree | 0.74 | 0.76 | 0.82 | 0.77 |
| RF | 0.67 | 0.66 | 0.70 | 0.68 |
| SVM | 0.51 | 0.32 | 0.73 | 0.52 |
| MLP | 0.57 | 0.48 | 0.58 | 0.54 |
| Inception | 0.88 | 0.84 | 0.97 | 0.90 |
| ResNet | 0.84 | 0.78 | 0.96 | 0.86 |
| Average | 0.65 | 0.60 | 0.72 |
The highest scores in each column is shown in bold.
Table 3.
The confusion matrix of Inception testset (total 132 trials) result in one experiment.
| True Class | ||||
|---|---|---|---|---|
| Rock | Paper | Scissors | ||
| Rock | 43 | 0 | 1 | |
| Prediction class | Paper | 0 | 43 | 0 |
| Scissiors | 2 | 0 | 43 |
Publisher’s Note: MDPI stays neutral with regard to jurisdictional claims in published maps and institutional affiliations. |
© 2021 by the authors. Licensee MDPI, Basel, Switzerland. This article is an open access article distributed under the terms and conditions of the Creative Commons Attribution (CC BY) license (https://creativecommons.org/licenses/by/4.0/).
Share and Cite
MDPI and ACS Style
Ma, T.; Chen, W.; Li, X.; Xia, Y.; Zhu, X.; He, S. fNIRS Signal Classification Based on Deep Learning in Rock-Paper-Scissors Imagery Task. Appl. Sci. 2021, 11, 4922. https://0-doi-org.brum.beds.ac.uk/10.3390/app11114922
AMA Style
Ma T, Chen W, Li X, Xia Y, Zhu X, He S. fNIRS Signal Classification Based on Deep Learning in Rock-Paper-Scissors Imagery Task. Applied Sciences. 2021; 11(11):4922. https://0-doi-org.brum.beds.ac.uk/10.3390/app11114922
Chicago/Turabian StyleMa, Tengfei, Wentian Chen, Xin Li, Yuting Xia, Xinhua Zhu, and Sailing He. 2021. "fNIRS Signal Classification Based on Deep Learning in Rock-Paper-Scissors Imagery Task" Applied Sciences 11, no. 11: 4922. https://0-doi-org.brum.beds.ac.uk/10.3390/app11114922
Note that from the first issue of 2016, this journal uses article numbers instead of page numbers. See further details here.