
Systematic Analysis of Micro-Fiber Thermal Insulations from a Thermal Properties Point of View


1
Department of Building Services and Building Engineering, Faculty of Engineering, University of Debrecen, Ótemető Str 2-4, H-4028 Debrecen, Hungary
2
Department of Experimental Physics, Institute of Physics Bem tér 18/a, Faculty of Science and Technology, University of Debrecen, H-4026 Debrecen, Hungary
3
Institute for Nuclear Research, Bem tér 18/c, H-4026 Debrecen, Hungary
*
Author to whom correspondence should be addressed.
Appl. Sci. 2021, 11(11), 4943; https://0-doi-org.brum.beds.ac.uk/10.3390/app11114943
Submission received: 3 May 2021
/
Revised: 23 May 2021
/
Accepted: 24 May 2021
/
Published: 27 May 2021
(This article belongs to the Special Issue Energy Efficient Envelope Technologies for Green, Healthy and Comfortable Buildings)
Abstract
:Featured Application
This paper contains laboratory measurements of four different micro-fiber thermal insulation materials to reveal their applicability limits under various environmental conditions. On the samples, scanning electron microscope investigations were executed to disclose the structure of the fibers. The study also investigated the most important thermal parameters of the samples, namely, the thermal conductivity and the calorific value with the specific heat capacity. Humidity measurements and hydrophobic tests were also conducted and the sorption isotherm of the samples was registered. To reveal the thermal stability as well as the applicability limits, differential scanning calorimetry and Raman spectroscopy measurements have also been performed. As a result of these comprehensive measurements, one can predict the behavior of the samples in various external circumstances. The results can generate further studies and are very useful for both designers, planners, and researchers.
Abstract
In the European Union, almost 40% of all energy consumption comes from buildings, while another 20–25% comes from transport. In the European Union, including Hungary, only buildings with almost-zero energy demand could be built after 2020, and the use of renewable energies must be strengthened. The Renewable Directive stipulated that by 2020, the share of renewable energy in buildings must be 25%, and in transport it must be 10%; the use of electric vehicles is vital. There are about four million dwellings in Hungary, of which approximately three million need to be renovated, and only some of these (a few hundred) meet the cost-optimized level of the 2020 directive. The use of insulation materials is very important in the transport sector, too. Insulation materials are also used by aircraft and electric vehicles. To reduce the energy loss from buildings, different insulation materials can be used; investigations of insulation materials are very important. This paper presents a comprehensive research report on insulation materials which could be used for building elements, HVAC (heating, ventilation, and air conditioning appliances) equipment, and vehicles. In this paper, laboratory investigations will be presented along with calculations to better understand the properties and behavior of these materials. For this, firstly structural analysis with scanning electron microscope will be presented. Moreover, the paper will present thermal conductivity and combustion heat measurement results. The sorption and hydrophobic behavior of the materials will be also revealed. Finally, the article will also display differential scanning calorimetry measurements and Raman spectroscopy results of the samples. The research was conducted on four different types of colorized microfiber lightweight wool insulation.
1. Introduction
In the European Union, almost 40% of all energy consumption comes from buildings, while another nearly 20–25% comes from transport. In the European Union, including Hungary, only buildings with almost-zero energy demand could be built after 2020, and the use of renewable energies must be strengthened. The directive stipulated that, by 2020, the share of renewable energy in buildings must be 25% and in transport it must be 10%. For reducing energy loss and greenhouse gas emissions, thermal insulations are used [1,2,3]. On the market, there are a few types of insulation materials, such as plastic foams, wool materials, and the use of super insulation materials is also widespread [4,5]. When choosing the right thermal insulation, several factors need to be considered to maximize energy savings. The choice of material depends on the budget of the investor and the heat transfer parameters of the materials. Designers should know and choose the appropriate insulation material and its thickness [6,7,8,9]. Furthermore, if one knows the proper heat transfer parameters, the useful thickness of the material can be determined [10,11,12,13]. Therefore, in winter, this is preventing the outflow of indoor heat, i.e., reducing the heat loss of heated rooms; in summer, one has to maintain good and healthy thermal comfort inside by displacing the heat. There are several benefits of thermal insulation: thermal insulation considerably reduces heating energy; and external insulation of the walls expressively reduces heat changes through the envelope. It also reduces energy consumption and therefore reduces carbon dioxide and carbon monoxide emissions from buildings, providing a healthier environment and cleaner air. Thermal insulation of vehicles such as aircraft is very important, too. Moreover, choosing the proper thermal insulation for both vehicles and buildings or HVAC appliances is also important from an acoustic point of view [14]. Reduction in unwanted noise by insulation is also essential. Furthermore, fire retardancy is also a very important aspect. In these last two requirements, fiber-wool insulations perform better than plastic foam [15,16,17,18,19]. Some other parameters such as hygric properties or hydrophobicity also have a significant influence on the selection [20,21].
The main aim of this paper is to present a comprehensive laboratory test to properly understand the thermal behavior of fibrous insulation materials. Most of the thermal and structural parameters of these materials are not clear, which is why it is important to perform these laboratory measurements, to develop a better understanding of the properties and behavior of these materials under different environmental circumstances. For this, structural analysis with a scanning electron microscope will first be presented, complete with composition analysis of the samples via the energy dispersive spectrometry method. From the images, the average diameter and the morphology of the fibers, as well as their components, will be defined. Moreover, the paper will present thermal conductivity and combustion heat measurement results as the most important thermal parameters for insulating materials. The sorption and hydrophobic behavior of the materials will also be in focus. Finally, the article will highlight differential scanning calorimetry measurements and Raman spectroscopy results to assess the thermal stability, as well as to explore further contents inside the materials which could not be detected by the scanning electron microscope. The research was conducted on four different types of colorized microfiber lightweight wool insulation used for building (HVAC) and other applications.
2. Materials and Methods
2.1. The Tested Material
The tested blankets were made of lightweight, flexible, fiber-glass material, which have superior thermal and acoustical performance in a minimal space, making them a dependable solution in many applications including HVAC equipment, office interiors, refrigerators and freezers, transportation, water heater retrofit kits, pipes, and a variety of specific applications such as in a convective microwave oven. They are also particularly well-suited for insulating the fuselage wall cavities of commercial and business aircraft. An additive is used to provide water repellence and increase hydrophobicity. In circumstances where moisture is not a concern, a plain phenolic binder can be specified. This is a lightweight, highly resilient, thermal insulation blanket made of fine, flame-attenuated glass fibers bonded with a thermosetting phenolic resin. Glass wool is an insulating material of glass fibers with a wool-like structure. Glass wool is a good quality raw material pre-shredded to a suitable fineness, e.g., glassy inorganic silicate fiber material obtained by melting and fiberizing a homogeneous mixture of sand, feldspar, soda ash, sodium sulfate, barium sulfate, fluorspar, and borax (or another boron-containing mineral). Within glass wool insulation, two types of product groups are known: one is rolled glass wool insulation, and the other is panel glass wool insulation. Glass wool has an extremely flexible and fine fiber structure and low body density (varying from 10 to 100 kg/m3 depending on the type). It has a fire rating of A1. Glass wool has good vapor permeability, i.e., it only slightly impedes the movement of steam [22,23,24]. In the case of multilayer thermal insulation, it is recommended for use just below the outermost layer. The thermal conductivity is estimated to be between 0.032–0.045 W/mK depending on the density. The research was conducted on four different types of colorized (pink, yellow, orange, and green) micro fiberglass wool insulation materials. All four samples were received from the same manufacturer, where the differences among the yellow, green, and pink arose only from their density, and their components were declared to be the same. The coloring was only for their easier distinction. Moreover, in this study, our main aim was to reveal the differences in their thermal behavior, which should be connected with different densities, except for the orange one. They contained predominantly glass or ceramic-based elements. Orange is specifically designed for use in spaces where a formaldehyde-free product is desirable; moreover, it also contains acryl. Table 1 shows the as-received densities and thicknesses of the samples examined in this work.
2.2. Application Possibilities and Experiences of Micro-Fiber Based Insulations
The use of micro-glass fiber materials as thermal insulation is well known, but it should be highlighted for better understanding. These materials can be used in buildings and for both industrial and vehicle engineering. They can be also used where the materials should be able to withstand high temperatures (~250–300 °C); for example, for insulating heating pipes transporting hot water or steam or for insulating furnaces [14]. Pipes are not only insulated to reduce heat loss. Several insulation methods are used which serve other purposes, such as safety, fire protection, sound attenuation, and condensation prevention. Thermal insulation coatings of pipelines have several elements that affect not only the efficiency of the system, but also the safety of their operation and utilization of the equipment [25]. Furthermore, they can be used as attic floors or dividing wall insulation between gypsum boards. It is reported that they can be used as shear wall insulation [26]. For choosing suitable places for these insulations, their thermo-physical properties as a function of temperature, density, mechanical load, thickness, and composition of insulating layers should be investigated. Moreover, analysis of the structure of the fibers is also vital [27]. These layers can be also used as the core of vacuum insulation panels (VIPs), due to their very lightweight and loose-filled structure [28,29]. As previously presented by the authors, glass fiber materials are also suitable for sound insulation. It should be mentioned that the thermal stability of glass wool materials is higher than plastic foam, and their compressibility is greater compared to polystyrene types [30]. Kunic presented an extensive report about a comparison of the carbon footprint of different types of insulation materials. He revealed that low-density glass wool materials have about 1.494 kg CO2 eq./kg carbon footprint, which is less than the values of both plastic foam and advanced materials such as VIP and aerogel. The author also stated that this material in use has the highest impact on the environment [31]. Schiavoni et al. [30] investigated the embodied energy and global warming potential of different insulation materials. The authors analyzed the insulation materials using CTGA standards for the cradle-to-gate method. They found that glass fibers have 134.17 MJeq per f.u. energy consumption, and reached about 8 kg CO2eq per f.u. of global warming potential. It should be mentioned that these values are higher compared to the values of other fibrous insulations such as cellulose or hemp [31,32]. Here, it should be mentioned that the environmental impact can be reduced and the circular economy approach can be adopted by using recycled glass during manufacturing [33].
2.3. Thermal Conductivity Measurements and Specific Heat Capacity Measurements
The thermal conductivity of the samples was measured by Netzsch 446 small heat flow meter equipment after curing the probes in Venticell-type drying apparatus to a constant weight. The thermal conductivity measurements were performed by using the ISO 10456 [34] and ISO 8301 [35] standards. The sample thickness corresponded to the actual sample dimension or matched the preferred thickness of a sample after compression. The experiments were performed on samples with a 20 cm × 20 cm base area. To determine the specific heat capacity (Cp), the same apparatus was used. This equipment measures the Cp by heating the sample on a step-by-step basis. After calibrating the equipment with a certified standard, about 5% uncertainty can be expected. The measurement procedures are presented in detail in the latest papers of the authors [16,36].
2.4. Combustion Heat Measurements of the Samples with Cal2 ECO Bomb Calorimeter
To measure the combustibility, or in the case of insulation materials, the non-combustibility, bomb calorimetry is a reasonable method. One of the most important properties of insulation materials is their behavior in or resistance to fire, which is called fire safety. For this, firing tests on the samples were conducted. With a Cal2 bomb calorimeter, the gross combustion heat (or the calorific value) of the samples could be measured. The calorific value of materials is measured by burning them at high pressure (30 bar) and in the presence of very clean oxygen gas. Both the clean O2 and the high-pressure ensure the complete burning of the organic content of the material. The experimental results were reached by the average of five individual samples’ gross combustion heat values [15,16].
2.5. Experiments Executed by Scanning Electron Microscope
To determine the fiber diameter, surface morphology, and the contamination of the samples, a scanning electron microscope (LV-SEM, JEOL IT500HR) was used. Element mapping was performed by applying a JEOL Energy-Dispersive X-ray (EDS) system with a detection threshold of 0.1 at.%. During the EDS investigations, the acceleration voltage was increased up to 15 kV. The measurement details are written in [16].
2.6. Raman Spectroscopy
As well as EDS investigations, analysis by Raman spectroscopy is also important. Inside the materials, there could be elements (compounds) or bonds that cannot be visualized by electron microscopy. For revealing further components and structures of the materials, more sensitive equipment is needed, e.g., a Raman spectrometer. This method provides a good opportunity to identify the elements through their footprints (bonds). EDS gives only results about the composition of the samples; however, Raman spectroscopy identifies compounds and bond structures. A Horiba LabRam Raman spectrometer was used for Raman measurements, with a laser diode which operated at a wavelength of 785 nm, and a cooled CCD detector. For the measurement, 1800 lines/mm gratings were used, and as a result, the accuracy of the peak positions was at least ±1.5 cm−1. The excitation beam was focused on the surface of the sample with a 50× lens. The laser power on the surface was about 1 mW/cm2. The measurements were performed with an acquisition time of 30 s, accumulating 5. The measured spectra were analyzed, and the baselines were corrected. Both the calibration method and other settings of the measurements were presented in [16,36].
2.7. Differential Scanning Calorimetry Measurements
Differential scanning calorimetry (DSC) experiments were performed with Netzsch DSC 3500 Sirius equipment in nitrogen protective gas. The measurements were executed between 30 and 350 °C with 10 °C/min steps. DSC measurements provided acceptable and useful results on the thermal behavior and thermal stability of the materials. For the measurements, powder of the samples ~10 mg in weight was prepared. The method procedure was as follows: two samples were placed in a programmable variable temperature oven, one for the test substance and the other for a reference sample with known thermal properties. While the furnace was heated in a programmed manner, the temperature difference between the two samples was measured as a function of the furnace temperature. However, in the calorimetric measurement, our goal was not to determine the temperature difference, but the power difference flowing into the two samples. It was previously presented that calorimetry measurements are suitable for thermal insulation materials [18,37].
2.8. Sorption Isotherms
Besides the thermal properties, the sorption characteristics of the samples are also important. Sorption isotherms are key parameters to understand the behavior of samples in a humid environment. Water taken up from humid environments can cause unwanted as well as undesirable changes in the properties of materials. Moisture in structures can affect the physical and mechanical properties of insulation materials. For the registration of the sorption isotherm curves, three types of equipment were combined. The sorption isotherms were registered by following the directions of the ISO 12571: 2013 standard. First, the samples were dehydrated until a constant mass was reached in Venticell 111 apparatus, the drying was executed at 70 °C and in atmospheric air, and after the equilibrium stage, the dry mass of the samples was measured (mdry). Subsequently, the dried samples were placed in a Climacell 111-type climatic chamber, treated at 23 °C and 20–90% relative humidity, and after reaching equilibrium, their wet mass was measured (mwet). By using Equation (1), their moisture content was calculated. For the measurements, four samples from each material were used, and the average of their equilibrium moisture content was given as a function of the relative humidity [7,38].
2.9. Hydrophobic Tests
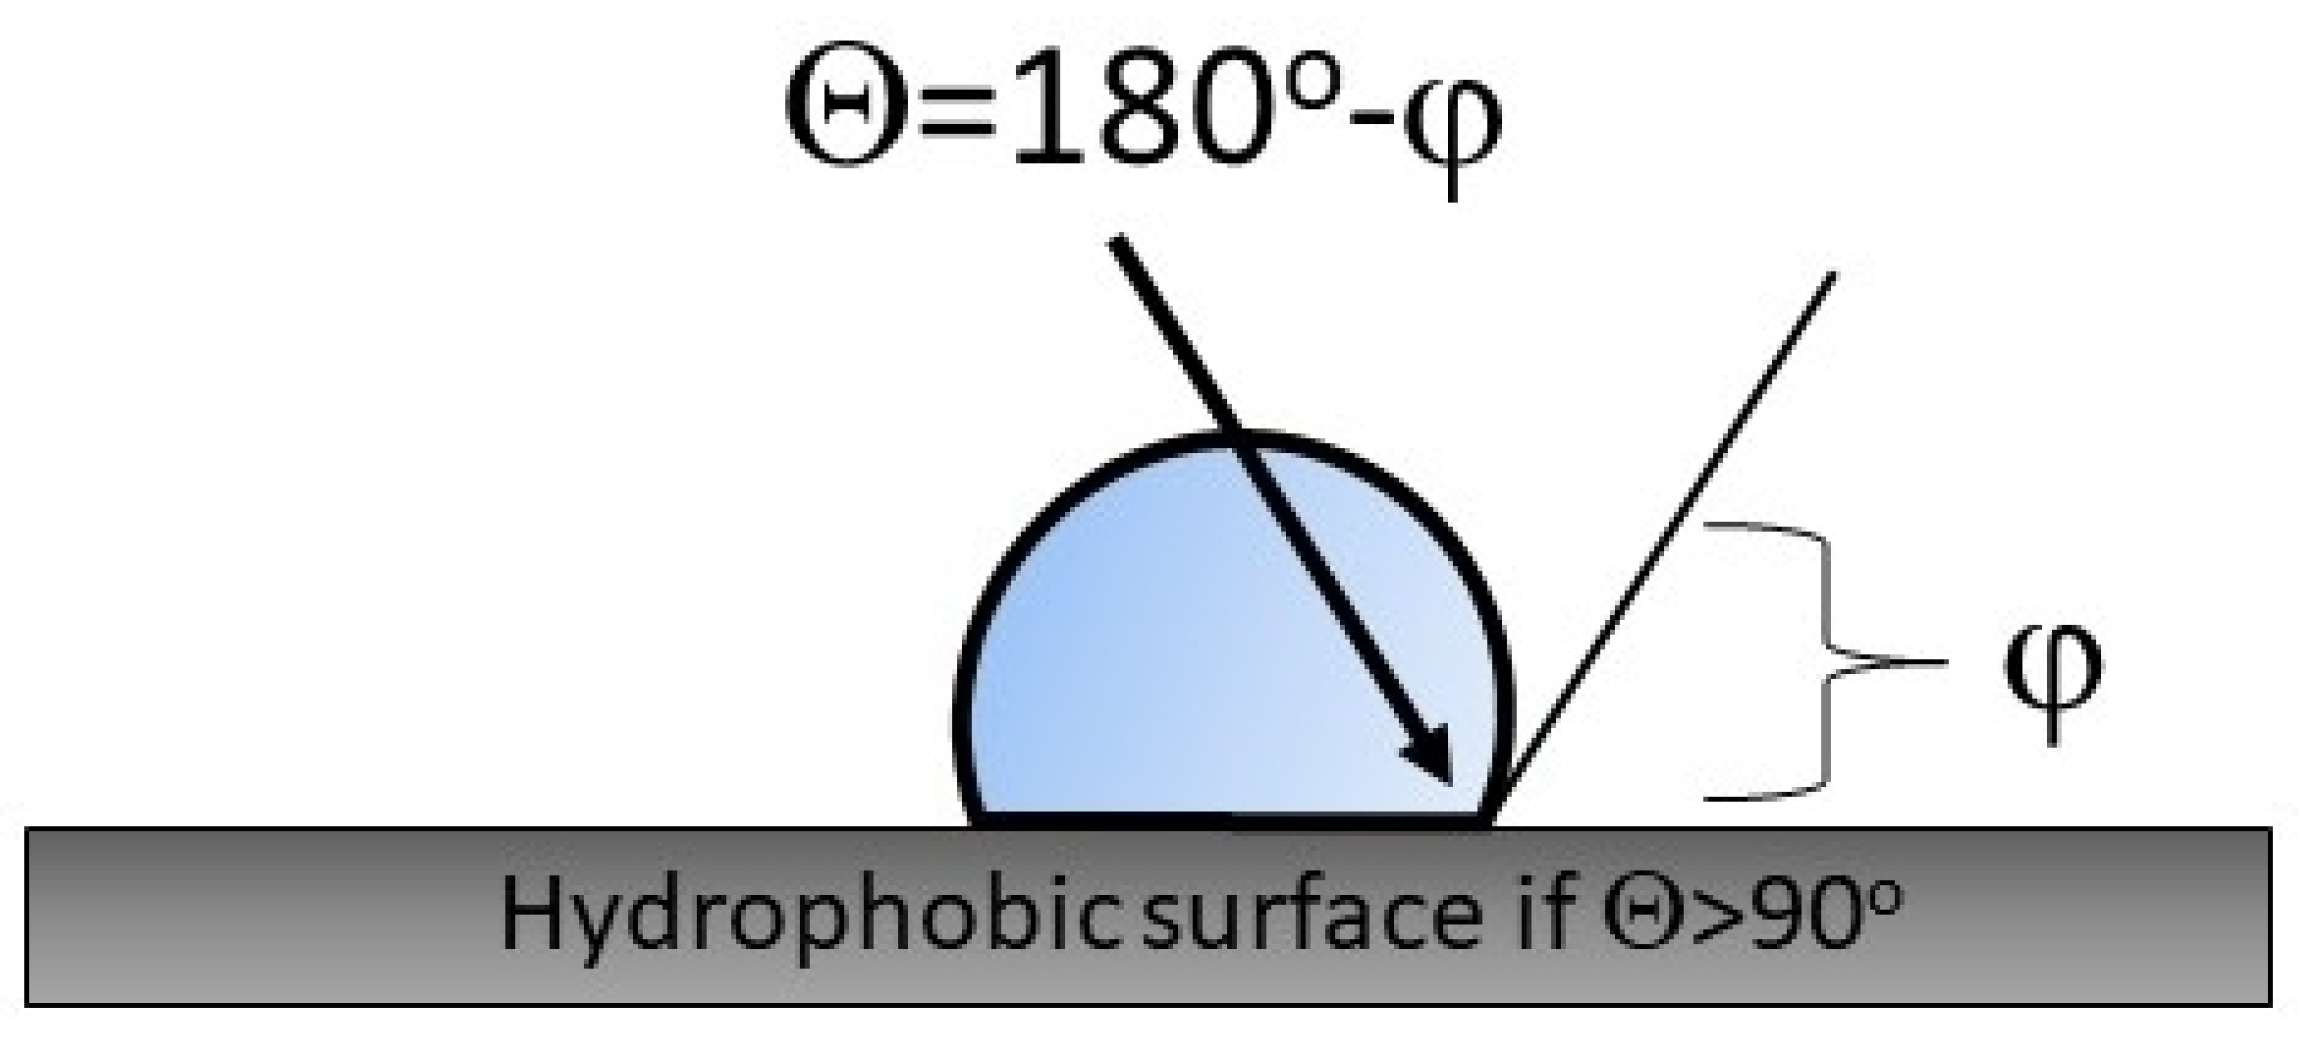
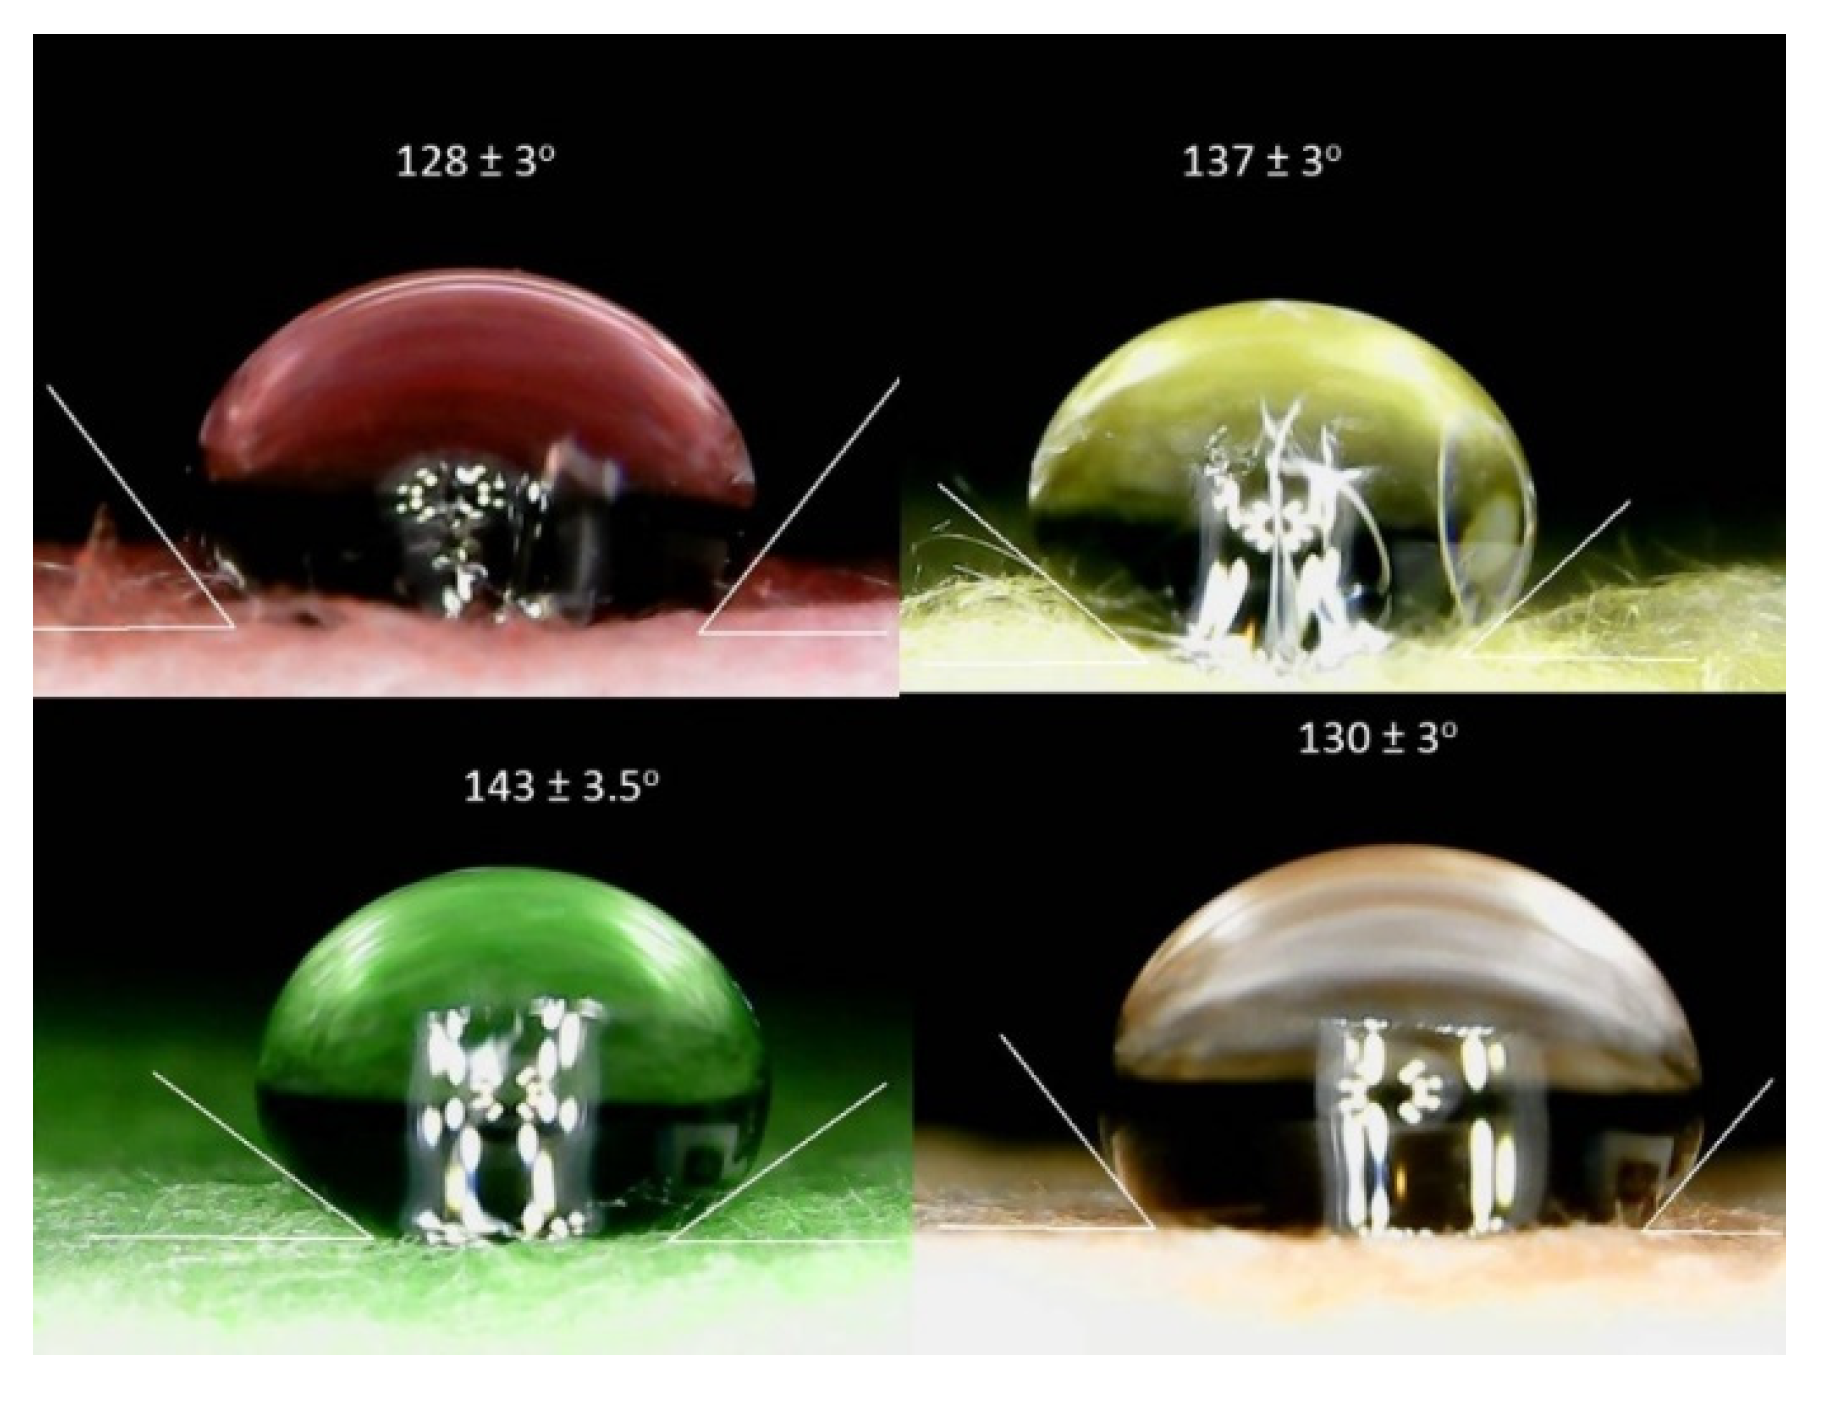
A hydrophobic test was executed with an optical microscope by investigating the contact angle between the water bubble and the surface area of the samples. For the evaluation of the images, the drop-snake plug-in of ImageJ software was used. Figure 1 shows the relationship between the contact angle and the surface. A surface is hydrophobic if the contact angle is greater than 90° [39].
3. Results and Discussion
3.1. Surface Morphology and Fiber Distribution Investigations by Scanning Electron Microscopy
In order to explore the components as well as the structure of the samples with the resins, scanning electron microscopy analysis was performed. Nagy et al. [40] highlight that electron microscopy produces significant results for mineral wool insulations. They have highlighted that resin can increase the density and can enhance the thermal and mechanical properties. Furthermore, they measured the fiber diameter to be 6–8 µm with a high rate of deviation. Others presented, through SEM images, that the fiber diameters of wool materials range between 2 and 8 µm inside the material [41].
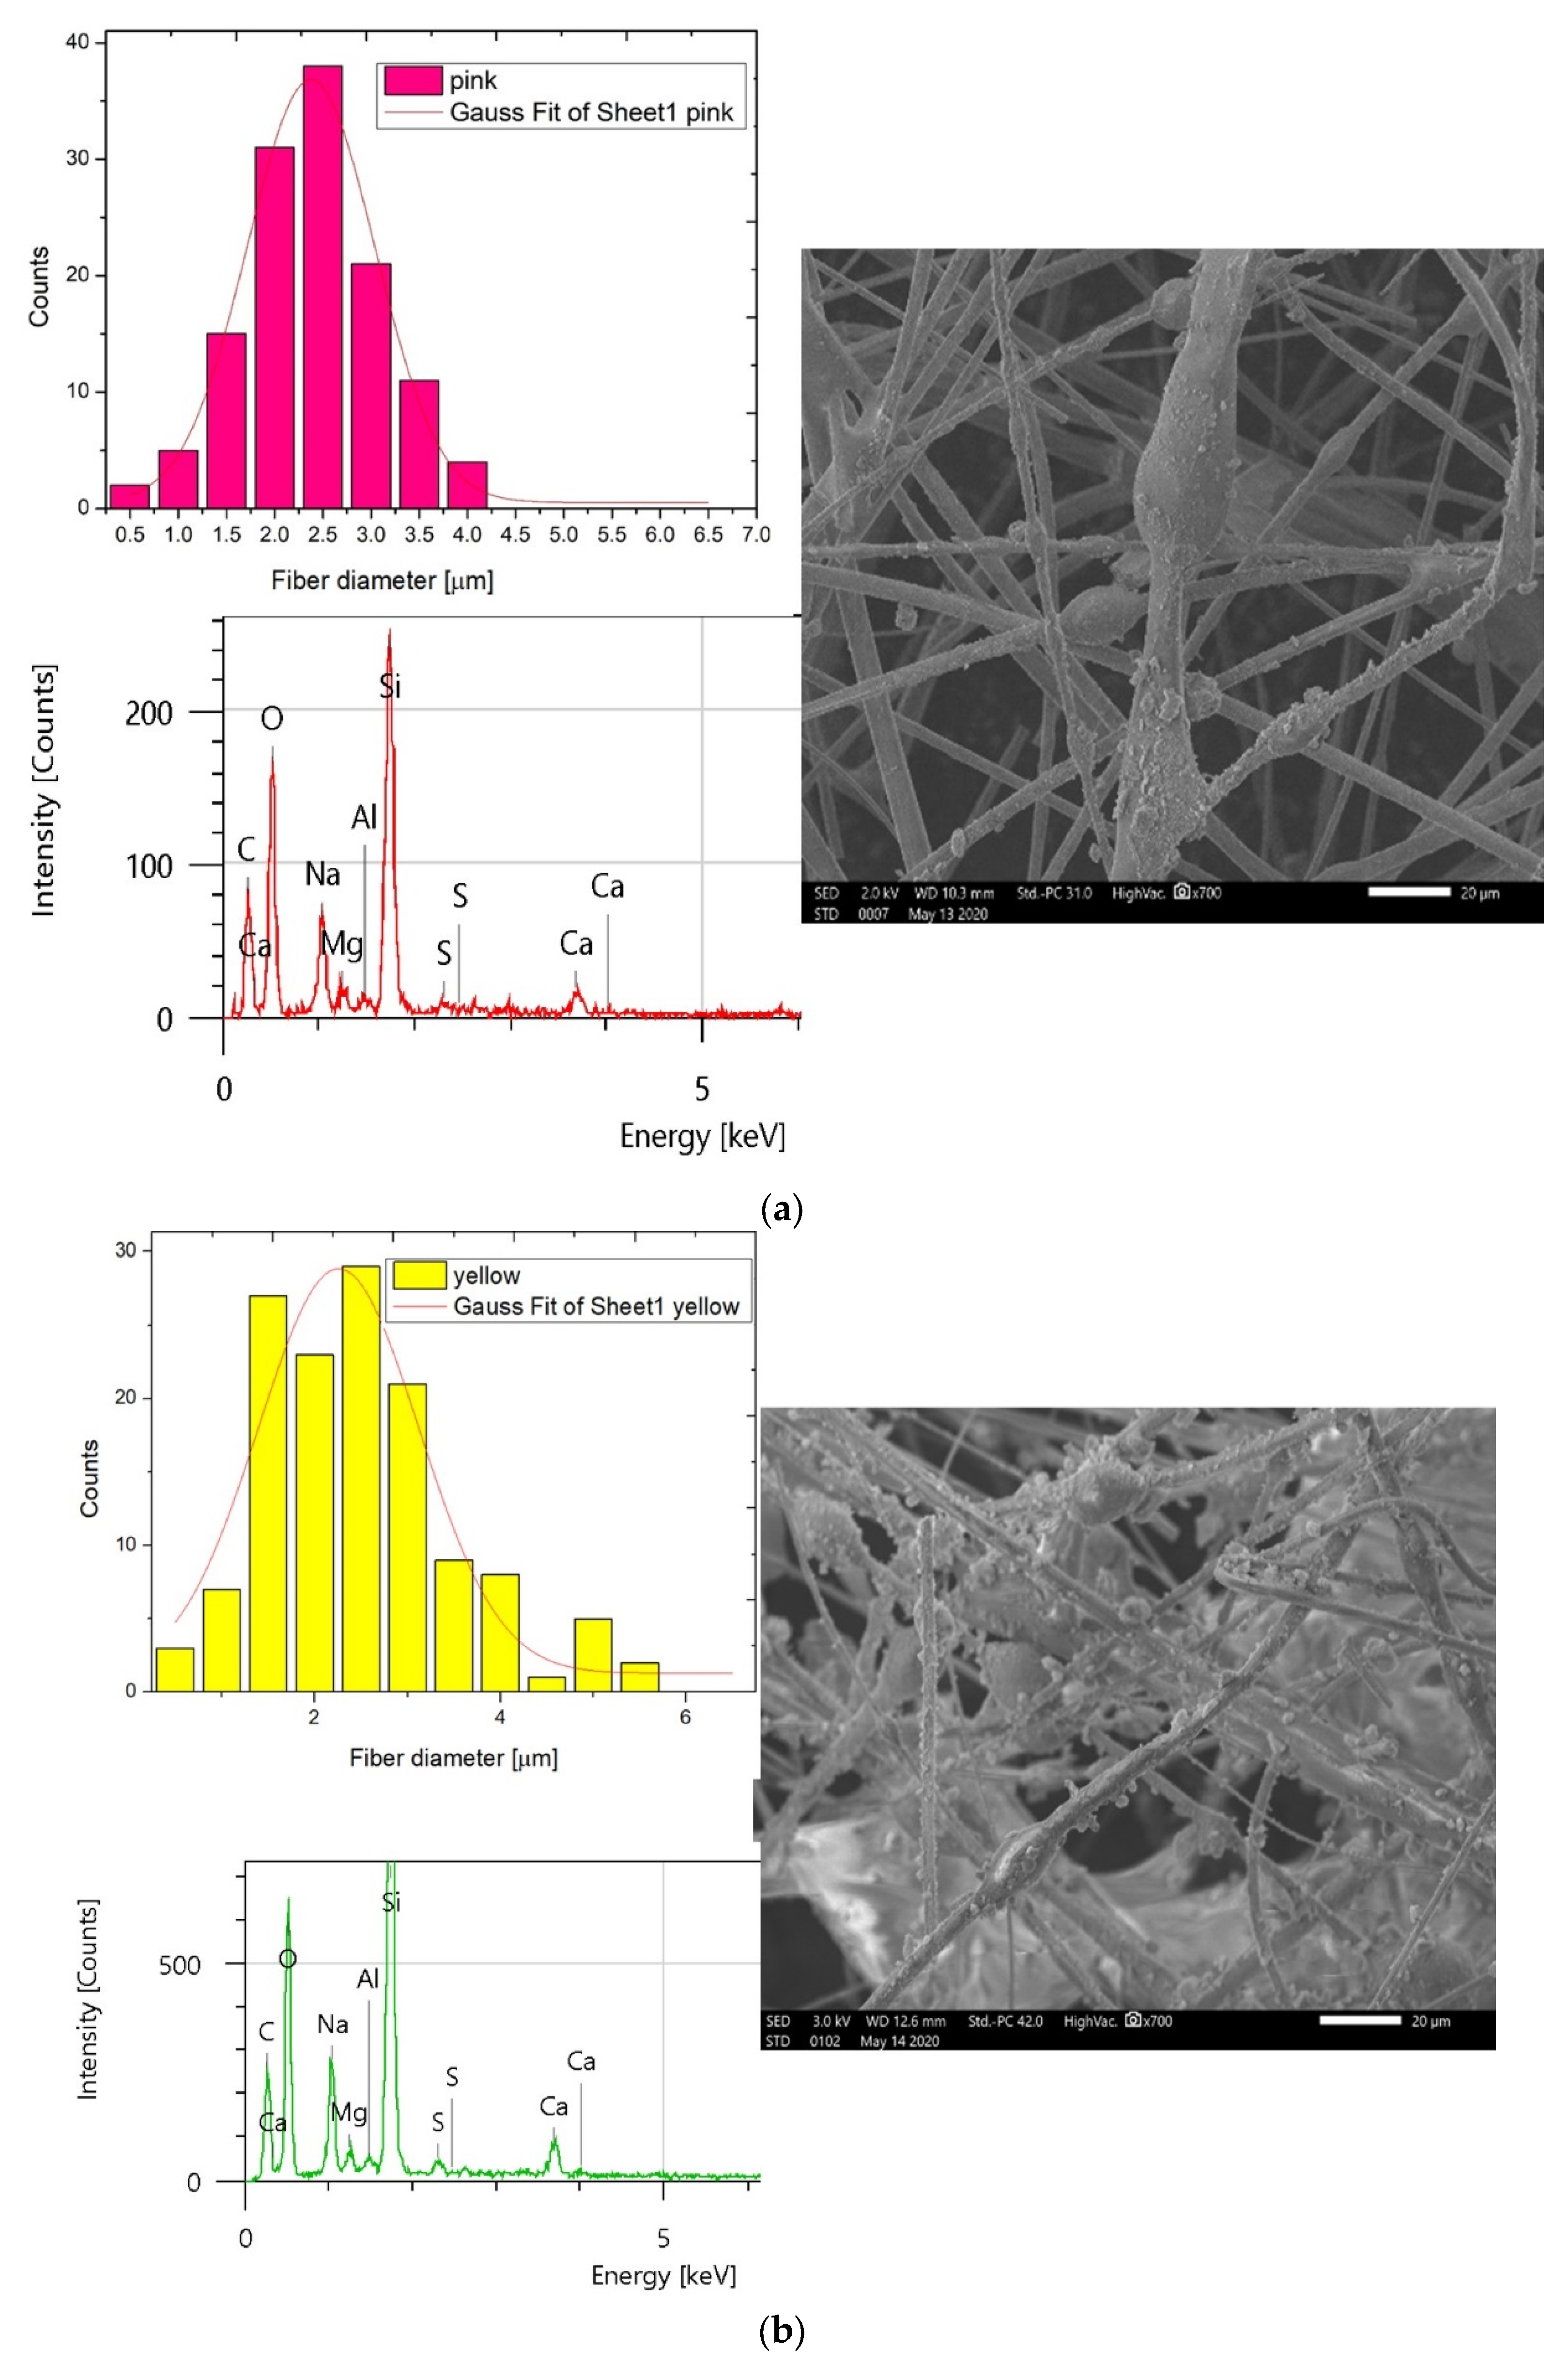
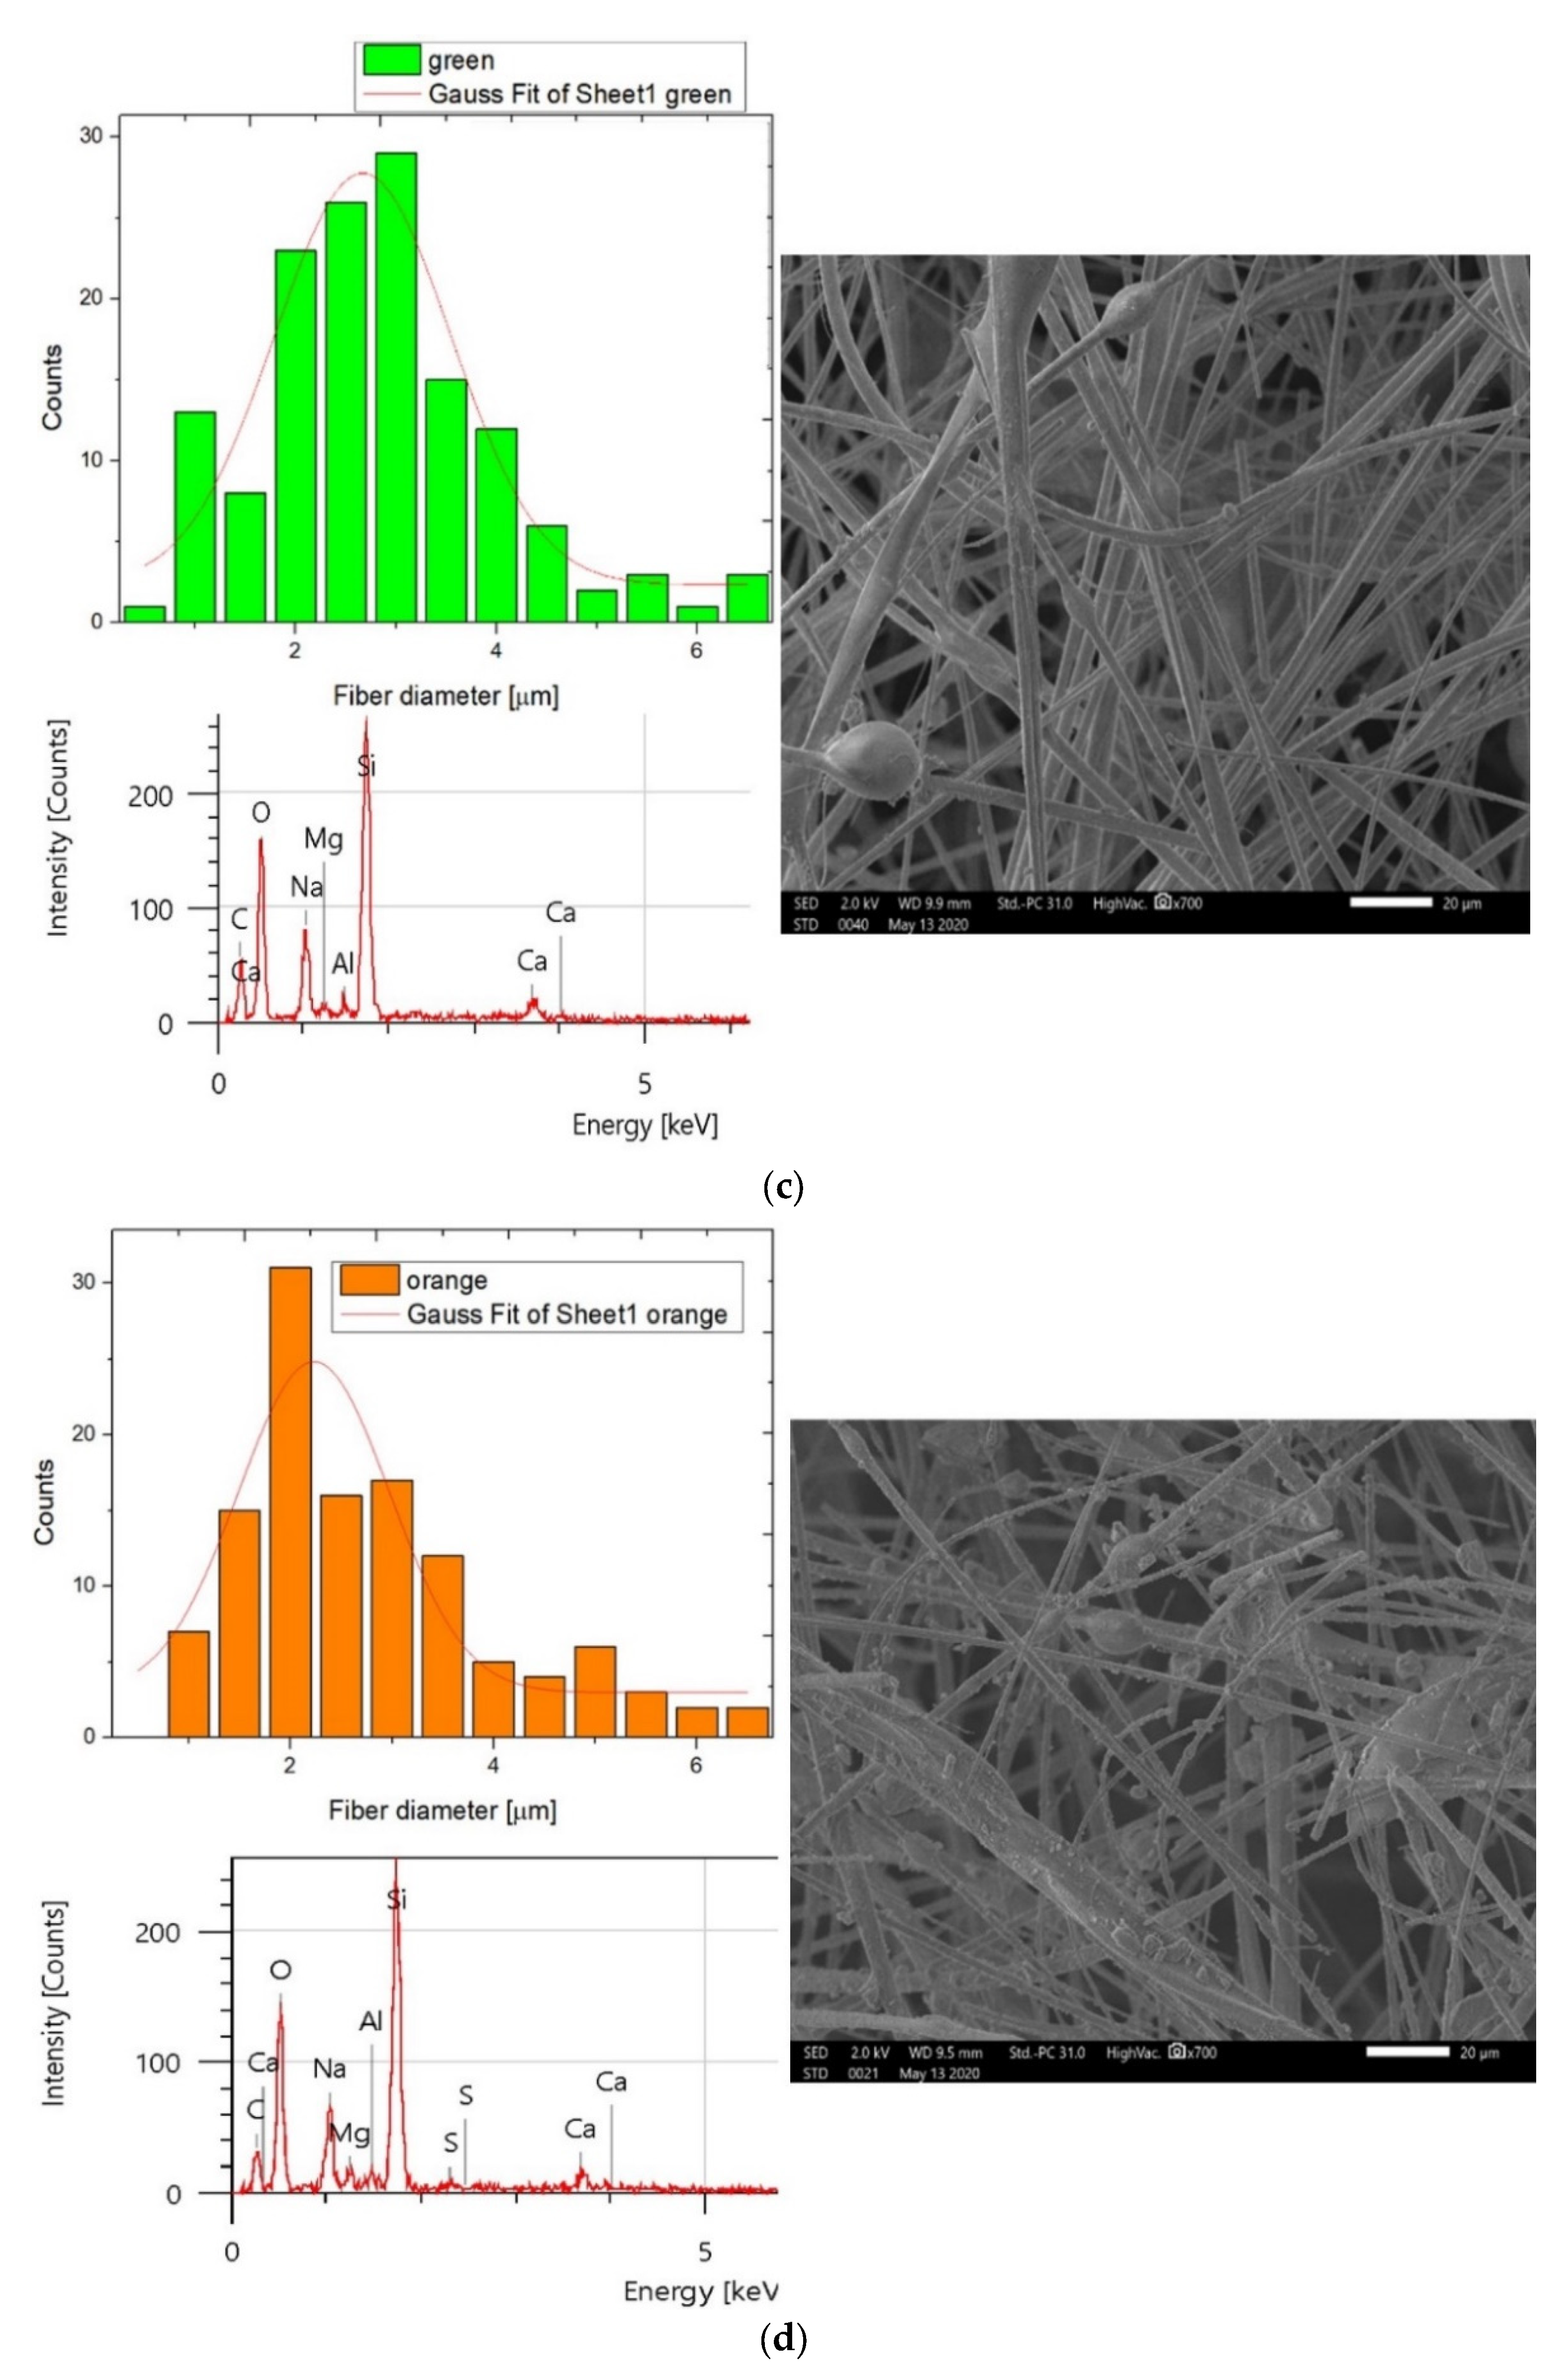
Vinh et al. [27] presented a visualization of glass micro-fibers with scanning electron microscopy. From our group of SEM images (Figure 2a–d), it can be seen the sample’s fiber is cylindrical, and the fibers are embedded in a binder material; moreover, the orientation of the fibers is randomized. For analysis of the samples, 700× magnification with a 2 kV acceleration voltage was used to minimize charge accumulation effects. By comparing the SEM images of the studied samples, the most important difference in morphology was that in the case of the yellow sample, the surface of the fibers was covered with a higher density of small particles. At the same time, the composition measurements did not show any difference between the samples. From the EDS results, we could deduce that the base components were almost the same for the four materials: carbon, silicon, aluminum, sodium, magnesium, and calcium, possibly with their oxides; moreover, a slight sign of sulfur was sometimes observed. However, significant sulfur was not detected in the green sample. By analyzing the fiber’s diameter with the ImageJ software, we could state that the distribution of the fibers also varied significantly within the material, and the inhomogeneity of the fibers was high. The scanning electron microscopy images show a typical image of fibrous insulation materials. The material was lightweight and compressible. It was also notable that the surface of the fibers was smooth only for the green samples.
Gaussian distribution analysis was also performed on the measured fiber diameters, and the results are shown in Figure 2a–d as well as in Table 2. The model used a built-in module of the data analyzing software. The equation of the model is given as Equation (2).
where w is the width, A is the area, yo = 0 is the offset, xc = is the center, and sigma is half of the width as the standard deviation. The values of these parameters are shown in Table 2. From the adjusted R-squared, it could be concluded that the model fitted very well to the data (fiber diameters) of the pink samples, and acceptably for the yellow and green samples. Moreover, the mean values of the measured data of the fiber diameters have also been calculated.
y = yo + (A/(w·sqrt(Pi/2))) ∗ exp(−2((x-xc)/w)^2
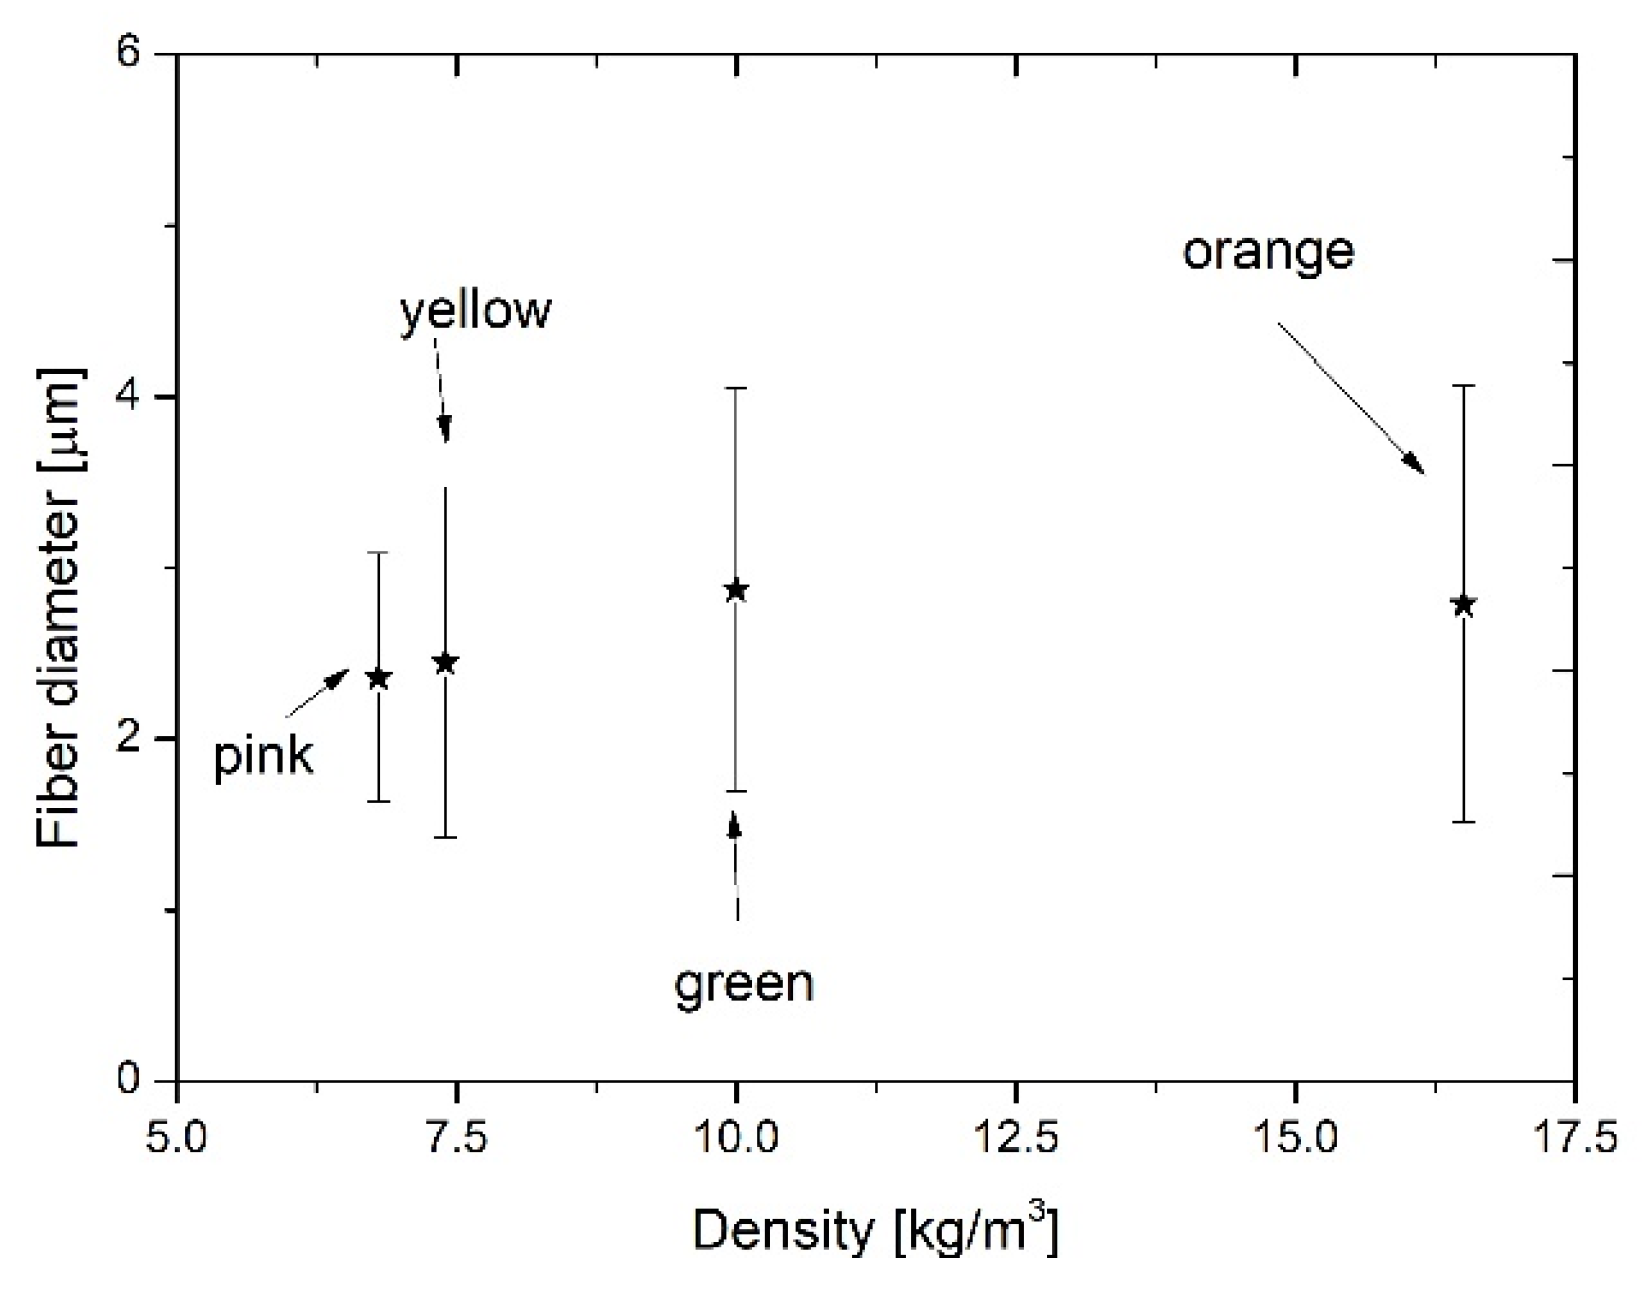
The main parameters of Gaussian distribution analysis are the center (xc) and sigma. It could be seen that the value of the center was the highest for the green sample. Smaller fiber diameters were detected for the other samples. At the same time, from the results of the histograms in Figure 2a–d, it was found that the largest inhomogeneity in fiber diameter was identified out for the green, yellow, and orange samples. For these materials, fiber diameters varied between 0.5 and 6.6 mm. To observe the relationship between the as-received density and the calculated mean fiber diameter, Figure 3 was created. This graph presents the fiber diameters of each sample. From the Gaussian distribution of the above figures, it could be determined that the mean value versus standard deviation ratio was 0.3 for pink, 0.41 for yellow and green, and 0.46 for the orange samples. The average fiber diameter for the orange and the green samples was the same considering the standard deviation. From Figure 3, it could be concluded that with increasing density, the fiber diameter increases.
3.2. Thermal Conductivity Measurement Results
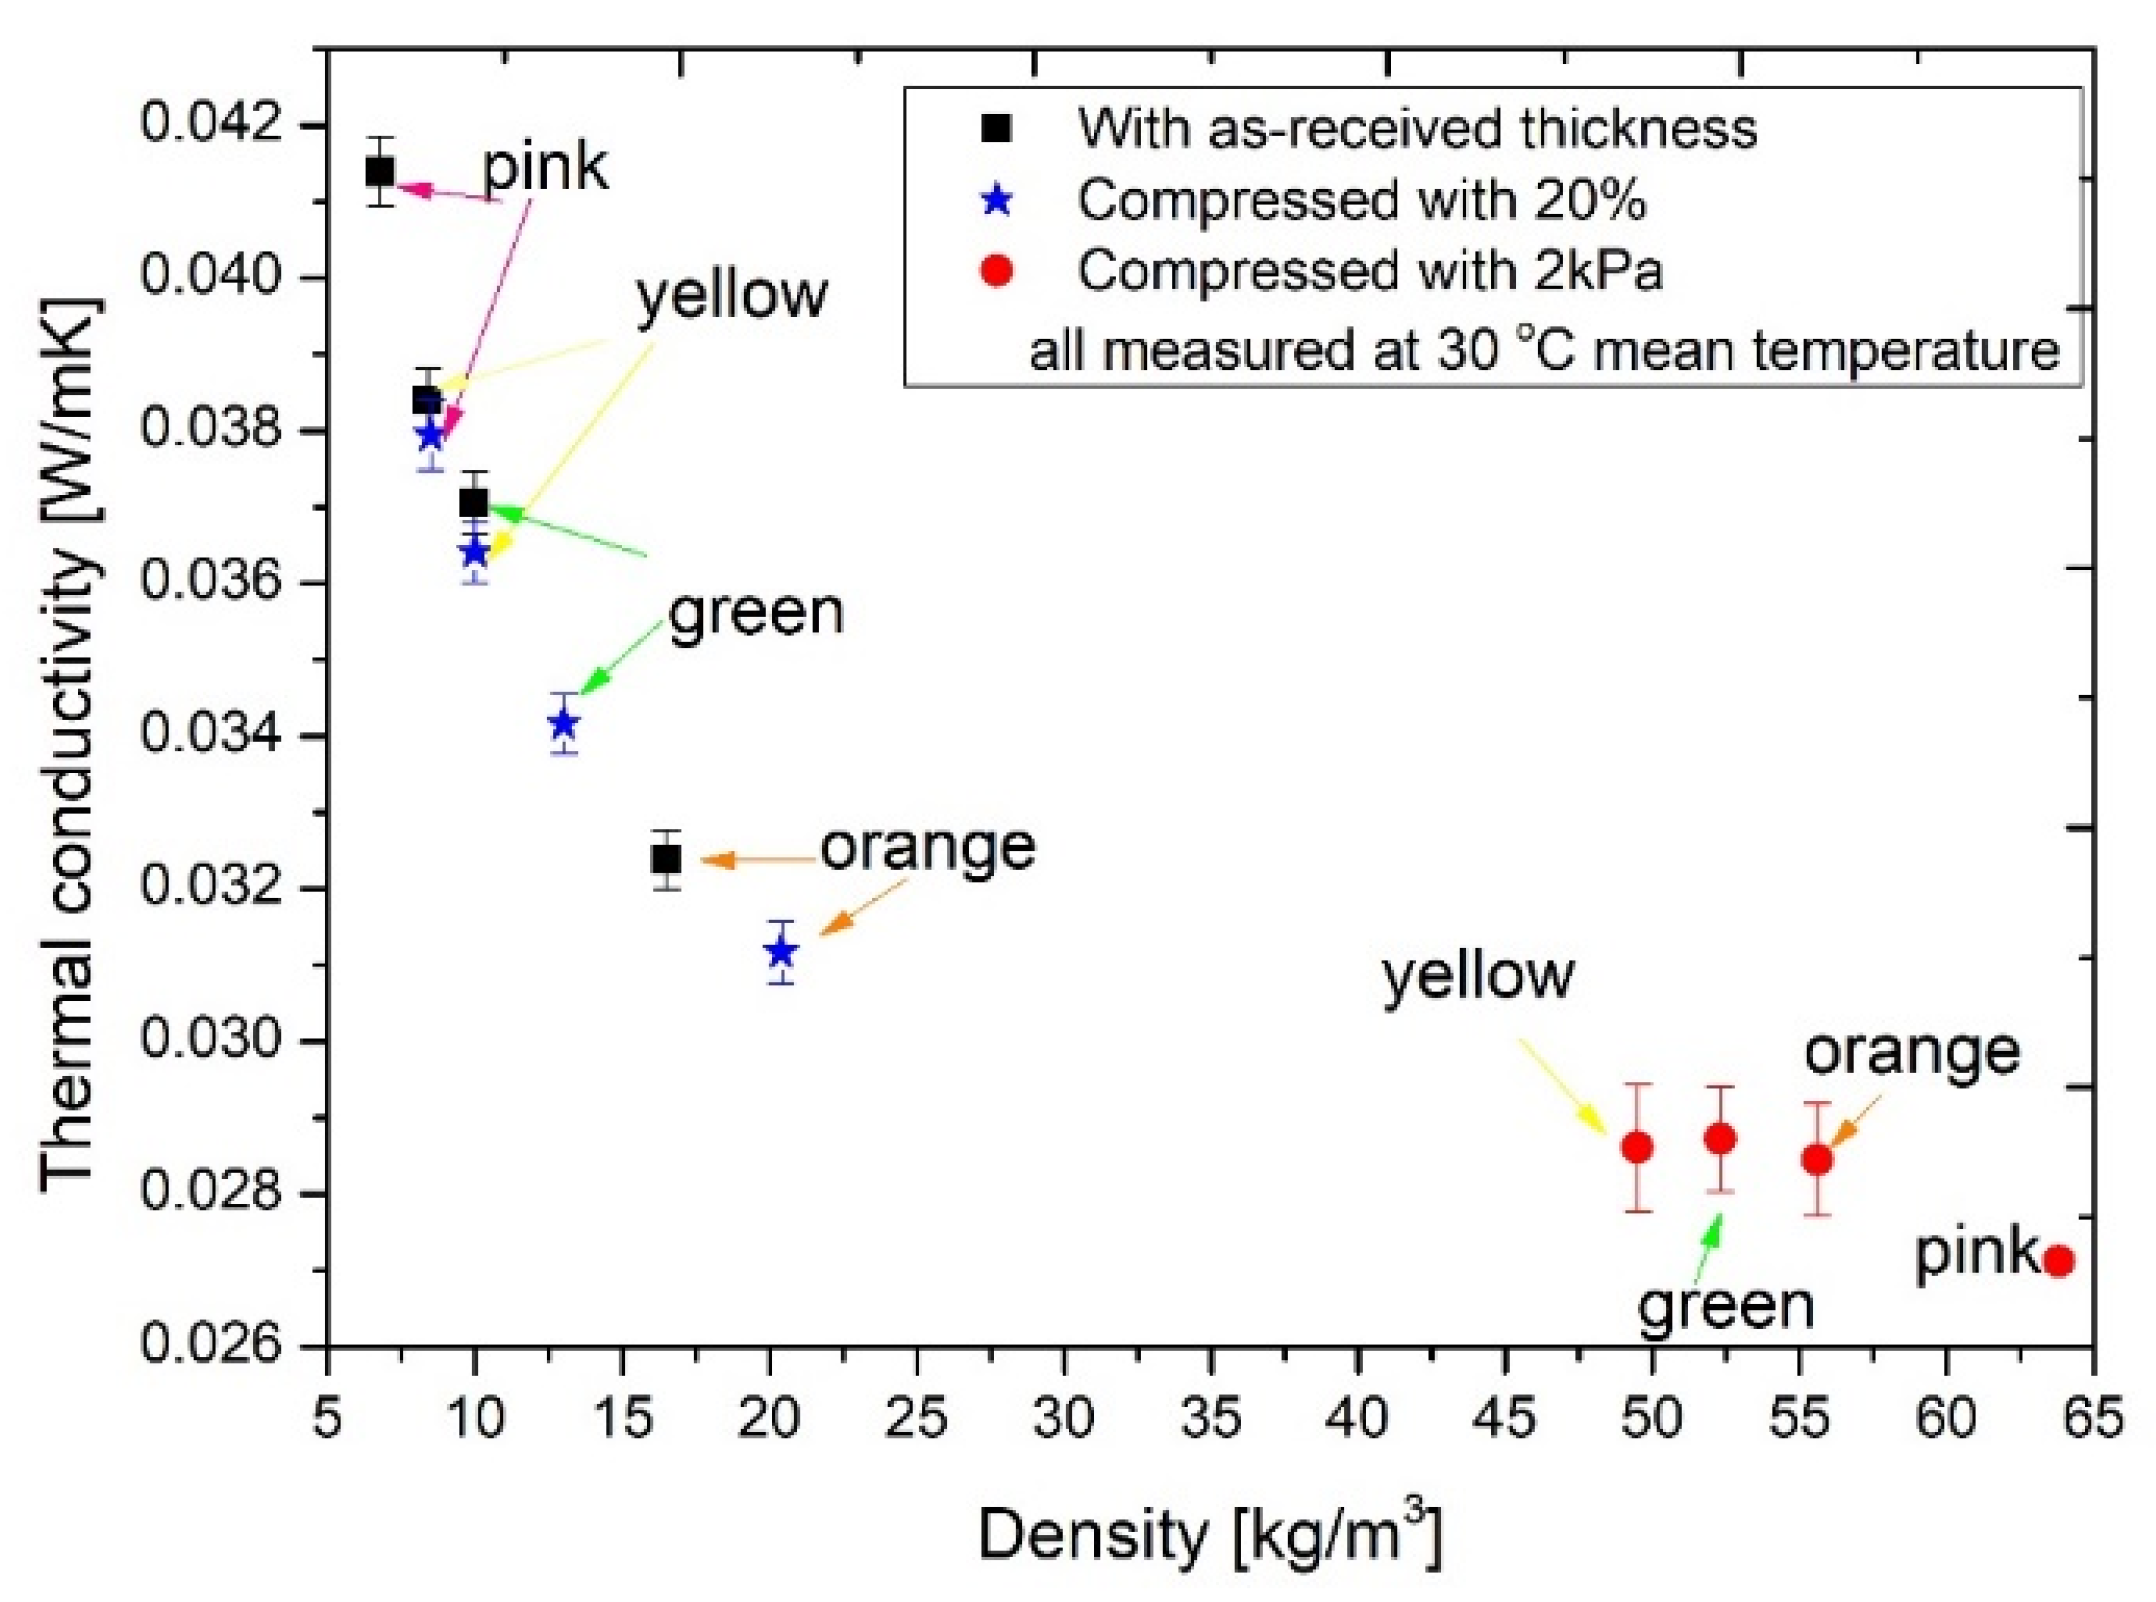
Table 3 shows the declared thermal conductivities as a function of the temperature and density. As can be observed, the thermal conductivities varied between 0.029 and 0.092 as a function of temperature and density. The tested materials were loose-filled and lightweight insulation; therefore, they were very compressible. Netzsch equipment enables measuring the thermal conductivity of the samples under various loads of heat plates applied on the samples, as well as allows measurement without any load. However, here it must be emphasized that the default setting for the applied load was about 2 kPa. Moreover, by using this equipment, the thermal conductivity could also be measured at different mean temperatures.
First, to observe the effects of compression and the resultant change in density on the thermal conductivity, three measurements were performed on each sample at a mean temperature of 30 °C, and the results are highlighted in Figure 4. Black squares show the measured thermal conductivities without any load. With an increasing density, a decreasing thermal conductivity was reached. Then, the samples were compressed manually with the equipment by 20%, and their thermal conductivities were measured again. Here, the results presented the same order as above: the highest value was attained for the pink sample, while the lowest value was measured for the orange. The phenomenon that the increasing density reduces the thermal conductivity was also presented by others for fibrous insulations, although notably, the thermal conductivity decreased to a local minimum [16,42]. In order to see the effect of the compression load on the thermal conductivity, samples were pressed with the plates applying 2 kPa pressure, resulting in about an 80 N force. This compression could happen in real cases, where the insulation material is placed between two layers, or it is compressed by another layer inside the structure. In this case (indicated with red circles), the density of the pink insulation changed the most due to the compression and reached the lowest thermal conductivity. Here, it must be mentioned that due to the compression, the resultant thermal conductivity and thickness decrease might also result in a decrease in the calculated thermal resistance. However, these results supported the case that increasing density decreases the thermal conductivity.
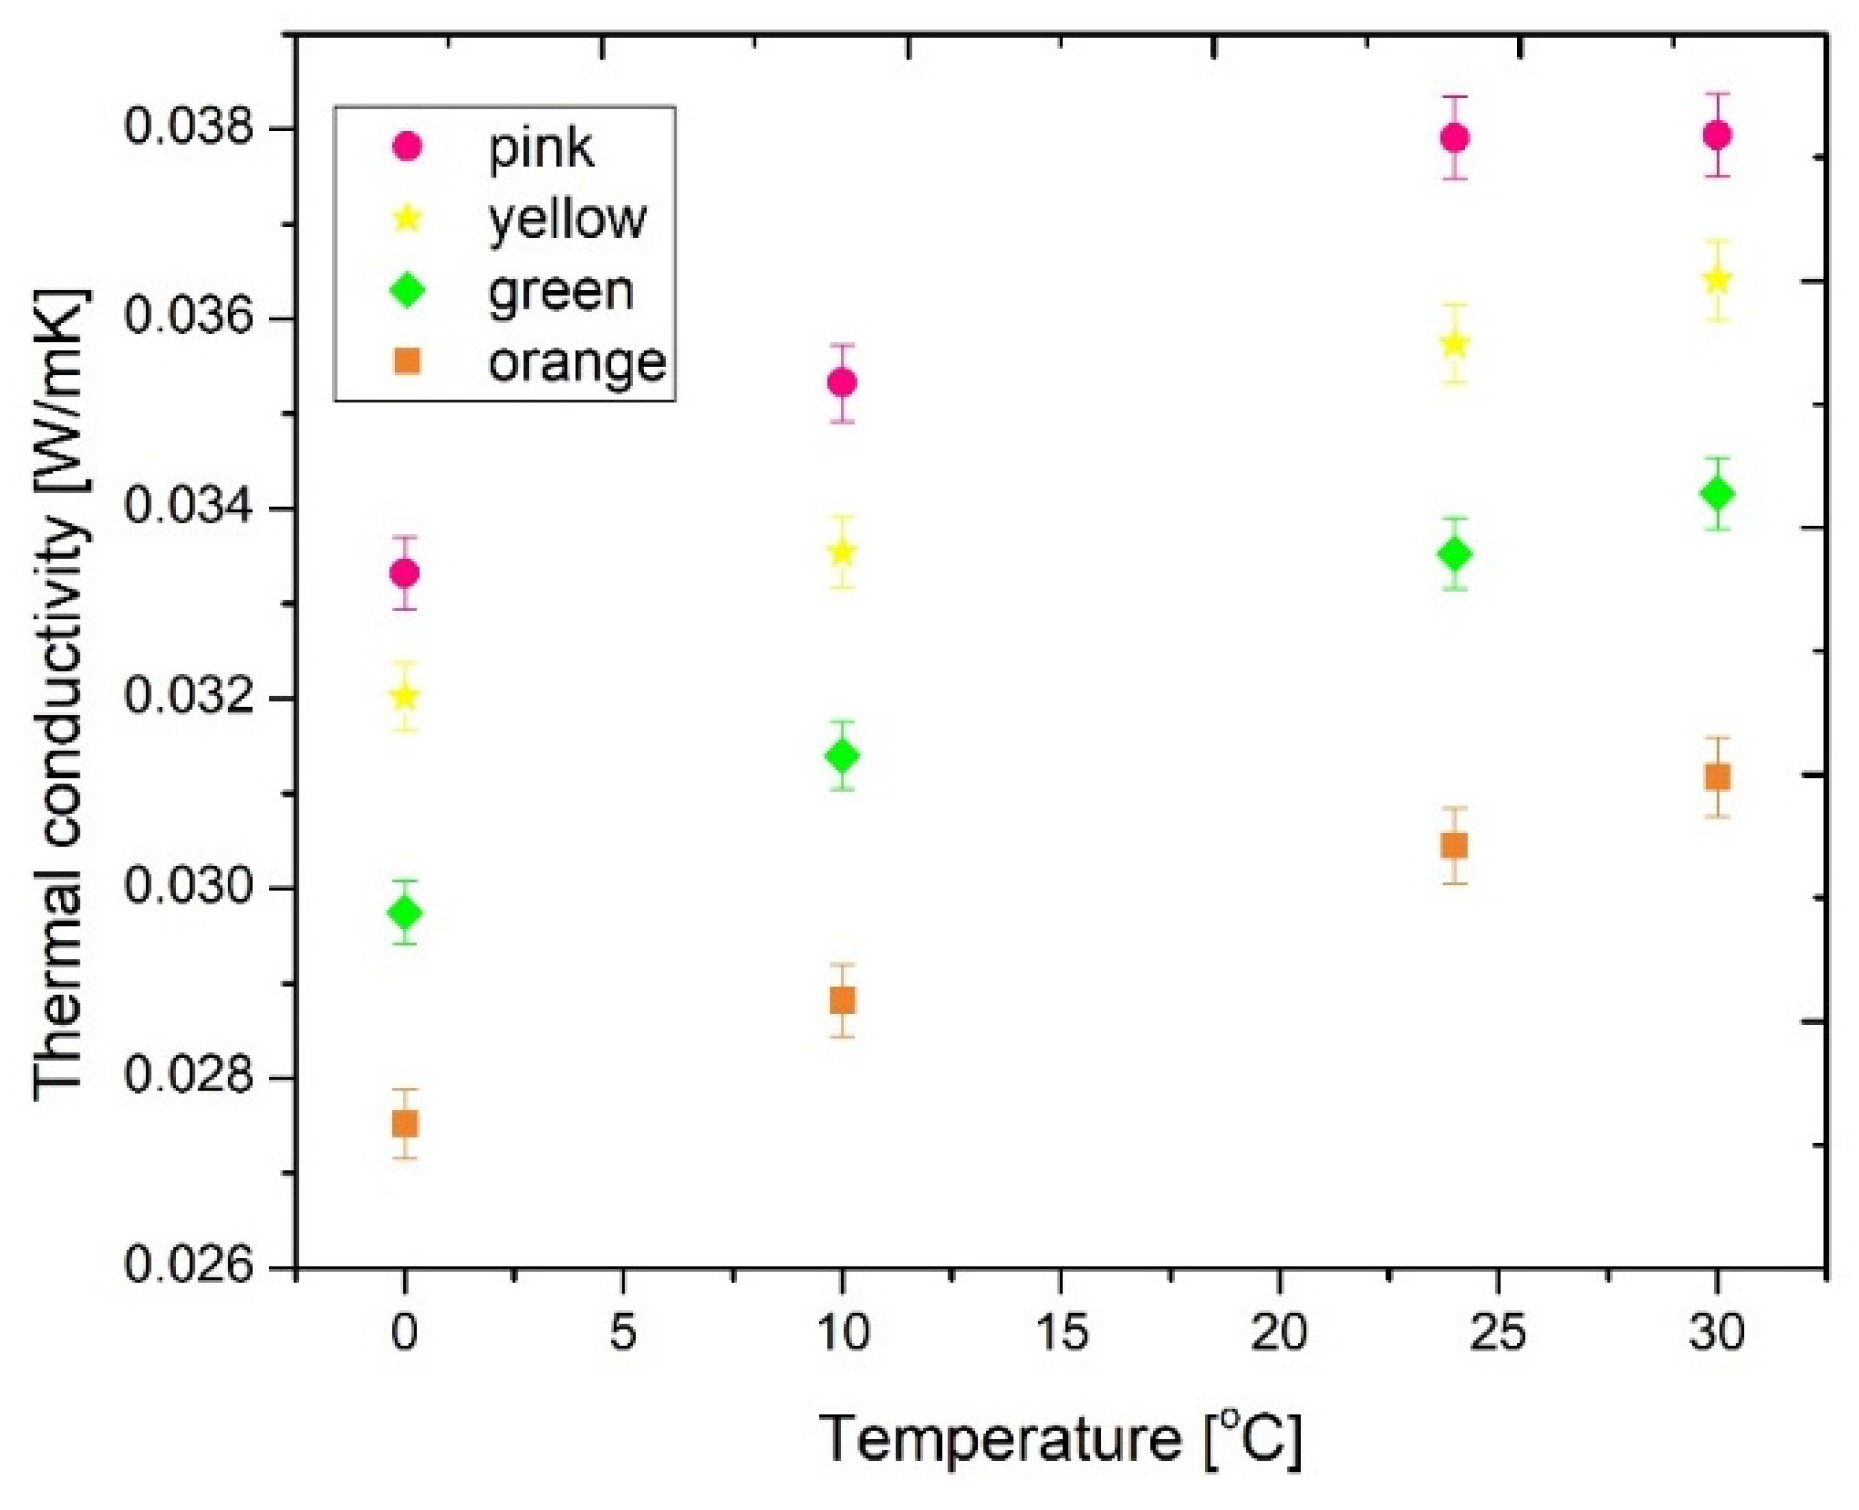
In Table 4, thicknesses measured during the thermal conductivities in the case of the 20% compression and under 2 kPa load are displayed. One can see that in the last case, where 2 kPa load was exerted on the materials, the thicknesses was less than 1 cm, where the measurement limit of the equipment was reached. Therefore, these results should be treated with care, and no significant conclusions should be drawn from this. Additionally, from the results presented in Figure 4, it can be stated that the best choice for the thermal conductivity measurements was the setup where the compression was fixed at 20%. The reason for this was because these materials are loose-filled and compressible. For exact measurements of the thermal conductivities, the heat plates had to be in good contact with the surface, and we found that this was the best solution for the thermal conductivity measurements. As a result, further thermal conductivity measurements were conducted at different mean temperatures (0, 10, 24, and 30 °C with 20 °C temperature differences, see Figure 5). We have concluded that thermal conductivities increased as a function of mean temperature. The lowest thermal conductivity was attributed to the orange sample, followed by the green, yellow, and pink materials, in ascending order.
With the Netzsch equipment, we were able to measure the specific heat capacity (Cp) values of the samples at 10 °C, and the results are shown in Table 5. It was found that the highest value was attained for the yellow sample, followed by the orange, green, and pink in descending order. Higher specific heat capacity means a higher potential for storing heat, which is a very important thermal property of insulation materials. Similar investigation results have been presented elsewhere [16,43].
3.3. Wetting Tests
3.3.1. Hydrophobic Tests
With a combination of an optical microscope and the ImageJ software, contact angles between the surface of the insulations and the water droplets were estimated (see Figure 6). From the measurement results, it can be concluded that the highest contact angle belonged to the green sample, while the orange and the pink one had the lowest. It should be emphasized that the results for each material showed hydrophobicity, which is also very important for insulation material. The uncertainty of this measurement was about ±5%.
3.3.2. Sorption Isotherm Measurement Results
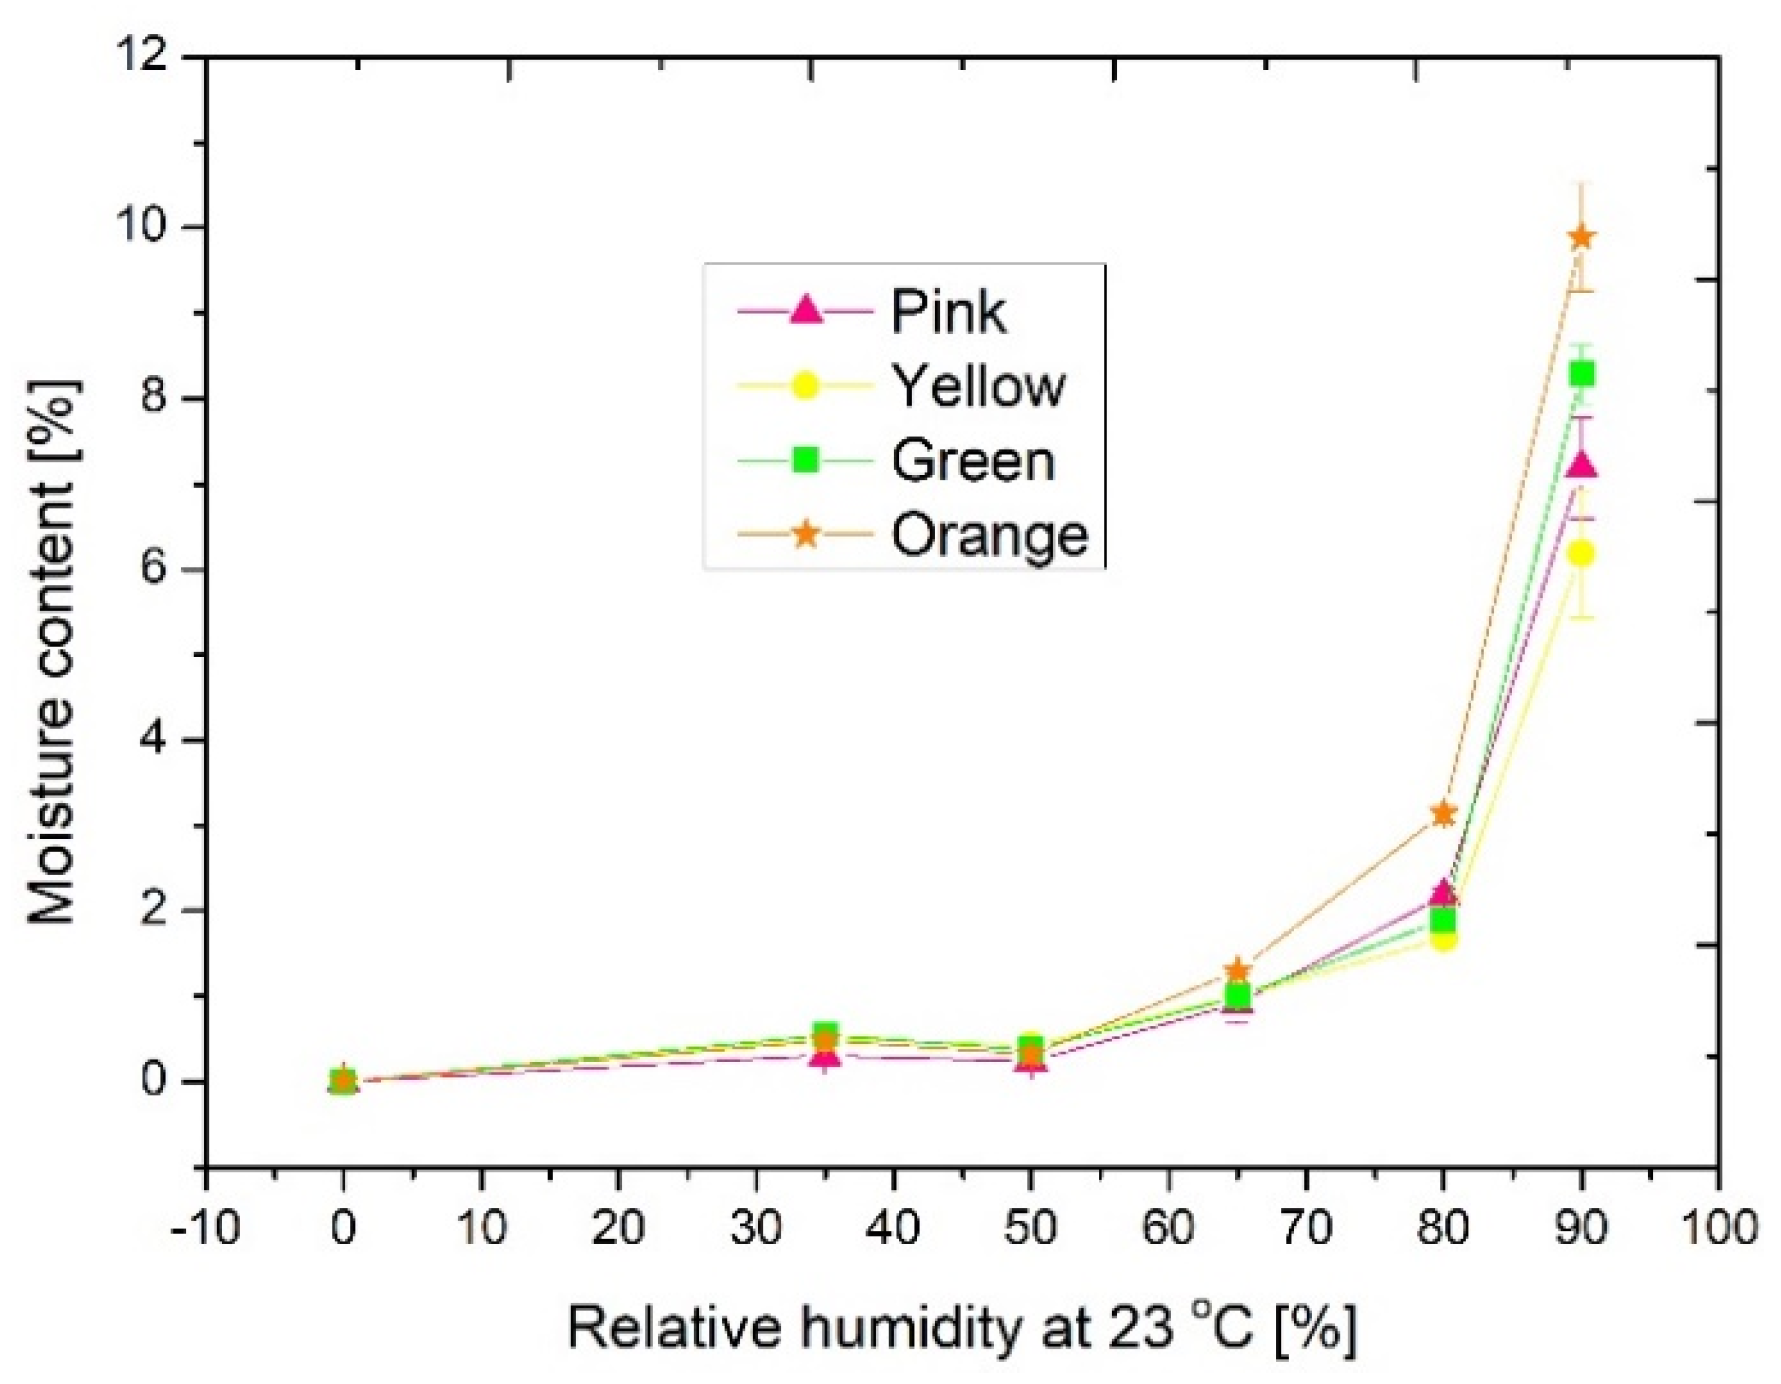
Sorption isotherms are key parameters of insulation materials from an application point of view. The sorption isotherm curves presented the dependency between the equilibrium moisture content and the relative humidity at a certain temperature: in our case, at 23 °C. For the exact planning of the structures, it is necessary to know how the applied materials behave in a humid environment. With the combination of the dryer and the climatic chamber, their sorption isotherms were determined. These curves can be assessed using Brunauer, Emmett and Teller’s theory from the point of view of adsorption processes among solid material and vapor. Figure 7 shows the measured sorption isotherms. The shape of the graphs shows a type III isotherm, which predicts strong cohesion forces between adsorbed molecules if the sample is hydrophobic. It can be seen that the extent of adsorption was high only under high pressures (over 70% relative humidity). This corresponds to multimolecular adsorption where the heat of adsorption of the monolayer is less than that of multilayers. As the heat of adsorption of the first layer approached zero, adsorption was delayed until near the saturation pressure limit. From the sorption isotherm curves, it can be seen that the orange sample had the highest moisture content, which might have originated from its acrylic content, and the others had a nearly similar quantity [44]. Here, it was noticed that significant moisture content (10%) was detected for the orange sample under a high humidity level (at rh = 90%). It could be concluded that these materials can be used in cases where the relative humidity of the environment is below 70%.
3.4. Investigations of the Thermal Degradation
3.4.1. Measurements of the Gross Combustion Heat
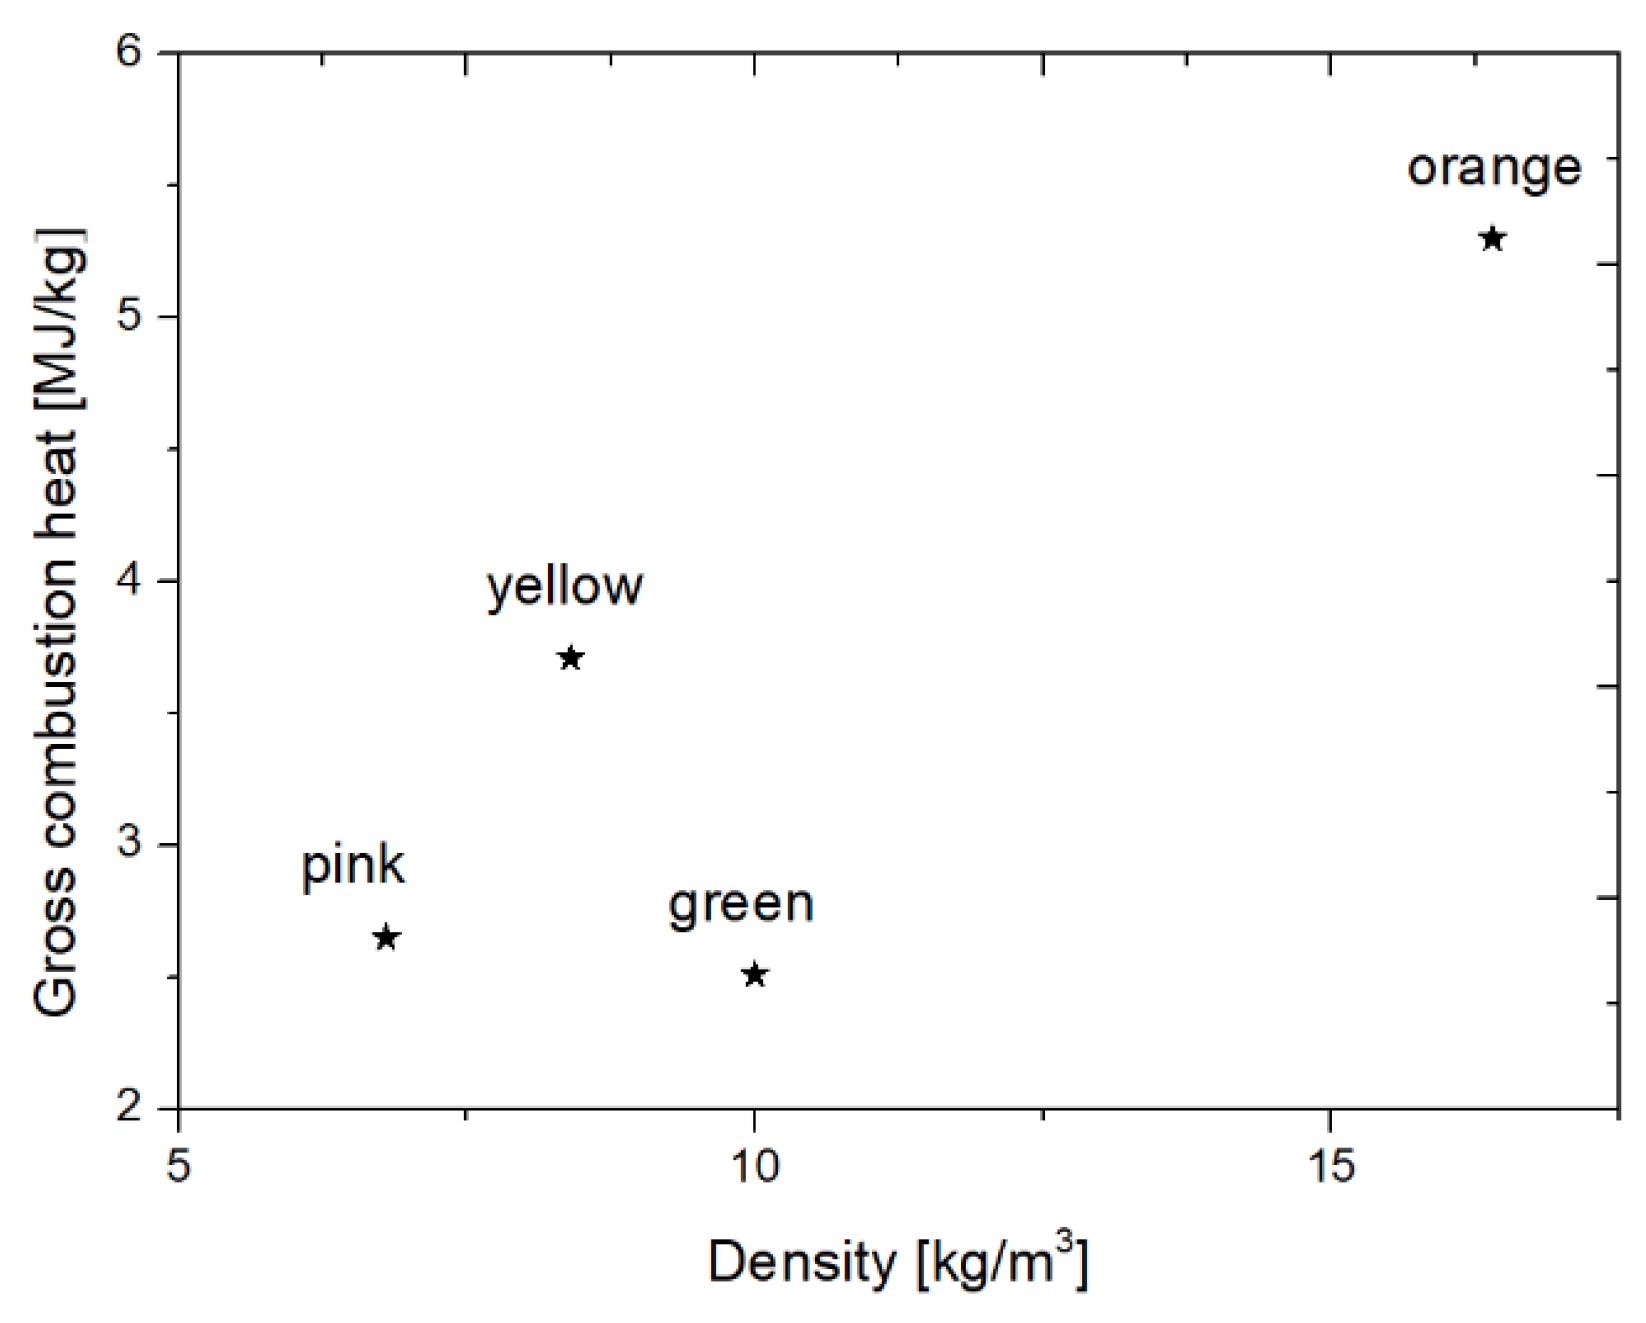
Thermal insulation materials should be fire retardant and should have a low gross combustion heat value (GHC < 7.5 MJ/kg). Fangrat [15] demonstrated that thermal degradation and combustion data can be accurately determined by bomb calorimetry. An unwanted fire in a structure can be fatal. Unfortunately, in many cases, fires cause significant damages and tragedies, mainly due to improper storage from a fire protection point of view, improper use, improper construction, or decades of construction. Contemporary fire protection is playing an increasingly important role, covering a growing segment of regulation. Thus, investigations of the calorific values of insulation materials are vital. The gross combustion heat of the materials was measured after burning them under high pressure (30 bars) and in pure oxygen. The results showed that the highest combustion heat value was attributed to the orange sample, which could also have resulted from its declared acrylic content. Moreover, it could be concluded that all the other samples had a lower calorific value, approximately 2–4 MJ/kg. Figure 8 presents the combustion heats of the samples as a function of the as-received densities.
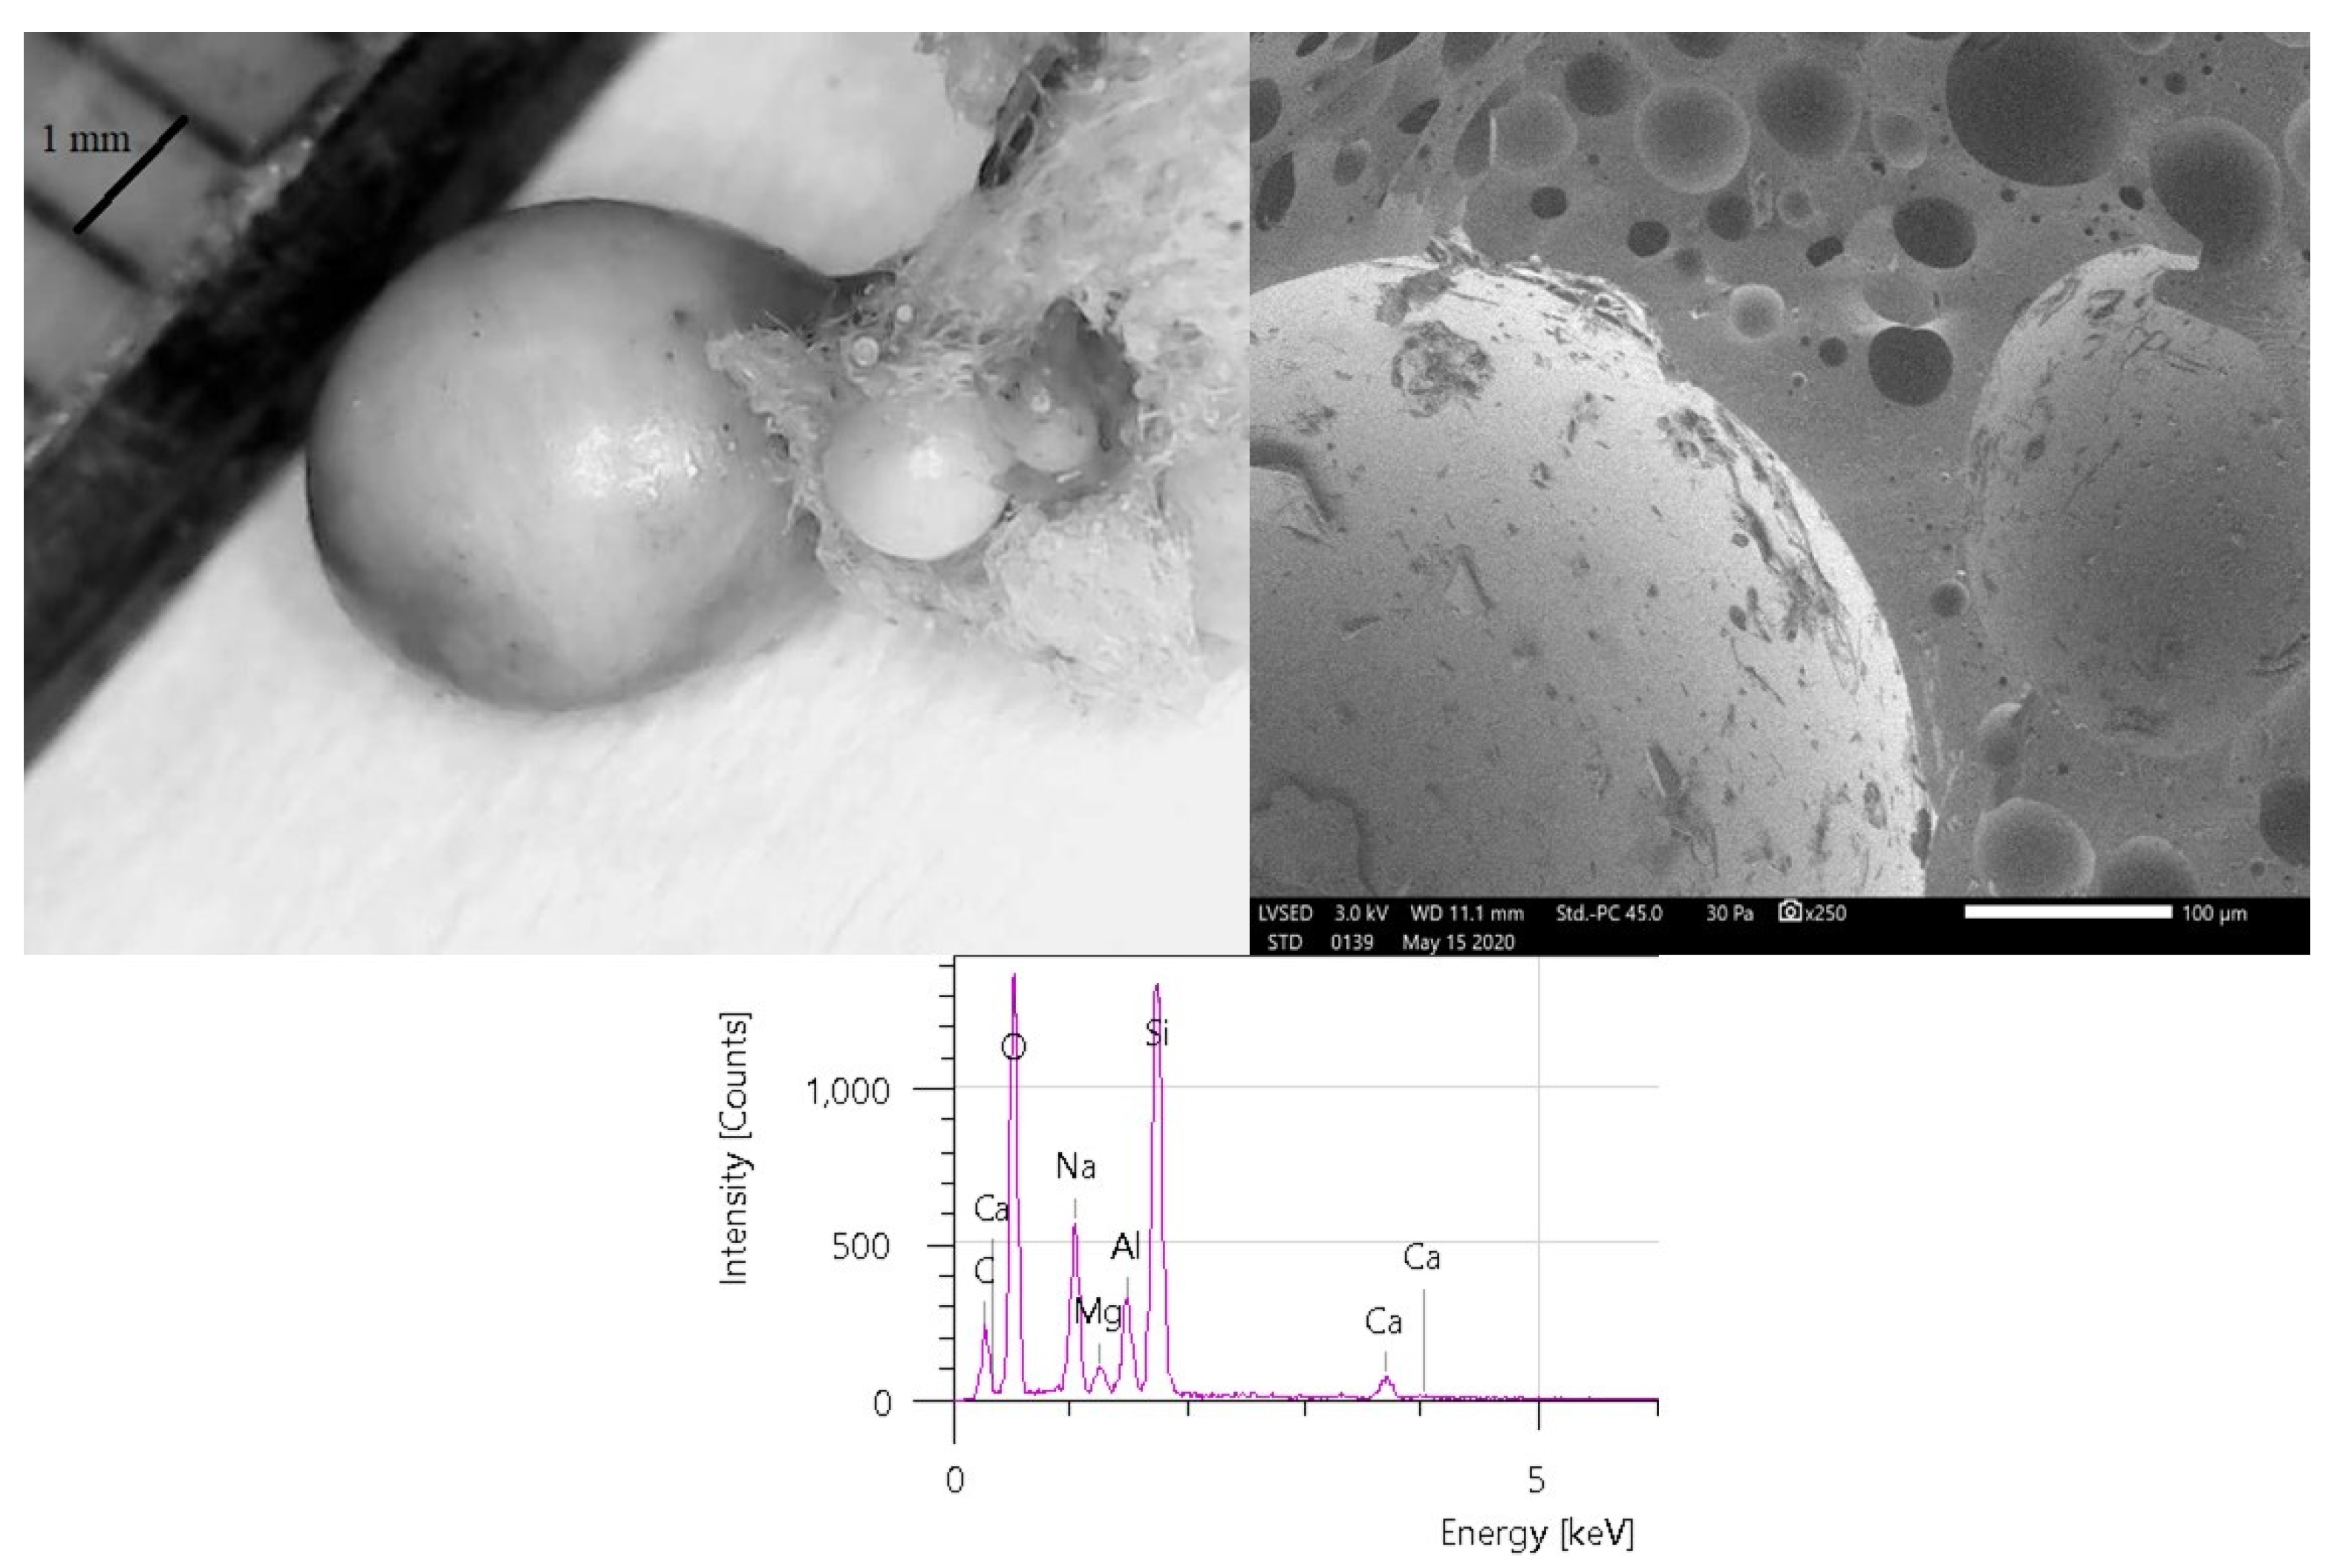
We noticed an interesting phenomenon in the structural changes of the samples after the bomb calorimetry measurements; all the samples took on a spherical shape after their combustion. To clarify this occurrence, the burned samples were analyzed by both scanning electron (at 3 Kv and M = 250×) and optical microscopy (M = 20×).
Figure 9 shows the microscope images and the EDS spectra of the burned samples. On the left-hand side, the optical images of the samples showed a spherical residuum after burning. This was also indicated by the SEM images. Due to the high charge accumulation, the electron microscope had to be operated under a low vacuum. After evacuation to high vacuum (~10−7 mbar), the chamber was filled with high-purity nitrogen up to 0.30 mbar. The observed strong charge accumulation effect suggested that after the calorimetry measurements, the spherical residuum was mostly formed of an oxide alloy. This was also confirmed by the fact that the elemental composition measurements clearly showed increasing oxygen content compared to the measured on the as-prepared samples. It can also be stated from the composition measurements that most of the components remained in the samples, but they diffused out to the surface of the samples.
3.4.2. Differential Scanning Calorimetry Measurement Results
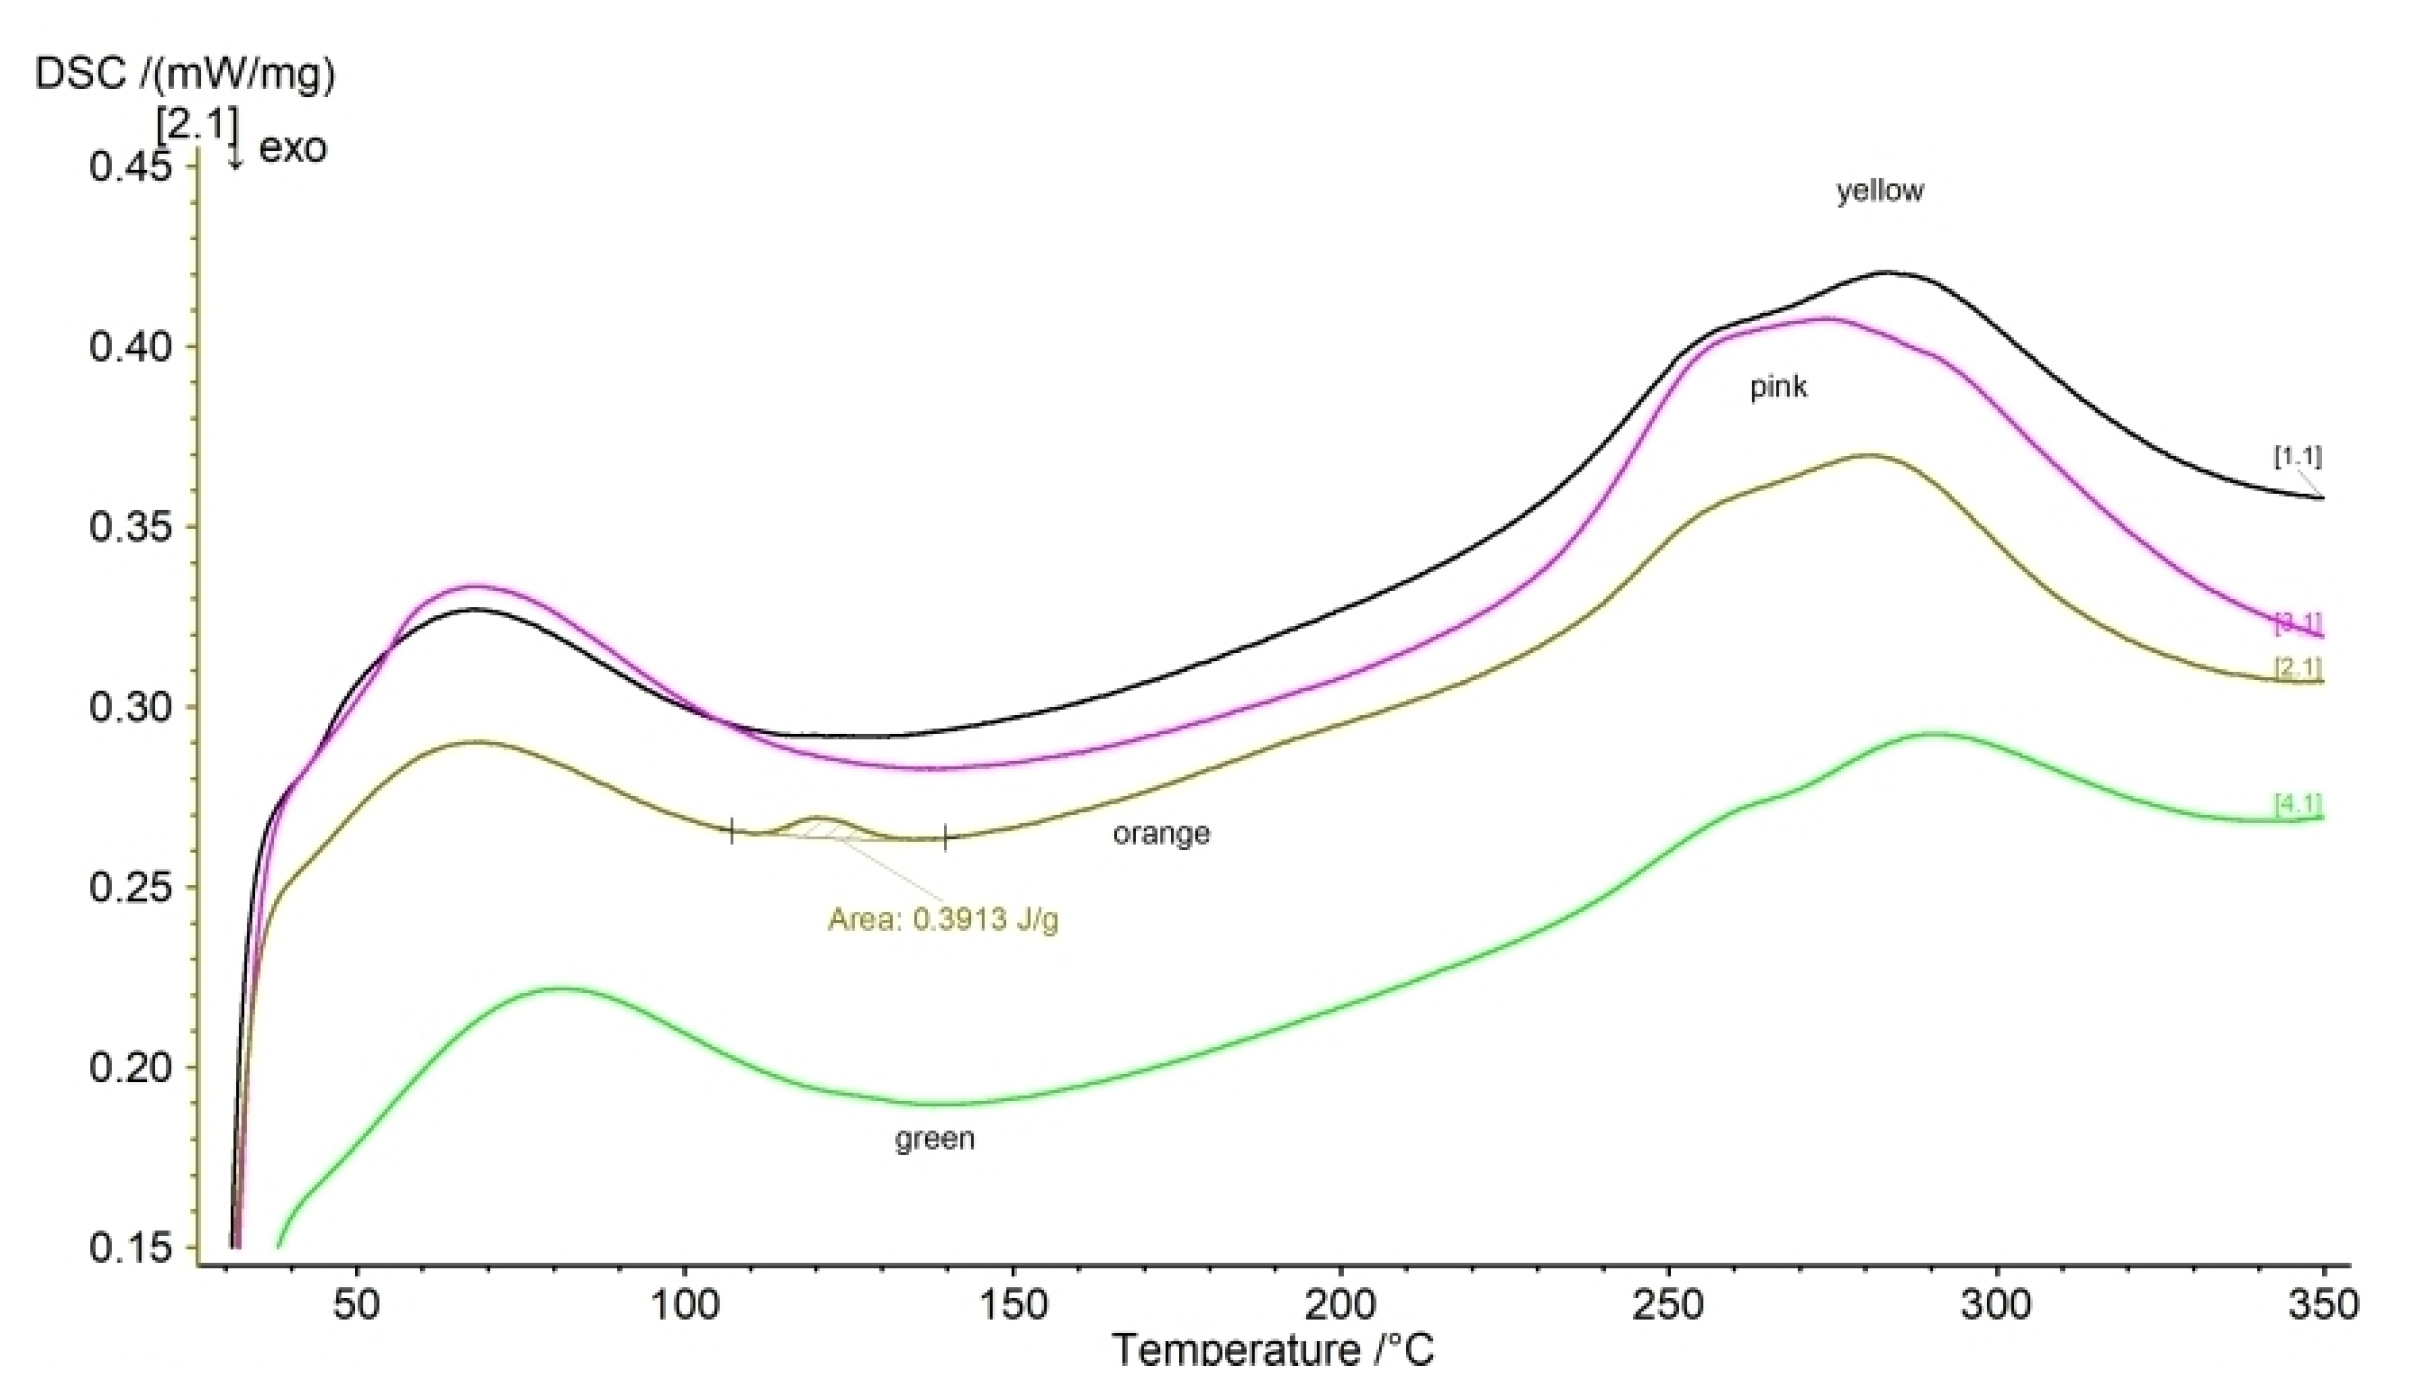
It has been demonstrated that differential scanning calorimetry is a good opportunity to disclose the thermal behavior and degradation of samples [18,37]. In order to correctly understand and reveal the thermal degradation of the samples, differential scanning calorimetry measurements were performed. From the DSC curves in Figure 10, in the 30–350 °C temperature range the curves had a wide peak after the amorphous stage between 50 and 100 °C, and above this, a valley was present in the curves until 170 °C, except in the curve of the orange samples where a small peak (a melting event) at about 110 °C was also shown. It is supposed that this deviation also resulted from the different components of the orange sample (e.g., acryl). Above 110 °C, similar peaks were detected until 350 °C, possibly due to the crystallization (semi-crystalline part) of the samples.
3.5. Raman Spectroscopy Measurement Results
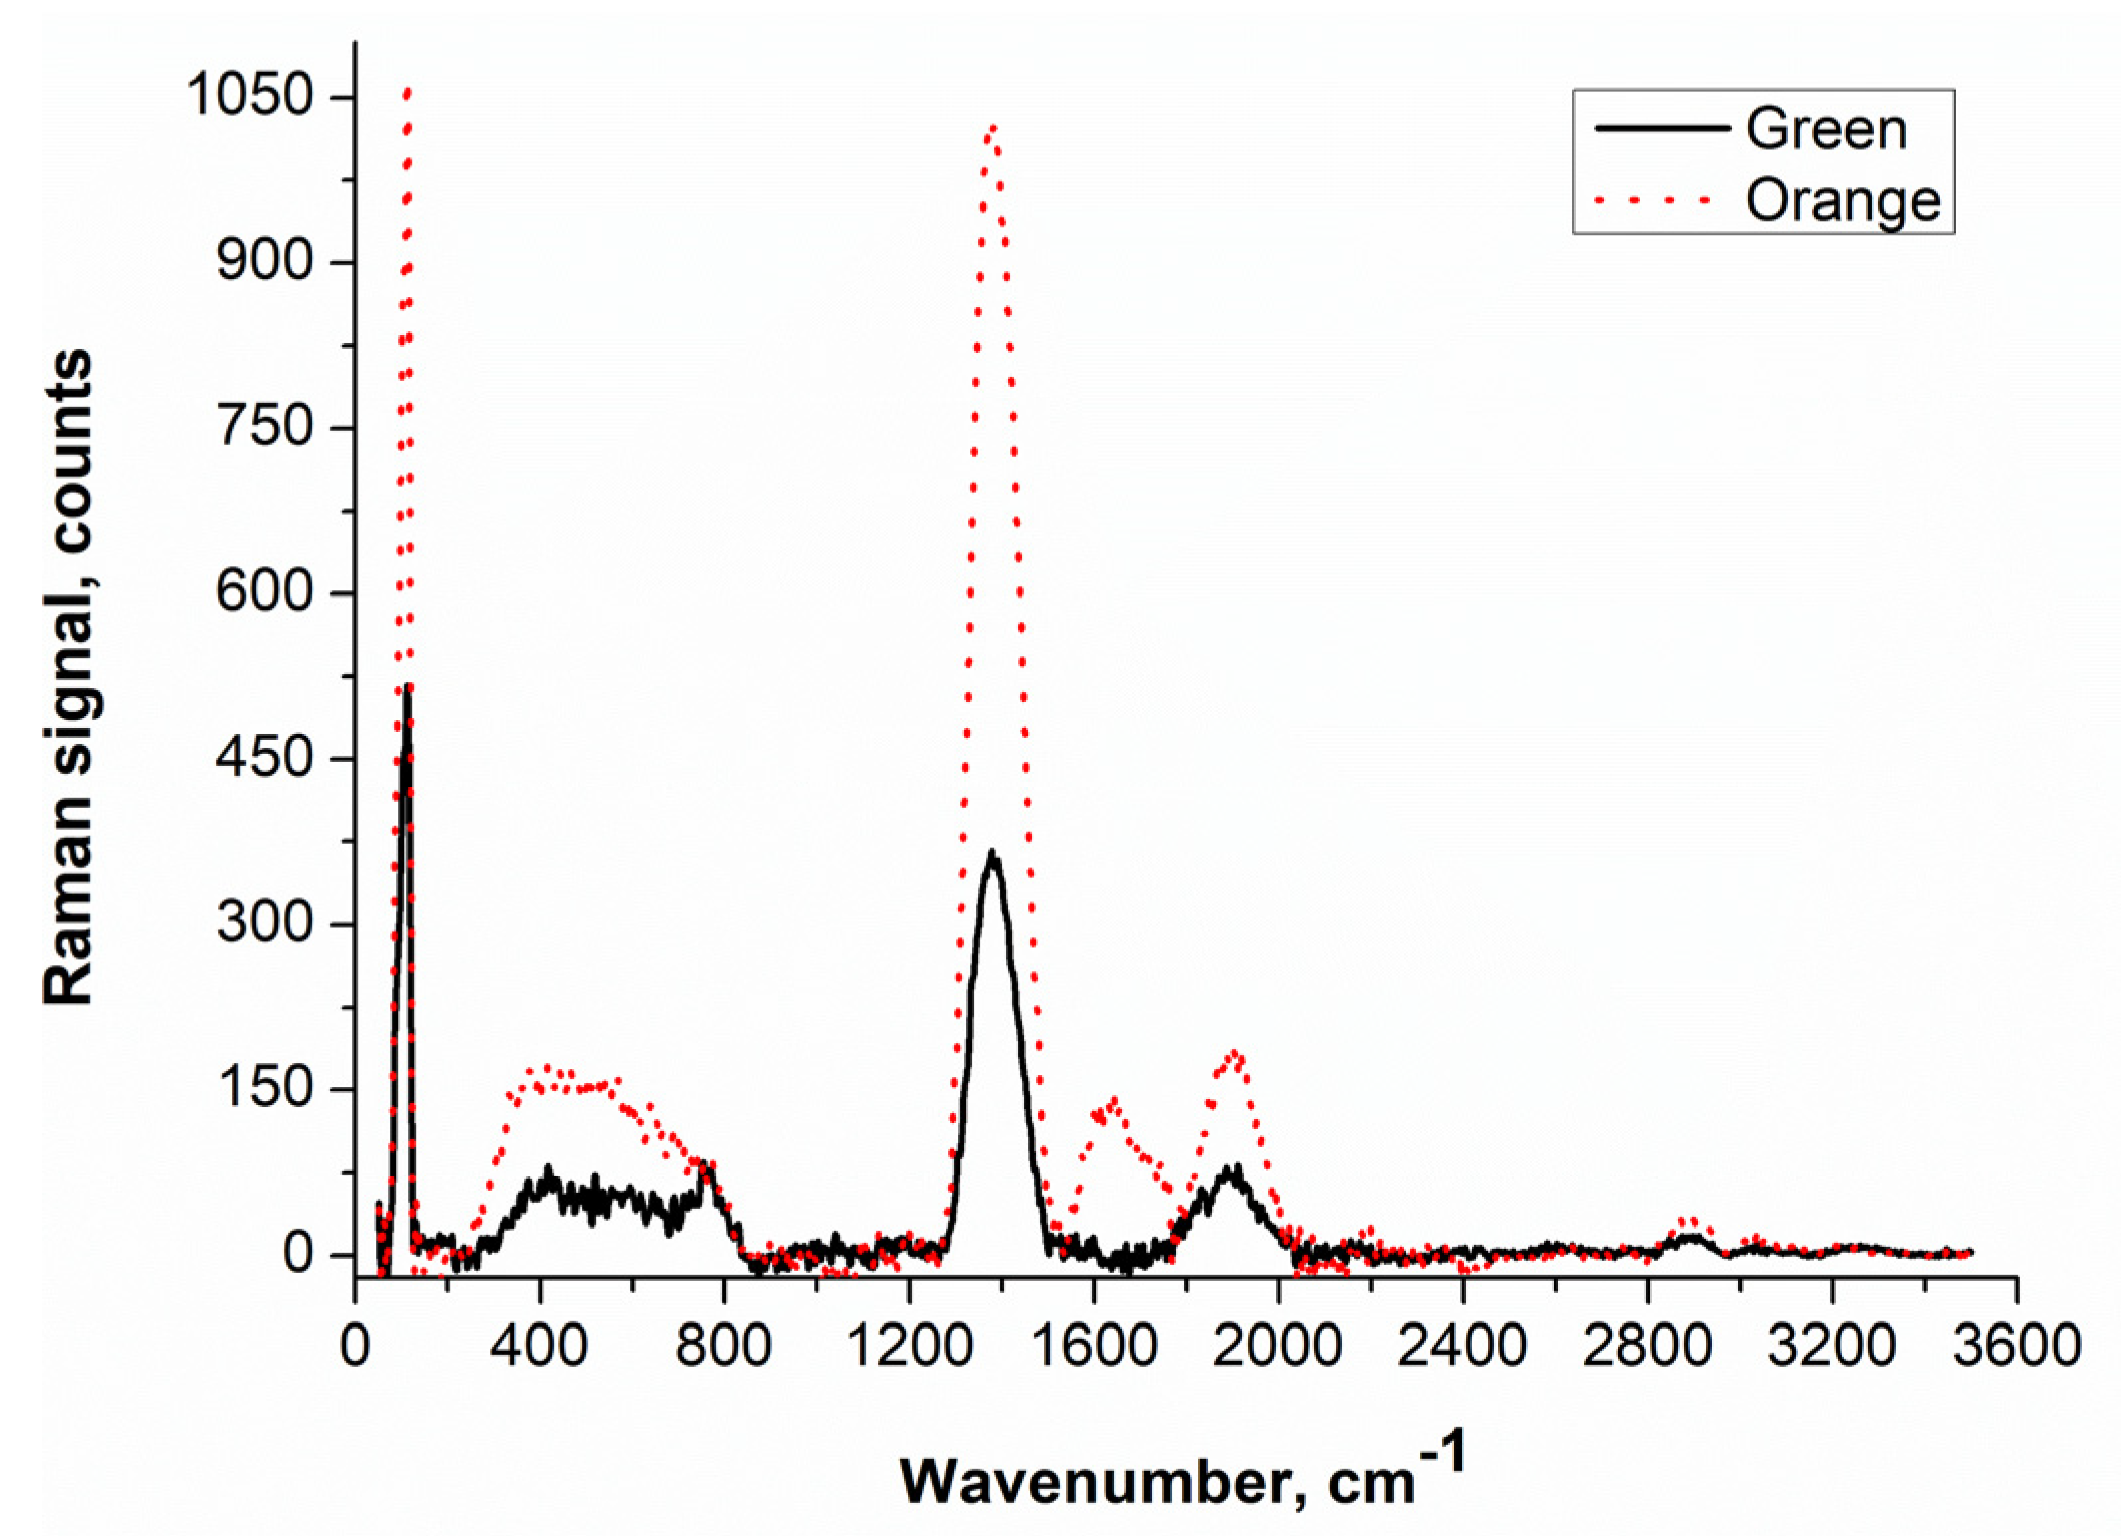
As visible in the DSC spectra, orange samples were suspected to have another component or compound which was not visible in the EDS images. To reveal this compound and the difference in the composition or the bond structure of the orange material compared to the other three, the green and orange samples were examined by Raman microscopy. Figure 11 reports the Raman spectra of the investigated samples. It is necessary to identify both spectra: the red dashed line belongs to the orange sample, while the black continuous line belongs to the green sample.
During the measurement, counts were registered at wavenumbers from 50 to 3600 cm−1. The changes of the main peaks, the Raman bands, are shown in Table 6.
It was established that the boson peak (connected with the metallic content of the samples), the metallic oxide bonds, basic bonds of the glassy network, some organic bonds, and OH modes could be observed in both samples. However, the intensities of the peaks at the same investigation parameters were larger for the orange sample. This could be connected with the higher density of the material. Moreover, the Raman spectra of the orange sample contain peaks associated with acrylic acid: a band at the wavelength of 1637 cm−1 is reported in Table 6. All these structural components and differences could influence the previously shown experimental results. From the Raman spectra, it can also be concluded that all of the samples had an amorphous structure.
4. Conclusions
It is well known that the application of thermal insulation to reduce energy consumption is vital. Laboratory tests of insulation materials are very important for the better characterization and development of new materials. The declared values by the manufacturers are often not complete, which why more and more investigations should be conducted to verify performance. Measurements of the thermal and hygric properties are extremely important to find suitable insulation for any cases. This paper focused on the results of complex laboratory investigations for better understanding of the thermal hygric and morphological properties and behavior of four different micro-fiber glass wool insulation materials under different environmental circumstances. From the measurements, our conclusions are as follows:
- After examining the samples with scanning electron microscopy, it was revealed that the bases of the materials were mainly silicon, calcium, magnesium, sodium, alumina, and carbon, and possibly their oxides. Moreover, some also contained traces of sulfur. The results showed that the mean pore diameter of the cylindrical fibers varied between 0.5 and 7 µm at random locations. The presence of colorized binders was also depicted. The increase in the fiber diameter increased the density and resulted in a better thermal insulation capability;
- Through thermal conductivity measurements, it was revealed that thermal conductivity decreased with increasing density independently from the mean temperature of the samples, but due to their loose-filled structure, unfortunately, they cannot be used in situations where they would be exposed to significant mechanical effects. By only applying a 2 kPa load on the sample, their material thickness decreased. This assay determined the applicability limit of the samples;
- From the specific heat capacity measurements, it was shown that Cp values of the samples fitted in the normal range of insulation materials (~1000 J/kgK);
- From microscopic tests, we found all the samples to be hydrophobic;
- We have characterized sorption isotherm profiles as showing type III isotherms from the BET theory, which defines weak adsorption under low-relative humidity. It must be mentioned that the materials could be used in cases where the relative humidity of the environment is under 70%. It is also notable that the orange sample had the highest amount of adsorbed water, caused mainly by its declared acrylic content;
- From bomb calorimetry measurements, it was clearly shown that the materials were fire retardant and the heat released during combustion was low (2–4 MJ/kg), except for the orange material with about GHC = 5.5 MJ/kg—possibly due to its slightly different components. All the samples took on a spherical shape after their combustion;
- Differential scanning calorimetry measurements were performed on the samples between 30 and 350 °C in order to determine their thermal stability. The shapes of the curves were the same, with a broad peak up to 100 °C; over this temperature, a continuous increase in the DSC indicated that a crystallization process might have taken place. It is also notable that the orange sample had a slight peak near 120 °C, possibly showing melting of one of the components;
- Raman spectroscopy results collated our findings and made them complex. It was revealed through the Raman experiments that the samples had an amorphous glassy bond structure; moreover, the orange sample had additional acrylic acid content.
Author Contributions
Conceptualization, Á.L. and I.C.; methodology, Á.L.; investigation measurements, Á.L. (sorption, hydrophobic, thermal conductivity, specific heat, calorific value, DSC), I.C. (Raman spectroscopy), and A.C. (SEM); writing—original draft preparation, Á.L.; writing—review and editing, Á.L., I.C. and A.C.; supervision, Á.L.; funding acquisition, Á.L. All authors have read and agreed to the published version of the manuscript.
Funding
The research was supported by the Thematic Excellence Programme (TKP2020-IKA-04) of the Ministry for Innovation and Technology in Hungary.
Informed Consent Statement
Not applicable.
Data Availability Statement
Data available on request.
Conflicts of Interest
The authors declare no conflict of interest.
References
- Cheng, Z.; Li, X.; Li, Z.; Si, J.; Xu, S.; Nie, R. Optimal Scheduling Strategy of Building Integrated Photovoltaic Microgrid Considering Virtual Energy Storage. Appl. Sci. 2020, 10, 6176. [Google Scholar] [CrossRef]
- Huang, B.; Lu, W. Experimental Investigation of the Multi-Physical Properties of an Energy Efficient Translucent Concrete Panel for a Building Envelope. Appl. Sci. 2020, 10, 6863. [Google Scholar] [CrossRef]
- Pereira, M.C.; Soares, A.; Flores-Colen, I.; Correiaj, R. Influence of Exposure to Elevated Temperatures on the Physical and Mechanical Properties of Cementitious Thermal Mortars. Appl. Sci. 2020, 10, 2200. [Google Scholar] [CrossRef] [Green Version]
- Capozzoli, A.; Fantucci, S.; Favoino, F.; Perino, M. Vacuum Insulation Panels: Analysis of the Thermal Performance of Both Single Panel and Multilayer Boards. Energies 2015, 8, 2528–2547. [Google Scholar] [CrossRef] [Green Version]
- Moga, L.M.; Bucur, A.; Iancu, I. Current Practices in Energy Retrofit of Buildings. In Environmental and Human Impact of Buildings: An Energetics Perspective; Springer: Berlin/Heidelberg, Germany, 2021; pp. 1–41. [Google Scholar]
- Fort, J.; Koci, J.; Pokorny, J.; Podolka, L.; Kraus, M.; Cerny, R. Characterization of Responsive Plasters for Passive Moisture and Temperature Control. Appl. Sci. 2020, 10, 9116. [Google Scholar] [CrossRef]
- Lakatos, Á. Stability investigations of the thermal insulating performance of aerogel blanket. Energy Build. 2019, 139, 506–516. [Google Scholar] [CrossRef] [Green Version]
- Pedroso, M.; Flores-Colen, I.; Silvestre, J.D.; Gomes, M.G. Nanomaterials’ Influence on the Performance of Thermal Insulating Mortars—A Statistical Analysis. Appl. Sci. 2020, 10, 2219. [Google Scholar] [CrossRef] [Green Version]
- Lakatos, Á. Exceeding the Applicability Limit of Aerogel Super Insulation Materials in Different Environmental Conditions. Appl. Sci. 2020, 10, 7824. [Google Scholar] [CrossRef]
- Berardi, U. The impact of aging and environmental conditions on the effective thermal conductivity of several foam materials. Energy 2019, 182, 777–794. [Google Scholar] [CrossRef]
- Koru, M. Determination of Thermal Conductivity of Closed-Cell Insulation Materials That Depend on Temperature and Density. Arab. J. Sci. Eng. 2016, 41, 4337–4346. [Google Scholar] [CrossRef]
- Miros, A. Thermal Aging Effect on Thermal Conductivity Properties of Mineral Wool Pipe Samples at High Temperature. In Proceedings of the 3rd World Congress on Mechanical, Chemical, and Material Engineering (MCM’17), Rome, Italy, 8–10 June 2017. [Google Scholar]
- Miros, A.; Psiuk, B.; Szpikowska-Sroka, B. Aerogel insulation materials for industrial installation: Properties, and structure of new factory-made products. J. Sol Gel Sci. Technol. 2017, 84, 496–506. [Google Scholar] [CrossRef] [Green Version]
- Semeniuk, B.P.; Göransson, P.; Dazel, O. Dynamic equations of a transversely isotropic, highly porous, fibrous material including oscillatory heat transfer effects. J. Acoust. Soc. Am. 2019, 146, 2540–2551. [Google Scholar] [CrossRef] [PubMed] [Green Version]
- Fangrat, J. On non-combustibility of commercial building materials. Fire Mater. 2017, 41, 99–110. [Google Scholar] [CrossRef]
- Lakatos, Á.; Csík, A.; Csarnovics, I. Experimental verification of thermal properties of the aerogel blanket. Case Stud. Therm. Eng. 2021, 25, 100966. [Google Scholar] [CrossRef]
- Zhu, J.; Zhao, F.; Xiong, R.; Peng, T.; Ma, Y.; Hu, J.; Xie, L.; Jiamg, C. Thermal insulation and flame retardancy of attapulgite reinforced gelatin-based composite aerogel with enhanced strength properties. Comp. Part A Appl. Sci. Manuf. 2020, 138, 106040. [Google Scholar] [CrossRef]
- Wakili, K.G.; Remhof, A. Reaction of aerogel containing ceramic fibre insulation to fire exposure. Fire Mater. 2017, 41, 29–39. [Google Scholar] [CrossRef]
- Boulaoued, I.; Amara, I.; Mhimid, A. Experimental determination of thermal conductivity and diffusivity of new building insulating materials. Int. J. Heat Technol. 2016, 34, 325–331. [Google Scholar] [CrossRef]
- Jelle, B.P. Accelerated climate ageing of building materials, components and structures in the laboratory. J. Mater. Sci. 2012, 47, 6475–6496. [Google Scholar] [CrossRef] [Green Version]
- Berardi, U.; Nosrati, R.H. Long-term thermal conductivity of aerogel-enhanced insulating materials under different laboratory aging conditions. Energy 2018, 147, 1188–1202. [Google Scholar] [CrossRef]
- Semeniuk, B.P.; Göransson, P. Microstructure based estimation of the dynamic drag impedance of lightweight fibrous materials. J. Acoust. Soc. Am. 2017, 141, 1360–1370. [Google Scholar] [CrossRef] [Green Version]
- Jeon, C.K.; Lee, J.S.; Chung, H.; Kim, J.H.; Park, J.P. A Study on Insulation Characteristics of Glass Wool and Mineral Wool Coated with a Polysiloxane Agent. Adv. Mater. Sci. Eng. 2017, 2017, 3938965. [Google Scholar] [CrossRef] [Green Version]
- Hung, W.C.; Horng, R.S.; Shia, R.E. Investigation of thermal insulation performance of glass/carbon fiber-reinforced silica aerogel composites. J. Sol Gel Sci. Technol. 2021, 97, 414–421. [Google Scholar] [CrossRef]
- Chyu, M.C.; Zeng, X.; Ye, L. Performance of fibrous glass pipe insulation subjected to underground water attack. In Proceedings of the American Society of Heating, Refrigerating and Air-Conditioning Engineers (ASHRAE) Winter Meeting, Philadelphia, PA, USA, 24–28 February 1997. [Google Scholar]
- Kodur, V.K.R.; Sultan, M.A.; Latour, J.C.; Leroux, P.; Monette, R.C. Fire Resistance Tests on Cellulose and Glass Fiber Insulated Wood Stud Shear Walls; IRC-IR-806, NRC-CNRC Report; National Research Council of Canada: Ottawa, ON, Canada, 2000. [Google Scholar]
- Vinh, T.L.; Ngoc, S.H.; Nam, S.G.; Jae, Y.K. Insulation System Using High-Temperature Fibrous Insulation Materials. Heat Trans. Eng. 2019, 40, 1523–1538. [Google Scholar]
- Mao, S.; Kan, A.; Huang, Z.; Zhu, W. Prediction of thermal performance of vacuum insulation panels (VIPs) withmicro-fiber core materials. Mater. Today Commun. 2020, 22, 100786. [Google Scholar] [CrossRef]
- Alam, M.; Singh, H.; Limbachiya, M.C. Vacuum Insulation Panels (VIPs) for building construction industry—A review of the contemporary developments and future directions. Appl. Energy 2011, 88, 3592–3602. [Google Scholar] [CrossRef] [Green Version]
- Schiavoni, S.; D’Alessandro, F.; Bianchi, F.; Asdrubali, F. Insulation materials for the building sector: A review and comparative analysis. Renew. Sustain. Energy Rev. 2016, 62, 988–1011. [Google Scholar] [CrossRef]
- Unic, R. Carbon footprint of thermal insulation materials in building envelopes. Energy Effic. 2017, 10, 1511–1528. [Google Scholar]
- Asdrubali, F. The role of Life Cycle Assessment (LCA) in the design of sustainable buildings: Thermal and sound insulating materials. In Proceedings of the Euronoise 2009, Edinburg, UK, 26–28 October 2009. [Google Scholar]
- Ayadi, A.; Stiti, N.; Boumchedda, K.; Rennai, H.; Lerari, Y. Elaboration and characterization of porous granules based on waste glass. Powder Technol. 2011, 208, 423–426. [Google Scholar] [CrossRef]
- ISO. EN ISO 10456: 277 Standard: Building Materials and Products. Hygrothermal Properties. Tabulated Design Values and Procedures for Determining Declared and Design Thermal Values; ISO: Geneve, Switzerland, 2007. [Google Scholar]
- ISO. EN ISO 8301:1991, Thermal Insulation—Determination of Steady-State Thermal Resistance and Related Properties—Heat Flow Meter Apparatus; ISO: Geneve, Switzerland, 1991. [Google Scholar]
- Lakatos, Á.; Csarnovics, I. Influence of thermal annealing on structural properties of silica aerogel super insulation material. J. Therm. Anal. Calorim. 2020, 142, 321–329. [Google Scholar] [CrossRef] [Green Version]
- Kočí, V.; Maděra, J.; Trník, A.; Černý, R. Heat transport and storage processes in differential scanning calorimeter: Computational analysis and model validation. Int. J. Heat Mass. Transf. 2019, 136, 355–364. [Google Scholar] [CrossRef]
- ISO. ISO 12571:2013 Hygrothermal Performance of Building Materials and Products—Determination of Hygroscopic Sorption Properties; ISO: Geneve, Switzerland, 2013. [Google Scholar]
- Novak, V.; Zach, J. Study of the efficiency and durability of hydrophobization modifications of building elements. IOP Conf. Ser. Mater. Sci. Eng. 2019, 583, 012032. [Google Scholar] [CrossRef]
- Nagy, B.; Simon, K.T.; Nemes, R. Effect of built-in mineral wool insulations durability on its thermal and mechanical performance. J. Therm. Anal. Calorim. 2020, 139, 169–181. [Google Scholar] [CrossRef] [Green Version]
- Silligardi, C.; Miselli, P.; Francia, E.; Lassinantti, G. Temperature-induced microstructural changes of fiber-reinforced silica aerogel (FRAB) and rock wool thermal insulation materials: A comparative study. Energy Build. 2017, 138, 80–87. [Google Scholar] [CrossRef]
- Dieckmann, E.; Onsiong, R.; Nagy, B.; Sheldrick, L.L.; Cheeseman, C. Valorization of Waste Feathers in the Production of New Thermal Insulation Materials. Waste Biomass. Valorization 2021, 12, 1119–1131. [Google Scholar] [CrossRef] [Green Version]
- Wakili, K.G.; Binder, B.; Vonbank, R. A simple method to determine the specific heat capacity of thermal insulations used in building construction. Energy Build. 2003, 35, 413–415. [Google Scholar] [CrossRef]
- Brunauer, S.; Deming, L.S.; Teller, E. On a theory of Van der Waals adsorption of gases. J. Am. Chem. Soc. 1940, 62, 1723–1732. [Google Scholar] [CrossRef]
- Avadhesh, K.Y.; Prabhakar, S. A Review on Structure of Glasses by Raman Spectroscopy. RSC Advs. 2015, 5, 67583–67609. [Google Scholar] [CrossRef]
- Hussin, R.; Salim, M.; Alias, N.; Abdullah, M.; Abdullah, S.; Ahmad, F.; Hamdan, S.; Hamdan, S.; Nor, M.; Yusuf, M. Vibrational Studies of Calcium Magnesium Ultraphosphate Glasses. Malays. J. Fund. Appl. Sci. 2014, 5, 41–53. [Google Scholar] [CrossRef] [Green Version]
- Todica, M.; Rázvan, S.; Pop, C.; Loredana, O. IR and Raman Investigation of Some Poly(acrylic) Acid Gels in Aqueous and Neutralized State. Acta Phys. Pol. A 2015, 128, 128–135. [Google Scholar] [CrossRef]
- Available online: https://spectrabase.com/spectrum/2Ntd4smFCEW (accessed on 25 October 2020).
- Ferreira, G.B.; Comerlato, M.N.; Wardell, J.L.; Hollauer, E. Vibrational spectra of bis(dmit) complexes of main group metals: IR, Raman and ab initio calculations. J. Braz. Chem. Soc. 2004, 15, 951–963. [Google Scholar] [CrossRef] [Green Version]
- Rodriguez, U.A. Fundamentals and Characterization of Fungally Modified Polysaccharides for the Production of Bio-Plastics. Ph.D. Thesis, University of Toronto, Toronto, ON, Canada, 2010. [Google Scholar]
Figure 1.
The hydrophobicity.

Figure 2.
(a) SEM and EDS results of the pink sample with a Gaussian distribution of the diameter of the measured fiber. (b) SEM and EDS results of the yellow sample with a Gaussian distribution of the diameter of the measured fiber. (c) SEM and EDS results of the green sample with a Gaussian distribution of the diameter of the measured fiber. (d) SEM and EDS results of the orange sample with a Gaussian distribution of the diameter of the measured fiber.


Figure 3.
The fiber diameter vs. as-received density.

Figure 4.
Thermal conductivity measurement results.

Figure 5.
The measured thermal conductivities at different temperatures.

Figure 6.
Hydrophobic tests of the samples.

Figure 7.
Sorption isotherms.

Figure 8.
The gross combustion heat of the samples.

Figure 9.
The optical microscopy (left), scanning microscopy (right), and EDS measurement results (down) of the burned sample.
Figure 9.
The optical microscopy (left), scanning microscopy (right), and EDS measurement results (down) of the burned sample.

Figure 10.
The DSC curves.

Figure 11.
Raman spectra of the green and orange samples.


Table 1.
The density and thickness of the as-received samples.
| Insulation Material | As-Received Density [kg/m3] st. dev. ±3% | As-Received Thickness [cm] st. dev. ±2% |
|---|---|---|
| Pink | 6.8 | 4.08 |
| Yellow | 8.4 | 4.35 |
| Green | 10 | 4.7 |
| Orange | 16.5 | 3 |
Table 2.
The results of the fitted Gaussian model on each sample.
| Gaussian Model | ||||||||
|---|---|---|---|---|---|---|---|---|
| Pink | st. Err. | Yellow | st. Err. | Green | st. Err. | Orange | st. Err. | |
| Adj. R-squared | 0.986 | 0.88 | 0.879 | 0.765 | ||||
| xc | 2.37 | 0.025 | 2.25 | 0.093 | 2.66 | 0.0944 | 2.23 | 0.125 |
| sigma | 0.66 | 0.029 | 0.86 | 0.11 | 0.87 | 0.123 | 0.742 | 0.15 |
| Calculated mean | 2.36 | 0.725 | 2.47 | 1.02 | 2.87 | 1.18 | 2.8 | 1.27 |
Table 3.
The declared thermal conductivities.
| Density [kg/m3] | |||
|---|---|---|---|
| Temperature [°C] | 6.70 | 9.60 | 19.00 |
| Thermal Conductivity [W/mK] | |||
| 10 | 0.036 | 0.035 | |
| 24 | 0.04 | 0.036 | 0.029 |
| 38 | 0.043 | 0.039 | 0.03 |
| 93 | 0.055 | 0.051 | 0.036 |
| 149 | 0.068 | 0.061 | |
| 204 | 0.092 | 0.079 | |
Table 4.
Thicknesses during the thermal conductivity measurements.
| Insulation Material | Thickness at 20% Compression [cm] | Thickness at 2 kPa [cm] |
|---|---|---|
| Pink | 3.30 | 0.44 |
| Yellow | 3.65 | 0.74 |
| Green | 3.66 | 0.91 |
| Orange | 2.25 | 0.82 |
Table 5.
The measured specific heat capacities.
| Specific Heat Capacity [J/kgK] | ||||
|---|---|---|---|---|
| Temperature [°C] | Pink | Yellow | Green | Orange |
| 10 | 740 | 1170 | 955 | 976 |
Table 6.
Identification of the signs in Raman spectra.
| Peak Position, [cm−1] | Vibration Mode | Comparison |
|---|---|---|
| 100, 110 | Boson peak and glass network [45] | Appeared in both samples, larger intensity for the orange sample |
| 480 | Mg–O, Ca–O, and Si–O [45,46] | Appeared in both samples, larger intensity for the orange sample |
| 1378 | Basic bonds of the glassy network [45] | Appeared in both samples, larger intensity for the orange sample |
| 1637 | Bonds of acrylic acid [47,48] | Appeared only for the orange sample |
| 1894 | Metal complex bond [49] | Appeared in both samples, larger intensity for the orange sample |
| 2892 and 3045 | Symmetric and anti-symmetric stretching vibrations of CH, CH2, or CH3 groups [50] | Appeared in both samples, larger intensity for the orange sample |
| 3230 | Stretching modes of OH [50] | Appeared in both samples, with the same intensity |
Publisher’s Note: MDPI stays neutral with regard to jurisdictional claims in published maps and institutional affiliations. |
© 2021 by the authors. Licensee MDPI, Basel, Switzerland. This article is an open access article distributed under the terms and conditions of the Creative Commons Attribution (CC BY) license (https://creativecommons.org/licenses/by/4.0/).
Share and Cite
MDPI and ACS Style
Lakatos, Á.; Csarnovics, I.; Csík, A. Systematic Analysis of Micro-Fiber Thermal Insulations from a Thermal Properties Point of View. Appl. Sci. 2021, 11, 4943. https://0-doi-org.brum.beds.ac.uk/10.3390/app11114943
AMA Style
Lakatos Á, Csarnovics I, Csík A. Systematic Analysis of Micro-Fiber Thermal Insulations from a Thermal Properties Point of View. Applied Sciences. 2021; 11(11):4943. https://0-doi-org.brum.beds.ac.uk/10.3390/app11114943
Chicago/Turabian StyleLakatos, Ákos, István Csarnovics, and Attila Csík. 2021. "Systematic Analysis of Micro-Fiber Thermal Insulations from a Thermal Properties Point of View" Applied Sciences 11, no. 11: 4943. https://0-doi-org.brum.beds.ac.uk/10.3390/app11114943
Note that from the first issue of 2016, this journal uses article numbers instead of page numbers. See further details here.