
Towards a Fast, Open-Path Laser Hygrometer for Airborne Eddy Covariance Measurements


1
Physikalisch-Technische Bundesanstalt, Bundesallee 100, 38116 Brunswick, Germany
2
Institut für Flugführung der Technischen Universität Braunschweig, Hermann-Blenk-Str. 27, 38108 Brunswick, Germany
3
Department of Mechanical Engineering, Technical University of Darmstadt, Reactive Flows and Diagnostics, Otto-Berndt-Str. 3, 64287 Darmstadt, Germany
*
Author to whom correspondence should be addressed.
Appl. Sci. 2021, 11(11), 5189; https://0-doi-org.brum.beds.ac.uk/10.3390/app11115189
Submission received: 12 May 2021
/
Revised: 28 May 2021
/
Accepted: 31 May 2021
/
Published: 3 June 2021
(This article belongs to the Special Issue Diode Laser Spectroscopy – Robust Sensing for Environmental and Industrial Applications)
Abstract
:Water vapor fluxes play a key role in the energy budget of the atmosphere, and better flux measurements are needed to improve our understanding of the formation of clouds and storms. Large-scale measurements of these fluxes are possible by employing the eddy correlation (EC) method from an aircraft. A hygrometer used for such measurements needs to deliver a temporal resolution of at least 10 Hz while reliably operating in the harsh conditions on the exterior of an aircraft. Here, we present a design concept for a calibration-free, first-principles, open-path dTDLAS hygrometer with a planar, circular and rotationally symmetric multipass cell with new, angled coupling optics. From our measurements, the uncertainty of the instrument is estimated to be below 4.5% (coverage factor k = 1). A static intercomparison between a dTDLAS prototype of the new optics setup and a traceable dew point mirror hygrometer was conducted and showed a systematic relative deviation of 2.6% with a maximal relative error of 2.2%. Combined with a precision of around 1 ppm at tropospheric conditions, the newly designed setup fulfills the static precision and accuracy requirements of the proposed airborne EC hygrometer.
1. Introduction
Water vapor is the most important greenhouse gas, and plays a key role in the energy budget of the atmosphere [1]. Water vapor fluxes transport latent heat vertically from the Earth’s surface into the atmosphere, and they are a major contributor to many meteorological processes, including the formation of clouds, storms and hurricanes [2]. The eddy correlation (EC) method can be used to measure these fluxes by correlating the vertical component of the wind vector with fast and accurate concentration values [3]. This method is commonly used in stationary setups, such as meteorological EC flux towers, to determine the water vapor flux from the ground into the atmosphere at one specific location [4,5]. To study fluxes on larger scales, EC measurements from airplanes are possible but are significantly more challenging from a technical and metrological standpoint [6,7]. The requirements for a hygrometer used for airborne EC measurements are (A) a high temporal resolution of more than 100 milliseconds (i.e., a 10 Hz rep rate), (B) a large dynamic range from below 100 to 30,000 µmol/mol (ppm, parts per million), (C) resistance to vibrations and large temperature variations, (D) small aerodynamic drag for the components mounted outside the aircraft and (E) compatibility with aviation licensing requirements [3,8].
A large number of airborne hygrometers have been demonstrated in the past. Besides the sensor type, the use of a closed- or open-path optical cell is one of the key characteristics of an airborne hygrometer. Notable instruments that utilize an extractive sampling system and a closed-path cell on aircrafts are described in [6,7,9,10,11,12,13,14,15,16,17]. Although closed-path instruments, such as SEALDH-II, can reach a spectrometric temporal resolution of up to 140 Hz, the response time of the instrument is significantly limited by the transport of the gas sample to the optical cell, particularly by adsorption/desorption processes in the sampling system [11]. The SPARC Report and AquaVIT-1 intercomparison both found sampling problems to be one of the major contributors to the observed deviation between hygrometers for atmospheric studies of 10% and more [18,19]. Whereas instruments with open-path optical cells avoid sampling and adsorption limitations, open-path instruments that are used on aircrafts face significant design and approval challenges due to the added complexity of conditions on the exterior of the aircraft [9,20,21,22,23]. The multi-channel, multi-phase Hygrometer for Atmospheric Investigation (HAI), developed for the German research aircraft HALO [24], demonstrated the simultaneous use of an open- and closed-path cell and showed the benefits of an open-path system, especially when fast concentration fluctuations are of interest (e.g., during EC measurements) [9,25].
Here, we present a design concept for a new calibration-free direct tunable diode laser absorption spectroscopy (dTDLAS) hygrometer, particularly optimized for airborne open-path EC measurements using a rotationally symmetric optical multipass cell. The multipass cell forms a particularly thin optical plane that is normal to the direction of the flow, thereby minimizing the transition time through the light sheet. This new design is integrated in a setup with fast pressure and temperature probes close to the optical plane. The spectroscopic performance of the newly designed, compact optics setup is validated by static intercomparison with an SI-traceable dew point mirror (DPM) hygrometer.
2. Materials and Methods
Figure 1 shows the schematic setup of the dTDLAS hygrometer. The light emitted by the fiber-coupled distributed feedback (DFB) diode laser is wavelength modulated by a laser current driver to sweep the absorption line at 1369 nm. The laser beam is collimated inside the optics and passes through the multipass cell onto the InGaAs detector [26]. A transimpedance amplifier is used to amplify the photodiode signal and to prepare it for its digitization before the data are stored and evaluated with a PC.
2.1. dTDLAS Methodology
The basic principle of dTDLAS has been described in detail in [27,28]. The relationship between the intensity of the laser beam and the absorption due to water vapor inside the cell can be described by an extended version of the Lambert–Beer law [29]:
In addition to the terms of the standard Lambert–Beer equation for light intensity without absorption , the line strength , the normalized line shape function , the absorber number density N and the optical pathlength L, the equation also accounts for stray light and background radiation reaching the detector, as well as broadband transmission losses , caused, e.g., by mirror contamination. The water vapor amount fraction c can be calculated by combining Equation (1) with the definition of the concentration in amount fraction and the ideal gas law to
The individual contributions to the amount fraction c are directly measured quantities, such as the temperature T, the pressure p and the absorption signal . Constant parameters, such as the Boltzmann constant and characteristic parameters of the instrument, such as the optical pathlength L and the dynamic tuning behavior of the laser , are also used. The spectral line strength is taken from the HITRAN database, as well as the measured data from previous publications [25,30,31,32,33]. The emission offset is measured at the beginning of each scan when the laser current is below the laser threshold so that the laser output is zero, rendering it possible to determine the zero line. The remaining parameters can be fitted using a Voigt profile for the line shape and a polynomial term for the baseline i.e., the light intensity at the detector without absorption.
Because the quantities T, p, L, S(T) and are all traceable to SI units, the use of the complete physical model given in Equation (2) establishes a direct link between the concentration and the SI, without the need to calibrate the dTDLAS hygrometer with, e.g., a water vapor generator.
The used spectral line at 1369 nm (7299.43 ) was selected because of (A) minimal cross-sensitivities to other species and a minimized amount of neighboring lines; (B) the compatibility with cost-effective, high-quality telecommunication lasers and detectors; and (C) since accurate and validated line data are available [25,30,31,32]. While the cross-sensitivities to other species are minimal, there are still 18 weaker water spectral lines influencing the main line at 7299.43 . To keep the degrees of freedom of the fit low, which improves the fit stability, most of the parameters of the 19 spectral lines are precalculated using spectral line data as well as measured temperature and pressure.
Only the line area, the Lorentz full width at half maximum (FWHM) of the Voigt profile and the line position of the main line, as well as the three coefficients of the baseline polynomial, are left as free-fitting parameters. In the case of challenging environmental conditions, the stability of the fit could be further increased by pre-calculating the Lorentz FWHM. This method is described in detail in [9,11,25,32].
Figure 2a shows typical raw photodiode signals for 1759 ppm and 7324 ppm water vapor amount fractions. Here, the laser is modulated at a frequency of 139.8 Hz, resulting in a duration of 3.6 ms per up ramp. The model given in Equation (2) is fitted to the raw signal, and the baseline polynomial and the fit to the raw signal are shown. The use of a complete physical model for the description of the absorption signal enables a good estimation of the baseline, even if the edges of the absorption line extend beyond the fit range, as is the case with the signal at 7324 ppm. Figure 2b shows the optical density data (OD, also known as absorbance; derived from the data in Figure 2a) fitted with a Voigt profile. The residual between the measured data and the fit is plotted underneath. The time axis of the raw data is converted into a wavenumber axis by applying the measured non-linear dynamic tuning behavior of the laser. The W-shape in the residuals can be traced to a known deficiency of the Voigt profile when fitting absorption signals at high signal-to-noise-ratios [10,25]. This systematic effect does not influence the optical resolution of the instrument, as it only depends on the line shape and the used Voigt profile and is, therefore, neglected when evaluating the optical resolution of the spectrometer. This is achieved by introducing the local standard deviation () inside the blue box in Figure 2b to capture the statistical optical noise of the instrument. By dividing the maximum peak optical density () by the local standard deviation , a signal-to-noise-ratio of 6507 can be determined.
2.2. Optics Design
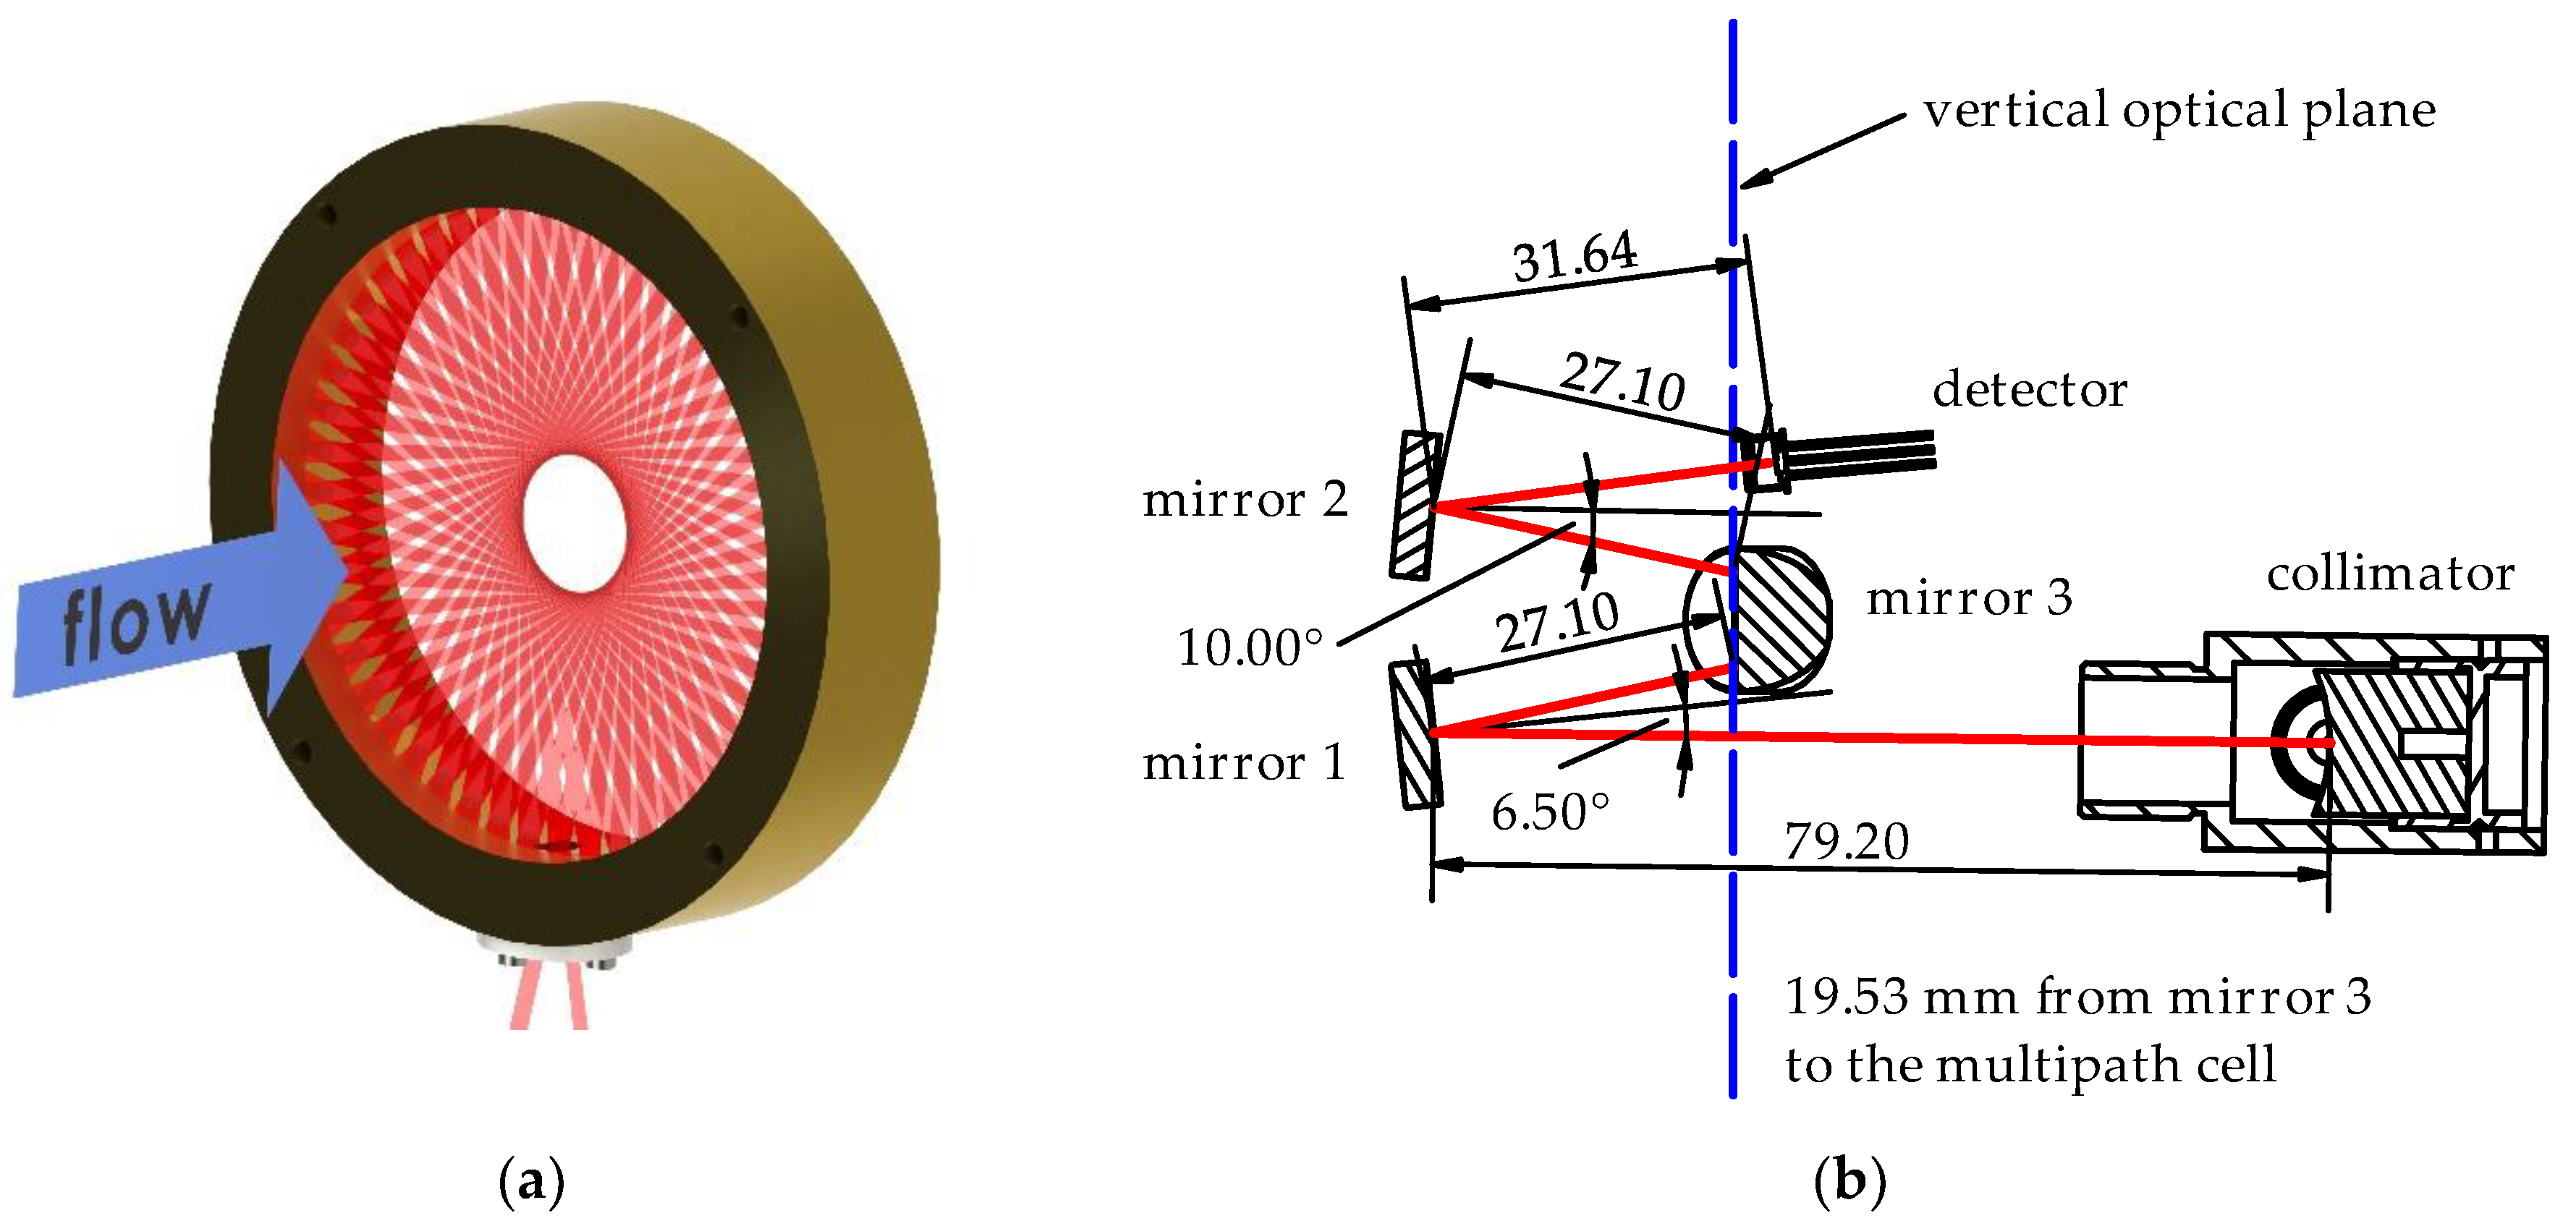
The optical setup of the dTDLAS hygrometer is centered around the rotationally symmetric multipass cell shown in Figure 3a [26]. The laser beam passes the cell a total of 51 times in a star polygon pattern, resulting in a total pathlength close to 4 m. The optical measurement region is very planar and thin, has a maximum thickness of around 3 mm directly in front of the gold-coated mirror surface and decreases towards the center of the cell due to the confocal mirror geometry. To reduce the effects of stray light and to prevent interferences between neighboring reflections, an aperture mask with 51 elongated holes was designed and optimized and placed inside the multipass cell. In contrast to the commercially available cell, we designed an open-path configuration in order to take full advantage of the thin optical plane that is oriented perpendicular to the direction of the flow. This open-path circular cell configuration minimizes gas transport times and the effects of gas transition broadening while simultaneously avoiding delayed sensor response by gas sampling problems and, in particular, the adsorption/desorption that is usually associated with sampling systems for atmospheric water vapor [6,34].
Figure 3b shows the optical components of a new, “angled” laser-to-cell-coupling-setup located underneath the multipass cell. The beam is collimated using an off-axis parabolic mirror and focused into the cell with a concave, gold-coated mirror. A planar mirror (mirror 3 in Figure 3b) is used to reflect the beam upwards into the multipass cell and directs the outcoming beam from the cell onto the second concave mirror, which focuses it on the detector. This setup enables the optical plane of the secondary optics to be oriented at a 90° angle to the optical plane inside the multipass cell. This new geometry drastically reduces the surface area normal to the direction of the air flow, which is indispensable to minimizing the aerodynamic drag on the instrument when using it on an aircraft. All optical components are reflective, which reduces interference fringes caused by unwanted reflections on lenses. The two windows at the entrance of the multipass cell and in front of the detector are anti-reflection coated and oriented at an angle to avoid light reflections back into the optical path.
2.3. Uncertainty Estimation
The individual contributions to the laser absorption model provided in Equation (2) can be used to derive an uncertainty budget for this dTDLAS hygrometer. The most relevant uncertainty contribution is the gas temperature, which is measured by calibrated PT100 sensors. Because of possible temperature variations between the sensor and the optical plane of the multipass cell, the relative uncertainty of the gas temperature is estimated to be 0.33% (≈1 K). The uncertainty of the pressure is estimated to be 0.2% (≈2 hPa). The optical pathlength is determined by the CAD model and is estimated to have an uncertainty of 0.5% (≈2.1 cm). The uncertainty of the line strength is provided by the HITRAN database with 3.5% [31]. Inhomogeneities in the concentration along the optical path, and between the optical plane and the sample point of an extractive reference instrument used for validation of the dTDLAS are conservatively estimated to be 1.0%. The uncertainty of the line area (integrated term in Equation (2)) is influenced by the tuning of the laser (1%) and the quality of the fit (2%). The combined contribution of both of these parameters is 2.2%. This results in a total uncertainty of 4.5% (k = 1) for the amount fraction (concentration), which is similar to comparable dTDLAS hygrometers [25]. The dominating contributors to the total instrument uncertainty are the line strength (65.7%), followed by the line area (fit and tuning) (26.8%) and spatial inhomogeneities (5.3%). The optical pathlength accounts for 1.3%, and the temperature and pressure for 0.6 and 0.2% of the total uncertainty.
3. Static Validation with a Dew Point Mirror and Spectroscopic Performance
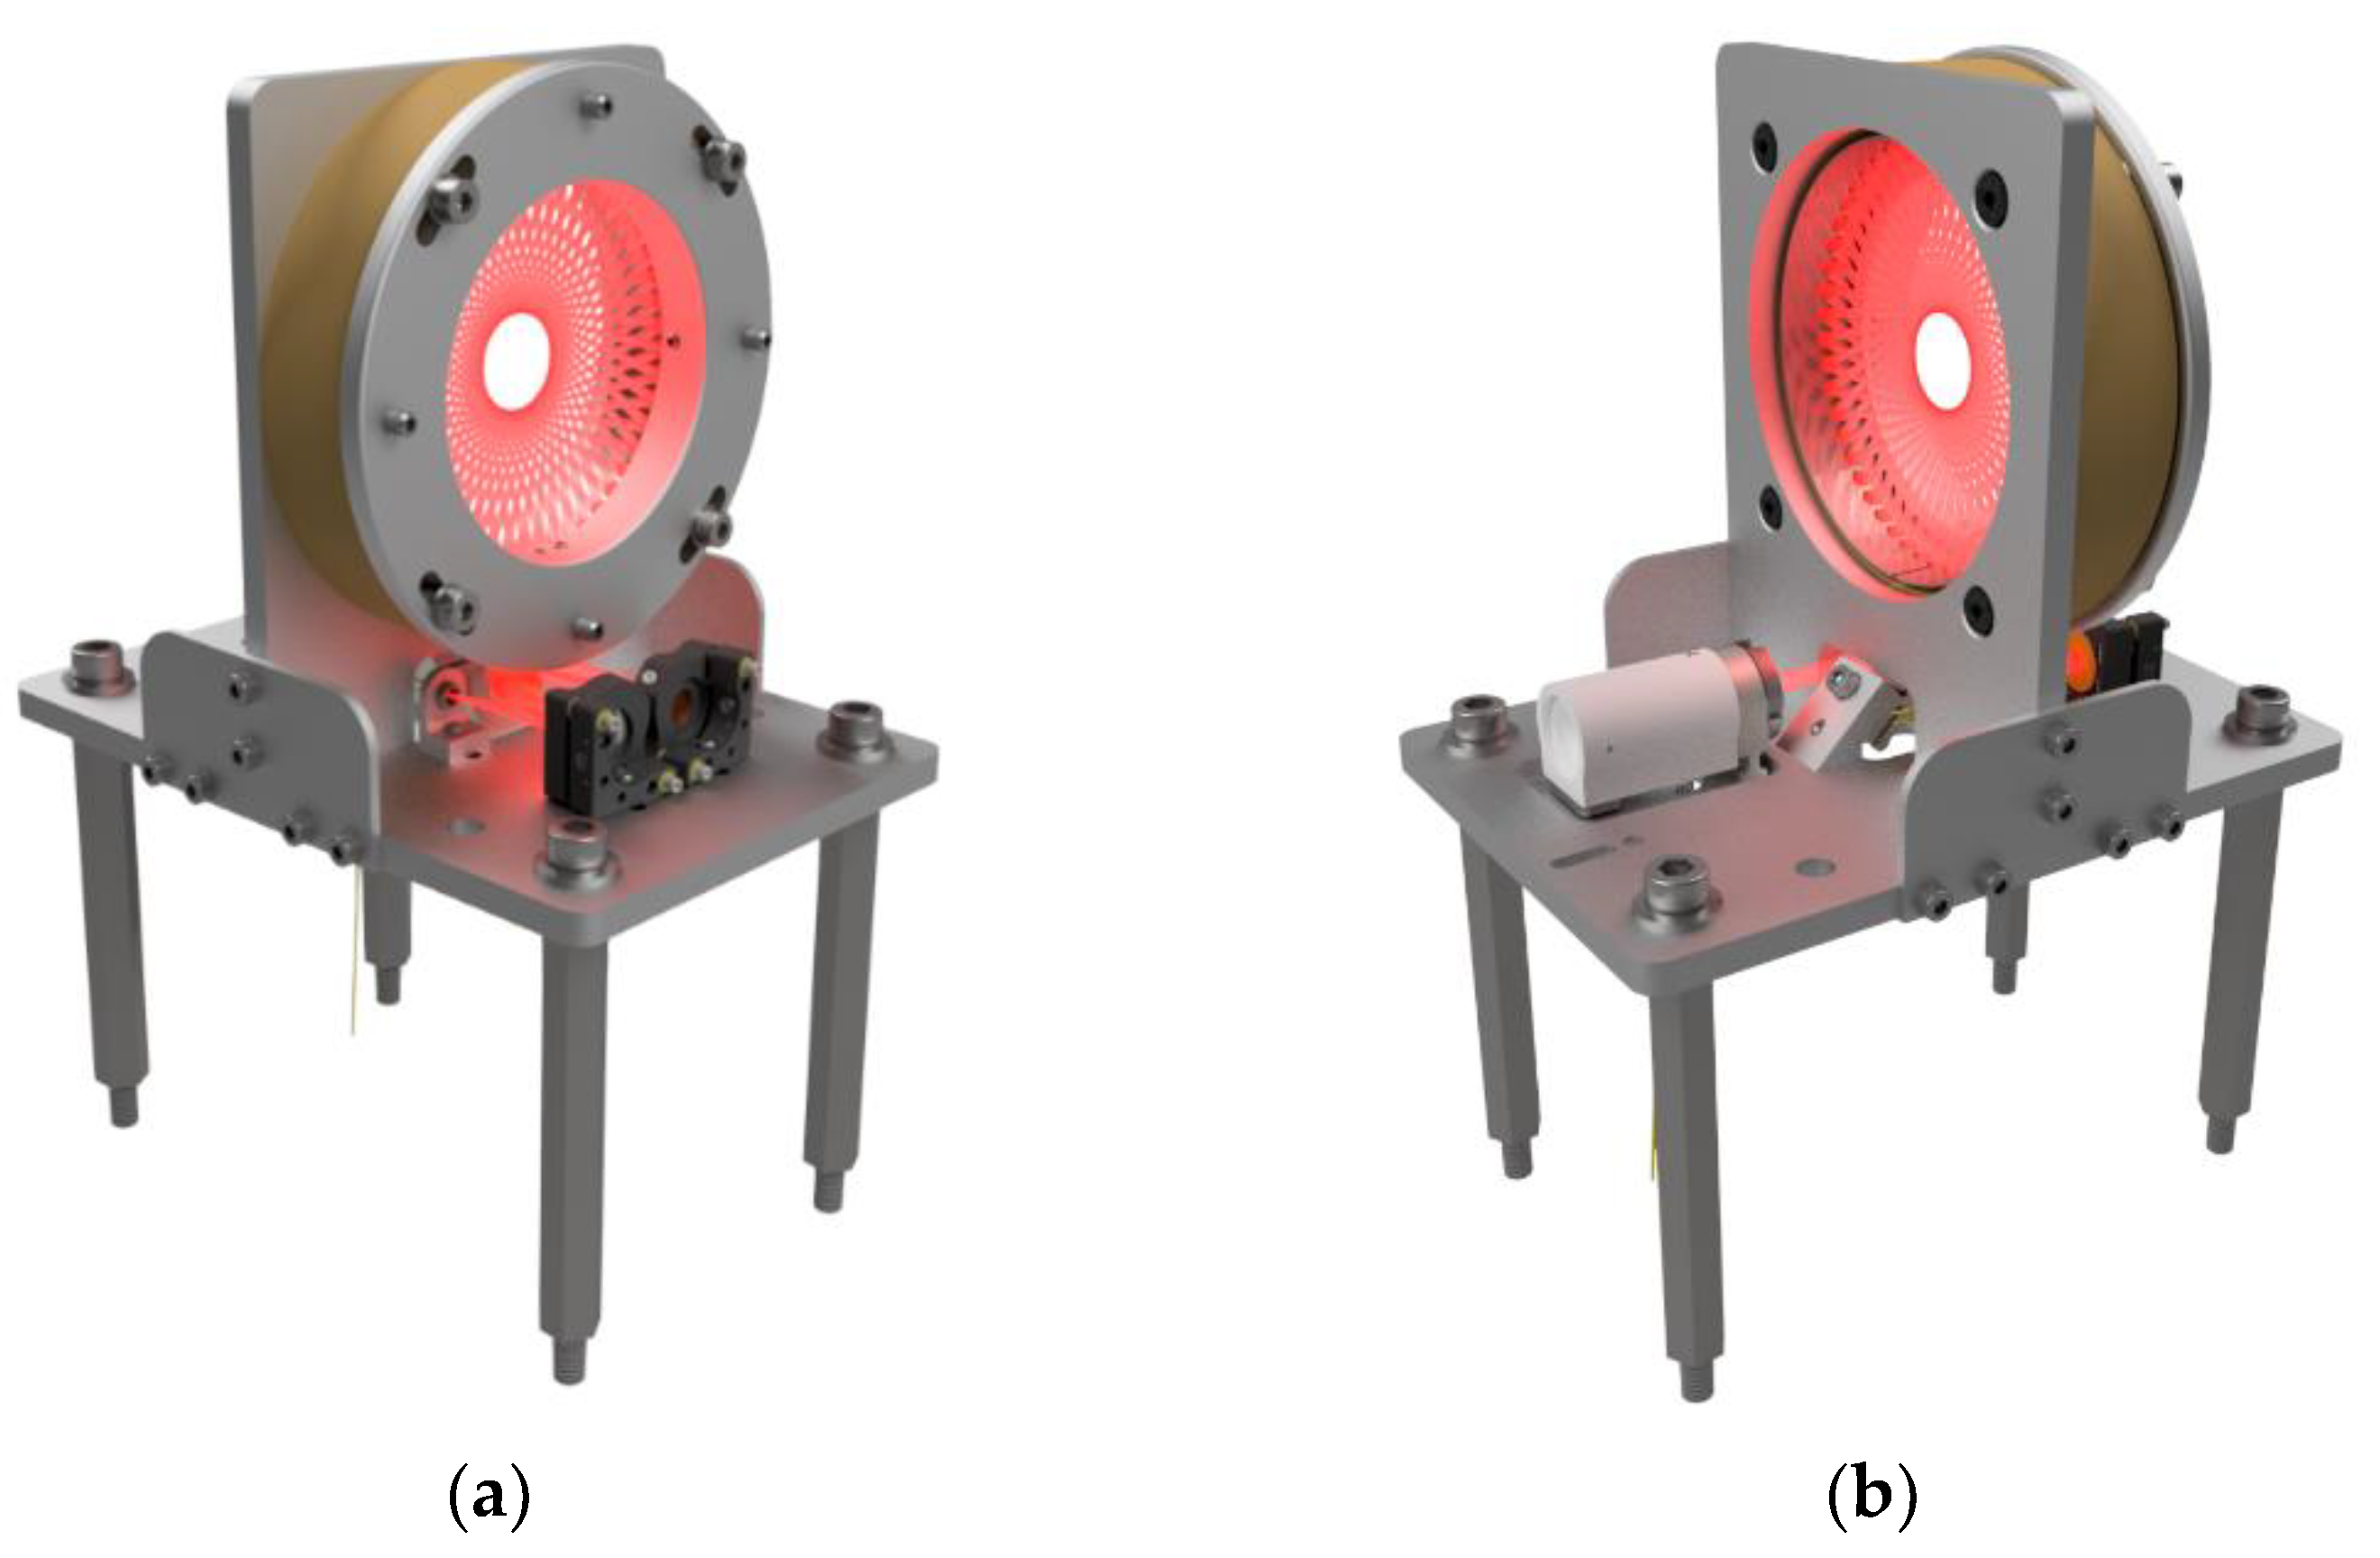
The spectroscopic performance and accuracy of the new optics design are validated with constant gas flow, but under stable amount fraction conditions with a spectrometer prototype with the angled coupling optics in an open-path configuration. For this, the prototype, shown in Figure 4, is placed inside a climate chamber that is continuously purged with dry air. In this configuration, we reduced the concentration from above 12,000 ppm to below 1000 ppm over the course of four hours. The climate chamber was heated to 30 °C to reduce adsorption effects on the chamber walls. The slow concentration change makes it possible to use a dew point mirror (DPM) hygrometer as an SI-traceable reference. The inlet of the DPM, as well as temperature and pressure sensors, was placed near the optical plane of the multipass cell.
Figure 5 shows a linear regression of the dTDLAS and DPM measurements between 1300 ppm and 11,500 ppm. The systematic deviation between both instruments is 2.61% with a good linearity, as indicated by the -value being close to one. The maximum relative deviation between dTDLAS and DPM is 2.2%. All observed deviations are well within the predicted uncertainty of 4.5% for the dTDLAS hygrometer and 2.5% for the DPM. It should be noted that an automatic mirror check of the DPM and the subsequent slow stabilization of the dew point temperature made it necessary to exclude the data between 2600 ppm and 6000 ppm from the regression due to non-equilibrated conditions.
To investigate the spectroscopic performance of the instrument, two water amount fractions, one for the lower and one for the upper end of the regression shown in Figure 5, are analyzed. The laser was modulated at a frequency of 139.8 Hz. The data acquisition hardware used in this static test can evaluate approximately 10% of the scanned absorption profiles. Ten of these recorded profiles are then averaged before the first-principles evaluation method described in Section 2.1 is applied. The data for each absorption profile shown in Figure 6 were acquired over a period of 0.72 s, with an effective total measuring time of 0.036 s. A good estimate of the precision of the instrument can be obtained by dividing the concentration by the signal-to-noise ratio (also called noise equivalent concentration, NEC). As the focus of this evaluation is the performance of the newly designed optics, the influence of the discrepancies between the line shape and the Voigt profile is excluded using the local standard deviation . In Figure 6a, the NEC at 1321 ppm is 1.01 ppm, and in Figure 6b, the NEC at 11,542 ppm is 0.86 ppm. To compare these results with other hygrometers, the precision is normalized with the length of the optical path and the square root of the temporal bandwidth (1.4 Hz). This results in 3.6 at 1321 ppm and 3.0 at 11,542 ppm.
4. Conclusions and Outlook to the Airborne Application
The novel concept of an airborne eddy correlation dTDLAS hygrometer with a thin, planar, rotationally symmetric multipass cell in an open-path configuration offers several benefits, such as small gas transit times, no sampling errors and high temporal resolution, particularly in combination with a calibration-free, first-principles data evaluation. Airborne water vapor flux measurements using the EC method would greatly benefit from this proposed instrument. The measurement uncertainty of this laser hygrometer is estimated to be less than 4.5% (k = 1), with the largest individual contributors being the spectral line data (65.7%) and the fitted line area (26.8%). The first step toward an airborne instrument was made by validating our newly designed, compact, 90°-angled optics setup under static conditions by comparison with an SI-traceable dew point mirror hygrometer. The linear regression between the uncalibrated first-principles dTDLAS and the calibrated DPM showed, over the range from 1300 to 11,500 ppm, an average deviation of the correlation slope from unity of 2.6%. The maximal relative error was 2.2%. The spectroscopic performance was evaluated by analyzing two absorbance profiles at low (1321 ppm) and high (11,542 ppm) amount fractions. Averaging 10 subsequently recorded profiles, the signal-to-local noise ratio is 1306 and 13,430 at 1321 ppm and 11,542 ppm, respectively. The NEC is approximately 1 ppm at 1321 ppm and 11,542 ppm, which can be used as a first estimate of the precision of the instrument. The high precision combined with the good agreement, with a traceable reference without any calibration, indicates that the designed optics setup will be suitable for airborne EC measurements.
4.1. Next Steps
In order to also fulfill the dynamic requirements for EC measurements, the dTDLAS data acquisition rate needs to be optimized. This will be achieved by increasing the laser scan repetition rate to around 1 kHz (several kHz are possible [35]) and by enhancing the data throughput by capturing and evaluating all scanned absorption profiles. These optimizations will enable further improvements in the precision of the instrument by increasing the number of pre-averaged scans while maintaining a temporal resolution above 10 Hz. The dynamic response of the hygrometer will be characterized and validated using a fast step change generator [36,37].
4.2. Outlook to the Airborne Instrument
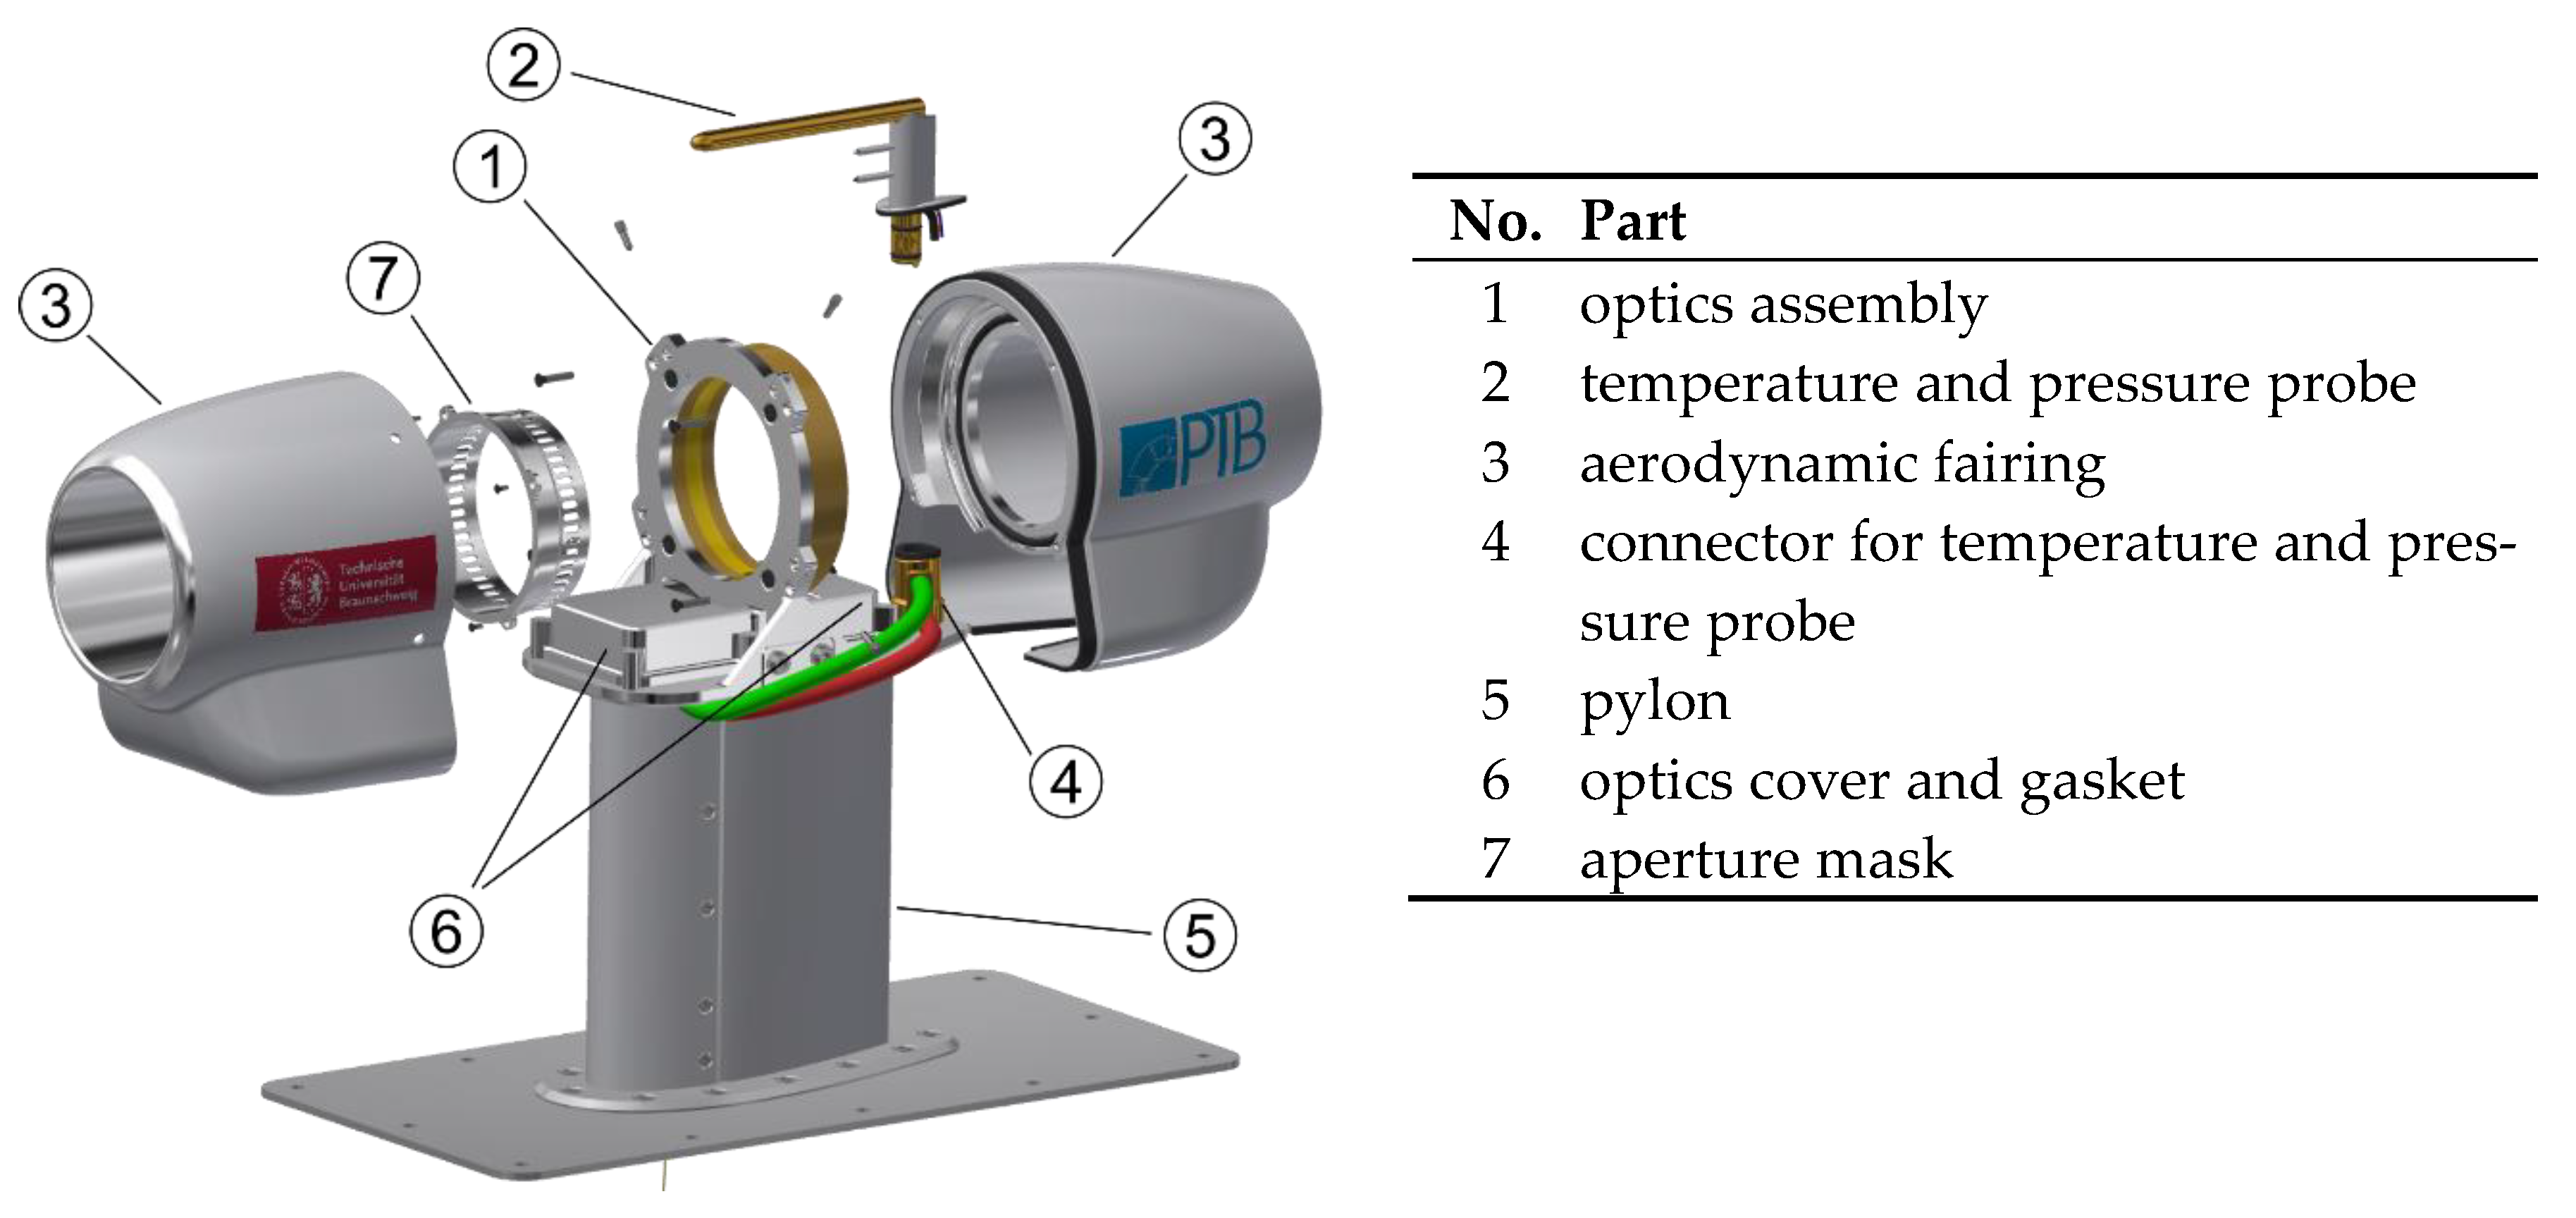
For airborne EC measurements using our planar cell setup, we developed a low air drag concept for an open-path EC laser hygrometer to be used on the outside of the airplane fuselage. Figure 7 shows an explosion view of the design of this airborne EC instrument. The hygrometer is designed around the optics assembly (1) containing the statically validated optical setup, which is covered (6) and can be continuously purged with dry air to reduce the effects of parasitic absorption [25]. The temperature and pressure probe consists of a heated pitot-static tube combined with a thermocouple and a PT100 for fast and accurate temperature measurements. The pitot-static tube is mounted inside the optical multipass cell such that the tube passes through the “hole” at the center of the beam pattern visible in Figure 3a and Figure 4. This placement enables static pressure measurements inside the optical measurement plane. CFD simulations were used to optimize aerodynamic fairing (3) and to minimize the pressure and velocity differences in the optical plane compared to the free air flow. The inlet of the fairing is heatable and made of aluminum to prevent icing and to reduce absorption. The hygrometer is designed for an average indicated airspeed of 75 m/s, and the current length of the pylon (5) and the baseplate are optimized for the Cessna F406 research aircraft of the TU-Braunschweig.
Author Contributions
Conceptualization, V.E., F.W. and A.L.; methodology, V.E.; formal analysis, F.W., J.N. and V.E.; data curation, F.W. and H.B.; writing—original draft preparation, F.W.; writing—review and editing, A.L., V.E., J.N. and H.B.; visualization, F.W.; supervision, V.E. All authors have read and agreed to the published version of the manuscript.
Funding
This research received no external funding.
Institutional Review Board Statement
Not applicable.
Informed Consent Statement
Not applicable.
Data Availability Statement
The data of the instrument comparison are available from the authors of PTB upon request.
Conflicts of Interest
The authors declare no conflict of interest.
References
- Kiehl, J.T.; Trenberth, K.E. Earth’s Annual Global Mean Energy Budget. Bull. Amer. Meteor. Soc. 1997, 78, 197–208. [Google Scholar] [CrossRef] [Green Version]
- Ludlam, F.H. Clouds and Stormshere; Pennsylvania State University Press: University Park, MD, USA, 1980; ISBN 02-710-05157. [Google Scholar]
- Wendisch, M.; Brenguier, J.-L. Airborne Measurements for Environmental Research: Methods and Instruments; WILEY-VCH Verlag GmbH & Co. KGaA: Weinheim, Germany, 2013; ISBN 978-3-527-40996-9. [Google Scholar]
- Ohtaki, E.; Matsui, T. Infrared device for simultaneous measurement of fluctuations of atmospheric carbon dioxide and water vapor. Boundary-Layer Meteorol. 1982, 24, 109–119. [Google Scholar] [CrossRef]
- Chatterjee, D.; Nayak, A.K.; Vijayakumar, S.; Debnath, M.; Chatterjee, S.; Swain, C.K.; Bihari, P.; Mohanty, S.; Tripathi, R.; Shahid, M.; et al. Water vapor flux in tropical lowland rice. Environ. Monit. Assess. 2019, 191, 550. [Google Scholar] [CrossRef] [PubMed]
- Desjardins, R.L.; MacPherson, J.I.; Schuepp, P.H.; Karanja, F. An evaluation of aircraft flux measurements of CO2, water vapor and sensible heat. Boundary-Layer Meteorol. 1989, 47, 55–69. [Google Scholar] [CrossRef]
- Brilouet, P.-E.; Durand, P.; Canut, G. The marine atmospheric boundary layer under strong wind conditions: Organized turbulence structure and flux estimates by airborne measurements. J. of Geophys. Res. Atmos. 2017, 122, 2115–2130. [Google Scholar] [CrossRef]
- Lampert, A.; Hartmann, J.; Pätzold, F.; Lobitz, L.; Hecker, P.; Kohnert, K.; Larmanou, E.; Serafimovich, A.; Sachs, T. Comparison of Lyman-alpha and LI-COR infrared hygrometers for airborne measurement of turbulent fluctuations of water vapour. Atmos. Meas. Tech. 2018, 11, 2523–2536. [Google Scholar] [CrossRef] [Green Version]
- Buchholz, B.; Afchine, A.; Klein, A.; Schiller, C.; Krämer, M.; Ebert, V. HAI, a new airborne, absolute, twin dual-channel, multi-phase TDLAS-hygrometer: Background, design, setup, and first flight data. Atmos. Meas. Tech. 2017, 10, 35–57. [Google Scholar] [CrossRef] [Green Version]
- Buchholz, B.; Böse, N.; Ebert, V. Absolute validation of a diode laser hygrometer via intercomparison with the German national primary water vapor standard. Appl. Phys. B 2014, 116, 883–899. [Google Scholar] [CrossRef]
- Buchholz, B.; Kallweit, S.; Ebert, V. SEALDH-II-An Autonomous, Holistically Controlled, First Principles TDLAS Hygrometer for Field and Airborne Applications: Design-Setup-Accuracy/Stability Stress Test. Sensors 2016, 17, 68. [Google Scholar] [CrossRef] [PubMed]
- Busen, R.; Buck, A.L. A High-Performance Hygrometer for Aircraft Use: Description, Installation, and Flight Data. J. Atmos. Oceanic Technol. 1995, 12, 73–84. [Google Scholar] [CrossRef] [Green Version]
- Helten, M.; Smit, H.G.J.; Sträter, W.; Kley, D.; Nedelec, P.; Zöger, M.; Busen, R. Calibration and performance of automatic compact instrumentation for the measurement of relative humidity from passenger aircraft. J. Geophys. Res. 1998, 103, 25643–25652. [Google Scholar] [CrossRef]
- Meyer, J.; Rolf, C.; Schiller, C.; Rohs, S.; Spelten, N.; Afchine, A.; Zöger, M.; Sitnikov, N.; Thornberry, T.D.; Rollins, A.W.; et al. Two decades of water vapor measurements with the FISH fluorescence hygrometer: A review. Atmos. Chem. Phys. 2015, 15, 8521–8538. [Google Scholar] [CrossRef] [Green Version]
- Sargent, M.R.; Sayres, D.S.; Smith, J.B.; Witinski, M.; Allen, N.T.; Demusz, J.N.; Rivero, M.; Tuozzolo, C.; Anderson, J.G. A new direct absorption tunable diode laser spectrometer for high precision measurement of water vapor in the upper troposphere and lower stratosphere. Rev. Sci. Instrum. 2013, 84, 74102. [Google Scholar] [CrossRef]
- Tátrai, D.; Bozóki, Z.; Smit, H.; Rolf, C.; Spelten, N.; Krämer, M.; Filges, A.; Gerbig, C.; Gulyás, G.; Szabó, G. Dual-channel photoacoustic hygrometer for airborne measurements: Background, calibration, laboratory and in-flight intercomparison tests. Atmos. Meas. Tech. 2015, 8, 33–42. [Google Scholar] [CrossRef] [Green Version]
- Beaton, S.P.; Spowart, M. UV Absorption Hygrometer for Fast-Response Airborne Water Vapor Measurements. J. Atmos. Ocean. Technol. 2012, 29, 1295–1303. [Google Scholar] [CrossRef]
- Kley, D.; Russell, J.M.; Phillips, C. WCRP, 113. SPARC assessment of upper tropospheric and stratospheric water vapour. World Meteorol. Organ. Geneva 2000, 1043, 113. [Google Scholar]
- Fahey, D.W.; Gao, R.-S.; Möhler, O.; Saathoff, H.; Schiller, C.; Ebert, V.; Krämer, M.; Peter, T.; Amarouche, N.; Avallone, L.M.; et al. The AquaVIT-1 intercomparison of atmospheric water vapor measurement techniques. Atmos. Meas. Tech. 2014, 7, 3177–3213. [Google Scholar] [CrossRef] [Green Version]
- Diskin, G.S.; Podolske, J.R.; Sachse, G.W.; Slate, T.A. Open-path airborne tunable diode laser hygrometer. In Proceeding SPIE 4817; Diode Lasers and Applications in Atmospheric Sensing: Seattle, WA, USA; International Society for Optics and Photonics: Ringham, WA, USA, 2002; pp. 196–204. [Google Scholar]
- May, R.D. Open-path, near-infrared tunable diode laser spectrometer for atmospheric measurements of H2O. J. Geophys. Res. 1998, 103, 19161–19172. [Google Scholar] [CrossRef]
- Roths, J.; Busen, R. Development of a laser in situ airborne hygrometer (LISAH). Infrared Phys. Technol. 1996, 37, 33–38. [Google Scholar] [CrossRef]
- Zondlo, M.A.; Paige, M.E.; Massick, S.M.; Silver, J.A. Vertical cavity laser hygrometer for the National Science Foundation Gulfstream-V aircraft. J. Geophys. Res. 2010, 115. [Google Scholar] [CrossRef]
- MISSION DLR Portal. DLR Research Aircraft HALO. Available online: https://www.dlr.de/content/en/missions/halo.html (accessed on 29 April 2021).
- Buchholz, B. Entwicklung, Primärvalidierung und Feldeinsatz neuartiger, kalibrierungsfreier Laser-Hygrometer für Forschungsflugzeuge; TU Darmstadt: Darmstadt, Germany, 2014. [Google Scholar]
- Tuzson, B.; Mangold, M.; Looser, H.; Manninen, A.; Emmenegger, L. Compact multipass optical cell for laser spectroscopy. Opt. Lett. OL 2013, 38, 257–259. [Google Scholar] [CrossRef] [PubMed]
- Ebert, V.; Wolfrum, J. Absorption. In Optical Measurements: Techniques and Applications, 2nd ed.; Mayinger, F., Feldmann, O., Eds.; Springer: Berlin/Heidelberg, Germany, 2001; pp. 231–270. ISBN 978-3-642-63079-8. [Google Scholar]
- Hanson, R.K.; Spearrin, R.M.; Goldenstein, C.S. Spectroscopy and Optical Diagnostics for Gases, 1st ed.; Springer International Publishing: Cham, Switzerland, 2016; ISBN 9783319232522. [Google Scholar]
- Teichert, H.; Fernholz, T.; Ebert, V. Simultaneous in situ measurement of CO, H2O, and gas temperatures in a full-sized coal-fired power plant by near-infrared diode lasers. Appl. Opt. AO 2003, 42, 2043–2051. [Google Scholar] [CrossRef] [PubMed] [Green Version]
- Hunsmann, S.; Wagner, S.; Saathoff, H.; Möhler, O.; Schurath, U.; Ebert, V. Messung der Temperaturabhängigkeit der Linienstärken und Druckverbreiterungskoeffizienten von H2O-Absorptionslinien im 1.4µm-Band. In VDI-Berichte 1959; VDI-Verlag: Düsseldorf, Germany, 2006. [Google Scholar]
- Rothman, L.S.; Gordon, I.E.; Barbe, A.; Benner, D.; Bernath, P.F.; Birk, M.; Boudon, V.; Brown, L.R.; Campargue, A.; Champion, J.-P.; et al. The HITRAN 2008 molecular spectroscopic database. J. Quant. Spectrosc. Radiat. Transf. 2009, 110, 533–572. [Google Scholar] [CrossRef] [Green Version]
- Nwaboh, J.A.; Werhahn, O.; Ebert, V. H2O collisional broadening coefficients and their temperature dependence: A metrology approach. Appl. Sci. 2021. in review. [Google Scholar]
- Pogány, A.; Klein, A.; Ebert, V. Measurement of water vapor line strengths in the 1.4–2.7 µm range by tunable diode laser absorption spectroscopy. J. Quant. Spectrosc. Radiat. Transf. 2015, 165, 108–122. [Google Scholar] [CrossRef]
- Rollins, A.W.; Thornberry, T.D.; Gao, R.S.; Smith, J.B.; Sayres, D.S.; Sargent, M.R.; Schiller, C.; Krämer, M.; Spelten, N.; Hurst, D.F.; et al. Evaluation of UT/LS hygrometer accuracy by intercomparison during the NASA MACPEX mission. J. Geophys. Res. Atmos. 2014, 119, 1915–1935. [Google Scholar] [CrossRef]
- Witzel, O.; Klein, A.; Meffert, C.; Wagner, S.; Kaiser, S.; Schulz, C.; Ebert, V. VCSEL-based, high-speed, in situ TDLAS for in-cylinder water vapor measurements in IC engines. Opt. Express 2013, 21, 19951–19965. [Google Scholar] [CrossRef] [PubMed]
- Georgin, E.; Bubser, F.; Deschermeier, R.; Ebert, V. Metrology of Transient Humidity Measurements: Dynamic Generation and Measurement of Humidity. In Proceedings of the TEMPMEKO 2019, Chengdu, China, 10–14 June 2019. [Google Scholar]
- Witt, F.; Bubser, F.; Ebert, V.; Bergmann, D. C9.1 Temporal Hygrometer Characterization: Design and First Test of a New, Metrological Dynamic Testing Infrastructure. In System of Units and Metreological Infrastructure; SMSI 2021, digital, 5/3/2021–5/6/2021; AMA Service GmbH: Wunstorf, Germany, 2021; pp. 308–309. [Google Scholar]
Figure 1.
Functional block diagram of a dTDLAS hygrometer.

Figure 2.
(a) Two typical absorption signals at 1759 ppm and 7324 ppm. The model shown in Equation (2) is fitted to the raw signal, and the baseline polynomial and fit of the absorption signal are displayed. (b) The optical density (OD) with the fitted Voigt profile and the residual difference between the measured data and the fit below. With the standard deviation of the complete residual , the local standard deviation inside the blue box and the maximum residual difference values.

Figure 3.
(a) CAD rendering of the multipass cell with the infrared laser beam visualized in red. (b) Top view of the optics. The dashed blue line shows the position of the optical plane of the multipass cell visible in (a). Mirrors 1 and 2 are concave mirrors, with a focal length of 85 and 25 mm. Mirror 3 is a plane mirror.

Figure 4.
CAD rendering of the prototype to validate the optical setup. (a) shows the front view and (b) the back view. The infrared laser beam is visualized in red.
Figure 4.
CAD rendering of the prototype to validate the optical setup. (a) shows the front view and (b) the back view. The infrared laser beam is visualized in red.

Figure 5.
Correlation plot of the dTDLAS vs. the DPM measurements between 1300 ppm and 11,500 ppm with linear regression. Data where the DPM performed an automatic mirror cleaning are excluded from this plot. The systematic error is around 2.61%.
Figure 5.
Correlation plot of the dTDLAS vs. the DPM measurements between 1300 ppm and 11,500 ppm with linear regression. Data where the DPM performed an automatic mirror cleaning are excluded from this plot. The systematic error is around 2.61%.

Figure 6.
Optical density at 1321 ppm (a) and at 11,542 ppm (b). in the air at 1015 hPa. The data are averaged over 10 subsequent scans of the absorption line.
Figure 6.
Optical density at 1321 ppm (a) and at 11,542 ppm (b). in the air at 1015 hPa. The data are averaged over 10 subsequent scans of the absorption line.

Figure 7.
Explosion view of the design for the airborne dTDLAS hygrometer.

Publisher’s Note: MDPI stays neutral with regard to jurisdictional claims in published maps and institutional affiliations. |
© 2021 by the authors. Licensee MDPI, Basel, Switzerland. This article is an open access article distributed under the terms and conditions of the Creative Commons Attribution (CC BY) license (https://creativecommons.org/licenses/by/4.0/).
Share and Cite
MDPI and ACS Style
Witt, F.; Nwaboh, J.; Bohlius, H.; Lampert, A.; Ebert, V. Towards a Fast, Open-Path Laser Hygrometer for Airborne Eddy Covariance Measurements. Appl. Sci. 2021, 11, 5189. https://0-doi-org.brum.beds.ac.uk/10.3390/app11115189
AMA Style
Witt F, Nwaboh J, Bohlius H, Lampert A, Ebert V. Towards a Fast, Open-Path Laser Hygrometer for Airborne Eddy Covariance Measurements. Applied Sciences. 2021; 11(11):5189. https://0-doi-org.brum.beds.ac.uk/10.3390/app11115189
Chicago/Turabian StyleWitt, Felix, Javis Nwaboh, Henning Bohlius, Astrid Lampert, and Volker Ebert. 2021. "Towards a Fast, Open-Path Laser Hygrometer for Airborne Eddy Covariance Measurements" Applied Sciences 11, no. 11: 5189. https://0-doi-org.brum.beds.ac.uk/10.3390/app11115189
Note that from the first issue of 2016, this journal uses article numbers instead of page numbers. See further details here.