
From Field Archaeology to Virtual Reconstruction: A Five Steps Method Using the Extended Matrix


Italian National Research Council, Institute of Heritage Science, Rome (CNR ISPC), 00100 Monterotondo, Italy
*
Author to whom correspondence should be addressed.
†
These authors contributed equally to this work.
Appl. Sci. 2021, 11(11), 5206; https://0-doi-org.brum.beds.ac.uk/10.3390/app11115206
Submission received: 27 April 2021
/
Revised: 26 May 2021
/
Accepted: 28 May 2021
/
Published: 3 June 2021
(This article belongs to the Special Issue 3D Virtual Reconstruction for Archaeological Sites)
Abstract
:This article is framed into the theoretical and methodological background of virtual archaeology. The advantages of virtual archaeology and its weak points have long been discussed in academia, formulating theoretical foundations and principles to be followed in order to guarantee scientific results, where data are traceable, transparent and verifiable. Gathering the inheritance of the last 30 years of debates and research, this work proposes implementing these principles through the formulation of a methodological approach, to virtual reconstruction of archaeological contexts, consisting of an application protocol articulated in five steps. In particular, the proposed methodology is grounded in the Extended Matrix (EM), a formal language and tools entirely developed and tested by the Virtual Heritage lab of the CNR ISPC. The EM takes its cue from the Matrix of Harris and adapts its system to the specific needs arising in the fields of virtual reconstruction and scientific visualisation. This protocol, which ranges from fieldwork to the publication of scientific data, has been tested and systematised in over ten years of activity on various complex and significant archaeological contexts. In the article, each methodological step is supported by case studies described in detail and accompanied by a graphic apparatus that clearly illustrates the results obtained. These case studies led to the definition of version 1.2 of the EM as described in the methods section.
1. Introduction
In the past, virtual reconstructions have been the subject of debates among archaeologists [1,2,3,4,5] because they have two main critical points: (1) they risk conveying the wrong message, namely that the reconstruction is the truth instead of one of the possible interpretations of the past; (2) they risk becoming a “black box” [6] (p. 105) where the sources and interpretative reasoning are not declared nor available both to the scientific community and to users. Despite prudence and criticisms, many benefits have been considered by the scientific community, considering virtual reconstruction as not just a mere visualisation but as a scientific tool with great cognitive value, since it facilitates the management and understanding of complex information thanks to 3D simulations [7,8,9]. After years of scientific debates, the introduction of internationally valid principles about the computer-based visualisation of Cultural Heritage (London Charter and Principles of Sevilla), have effectively oriented the scientific discussion with the aim of overcoming the initial concerns [10,11]. Following these regulations, virtual reconstructions are designed following accurate workflow of analysis and interpretation of data and results are no longer presented as peremptory. However, the question of data management remains open. Although imprecision and subjectivity are mitigated using structured metadata and paradata [12], these are not always easily accessible outside the research laboratories. Furthermore, there are not yet universally accepted methods and tools to manage data and paradata and to display uncertainty and conflicting or alternative 3D reconstructions [13].
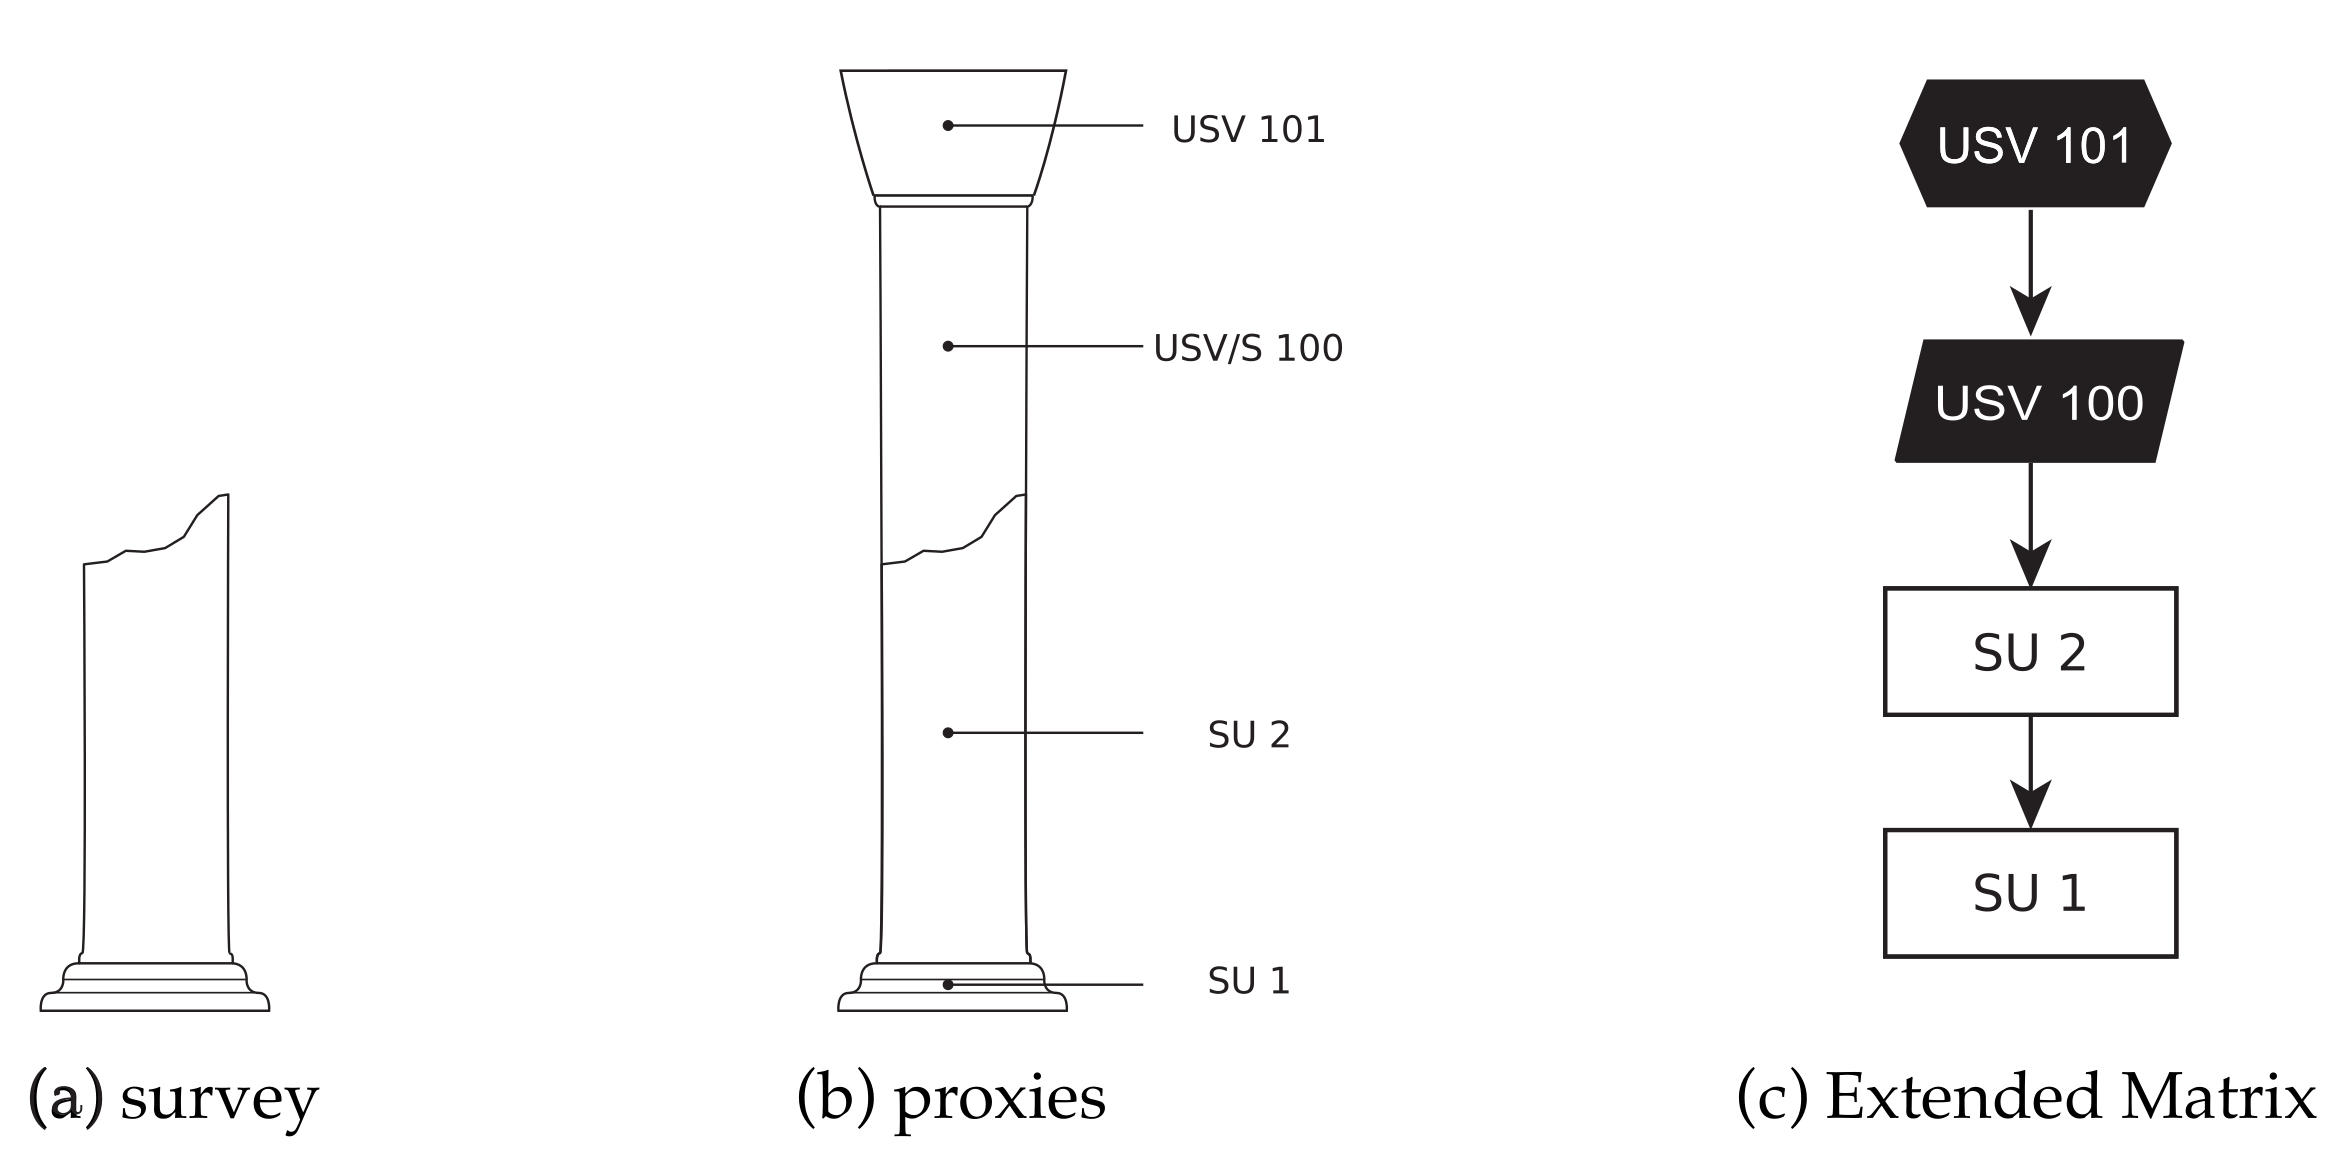
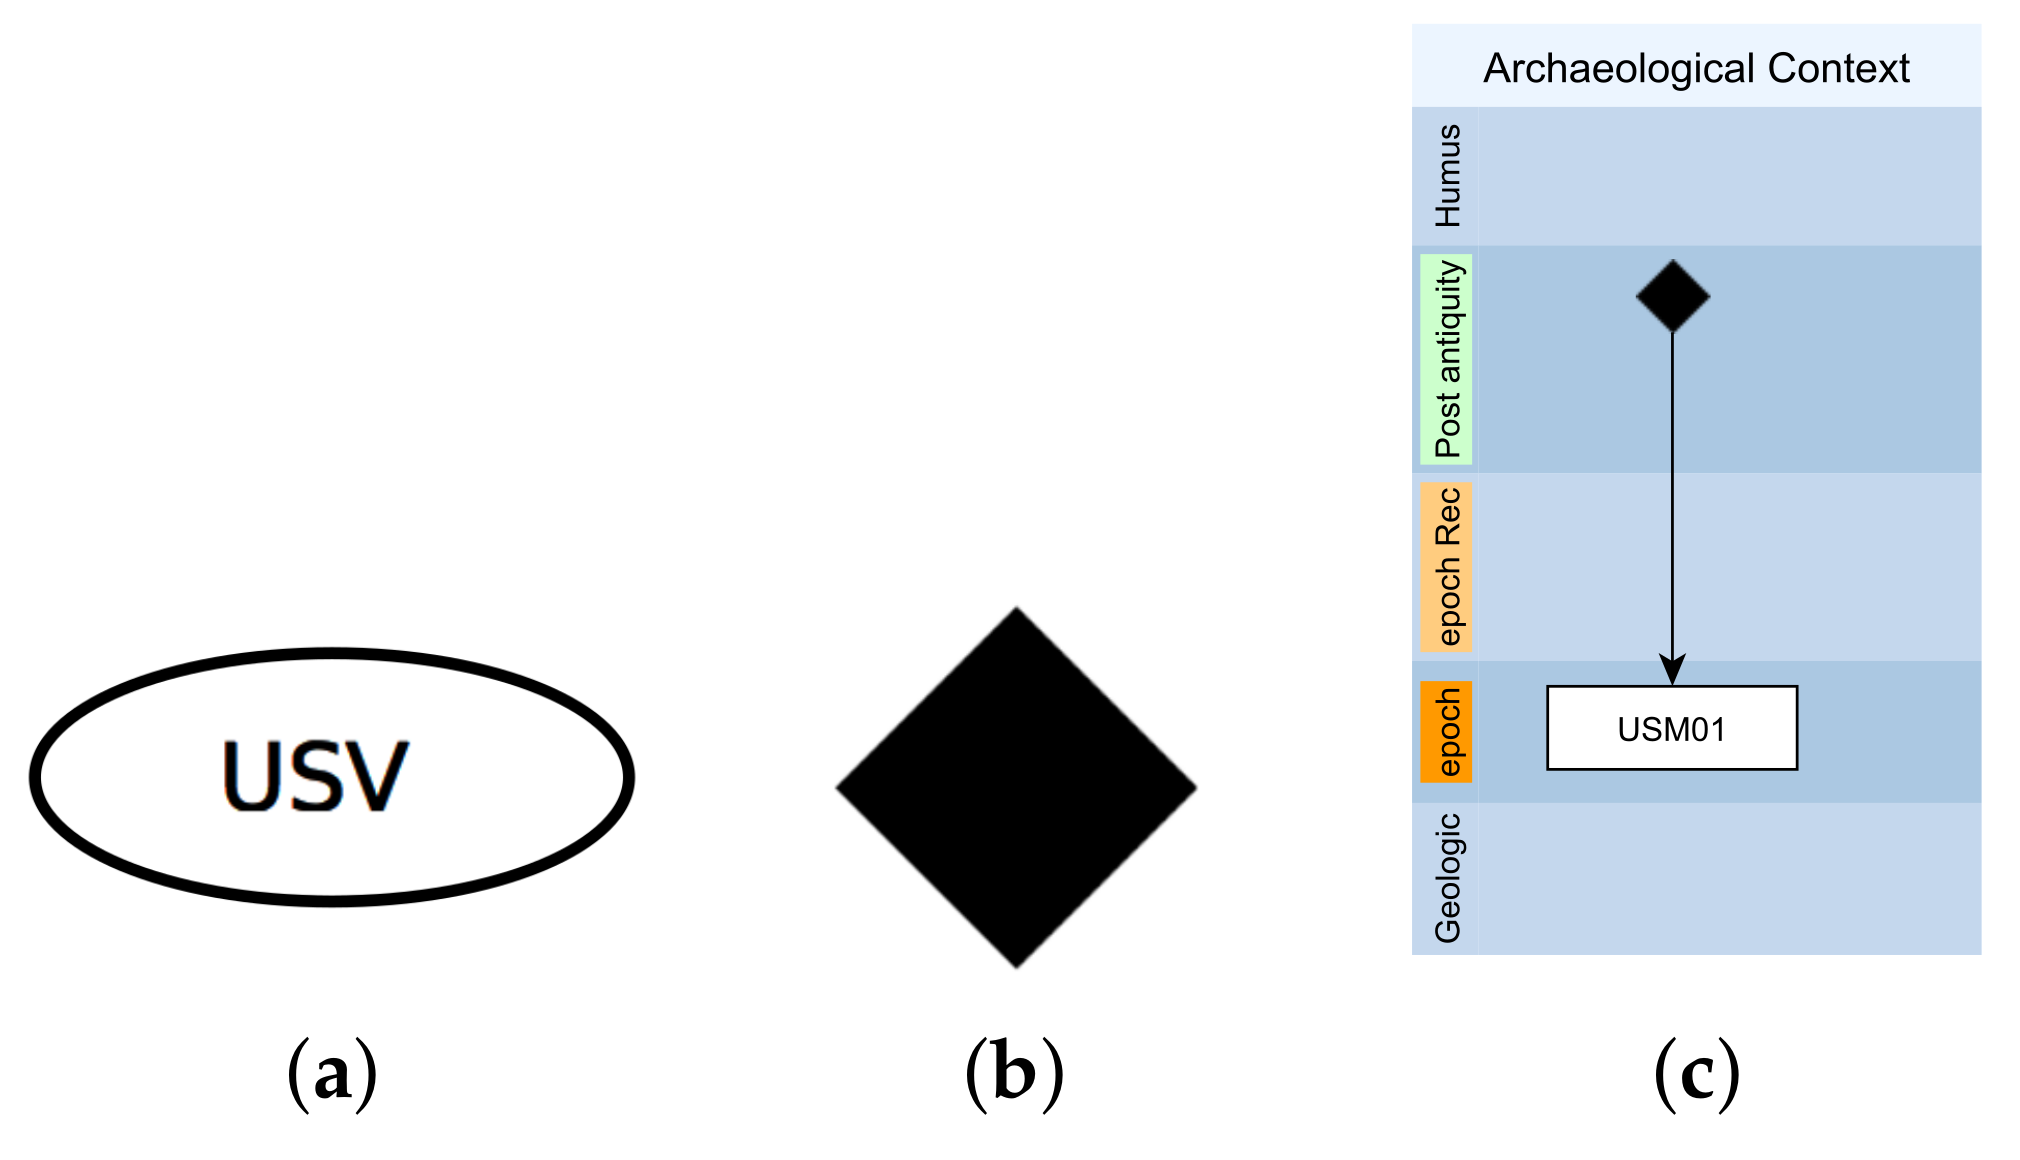
The five-step method presented in this article is conceived to overcome such issues and use a 3D simulation tool based on the Extended Matrix (EM) [14,15], to answer precise archaeological questions that could arise during the analysis, synthesis and interpretation of a site. EM is a visual node-based formal language grounded on a stratigraphic approach designed for virtual archaeology and on the theory of knowledge graphs. The term ”extended” highlights that it includes and defines not only archaeological stratifications (SU) but also their hypothetical reconstructions (Virtual Stratigraphic Unit—USV, see Figure 1). Given that, within a EM standardised ”five steps” methodology, it is possible to account, using a graph database connected to a 3D environment, all the relevant sources (data) and the logical-interpretative processes of analysis and synthesis (paradata) that have led from archaeological evidence to the reconstructive hypothesis.
The EM approach is part of a more general trend towards information management based on knowledge networks (graphs) expressed through data triplets (node, arc, node), oriented to convey the interconnection between the elements, and recorded within a graph database [16]. Although international standards in the Cultural Heritage domain such as CIDOC-CRM or operational tools such as the Matrix are based on information triplets, graph databases are still poorly adopted in favour of “traditional” table-based databases. Thus, an EM is a knowledge graph intended to explicitly represent properties like the chronological extension by means of graphical conventions (y axis = time, black lines = stratigraphic relations, dotted lines = data provenance, etc.).
In recent years, several case studies [17,18,19,20,21,22,23] have used the Extended Matrix methodology offering important test-beds to validate the theoretical framework (EM, [14]), the formal tools (USVs [14], proxies [15]), and its digital ecosystem framework (Extended Matrix Framework—EMF [15]). Section 2 offers the result of this process of maturation as a standardised five step process that, in turn, allows to address several main issues related to the virtual reconstruction process as in Section 3 will be discussed. In Section 4 a selection of EM-based case studies that allowed the tool to be enriched with new features, both in terms of method and formal language and in terms of software solutions will be presented. Thus, these projects led to the definition of the version 1.2 of the EM (see infra Section 5.1) and EMF (see infra Section 5.2) whose change-log compared to version 1.1 [15] will be described.
2. Results: A Standardised ”Five Steps” Protocol
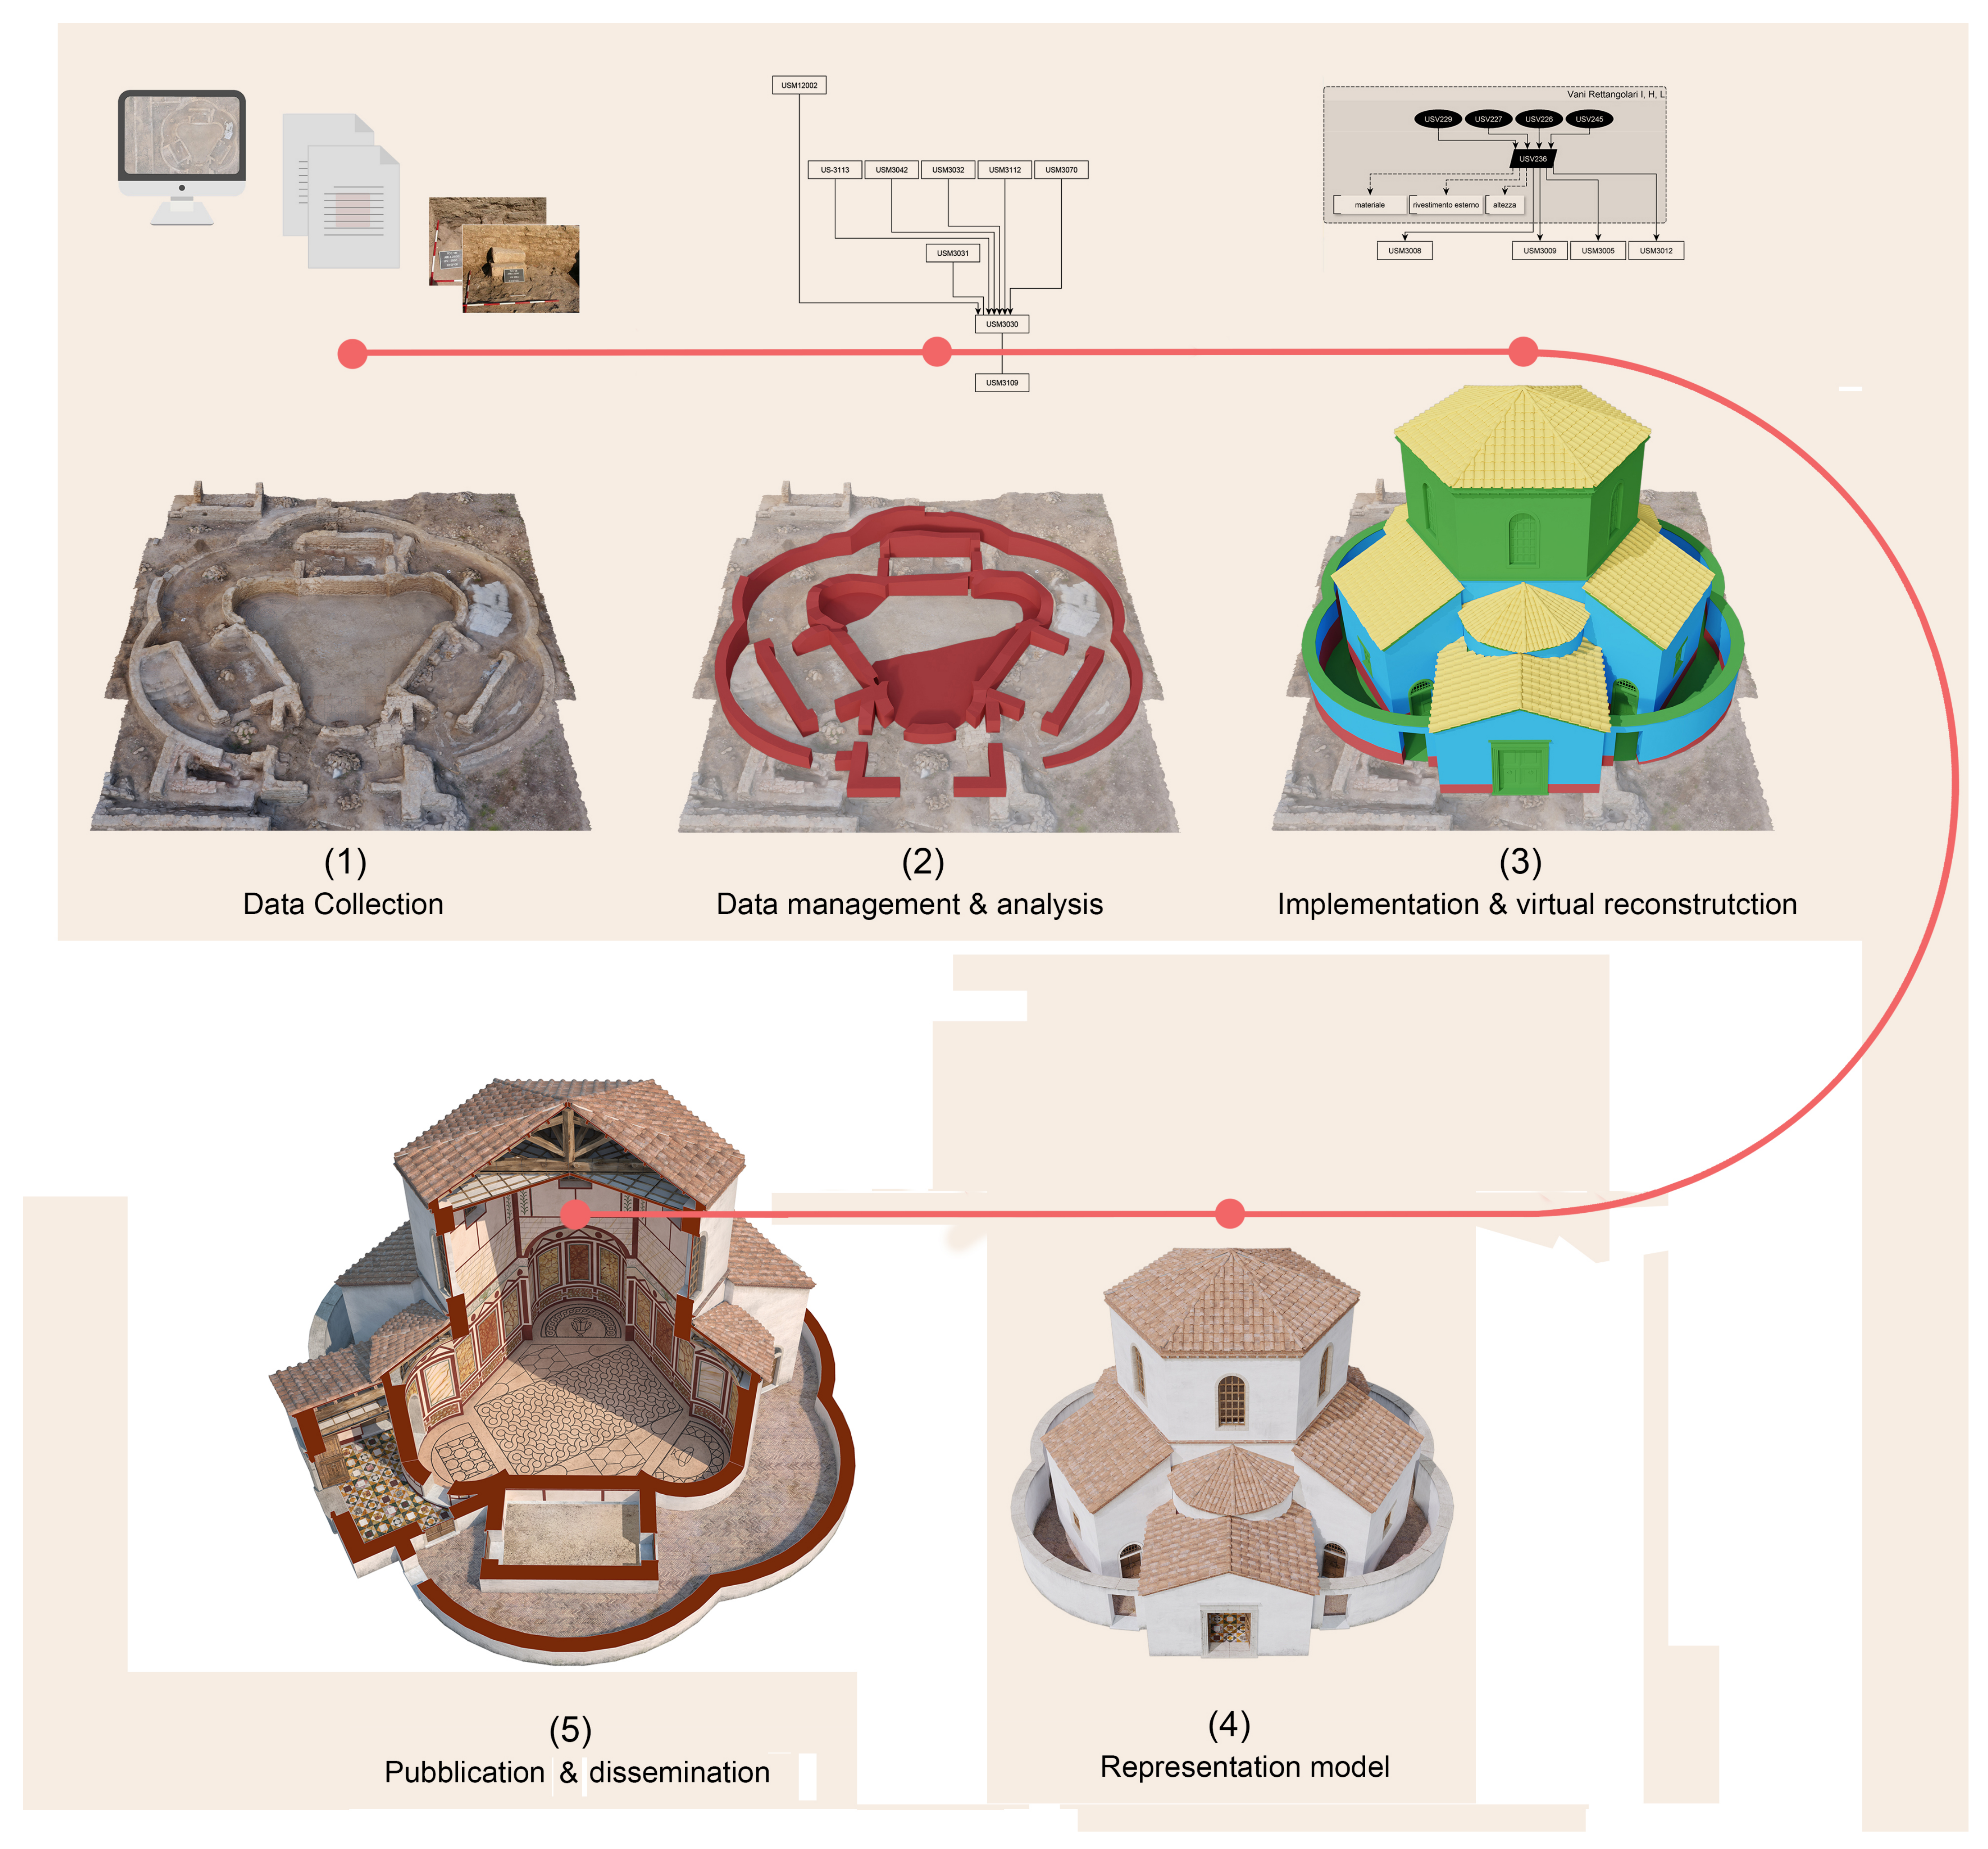
The objective of this section is to arrange a validated reference work with instructions and ready-to-use references to consciously setup a project of virtual reconstruction based on the EM five steps method (see Figure 2).
During the description of the five steps, practical examples of applied EM methods and techniques drawn from real case studies (see infra Section 4) will be mentioned. Information formalisation tools (Extended Matrix) and open source software tools (Extended Matrix Framework), developed to facilitate their use during the production of a reconstructive hypothesis, will be discussed in the different steps. These tools will be discussed in detail in Section 5.1 and Section 5.2.
2.1. Data Collection (1/5)
The reconstructive process begins with the study of the archaeological and historical context (see Figure 2) through excavation, source collection, survey, and digitisation. Comparisons with similar contexts, belonging to the same geographical area and historical period, are a valid reference for the reconstruction. In this phase it is important to pay particular attention to the visual quality of the models representing the real data (obtained using digitization technique such as laser scanning or photogrammetry) as this has an important influence on the richness of the information available for the reconstructive hypothesis. The model should be a digital replica [24] (a model with a high visual resolution suitable for real-time simulation) allowing the relevant elements of the original context to be clearly perceived and recognised (e.g., colour, shape, dimensions). In other words, the reliability of archaeological interpretations is strongly influenced by the meticulousness of the work of collecting and managing archaeological records and data. According to the third principle of the London Charter in fact, ”in order to ensure the intellectual integrity of computer-based visualisation methods and outcomes, relevant research sources should be identified and evaluated in a structured and documented way” [10]. All the archaeological reports must be kept into account before designing a reconstructive hypothesis, however, being the remains insufficient to reconstruct an entire context, other fundamental sources should be examined and used to improve the quality of the work and mitigate the ”shadow area”:
- digital replica of archaeological site (3D survey techniques such as photogrammetry or laser scanners are fundamental to obtain accurate metric documentation and effective digital models);
- photographic documentation and excavation reports;
- historical documentation and testimonies (including historical paintings and designs, archive photographs, cadastral map, archives, registers, deeds, etc.);
- architectural studies on ancient buildings, architectural styles, theoretical rules of construction, theory of proportions and modules;
- structural analyses and simulations;
- dating and archaeometric analyses;
- comparison with other buildings still preserved and showing similar stylistic, structural or functional solutions.
The information collected should be stored in a list of sources (see infra Table 2) and provided with an identifier. In the EM 1.2 this identifier consists of a ”D” (which stands for ”document”) followed by a dot and an incremental number (D.01, D.02,…, D.n).
This data structure will make it easy to collect information (from physical libraries or online database) and to reuse it in the Extended Matrix. A ”key” field, to be filled in, is ”properties”: here, specific features, obtained from the source and testifying useful information for the reconstruction (such as shape, colour, dimension, function, style, etc.), are annotated.
This is a fundamental step that lays the foundations for the subsequent interpretative work. The right amount of time should be allocated to this phase, bearing in mind that the whole process is iterative and going back and add sources to the list is always possible (the Extended Matrix is conceived to assist users to develop interpretative hypotheses within a ”non-destructive” expert system in which it is possible to modify the information involved in the different phases).
2.2. Data Management and Analysis (2/5)
The second step (see Figure 2) concerns the stratigraphic analysis and annotation of the physical remains discovered in the archaeological context and their 3D visualisation within a virtual environment by means of proxy models. A proxy model is a simplified geometric representation of a stratigraphic unit (SU) (see Figure 2 (Subfigures 2 and 3)): as an example, the proxy of a column is a low-polygon cylinder mesh. The creation of the proxy model is performed as follow: firstly, the stratigraphic sequence (containing all the SU identified in the archaeological context) is drawn following the Matrix system proposed by Harris [25] in order to support the analysis and to give an overview of the chronological relationships between the building elements. The stratigraphic sequence is structured within a graph database as nodes connected to each other by lines expressing relative chronological relationships. In the EMF 1.2, the yEd graph editor and an ISO standard XML GraphML format is used. In yEd, the SU are arranged within chronological periods possibly grouped into activities as happens in the classic Matrix of Harris.
Finally, the proxies are modelled within a virtual environment, using the digital replica as reference to sketch the volume, and linked to the graph database through the EMtools [26] add-on (see infra Section 5.2) in order to retrieve relevant information.
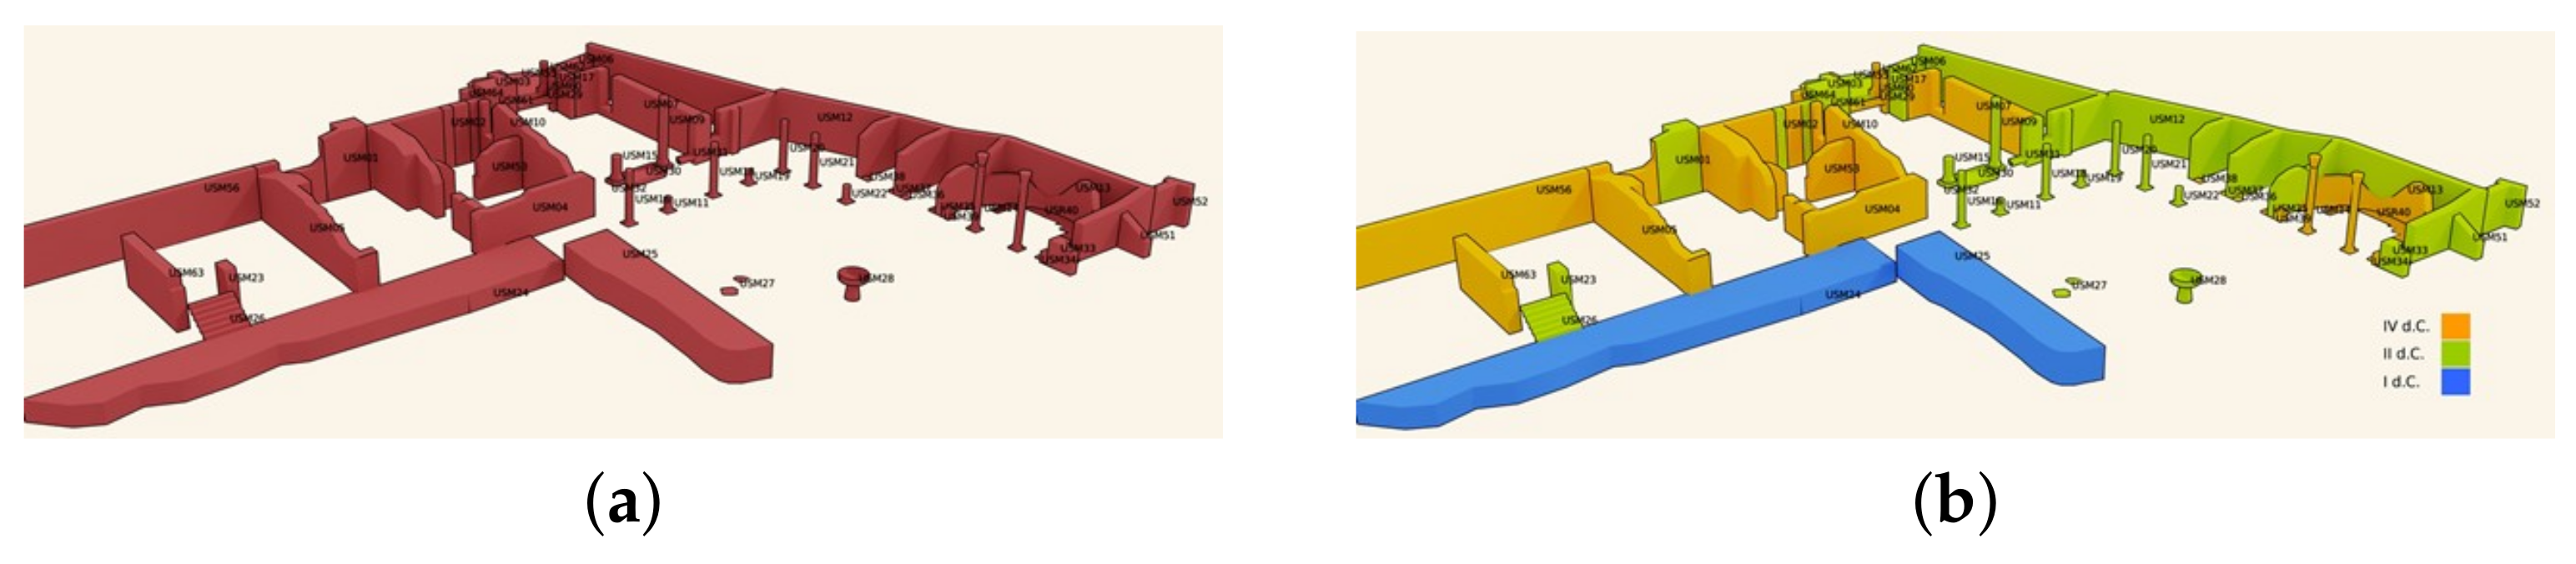
As an example, in the Porta Marina case study (see infra Section 4.7) the stratigraphy of the remains is represented through the EMtools software as proxies using different color schema: EM and chronological (see infra Figure 13a,b). In the Onde Marine case study, the proxy representation of the stratigraphy (see infra Figure 5), related to the remains discovered during the archaeological excavation, allow a deeper understanding of the site evolution to be perceived.
In all the case studies in Section 4, a reality based model was used as a reference to model the proxies related to the extant structures. In this way, for all the SU, chronological and physical relationship together with descriptive information, are connected to the digital replica by means of proxies.
2.3. Interpretation and Virtual Reconstruction (3/5)
In the third step (see Figure 2-subfigure 3) one or more virtual reconstructive hypotheses of the archaeological context are proposed within the EM graph (using yEd) along with their representation by means of proxies. The process is similar to the previous step 3 but, in this case, the potential (virtual) stratigraphy belonging to the reconstructive hypothesis is also formalised: for each USV in the EM graph, a proxy model is provided. This process is not one-way: it is an iterative process of hypothesis making and visualisation (the EMtools simplifies this task through a ”hot reload” function of the GraphML inside Blender). During this operation a report of virtual activities, representing a textual discursive version concerning the reconstructive hypothesis, is drawn up (it is divided according to the supposed evolution/construction phases of the archaeological context). At the end of this step, a 3D proxy model representing the reconstruction hypothesis is available for a review by experts outside the team for validation and discussion. Thus, it allows to visualise and query the extended matrices containing excavation information and the sources used in the reconstructive process. Indeed when the proxy model and the EM are connected in the Blender software, a conceptual visualisation using different colour coding is provided showing different levels of certainty (that a given element existed in the past) according to archaeological evidences (see infra colour chart in Table 3). The colours distinguish extant structures (red) from their completion and hypothetical reconstruction (blue); repositioned fragments (dark yellow) form their hypothetical completion (light yellow). The green colour finally refers to all those parts for which we have no structural or archaeological evidences, but their reconstruction is entrusted to stylistic comparisons or interpreted sources.
2.4. Representation Model (4/5)
In the fourth step (see Figure 2-subfigure 4), once the reconstruction has been validated, a detailed model including materials and textures, the so-called ”representation model” (RM), is performed for each of the phases of life of the context to be reconstructed. In the Amba Aradam case study, the RM (see infra Figure 8c) has been modelled in Blender retrieving the relevant properties (materials, references etc… that were previously stored in the EM graph in the step 3) through the paradata manager and the sources manager of the EMtools (see infra Figure 18). This task can be assigned to a senior 3D modeller that can access in a convenient way to the complete reconstructive record within the 3D modelling software. The ”hot reload” function of the GraphML file (the graph database) in Blender enables fast update of the properties making it possible a tighter collaboration between experts involved in step 3 and step 4.
Making the RM, the reconstruction is designed in detail on top of the digital replica and inherits its volumes, measures and proportions allowing great accuracy and control during the modelling processes.
Among the advantages of separating the two views (proxy and RM) is the fact that the ethical issues related to the completeness of the reconstructive record are mitigated by the opportunity to visualise the site even only with proxies (conceptual reconstruction). Other benefits of this division are well known in literature [27] and already explained in the version 1.1 of the EM [15].
It is noteworthy that in the case of Ostia (see infra Section 4.7) the reconstruction stopped at the creation of the proxies to allow the project partners to work on the RM model independently in the future.
2.5. Publication and Digital Dissemination (5/5)
Within a ”traditional” approach to virtual reconstruction, the creation of the metadata formalising the process and the effort devoted to dissemination and publication are tasks normally carried out at the end of the project leading to a number of drawbacks: on the one hand, these actions sometimes require extra budgets that have not been properly estimated and, on the other hand, there is a real risk of losing track of the reasons that led to certain interpretations and of having an incomplete list of employed sources.
An EM data-set instead, for its very nature, enables the possibility to publish a complete reconstructive record through standardised outputs. Although the entire workflow is based on an open source framework (see infra Section 5.2) that ensures maximum sustainability and re-usability, the method is nonetheless ”agnostic”. This means that it can be replicated regardless of the tools used, as in the case of the Forum of Augustus Section 4.2 where the models were made using the 3D Studio Max software.
As we have seen, the data-set may include more than one reconstructed phase (e.g., Roman times, medieval times, etc.). Each epoch should be described as a section or chapter and, within each period, the Stratigraphic Units (SU) and Virtual Stratigraphic Units (USV) explained in a narrative way as part of Virtual Activities. Each Virtual Activity is accompanied by a virtual activity report, a discursive text that puts into words the reasoning behind the stratigraphic reading and hypothesis like already formalized in the EM 1.1 [15] (pp. 504–506). Each virtual activity is presented with the corresponding portion of the EM graph, sections and plans illustrating the proxy model and the representation model (see infra Figure 9).
A list of relevant documents for the publication is as follows:
- digital replica and related proxies;
- reconstructive interpretation of a given epoch. This part includes the textual part (report of virtual activities) of the reconstructive interpretation, the creation of proxies and the representation model;
- the Extended Matrix graph (2D);
- 2D blueprints and sections derived from the 3D models;
- tables with lists of stratigraphic units, source nodes and interpretation nodes.
The publication of the reconstruction should take place on two levels: the publication of the Extended Matrix (EM graph, proxies and RM) and the derived graphic and textual documents. The publication of the whole dataset, structured according to the scheme in the Figure 16, should be placed next to these documents. Following general FAIR principles for the management and dissemination of the scientific record, a suggested publication repository is Zenodo (https://zenodo.org (accessed on 26 May 2021) indexed by Open Aire, maintained by CERN, and funded by the European community) which can provide unique document identifiers (DOI) that can be cited in projects where the data is reused.
The ”export manager” tool of EMtools will help users to create tables for an article or a book chapter (csv export), an ”EMviq” (see infra Section 5.2) interactive web app or a desktop real-time environment (using Unreal, Unity, Cry-engine, or Godot just to mention some examples).
3. Discussion
As well as structuring a process, the five-step procedure offered possible solutions to some of the general issues involved in virtual reconstruction, including data management, collaborative working, dissemination and re-use of the results of a research project. This section points out the issues mentioned above and discusses some of the positive effects that have been brought about by the application of the method in case studies (see infra Section 4).
Flexibility of the process. It should be noted that, although the five steps have a logical coherence, so that the method should start with the first and ends with the fifth, the steps in between are iterative and interconnected and do not compulsorily follow a strict chronological sequence.
Thus, it is noteworthy that the first three steps alone can be considered necessary and sufficient to obtain a complete reconstructive record. In other words, the collection of information, the analysis and management of the data, and the reconstructive interpretation shape a reconstructive data-set even if a representation model is not produced and/or publication and dissemination activities are not carried out. This is the case of the villa outside Porta Marina in Ostia (see infra Section 4.7): in this case study the complete data-set of sources and the annotation of how they were used, have been implemented the Extended Matrix along with a complete proxy model for the late antique phase. This will provide the scientific basis for the future creation of the representation model and dissemination activities (steps 4 and 5) that have not yet taken place.
The possibility of proceeding in random order in the development of the five steps, in the absence of solid tools to trace the origin of the data and the construction processes, could have made the process of interpretation and study chaotic. This potential drawback is managed and solved by the EM: changing sources or data in the excavation database make it easy to upgrade the interpretative process, the 3D models, and the derived graphic works. As an example, in the design process of an archaeological excavation, it is not uncommon for provisional reconstructive drawings to be required in order to disseminate the discoveries that have just been made. This is the case study of Amba Aradam (see infra Section 4.4), where an acceleration in the timing of the project required the virtual reconstruction to proceed even before the end of the stratigraphic study, making it necessary to perform subsequent adjustments to the reconstructive hypothesis when the latest and final documentation became available. The updating of a reconstructive record is not only a fundamental requirement in a long-term archaeological excavation project, but also becomes fundamental after its publication: the study by the community of such a record and above all its reuse and improvement, thanks to the acquisition of new information, makes possible a further development of knowledge without having to rebuild a data-set from scratch.
Collaboration oriented. A division into five steps, in the considered use cases, to allow a division of labour to be set up between professionals belonging to different teams, with different technical skills and different subject areas, thanks to a common formal language (the EM). In this way, it was clear at all times which process and which precise information in the database had to be made available by user A to user B: in the case of Amba Aradam (see infraSection 4.4), the proxies, along with the graph database, were sufficient for the work of a senior modeller to create the representation model. In other words, the proposed methodology is a pivot to build a multidisciplinary team and a production process adaptable to different case scenarios.
Re-conciliate fragmentary contexts and simulation tasks. As often happens in archaeology, only the lower parts of the wall structures are preserved, while the volumes of the upper part are completely lost and partially attested only in the archaeological layers. During the simulation, the roofing systems is the most complex part to interpret. The technological solutions, in fact, depend on many factors such as the structural design of the building, on the height of the walls and their payload and finally on the construction materials used. Reconstructing missing parts of a building without following a structured protocol could be very difficult and may lead to ignore or underestimate some data. In the Aiano (see infraSection 4.1), in Ostia Porta Marina (see infraSection 4.7), and in the Amba Aradam (see infraSection 4.4) case studies, simulations were crucial to test complex hypotheses and to visualise speculation about the site, its changes and developments over the centuries.
Visual tools for a simplified and synoptic access to relevant information. The stratigraphic records is chaotic and difficult to read because the documentation is complex and composed by different documents (stratigraphic sheets, drawings, photographs, plans, sections, etc.). The use of the EM tool for a management and query of archaeological records allowed a synoptic vision of the data directly on the models using different colour coding: different building phases, extant structures, reconstructions and level of certainty. In large excavations, like in the Onde Marine (see infraSection 4.3) and in the Amba Aradam (see infraSection 4.4) case studies, the extension of the site and the quantity of stratigraphic units involved required a tool to manage such complexity without loosing relevant information for the reconstruction hypothesis.
Reconstruction as part of the interpretative and cognitive process. Reconstruction is often considered as a task to be done at the end of the excavation with the risk of losing data because they have not been structured in a coherent system. Indeed, the reconstruction is not merely visualisation, but is part of the interpretative and cognitive process. In our case scenarios, before its publication, 3D models have played a fundamental role as research tool since they improved cognitive processes by transforming the raw data into visual information. The analyzed case studies show that when the activities of 3D simulation have been realised simultaneously with the excavations or during the post processing of the archaeological records, they have improved the quality of the analytical phase. They supported interpretation allowing discussion and comparison of interpretative hypotheses and their verification through simulations and visualisation. Furthermore the use of the EM tool allowed to create a ”white box” semantic model to visually display complex data-set. In the case of the Great Temple (see infra Section 4.5) the data ingestion, analysis and interpretation tasks were performed through the EM visual formal language in order to create a stratigraphic record including the remains of the temple’s podium and a subset of 50 architectural fragments (special finds): the anastylosis and the digital restoration of the elements as well as the general reconstruction hypothesis, started at the very beginning of the project as the annotation (through the EM visual language) of attempts to interpret the remains with a continue update of the information during the ingestion of new sources. This iterative procedure empowered the cognitive process keeping reasoning patterns within safe boundaries.
Setup a project of virtual reconstruction in practice. In recent years more and more cultural sites are upgrading their exhibitions with multimedia itineraries and virtual museums. The stakeholders (managers, curators, exhibit designers) aim at improving the educational offer and radically changing the way the cultural sites communicate to visitors. Besides, the rapid technological development has allowed the advancement of scientific-based visualisation and dissemination of virtual reconstruction of the past thanks to digital application in museums and archaeological sites (e.g., virtual reality, augmented reality and mixed reality applications, tangible interfaces, video mapping, applied games, etc.). Whenever a cultural site has to perform a virtual reconstruction of an ancient artifact, to be integrated within one of the above-mentioned applications, it must set up a project facing several problems. In our experience doubts and questions are always the same: “how to set up a project of virtual reconstruction into practice? How can we reconstruct this artefact in a scientific way? How can we communicate the uncertainty?”. The problem becomes even greater when such reconstructions are not developed within a project involving research centres or universities but are contracted out to external companies or creative industries for public dissemination. Professionals like digital archaeologist, digital asset managers, 3D artists expert of cultural heritage, are not very common. Digital Archaeology and Digital Heritage are new-born disciplines in the academic environment. For years indeed, virtual reconstructions have been belittled and relegated to mere visualisation and their role excluded from interpretative and cognitive process. This method proposes an operative protocol useful to set up a project of virtual reconstruction. The objective is to convey the results from scientific research along with reference, instruction and procedures, not only to scientific communities but, above all, to the market. It is addressed both to all those public and private institutions that have to contract out such works to improve the educational offer through digital products and to the creative industries that have to implement them into digital application and virtual museums. In the case study of Montebelluna (see infraSection 4.6), the municipality’s museum needed to create a permanent exhibition focused on a roman craft building: the five steps method made the reconstructive process understandable both to the partners of the University of Padua and the Montebelluna Museum during the planning and fundraising activities of the project, and to visitors during the exhibition.
4. Materials
In this section a selection of use cases where EM has been applied is presented. In some cases an incomplete workflow was employed as in the case of the villa outside Porta Marina (for which no representation model was developed) or a workflow based on tools other than those recommended in EMF as in the case of the Forum of Augustus (for which software other than Blender was chosen to represent the proxies and to model the RM). In Table 1 there is a summary of the main characteristics of the case studies.
4.1. The Roman Villa of Aiano (SG, Italy)
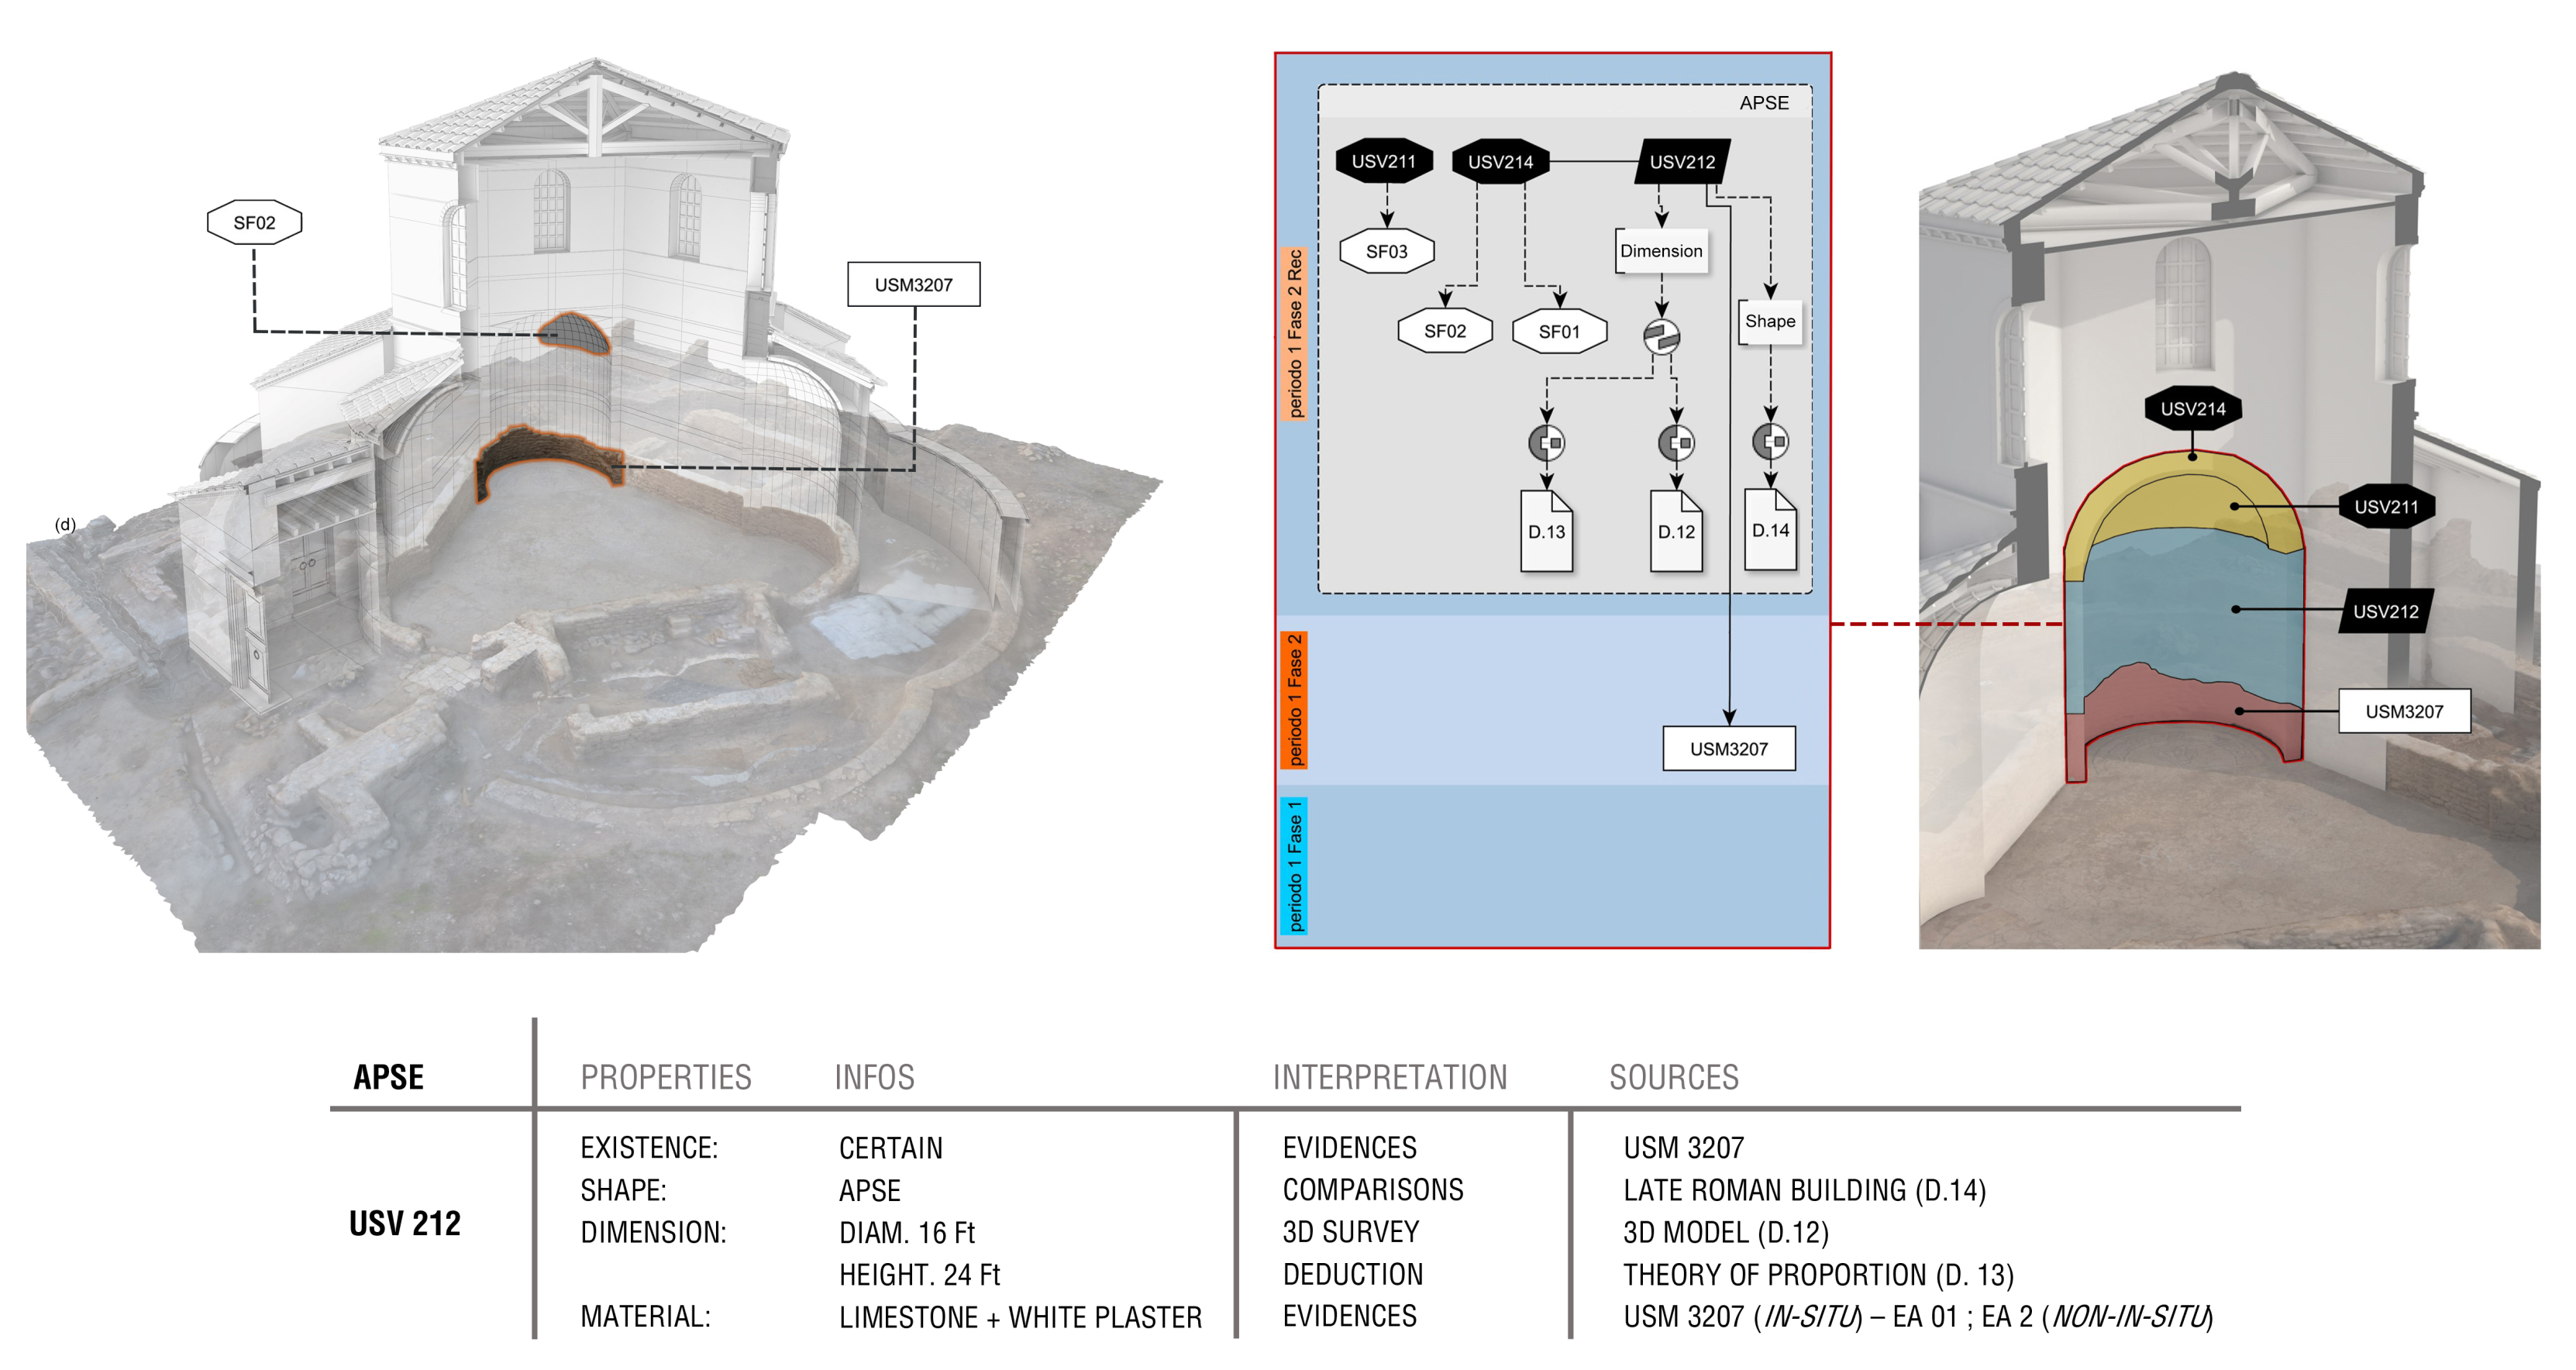
The Roman villa of Aiano is an archaeological site placed in Tuscany near San Gimignano (http://www.villaromaine-torracciadichiusi.be/it/home/ (accessed on 26 May 2021)). Since 2005 the site has been excavated by an Italian-Belgian mission coordinated by the UCLouvain within the international project VII Regio. The Elsa Valley during Roman Age and Late Antiquity [28]. In 2018, the CNR ISPC performed a virtual reconstruction of so-called trefoil, ambulatio and vestibule, in the chronological phase between the end of the 4th and the beginning of the 5th century. 3D modelling and the Extended Matrix approach were used as scientific tools of investigation. This five step methodology, in all its declinations, was mainly used to support archaeological research with the aim of organising all the excavation documentation, sources and comparisons, to verify the hypotheses proposed and help in the understanding of a very complex site. Indeed, the trefoil hall presents characteristics that make it unique. An example of the EM workflow can be seen in the Figure 3. One of the three apses was reconstructed on the basis of archaeological evidence in-situ (SU 3207: foundation wall), of some collapsed architectural elements (SF 1 and 2: fragments of the plaster covering the ceiling; SF 3: fragment of a brickwork arch) found during excavations, and on the basis of stylistic comparisons (late Roman buildings with similar functional and structural elements). In the EM the relationship between sources and interpretation processes, that led to the formulation of the reconstructive hypothesis (USV 212), is visible. The table below illustrates the data contained in the EM nodes in more detail. The use of the Extended Matrix and colour coding was also fundamental to the declaration of the degree of certainty and the limits of interpretation while guaranteeing intellectual transparency [20]. All the 5 steps were performed in collaboration with a scientific committee from the UCLouvain. From the virtual reconstruction various outputs were generated such as perspective and axonometric projections. In addition, various two-dimensional technical drawings have been produced to provide a synoptic understanding of the building, its stratigraphic connections and relationships between the buildings blocks. Finally the models has been also used to create CGI (computer-generated imagery) animations for a short movie, financed and supported by the Municipality of San Gimignano, that will be shown in a museum in San Gimignano during 2021.
4.2. The Imperial Forum of Augustus (RM, Italy)
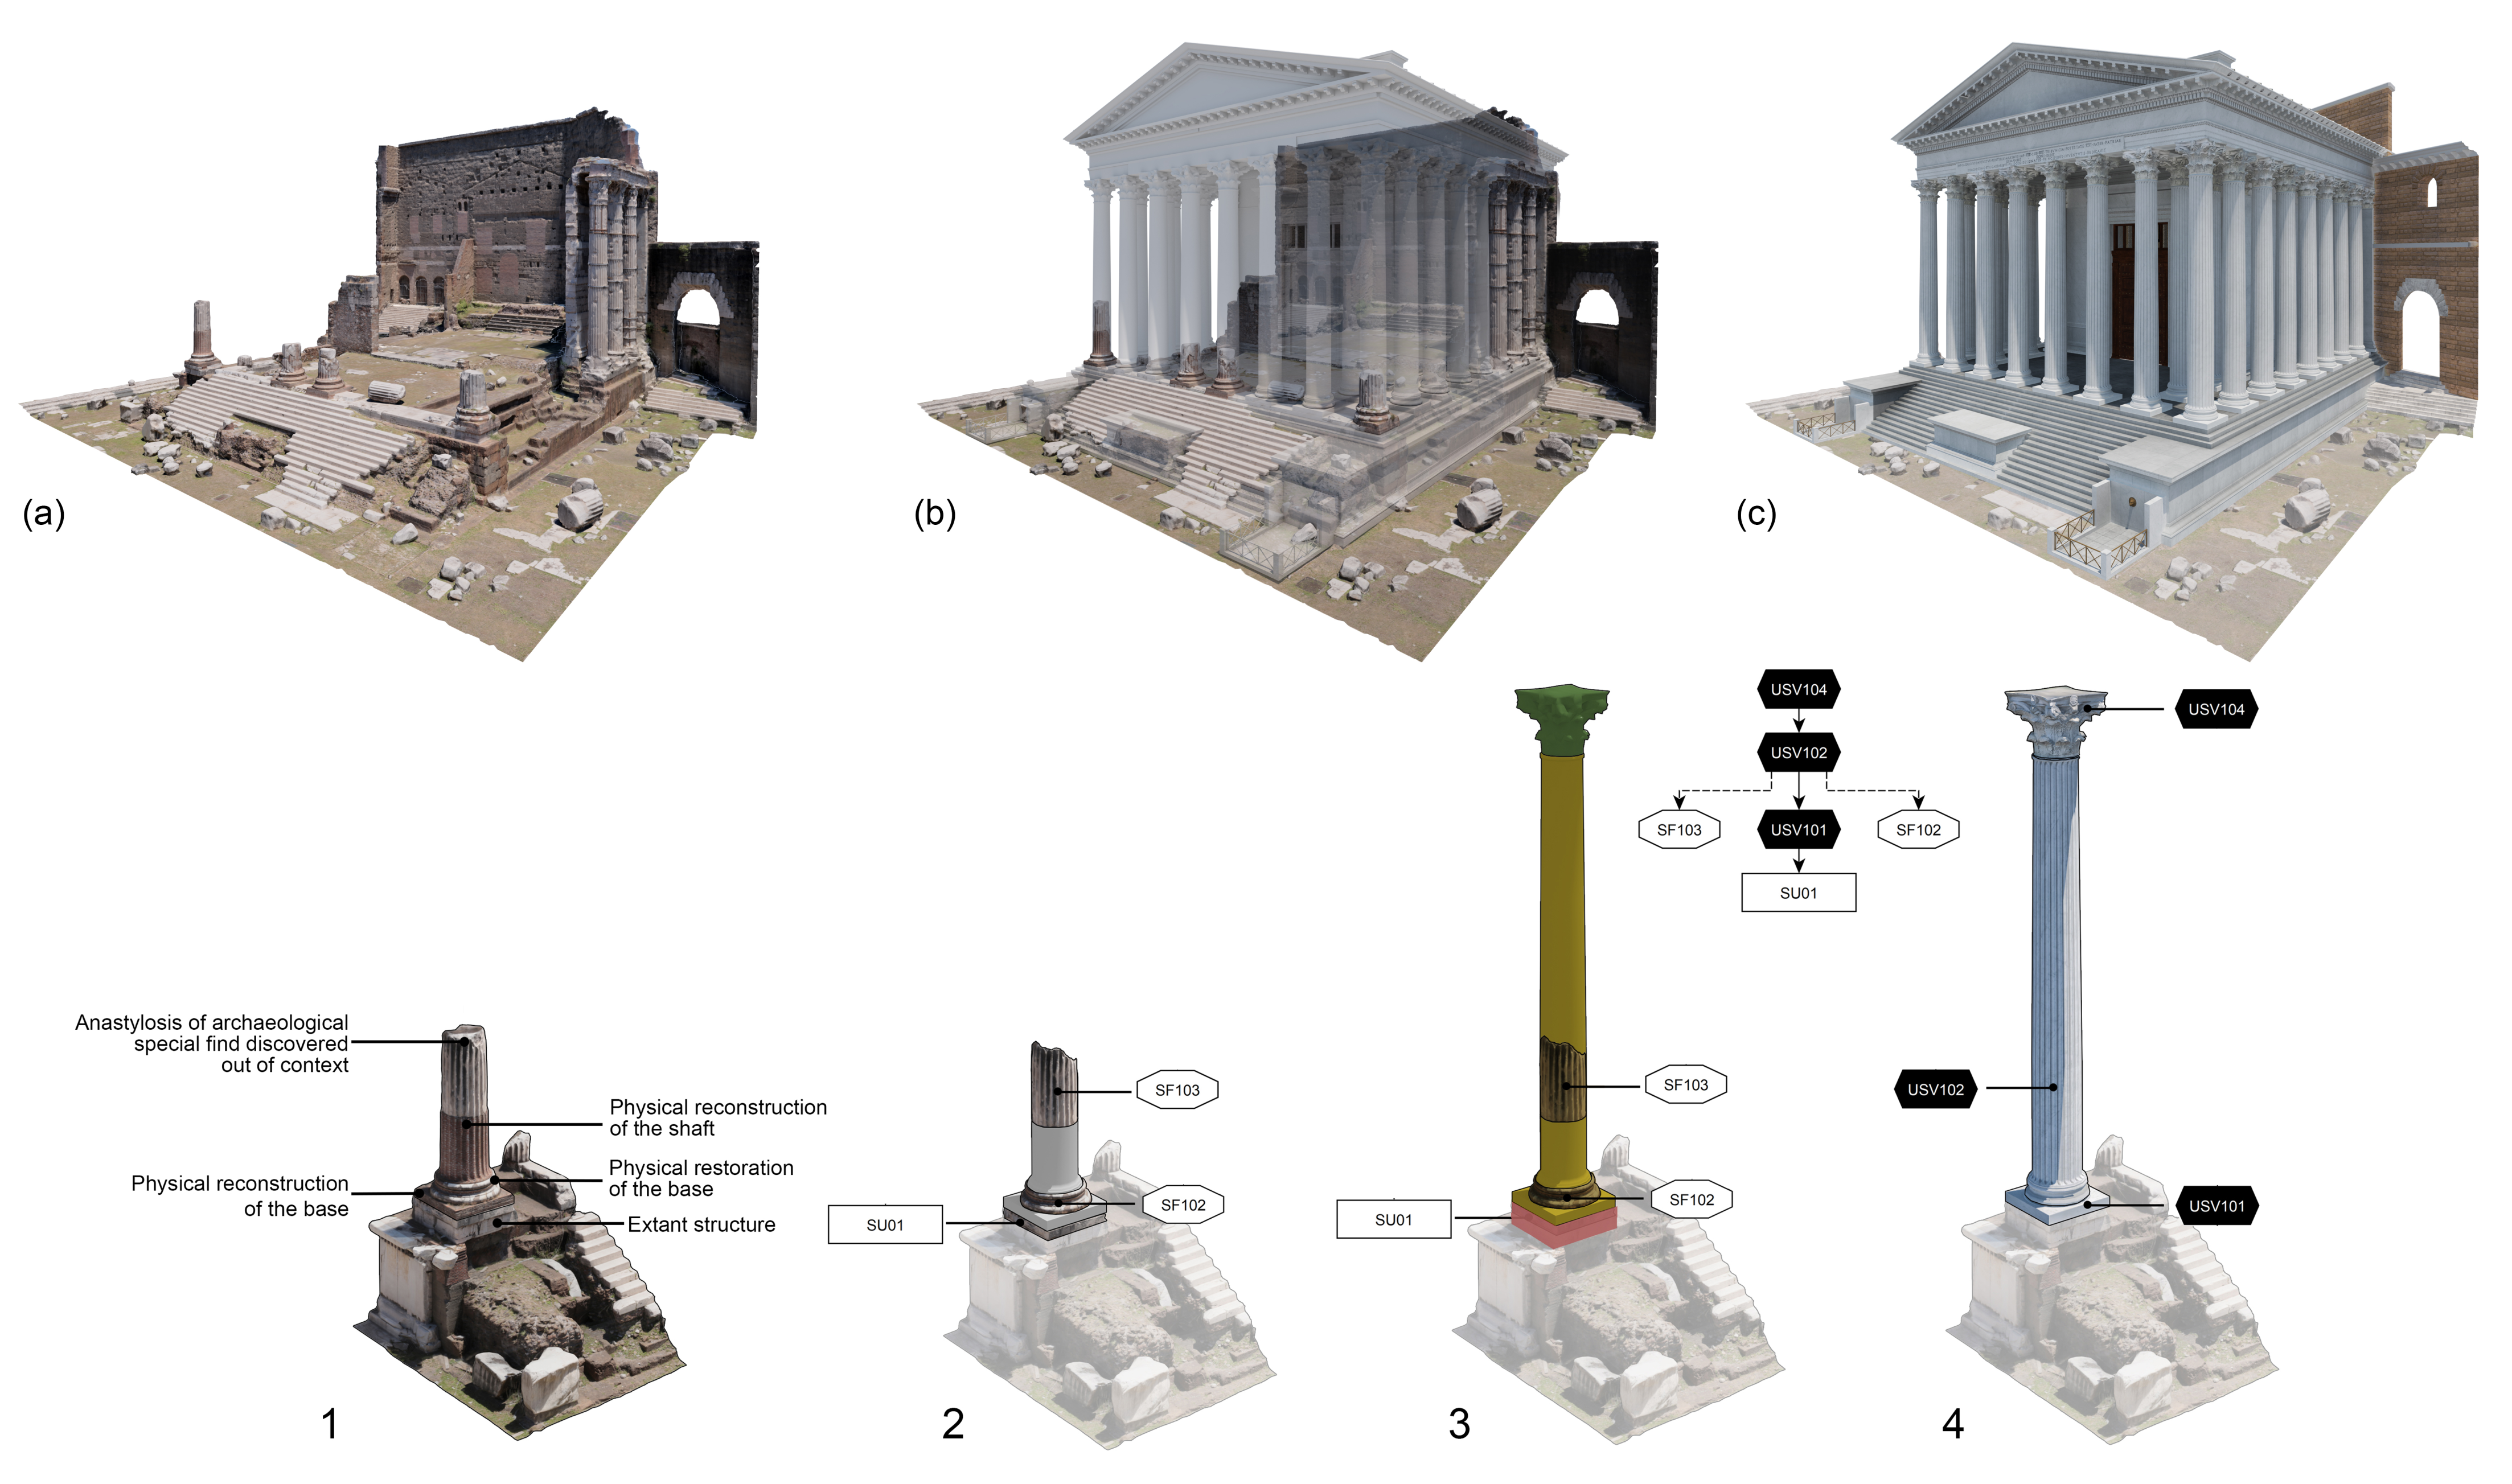
In 2018 the CNR ISPC was one the participants of the project Reveal (Realising Education through Virtual Environments and Augmented Locations) which was funded under the European Horizon 2020 program (https://cordis.europa.eu/project/id/732599 (accessed on 26 May 2021)). This project pioneered the use of PlayStation VR technologies for innovative educational applications and disseminating knowledge of the historical-artistic-archaeological heritage of Europe. It was supported by the R&D team at Sony Interactive Entertainment Europe (SIEE). The project has created technologies for developing educational VR (virtual Reality) games and published two Educational Environmental Narrative (EEN) games, based on different cultural heritage site, on the European PlayStation Store (https://store.playstation.com/en-ie/product/EP2996-CUSA12481_00-THEIMPERIALFORUM (accessed on 26 May 2021)). the first game was The Chantry and is based on the life and work of Dr Edward Jenner, the doctor associated with the discovery of vaccination. The second game was “A Night in the Forum” a story centred on the Forum of Augustus at the beginning of Imperial Rome [21]. The Latter was performed by the CNR ISPC in collaboration with VRTron. Virtual reconstruction here plays an important role as it improves cognitive processes by making historical and archaeological data easily understandable to the public. The archaeological site of the Forum of Augustus is articulated in numerous buildings and has been the subject of studies for many years [29,30]. The reconstruction work followed the five-step method and was carried out after a process of analysis and interpretation of the sources in collaboration with the staff of the Museo dei Fori Imperiali - Mercati di Traiano. The reconstructive model has been designed starting from the digital replica of the archaeological site and from some architectural fragments that was digitised using photogrammetric techniques. The missing parts have been completed by referring to the archaeological discoveries, iconographic testimonies, historical-archaeological documents, and stylistic comparisons. In addition to the digital replica and the reconstructive model, a proxy model was created to keep track of the virtual reconstruction activities and to visually show the difference between the original parts, those repositioned by virtual anastylosis processes and those reconstructed based on deductions or comparisons. (see Figure 4). As mentioned, the goal of the project was not to produce a critical review of the Forum of Augustus, which has already been interpreted and published in numerous studies over the years, but to connect the world of archaeology with the domain of the applied games. Moreover, since the site has been excavated in several stages since the first half of the 19th century, it was not always possible to have the original excavation data available and carry out a detailed mapping of the stratigraphies and report them in the EM. Therefore, in this specific case, the reconstruction was based on already known and published interpreted studies rater than raw data and the application of EM was carried out only to organise these studies and produce a coherent representation model. Given that the EM was performed using a more concise approach based on tables instead of a node structure [19]. This part, however, is not displayed in the VR game. Indeed, for obvious reasons of synthesis and communication, recognizability of the original part of the monuments and transparency of the data are guaranteed in the game by using visual and narrative workaround. During the exploration within the video-game, the player explores the site in its current state of preservation before viewing the reconstruction. This way he can distinguish the real data from the interpreted one. Lastly, the immersive visit with VR headset allows the user to have a full-scale perception of the space and volumes that surrounds him.
4.3. Onde Marine, Necropolis of Banditaccia (Cerveteri, Italy)
Within the collaboration—started with the European 3D-ICONS project (http://3dicons-project.eu/ (accessed on 26 May 2021))—between the Soprintendenza Archeologia del Lazio e dell’Etruria Meridionale and CNR-ISPC (former ITABC) for the use of innovative methodologies for the study and valorisation of the Banditaccia Necropolis, a large number of 3D survey and documentation activities was carried out [31]. One of the most important was performed in 2015 in the Necropolis of Banditaccia (Cerveteri) and was focused on the archaeological excavation of the tombs 2074-2072. Three unpublished burial chambers were found on the site, one of which was featured by bi-coloured painted decorations (red ochre and black). The 3D model, obtained by terrestrial photogrammetry and by UAV, was conceived both for technical (orthophotos, plans and sections at an archaeological scale—1:20 and 1:50) and communicative outputs (immersive head-mounted display, natural interaction, projection mapping). For this reason the 3D model was acquired with image-based technology in order ensure an high visual resolution and allowing a detailed characterisation of the wall surfaces (1 px/mm texture) [23].
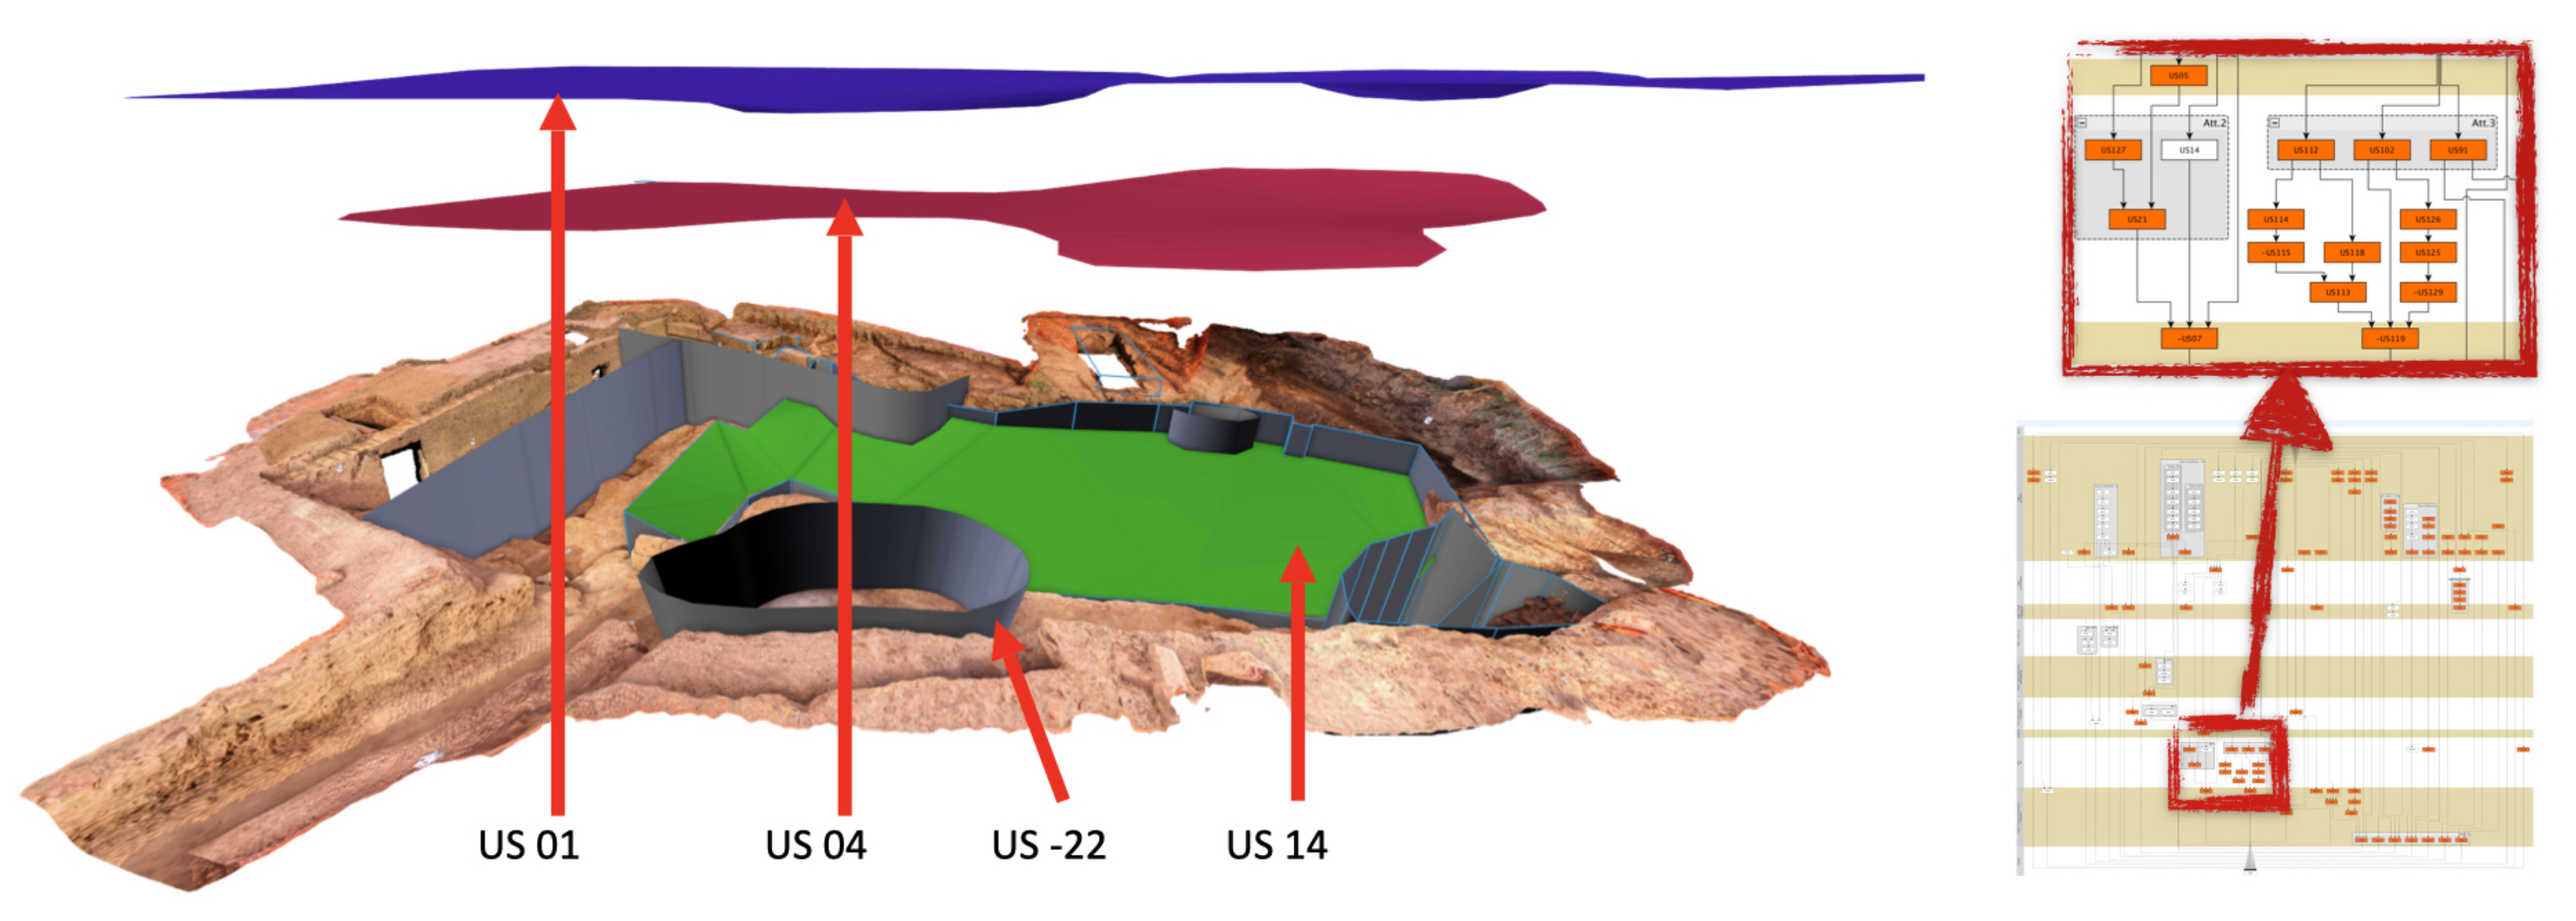
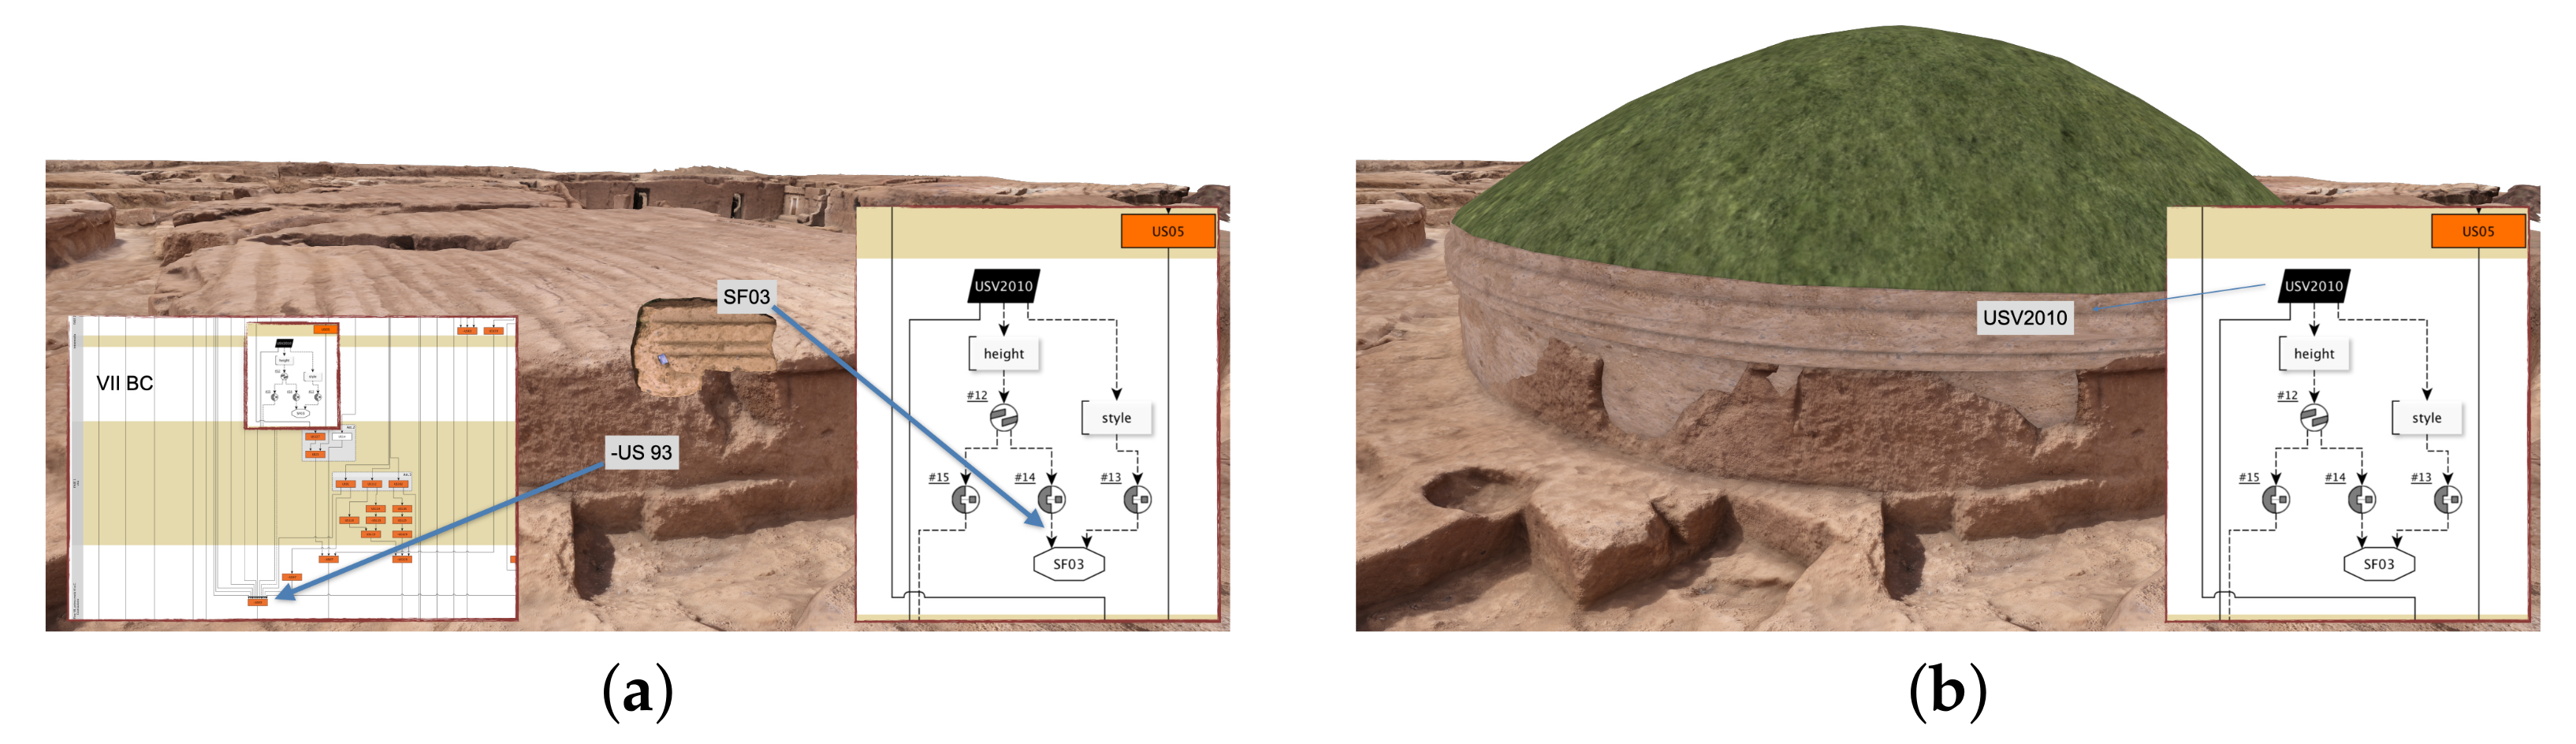
In order to obtain a virtual reconstruction of the funerary structures of the Onde Marine context, archaeological evidence was analysed and discussed with experts in the various archaeological, historical and architectural issues. This task was performed in Blender through the EMtools addon (see infra Section 5.2) by connecting the stratigraphic record collected on the field and formalized in the Matrix of Harris (through the yEd graph editor and a GraphML file format) with the proxy representation (see Figure 5). In our experience, this process enhanced the general comprehension of the transformation of the site (construction, phases of use of the necropolis, destruction of the site, activities of grave robbers etc.) resulting in a better interpretation of the site. After devising a stratigraphic analysis, the first reconstructive draft (proxy model) was elaborated by integrating the mounds of the missing parts and then adding architectural details (see infra Figure 6).
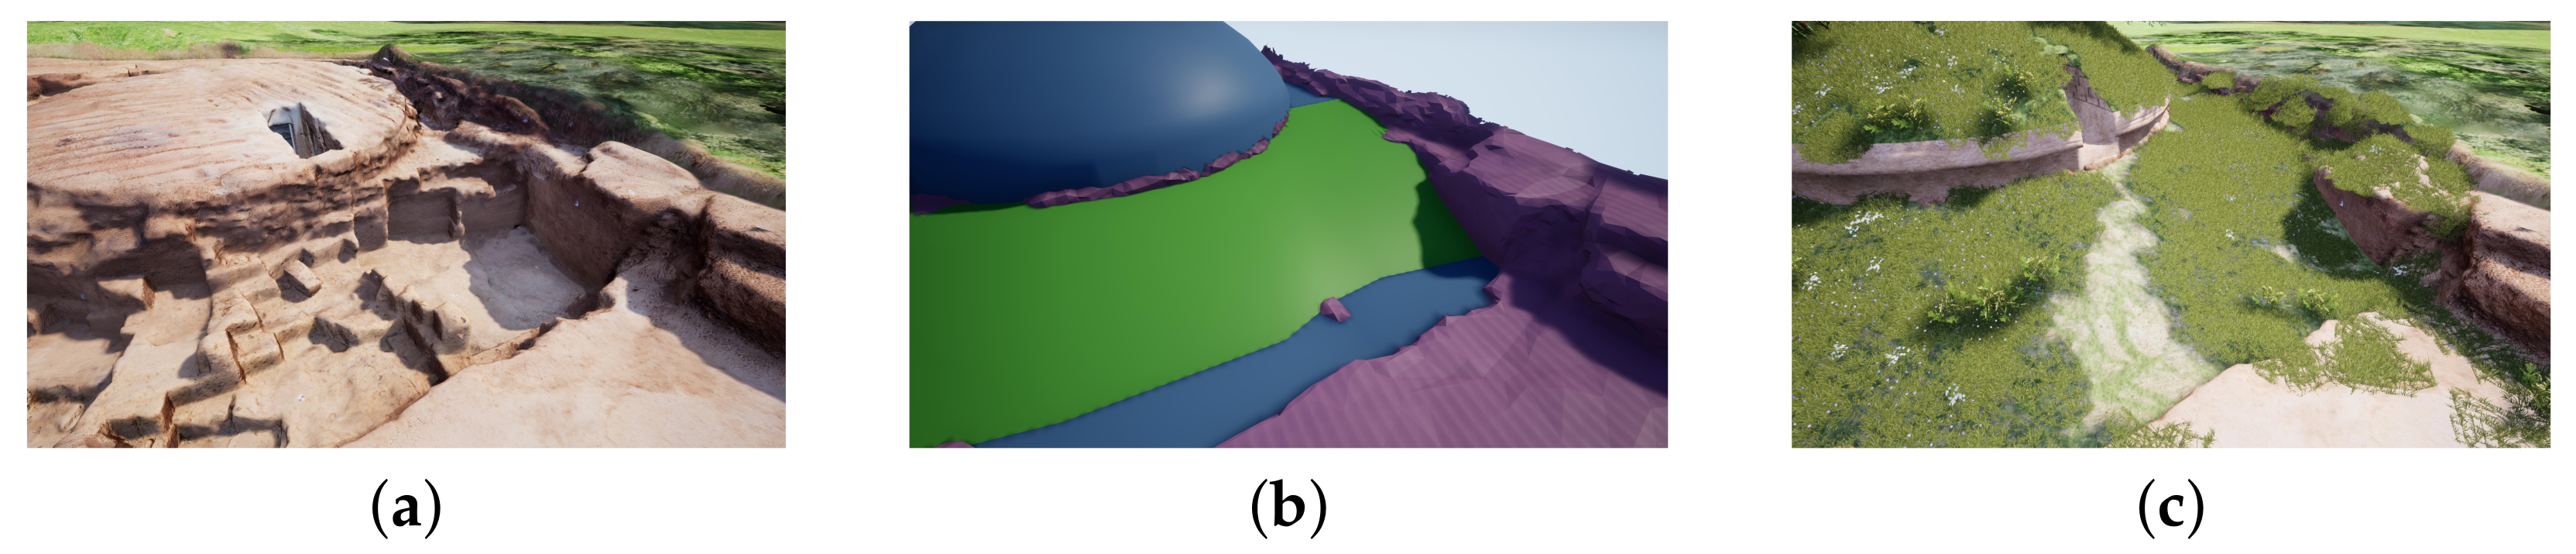
The 3D reconstruction of the mounds and their context was made using the digital replica of the site as a metric reference. In this way it was possible to progressively proceed with the reconstruction by displaying the two models in parallel, verifying dimensions, orientations and elevations and graphically visualising the relationship between the stratigraphic data (US/USM) and the virtual one (USV). Starting from geometric primitives or by extruding two-dimensional profiles obtained from drawings, the structures were progressively refined by adding details with digital sculpting operations and finally by assigning shaders and textures that simulated the materials in order to give the reconstruction a realistic appearance (representation model - RM). Based on the process described above, it is possible to represent the site through three different views: the digital replica, the proxy model referring to different degrees of reconstructive reliability and, finally, the representation model (see Figure 7).
4.4. Amba Aradam, (RM, Italy)
In 2015–2018 a large-scale archaeological excavation [18,32,33], under the scientific direction of the ”Soprintendenza Speciale Archeologia Belle Arti e Paesaggio di Roma”, was made to build the Amba Aradam station on Rome’s new underground line C.
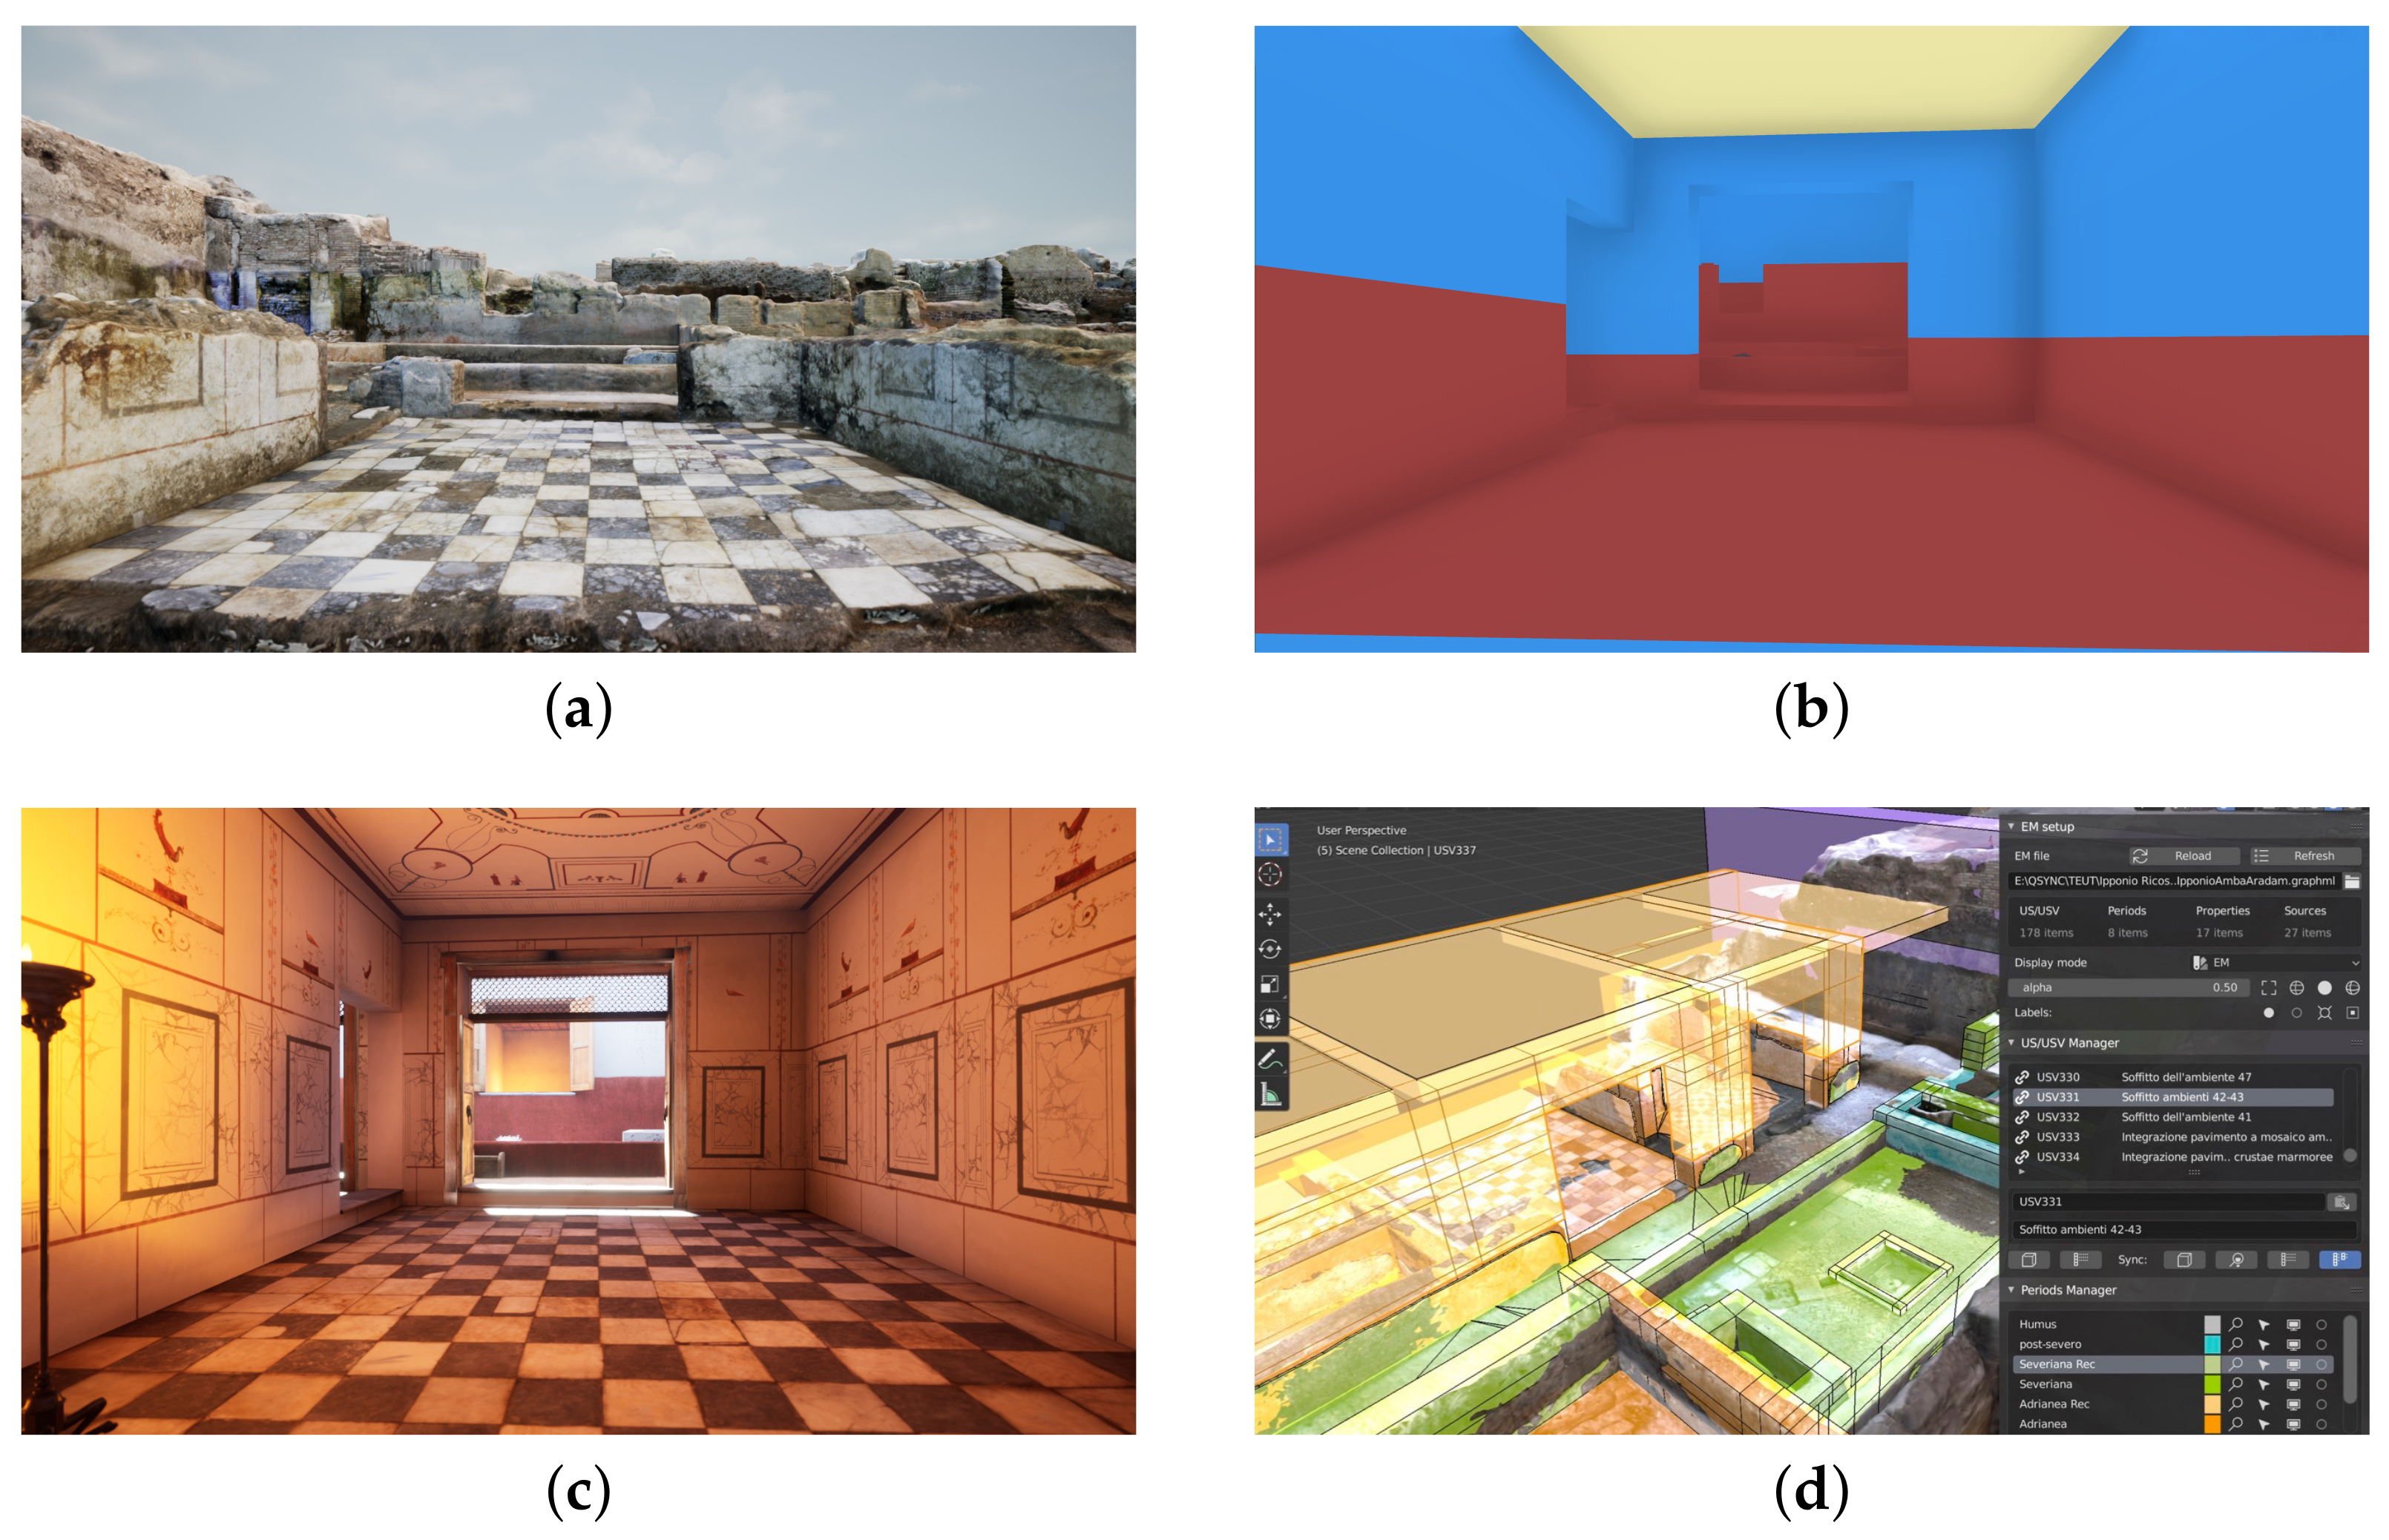
The archaeological excavation covered about 3000 m at a depth of about 9 m and brought to light part of a large military complex dating from the first half of the 2nd century AD. The complex structure consists of two levels created by a terracing built respecting the original orography of a water course that ran parallel to the future Aurelian walls. This barracks is part of a larger group of military structures built on the slopes of Monte Celio. The enormous extension of the excavation area both in terms of the surface area involved and in terms of the depth reached in relation to the ground level of the present-day city made it necessary to adapt the standards of archaeological documentation through new 3D tools, including the use of the Extended Matrix to facilitate the formulation of interpretative hypotheses. A series of high resolution surveys of the excavation were carried out as the excavation progressed and the structures were documented and disassembled (3D snapshots) in order to create an optimised digital replica that could be explored in real time within a 3D scenario. This digital documentation, together with the stratigraphic study and comparisons with other archaeological sites, was the starting point for the development of a reconstructive hypothesis using EM methodology. The digital replica, the proxy model and the representation model (see Figure 8) were used for the production of plans and sections and technical views and for the production of a computer graphics film that allows the exploration of the entire barracks complex in the Severian period.
4.5. Great Temple (Sarmizegetusa, Romania)
The Great Temple of Sarmizegetusa is the largest known temple in the ancient Roman province of Dacia (modern Romania) [34]. Its state of preservation is extremely poor, with only the perimeter of the foundations and a series of about 50 architectural fragments, some of which were found during recent excavation campaigns of the National Museum of Transylvanian History (MNIT). The project of interpretation and virtual reconstruction of the temple was carried in the period 2012–2015 as a PhD project at the University of Bucharest and contributed in the creation of 3D assets for the Europeana digital library promoted by the 3DICONS (http://3dicons-project.eu/ (accessed on 26 May 2021)) project.
The aim of the research was to define the EM integrated methodology (version 1.0 [14]) in order to combine the archaeological record coming from the excavation (stratigraphic analysis of the masonry) with the hypothesis of virtual reconstruction. The case study of the Great Temple of Sarmizegetusa Ulpia Traiana was used as a first test bed to validate the benefits of the EM during the whole process of data collection and interpretation.
The project led to the production of a digital replica of the temple remains and architectural fragments, the formulation of standardised technical blueprints (see Figure 9) related to the publication of virtual reconstruction, including the 3D survey, proxy, and representation model (see Figure 10), along with sheets with the list of UUSS and virtual activity reports. Furthermore, the 3D models were used as assets for a virtual museum installation within the exhibition ”3D Roma—Sarmizegetusa. Turn on the History” which took place at the National Museum of Transylvanian History in the city of Cluj-Napoca - Romania (7 April–30 September 2016). It was the first museum installation carried out with the data collected on the ancient roman city of Colonia Dacica Sarmizegetusa and a concrete example of a full workflow, from photogrammetric 3D acquisition to dissemination by means of applied game, using the EM method [35].
4.6. Craft Building (Montebelluna, Italy)
Between 2006 and 2010 the interdisciplinary team from the University of Padua investigated, in co-direction with the Superintendence, a Roman building in the locality of Posmon, on the western edge of Montebelluna, an important settlement of the ancient Venetians, which in Roman times became a minor centre, located at the foot of the hillside, near the outlet of the Piave River into the plain. The craft building in Montebelluna, active from the first to the third century A.D., consisted of seven rooms (A, B, C, D, E, F and G) arranged around a central courtyard (I) and a rear annex (H) occupying an area of approximately 200 m. From a laser scanner survey and a series of images taken by a SAPR (drone) of the excavation, a digital replica was produced. In recent years, research and enhancement activities have continued, culminating in the exhibition ”Sapiens. Da cacciatore a cyborg” exhibition, held in 2020 at the Museum of Natural History and Archaeology in Montebelluna. In the section dedicated to the man-craftsman there is a 1:1 scale reconstruction of part of the Montebelluna forge, some iron objects and tools found at the site, specially restored, and a reconstructive hypothesis developed, using the EM methodology, by the CNR-ISPC (see Figure 11) and disseminated through a computer graphics video (see Figure 12) that for the first time, starting from the excavation data, showed what the building must have looked like through virtual reality systems.
Prior to the virtual reconstruction, an excavation matrix of the wall structures alone was processed in the yEd software. The information contained in the matrix was then studied and visualised in 3D space using EMtools. Thanks to this tool, it was possible to visualise the archaeological excavation by breaking it down into its various phases, to transform the classic excavation matrix into a three-dimensional stratigraphic sequence and to edit a critical edition of the reconstructive hypothesis.
4.7. Roman Villa Out of Porta Marina (Ostia, Italy)
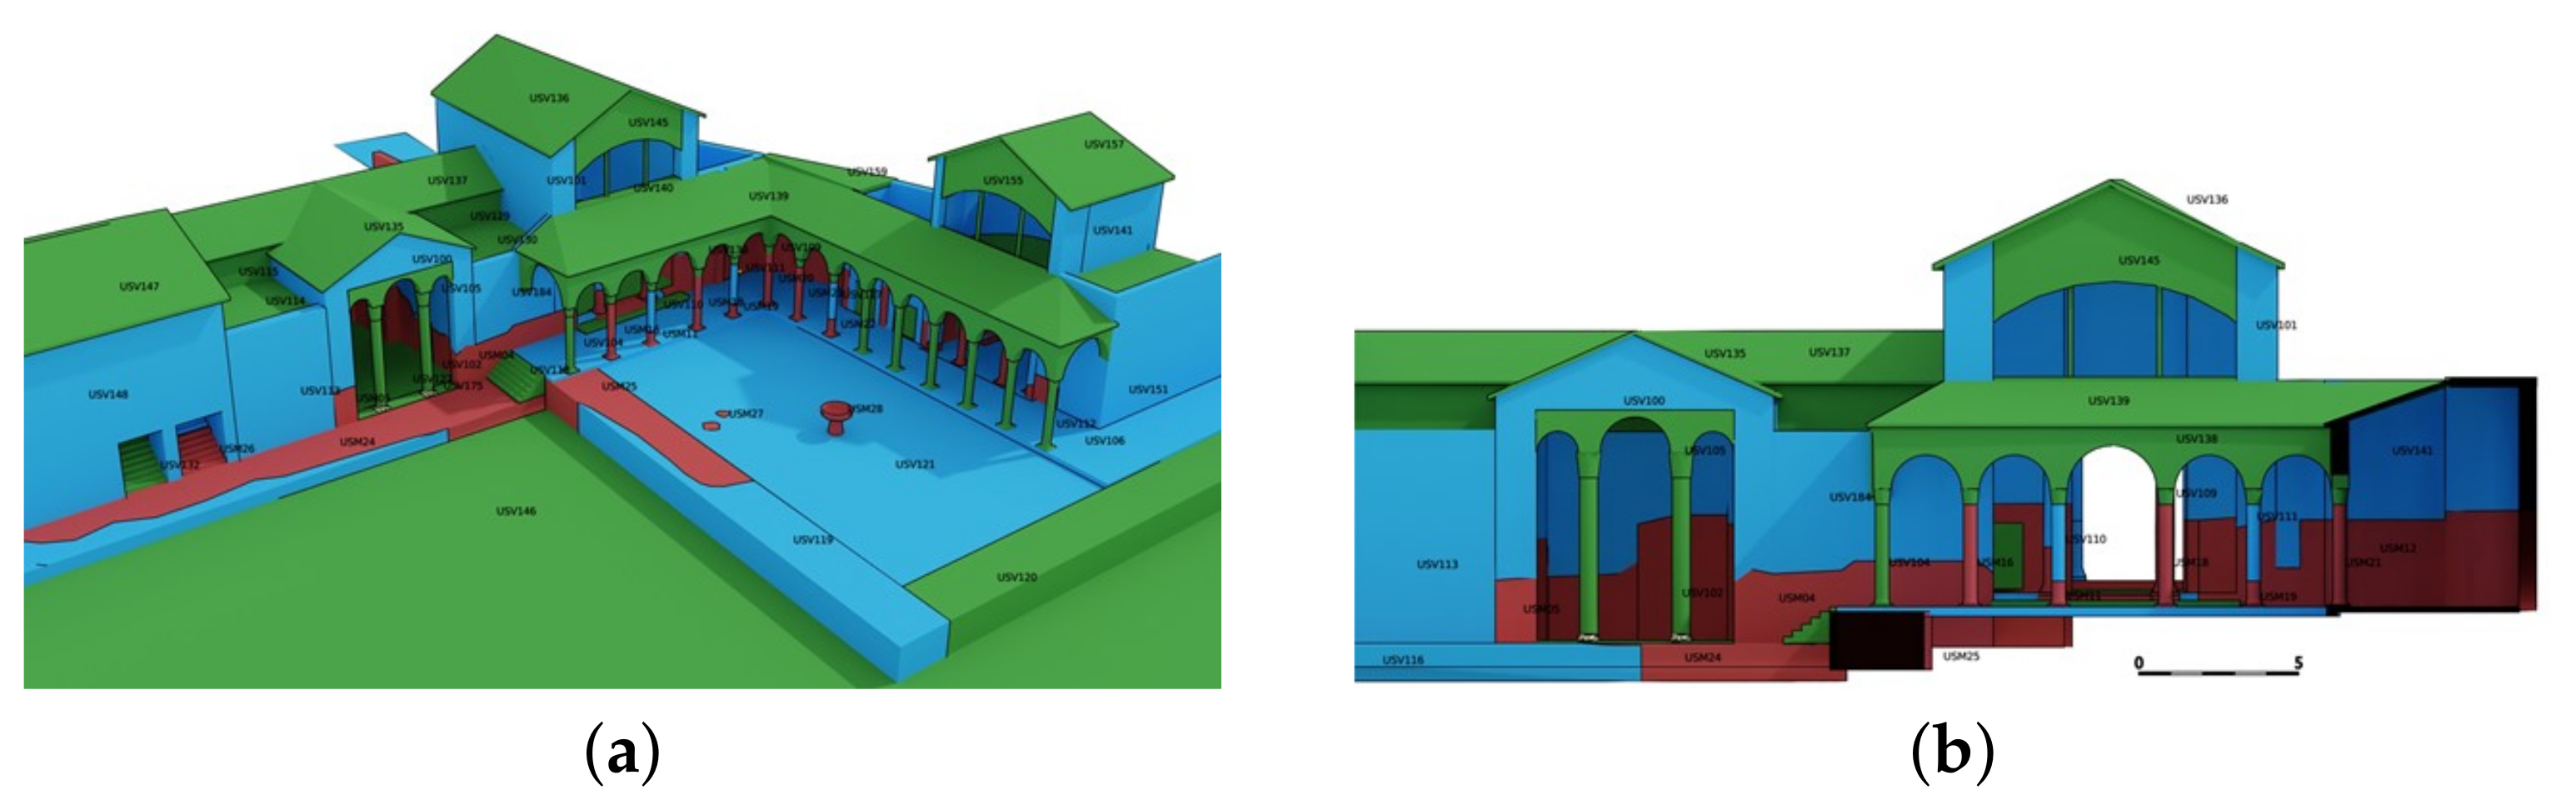
The site of the Sala dell’Opus, within the ”Roman villa out of Porta Marina,” was excavated in detail from 1956 on-wards, while at the same time a restoration project of the decorative stone material was carried out, with the first complete publication in 1967 by Giovanni Becatti [36]. This publication remains to this day the main documentary reference point for this context. In addition to this study, a laser scanning survey was recently carried out by the Kyushu University team led by Prof. Hory and a photogrammetric survey, supplementing it, was carried out in 2019 by the Virtual Heritage Lab (VHLab) of the CNR-ISPC. The archives of the Ostia Antica Archaeological Park have made available the graphic documents of M.A. Ricciardi, some of which are unpublished, relating to the analytical and reconstructive study of the opus room and its immediate surroundings in the Porta Marina district. These ”local sources” (coming directly from the study of the context) were included in a dossier comparatif together with comparative studies coming from other contemporary contexts and synthesis studies on Roman architecture able to provide general assumptions on specific aspects less documented by the ”local sources” such as the wooden roofs and the functional structures of the building site. The reconstruction methodology adopted was the Extended Matrix: starting from the survey data and through a stratigraphic analysis, a complete 4D record of the site was produced (see Figure 13) highlighting different phases of the site; this data-set was used to propose a reconstructive record through an EM graph and a series of proxy models (see Figure 14).
5. Methods
Over the last few years, we have been working on the development and improvement of the Extended Matrix, the approach and methodology of which has been described in the introduction and in Section 2. The above mentioned case studies allowed us to put the theoretical aspects into practice and to improve the method and application tools. We have now delivered the version 1.2, which introduces substantial innovations by resolving some gaps and responding to needs that have arisen over the years.
5.1. Extended Matrix 1.2
The Extended Matrix in both the 1.0 [14] and 1.1 [15] versions limited itself to ‘extending’ the classical Matrix by adding the nodes relating to the reconstructive discourse but, at a later stage, the need was felt to also improve the formal tools for describing the ‘existing’ stratigraphy. Thus, in order to better understand the tools and the formal language of the EM, a reading of the 1.0 and 1.1 versions reference paper is suggested. It has to be clarified that the EM versions propose incrementally new features so that elements and schematics of every previous version are still valid. Here we see some examples of extensions provided by EM 1.2. Often, in the stratigraphic analysis, one has to deal with a series of units rather than a single stratigraphic unit: a series of column plinths, a series of capitals, a series of thermal pavement foundations pilae, and so forth. In these situations, rather than giving a different number to each element, where it is desired to express elements arising from the same action, it is possible to use the “seriation” node (Figure 15a): it allows to formalize them in a convenient way, avoiding redundant information within the EM.
Another aspect that has been lacking in the matrix for many years is how to express the lifespan of a stratigraphic unit, enclosed between the moment of its execution and the moment of its destruction or defunctionalization. Although there have been several hypotheses and proposals, there was no solution in the literature consistent with the ‘graph structure’ of the matrix. In the EM the continuity of life is expressed through a continuity node (a black rhombus, Figure 15b) that marks the end of the life of the stratigraphic unit (the beginning is marked by the stratigraphic unit itself).
The aspect that marks a greater distance of the EM with regard to the classical matrix is the introduction of paradata (expressing data provenance). In order to understand the importance of documenting the origin of the data collected, it is necessary to make an aside on how a US is described through the textual and graphic apparatus.
Each stratigraphic unit is identified starting from an autoptic analysis that is formalised through textual information (name of the stratigraphic unit, site of belonging, day of discovery, etc.) and through visual aids such as a technical drawing (an excavation blueprint, a photogrammetric survey, a photograph with a metric pole and arrow of the North etc.).
The representation of the stratigraphic unit is a crucial tool for documenting its shape, spatial positioning and dimensions in a coherent manner. However, it is not unusual for the documentation of a stratigraphic unit to be entrusted to several documents.
Let us consider an example. In some cases, the analysis of the walls of buildings that are still preserved, as in the case of a historical building, does not allow us to appreciate the real thickness of some wall structures built by leaning against and subsequent stratification, precisely because of the lack of structural gaps. In this case the information of height and length of the wall readable in the photogrammetric survey, must be integrated with the information of a micro-carving or another non-invasive technique to determine the thickness of the wall.
In this example, it is necessary to combine several graphical drawings in order to document the dimensional properties of a stratigraphic unit. In an Extended Matrix it is possible to input this information. Through document nodes (in which the aforementioned graphic works are cited), extractor nodes (in which it is specified how these sources are interpreted) and through a combiner node (to illustrate the scientific reasoning), the origin of the information is formalised.
A proxy model is therefore designed to provide a picture as complete as possible of the stratigraphic unit, taking into account the various graphic and textual documents available that contribute to the description of its dimensional characteristics and positioning.
In EM 1.2 the task of collecting sources has now a reference table (see Table 2) that helps experts to focus on relevant information. The use of a table, instead of a graph database at this initial stage, makes data entry quicker and easier for staff, without specific skills, to join the team.
EM 1.2 comes with an updated color chart (see Table 3) that now includes the proxies that represent the re-positioned non in situ (Virtual anastylosis) architectural fragments (Special Finds—SF) along with their virtual completion (Virtual completion of Special Finds—VSF).
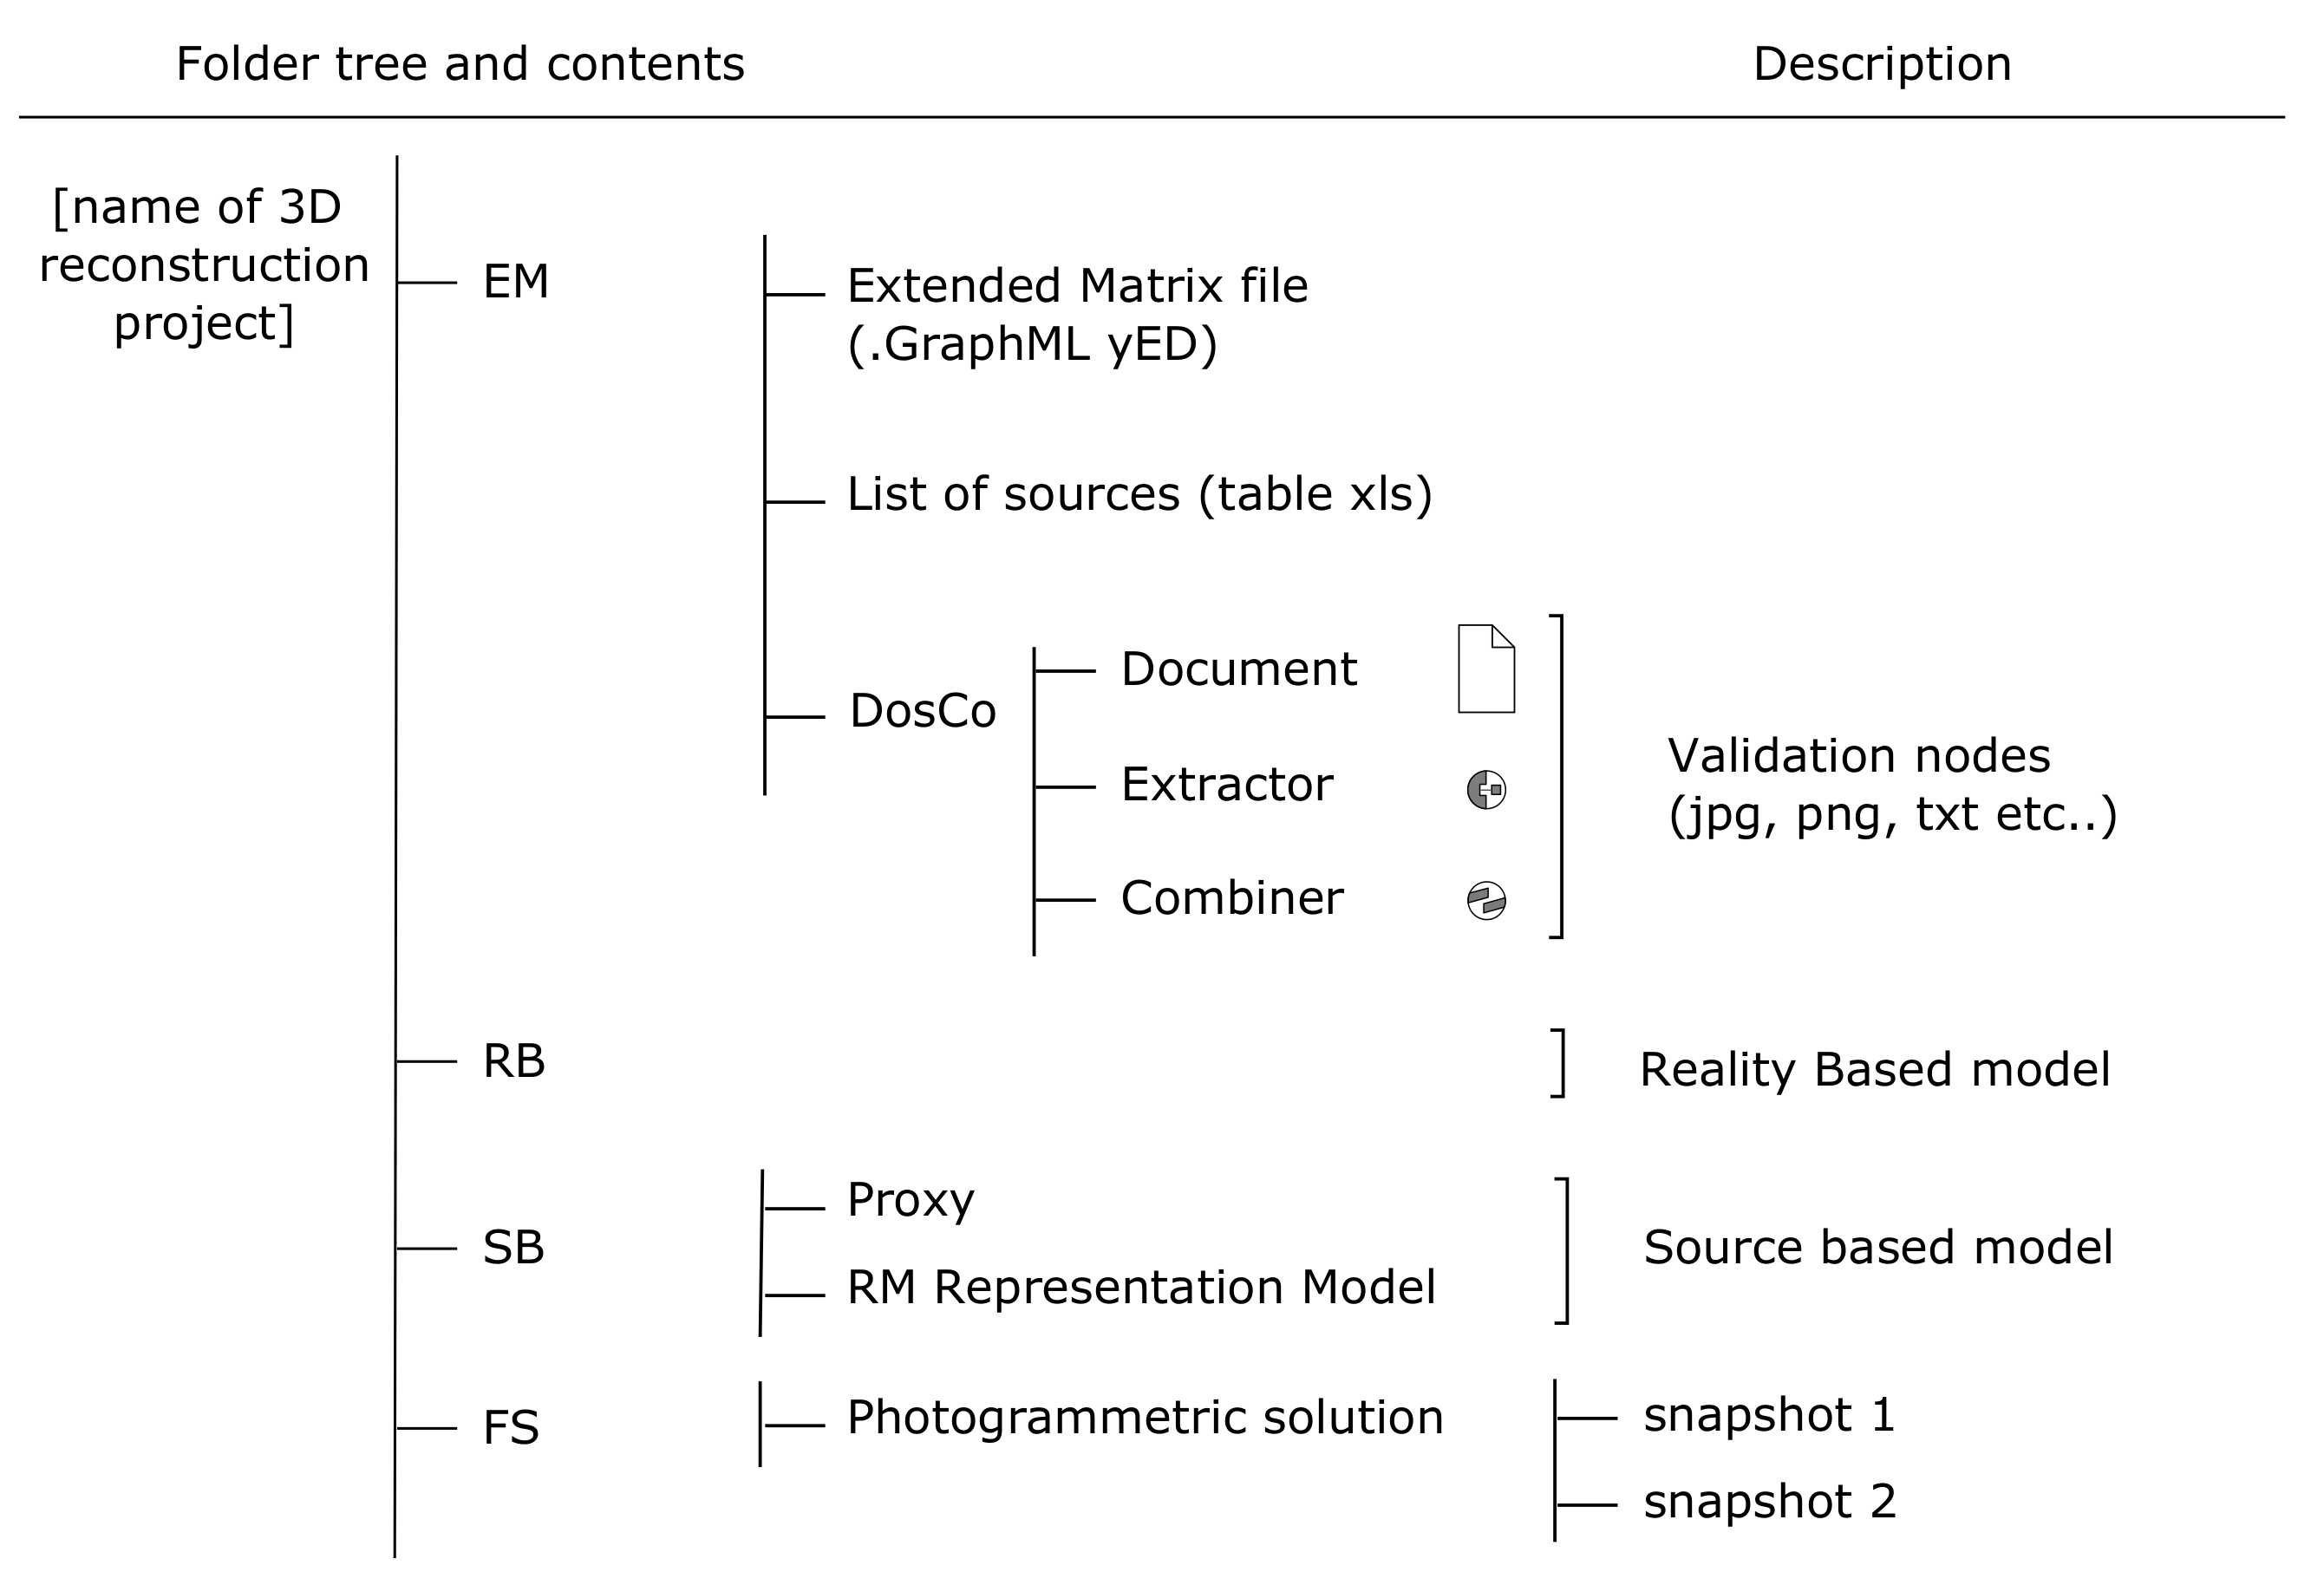
EM 1.2, thanks to the validation process made through several case studies, can finally propose a mature folder structure (see Figure 16) for a reconstruction project including the EM (Extended Matrix), the RB (Reality Based model, coming from image-based or range-based survey), the SB (Source Based model with proxies and, eventually, the Representation Model -RM), and the FS of Photogrammetric Solution (with the results of the Structure from Motion algorithms: camera position, Ground Control Points, and errors etc.).
5.2. Extended Matrix Framework 1.2: Software Tools for Reconstruction
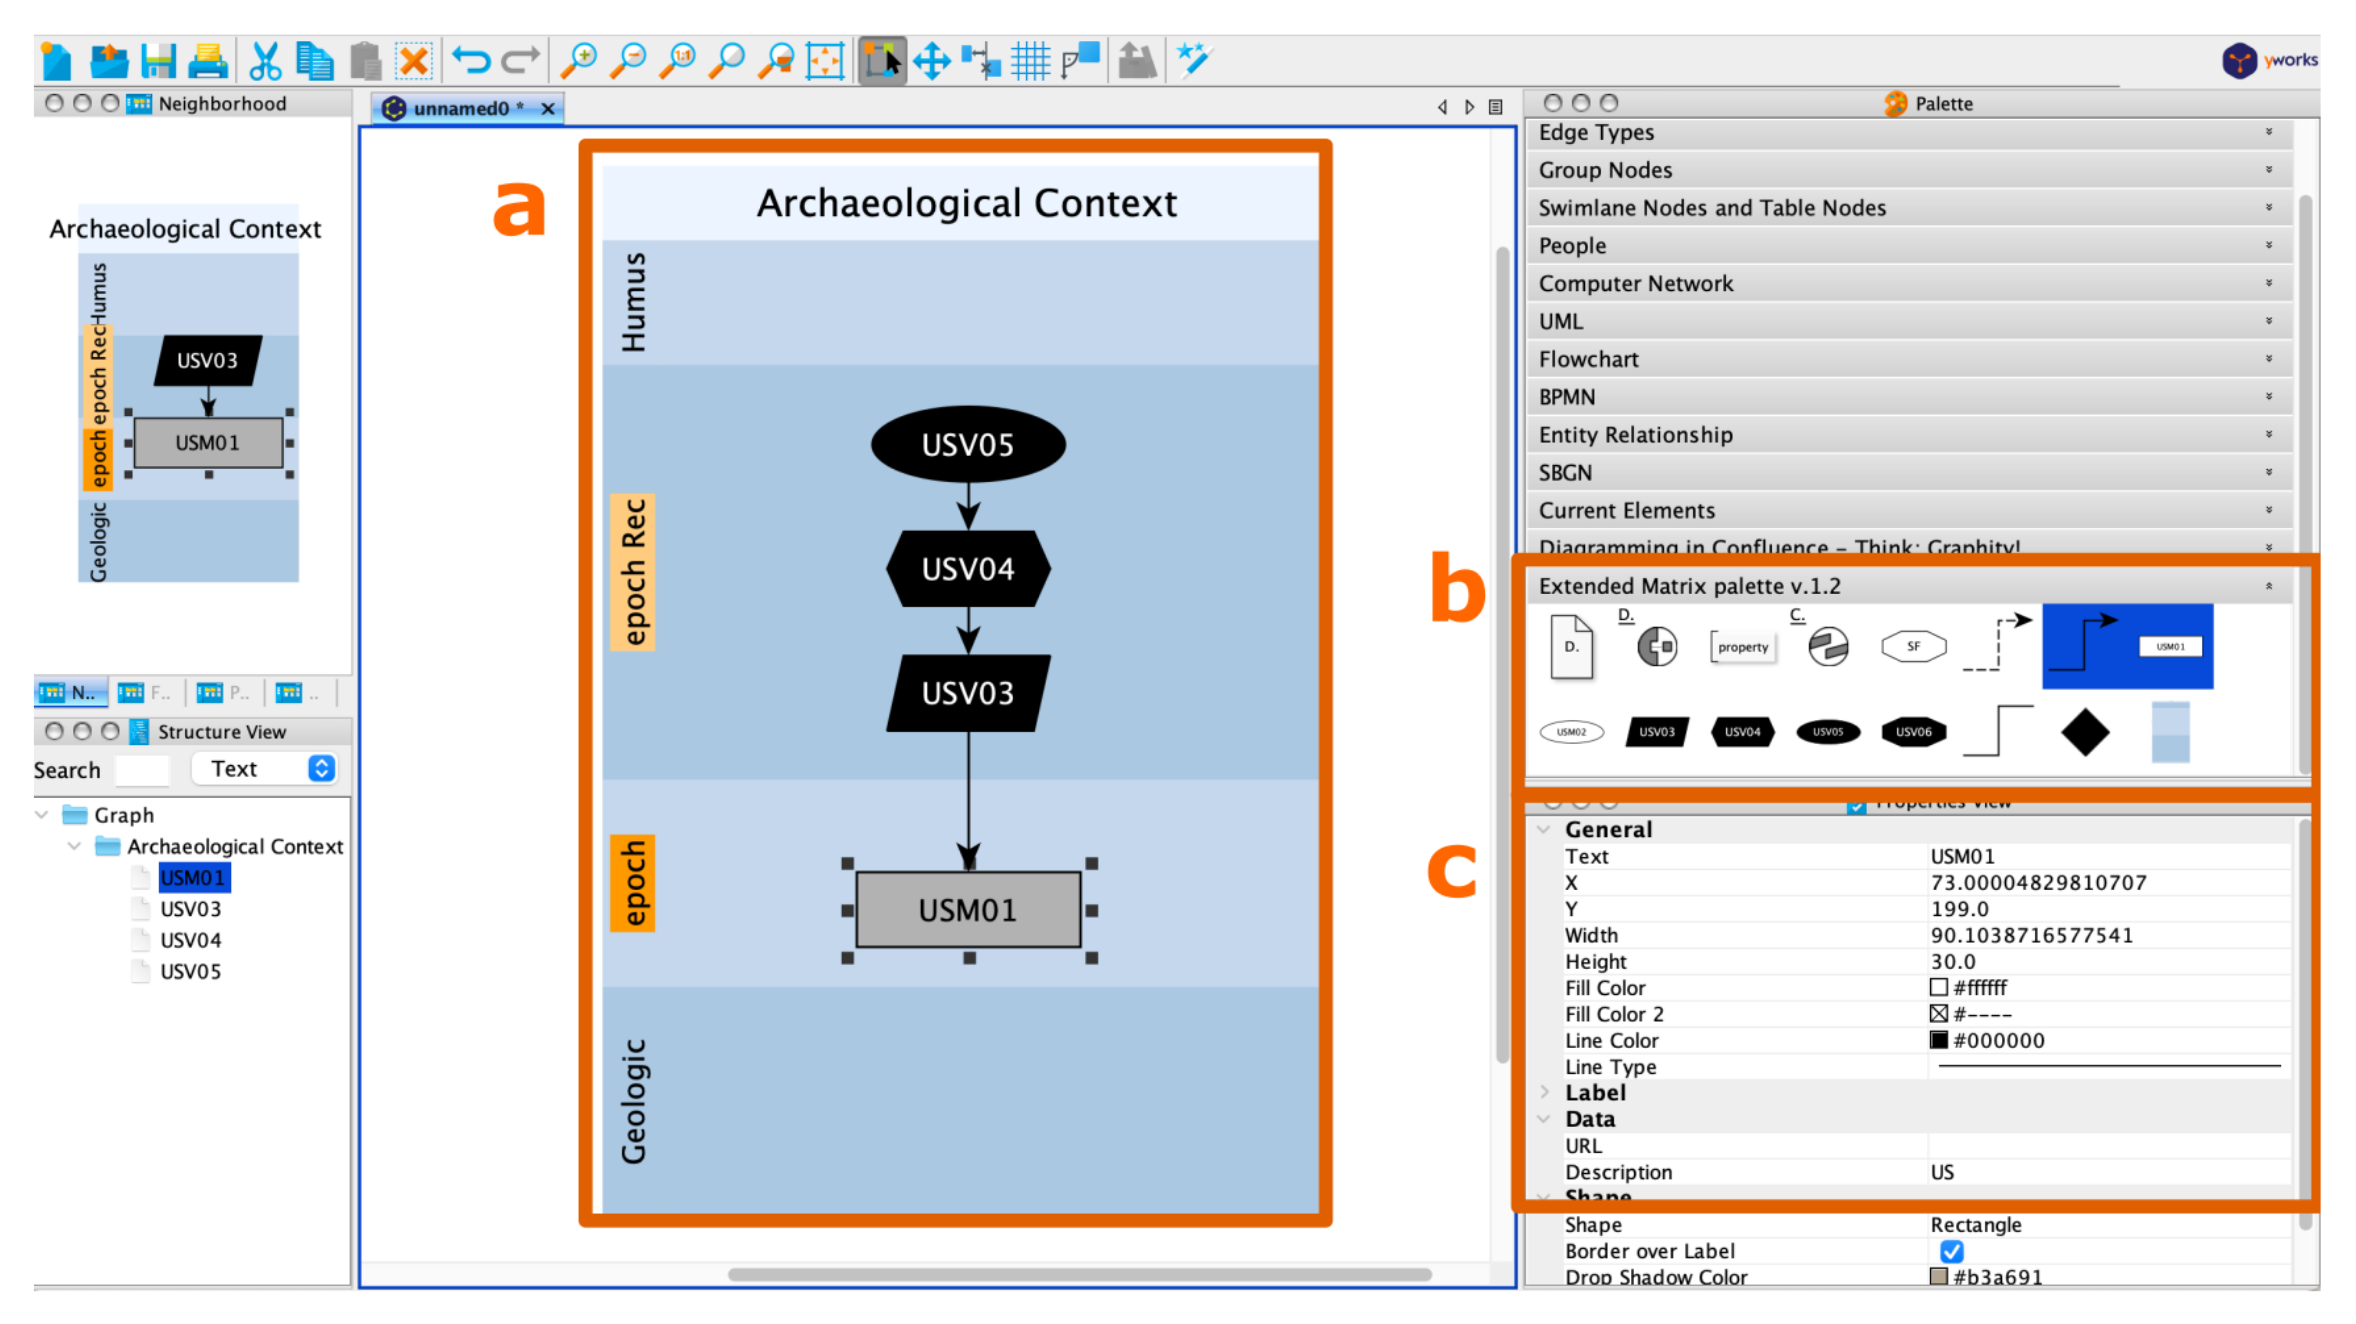
Despite the EM methodology is designed to be software-agnostic, there are currently three recommended digital tools: yEd (http://yed.yworks.com (accessed on 26 May 2021)) graph editor (see Figure 17), Blender (with the EMtools add-on) to connect graphs and 3D models, and EMviq (https://github.com/phoenixbf/emviq (accessed on 26 May 2021) a open source web-app based on Aton [37], http://osiris.itabc.cnr.it/aton/ (accessed on 26 May 2021)) for the online visualisation of the reconstructive record. Full references about the tools and tutorials are available on the EM site (http://osiris.itabc.cnr.it/extendedmatrix/ (accessed on 26 May 2021)).
EMtools [26] is an original software for semantic annotation and creation of reconstructive hypotheses in connection with an Extended Matrix (EM). The software, developed in Python as an add-on for the open source package Blender 3D (www.blender.org (accessed on 26 May 2021)), aims to enhance the processes of analysis, synthesis and dissemination in the field of cultural heritage sciences. The tool makes it possible to connect graph databases to proxy models within a 3D space according to the EM methodology. It is freely available under GPL3 license on Github (https://github.com (accessed on 26 May 2021)) and is under active development within the European SSHOC project (https://sshopencloud.eu (accessed on 26 May 2021)).
EM tools allows to:
- overcome the limitations currently present in BIM and GIS with regard to their lack of compatibility with graph databases;
- semantically annotate the stratigraphy within a 3D environment;
- create a critical edition of a reconstructive hypothesis.
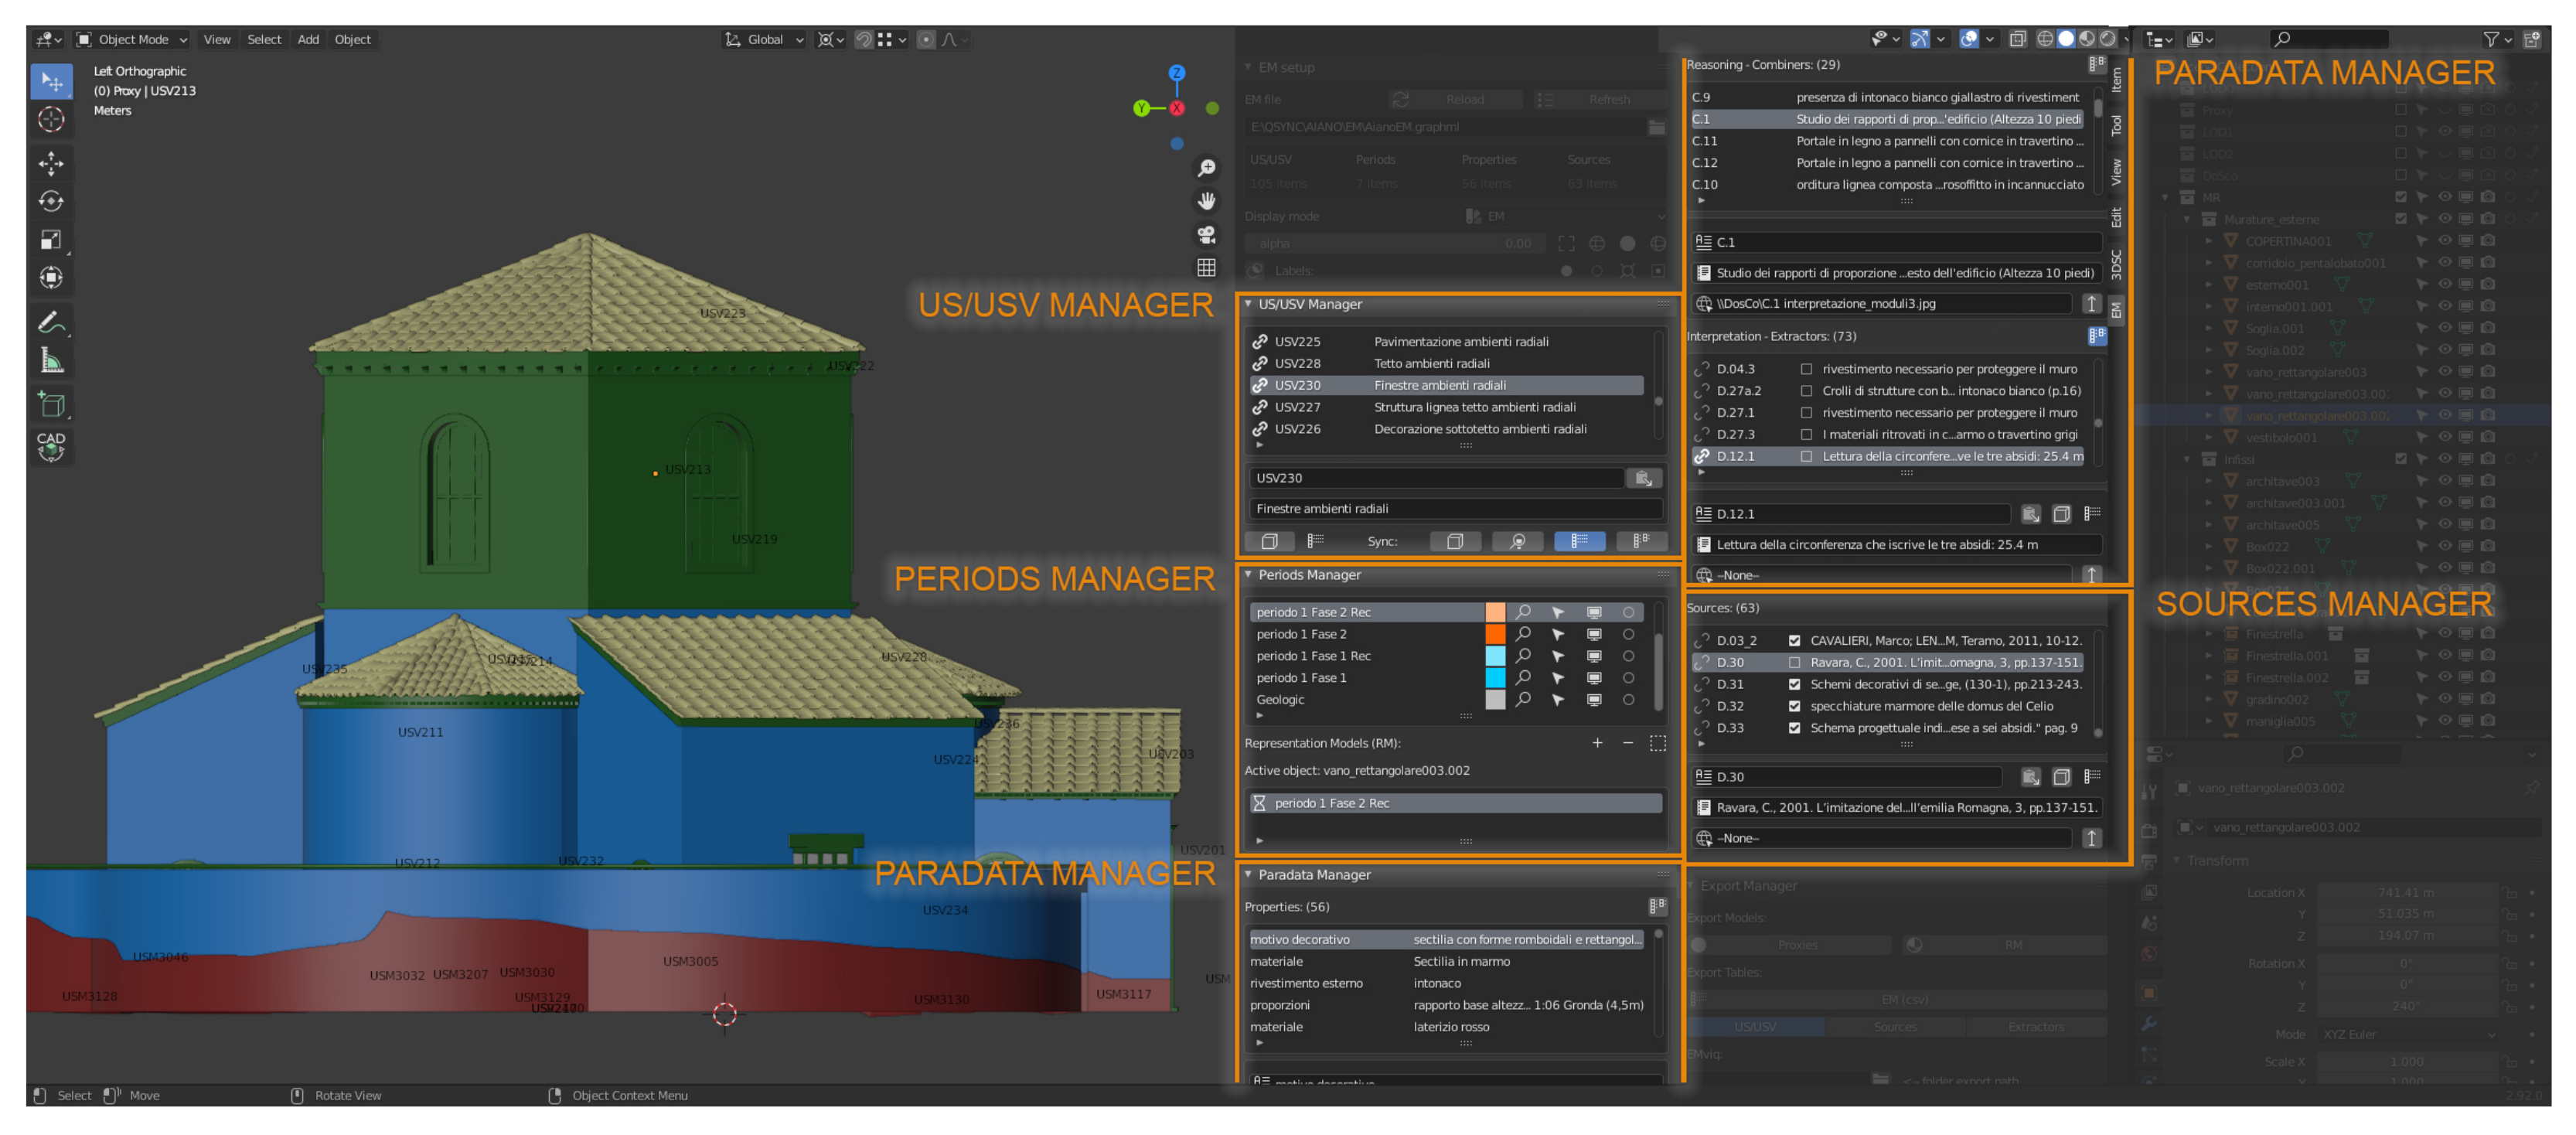
Once activated, the EM add-on is visible in the sidebar and allow to query the 3D model gathering the semantic data directly from the graph database. The add-on is composed by many tools allowing to query the proxy models and to activate different visualisation mode (see Figure 18). The tools are organised as follows:
- US/USV Manager: this tool allow to visualise US/USV ID’s and descriptions; activate and locate labels; select and zoom on selected item;
- Periods Manager: it allow to activate a specific colour coding on the proxy model. (1) Periods: in case the digital replica consists of multi-layered archaeological remains formed in different historical periods, the tool assigns a different colour to the proxy model depending on the historical period; (2) Levels of certainty: the tool assign to each segment of the proxy model one of the five coded colour according to archaeological evidences (see Table 3 and Section 2.3);
- Paradata Manager: This section displays the properties of each reconstructed element (USV), such as material, shape, appearance and size. In addition, specific information extracted from the sources (Extractors) and combined with each other (Combiners) in order to perform interpretative reasoning and deduce the above properties, is here accessible;
- Sources: finally, in this section, one can view the list of sources (Documents) and access the files previously saved in the data repository.
6. Conclusions and Future Works
The main topic debated within this paper was the validation of a standardised reconstruction process starting from seven case studies that contributed to the maturation of five clearly recognisable steps developed with the Extended Matrix methodology and that led to the definition of its new version (EM 1.2). The problems inherent to each virtual reconstruction project were analysed in the discussion Section 3 and specific solutions were proposed. The case studies have highlighted some gaps that should be filled in the future, such as the management of multiple hypotheses and a more detailed representation of the USV/n that currently belong to a category that is, perhaps, too broad. The former, in particular, is a long-debated issue. As highlighted by Barrat [13], in the dissemination context, there is a need to propose a clear and understandable hypothesis of the public hindering the use of alternative models. In academia there is also a tendency to propose a univocal solution because the management of multiple coexisting theories is complex and time-consuming, and alternative or fallacious hypotheses are often not published. These issues, together with a greater integration with CIDOC-CRM, are currently the focus of development and research to be included in the next versions of the EM.
Author Contributions
Authors (E.D. and D.F.) have equally contributed to this article, in terms of conceptualization, methodology, validation, formal analysis, investigation, resources, data curation, writing, review and editing, and supervision. All authors have read and agreed to the published version of the manuscript.
Funding
This research received no external funding. Projects mentioned as case studies, were funded by different institutions over the time; related information can be found in Section 4.
Acknowledgments
Authors would like to acknowledge all the colleagues and the Institutions who participated in the projects from which the case studies presented in Section 4 were taken: VHLab—CNR ISPC; UCLouvain; Museo dei Fori Imperiali—Mercati di Traiano, VRTron; Soprintendenza Archeologia del Lazio e dell’Etruria Meridionale; Necropoli della Banditaccia; Soprintendenza Speciale Archeologia Belle Arti e Paesaggio di Roma; Metro C S.p.A; Roma Metropolitane; Cooperativa Archeologia; Parsifal Cooperativa di Archeologia; National Museum of Transylvanian History (MNIT); Università degli Studi di Padova; Soprintendenza Archeologia, Belle Arti e Paesaggio per l’Area Metropolitana di Venezia e le Province di Belluno, Padova e Treviso; Parco Archeologico di Ostia Antica; Museo delle Civiltà (MuCiv).
Conflicts of Interest
The authors declare no conflict of interest.
References
- Reilly, P. Towards a virtual archaeology. In Computer Applications in Archaeology; British Archaeological Reports: Oxford, UK, 1990; pp. 133–139. [Google Scholar]
- Forte, M. About virtual archaeology: Disorders, cognitive interactions and virtuality. BAR Int. Ser. 2000, 843, 247–259. [Google Scholar]
- Frischer, B.; Niccolucci, F.; Ryan, N.S.; Barceló, J.A. From CVR to CVRO: The past, present, and future of cultural virtual reality. BAR Int. Ser. 2002, 1075, 7–18. [Google Scholar]
- Clark, J.T. The fallacy of reconstruction. In Cyber-Archaeology; Archaeopress Oxford: Oxford, UK, 2010; pp. 63–74. [Google Scholar]
- Rasmussen, M. Under the same roof. Experimental research and interpretation with examples from the construction of house models. In Experimental Archaeology between Enlightenment and Experience; Lund University: Lund, Sweeden, 2011; pp. 147–166. [Google Scholar]
- Demetrescu, E. Virtual Reconstruction as a Scientific Tool: The Extended Matrix and Source-Based Modelling Approach. In Digital Research and Education in Architectural Heritage; Number 817 in Communications in Computer and Information Science; Springer: Berlin, Germany, 2018; pp. 102–116. [Google Scholar] [CrossRef]
- Hermon, S.; Nikodem, J. 3D modelling as a scientific research tool in archaeology. In Proceedings of the CAA Conference Proceedings, Berlin, Germany, 2–6 April 2007. [Google Scholar]
- Sanders, D. Why do virtual heritage. Online Featur. Artic. Archaeol. Archive. Publ. 2008, 13, 2008. [Google Scholar]
- Dell’Unto, N.; Leander, A.M.; Dellepiane, M.; Callieri, M.; Ferdani, D.; Lindgren, S. Digital reconstruction and visualization in archaeology: Case-study drawn from the work of the Swedish Pompeii Project. In Proceedings of the 2013 Digital Heritage International Congress (DigitalHeritage), Marseille, France, 28 October–1 November 2013; IEEE: Piscatway, NJ, USA, 2013; Volume 1, pp. 621–628. [Google Scholar]
- Denard, H. A New Introduction to the London Charter. In A Paradata and Transparency in Virtual Heritage Digital Research in the Arts and Humanities Series; Bentkowska-Kafel, D., Baker, H., Eds.; Ashgate: London, UK, 2012. [Google Scholar]
- Lopez-Menchero, V.M.; Grande, A. The principles of the Seville Charter. In Proceedings of the CIPA Symposium, Prague, Czech Republic, 12–16 September 2011; Volume 2011, pp. 2–6. [Google Scholar]
- Baker, D. Defining paradata in heritage visualization. In Paradata and Transparency in Virtual Heritage; Routledge: London, UK, 2016; pp. 238–251. [Google Scholar]
- Barrat, R.P. Defining a Methodology for 3D Approximations in Archaeology: The Issue with Alternative Models. In Proceedings of the 23rd International Conference on Cultural Heritage and New Technologies 2018, CHNT 23, Vienna, Austria, 12–15 November 2018; pp. 1–5. [Google Scholar]
- Demetrescu, E. Archaeological Stratigraphy as a formal language for virtual reconstruction. Theory and practice. J. Archaeol. Sci. 2015, 57, 42–55. [Google Scholar] [CrossRef]
- Demetrescu, E.; Fanini, B. A white-box framework to oversee archaeological virtual reconstructions in space and time: Methods and tools. J. Archaeol. Sci. Rep. 2017, 14, 500–514. [Google Scholar] [CrossRef]
- Oldman, D.; Tanase, D. Reshaping the Knowledge Graph by Connecting Researchers, Data and Practices in ResearchSpace; Lecture Notes in Computer Science. In Proceedings of the Semantic Web—ISWC 2018—17th International Semantic Web Conference, Monterey, CA, USA, 8–12 October 2018. [Google Scholar]
- Demetrescu, E.; Ferdani, D.; Dell’Unto, N.; Touati, A.M.L.; Lindgren, S. Reconstructing the original splendour of the House of Caecilius Iucundus. A complete methodology for virtual archaeology aimed at digital exhibition. SCIRES-IT Res. Inf. Technol. 2016, 6, 51–66. [Google Scholar]
- Demetrescu, E. La ricostruzione dei paesaggi antichi attraverso l’integrazione di dati, metodologie e tecniche: Presente e futuro dagli esempi della Metro C a Roma. In Archeologi Nelle Terre di Bonifica. Paesaggi; Stratificati e Antichi Sistemi da Riscoprire e Valorizzare; Number 2 in TerrEvolute; Università Degli Studi di Pavia: Pavia, Italy, 2020; pp. 135–151. [Google Scholar]
- Ferdani, D.; Demetrescu, E.; Cavalieri, M.; Pace, G.; Lenzi, S. 3D Modelling and Visualization in Field Archaeology. From Survey to Interpretation of the Past Using Digital Technologies. Groma 2020. [Google Scholar] [CrossRef] [Green Version]
- Ferdani, D.; Fanini, B.; Piccioli, M.C.; Carboni, F.; Vigliarolo, P. 3D reconstruction and validation of historical background for immersive VR applications and games: The case study of the Forum of Augustus in Rome. J. Cult. Herit. 2020. [Google Scholar] [CrossRef]
- Pescarin, S.; Fanini, B.; Ferdani, D.; Mifsud, K.; Hamilton, A. Optimising Environmental Educational Narrative Videogames: The Case of ‘A Night in the Forum’. J. Comput. Cult. Herit. (JOCCH) 2020, 13, 1–23. [Google Scholar] [CrossRef]
- Pietroni, E.; Ferdani, D. Virtual Restoration and Virtual Reconstruction in Cultural Heritage: Terminology, Methodologies, Visual Representation Techniques and Cognitive Models. Information 2021, 12, 167. [Google Scholar] [CrossRef]
- Russo, A.; Cosentino, R.; d’Annibale, E.; Demetrescu, E.; Ferdani, D. La necropoli della Banditaccia di Cerveteri: Da Raniero Mengarelli agli UAV. Archeol. Aerea 2019, 11, 171–176. [Google Scholar]
- Demetrescu, E.; d’Annibale, E.; Ferdani, D.; Fanini, B. Digital replica of cultural landscapes: An experimental reality-based workflow to create realistic, interactive open world experiences. J. Cult. Herit. 2020. [Google Scholar] [CrossRef]
- Harris, E.C. Principles of Archaeological Stratigraphy; Elsevier: Amsterdam, The Netherlands, 2014. [Google Scholar]
- Demetrescu, E. EMtools Extended Matrix Tool (Python Add-On) 202. Available online: http://0-doi-org.brum.beds.ac.uk/10.5281/zenodo.4581456 (accessed on 26 May 2021).
- Serna, S.P.; Schmedt, H.; Ritz, M.; Stork, A. Interactive Semantic Enrichment of 3D Cultural Heritage Collections. In Proceedings of the VAST: International Symposium on Virtual Reality, Archaeology and Intelligent Cultural Heritage, Brighton, UK, 19–21 November 2012; pp. 33–40. [Google Scholar]
- Cavalieri, M. La villa tardoantica di Aiano (2005-2011/2014-2018). Bilancio di dodici anni di attività dell’UCLOUVAIN in Val d’Elsa (San Gimignano, SI). Bollettino di Archeologia 2019, 10, 159–172. [Google Scholar]
- Ungaro, L. Storia, Mito, Rappresentazione: Il Programma Figurativo del Foro di Augusto e l’Aula del Colosso; L’Erma di Bretschneider Srl: Roma, Italy, 2008; pp. 399–417. [Google Scholar]
- Ungaro, L. Foro di Augusto, Casa dei Cavalieri di Rodi, Museo dei Fori Imperiali. Ricostruzioni, ricomposizioni, anastilosi dalla Ripartizione X AA. BB. AA. alla Sovrintendenza Capitolina ai Beni Culturali. Bull. Della Comm. Archeol. Comunale Di Roma 2015, 116, 281–310. [Google Scholar]
- Benedettini, M.G.; Cosentino, R. L’altipiano delle Onde Marine nella necropoli della Banditaccia, Cerveteri: Il Tumulo Della Protome Equina e il Suo Insospettabile Corredo. In Mediterranea: XIV, 2017; Edizioni Quasar: Rome, Italy, 2017; pp. 7–38. [Google Scholar]
- Demetrescu, E.; Morretta, S.; Rea, R. Urban archaeology and digital applications: The Amba Aradam station of the underground line C in Rome. In Proceedings of the XVIII International Forum Le Vie dei Mercanti-World Heritage and Contamination, Naples, FL, USA, 26 September 2020; pp. 1075–1084. [Google Scholar]
- Demetrescu, E. Digital replicas and 3D virtual reconstructions for large excavations in urban archaeology: Methods and techniques drawn from the “Metro C” case study in Rome. In Digital Research and Education in Architectural Heritage; Springer: Berlin, Germany, 2018. [Google Scholar]
- Ciongradi, C. Grabmonument und Sozialer Status in Oberdakien; Mega-Verlag: Berlin, Germany, 2007. [Google Scholar]
- Antal, A.; Bota, E.; Ciongradi, C.; D’Annibale, E.; Demetrescu, E.; Dima, C.; Fanini, B.; Ferdani, D. A complete workflow from the data collection on the field to the deployment of a virtual museum: The case of virtual Sarmizegetusa. In Proceedings of the 14th Eurographics Workshop on Graphics and Cultural Heritage, Genova, Italy, 5–7 October 2016; pp. 75–78. [Google Scholar]
- Becatti, G. Scavi di Ostia; Edificio con Opus Sectile fuori Porta Marina: Rome, Italy, 1967; Volume VI. [Google Scholar]
- Fanini, B.; Cinque, L. Encoding, Exchange and Manipulation of Captured Immersive VR Sessions for Learning Environments: The PRISMIN Framework. Appl. Sci. 2020, 10, 2026. [Google Scholar] [CrossRef] [Green Version]
Figure 1.
The USV describes potential (virtual) elements in space and time, directly connected to extant remains (USV/s 100) or without any physical connection (USV/n 101). Node shapes and names follow the EM formal language conventions [14,15].

Figure 2.
An overview of the reconstructive process: (1) Data collection: digital replica of an archaeological site and related sources; (2) Data management and analysis: proxy model of the extant structure semantically enriched with stratigraphic information from the Matrix; (3) Implementation and virtual reconstruction: proxy model of the reconstructive hypotheses is drawn and connected with the EM. See colour chart in Table 3; (4) Representation model: reconstructive model provided with textures and materials; (5) Publication and dissemination: rendering of the model according to the chosen aesthetic style and the publication context.

Figure 3.
An applied example of the EM: the reconstruction of the apse, USV 212, together with data and paradata used. See colour chart in Table 3.
Figure 3.
An applied example of the EM: the reconstruction of the apse, USV 212, together with data and paradata used. See colour chart in Table 3.

Figure 4.
Virtual reconstruction of the Temple of Mars Ultor in the Forum of Augustus. Above: the examples shows different model created within this project: (a) Actual model; (b) Reconstructive model (only volumes); (c) Representation model (geometry, shaders and textures). Below: example of the first 4 steps of the EM workflow applied on a column of the porticus: (1) Digital replica and data collection; (2) Data management and analyses; (3) Interpretation and virtual reconstruction (proxy model) (4) representation model. See colour chart in Table 3.

Figure 5.
Proxies related to the stratigraphy of the Onde Marine excavation in 2015. On the right the EM representation. The proxies have a color schema based on the epochs they belongs to.
Figure 5.
Proxies related to the stratigraphy of the Onde Marine excavation in 2015. On the right the EM representation. The proxies have a color schema based on the epochs they belongs to.

Figure 6.
Reconstruction process of the mound 2488 of the Onde Marine site. (a) Special Find (SF) relocated in its supposed original place. Below the EM with the negative stratigraphic unit related to the destruction. (b) USV 2010 related to the reconstruction hypothesis of the mound 2488. As in the detail of the EM on the right, some of the properties are based on the relocated SF03.

Figure 7.
Digital Replica (DR, a), Proxy model (b) and Representation Model (RM, c) related to the mound 2471 of the Onde Marine site. See colour chart in Table 3.
Figure 7.
Digital Replica (DR, a), Proxy model (b) and Representation Model (RM, c) related to the mound 2471 of the Onde Marine site. See colour chart in Table 3.

Figure 8.
Digital Replica (DR, a), Proxy model (b) and Representation Model (RM, c) of the so-called Domus of the Commander from the Amba Aradam excavation. The 3d model semantic enrichment is provided through the EMtools (d, see infra Section 5.2). See colour chart in Table 3.
Figure 8.
Digital Replica (DR, a), Proxy model (b) and Representation Model (RM, c) of the so-called Domus of the Commander from the Amba Aradam excavation. The 3d model semantic enrichment is provided through the EMtools (d, see infra Section 5.2). See colour chart in Table 3.

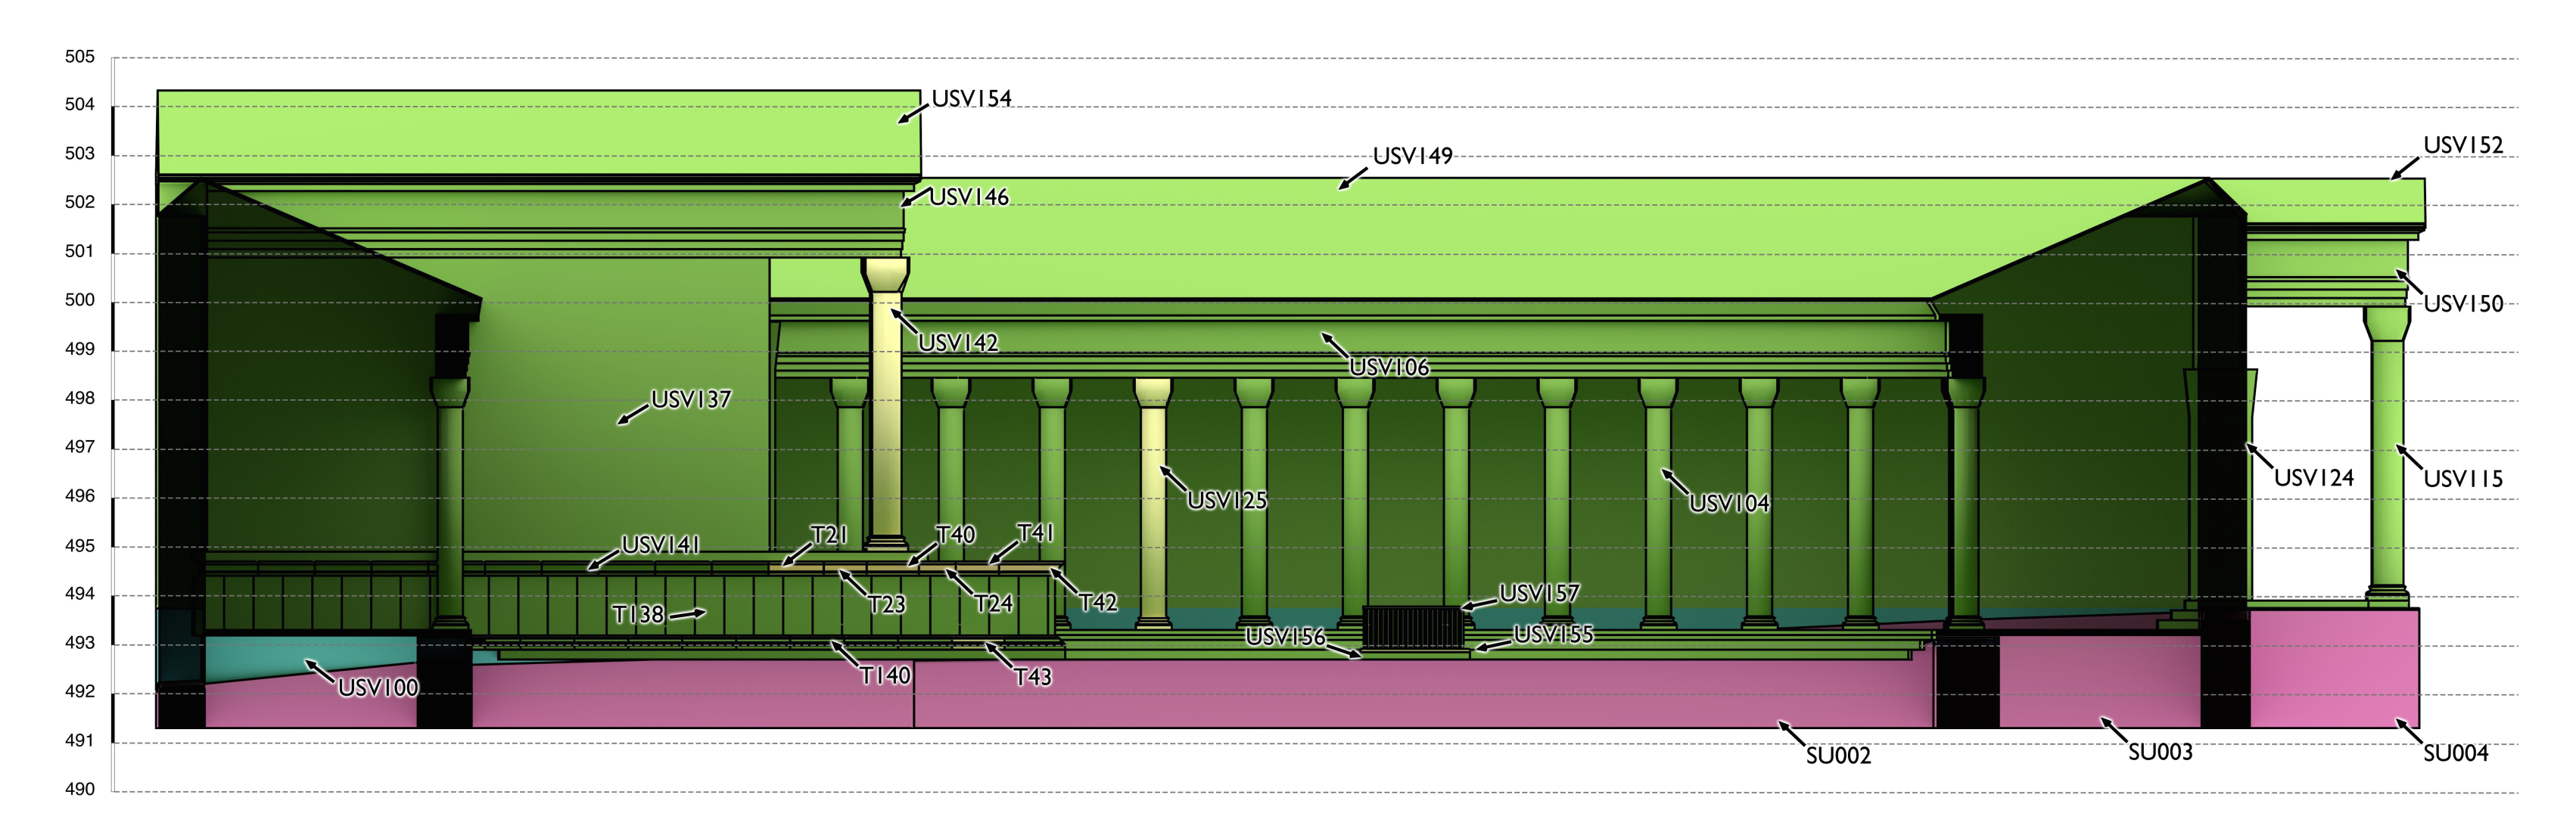
Figure 9.
Section N-S of the Great Temple representing the proxy model and the SU/USV number’s. See colour chart in Table 3.
Figure 9.
Section N-S of the Great Temple representing the proxy model and the SU/USV number’s. See colour chart in Table 3.

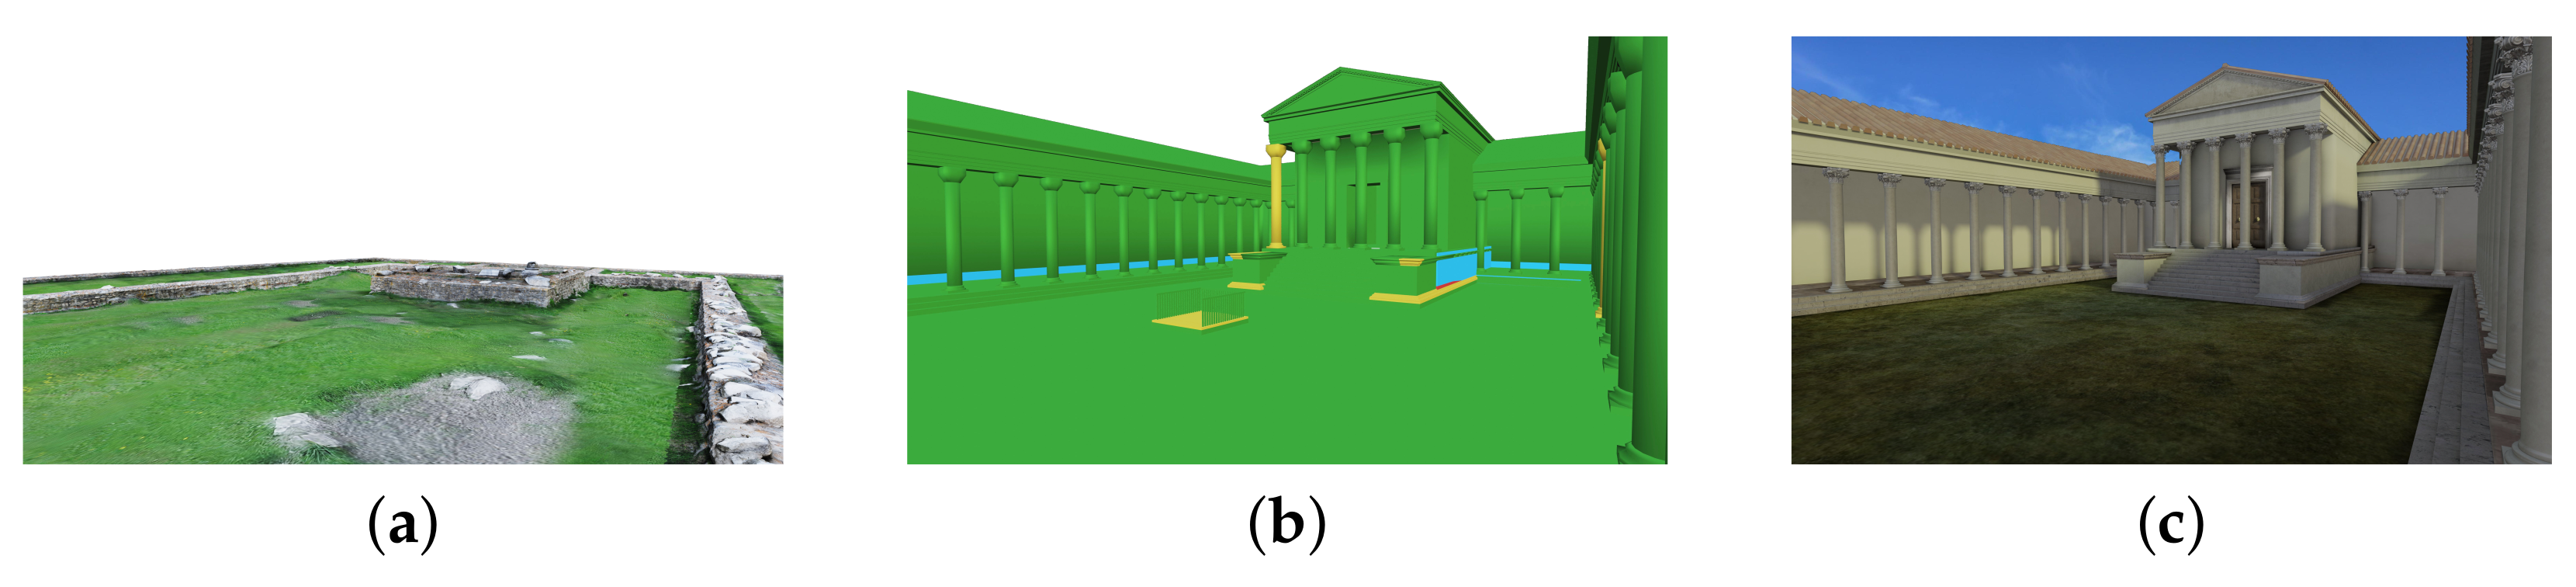
Figure 10.
Digital Replica (DR, a), Proxy model (b) and Representation Model (RM, c) of the Great Temple. See colour chart in Table 3.
Figure 10.
Digital Replica (DR, a), Proxy model (b) and Representation Model (RM, c) of the Great Temple. See colour chart in Table 3.

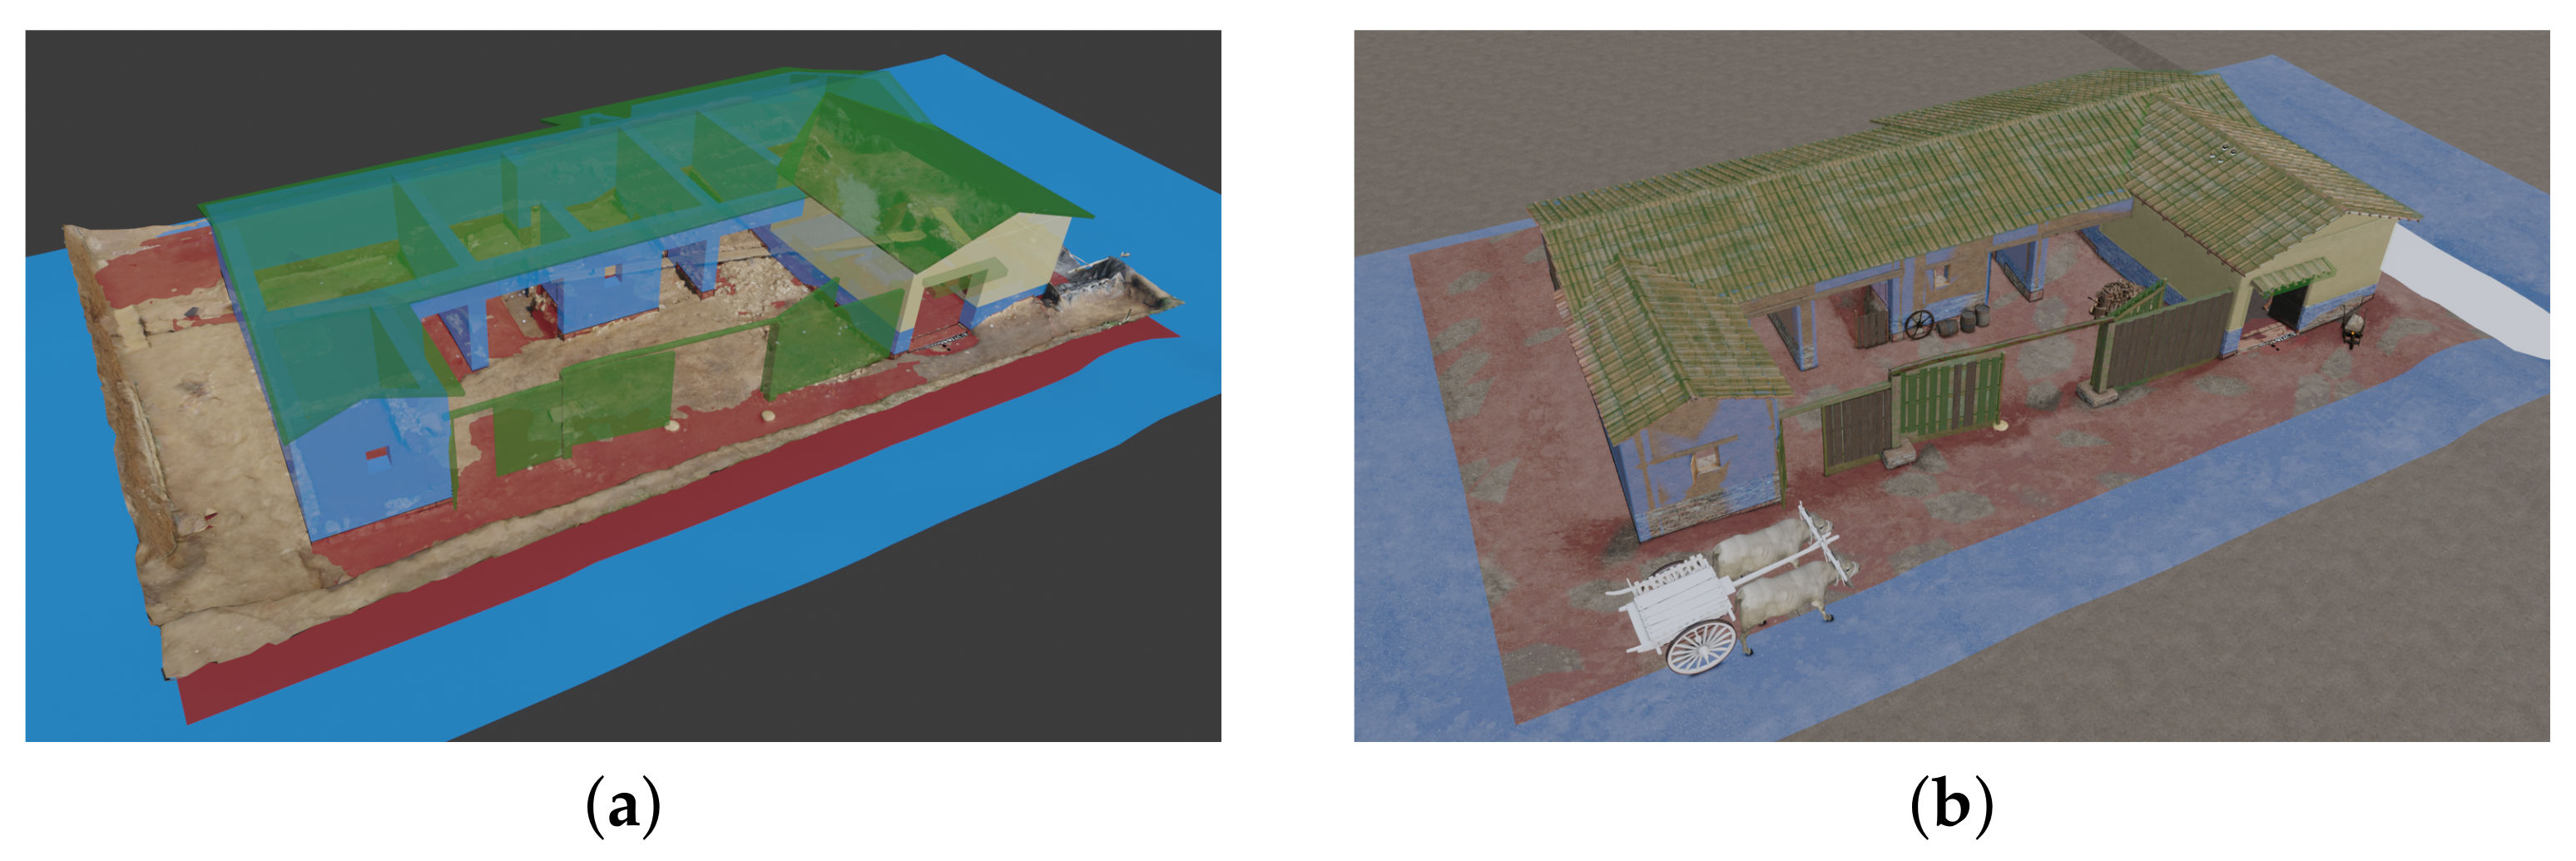
Figure 11.
Superimposition of the Proxy model on the Digital Replica (a) and on the Representation model (b) in order to add the chronological and provenance information. See colour chart in Table 3.
Figure 11.
Superimposition of the Proxy model on the Digital Replica (a) and on the Representation model (b) in order to add the chronological and provenance information. See colour chart in Table 3.

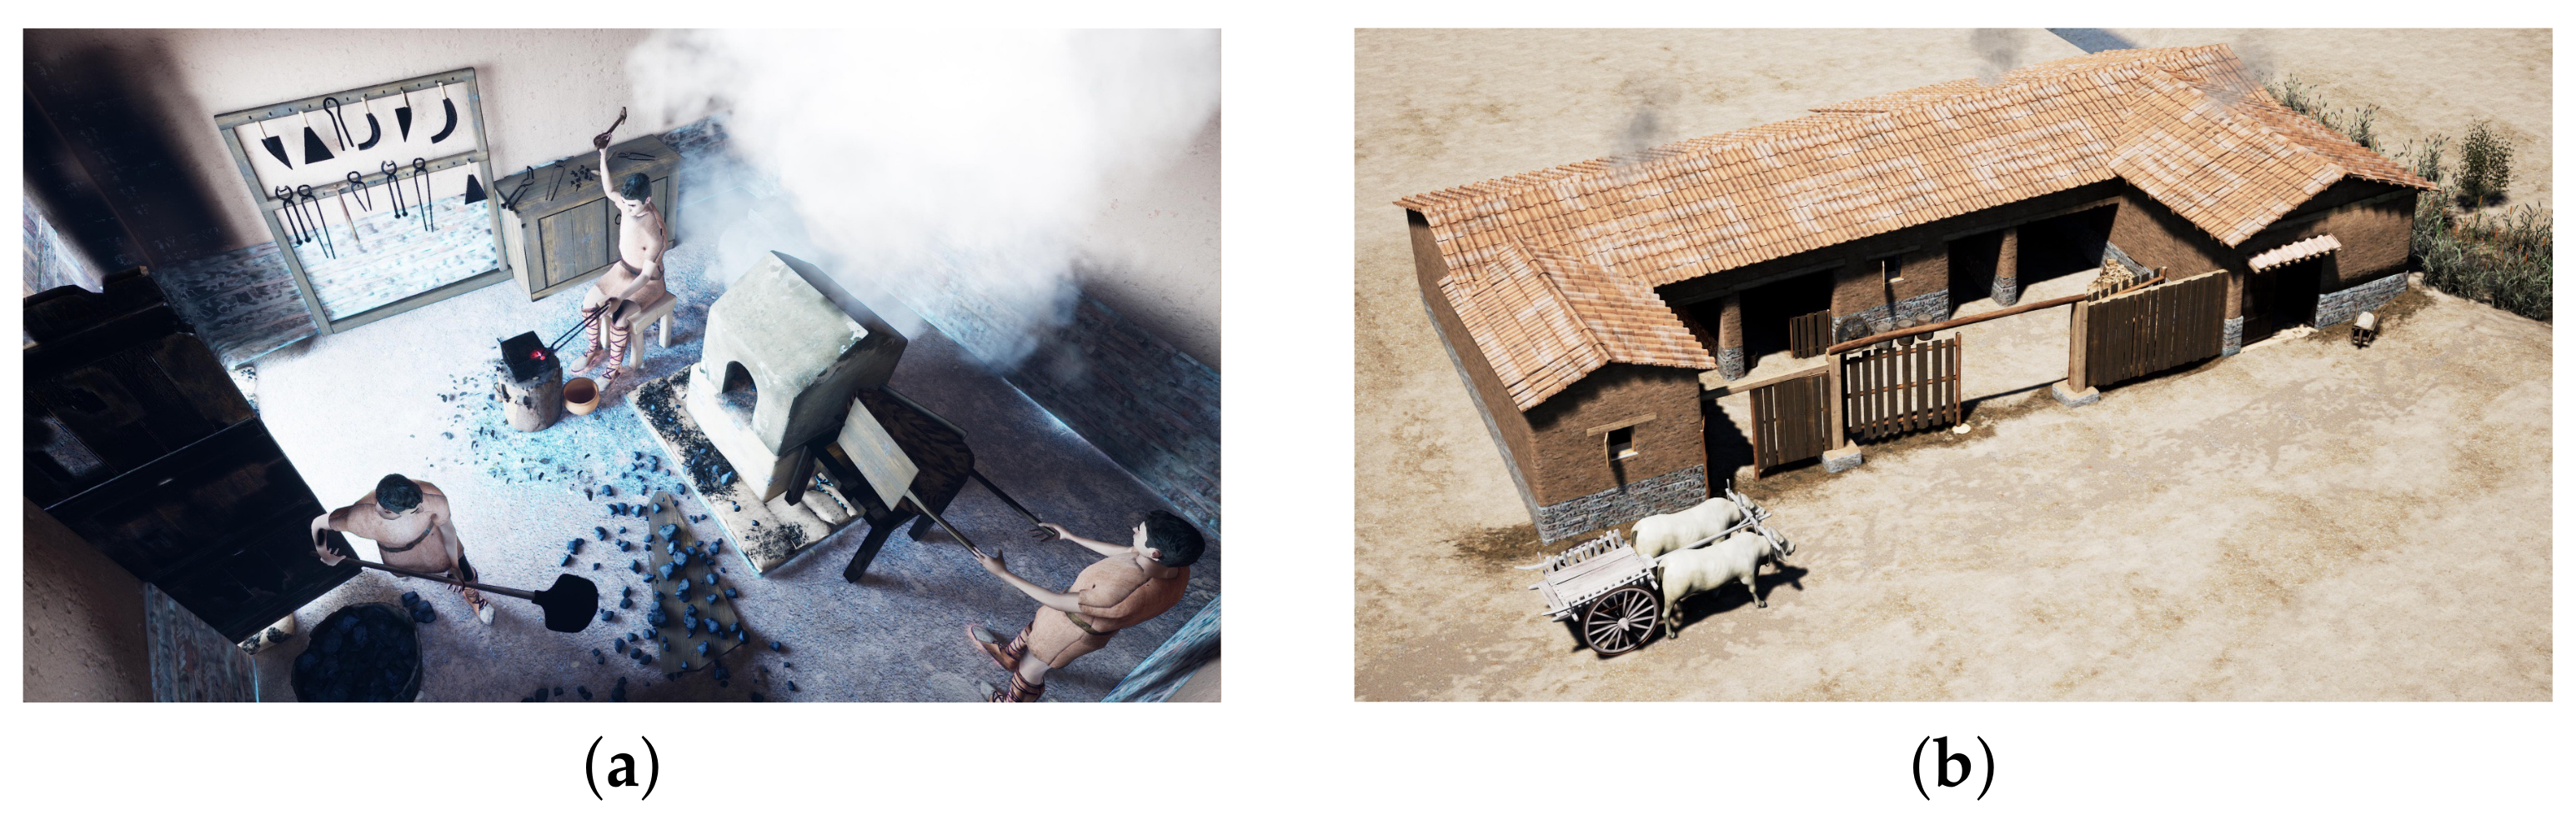
Figure 12.
Frames of the video from the permanent exhibition in the Montebelluna civic Museum with details of the Representation Model (RM): interior of room G (a) and externals of the craft building (b).
Figure 12.
Frames of the video from the permanent exhibition in the Montebelluna civic Museum with details of the Representation Model (RM): interior of room G (a) and externals of the craft building (b).

Figure 13.
View of the remains of the complex from SW represented by means of proxy models. (a) proxies of the remains of the wall structures with EM color schema (see Table 3) (b) proxies of the remains of the wall structures with chronological phases color schema.
Figure 13.
View of the remains of the complex from SW represented by means of proxy models. (a) proxies of the remains of the wall structures with EM color schema (see Table 3) (b) proxies of the remains of the wall structures with chronological phases color schema.

Figure 14.
Proxy representation at eye bird point of view (a) or through a section (b). See colour chart in Table 3.
Figure 14.
Proxy representation at eye bird point of view (a) or through a section (b). See colour chart in Table 3.

Figure 15.
Nodes added to Extended Matrix 1.2: (a) seriation node for an extant US and (b) continuity node; (c) example of use of the continuity node linked to the US whose end of life it expresses.
Figure 15.
Nodes added to Extended Matrix 1.2: (a) seriation node for an extant US and (b) continuity node; (c) example of use of the continuity node linked to the US whose end of life it expresses.

Figure 16.
Outline of the suggested folder structure for a reconstruction project.

Figure 17.
yEd graph editor to create Extended Matrices (a) with a custom EM palette (b) with the nodes of the formal language. Once selected a node, its name, url and description can be edited (c).
Figure 17.
yEd graph editor to create Extended Matrices (a) with a custom EM palette (b) with the nodes of the formal language. Once selected a node, its name, url and description can be edited (c).

Figure 18.
The layout of the EM add-on and its tools for querying semantic models after being added to the Blender software.
Figure 18.
The layout of the EM add-on and its tools for querying semantic models after being added to the Blender software.


Table 1.
Summary of the main characteristics of the case studies.
| n. | Project | Type | Epoch | Place | CNR-ISPC with |
|---|---|---|---|---|---|
| 1 | Aiano | Roman Villa | 4th–5th A.D | San Gimignano | UCLouvain |
| 2 | Forum of Augustus | Roman Forum | 1st A.D | Rome | Museo dei Fori Imperiali Mercati di Traiano; VRTron |
| 3 | Onde Marine | Etruscan Necropolis | 7th B.C | Cerveteri | SABAP |
| 4 | Amba Aradam | Roman military barracks | 2nd A.D | Rome | SSABAPR |
| 5 | Great Temple | Roman Temple | 2nd A.D | Sarmizegetusa | MNIT |
| 6 | Montebelluna | Roman forge and workshop | 1st–2nd A.D | Montebelluna | Soprintendenza per i Beni Archeologici del Veneto; University of Padua; Montebelluna Museum |
| 7 | Porta Marina | Roman Domus | Late antiquity | Ostia | MUCIV; Parco di Ostia Antica |
Table 2.
Example from the Montebelluna case study (Section 4.6) of an excerpt of the source table for data collection.
Table 2.
Example from the Montebelluna case study (Section 4.6) of an excerpt of the source table for data collection.
| Name | Description | URL | Properties | Original Id. | Type |
|---|---|---|---|---|---|
| D.01 | Photo of UG3081 | building material | Picture | ||
| D.03 | Aquileia Stone | blacksmith’s tools: type | Picture | ||
| D.04 | Photo of UUSS -3503 and 3477 | Shape of the anvil | Picture | ||
| D.05 | Marble tablet engraved representing a forge of a blacksmith from the Catacombs of Priscilla | blacksmith’s tools: shape | ICUR, III, 7372, tab. XVIII | Picture | |
| D.08 | Photogrammetric model | 3D volumes | mesh | ||
| D.15 | Blueprint of the site | layout of the buildings | Picture | ||
| D.17 | The standard height of a floor is ten Roman feet (3 metres) | height of wall structures | Roman modules |
Table 3.
EM nodes and color schema (RGB ed Hex values).
| Node | Definition | Description | Col | R | G | B | Hex |
|---|---|---|---|---|---|---|---|
| US | Extant structures | In situ archaeological evidences | 0.328 | 0.033 | 0.033 | 9B3333 | |
| USV/s | Structural virtual reconstruction | Based on in situ archaeological evidences | 0.018 | 0.275 | 0.799 | 248FE7 | |
| USV/n | Non structural virtual reconstruction | Based on sources and comparisons | 0.031 | 0.191 | 0.026 | 31792D | |
| SF | Fragmental virtual anastylosis | Repositioning of non in situ architectural fragments | 0.847 | 0.741 | 0.188 | D8BD30 | |
| VSF | Fragmental virtual reconstruction | Completion of repositioned fragments | 0.694 | 0.623 | 0.380 | B19F61 |
Publisher’s Note: MDPI stays neutral with regard to jurisdictional claims in published maps and institutional affiliations. |
© 2021 by the authors. Licensee MDPI, Basel, Switzerland. This article is an open access article distributed under the terms and conditions of the Creative Commons Attribution (CC BY) license (https://creativecommons.org/licenses/by/4.0/).
Share and Cite
MDPI and ACS Style
Demetrescu, E.; Ferdani, D. From Field Archaeology to Virtual Reconstruction: A Five Steps Method Using the Extended Matrix. Appl. Sci. 2021, 11, 5206. https://0-doi-org.brum.beds.ac.uk/10.3390/app11115206
AMA Style
Demetrescu E, Ferdani D. From Field Archaeology to Virtual Reconstruction: A Five Steps Method Using the Extended Matrix. Applied Sciences. 2021; 11(11):5206. https://0-doi-org.brum.beds.ac.uk/10.3390/app11115206
Chicago/Turabian StyleDemetrescu, Emanuel, and Daniele Ferdani. 2021. "From Field Archaeology to Virtual Reconstruction: A Five Steps Method Using the Extended Matrix" Applied Sciences 11, no. 11: 5206. https://0-doi-org.brum.beds.ac.uk/10.3390/app11115206
Note that from the first issue of 2016, this journal uses article numbers instead of page numbers. See further details here.