Article

The Relationship between the Performance of Soccer Players on the Curved Sprint Test, Repeated Sprint Test, and Change-of-Direction Speed Test

by
Tomáš Baranovič
1,* and
Erika Zemková
2,3
1
Secondary Medical School, 821 08 Bratislava, Slovakia
2
Department of Biological and Medical Sciences, Faculty of Physical Education and Sport, Comenius University in Bratislava, 814 69 Bratislava, Slovakia
3
Sports Technology Institute, Faculty of Electrical Engineering and Information Technology, Slovak University of Technology, 812 19 Bratislava, Slovakia
*
Author to whom correspondence should be addressed.
Submission received: 25 April 2021 / Revised: 27 May 2021 / Accepted: 7 June 2021 / Published: 9 June 2021

Abstract

:
The curved sprint test is the most commonly used test in team sports. From a practical point of view, it would be interesting to know to what extent it is related to a direct sprint and a sprint involving changes in direction. This study investigated the relationship between the times taken by soccer players in the curved sprint test, repeated sprint test involving changes in direction, and change-of-direction speed test. Two age groups of soccer players U15 and U17 (n = 22) took the curved sprint test, the repeated straight sprint test, and the repeated straight sprint test involving changes in direction. The total time taken in the curved sprint test did not differ significantly from the total time taken in the repeated straight sprint test (46.80 ± 1.85 s and 34.51 ± 1.66 s, respectively; T = 120). The total time taken in the curved sprint test was not significantly different from the total time taken in the repeated straight sprint test involving changes in direction (46.80 ± 1.85 s and 82.36 ± 4.47 s, respectively; T = 115). There was no significant correlation between the total times taken in the curved sprint test (CST) and the repeated sprint test involving changes in direction (RSCD) (r = 0.180). There was also no significant correlation between the total times taken in the curved sprint test (CST) and the repeated straight sprint test (RSST) (r = 0.301). The non-significant relationship between these abilities implies that they are independent of each other and may have to be tested and trained complementarily.

1. Introduction

The majority of sports require an ultimate or nearly ultimate performance of players, lasting 1 to 7 s with a short recovery time over the course of 60–90 min [1]. This intermittent kinetic action typical for soccer is referred to as intermittent sport [2,3,4,5,6,7]. The player’s repeatedly performs short-term but high-intensity exercise during the whole match [8]. This places higher energy demands on competitive soccer players compared to those playing soccer at a recreational level [9].
So far, several methods have been designed for testing repeated short-term, high-intensity exercise in soccer players [2,10,11,12,13,14]. The protocols often differ in terms of length, number of sprint repetitions, and rest intervals [15]. However, there is only one test that contains active rest involving changes in direction. It is the well-known curved sprint test [14], also known as the Bangsbo sprint test [16,17,18] or the sprint test [2]. Its remarkable feature lays in a track consisting of three changes in direction with length approximately 30 m, which simulates sprints in the match [14]. On the basis of the fact that the covered distance in a match is closely linked to the performance in the repeated short-term, high-intensity exercise, the curved sprint test is considered applicable for soccer players [14]. The test results are the time of the fastest sprint, the average sprint time, and the fatigue index. The collected data might be compared with the data of elite soccer players [14].
The curved sprint test is an effective tool for differentiating between players with different performance levels as well as for detecting changes in kinetic performance during a match. Reilly et al. [19] showed that the performance of top-level soccer players is significantly better than that of second-rate players. Abrantes et al. [20] demonstrated that test performance is closely connected to the age of participants and the performance level in soccer. The performance on non-linear sprints can also help differentiate between professional and young soccer players [21].
The optimal design and implementation of training strategies that increase repeated sprints of young talented players is of special importance for soccer coaches. The number of high-intensity runs in matches has gradually increased over the years [22], especially in crucial situations [3,23]. Approximately 85% of all actions performed at maximum speed by soccer players consist of curvature sprints [24]. In spite of their critical importance, investigations related to curve sprints have been largely overlooked by sport scientists [25]. The performance in curvilinear runs has been evaluated by footballers [26,27] but only at minimal speeds (e.g., jogging). Most studies on young players in team sports have investigated the effect of high-intensity aerobic training on repeated sprint ability [28,29,30]. However, the authors of these studies were not concerned with the relationship between particular sprint times of players in these tests that could lead to stating striking differences in participants’ performance.
Taking into account a similar track and a small number of changes in direction, we assumed a significant correlation between the total times taken in the curved sprint test and in the repeated straight sprint test but not times taken in the repeated sprint test involving changes in direction. Verification of these assumptions was accomplished by investigation of the relationship between the times taken by soccer players in the curved sprint test, the repeated straight sprint test, and the repeated sprint test involving changes in direction.

2. Materials and Methods

2.1. Participants

A group of 22 male soccer players from the TJ Spartak Myjava youth soccer club, Slovakia, classified into two age categories (U15: age 13.8 ± 0.5 years, height 169.2 ± 4.4 cm, body mass 54.1 ± 4.9 kg; U17: age 15.6 ± 0.5 years, height 180.6 ± 4.2 cm, body mass 67.3 ± 5.8 kg), volunteered to participate in the study. In terms of performance level, the U15 group plays the league of older pupils west and the U17 group plays the league of young adults west.
Inclusion criteria were as follows: participation in all tests, no invalid measurements, and player position (defender, half-back, or forward). Exclusion criteria were goalkeeper) and sustained pain or injury of the lower limb during the past 6 months.
Participants were required to avoid any vigorous workouts in the 48 h preceding the testing day. They were informed of the main purpose and design of the study, and they all provided informed consent. The procedures followed were in accordance with the ethical standards laid down in the 1964 Declaration of Helsinki and its later amendments. The study was approved by the ethics committee of the Faculty of Physical Education and Sports, Comenius University in Bratislava (nos. 3/2017 and 1/2020).

2.2. Procedures

Prior to starting the study, all participants took part in an assembly/preparatory meeting, where particular tests and testing conditions were presented as well as examination tests conducted.
All tests were carried out at the beginning of the winter preparation period and were located in the TJ Spartak sport facility with artificial turf.
There were three tests: the curved sprint test (CST), the repeated straight sprint test (RSST), and the repeated sprint involving changes in direction (RSCD). Before each test, the players went through standardized warm-up, pre-workout, and dynamic stretching under the supervision of coaches. With the aid of photocells and the Witty system (Microgate, Italy), the total time and the time taken on singular distances were measured.

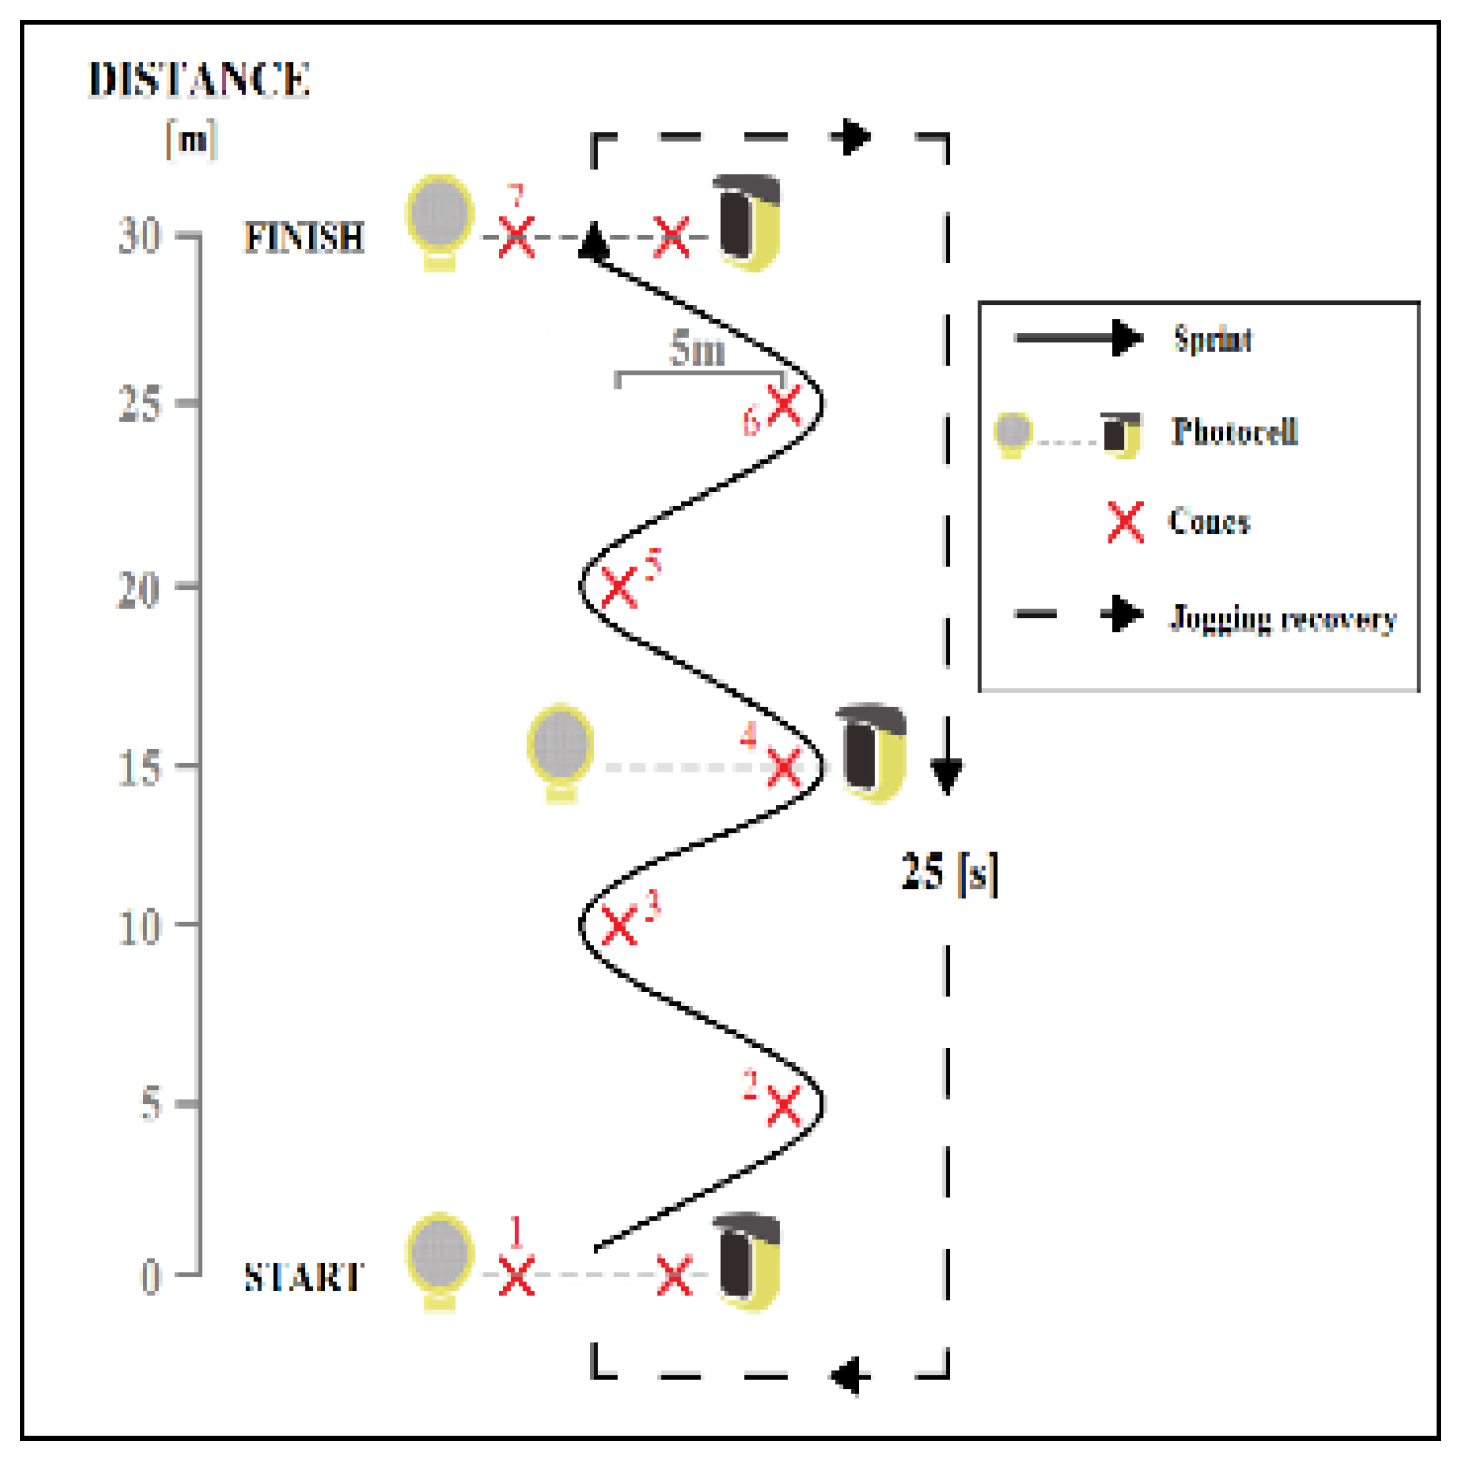
2.2.1. Curved Sprint Test

It is a standardized endurance test involving changes in direction [14]. The test track measurements were 34.2 m in length and consisted of three nets 2 m in width (built from 2 photocells) and 5 plastic cones. Net N.1 was the starting line, and net N.5 was the finishing line. The net placement and the mutual distance between them are illustrated in Figure 1.
A player started from net N.1, with one leg placed on the starting line and the other leg placed behind the starting line. The player started sprinting to net N.5 once the examinator signaled the start. Right after the start, the player sprinted to the second cone, where he changed direction by circling the #2 cone from the outside and sprinted to the #3 cone. After circling the #3 cone from the outside, the player sprinted to the finishing line. Photocells used for measuring time were placed 1 m high and were located on the starting line, 15 m from the starting line, and on the finishing line. After the player finished the sprint, he returned to the starting line to start again. The player ran a total of 7 sprints with 25 s of active rest (low-intensity running). After the player finished every sprint, he had 25 s to return to the starting line. Then, the examinator counted down the last 3 s and measured both the total time as well as the time taken on singular distances.

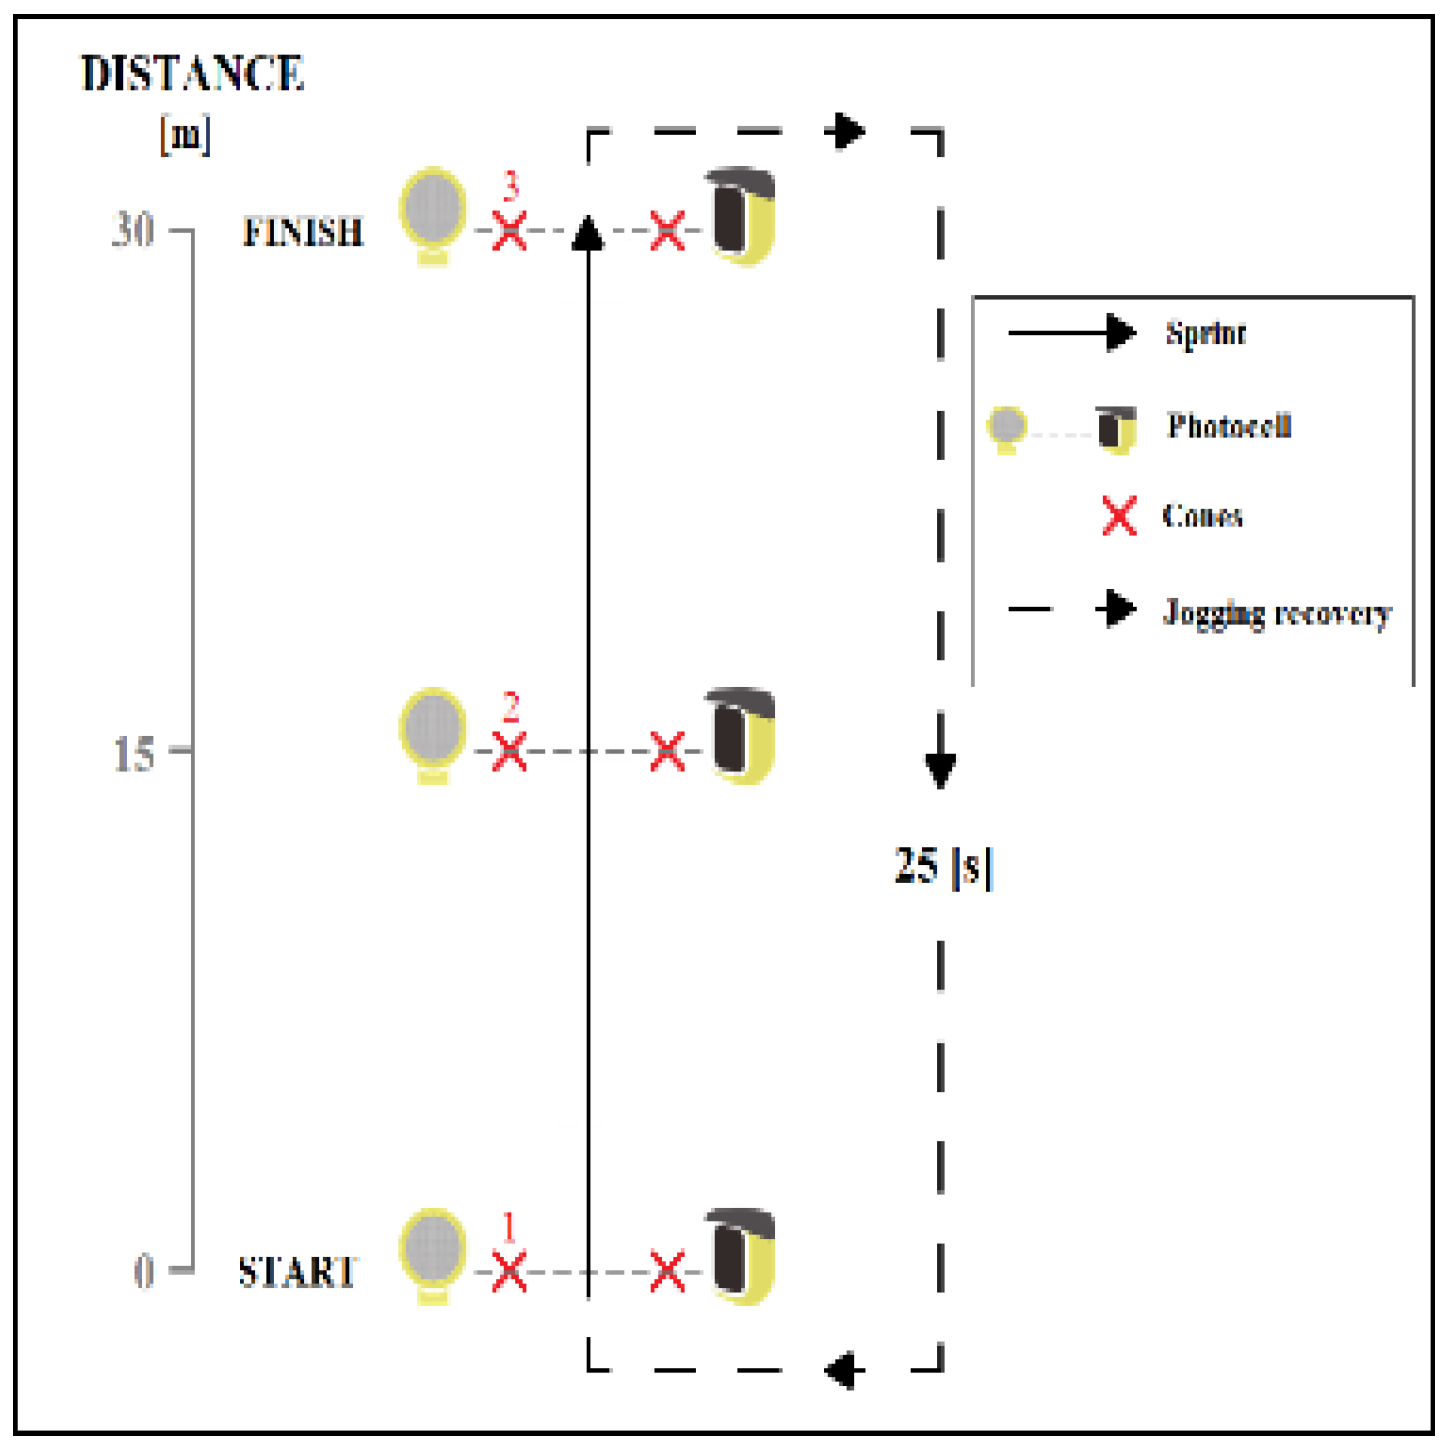
2.2.2. Repeated Straight Sprint Test (7 × 30 m)

The test track measured 30 m in length. It consisted of 3 nets built from 2 photocells and plastic cones, 2 m away from each other. Net N.1 was the starting line and net N.3 was the finishing line. For a further illustration, see Figure 2.
A player started from net N.1, with one leg placed on the starting line and the other leg placed behind the starting line. The player started sprinting to net N.3 (finishing line) once the examinator signaled the start. Photocells used for measuring time were placed 1 m high and were located on the starting line, 15 m from the starting line, and on the finishing line. The player returned to the starting line right after he finished sprinting. The player ran a total of 7 sprints with 25 s of active rest (low-intensity running). The player had 25 s to return to the starting line after he finished each sprint. When the examinator counted down the last 3 s, the player sprinted again and both the total time as well as the time taken on singular distances were measured.

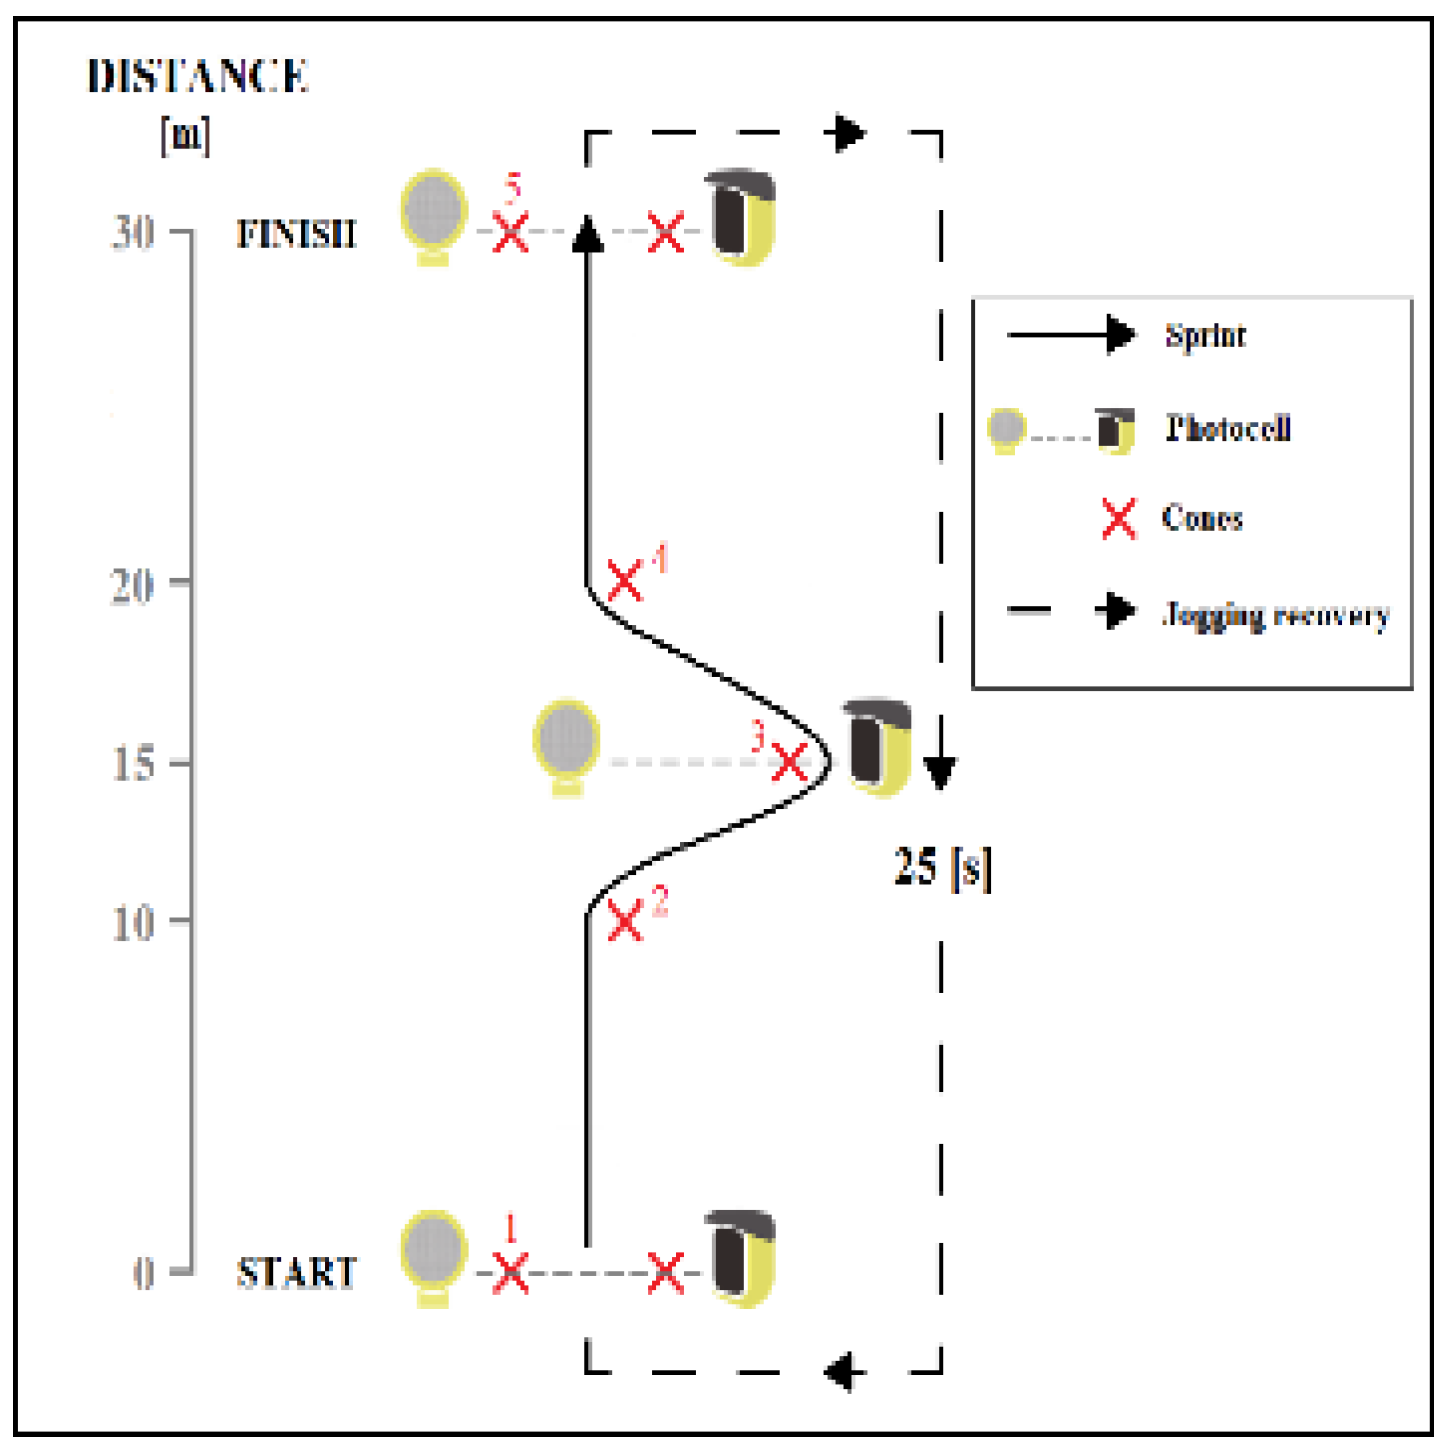
2.2.3. Repeated Sprint Test Involving Changes in Direction

The test track consisted of 3 nets, each 2 m in width, built from 2 photocells and 7 plastic cones. Net N.1 represented the starting line, and net N.7 was the finishing line. For a more detailed illustration of the nets and cone placement, see Figure 3.
A player started from net N.1, with one leg placed on the starting line and the other leg placed behind the starting line. The player started sprinting to net N.7 (finishing line) once the examinator signaled the start. During the sprint, the player circled every cone from the outside and continued to do so until he reached the finishing line. Photocells used for measuring time were placed 1 m high and were located on the starting line, 15 m from the starting line, and on the finishing line. The player returned to the starting line right after he finished sprinting. The player ran a total of 7 sprints with 25 s of active rest (low-intensity running). After he finished each sprint, the player had 25 s to return to the starting line. The player sprinted again when the examinator counted down the last 3 s, and both the total time as well as the time taken on single distances were measured.

2.3. Statistical Analysis

The z-score, followed by the t-score, converted the collected data to a standardized range. The non-parametric Wilcoxon signed-rank test was used for ranking the dependent variables for statistical significance of differences in measured times in the CST, RSST, and RSCD. The statistical significance level was set at p < 0.05. Spearman’s rank correlation coefficient was used to determine the correlation between the times taken in the CST, RSST, and RSCD. The statistical significance level was set at p < 0.05.

3. Results

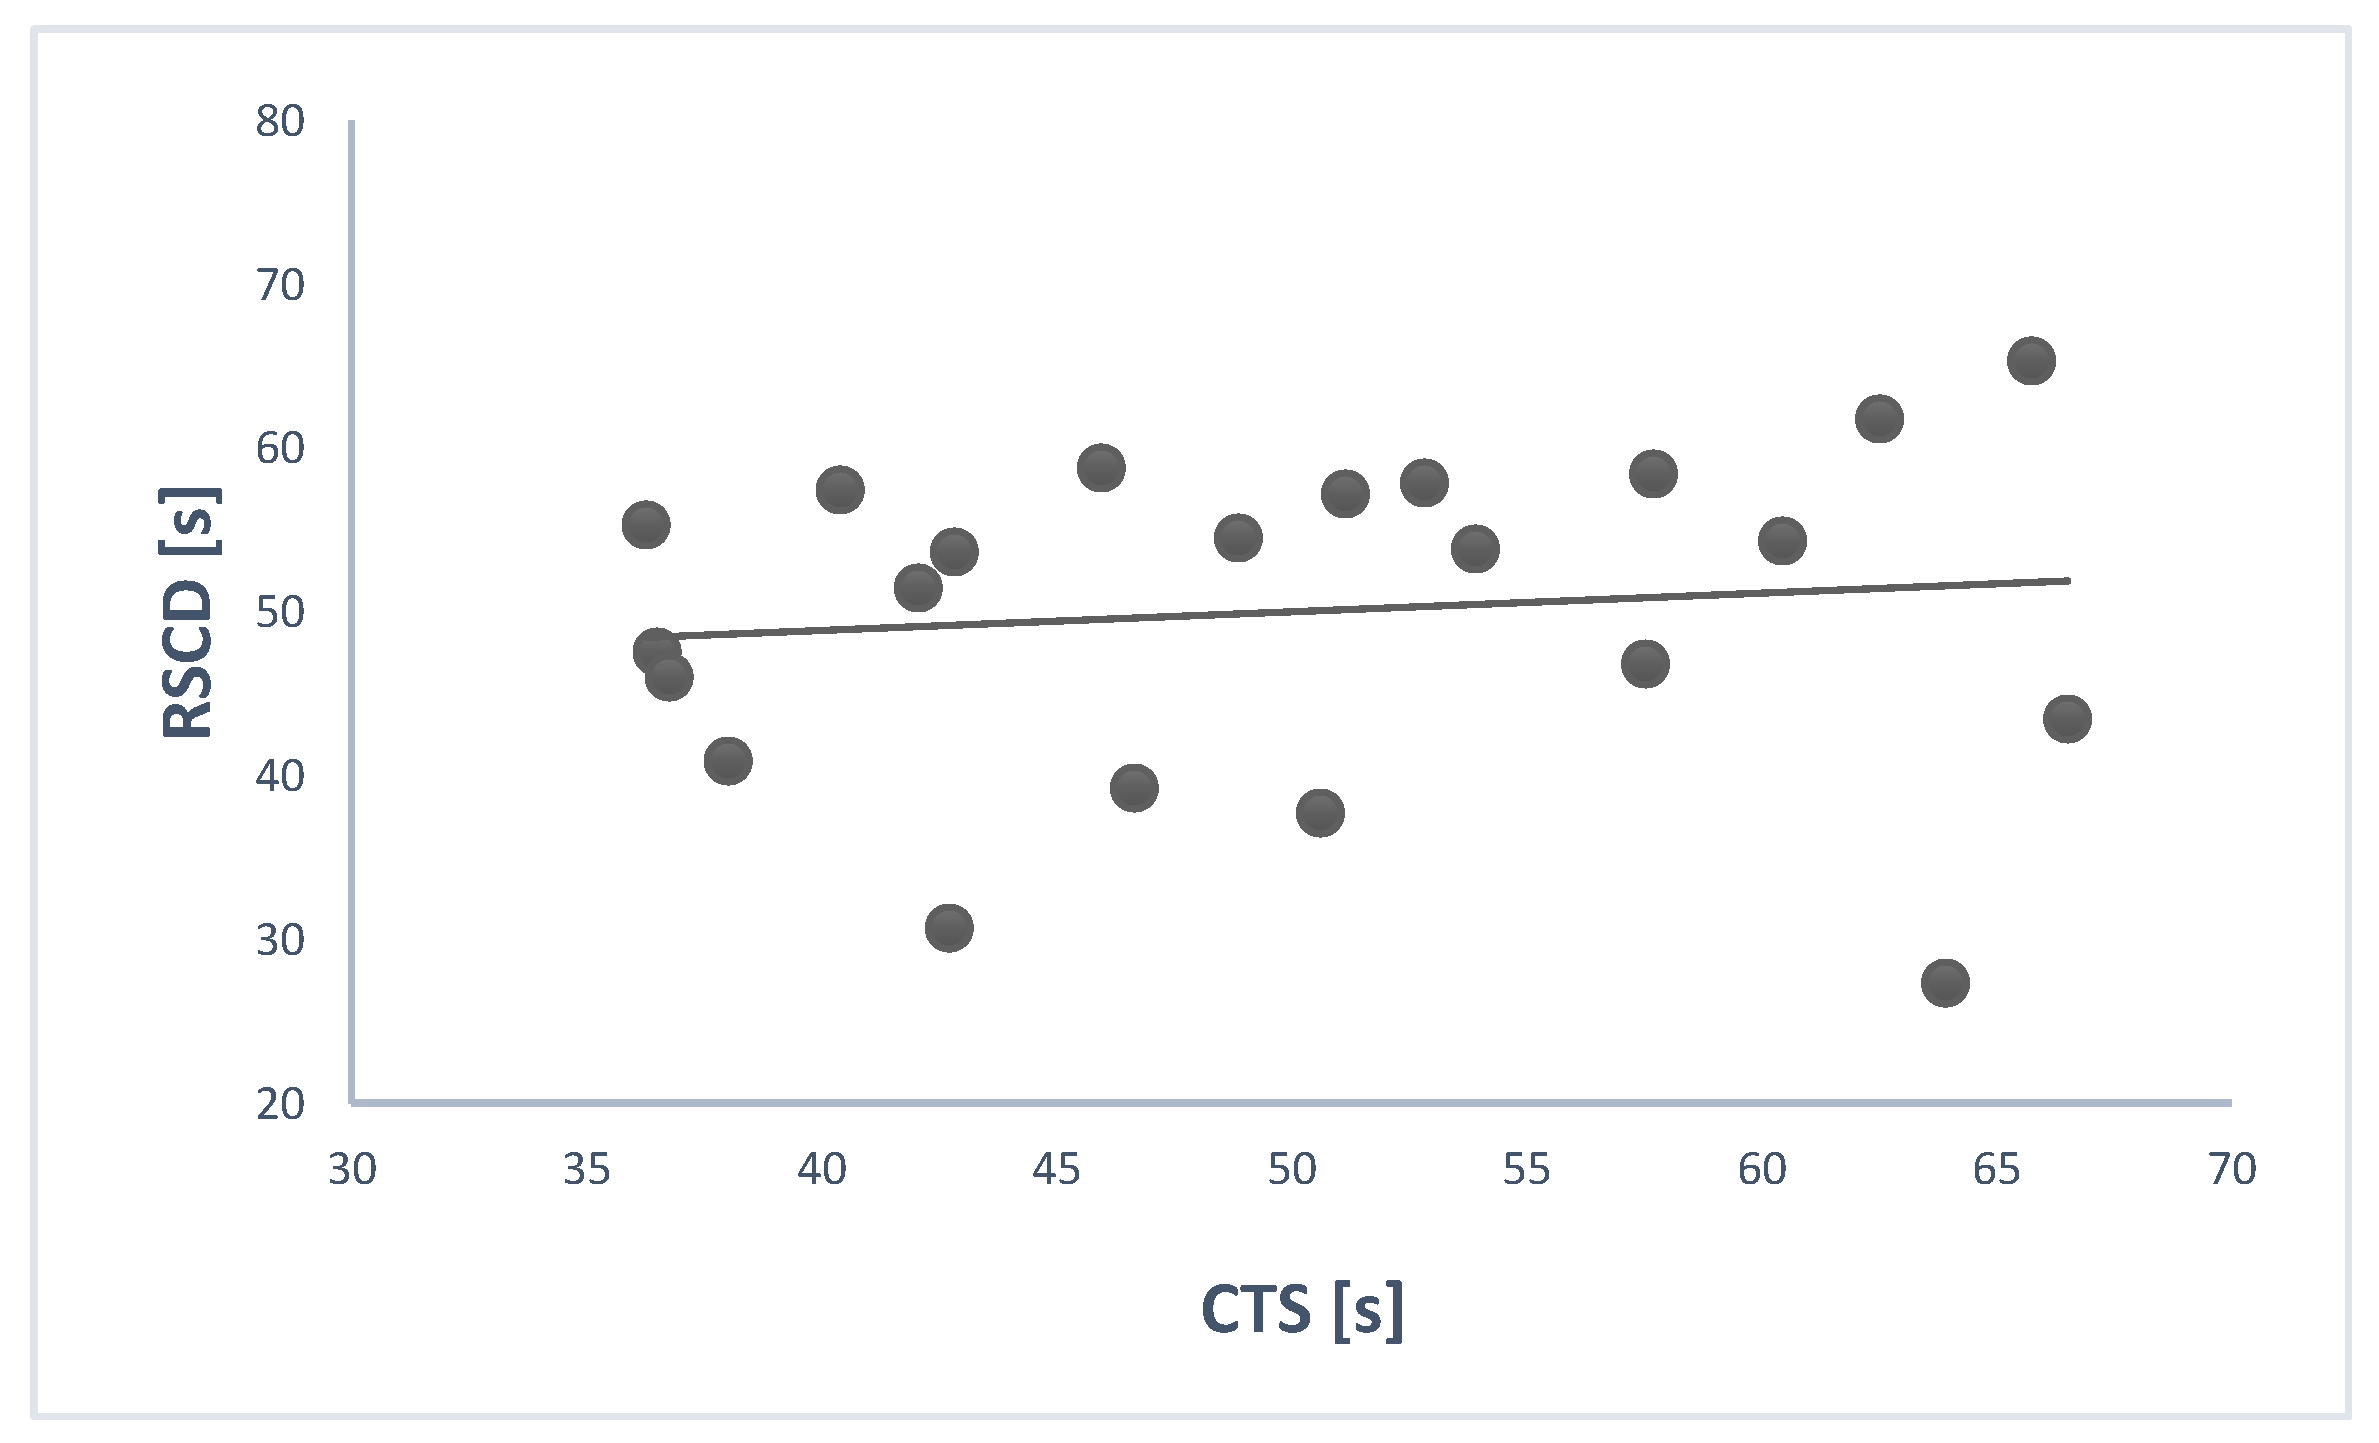
3.1. Relationship between the Total Times Taken in the CTS and the RSCD

There was no significant correlation between the total times taken in the CST and the RSCD (r = 0.180) (Figure 4). The coefficient of determination was r2 = 0.032, which explained only a small proportion of the variance (3.2%).
The total time taken in the CST was not significantly different from the total time taken in the RSCD (46.80 ± 1.85 s and 82.36 ± 4.47 s, respectively; T = 115). The times were not significantly different regarding distance either: 0–15 m (3.34 ± 0.15 s and 5.74 ± 0.36 s, respectively; T = 124) and 15–30 m (3.34 ± 0.14 s and 5.96 ± 0.40 s, respectively; T = 122).

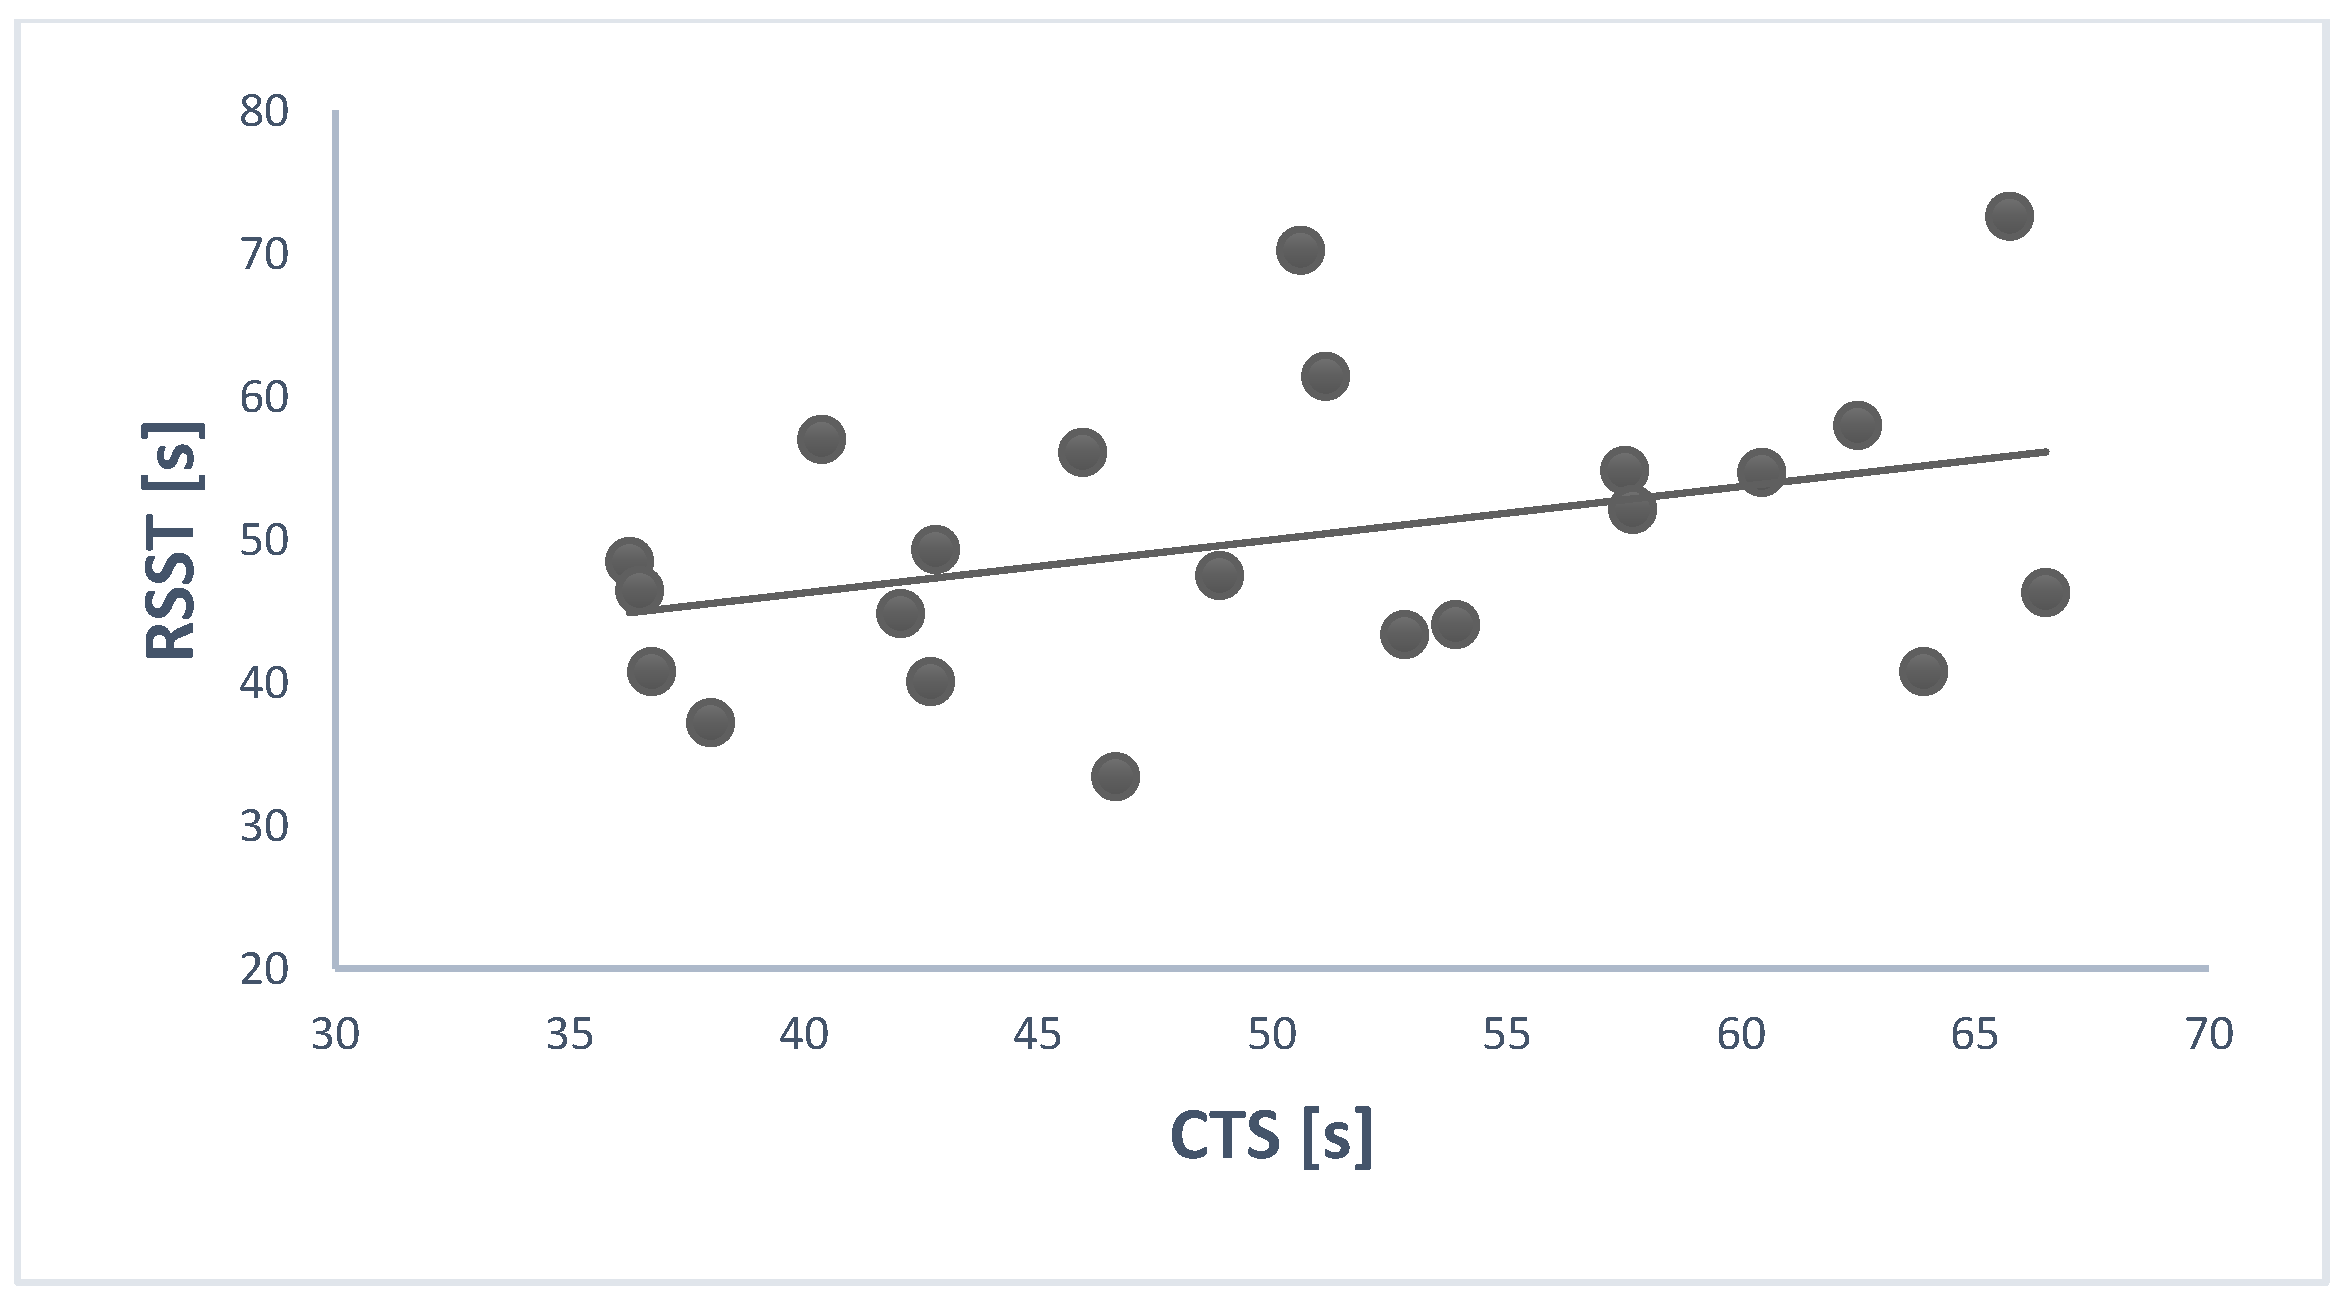
3.2. Relationship between the Total Times Taken in the CTS and the RSST

There was no significant correlation between the total times taken in the CST and the RSST (r = 0.301) (Figure 5). The coefficient of determination was r2 = 0.091, which explained the variance of 9.1%.
The total time taken in the CST was not significantly different from the total time taken in the RSCD (46.80 ± 1.85 s and 82.36 ± 4.47 s, respectively; T = 115). The times were not significantly different regarding distance either: 0–15 m (3.34 ± 0.15 s and 5.74 ± 0.36 s, respectively; T = 124) and 15–30 m (3.34 ± 0.14 s and 5.96 ± 0.40 s, respectively; T = 122).

4. Discussion

There were no significant correlations between the total times taken in the CST and the RSST, between the total times taken in the CST and the RSCD, and between the times taken in the curved sprint test, the repeated straight sprint test, and the repeated sprint test involving changes in directions. These findings are in agreement with Fílter et al. [25], who found a coefficient of determination of ~35% between linear and curve sprinting. The authors reported that the curved sprint test is highly reliable and that curvilinear and linear sprints are different and independent actions. In addition, Çinarli et al. [31] found no correlation between the linear 10, 20, and 30 m sprint and the t-test with a change of direction.
There was no significant correlation between the time taken in the CST and the RSST. These findings are in contradiction with Sporiš et al. [32], who discovered an eminent correlation between speed in the zigzag test (sprint involving changes in direction) and speed measured by a 30 m straight sprint (r = 0.560) (in 15-year-old soccer players). In addition, other authors [33,34,35] have reported that the times measured in tests involving changes in direction are in correlation with times in straight sprint tests. This significant relationship between the times taken in individual tests indicate that they influence the same abilities to some extent.
Additionally, there was no significant correlation between the total times taken in the curved sprint test and in the repeated sprint involving changes in direction. These findings are at variance with Vescovi and McGuigan [33], who found a correlation (r ≥ 0.600) between the times taken in Illinois and Pro-agility tests involving changes in direction.
The possible explanation is the diversity in test tracks, the number of repetitions, and the number of changes in direction. The CST contains of two changes in direction. There are many more changes in direction in the remaining tests, making them more difficult in terms of coordination. The critical part is not only speed endurance but also whole-body coordination and the ability to change direction. Developing these skills is as important as improving sensory and cognitive functions. Video observation/motor imagery training may be useful for individuals who need to simultaneously develop a fast response to different types of stimuli [36].
The standard distance during a match is closely linked to performance in the curved sprint test and the repeated straight sprint test [14]. For that reason, these tests are appropriate for assessing the speed endurance of soccer players. Their advantage lies in simultaneously assessing the maximal performance as well as the performance in repeated sprints. The highest sprint speed achieved in a match is in correlation with the highest speed achieved in the RSST [14]. That means the player performance in this test can be used for estimation of the highest sprint speed performed during the match.
The limitation of this study was that the research included only young soccer players. Further investigations should involve elite, professional soccer players. It would also be worth to address the relationship between test performance and match performance. This could be valuable and useful information for trainers in practice.

5. Conclusions

There was no significant correlation between the times taken in the curved sprint test, the repeated straight sprint test, and the repeated sprint test involving changes in direction. This indicates that curvilinear and linear sprints are different and independent actions. Soccer coaches and sports scientists who work to improve the movement speed of soccer players should be conscious that linear sprints and sprints with changes in direction reflect different abilities.

Author Contributions

Conceptualization, T.B. and E.Z.; methodology, T.B.; formal analysis, T.B. and E.Z.; investigation, T.B. and E.Z.; data curation, T.B.; writing—original draft preparation, T.B. and E.Z.; writing—review and editing, T.B. and E.Z.; visualization, T.B.; supervision, E.Z. Both authors have read and agreed to the published version of the manuscript.

Funding

This research received no external funding.

Institutional Review Board Statement

The study was approved by the ethics committee of the Faculty of Physical Education and Sports, Comenius University in Bratislava (nos. 3/2017 and 1/2020).

Informed Consent Statement

Informed consent was obtained from all subjects involved in the study.

Acknowledgments

This work was supported by the Scientific Grant Agency of the Ministry of Education, Science, Research and Sport of the Slovak Republic and the Slovak Academy of Sciences (nos. 1/0824/17 and 1/0089/20).

Conflicts of Interest

The authors declare no conflict of interest.

References

  1. Bishop, D.; Spencer, M.; Duffield, R.; Lawrence, S. The validity of a repeated sprint ability test. J. Sci. Med. Sport 2001, 4, 19–29. [Google Scholar] [CrossRef]
  2. Bangsbo, J. Fitness Training in Football: A Scientific Approach; August Krogh Institute: Copenhagen, Denmark, 1994; 336p. [Google Scholar]
  3. Mohr, M.; Krustrup, P.; Bangsbo, J. Match performance of high-standard soccer players with special reference to development of fatigue. J. Sports Sci. 2003, 21, 519–528. [Google Scholar] [CrossRef] [Green Version]
  4. Krustrup, P.; Mohr, M.; Ellingsgaard, H.E.L.G.A.; Bangsbo, J. Physical demands during an elite female soccer game: Importance of training status. Med. Sci. Sports Exerc. 2005, 37, 1242–1248. [Google Scholar] [CrossRef]
  5. Krustrup, P.; Mohr, M.; Steensberg, A.; Bencke, J.; Kjær, M.; Bangsbo, J. Muscle and blood metabolites during a soccer game: Implications for sprint performance. Med. Sci. Sports Exerc. 2006, 38, 1165–1174. [Google Scholar] [CrossRef]
  6. Rampinini, E.; Impellizzeri, F.M.; Castagna, C.; Coutts, A.J.; Wisløff, U. Technical performance during soccer matches of the Italian Serie A league: Effect of fatigue and competitive level. J. Sci. Med. Sport 2009, 12, 227–233. [Google Scholar] [CrossRef] [PubMed]
  7. Orendurff, M.S.; Walker, J.D.; Jovanovic, M.; Tulchin, K.L.; Levy, M.; Hoffmann, D.K. Intensity and duration of intermittent exercise and recovery during a soccer match. J. Strength Cond. Res. 2010, 24, 2683–2692. [Google Scholar] [CrossRef] [Green Version]
  8. Holienka, M. Kondičný Tréning vo Futbale, 2nd ed.; Peter Mačura-PEEM: Bratislava, Slovakia, 2007; 158p. [Google Scholar]
  9. Palermi, S.; Sacco, A.M.; Belviso, I.; Romano, V.; Montesano, P.; Corrado, B.; Sirico, F. Guidelines for physical activity—A cross-sectional study to assess their application in the general population. Have we achieved our goal? Int. J. Environ. Res. Public Health 2020, 17, 3980. [Google Scholar] [CrossRef]
  10. Svensson, M.; Drust, B. Testing soccer players. J. Sports Sci. 2005, 23, 601–618. [Google Scholar] [CrossRef] [PubMed]
  11. Malomsoki, E.J. Physiological characterization of physical fitness of football players in field conditions. In Science and Football II; Taylor & Francis: Abingdon-on-Thames, UK, 1993; pp. 81–85. [Google Scholar]
  12. Psotta, R.; Bunc, V. Reliability and validity of the Intermittent anaerobic running test (IAnRT). In Science and Football V: The Proceedings of the Fifth World Congress on Science and Football; Taylor & Francis: Abingdon-on-Thames, UK, 2005; pp. 115–125. [Google Scholar]
  13. Rampinini, E.; Bishop, D.; Marcora, S.M.; Ferrari Bravo, D.; Sassi, R.; Impellizzeri, F.M. Validity of simple field tests as indicators of match-related physical performance in top-level professional soccer players. Int. J. Sports Med. 2007, 28, 228–235. [Google Scholar] [CrossRef]
  14. Bangsbo, J.; Mohr, M. Fitness Testing in Football; Bangsbosport: Copenhagen, Denmark, 2012; 167p. [Google Scholar]
  15. Drust, B.; Gregson, W. Fitness testing. In Science and Soccer: Developing Elite Performers, 3rd ed.; Routledge: London, UK, 2013; pp. 43–64. [Google Scholar]
  16. Wragg, C.B.; Maxwell, N.S.; Doust, J.H. Evaluation of the reliability and validity of a soccer-specific field test of repeated sprint ability. Eur. J. Appl. Physiol. 2000, 83, 77–83. [Google Scholar] [CrossRef]
  17. Pasquarelli, B.N.; Santos, A.L.; Frisselli, A.; Dourado, A.C.; Stanganelli, L.C.R. Relationship between the Bangsbo sprint test with sprint, agility, lower limb power and aerobic capacity tests in soccer players. Rev. Andal. Med. Deporte 2010, 3, 87–91. [Google Scholar]
  18. Valente-Dos-Santos, J.; Coelho-E-Silva, M.J.; Severino, V.; Duarte, J.; Martins, R.S.; Figueiredo, A.J.; Seabra, A.T.; Philippaerts, R.M.; Cumming, S.P.; Elferink-Gemser, M.; et al. Longitudinal study of repeated sprint performance in youth soccer players of contrasting skeletal maturity status. J. Sports Sci. Med. 2012, 11, 371–379. [Google Scholar]
  19. Reilly, T.; Williams, A.M.; Nevill, A.; Franks, A. A multidisciplinary approach to talent identification in soccer. J. Sports Sci. 2000, 18, 695–702. [Google Scholar] [CrossRef]
  20. Abrantes, C.; Maçãs, V.; Sampaio, J. Variation in football players’ sprint test performance across different ages and levels of competition. J. Sports Sci. Med. 2004, 3, 44–49. [Google Scholar] [PubMed]
  21. Cardoso de Araújo, M.; Baumgart, C.; Freiwald, J.; Hoppe, M. Nonlinear sprint performance differentiates professional from young soccer players. J. Sports Med. Phys. Fit. 2017, 58, 1204–1210. [Google Scholar]
  22. Barnes, C.; Archer, D.; Hogg, B.; Bush, M.; Bradley, P. The evolution of physical and technical performance parameters in the English premier league. Int. J. Sports Med. 2014, 35, 1095–1100. [Google Scholar] [CrossRef]
  23. Faude, O.; Koch, T.; Meyer, T. Straight sprinting is the most frequent action in goal situations in professional football. J. Sports Sci. 2012, 30, 625–631. [Google Scholar] [CrossRef]
  24. Caldbeck, P. Contextual Sprinting in Football. Ph.D. Thesis, John Moores University, Liverpool, UK, 2019. [Google Scholar]
  25. Fílter, A.; Olivares, J.; Santalla, A.; Nakamura, F.Y.; Loturco, I.; Requena, B. New curve sprint test for soccer players: Reliability and relationship with linear sprint. J. Sports Sci. 2019, 38, 1320–1325. [Google Scholar] [CrossRef] [PubMed]
  26. Smith, N.; Dyson, R.; Hale, T.; Janaway, L. Contributions of the inside and outside leg to maintenance of curvilinear motion on a natural surface. Gait Posture 2006, 24, 453–458. [Google Scholar] [CrossRef]
  27. Smith, N.; Dyson, R.; Hate, T. Lower extremity muscular adaptations to curvilinear motion in soccer. J. Hum. Mov. Stud. 1997, 33, 139–153. [Google Scholar]
  28. Bravo, D.F.; Impellizzeri, F.M.; Rampinini, E.; Castagna, C.; Bishop, D.; Wisloff, U. Sprint vs. interval training in football. Int. J. Sports Med. 2008, 29, 668–674. [Google Scholar] [CrossRef] [Green Version]
  29. Buchheit, M.; Laursen, P.B.; Kuhnle, J.; Ruch, D.; Renaud, C.; Ahmaidi, S. Game-based training in young elite handball players. Int. J. Sports Med. 2009, 30, 251–258. [Google Scholar] [CrossRef] [PubMed]
  30. Buchheit, M.; Millet, G.P.; Parisy, A.; Pourchez, S.; Laursen, P.B.; Ahmaidi, S. Supramaximal training and post-exercise parasympathetic reactivation in adolescents. Med. Sci. Sports Exerc. 2008, 40, 362–371. [Google Scholar] [CrossRef] [PubMed] [Green Version]
  31. Çinarli, F.S.; Kafkas, A.Ş.; Kafkas, M.E. Relationship between linear running and change of direction performances of male soccer players. Türk Spor ve Egzersiz Dergisi 2018, 20, 93–99. [Google Scholar]
  32. Sporiš, G.; Milanović, Z.; Trajković, N.; Joksimović, A. Correlation between speed, agility and quickness (saq) in elite young soccer players. Acta Kinesiol. 2011, 5, 36–41. [Google Scholar]
  33. Vescovi, J.D.; McGuigan, M.R. Relationships between sprinting, agility, and jump ability in female athletes. J. Sports Sci. 2008, 26, 97–107. [Google Scholar] [CrossRef]
  34. Oliver, J.L.; Armstrong, N.; Williams, C.A. Relationship between brief and prolonged repeated sprint ability. J. Sci. Med. Sport 2009, 12, 238–243. [Google Scholar] [CrossRef] [PubMed]
  35. Ingebrigtsen, J.; Brochmann, M.; Castagna, C.; Bradley, P.S.; Ade, J.; Krustrup, P.; Holtermann, A. Relationships between field performance tests in high-level soccer players. J. Strength Cond. Res. 2014, 28, 942–949. [Google Scholar] [CrossRef] [PubMed]
  36. Sirico, F.; Romano, V.; Sacco, A.M.; Belviso, I.; Didonna, V.; Nurzynska, D.; Castaldo, C.; Palermi, S.; Sannino, G.; Della Valle, E.; et al. Effect of video observation and motor imagery on simple reaction time in cadet pilots. J. Funct. Morphol. Kinesiol. 2020, 5, 89. [Google Scholar] [CrossRef]
Figure 1. The curved sprint test.
Applsci 11 05355 g001
Figure 2. The repeated straight sprint test (7 × 30 m).
Applsci 11 05355 g002
Figure 3. The repeated sprint test involving changes in direction.
Applsci 11 05355 g003
Figure 4. Correlation between the total times taken in the CST and the RSCD.
Applsci 11 05355 g004
Figure 5. Correlation between the total times taken in the CST and the RSST.
Applsci 11 05355 g005
Publisher’s Note: MDPI stays neutral with regard to jurisdictional claims in published maps and institutional affiliations.

