Article

Quantitative Evaluation of Unfilled Grout in Tendons of Prestressed Concrete Girder Bridges by Portable 950 keV/3.95 MeV X-ray Sources

1
Nuclear Professional School, School of Engineering, The University of Tokyo, Ibaraki 319-1188, Japan
2
Department of Nuclear Engineering and Management, School of Engineering, The University of Tokyo, Tokyo 113-8654, Japan
3
Accuthera Inc., Kanagawa 215-0033, Japan
4
Atox Co., LTD., Tokyo 108-0014, Japan
*
Author to whom correspondence should be addressed.
Submission received: 29 April 2021 / Revised: 4 June 2021 / Accepted: 7 June 2021 / Published: 15 June 2021
(This article belongs to the Special Issue Non-destructive Testing in Civil Engineering)

Abstract

:
We have developed porTable 950 keV/3.95 MeV X-band (9.3 GHz) electron linear accelerator (LINAC)-based X-ray sources and conducted onsite prestressed concrete (PC) bridge inspection in the last 10 years. A T-shaped PC girder bridge with a thickness of 200–400 mm and a box-shaped PC girder bridge with a thickness of 200–800 mm were tested. X-ray transmission images of flaws such as thinning, fray, and disconnection caused by corrosion of PC wires and unfilled grout were observed. A three-dimensional structural analysis was performed to estimate the reduction in the yield stress of the bridge. In this study, we attempted to evaluate the unfilled grout quantitatively because it is the main flaw that results in water filling and corrosion. In the measured X-ray images, we obtained gray values, which correspond to the X-ray attenuation coefficients of filled/unfilled grouts, PC wires (steel) in a sheath, and concrete. Then, we compared the ratio of the gray values of the filled/unfilled grouts and PC wires to determine the stage of the unfilled grout. We examined this quantitative evaluation using the data obtained from a real T-shaped PC girder bridge and model samples to simulate thick box-shaped PC girder bridges. We obtained a clear quantitative difference in the ratios for unfilled and filled grouts, which coincided with our visual perception. We synthesized the experience and data and proposed a quantitative analysis for evaluating the unfilled grout for subsequent steps such as structural analysis and destructive evaluation by boring surveys.

1. Introduction

Many concrete structures are facing aging problems. Most social infrastructure components, including bridges and tunnels, were built during the rapid economic boom of the 1960s. Since then, the aging and degradation effects have gradually proceeded. Thus, the need for maintenance of these structures is growing exponentially. Due to the legendary growth boom that started after WWII, 16% of the overall concrete social infrastructure was over 50 years old in 2011. The lifespan of these structures is generally 50 years [1]. Only 10 years later, in 2021, this ratio has reached 42% and will increase to 63% by 2031, as shown in Figure 1. The number and rate of growth of aging structures are astounding, and this constitutes a critical problem for our society.
Any major malfunction in these infrastructures may have a profound influence on our industrial system and social life. It is very costly to rebuild anything that seems to have been damaged. Only if proper management is carried out can the lifespans of these structures be extended. Even though deterioration has already proceeded, appropriate assessment and management are necessary to ensure their safety. After the accident caused by the fall of a concrete ceiling at a Japanese highway tunnel in 2012, the Japanese government approved a law to maintain and manage such infrastructure every five years in order to secure their continuous and long-term use. However, it is difficult to determine the state of deterioration to prevent a collapse during maintenance. According to the governmental law, the current inspections are mainly carried out by visual inspection, hammer-sounding inspection, and palpation. The surface condition is observed visually, and the wall surface is evaluated by knocking on it with a special hammer to examine the concrete lifting and peeling. Palpation is mainly used to detect loose bolts and nuts. Only superficial conditions can be confirmed by these methods. Damage, degradation, and deterioration proceed continuously, not only outside but also inside the structure. How the inner structure is damaged, especially the metal rods on which the strength and load of the whole structure rely to a large extent, remains unknown from outside. An appropriate evaluation technology for structural integrity is necessary for the assessment of deep inside degradation. Figure 2 shows the number of bridges built per year and the percentage by structure in Japan. From 1950 to 1960, the number of newly constructed bridges increased significantly each year. During the economic boom, most bridges were built with prestressed concrete (PC) [2].
The PC bridge technology was first applied in construction in 1951 in Japan and subsequently became widespread owing to its ability to meet the high strength required by the design standard at a low construction cost. However, as the scale of bridges expanded, these structures became more complicated [3]. The technology was relatively new, and knowledge had not yet accumulated. As these bridges aged, degradation damage caused by the environment, corrosion, and rupture appeared in the late 1980s and 1990s. These problems are occurring now and will continue in the future, leading to critical situations, as shown in Figure 3. To demonstrate the inspection method, it is necessary to explain the types of concrete bridges while underlining the primary inspection target, namely, PC bridges.
As shown in Figure 4, there are several types of PC bridges. T-shaped PC girder bridges have cast-in-place concrete beams with designed sections on both sides of the beams. The beams are more profound than the deck sections of their cross sections. Thus, it is called a T-shaped PC girder bridge. Box-shaped PC girder bridges are bridges in which the main beams comprise girders in the shape of a hollow box, which is typically rectangular in a cross section. This type is typical of highways and other elevated structures. As it is cost-effective and superior in strength, it can be a precast offsite to assure quality. Slab bridges are monolithic and consist of simple flat concrete slabs with twisted or roughened reinforcing rods concentrated in the lower portion at both ends of the slab. Regardless of its type, a bridge relies on the built-in prestressed steel reinforcement.
Reinforcements are generally distributed and fixed at the two ends of the concrete bridge, as shown in Figure 5. Steel reinforcements are generally placed inside a hollow sleeve, called a sheath. The reinforcements are fixed inside the sheath using a material called grout, as shown in Figure 6. The grout inside a sheath may suffer from damage because it is a material different from concrete and is filled into the sheath afterward. Several factors may cause grout failure, such as construction negligence and neutralization with CO2, as the grout consists of alkali. In addition, water, moisture, and salt invasion are the other main reasons for failure. Rainwater invades the PC sheath from the edge. The situation of filled and unfilled grout in two types of PC is schematically depicted in Figure 7. If there is unfilled grout, a large amount of water remains. Then, it gradually induces corrosion, thinning, and cracking of the PC sheath and wires. The water exudes from the corroded sheath to the surface of the concrete. Thinning, fray, and disconnection of PC wires occur, which leads to a significant reduction in mechanical strength. The unfilled grout itself is a longitudinal discontinuity of the mechanical stiffness. Therefore, it becomes a reason for cracks in the nearby concrete, even at an early stage of use. Finally, rainwater and humidity invade the concrete from the surface.
Unfilled grout of the tendons of PC bridges can cause corrosion and, consequently, provoke significant prestress losses, which, in turn, can induce cracking and excessive deflections during service of the PC bridge girder [5,6,7,8,9].

2. Review of Existing Methods

There are several nondestructive evaluation (NDE) methods for detecting poor construction, such as unfilled grout in the PC sheath, and degradation, such as thinning and disconnection of PC wires. RADAR [10], ultrasonic testing [11], magnetic testing [12], and 200–400 kV X-ray tubes [13] are shown in Figure 8. RADAR can detect and visualize 3D iron structures up to 300 mm thick, but the reconstructed image is distorted by a few milliseconds. Ultrasonic testing is available up to 200 mm in thickness, but it is difficult to use to reconstruct the shape of an iron structure. Magnetic testing can detect the disconnection of iron rods or wires up to 300 mm in thickness. With a 400 kV X-ray tube, transmitted images of the PC sheath, wires, rods, and grout can be obtained up to 400 mm in thickness, but it takes approximately 1 h.
Compared with the above existing methods, we explain and emphasize the advantage of our method using 950 keV/3.95 MeV X-ray sources [14,15,16]. With them, clear detection and visualization with 1 mm resolution of PC iron structures and grout filling at a depth of 400–1000 mm are possible within minutes.

3. Proposed Methodology

3.1. 950 keV/3.95 MeV X-ray Sources

We used an X-band (9.3 GHz) LINAC-based 950 keV/3.95 MeV X-ray source to inspect the actual bridge [14,15,16]. These systems are shown in Figure 9a,b, respectively.
The electrons are accelerated up to 950 keV by radio frequency (RF) fields in the first source. We also adopted a side-coupled standing-wave-type accelerating structure. The electrons are injected into the tungsten target, which generates bremsstrahlung X-rays. A tungsten collimator makes the generated X-rays to the shape of a cone with an opening angle of 17°. The X-ray intensity is 50 mSv/min at 1 m for a full magnetron RF power of 250 kW. The system consists of a 50 kg X-ray head, a 50 kg magnetron box, and a stationary unit of an electric power source and water chiller. The X-ray head and the magnetron box are portable. Because a flexible waveguide connects them, only the position and angle of the X-ray head can be finely tuned. We optimized the design based on the X-ray intensity, compactness, and weight. The parameters of the 950 keV X-ray source are listed in Table 1. We placed an X-ray detector on the opposite side of the object to detect the transmitted X-rays. We used a flat panel detector (FPD) of a 0.4 thick GOS scintillator, with 16″ × 16″ detector size and 200 μm pixels.
The 3.95 MeV system appears in Figure 9b. This system consists of a 62 kg X-ray head with a target collimator of 80 kg, a magnetron box weighing 62 kg, electric power sources at 116 kg, and a water-cooling system weighing 30 kg. The X-ray head and magnetron box are portable, and the position and angle of the former are finely tuned. The X-ray intensity of the system was 2 Gy/min at 1 m.
The calculated attenuation in concrete for the X-rays from the 950 keV/3.95 MeV sources are shown in Figure 10. The results indicate that concrete with thicknesses up to 400 mm and 800 mm can be penetrated by the 950 keV/3.95 MeV sources, respectively.
Figure 11 depicts the procedure of X-ray inspection, flaw evaluation, and structural analysis. Poor construction of unfilled grout in PC sheaths, early degradation such as rainwater intrusion, and finally serious degradation of thinning and disconnection of PC wires are detected with a spatial resolution of 1 mm within minutes by X-ray transmission imaging inspection. The iron components of PC, such as wires, can be clearly seen with a good contrast to concrete. Thinning and disconnection were observed with a spatial resolution of 1 mm. Measured flaws such as unfilled grout and thinning/disconnection are input to the structural analysis described in References [16,17]. Thus, the initial poor construction of unfilled grout and serious thinning and disconnection of PC wires are diagnosed, and their effect on the lack and degradation of strength is quantitatively evaluated by structural analysis. Finally, maintenance, repair, and reconstruction were planned.

3.2. Radiation Safety Control

We complied with the law (including the Law Concerning Prevention from Radiation Hazards due to Radioisotopes) and regulations (Regulations on Prevention of Ionizing Radiation Hazards) [18] when we used the 950 keV/3.95 MeV X-ray sources outside for onsite bridge inspection in Japan. According to the law, an electron beam source below 1 MeV is not defined as an accelerator. Thus, we complied with these regulations. The 950 keV X-ray source was registered at the local agency of labor supervision. Following the regulations, the source was usually operated in a radiation-controlled area with a radiation safety system. The use of sources outside the controlled area was also allowed. In this case, we temporally set a restricted area at the measurement site and put sufficient shielding around the source and object to suppress the air dose rate below 1.3 mSv/3 months. Moreover, we set the facility boundary at 250 μSv/month temporally. An amendment of the law allowing the use of less than 4 MeV accelerators for onsite bridge inspection was approved in Japan in 2005. After we received the governmental registration as a radiation source, we submitted permission for its use outside the radiation-controlled area. Finally, we performed onsite inspections under the same regulations for the 950 keV case.

4. Experimental Results

4.1. WEB Part of T-Shape PC Girder Bridge

X-ray transmission images for a typical T-shaped PC girder bridge were acquired onsite, as shown in 
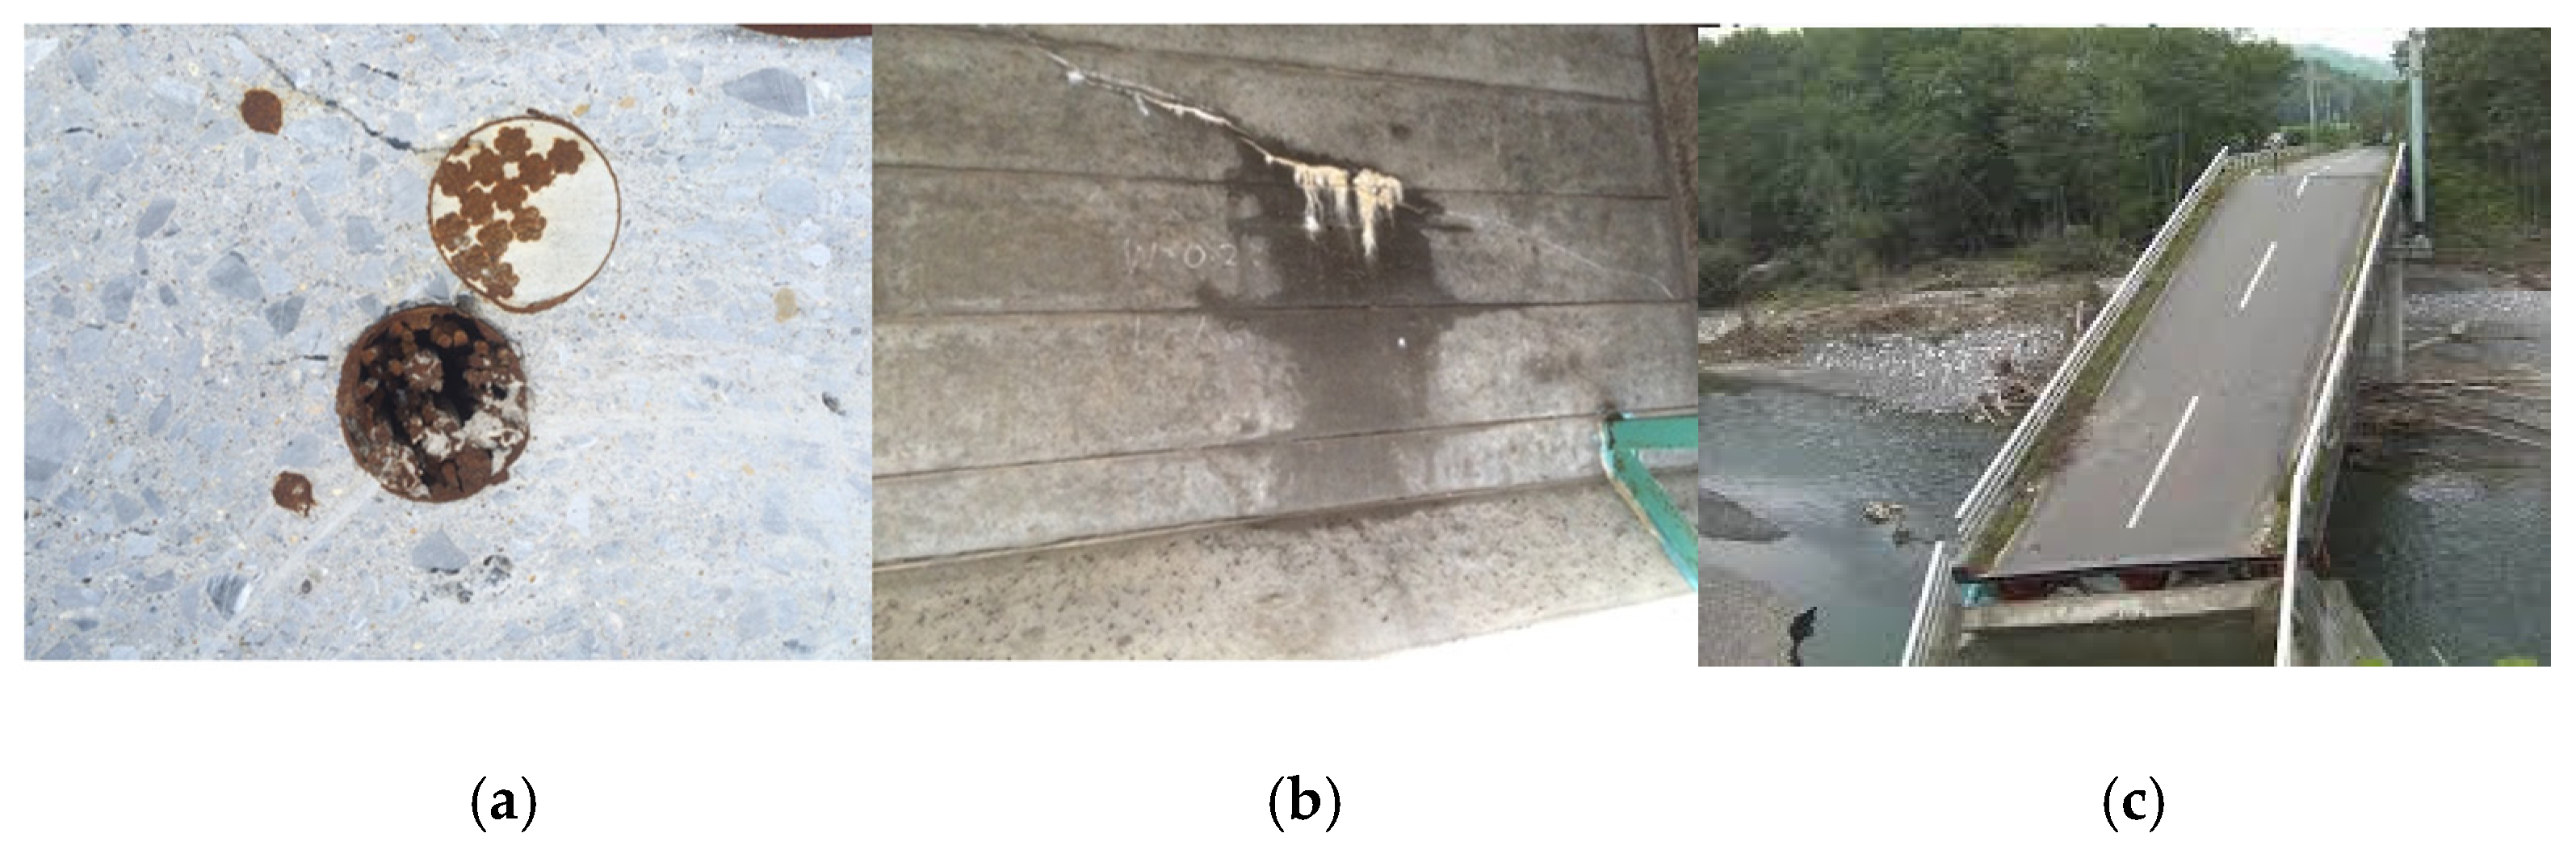
Figure 12a. The portable X-ray source box and magnetron box were lifted and finely positioned to the WEB part of the T-shaped PC girder bridge. The electric power source and water chiller are installed in a special vehicle with a 20 kVA electric diesel generator. The X-ray FPD was attached to the opposite side of the WEB part with respect to the X-ray source. Based on visual inspection, the WEB part indicated by the lines became the target ((b)). We found large surface concrete cracks and an exuded white Ca water stain. The inspection region of the PC wires, shown in (b), was examined using an X-ray source. Figure 12c shows the surface cracks and the stain and X-ray transmitted images at the two flaws. In the two X-ray images, we observed declined PC sheaths, where PC wires and grout were inserted, and vertical/horizontal reinforcing rods. In the upper and lower cases, the lower halves beneath the PC wires appear dark/black and bright/white, respectively. In particular, it was speculated that the grout was unfilled and as a result, rainwater was retained in (c). Then, the PC sheath was corroded, and water exuded from the corroded cracks of the sheath to the surface via cracks in the concrete. The obtained X-ray images were attached to the design drawing, as shown in Figure 12d. The inner situation of the PC sheaths in a rather wide region was then visualized.
We then evaluated the stage of unfilled grout in the PC sheath by gray value plotting, using the ratio of the gray values of unfilled grout and PC wires from the measured X-ray images. Here, we needed to consider and calibrate the uniformity of the background X-ray intensity distribution.
The X-rays used were emitted from a point with diameter of 2 mm at the W target and collimated by 17° by the W collimator. Therefore, the X-ray intensity at the FPD had an axisymmetric distribution. As the radius increased, the intensity decreased. As shown in Figure 13, if the source releases the X-ray beam in parallel, the dose is equally received by the detector at every location. The beam distribution is uniform. However, the X-rays from our point-source have a cone shape and radial intensity distribution at the FPD, as shown on the right-hand side of the figure.
A typical X-ray image is shown in Figure 14. This was acquired from a 200 mm-thick WEB part of the T-shaped PC girder bridge using the 950 keV X-ray source. The PC sheath, wires, and other rods are observed. The definition of the gray value is shown in Figure 15. In this measurement, the black and white parts correspond to highly and slightly X-ray-attenuated parts, respectively. According to the X-ray attenuation coefficient, PC wires appear very dark while grout in the PC sheath and concrete appears bright. The locations of typical materials such as PC wires, rods, concrete, and filled/unfilled grouts are shown in Figure 14.
Then, we checked the background X-ray intensity distribution on the line segment, as indicated in Figure 14. Here, we used an 8-bit system so that the full scale corresponds to 256. Darkness, or a lower gray value near the corners, is a result of an ununiformly distributed X-ray dose. The effect must be considered when the evaluation is based on gray values. The gray value of the line segment, where only concrete exists (see Figure 14), is plotted in Figure 16. An 8th-degree polynomial fitting curve was added to the original profile. At that stage, the relative background X-ray intensity distribution was obtained. These data were utilized to compensate for the gray values of unfilled grout and PC wires to obtain their ratio, which is the proposed index for the stage of unfilled grout.
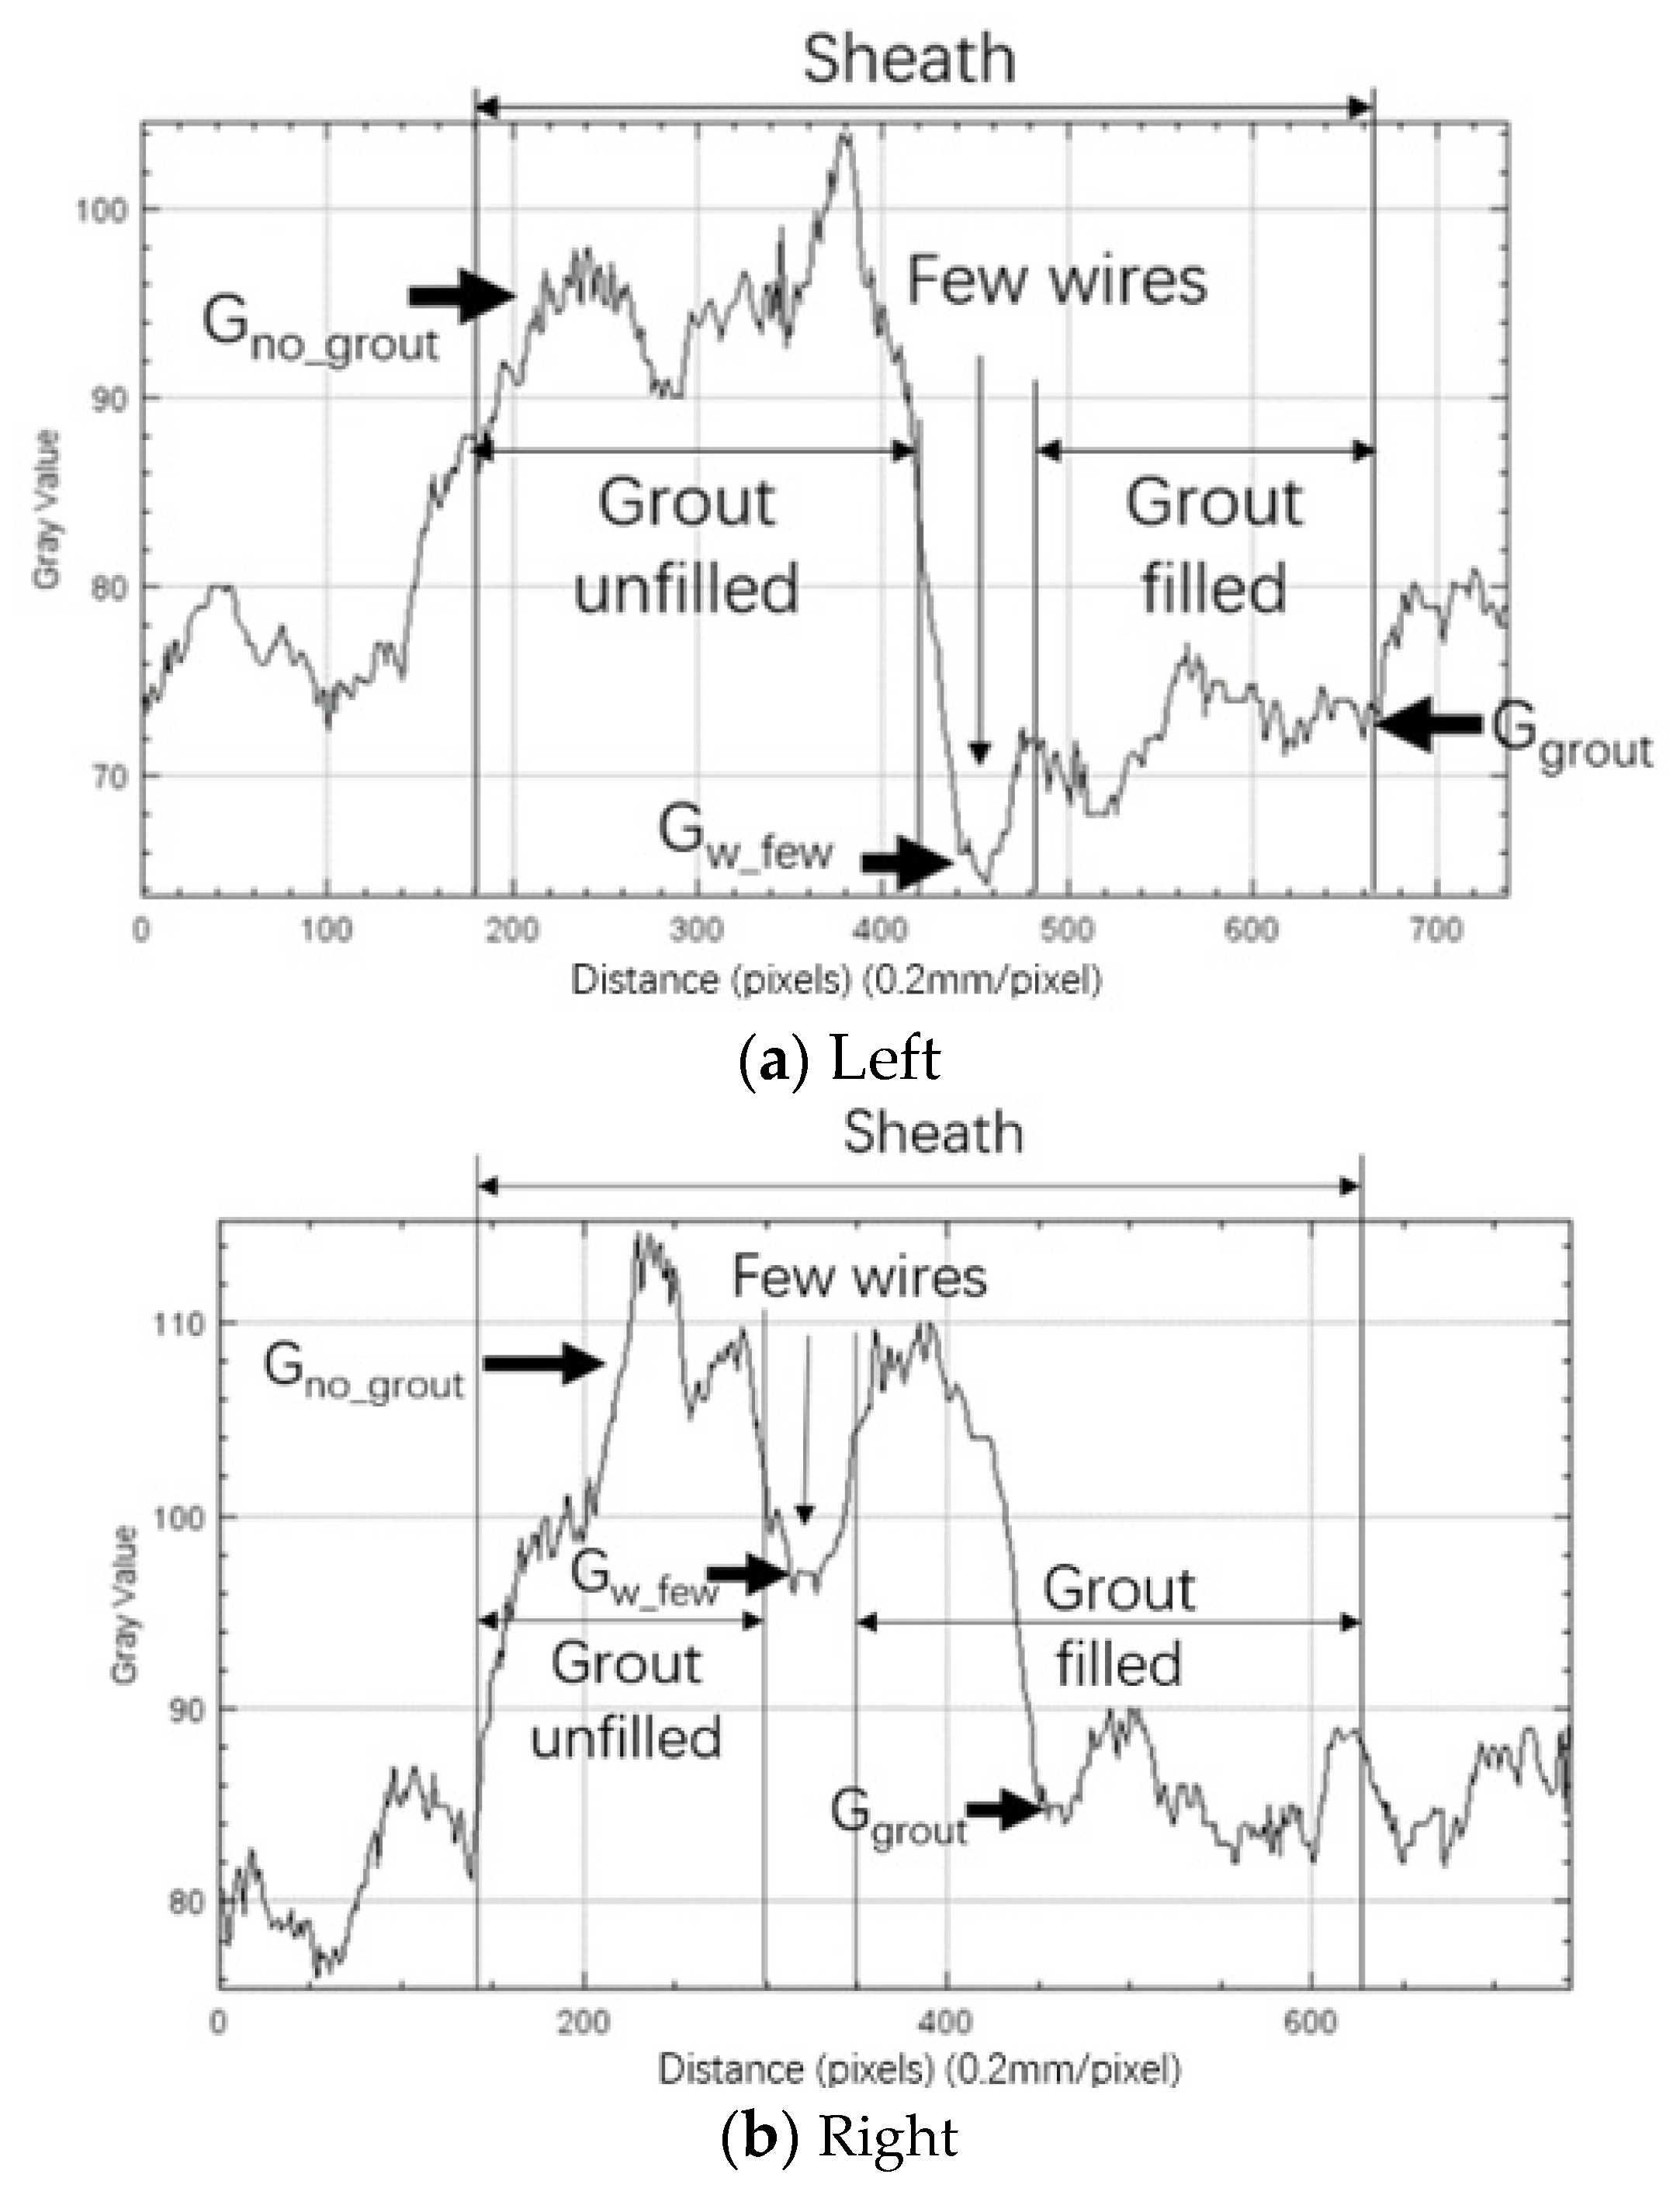
Schematic gray value profiles of the filled and unfilled grout cases are shown in Figure 17a. In fact, these lie on the background of the X-ray point source, as shown in (b). In this measurement by the X-ray FPD, heavy and light materials appear dark and gray, respectively. The gray values of the dark and gray parts correspond to the low and high gray values, respectively. We needed to evaluate the background X-ray intensity distribution first and subtract it from the measured data. We tried to represent the gray value at the plateau, Gw, for PC wires, as shown in (a). The boundary to the grout area appeared to be less dark and its gray value, Gw_few, became lower because only a few wires were located. There was gradation in the region of the filled grout as the effective thickness changes (see (a)). Thus, the medium gray value was selected for the filled grout as Ggrout. The gray value at the high/bright peak was regarded as Gno_grout. The ratio, K, of the gray values at filled/unfilled grout and PC wires was calculated for several situations as
K f w = G g r o u t   G w   for   filled   grout   and   many   wires .
Then,
K u w =   G n o _ g r o u t G w   for   unfilled   grout   and   many   wires ,
K f w f = G g r o u t G w _ f e w   for   filled   grout   and   few   wires ,
K u w f =   G n o _ g r o u t G w _ f e w   for   unfilled   grout   and   few   wires ,
K u f =   G n o _ g r o u t G g r o u t   for   unfilled   and   filled   grouts .
Because Gw is lower than Ggrout and Gno_grout, both Kuw and Kfw must be higher than 1. Kuw at the unfilled grout must also be higher than Kfw at the filled grout, as explained above.
The inner contents of the image in Figure 14 are explained in Figure 18. The grout appears wholly unfilled in the broken line frame. The bright blank indicates the vacancy at this location, leading to a high dose at the FPD, which reveals a grout flaw. In comparison, the dark straight region above the broken line frame indicates the existence of PC wires, which remarkably attenuate X-rays. To make a quantitative evaluation, it was necessary to establish a method based on sufficient numerical tools. Gray value evaluation of the raw images was expected to be effective on this occasion.
Figure 19 shows the gray value profile plotted along the line segment that crosses the PC sheath transversely. The diameter and thickness of the PC sheath tube were ~38 mm and ~1 mm, respectively. Approximately 15 PC wires of ~7 mm in diameter were installed in a sheath. Each wire can be recognized almost entirely. The magnified profile of the gray value across the PC sheath is shown in Figure 19. We can clearly observe the locations of the PC wires and grout in the concrete. The dark and bright/white parts of the PC wires and grout correspond to the lower and upper gray value peaks, respectively. This quantitative result is consistent with our visual recognition of the original X-ray image. That is, the bright/white part beneath the PC wires appears as a fully unfilled grout. This is supported by gray value analysis. Thus, this case can be evaluated as a fully unfilled grout.
Next, we proposed a quantitative index of the stage of the unfilled grout. The gray value profile along the line segment across the PC sheath and nearby reinforcing rods (see Figure 20) was obtained, as shown in Figure 21. Regions of “A” and “B” correspond to the PC wires and unfilled grout, respectively. A few wires are seen less to be dark in the region between them, as depicted in Figure 17a. Additionally, two lower peaks attributed to the two rods can be clearly observed as “C” and “D”. Because this profile contains an ununiform background distribution of irradiating X-rays, it has to be compensated by using the data shown in Figure 16. The compensated profile is shown in Figure 22. We used these compensated profiles for the gray value analysis to evaluate the filled and unfilled grouts quantitatively.
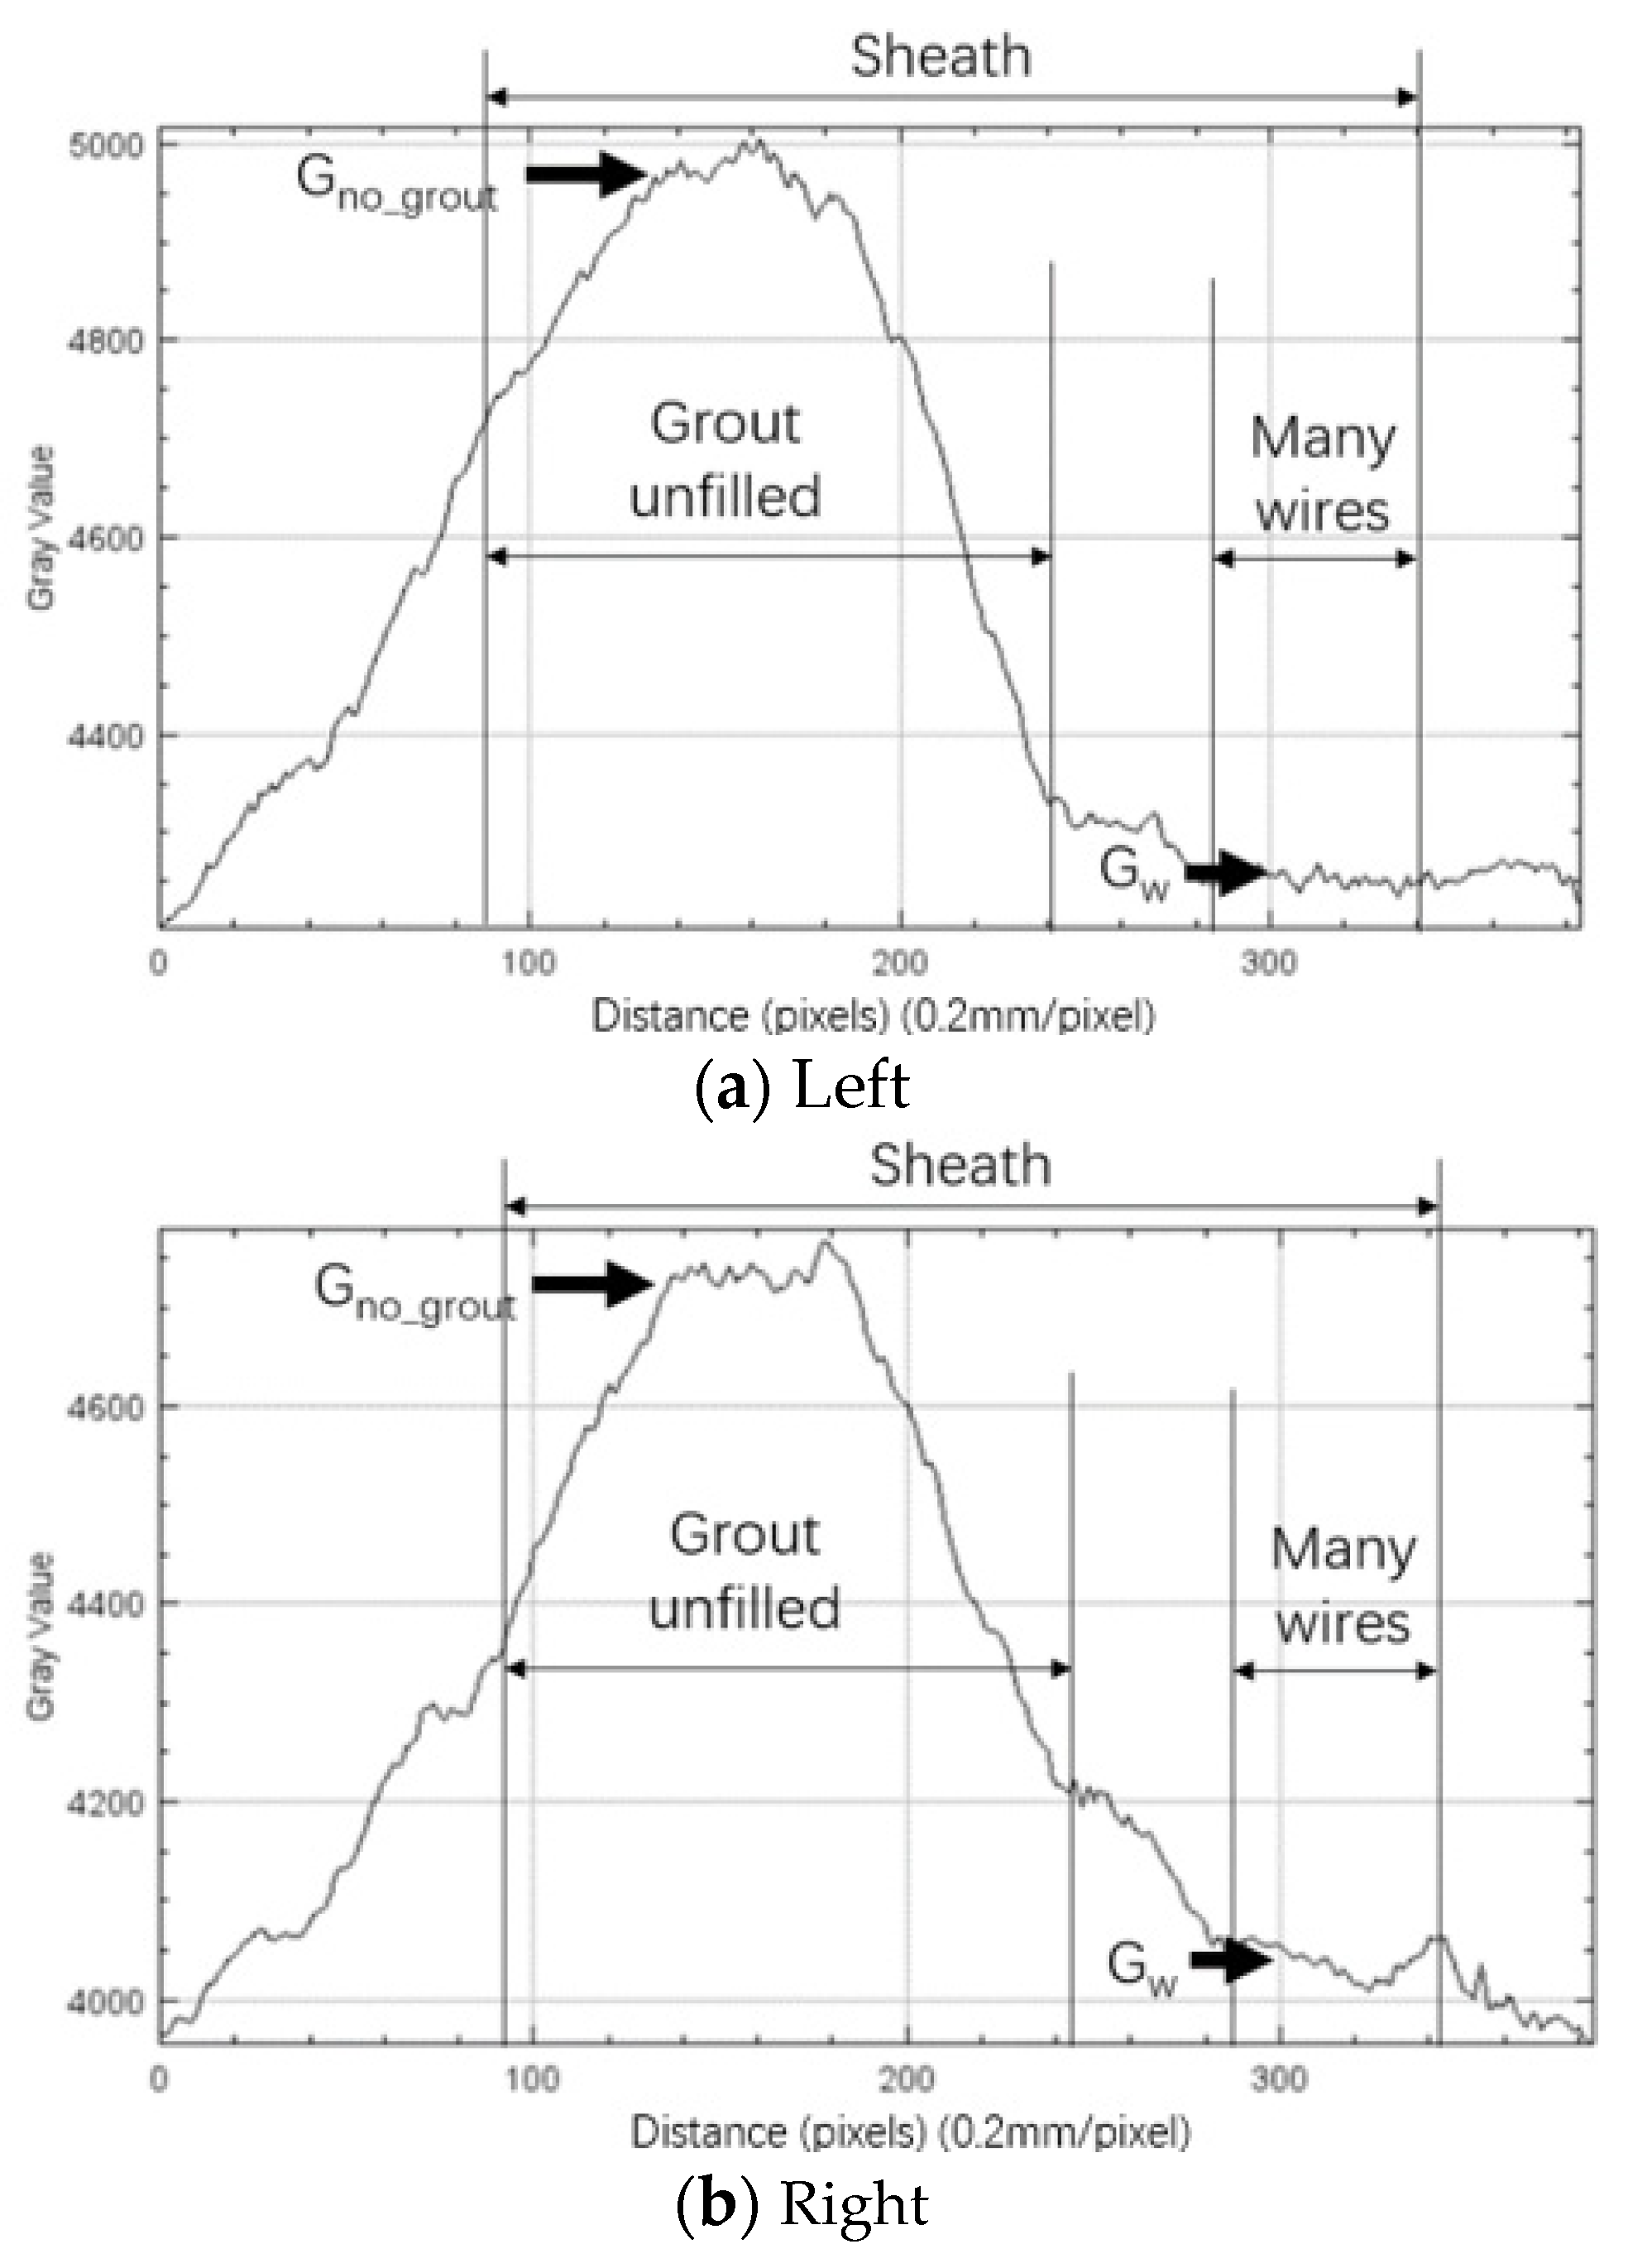
Line segments for gray value analysis are indicated in Figure 23 in this X-ray image of the 200 mm thick WEB of the T-shaped PC girder bridge by the 950 keV X-ray source. The gray-value profiles are shown in Figure 24.
By identifying the sheath range within the gray value profile, gray values could be obtained. The evaluated values are summarized in Table 2. As predicted above, the average ratio of K is clearly higher than 1 and is approximately 1.4.
Moreover, we plotted another set of gray values for the unfilled grout. Figure 25 shows the original image of the same WEB part (200 mm-thick T-shaped PC girder bridge) taken by the 950 keV source. The inspection location is different from that shown in Figure 23, as exhibited in Figure 12d. Line segments for gray value analysis are also indicated in the figure.
The gray value distributions on the line segments in Figure 25 are shown in Figure 26. Table 3 lists the gray values and K ratios. The average ratio of Kuw is approximately 1.5. Meanwhile, Kuw_few is lower at ~1.1 This is because the parts of many and a few wires look dark and less dark, that is, Gw_few > Gw.
After looking into the unfilled sample, we proceeded to the filled grout case. Figure 27 shows an image taken from the same WEB part (200 mm-thick T-shaped PC girder bridge) by the 950 keV source. The lower half of the PC sheath appears to be dark compared to that in Figure 23 and Figure 25. Line segments for plotting the gray values are also observed.
In the same way, the profiles were plotted as shown in Figure 28, and the K ratios are calculated in Table 4. The average ratio of Kfw is ~1.3, which is lower than the Knw of ~1.4 and ~1.5 indicated in Table 2 and Table 3. If we used the gray value at the wire boundary, Gw_few, the ratio of Kfw_few became rather low at ~1.1. Again, the gray value at the wire boundary does not appear appropriate for the evaluation of unfilled and filled grouts.

4.2. Model Samples of 750 mm Thickness for Box-Shape PC Girder Bridge

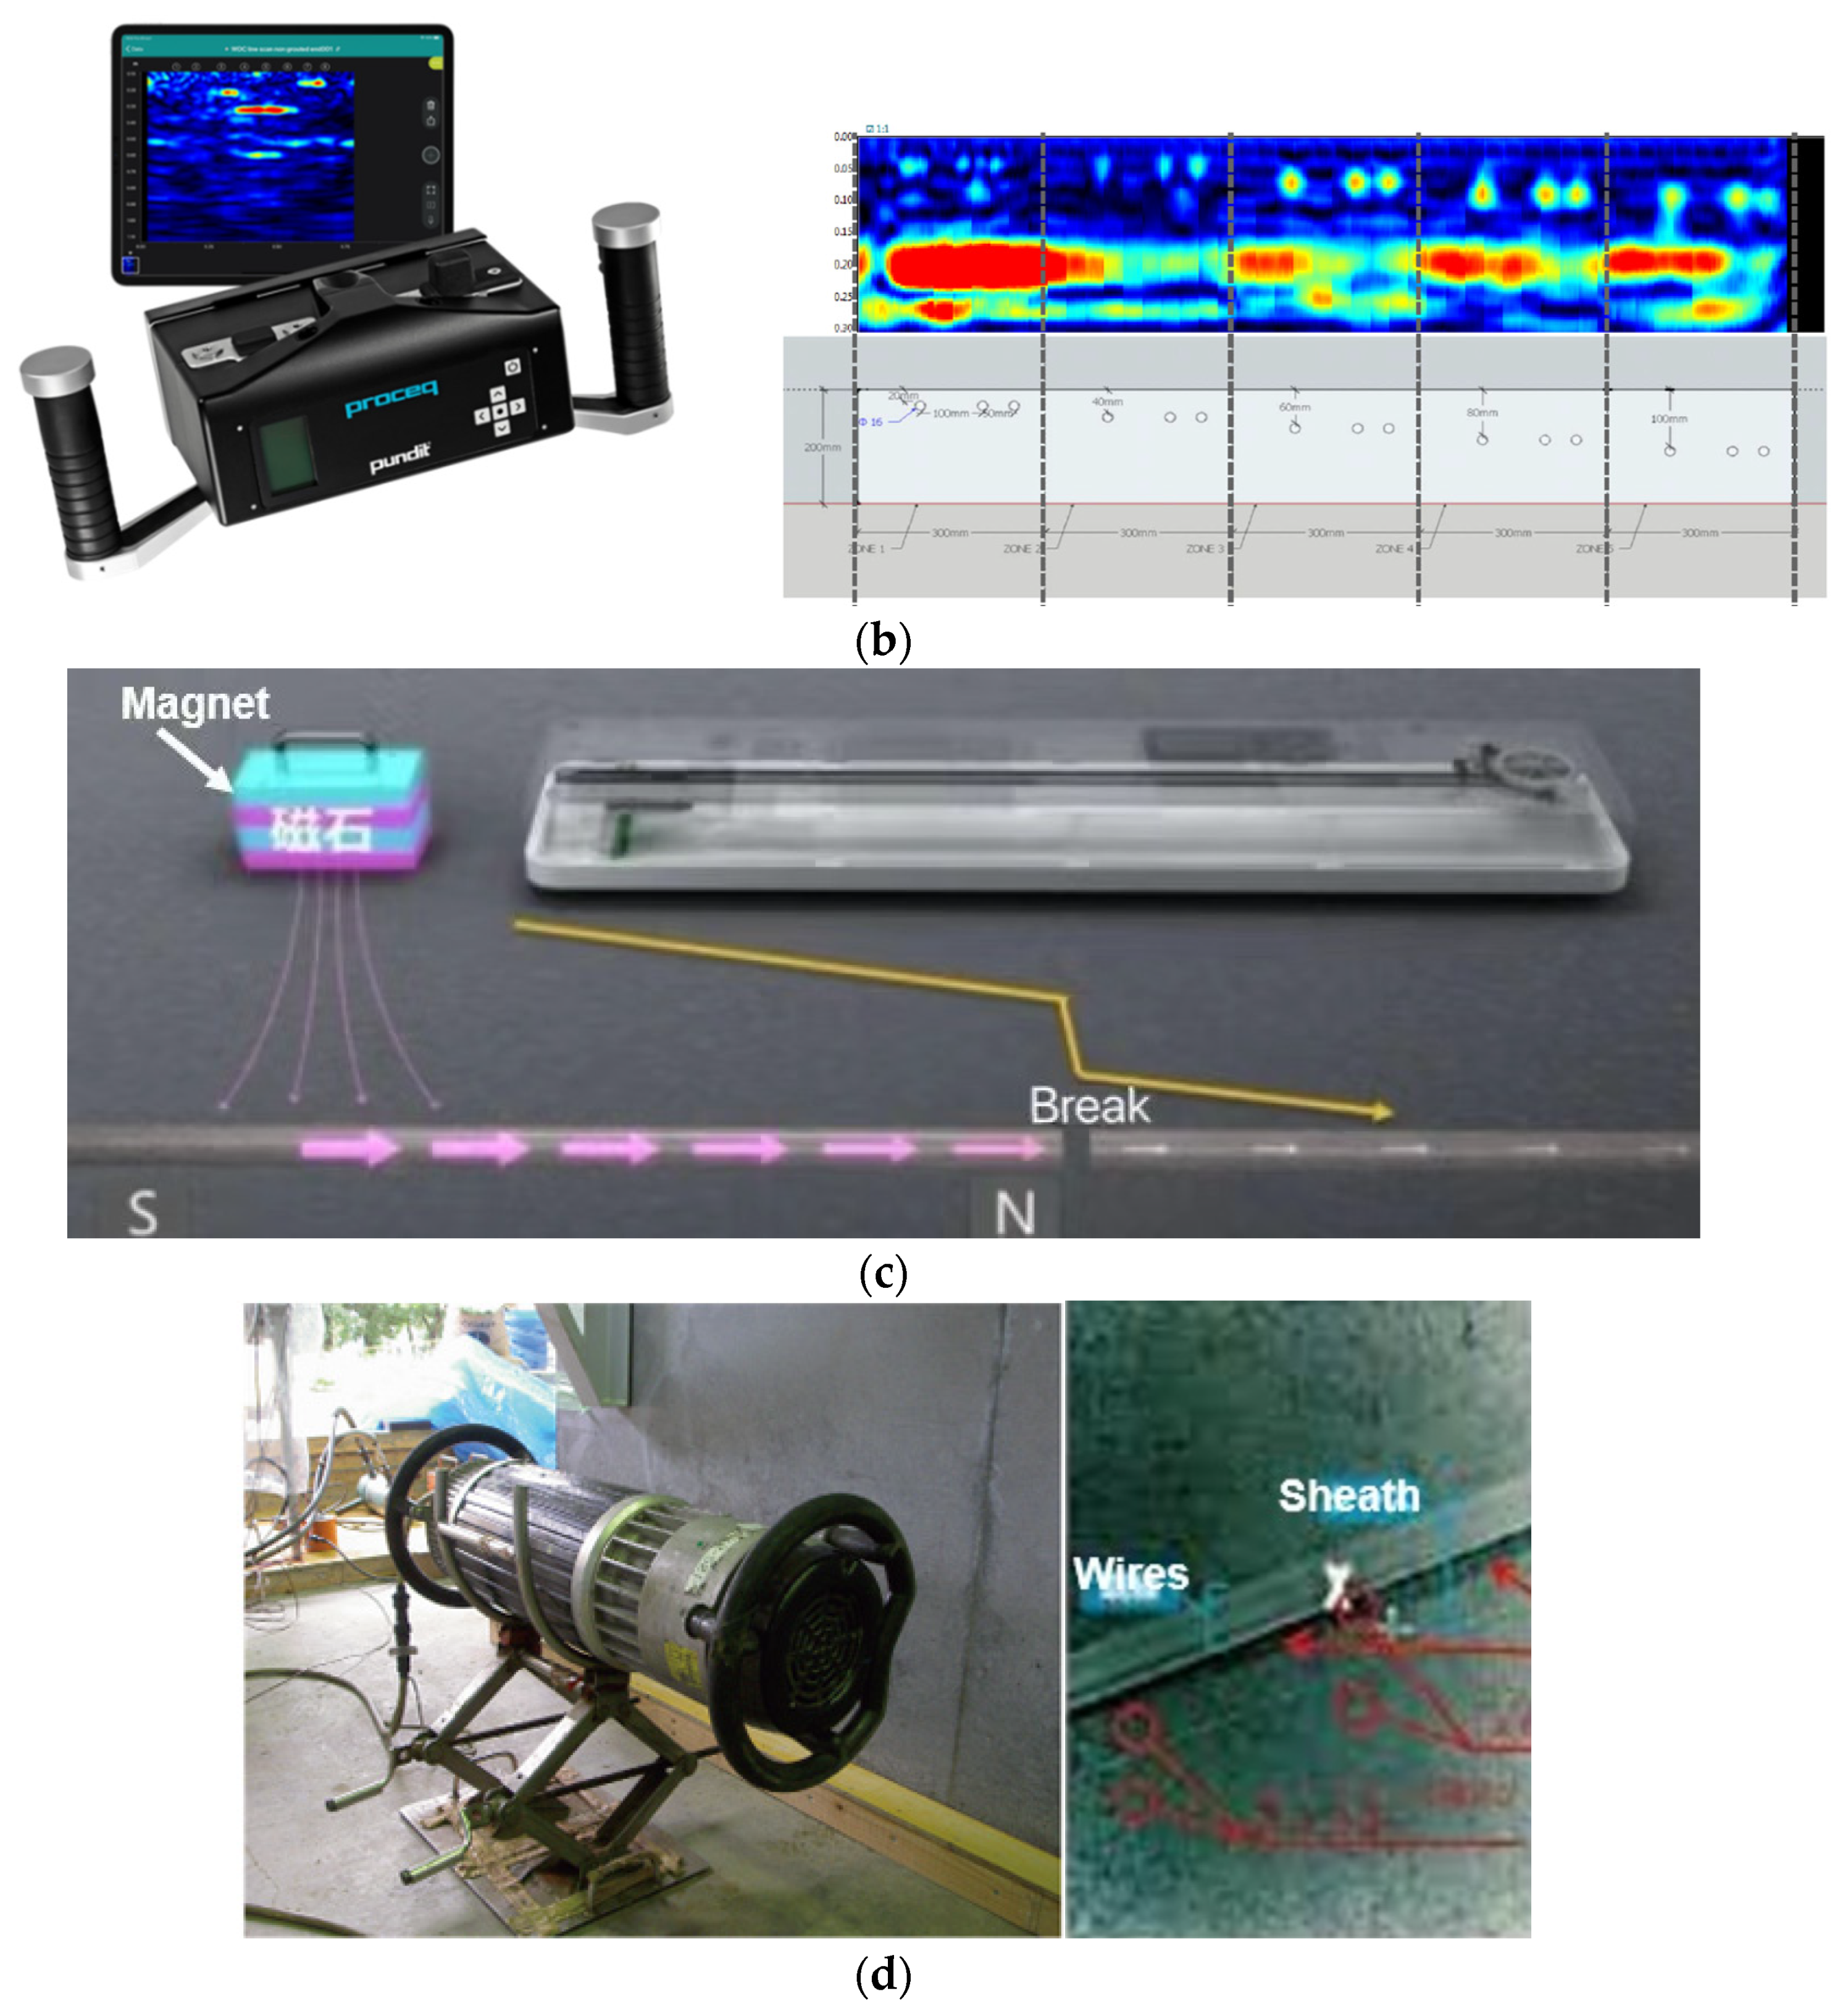
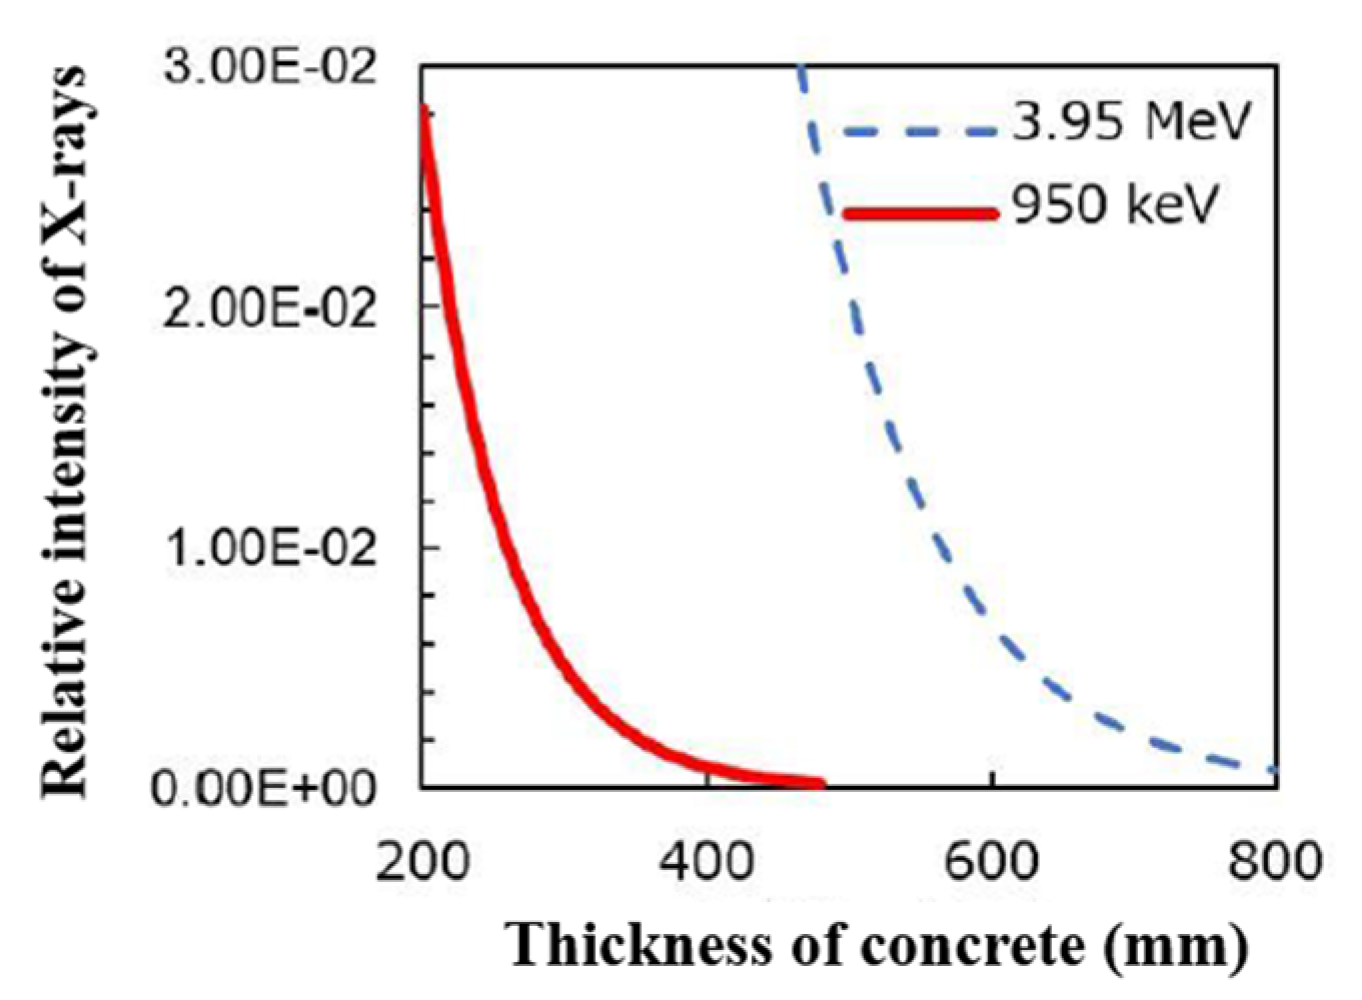
Now, we explain the similar filled/unfilled grout analysis for the side WEB of a box-shaped PC girder bridge using the 3.95 MeV X-ray source. Because the PC concrete thickness is far greater than 400 mm, we needed to use the 3.95 MeV X-ray source here. Real bridge inspection continued, and the obtained results are currently under evaluation. Hence, the results of the preparatory experiments modeling the real situation are introduced in this paper.
The target was a 750 mm thick PC WEB wall. We constructed model samples using pieces cut from real old bridges. The 750 mm thick assemblies are located between the 3.95 MeV X-ray source and the X-ray FPD detector, as shown in Figure 29a. The photograph is shown in (b). The PC wire used for insertion is shown in (c).
For better image quality, multiple X-ray shots should be averaged into a single image. As shown in Figure 29, the 750 mm-thick assembly is irradiated by the 3.95 MeV X-ray source. Figure 30 shows the X-ray images for 1, 25, 50, and 100 shots, where one shot means 10 s exposure, and their averages are taken for each image to smooth the image [19]. When the exposure time is short and the transmitted X-ray intensity is weak, the image appears spotty and the gray value profile becomes noisy. If the exposure time is increased, the profile is expected to be smoother. Such a denoising effect by stacking 1, 25, 50, and 100 X-ray shots is clear, as shown in Figure 31. The noise attributed to the lack of X-ray intensity is remarkably reduced for many stacking shots. Because the concrete is significantly thick, the intensity of the transmitted X-ray becomes attenuated. Therefore, stacking using appropriate shots is necessary for an accurate quantitative analysis of filled and unfilled grouts based on their gray value difference.
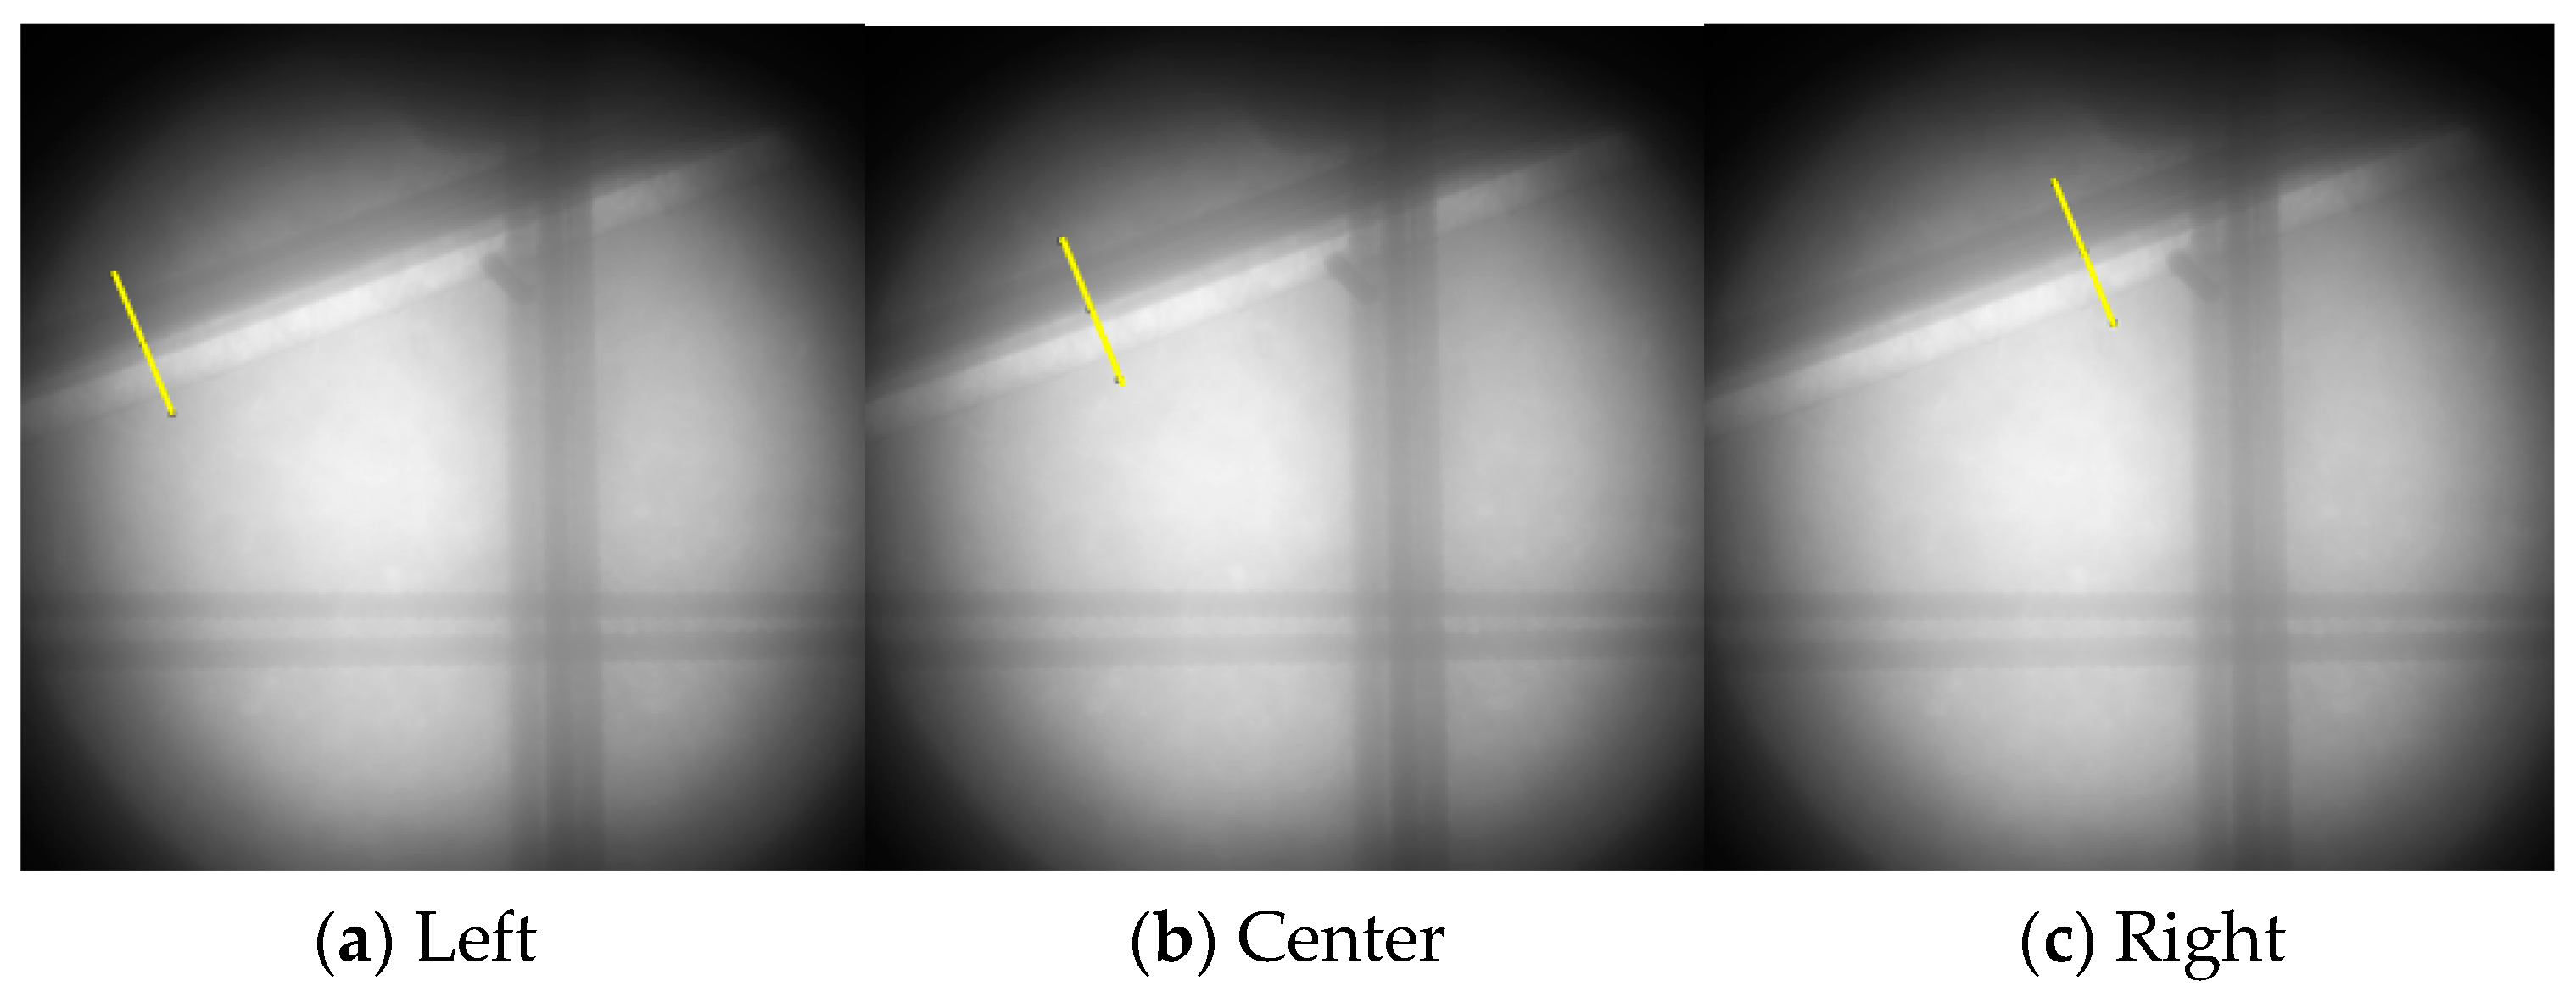
Now, X-ray images taken by the 3.95 MeV source for the model samples of a box-shaped PC girder bridge were analyzed. The inner contents of the samples are shown in Figure 32. Two declined sheaths can be observed. In this case, only a few wires are inserted into the remaining grout in the upper sheath 1, and many wires are located in the lower sheath 2. The gray value profiles were evaluated on the indicated line segments. Gray value profiles and analysis were performed, as shown in Figure 33. A few wires are clearly recognized by the small negative peak in the figure. The calculated values are listed in Table 5. Because there were only a few wires in sheath 2, only Kuw_few and Kfw_few were evaluated. Additionally, Kuwf was calculated.
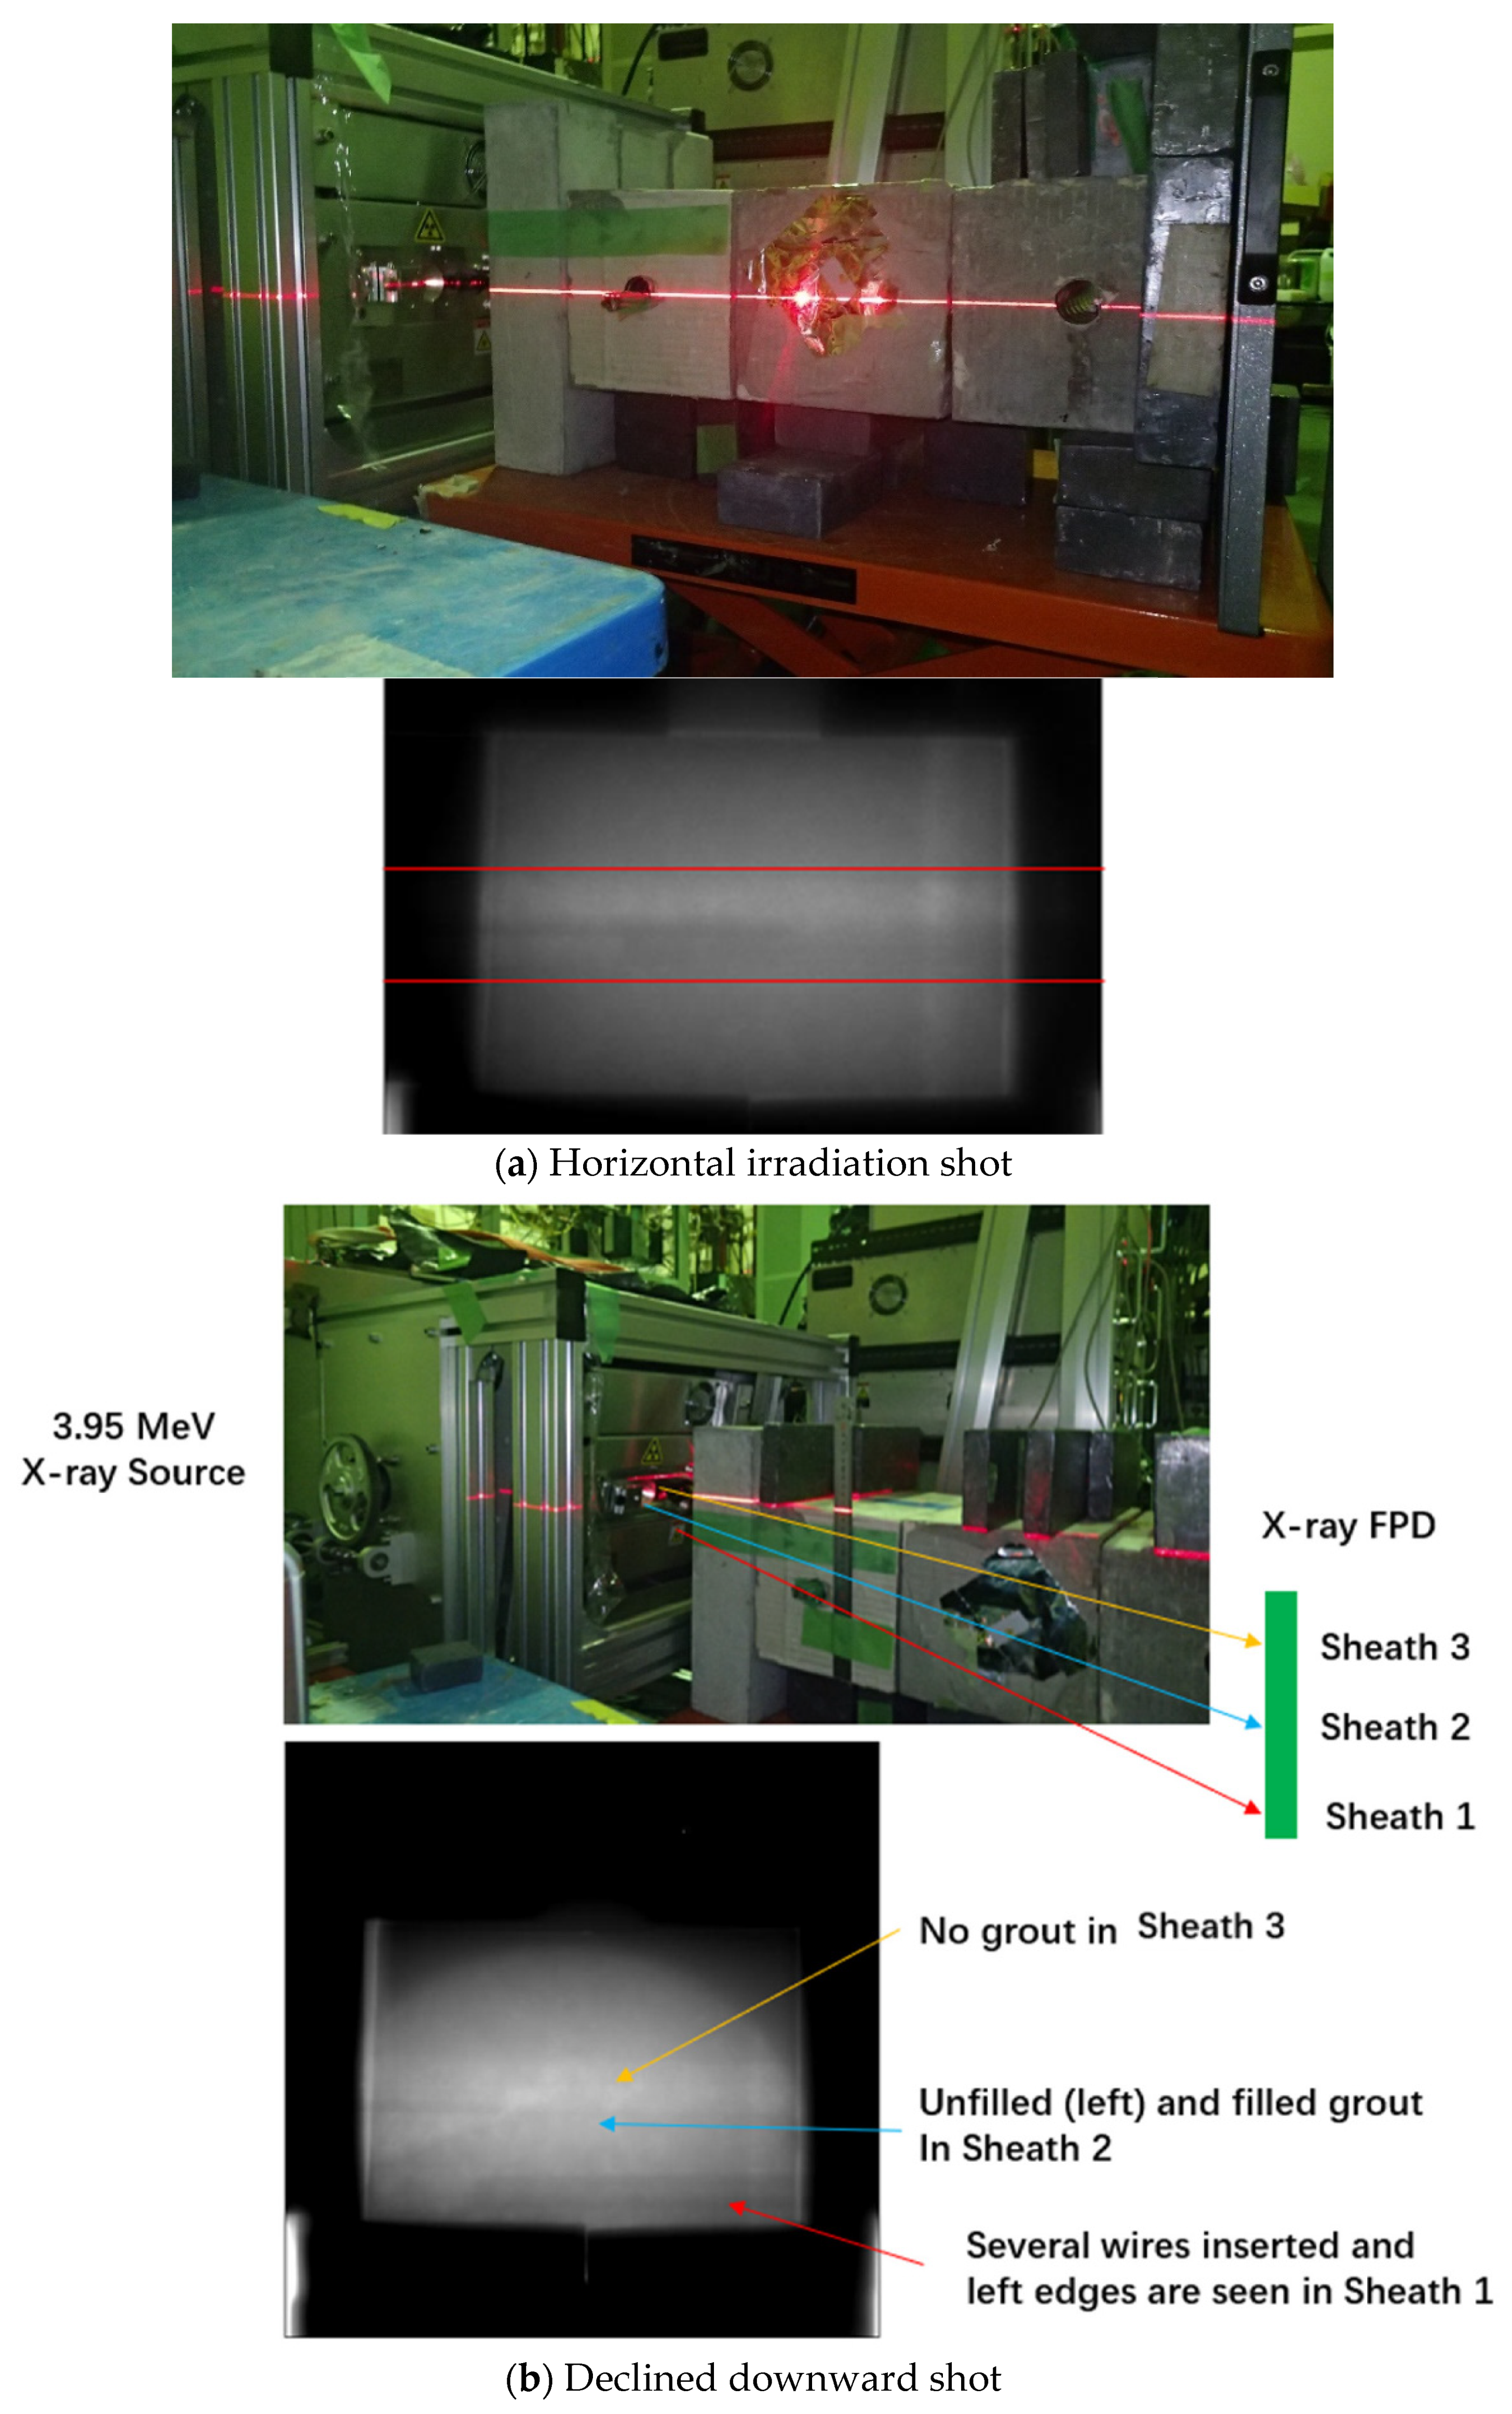
We then analyzed an additional case for the 750 mm thick concrete of a box-shaped PC girder bridge. We prepared three sheaths, 1, 2, and 3, at the same horizontal level, as shown in Figure 34. In the lower half of sheath 1, several wires were inserted, whereas the upper half was vacant. The grout is filled only in the lower half of sheath 2, and a few wires are placed on it. Sheath 3 is completely empty. First, we carried out a horizontal shot in (a). In this case, only sheath 1, which is the nearest to the X-ray source, could be clearly recognized. We could also observe a few wires in sheath 2 at the wire grout boundary in the X-ray image. Next, the downward shot was reduced to shift the images vertically at the FPD, as shown in (b). The three sheaths were still partially overlapped at their edges.
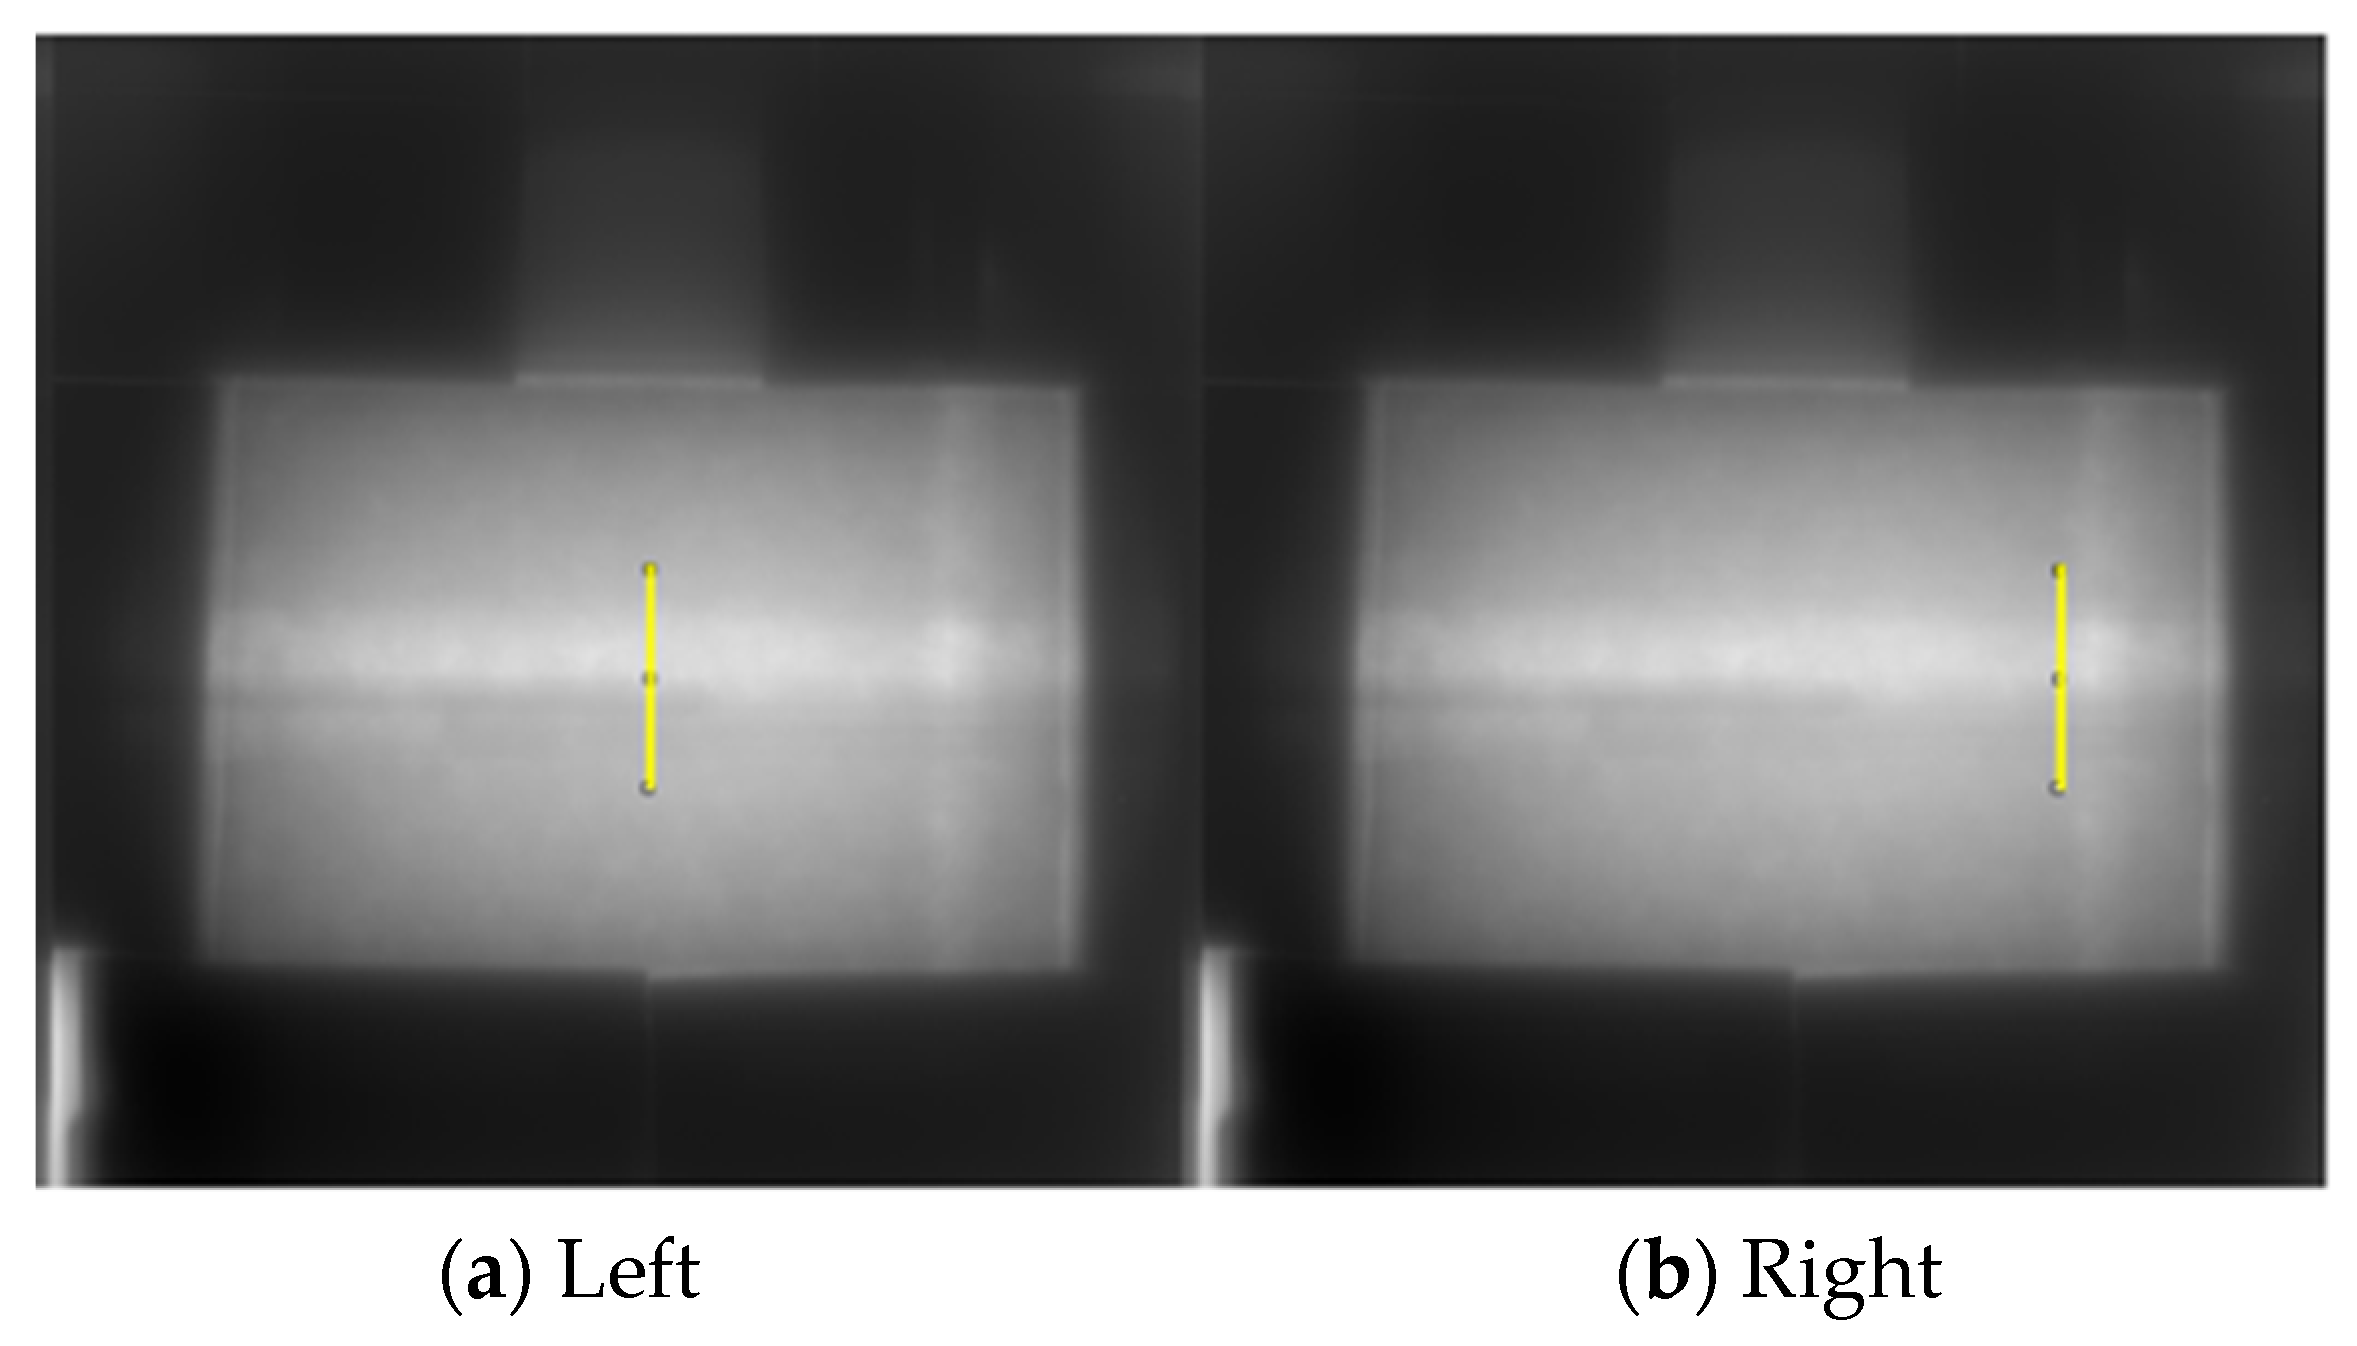
Because the three sheaths partially overlap at each edge, treatment of the regions and gray values was complicated for the gray value analysis in the declined shot case. Thus far, the inner structures were also rather complicated. Therefore, we also adopted a 16-bit system with a full scale of 65,536 to upgrade the resolution of the analysis. Thus, the gray value profile analysis was performed only for sheath 1 in the horizontal shot case, as shown in Figure 35 and Figure 36. We could also observe a few wires in sheath 2 near the wire grout boundary of the sheath 1 image in Figure 35. Therefore, we did not use the gray value at the boundary as Gw_few and only calculated Knw. Knw became ~1.2 as given in Table 6.

5. Discussion

Table 7 summarizes the K ratios obtained thus far. In the case of the T-shape PC girder bridge of 200 mm thickness and 950 keV X-ray source, the K ratio, Knw, for unfilled grout is in the range 1.4–1.5, while Kfw is approximately 1.3 for filled grout. Knw for the case of the 750 mm thick model samples for a box-shape PC girder bridge and the 3.95 MeV system becomes ~1.2. The ratio between the unfilled and filled grouts was calculated using the averaged Kuw of cases 1 and 2 and Kfw of cases 3, as presented in the table. In all cases, the difference of the values is at least 10%. It is still early to declare standard values to indicate the status of grout. Further accumulation and verification of tests and data are necessary. However, this analysis is expected to be important for evaluating the grout situation quantitively during the next steps of structural analysis or destructive inspection.

6. Conclusions

We attempted a quantitative evaluation of the stage of unfilled grout in PC bridges using porTable 950 keV/3.95 MeV X-ray sources. We obtained the gray value profiles from the measured X-ray transmitted images and calculated the ratios of the gray values of the PC wires and grout. In this measurement, iron PC wires, filled grout, concrete, and unfilled grout appeared to be black, very dark, dark, and bright, respectively. As the image was darker, the gray value decreased in this analysis. It is possible that the stage of unfilled grout could be quantitatively evaluated as the gray value ratio between the PC wires and grout part by stacking more experiences and data. If the stage looks rather unfilled, further detailed inspection, such as destructive evaluation by boring surveys, for instance, should be performed. This method is applicable to a wide range of scenarios and supports the overall strength evaluation of bridges for safety maintenance [17]. Actual on-site inspection of PC highway bridges and analysis of the results are underway. We proposed a guideline for X-ray inspection using 950 keV/3.95 MeV X-ray sources accompanied by visual and hammering-sound screenings, structural analysis, final repair, and/or reinforcement, as described in Figure 37. The purpose is to extend the lifespan of PC bridges worldwide. An academic and industrial consortium, which included the authors, successfully performed the 3.95 MeV X-ray inspection and evaluation of grout filling for a box-shaped PC girder highway-bridge in Japan in 2020. Detailed results will be presented in the near future.

Author Contributions

All authors made equal contributions to all the aspects of the paper. All authors have read and agreed to the published version of the manuscript.

Funding

This research was partially funded by Cross-ministerial Innovation Promotion Program—Infrastructure Maintenance Renovation and Management-(2015–2019), Cabinet Office of Japan.

Institutional Review Board Statement

Not applicable.

Informed Consent Statement

Not applicable.

Data Availability Statement

Not applicable.

Conflicts of Interest

The authors declare no conflict of interest.

References

  1. Japan Ministry of Land, Infrastructure, Transport and Tourism. Status Quo of Social Infrastructure Inspection and Maintenance. Available online: https://www.mlit.go.jp/sogoseisaku/maintenance/02research/02_01.html (accessed on 30 March 2021).
  2. Japan Prestressed Concrete Contractors Associate. Design of PC Bridges, 5th ed.; Japan Prestressed Concrete Contractors Associate: Tokyo, Japan, 2019; Volume 1, pp. 15–25. [Google Scholar]
  3. Anton, O.; Komárková, T.; Heřmánková, V. An optimal method of determining the position of bends on shear reinforcement as part of the diagnosis of reinforced concrete beam structures. IOP Conf. Ser. Mater. Sci. Eng. 2019, 549, 012015. [Google Scholar]
  4. Available online: https://home.hiroshima-u.ac.jp/bridge2/mb/mb-po.html (accessed on 15 March 2017).
  5. Abdel-Jaber, H.; Glisic, B. Monitoring of prestressing forces in prestressed concrete structures—An overview. Struct. Control Health Monit. 2019, 26, e2374. [Google Scholar] [CrossRef] [Green Version]
  6. Bonopera, M.; Chang, K.-C.; Lee, Z.-K. State-of-the-art review on determining prestress losses in prestressed concrete girders. Appl. Sci. 2020, 10, 7257. [Google Scholar] [CrossRef]
  7. Yang, J.; Guo, T.; Li, A. Experimental investigation on long-term behavior of prestressed concrete beams under coupled effect of sustained load and corrosion. Adv. Struct. Eng. 2020, 23, 2587–2596. [Google Scholar] [CrossRef]
  8. Huang, H.; Huang, S.-S.; Pilakoutas, K. Modeling for assessment of long-term behavior of prestressed concrete box-girder bridges. J. Bridge Eng. 2018, 23, 1–15. [Google Scholar] [CrossRef] [Green Version]
  9. Meng, Q.; Zhu, J.; Wang, T. Numerical prediction of long-term deformation for prestressed concrete bridges under random heavy traffic loads. J. Bridge Eng. 2019, 24, 1–19. [Google Scholar] [CrossRef]
  10. SCREENING EAGLE. Available online: https://www.proceq.com/product/pundit-pd8000/?utm_content=buffer3af4c&utm_medium=social&utm_source=facebook.com&utm_campaign=buffer (accessed on 21 March 2017).
  11. Konica Minolta “Magnetic Stream Method” Enters Infrastructre Non-Destructive Inspection. 2018. Available online: https://www.konicaminolta.hk/hk/zh-hk/home.php?gclid=EAIaIQobChMI8LbJnPqO8QIVATdgCh2Q6QIvEAMYASAAEgLNevD_BwE (accessed on 19 March 2017).
  12. Available online: https://xtech.nikkei.com/atcl/nxt/column/18/00107/00033/ (accessed on 23 March 2017).
  13. Available online: http://www.kokusai-se.co.jp/technology/technology03.html (accessed on 25 March 2017).
  14. Uesaka, M.; Mitsuya, Y.; Hashimoto, E.; Dobashi, K.; Yano, R.; Takeuchi, H.; Bereder, J.M.; Kusano, J.; Tanabe, E.; Maruyama, N.; et al. Onsite Non-destructive Inspection of the Actual Bridge using the 950 keV X-band Electron Linac X-ray Source. J. Disaster Res. 2017, 12, 578–584. [Google Scholar] [CrossRef]
  15. Uesaka, M.; Mitsuya, Y.; Dobashi, K.; Kusano, J.; Yoshida, E.; Oshima, Y.; Ishida, M. On-Site Bridge Inspection by 950 keV/3.95 MeV Portable X-band Linac X-ray Sources. In Bridge Optimization—Inspection and Condition Monitoring; InTech Open: London, UK, 2018. [Google Scholar] [CrossRef] [Green Version]
  16. Uesaka, M.; Dobashi, K.; Mitsuya, Y.; Yang, J.; Kusano, J. Highway Bridge Inspection by 3.95 MeV X-ray/Neutron Source. In Computational Optimization Techniques and Applications; InTech Open: London, UK, 2021. [Google Scholar] [CrossRef]
  17. Maekawa, K.; Pimanmas, A.; Okamura, H. Nonlinear Mechanics of Reinforced Concrete; Spon Press: London, UK, 2003. [Google Scholar]
  18. NRA JAPAN. Available online: https://www.nsr.go.jp/english/library/RI.html (accessed on 21 March 2017).
  19. Pei, C.; Wu, W.; Uesaka, M. Image enhancement for onsite X-ray nondestructive inspection of reinforced concrete structures. J. X-ray Sci. Technol. 2016, 24, 797–805. [Google Scholar] [CrossRef] [PubMed]
Figure 1. Changes in the ratio of overaged concrete structures in Japan by decade.
Applsci 11 05525 g001
Figure 2. Bridges built in Japan by year (MLIT is the Ministry of Lands, Infrastructure, Transportation, and Tourism).
Applsci 11 05525 g002
Figure 3. Degraded and collapsed bridges. (a) Cross section of PC sheaths (b) Concrete surface crack (c) collapse [4].
Applsci 11 05525 g003
Figure 4. Types of PC bridges. (a) T-shape girder type; (b) box-shape girder type; (c) Slab type.
Applsci 11 05525 g004
Figure 5. Reinforcement distribution within a structure.
Applsci 11 05525 g005
Figure 6. Side cross-section of a sheath inside a PC structure.
Applsci 11 05525 g006
Figure 7. (a) Schematic of the cross-section of a sheath; (b) cut surface of a sheath.
Applsci 11 05525 g007
Figure 8. Other inspection methods for the inner structure of bridges. (a) RADAR (1.6–3 GHz) [10]; (b) ultrasonic testing (50 kHz) [11]; (c) magnetic testing [12]; (d) X-ray tubes (200–400 keV) [13].
Applsci 11 05525 g008aApplsci 11 05525 g008b
Figure 9. Portable X-band LINAC-based X-ray sources. The systems are composed of three units: X-ray head, magnetron, and power units. (a) 950 keV; (b) 3.95 MeV.
Applsci 11 05525 g009
Figure 10. Calculated results of attenuation of the X-rays in concrete from the 950 keV/3.95 MeV X-ray sources.
Applsci 11 05525 g010
Figure 11. Procedure of X-ray inspection, flaw evaluation, and structural analysis.
Applsci 11 05525 g011
Figure 12. Photographs of onsite inspection and measured X-ray images by 950 keV X-ray source for a T-shape PC girder bridge. (a) Way of inspection; (b) inspection region; (c) filled and unfilled grouts in the X-ray images; (d) overall situation composed by several images.
Applsci 11 05525 g012
Figure 13. Parallel beam vs. cone beam in the dose regarding location.
Applsci 11 05525 g013
Figure 14. Typical X-ray image of circular shape at the FPD screen and intensity profile evaluating line.
Applsci 11 05525 g014
Figure 15. Gray value from low to high and typical materials.
Applsci 11 05525 g015
Figure 16. Gray value profile and the polynomial fitting along the line segment in Figure 14 as the background X-ray intensity distribution.
Applsci 11 05525 g016
Figure 17. Schematic drawing of the correlation between filled/unfilled grouts and gray value profiles. (a) Typical gray value profiles for filled and unfilled grout cases; (b) The profiles lie on the intensity background due to point source X-rays.
Applsci 11 05525 g017
Figure 18. X-ray Image acquired from 200 mm thick WEB of the T-shape PC girder bridge and explanation of the inner structure.
Applsci 11 05525 g018
Figure 19. Gray value profile of the line segment in Figure 18.
Applsci 11 05525 g019
Figure 20. Gray value profile analyzing line.
Applsci 11 05525 g020
Figure 21. Original gray value profile of the yellow line in Figure 17.
Applsci 11 05525 g021
Figure 22. Compensated profile of Figure 20 by subtracting the ununiform background due to the X-ray point source.
Applsci 11 05525 g022
Figure 23. Line segments for gray value analysis for unfilled grout in the X-ray image of 200 mm thick WEB of the T-shape PC girder bridge by the 950 keV X-ray source.
Applsci 11 05525 g023
Figure 24. Gray value profiles of (a) Left; (b) Center; (c) Right in Figure 22.
Applsci 11 05525 g024aApplsci 11 05525 g024b
Figure 25. X-ray image of unfilled grout in a 200 mm thick T-shape PC girder bridge taken by the 950 keV source. (a) Left; (b) center; (c) right. Line segments for gray value analysis are also indicated.
Applsci 11 05525 g025
Figure 26. Gray value profiles of Figure 25. (a) Left; (b) center; (c) right.
Applsci 11 05525 g026
Figure 27. X-ray images of filled grout for 200 mm thick PC bridge taken by the 950 keV source. (a) Left; (b) center; (c) right. Line segments for gray value analysis are also indicated.
Applsci 11 05525 g027
Figure 28. Gray value profiles of (a) left; (b) center; (c) right in Figure 27 for 200 mm thick T-shape PC girder bridge by 950 keV.
Applsci 11 05525 g028aApplsci 11 05525 g028b
Figure 29. Experimental configuration (a) and photograph (b) for modeling the 750 mm thick side WEB wall of a box-shape PC girder bridge with the 3.95 MeV X-ray source and FPD. (c) PC wire for insertion.
Applsci 11 05525 g029aApplsci 11 05525 g029b
Figure 30. Measured X-ray images for 1 (a), 25 (b), 50 (c) and 100 shots (d). Gray value analysis lines are also indicated.
Applsci 11 05525 g030
Figure 31. Denoising effects by stacking 1, 25, 50, and 100 X-ray shots.
Applsci 11 05525 g031
Figure 32. X-ray images of the model sample for a 750 mm-thick PC bridge taken by the 3.95 MeV source. The grout is partially filled. Wires are inserted. (a) Left; (b) Right.
Applsci 11 05525 g032
Figure 33. Gray value profiles of Figure 32. (a) Left; (b) Right.
Applsci 11 05525 g033
Figure 34. Photograph and X-ray image by 3.95 MeV X-ray source for 750 mm thick model sample for box-shape PC girder bridge. There are three sheaths. (a) Horizontal shot. The three sheaths are overlapped and only Sheath 1 can be seen. (b) Declined downward X-ray shot to shift the three sheaths at the FPD.
Applsci 11 05525 g034
Figure 35. X-ray images of a 750 mm-thick PC bridge taken by the 3.95 MeV source. The grout is not filled. (a) Left; (b) right.
Applsci 11 05525 g035
Figure 36. Gray value profiles of Figure 35. (a) Left; (b) right.
Applsci 11 05525 g036
Figure 37. Proposed guideline for X-ray inspection using 950 keV/3.95 MeV X-ray sources accompanied with visual and hammering-sound screenings, structural analysis, final repair, and/or reinforcement.
Applsci 11 05525 g037
Table 1. Specifications of X-ray sources.
950 keV3.95 MeV
Operating Frequency9.3 GHz9.3 GHz
Beam Energy950 keV3.95 MeV
Beam Current130 mA100 mA
Electron Gun Voltage20 kV20 kV
Electron Gun Current300 mA300 mA
Pulse Width2.5 μs4 μs
Pulse Frequency330 pps200 pps
RF Power250 kW1.5 MW
Table 2. Gray values and K ratios for 200 mm PC, 950 keV and unfilled grout.
LocationGwGno_groutKfw (Gno_grout/Gw)
Left148 210 1.42
Center167 232 1.39
Right152 2141.41
Average156 2281.41
Table 3. Gray values and K ratios for Figure 26. 200 mm by 950 keV, grout is not filled.
LocationGwGw_fewGno_groutKuw (Gno_grout/Gw) Kuwf(Gno_grout/Gw_few)
Left1031571701.651.08
Center1402002111.511.06
Right1391902011.441.06
Average127 182 194 1.53 1.07
Table 4. Gray values and K ratios of Figure 28 for 200 mm thick T-shape PC girder bridge by 950 keV. The grout is filled.
LocationGwGw_fewGgroutKfw (Gno_grout/Gw) Kfwf (Gno_grout/Gw_few)
Left1151411501.30 1.06
Center1351521751.30 1.15
Right1101341471.34 1.10
Average120 142 157 1.31 1.10
Table 5. Gray value numbers and K ratios of Figure 33. 750 mm by 3.95 MeV, grout is not filled.
LocationGw_fewGno_groutGgroutKuwfKfwfKuf
Left66 98 76 1.48 1.15 1.29
Right92 108 92 1.17 1.00 1.17
Average79 103 84 1.33 1.08 1.23
Table 6. Gray value numbers and K ratios of Figure 36. 750 mm by 3.95 MeV, grout is not filled.
LocationGwGno_groutKuw
Left425049501.16
Right4050 4750 1.17
Average4150 48501.17
Table 7. Overall K ratio summary in different conditions.
CaseThicknessX-ray SourceAvg. KuwAvg. KfwAvg. KuwfAvg. KfwfAvg. KufPC Type
1200950 keV1.41 1.12T-shape
2200950 keV1.53 1.07 T-shape
3200950 keV 1.31 1.10 T-shape
47503.95 MeV 1.33 1.08 1.23 Box
57503.95 MeV1.17 Box
Publisher’s Note: MDPI stays neutral with regard to jurisdictional claims in published maps and institutional affiliations.

