
Coupling Denoising to Detection for SAR Imagery


Agency for Defense Development, Institute of Defense Advanced Technology Research, Daejeon 34186, Korea
*
Author to whom correspondence should be addressed.
Appl. Sci. 2021, 11(12), 5569; https://0-doi-org.brum.beds.ac.uk/10.3390/app11125569
Submission received: 12 May 2021
/
Revised: 8 June 2021
/
Accepted: 8 June 2021
/
Published: 16 June 2021
(This article belongs to the Special Issue Image Simulation in Remote Sensing)
Abstract
:Featured Application
The proposed object detection framework aims to improve detection performance for noisy SAR images, which is applicable for general object detection in SAR imagery: recognition of militarily important targets such as ships and aircrafts or monitoring for abnormal civilian events.
Abstract
Detecting objects in synthetic aperture radar (SAR) imagery has received much attention in recent years since SAR can operate in all-weather and day-and-night conditions. Due to the prosperity and development of convolutional neural networks (CNNs), many previous methodologies have been proposed for SAR object detection. In spite of the advance, existing detection networks still have limitations in boosting detection performance because of inherently noisy characteristics in SAR imagery; hence, separate preprocessing step such as denoising (despeckling) is required before utilizing the SAR images for deep learning. However, inappropriate denoising techniques might cause detailed information loss and even proper denoising methods does not always guarantee performance improvement. In this paper, we therefore propose a novel object detection framework that combines unsupervised denoising network into traditional two-stage detection network and leverages a strategy for fusing region proposals extracted from both raw SAR image and synthetically denoised SAR image. Extensive experiments validate the effectiveness of our framework on our own object detection datasets constructed with remote sensing images from TerraSAR-X and COSMO-SkyMed satellites. Extensive experiments validate the effectiveness of our framework on our own object detection datasets constructed with remote sensing images from TerraSAR-X and COSMO-SkyMed satellites. The proposed framework shows better performances when we compared the model with using only noisy SAR images and only denoised SAR images after despeckling under multiple backbone networks.
1. Introduction
Synthetic Aperture Radar (SAR) is a type of radar system used to reconstruct 2D or 3D terrain and objects on the ground (or over oceans). The SAR system utilizes a technology to synthesize a long virtual aperture through a coherent combination of the received signals from objects. The synthesized aperture transmits pulses of microwave radiation, which in turn has the effect of narrowing the effective beam width in an azimuth direction and thus achieving high resolution. Combining return signals by an on-board radar antenna, SAR overcomes the main limitations of traditional systems that the azimuth resolution is determined by physical antenna size. Optical and infrared sensors are passive since they detect objects by reflected light and emitted signals from the objects, respectively, while the radars can actively transmit and receive radar waves, operating in all-weather and day-and-night conditions.
Thanks to the useful characteristics available under all-weather conditions and also during night-time, SAR images are especially applied to military reconnaissance as most military operations take place at night in poor weather conditions. There is a variety of applications such as information and electronic warfare, target recognition of aircrafts that maneuver irregularly, battlefield situational awareness, and development of aircrafts that are hard for the other party to track with radar. In addition, it is necessary to study on object detection using radar imagery for civilian applications (e.g., resources exploration, environmental monitoring, etc.).
With the recent rapid development of deep learning, many deep convolutional neural network (CNN)-based object detection approaches using SAR imagery have gained increased attention. The successes of the deep detectors on SAR images facilitate a wide range of civil and military applications, such as detection of ship [1,2,3,4,5], aircraft [6,7,8,9], destroyed building [10], oceanic internal wave [11], oceanic eddy [12], oil spill [13], avalanche [14], and trough [15]. For the further research purposes, several SAR object detection datasets have also been released called AIR-SARShip-1.0 [16], SAR-Ship-Dataset [17], SAR ship detection dataset (SSDD) [18], and HRSID [19].
SAR images are formed from a coherent sum of backscattered signal components at the boundary of different media after pulsed transmissions of microwave radiation, enabling to observe the interior of the targets otherwise invisible to the naked eye. However, when obtaining the SAR images, if the emitted pulses are reflected from the boundary of a target with uneven surface, then scattering and interference waves are created. These wave signals have a direct impact on a SAR imaging the structure of the target as noise components. The produced noise is often called speckle noise, which hinders the original image information and causes a speckle corrupted SAR image as shown in Figure 1. The scattering characterization of the target gets severe depending on changes in radial properties and orbital surfaces, leading to degradation of recognition performance. It is worth noting that a number of published studies were conducted for denoising (or despcekling) SAR images [20,21,22,23,24,25].
Many previous works first perform despeckling on SAR images as one of preprocessing steps and then utilize the SAR images for several tasks via deep learning; e.g., classification task [26,27], detection task [28,29,30], etc. Processing separately the large amount of SAR images results in high time consumption and low efficiency. Though various despeckling methods such as Lee filter [22], Kuan filter [23], Frost filter [24], Probabilistic Patch-Based (PPB) filter [25] have been proposed, if we take an improper despeckling methodology without considering the dataset characteristics carefully, then the despeckling may lead to poor performance due to the information loss from raw SAR images. Meanwhile, to further improve the visual quality of SAR images, there are other preprocessing methods such as contrast enhancement methods. Given that most of SAR images are usually grayscale images, we can consider various processing methods, for example, fuzzy-based gray-level image contrast enhancement [31] or fuzzy-based image processing algorithm [32].
To overcome the issue and guide for directly promoting object detection performance, developing an object detection framework through incorporating an alternative deep denoiser replacing the separate denoising preprocessing step into the classical object detection network is significant and necessary. The motivation shares the similar spirit to the recent classification work proposed by Wang et al. [33], where they learn a noise matrix from an input noisy image and with the noise matrix synthesize a despeckled image taken as the input into a subsequent classification network. According to our best knowledge, we are the first to connect a denoising network to an object detection network. We additionally introduce fusing region proposals approach which fuses set of Region of Interests (RoIs) from both noisy and denoised images; rather than simply ending with the coupling structure as in Wang et al. [33].
We propose a novel object detection framework whose the core idea comprises two parts: (1) connecting an unsupervised denoising network to an object detection network for dynamically extracting a denoised SAR image from a given noisy SAR image, and (2) forwarding an image pair of two SAR images (the given real SAR image and the synthetically generated SAR image) to an object detection network and fusing region proposals from the two SAR images for complementarily integrating regional information. Here fusing region proposals refers to merging two sets of RoIs yielded by a shared region proposal network within the object detection network. This is inspired by the observation that utilizing only real SAR image may bring about false positives due to the inherent speckle noise of the image and on the contrary, depending on only denoised SAR image may cause missing targets because inadequate denoising leads to fine information loss of raw data.
The rest of this paper is organized as follows. Section 2 mainly consists of two parts, where the first part introduces our datasets constructed with SAR images from TerraSAR-X and COSMO-SkyMed satellites, and the second part describes the detailed design of our proposed object detection framework, i.e., how to incorporate an unsupervised denoising network into an object detection network and fuse the region proposals within the object detection network. Section 3 reports comparative experimental results for the proposed object detection network on our own datasets. To validate the effectiveness of our approach, we carry out multiple experiments; (1) we need to experimentally demonstrate that our coupling structure between denoising and detection networks can strengthen detection performance, (2) we further verify the proposed region proposal fusing strategy in terms of input data for detection network and fusing method through ablation studies, and (3) we additionally perform comparative experiments with respect to the choice of a feature map extracted from either real or synthetic SAR image, where the feature map refers to the output of CNN backbone in the detection network. Section 4 presents the discussion of the experimental results together with an additional time complexity analysis. Finally, Section 5 includes the final remarks and a conclusion.
2. Materials and Methods
In this section, we describe SAR remote sensing datasets that we constructed and the proposed object detection framework which fuses region proposals utilizing denoised SAR image. The remote sensing datasets include not only SAR imagery but also corresponding labeled objects. We develop our object detection framework with the datasets and detail the proposed framework in the rest of this section.
2.1. SAR Remote Sensing Dataset
2.1.1. Description
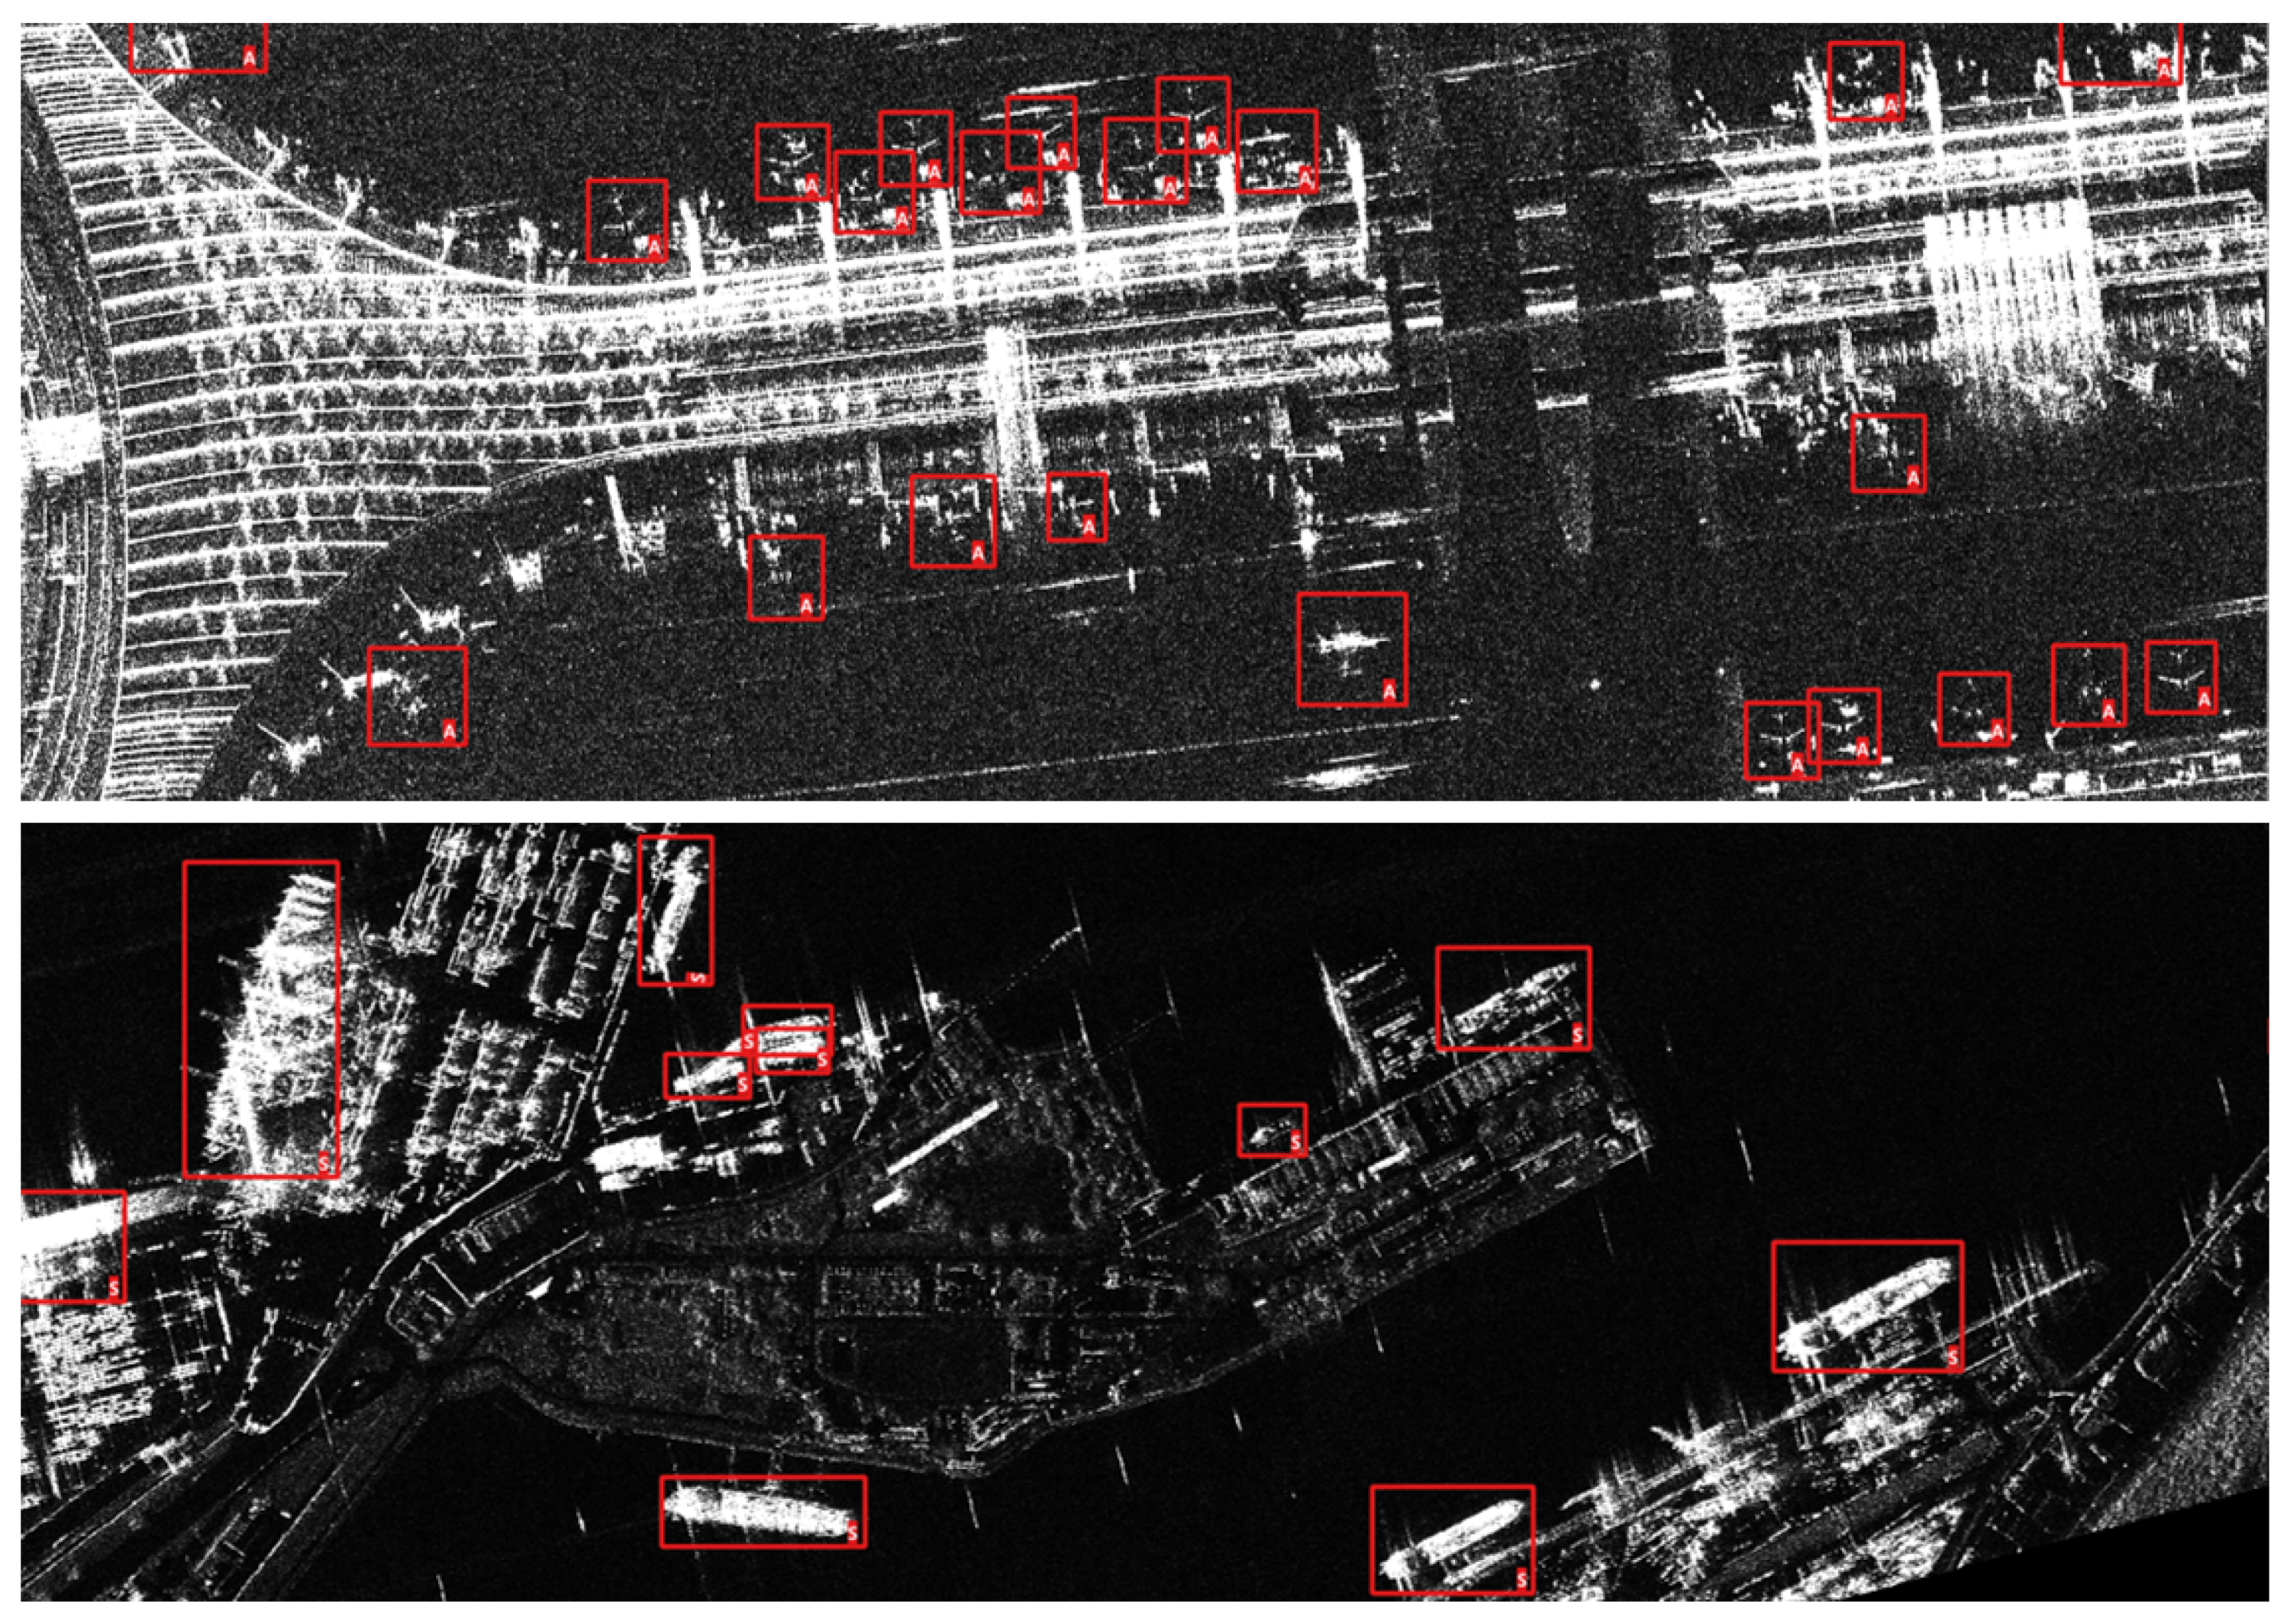
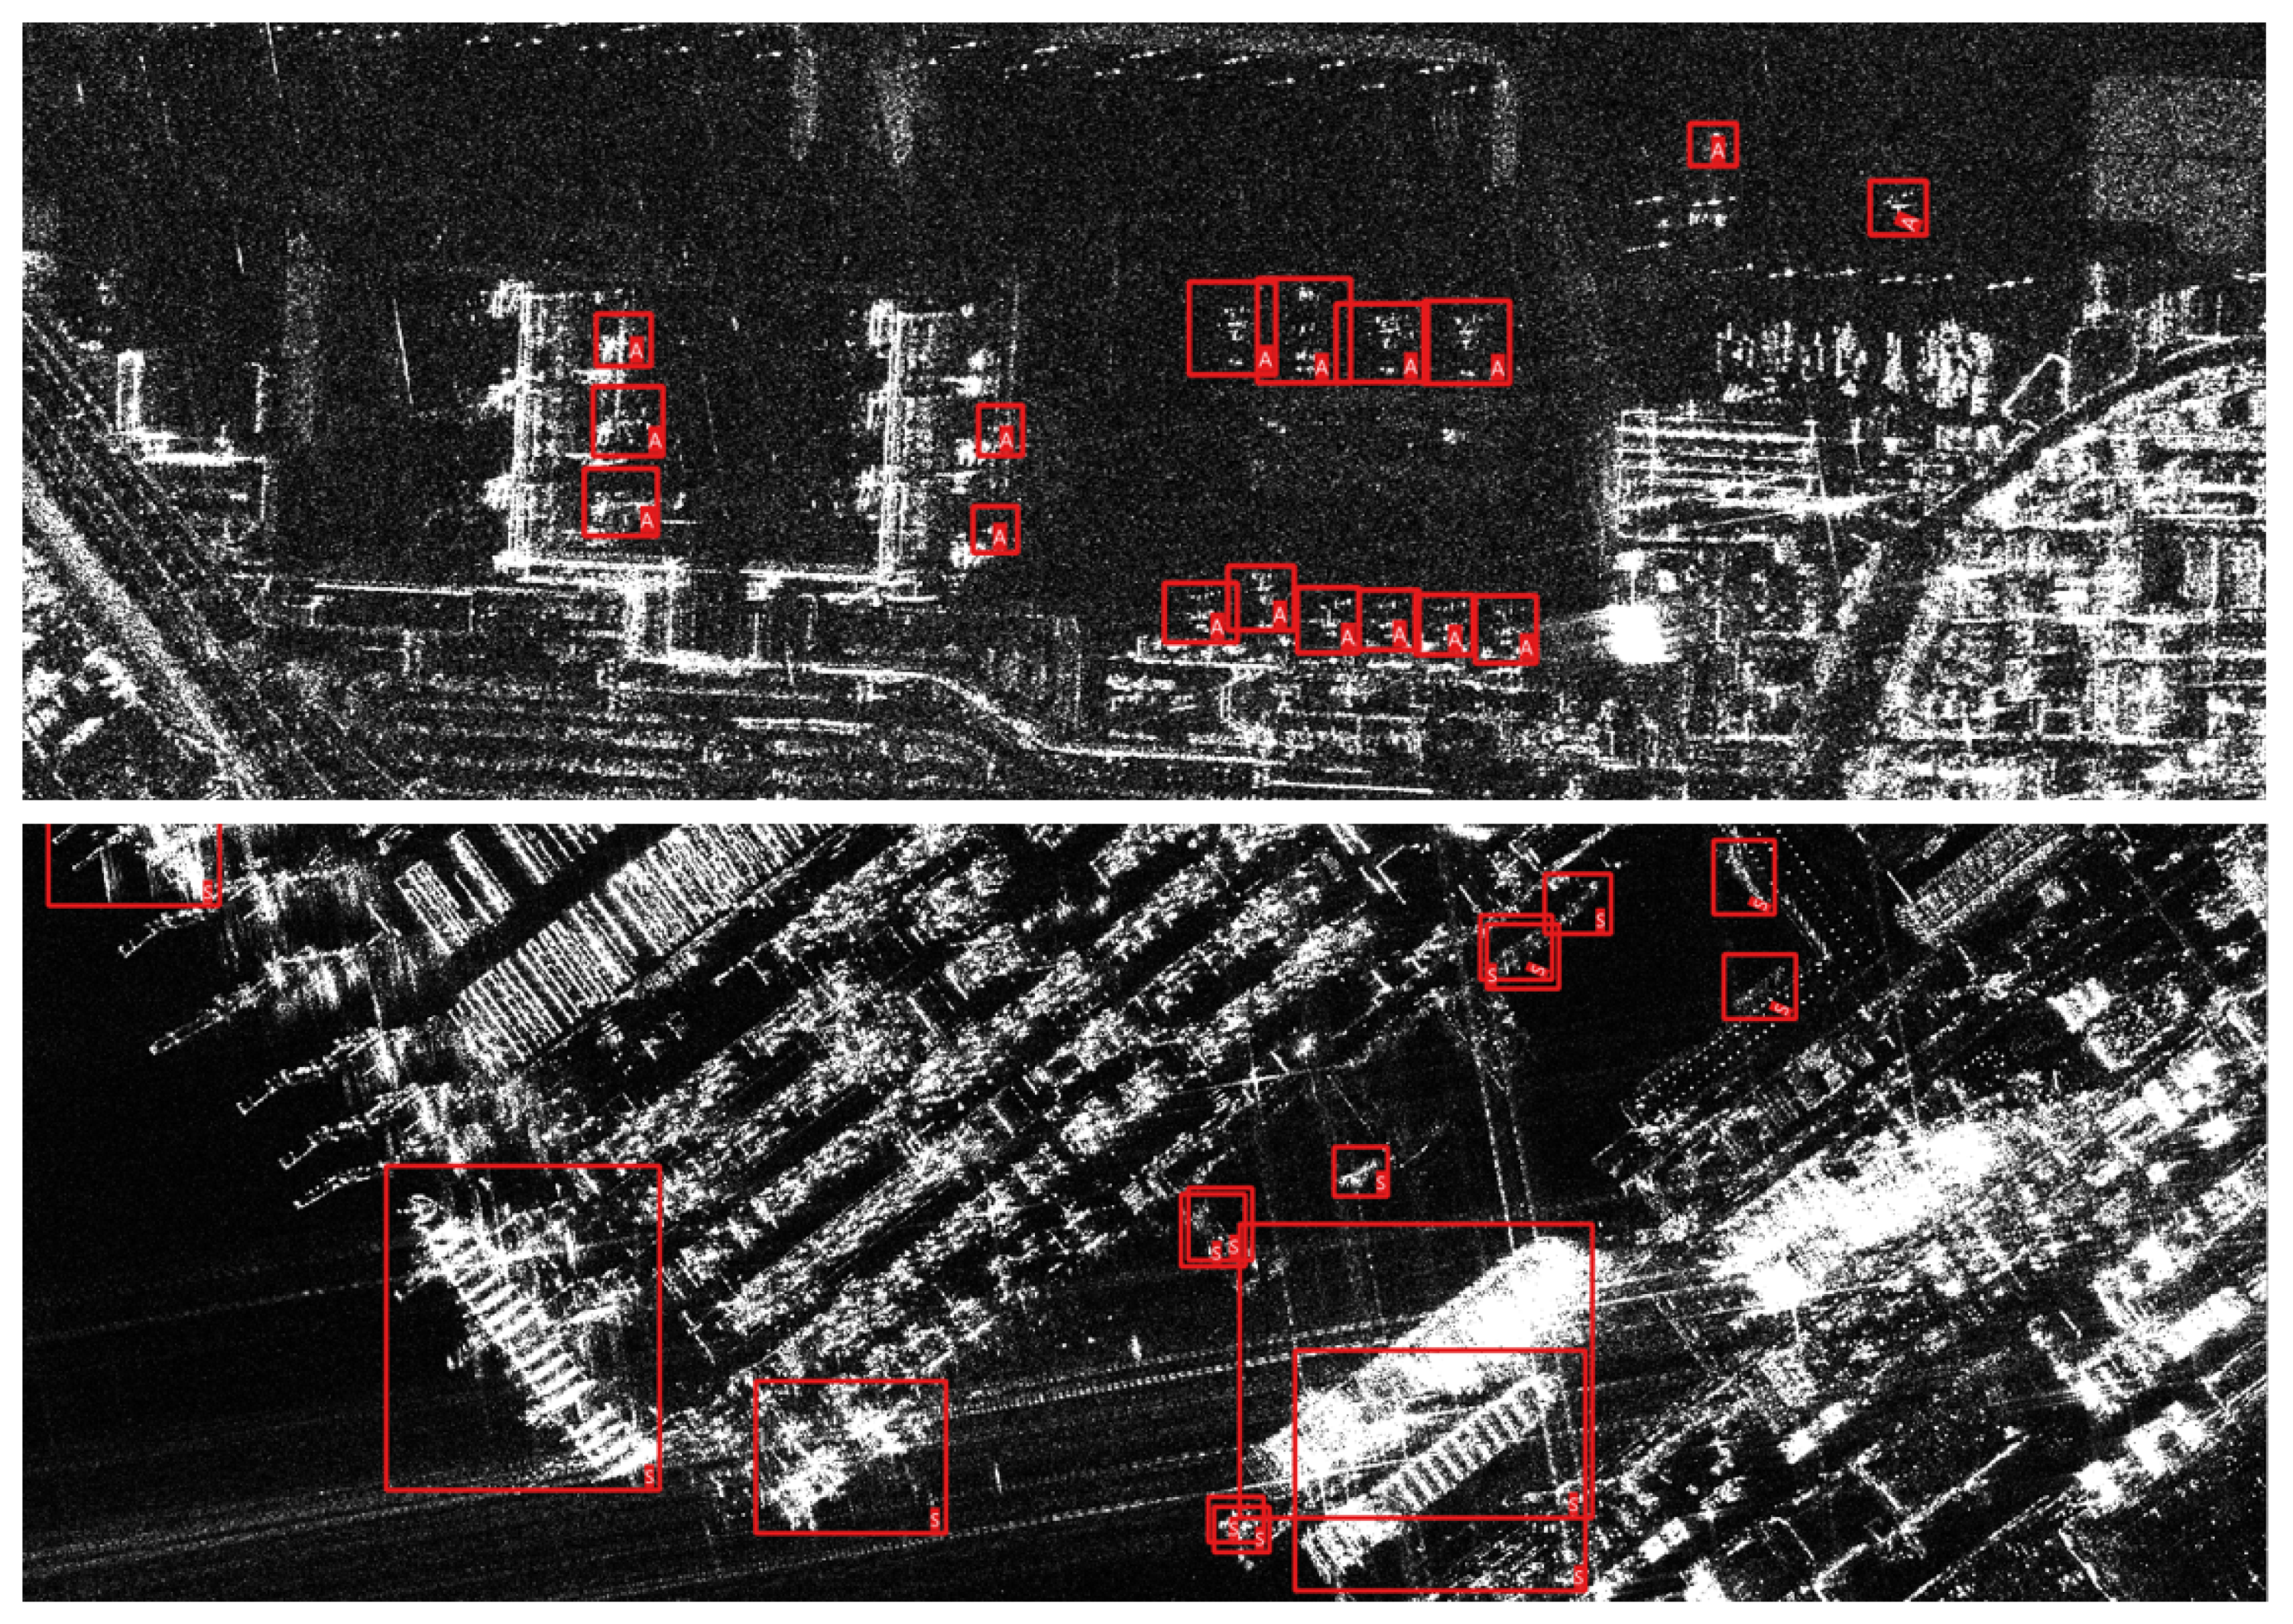
We constructed our datasets with 60 TerraSAR-X images from German Aerospace Center [34] and 55 COSMO-SkyMed images from Italian Space Agency [35], which is mainly covering harbor- and airport- peripheral areas. For TerraSAR-X satellite, the images have resolutions from 0.6 m to 1 m, and is of the size in the range from about 6 k × 2 k to 11 k × 6 k pixels (sorted by their area). For COSMO-SkyMed satellite, the images have a resolution of 1 m, and is of the size in the range from about 13 k × 14 k to 20 k × 14 k pixels (sorted by their area). Each remote sensing image is labeled by experts in aerial image interpretation with multiple categories such as airplane (A), etcetera (E) and ship (S). The ship/airplane classes contain a variety of civil and military ships/airplanes while the etcetera class includes support vehicles, air defense weapons and air defense vehicles. Some example ship/airplane objects are shown in Figure 2 and Figure 3 for TerraSAR-X and COSMO-SkyMed imagery, respectively.
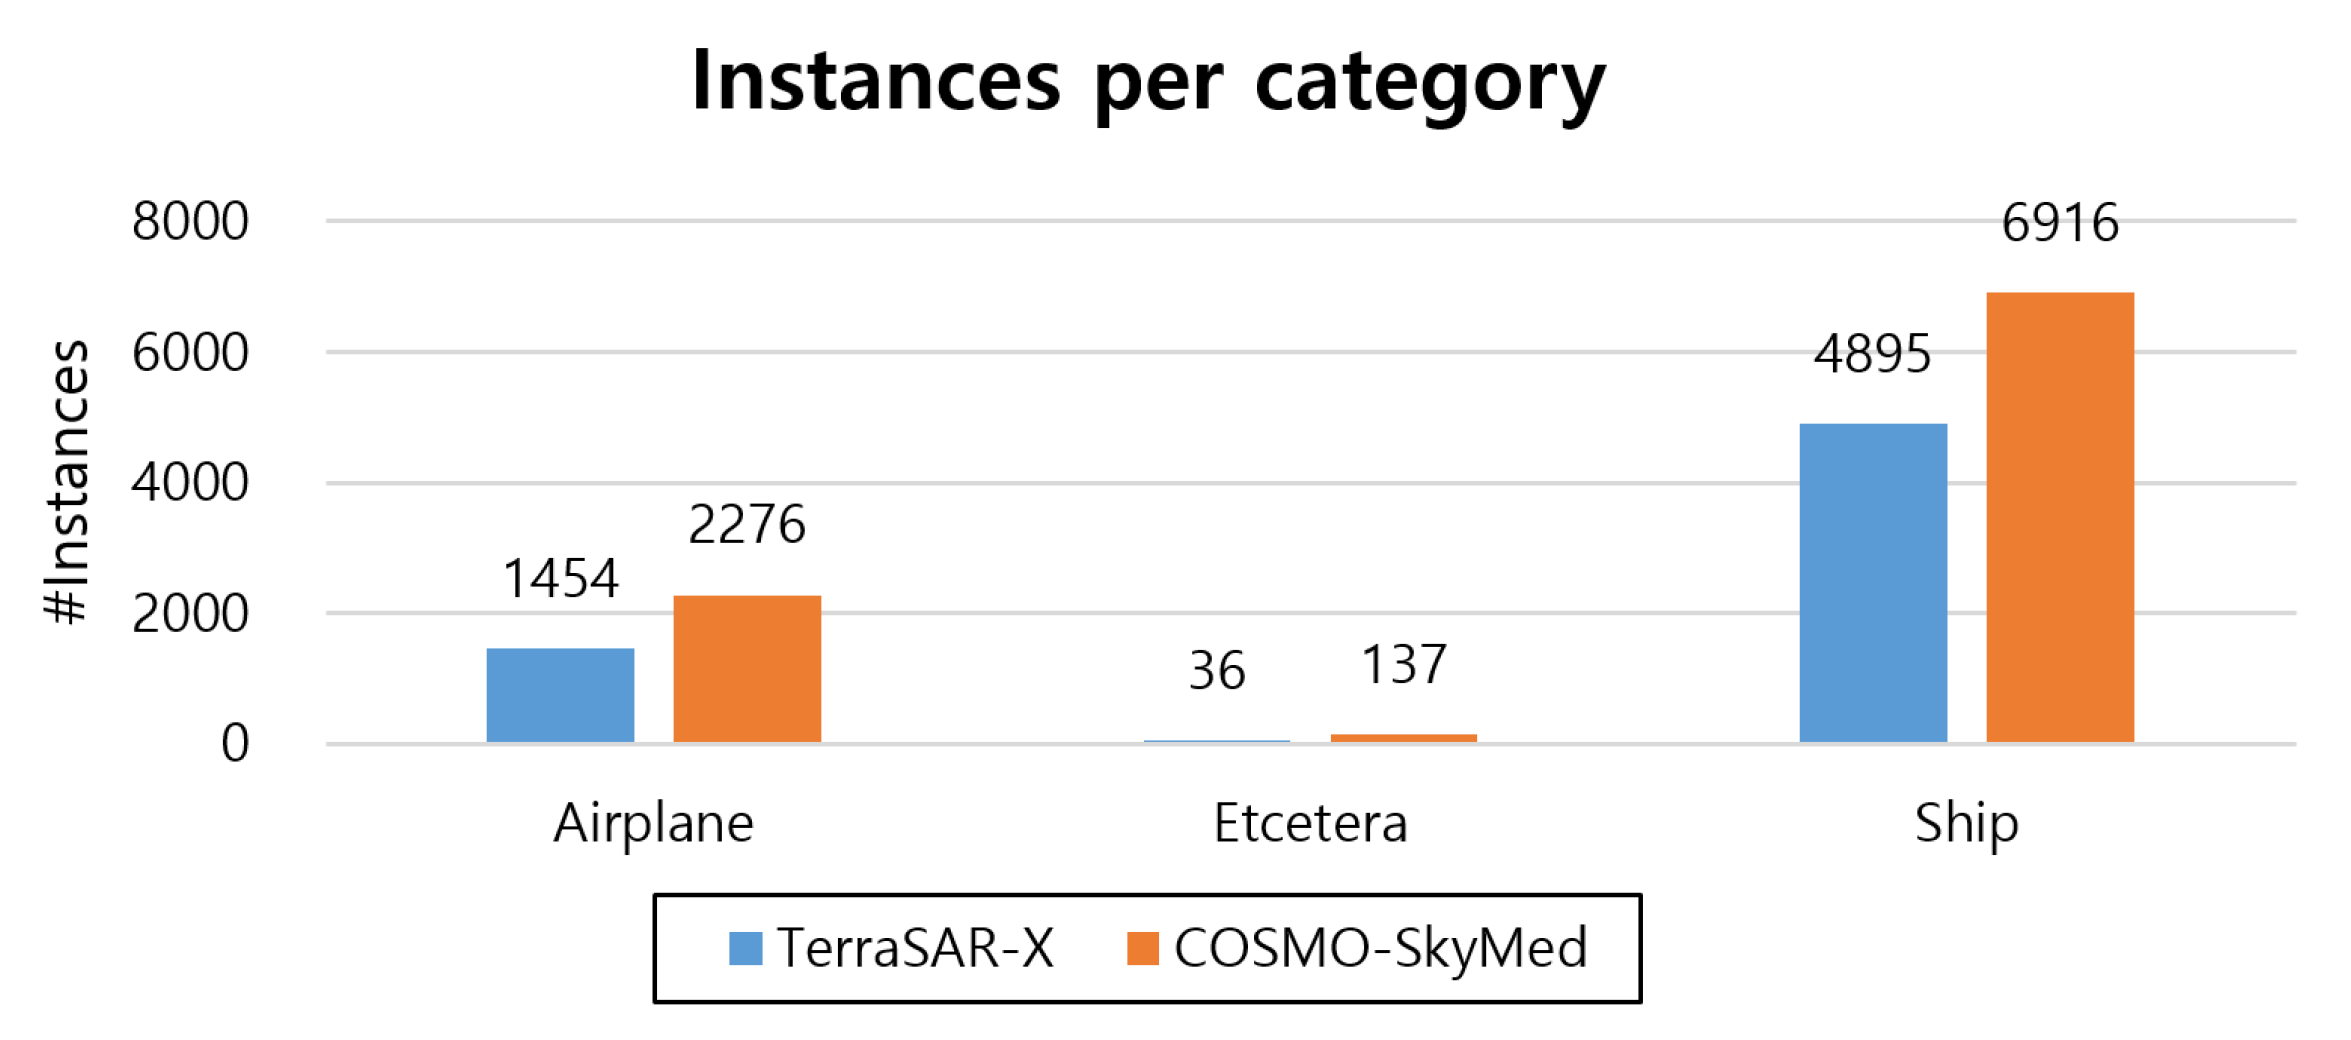
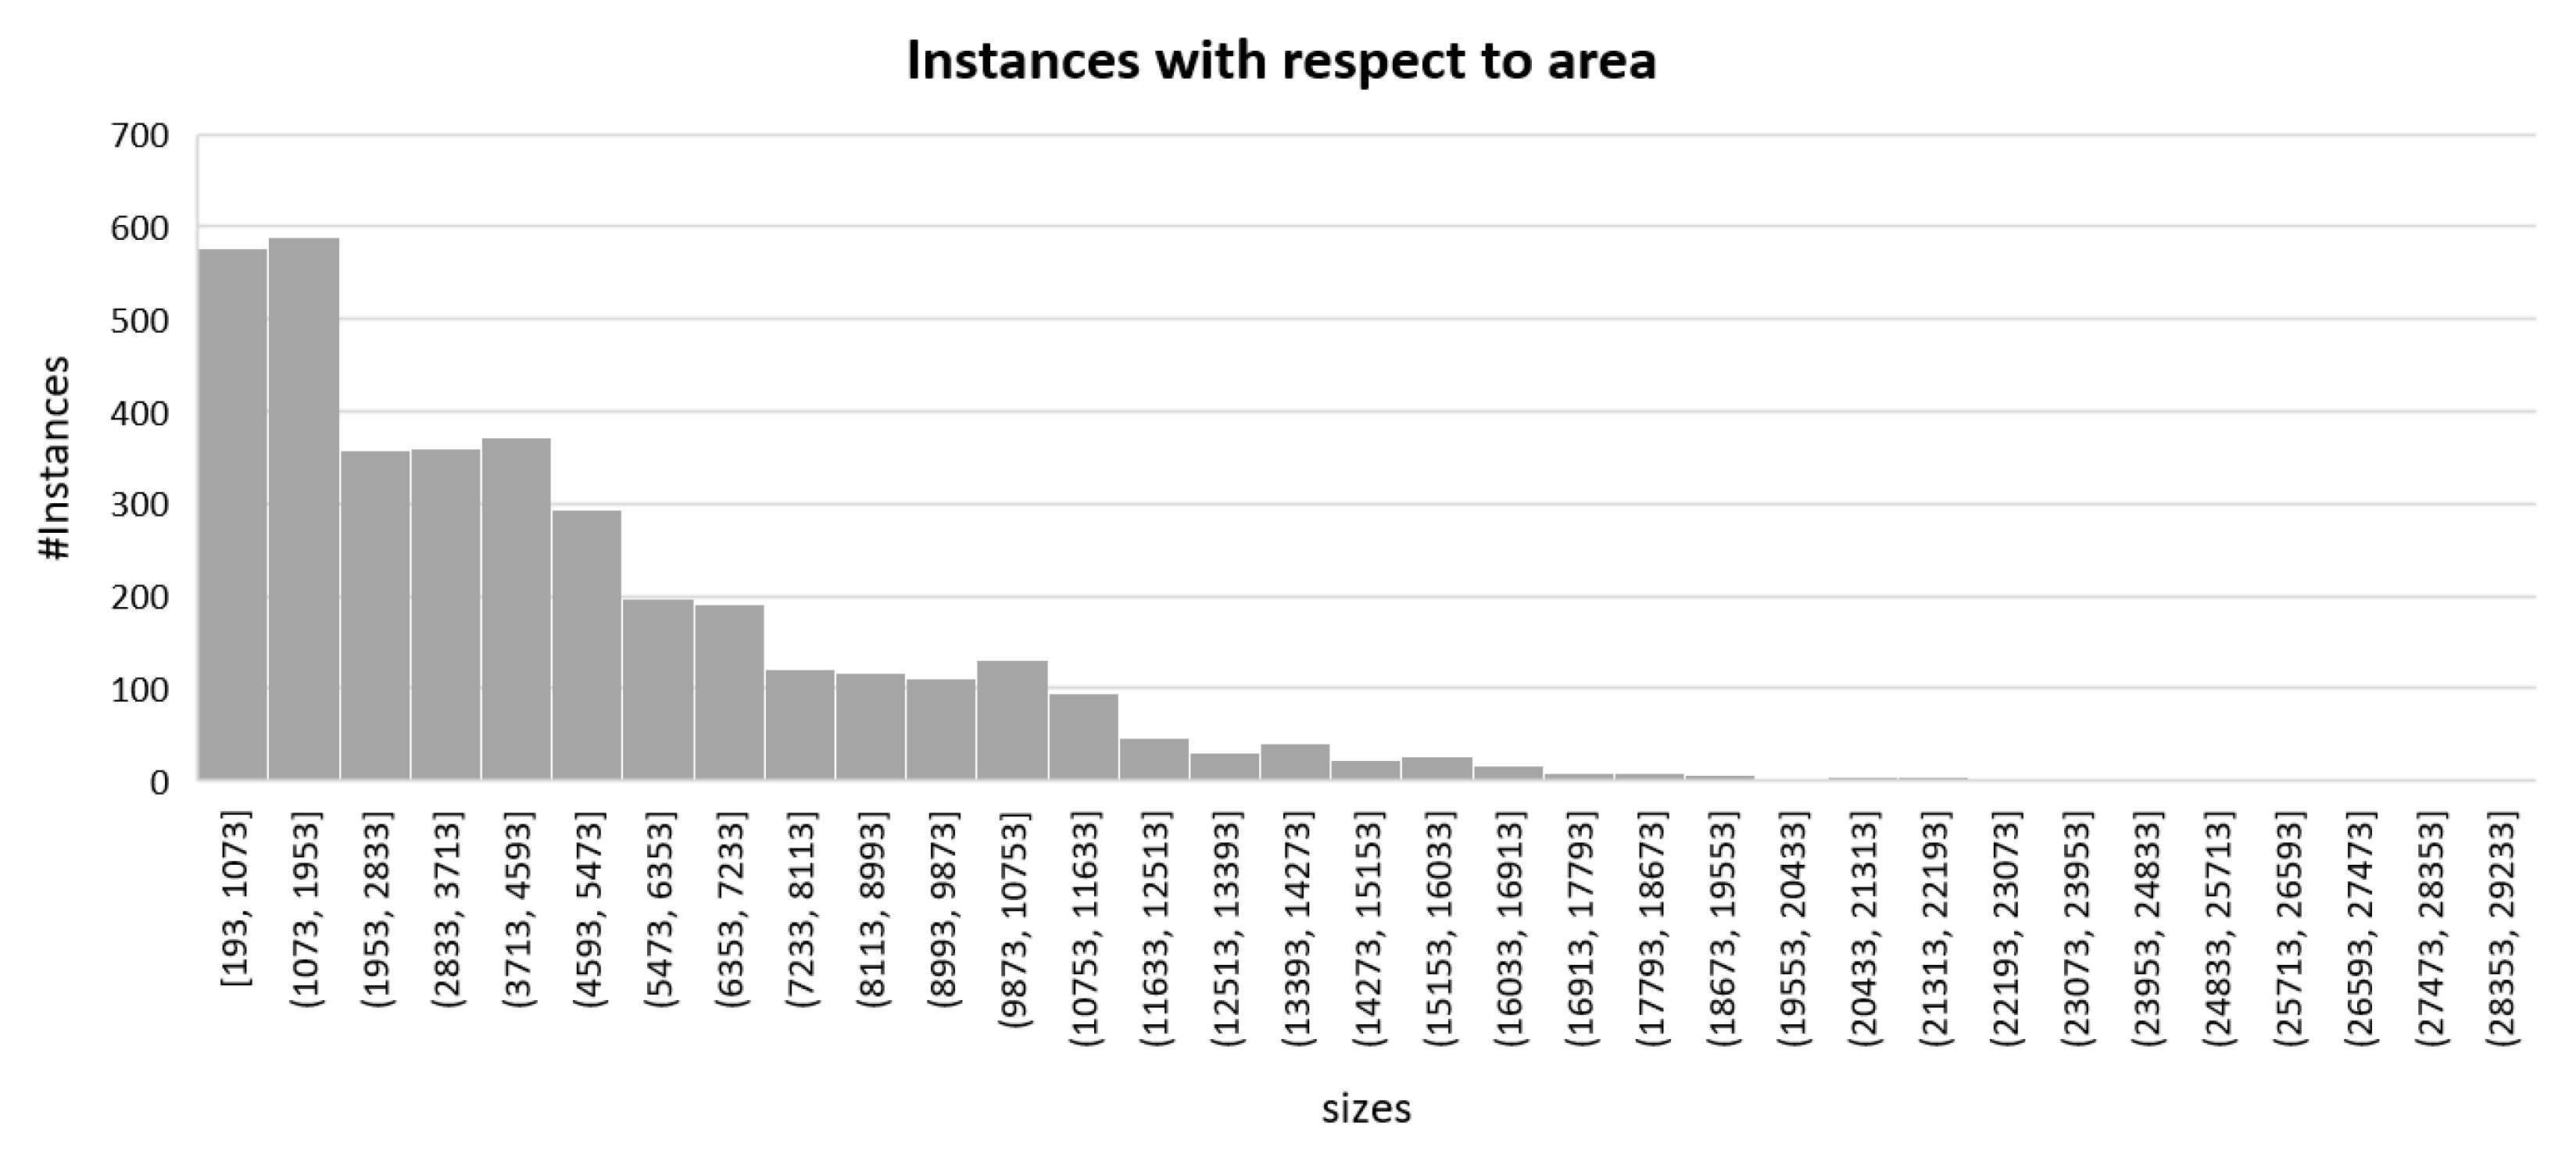
Our labeled objects include a total of 15.7 k instances of 3 categories; 3.7 k instances for A class, 0.2 k instances for E class, and 11.8 k instances for S class, which implies that our datasets are quite imbalanced between the categories and relatively skewed towards S class. The class distribution by type of satellite imagery is plotted in Figure 4. Furthermore, target objects in our dataset exist at a variety of scales due to our multiresolution images and the variety of shapes, especially for ships objects. We measure the bounding box size of objects with and present the frequency of boxes by size as a histogram in Figure 5, where and is the width and height of the bounding box, respectively.
2.1.2. Comparison to other SAR Detection Datasets
Table 1 summarizes the detailed comparisons between our own constructed dataset and other publicly available SAR detection datasets, i.e., AIR-SARShip-1.0 [16], SSDD [18], SAR-Ship-Dataset [17], and HRSID [19]. SAR-Ship-Dataset is the dataset with the largest number of instances, followed by our own dataset. The primary differentiator of our dataset as compared with other datasets lies in (1) class diversity such as ships, aircrafts, and etcetera classes, and (2) the number of scene areas. We obtained the SAR images from a variety of harbor and airport peripheral areas around the world wide and annotated different shapes of objects.
2.2. Proposed Methodology
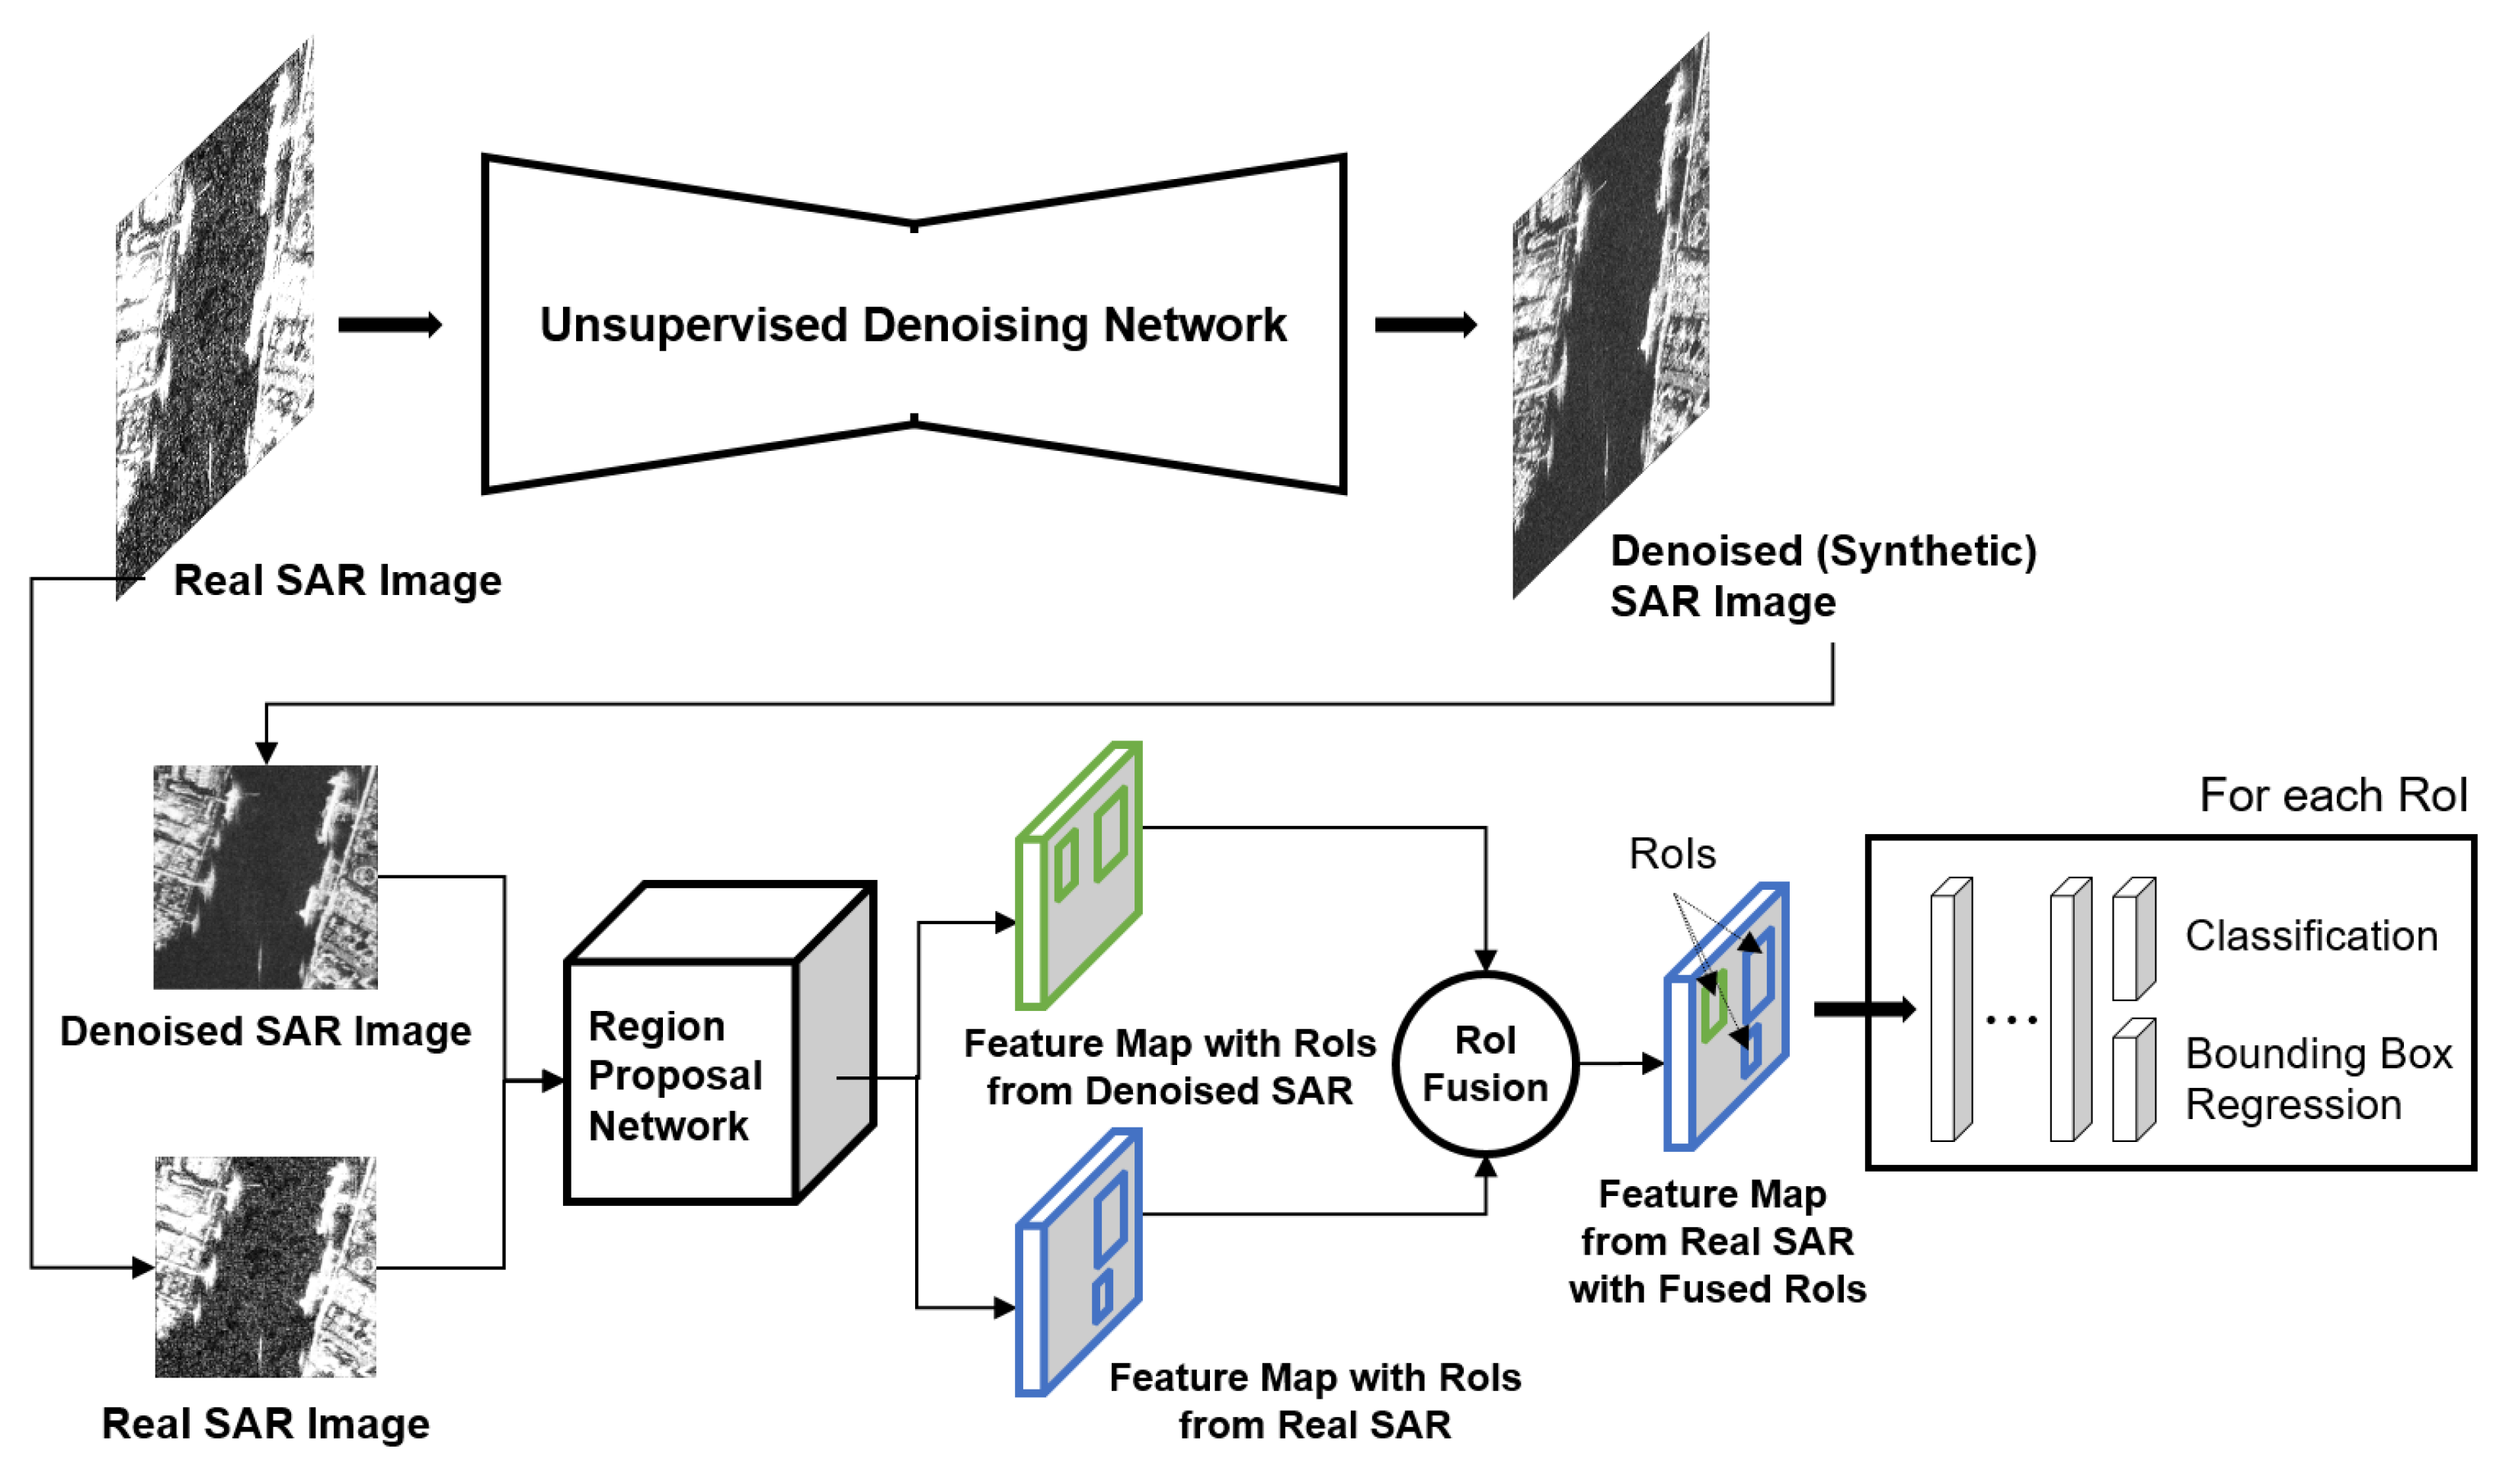
Given the inherent speckle noise of SAR, researchers have previously performed a preprocessing step like despeckling before training an object detection model. However, such prior preprocessing independent of the performance of object detection may not only be inefficient, but also lead to weak detection performance because an unintentionally improper denoising induces loss of detailed information. Therefore, we integrate a denoising network with a two-stage detection network so that the denoising network can directly receive feedbacks from the detection network, as illustrated in Figure 6.
We choose a blind-spot neural network [36] based self-supervised scheme as the unsupervised denoising model and adopt Gamma noise modeling as in Speckle2Void [37] fitted with SAR speckle, but not limited to this model sturcture. We can train the unsupervised denoising model as a generator G that maps a real (noisy) SAR image to the synthetic (denoised) SAR image . The core idea of our model is to infer a synthetic denoised SAR image from the input SAR image and merge the two sets of extracted RoIs to improve detection performance. Without any help of related materials such as corresponding denoised image for an input SAR image, we can autonomously simulate the denoised image and fuse the inferred information such as RoIs. The entire model enables effective end-to-end learning.
The unsupervised denoising network G in our model firstly takes as input a real (noisy) SAR image and extracts synthetic (denoised) SAR image as the output. Then, the formed (real, synthetic) image pairs are fed into a shared region proposal network and the region proposal network outputs two corresponding feature maps and sets of RoIs. The two sets of RoIs are merged and the redundant bounding boxes are subsequently removed by a NMS procedure, i.e., , where is the resultant fused bounding boxes. For each RoI in on the feature map from the real SAR image, the RoI feature vector is then forwarded to obtain the classification and regression results as traditional two-stage detection network.
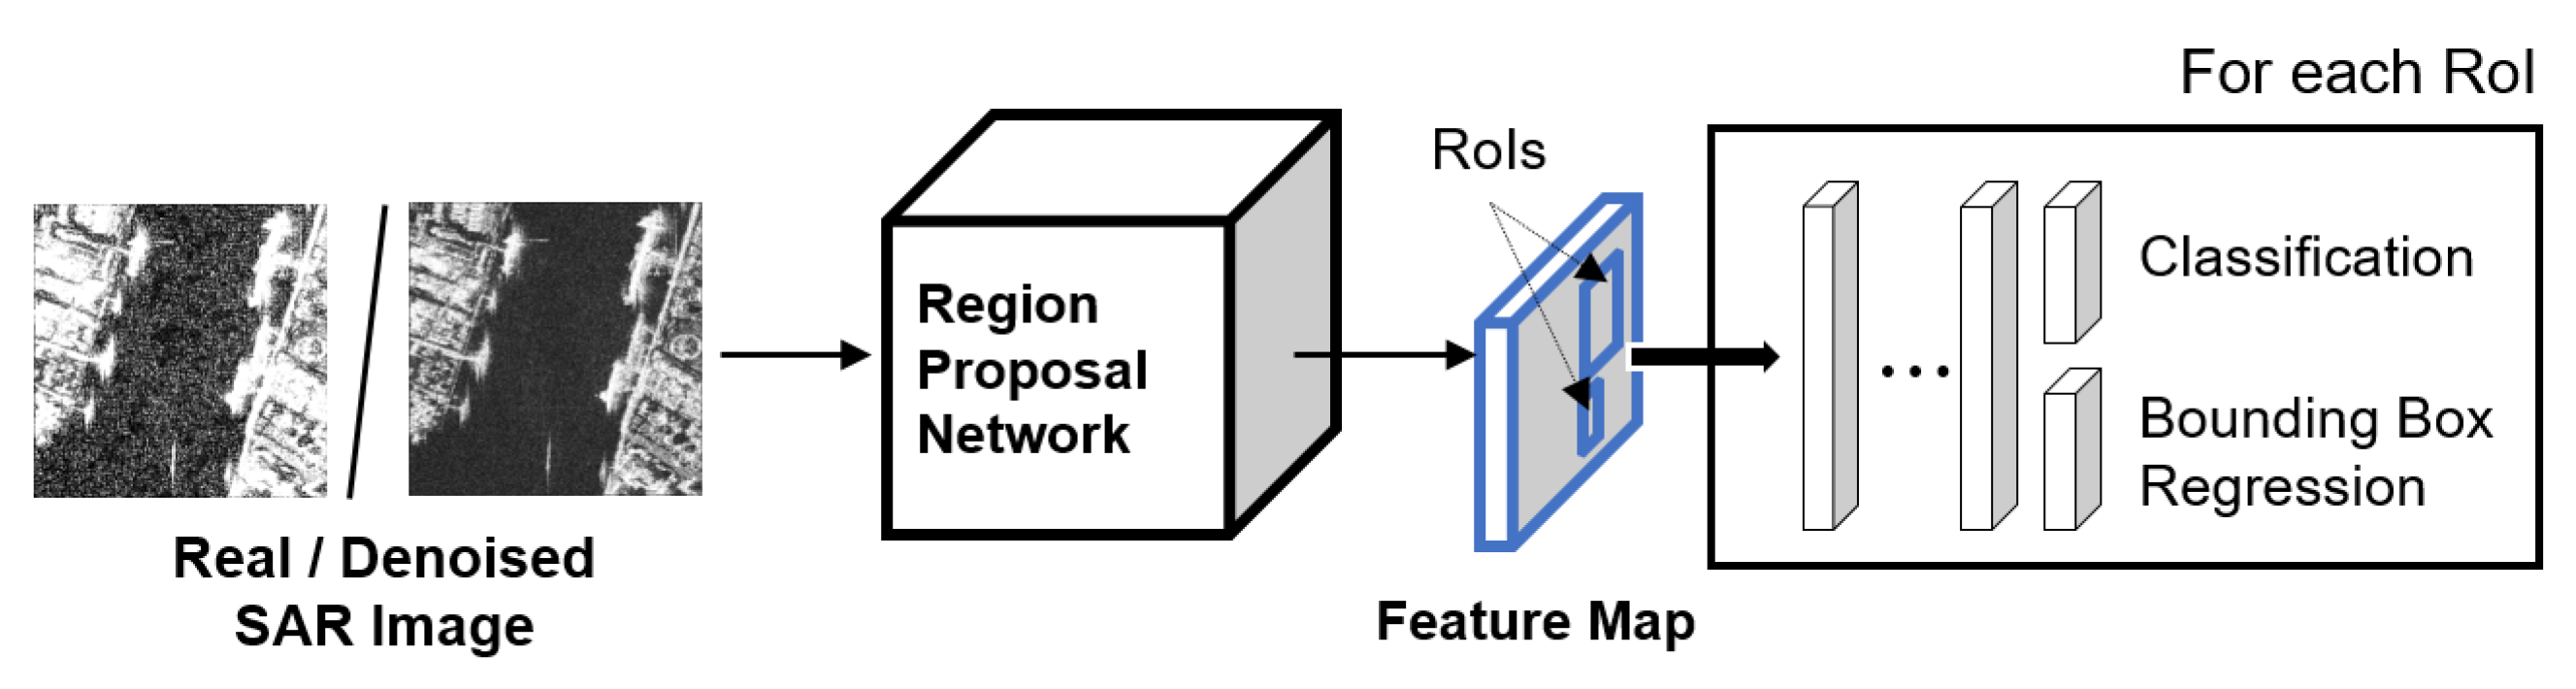
Usually, only single SAR image which is either real or denoised (preprocessed) is employed for training an object detection network as shown in Figure 7. Suppose we have real SAR images which is inherently speckled noisy without any preprocessing, relying solely on the real SAR image for training may cause false alarms of region proposals. On the other hand, utilizing denoised SAR images alone may be prone to suffer from missing targets because of detailed information loss. We, therefore, devise a novel denoising-based object detection network to make full use of the complementary advantages between the real and denoised SAR images.
To combine extracted information from both real and synthetic SAR images, we consider fusing region proposals which merges two sets of RoIs yielded by a region proposal network. Considering that there exist qualitative differences between the two sets of RoIs derived real and synthetic SAR images, the real and synthetic SAR images are separately trained by the region proposal network. After fusing region proposals, we take the feature map from the real SAR image for preserving the global context information of the raw input SAR image.
The proposed architecture is trained end-to-end with a multi-task loss which mainly consists of (1) unsupervised denoising loss, (2) region proposal loss, and (3) RoI loss for classification and bounding-box regression. Especially, the region proposal network is trained for both real and synthetic SAR image, and thus two distinctly losses are defined. The final loss function that we propose is a weighted summation of all losses as follows.
where:
where denotes the unsupervised denoising loss. and are the region proposal loss of RPN for and , respectively. refers to the loss summation of classification and bounding-box regression loss for all RoIs . are the hyper-parameters to balance the interplay between the losses and the all parameters are set to 1 in all our experiments.
3. Results
We first present the description of our experimental dataset settings in Section 3.1. Section 3.2 presents the details of our model architecture and the hyperparameter settings. Based on this implementation, we conduct extensive experiments to validate the contributions of the proposed model and Section 3.3 and Section 3.4 contain the experimental results. Section 3.5 provides comprehensive ablation studies.
3.1. Dataset Settings
We acquired 60 TerraSAR-X raw scenes from German Aerospace Center [34] and 55 COSMO-SkyMed raw scenes from Italian Space Agency [35]. The raw scenes go through multiple stages like preprocessing, Doppler centroid estimation (DCE), and focusing to obtain single look slant range complex (SSC) images. The SSC images are then converted to multi-look ground range detected (MGD) images by multi-looking procedures. With the MGD images, we create patches of size 800 × 800 via sliding-window operation, within each patch containing at least one target object which belongs to airplane (A), etcetera (E), or ship (S) categories. Finally, we randomly split patches into 80% for training, and 20% for testing.
3.2. Implementation Details
We implemented our unsupervised denoising model following self-Poisson Gaussian [38], however, adopted Gamma noise modeling as in Speckle2Void [37] to characterize the SAR speckle. Our implementation for detection framework was based on the MMDetection tool box [39] which is developed in PyTorch [40]. Stochastic gradient descent (SGD) Optimizer [41,42] with momentum of 0.9 was used for optimization. We trained a total of 24 epochs, with an initial learning rate of 0.0025, momentum of 0.9, and weight decay of 0.0001. We experimented with ResNet-50-FPN and ResNet-101-FPN backbones [43,44]. All evaluations were carried out on a TITAN Xp GPUs with 12G memory.
3.3. Qualitative Evaluation
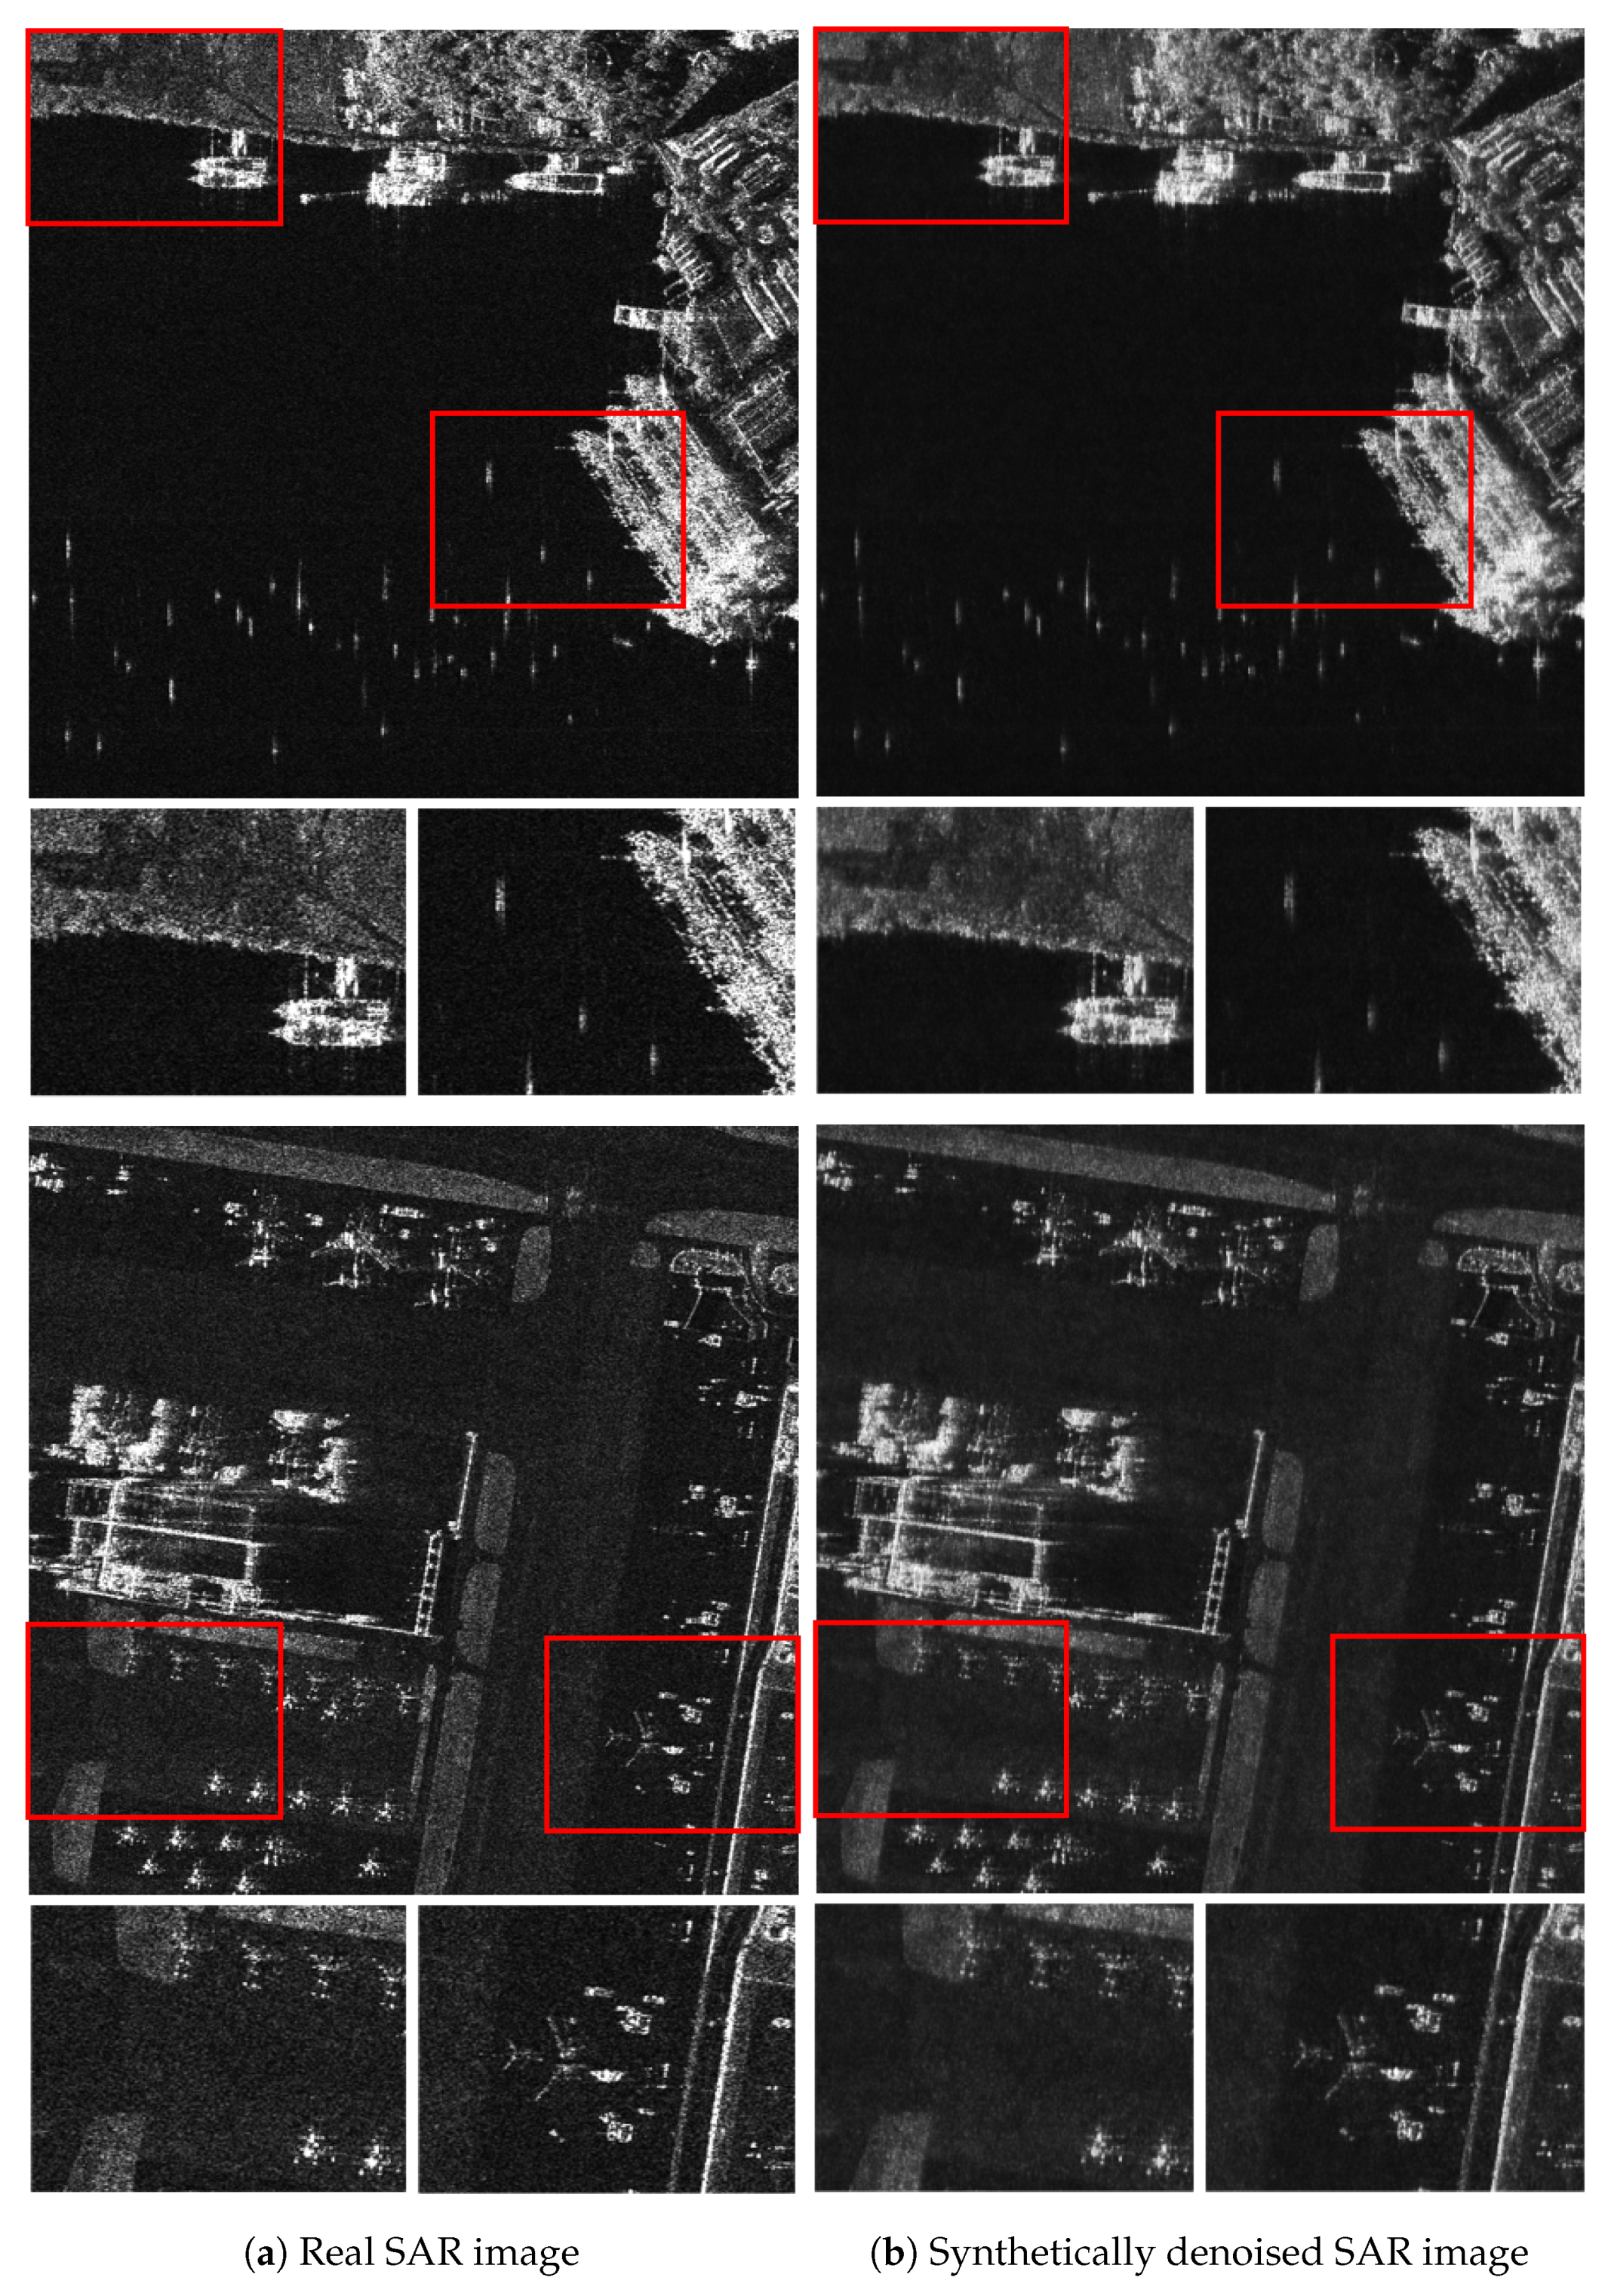
Figure 8 shows paired examples of real SAR images and corresponding synthetically denoised SAR images where the denoised SAR images are the intermediate results in our model. After the denoising stage, the general speckle noises are drastically reduced; however, there inevitably exists a trade-off between the noise level and image clarity. Especially, a lot of buoys that usually look like actual ships are located in the first example of Figure 8 and in the denoised SAR image, brightness of the buoys relatively gets faded and the visual difference with the surrounding ships becomes clear. In addition, scattering waves around target objects which are one of factors hindering accurate localization is blurred after the denoising. The denoising within our network confirms such positive effectiveness.
Some image triples of groundtruth, baseline detection, and our detection visualizations are presented in Figure 9. We train the baseline detection model with non-preprocessed and raw noisy SAR images. For a fair comparison, both the baseline and our detection model equally adopt Faster RCNN with ResNet-101-FPN [43,44] backbone architecture. The detection results show that our model could localize overall objects accurately with higher confidence scores and detects with a small number of false alarms compared to with the baseline detection model in the given patch images. Although the progress made by our detection models are inspiring, our detectors still have a room further improvement due to the few remaining false alarms and missing targets.
3.4. Quantitative Evaluation
To quantitatively evaluate the detection performance, we calculate mean average precision (mAP). The mAP metric is widely used as a standard metric to measure the performance of object detection and estimated as the average value of AP over all categories. Here, AP computes the average value of precision over the interval from recall = 0 to recall = 1. The precision weighs the fraction of detections that are true positives, while the recall measures the fraction of positives that are correctly identified. Hence, the higher the mAP, the better the performance.
As shown in Table 2, we compare the proposed network with the traditional two-stage detection model under two different backbones such as ResNet-50-FPN and ResNet-101-FPN [43,44]. By varying despeckling approaches, we set several baseline models as previous work processes: (1) inputting non-preprocessed real SAR images, (2) feeding denoised SAR images into the traditional two-stage detection model after denoising via representative techniques called Lee filter [22] or PPB filter [25]. We observe that the despeckling effect of applying Lee filter is more minor than PPB filter. PPB filter enables us to reduce more speckle noises; but, much detailed information visually gets concealed. This validates our experimental results that the baseline model with PPB filter slightly performs inferior compared to the baseline model with Lee filter. On the other hand, our detection network provides significant advances in performance under all backbone architectures. Through observation of the test results, this is attributed to the suppression of many false positive detections resulting from speckle noise problems of real SAR images.
3.5. Ablation Study
We conduct an ablation study for structurally verifying the proposed fusing region proposal strategy. We first compare the case without fusing itself after denoising on input noisy SAR image, which corresponds to the first experiment in Table 3. With the comparison to inputting only denoised SAR image as an input to detection network, we can identify whether the usage of real SAR image as another input of the detection network is important. This case shows the poorest detection performance and justifies the importance of fusing information from raw noisy SAR images. Secondly, for the choice of feature map after fusing, we perform experiments with feature map from denoised SAR image or feature map from real SAR image. As a result, keeping the feature map from the real SAR image as proposed is found to be much better.
4. Discussion
Our proposed detection framework obviously achieves a better performance through combining a denoising network with an existing detection network; however, more parameters and the complex structure demand larger memory for model storage and higher computing cost. We report average inference times (measured in seconds/(patch image) on a Titan Xp GPU) for the purpose of time complexity analysis, as presented in Table 4. Compared with the existing two-stage object detection network like Faster RCNN [45] in the first row of Table 4, our detection framework further requires denoising time and time for fusing region proposals during inference. The denoising time makes up a large portion of the added running times, so the most promising way for reducing the average inference time would be adopting a relatively light denoising network.
5. Conclusions
In this study, we develop a novel object detection framework, where an unsupervised denoising network is combined with a two-stage detection network and two sets of region proposals extracted from a real noisy SAR image and a synthetically denoised SAR image are complementarily merged. The coupling structure of denoising network with detection network together intends to replace a cumbersome preprocessing step for denoising with our denoising network and at the same time, the integrated denoising network performs denoising to support the subsequent object detection. To remedy a potential risk due to fine information loss after denoising, we keep raw information from input SAR image within detection network while only utilize a set of region proposals inferred from the synthetically denosied SAR image. The extensive qualitative and quantitative experiments on our own datasets with TerraSAR-X and COSMO-SkyMed satellite images suggest that the proposed object detection framework involves the adaptive denoising for directly influencing detection performance. Our method shows significant improvements over several detection baselines on the datasets constructed from TerraSAR-X and COSMO-SkyMed satellite images.
Author Contributions
Conceptualization, all authors; methodology, S.S.; software, S.S.; validation, Y.K., I.H. and J.K.; formal analysis, J.K.; investigation, I.H.; resources, S.S.; data curation, S.S.; writing—original draft preparation, S.S.; writing—review and editing, S.S.; visualization, S.S. and Y.K.; supervision, S.K.; project administration, S.K. All authors have read and agreed to the published version of the manuscript.
Funding
This research received no external funding.
Institutional Review Board Statement
Not applicable.
Informed Consent Statement
Not applicable.
Data Availability Statement
Not applicable.
Acknowledgments
This research was supported by the Defense Challengeable Future Technology Program of Agency for Defense Development, Republic of Korea.
Conflicts of Interest
The authors declare no conflict of interest.
References
- Chang, Y.L.; Anagaw, A.; Chang, L.; Wang, Y.C.; Hsiao, C.Y.; Lee, W.H. Ship detection based on YOLOv2 for SAR imagery. Remote Sens. 2019, 11, 786. [Google Scholar] [CrossRef] [Green Version]
- Chen, P.; Li, Y.; Zhou, H.; Liu, B.; Liu, P. Detection of small ship objects using anchor boxes cluster and feature pyramid network model for SAR imagery. J. Mar. Sci. Eng. 2020, 8, 112. [Google Scholar] [CrossRef] [Green Version]
- Kang, M.; Ji, K.; Leng, X.; Lin, Z. Contextual region-based convolutional neural network with multilayer fusion for SAR ship detection. Remote Sens. 2017, 9, 860. [Google Scholar] [CrossRef] [Green Version]
- Lin, Z.; Ji, K.; Leng, X.; Kuang, G. Squeeze and excitation rank faster R-CNN for ship detection in SAR images. IEEE Geosci. Remote Sens. Lett. 2018, 16, 751–755. [Google Scholar] [CrossRef]
- Zhai, L.; Li, Y.; Su, Y. Inshore ship detection via saliency and context information in high-resolution SAR images. IEEE Geosci. Remote Sens. Lett. 2016, 13, 1870–1874. [Google Scholar] [CrossRef]
- He, C.; Tu, M.; Xiong, D.; Tu, F.; Liao, M. A component-based multi-layer parallel network for airplane detection in SAR imagery. Remote Sens. 2018, 10, 1016. [Google Scholar] [CrossRef] [Green Version]
- Zhang, L.; Li, C.; Zhao, L.; Xiong, B.; Quan, S.; Kuang, G. A cascaded three-look network for aircraft detection in SAR images. Remote Sens. Lett. 2020, 11, 57–65. [Google Scholar] [CrossRef]
- Diao, W.; Dou, F.; Fu, K.; Sun, X. Aircraft detection in sar images using saliency based location regression network. In Proceedings of the IGARSS 2018 IEEE International Geoscience and Remote Sensing Symposium, Valencia, Spain, 22–27 July 2018; pp. 2334–2337. [Google Scholar]
- Zhao, Y.; Zhao, L.; Li, C.; Kuang, G. Pyramid attention dilated network for aircraft detection in SAR images. IEEE Geosci. Remote Sens. Lett. 2021, 18, 662–666. [Google Scholar] [CrossRef]
- Saha, S.; Bovolo, F.; Bruzzone, L. Destroyed-buildings detection from VHR SAR images using deep features. In Image and Signal Processing for Remote Sensing XXIV; International Society for Optics and Photonics: Bellingham, WA, USA, 2018; Volume 10789, p. 107890Z. [Google Scholar]
- Bao, S.; Meng, J.; Sun, L.; Liu, Y. Detection of ocean internal waves based on Faster R-CNN in SAR images. J. Oceanol. Limnol. 2020, 38, 55–63. [Google Scholar] [CrossRef]
- Huang, D.; Du, Y.; He, Q.; Song, W.; Liotta, A. DeepEddy: A simple deep architecture for mesoscale oceanic eddy detection in SAR images. In Proceedings of the 2017 IEEE 14th International Conference on Networking, Sensing and Control (ICNSC), Calabria, Italy, 16–18 May 2017; pp. 673–678. [Google Scholar]
- Bianchi, F.M.; Espeseth, M.M.; Borch, N. Large-scale detection and categorization of oil spills from SAR images with deep learning. Remote Sens. 2020, 12, 2260. [Google Scholar] [CrossRef]
- Waldeland, A.U.; Reksten, J.H.; Salberg, A.B. Avalanche detection in sar images using deep learning. In Proceedings of the IGARSS 2018 IEEE International Geoscience and Remote Sensing Symposium, Valencia, Spain, 22–27 July 2018; pp. 2386–2389. [Google Scholar]
- Rotter, P.; Muron, W. Automatic Detection of Subsidence Troughs in SAR Interferograms Based on Convolutional Neural Networks. IEEE Geosci. Remote Sens. Lett. 2020, 18, 82–86. [Google Scholar] [CrossRef]
- Sun, X.; Wang, Z.; Sun, Y.; Diao, W.; Zhang, Y.; Fu, K. AIR-SARShip-1.0: High-resolution SAR Ship Detection Dataset. J. Radars 2019, 8, 852–862. (In English) [Google Scholar]
- Wang, Y.; Wang, C.; Zhang, H.; Dong, Y.; Wei, S. A SAR Dataset of Ship Detection for Deep Learning under Complex Backgrounds. Remote Sens. 2019, 11, 765. [Google Scholar] [CrossRef] [Green Version]
- Li, J.; Qu, C.; Shao, J. Ship detection in SAR images based on an improved faster R-CNN. In Proceedings of the 2017 SAR in Big Data Era: Models, Methods and Applications (BIGSARDATA), Beijing, China, 13–14 November 2017; pp. 1–6. [Google Scholar]
- Wei, S.; Zeng, X.; Qu, Q.; Wang, M.; Su, H.; Shi, J. HRSID: A high-resolution SAR images dataset for ship detection and instance segmentation. IEEE Access 2020, 8, 120234–120254. [Google Scholar] [CrossRef]
- Bai, Y.C.; Zhang, S.; Chen, M.; Pu, Y.F.; Zhou, J.L. A fractional total variational CNN approach for SAR image despeckling. In International Conference on Intelligent Computing; Springer: Berlin/Heidelberg, Germany, 2018; pp. 431–442. [Google Scholar]
- Parrilli, S.; Poderico, M.; Angelino, C.V.; Verdoliva, L. A nonlocal SAR image denoising algorithm based on LLMMSE wavelet shrinkage. IEEE Trans. Geosci. Remote Sens. 2011, 50, 606–616. [Google Scholar] [CrossRef]
- Lee, J.S. Speckle analysis and smoothing of synthetic aperture radar images. Comput. Graph. Image Process. 1981, 17, 24–32. [Google Scholar] [CrossRef]
- Kuan, D.T.; Sawchuk, A.A.; Strand, T.C.; Chavel, P. Adaptive noise smoothing filter for images with signal-dependent noise. IEEE Trans. Pattern Anal. Mach. Intell. 1985, PAMI-7, 165–177. [Google Scholar] [CrossRef] [PubMed]
- Frost, V.S.; Stiles, J.A.; Shanmugan, K.S.; Holtzman, J.C. A model for radar images and its application to adaptive digital filtering of multiplicative noise. IEEE Trans. Pattern Anal. Mach. Intell. 1982, PAMI-4, 157–166. [Google Scholar] [CrossRef]
- Deledalle, C.A.; Denis, L.; Tupin, F. Iterative weighted maximum likelihood denoising with probabilistic patch-based weights. IEEE Trans. Image Process. 2009, 18, 2661–2672. [Google Scholar] [CrossRef] [Green Version]
- Guo, H.; Wu, D.; An, J. Discrimination of oil slicks and lookalikes in polarimetric SAR images using CNN. Sensors 2017, 17, 1837. [Google Scholar] [CrossRef] [PubMed] [Green Version]
- Xu, Q.; Li, W.; Xu, Z.; Zheng, J. Noisy SAR image classification based on fusion filtering and deep learning. In Proceedings of the 2017 3rd IEEE International Conference on Computer and Communications (ICCC), Chengdu, China, 13–16 December 2017; pp. 1928–1932. [Google Scholar]
- Zhang, T.; Zhang, X. High-speed ship detection in SAR images based on a grid convolutional neural network. Remote Sens. 2019, 11, 1206. [Google Scholar] [CrossRef] [Green Version]
- Hong, S.J.; Baek, W.K.; Jung, H.S. Ship Detection from X-Band SAR Images Using M2Det Deep Learning Model. Appl. Sci. 2020, 10, 7751. [Google Scholar] [CrossRef]
- Zhao, J.; Zhang, Z.; Yu, W.; Truong, T.K. A cascade coupled convolutional neural network guided visual attention method for ship detection from SAR images. IEEE Access 2018, 6, 50693–50708. [Google Scholar] [CrossRef]
- Versaci, M.; Morabito, F.C.; Angiulli, G. Adaptive image contrast enhancement by computing distances into a 4-dimensional fuzzy unit hypercube. IEEE Access 2017, 5, 26922–26931. [Google Scholar] [CrossRef]
- Orujov, F.; Maskeliūnas, R.; Damaševičius, R.; Wei, W. Fuzzy based image edge detection algorithm for blood vessel detection in retinal images. Appl. Soft Comput. 2020, 94, 106452. [Google Scholar] [CrossRef]
- Wang, J.; Zheng, T.; Lei, P.; Bai, X. Ground target classification in noisy SAR images using convolutional neural networks. IEEE J. Sel. Top. Appl. Earth Obs. Remote Sens. 2018, 11, 4180–4192. [Google Scholar] [CrossRef]
- German Aerospace Center. Available online: https://www.dlr.de/EN/Home/home_node.html (accessed on 4 May 2021).
- Italian Space Agency. Available online: https://www.asi.it/en/#divFooter (accessed on 4 May 2021).
- Laine, S.; Karras, T.; Lehtinen, J.; Aila, T. High-Quality Self-Supervised Deep Image Denoising. Adv. Neural Inf. Process. Syst. 2019, 32, 6970–6980. [Google Scholar]
- Molini, A.B.; Valsesia, D.; Fracastoro, G.; Magli, E. Speckle2Void: Deep Self-Supervised SAR Despeckling with Blind-Spot Convolutional Neural Networks. IEEE Trans. Geosci. Remote Sens. 2021. [Google Scholar] [CrossRef]
- Khademi, W.; Rao, S.; Minnerath, C.; Hagen, G.; Ventura, J. Self-supervised poisson-gaussian denoising. In Proceedings of the IEEE/CVFWinter Conference on Applications of Computer Vision, Waikoloa, HI, USA, 5–9 January 2021; pp. 2131–2139. [Google Scholar]
- Chen, K.; Wang, J.; Pang, J.; Cao, Y.; Xiong, Y.; Li, X.; Sun, S.; Feng, W.; Liu, Z.; Xu, J.; et al. MMDetection: Open MMLab Detection Toolbox and Benchmark. arXiv 2019, arXiv:1906.07155. [Google Scholar]
- Paszke, A.; Gross, S.; Massa, F.; Lerer, A.; Bradbury, J.; Chanan, G.; Killeen, T.; Lin, Z.; Gimelshein, N.; Antiga, L.; et al. PyTorch: An Imperative Style, High-Performance Deep Learning Library. In Proceedings of the Advances in Neural Information Processing Systems 32, Vancouver, BC, Canada, 8–14 December 2019; pp. 8024–8035. [Google Scholar]
- Robbins, H.; Monro, S. A stochastic approximation method. Ann. Math. Stat. 1951, 22, 400–407. [Google Scholar] [CrossRef]
- Sutskever, I.; Martens, J.; Dahl, G.; Hinton, G. On the importance of initialization and momentum in deep learning. In Proceedings of the International Conference on Machine Learning, Atlanta, GA, USA, 16–21 June 2013; pp. 1139–1147. [Google Scholar]
- He, K.; Zhang, X.; Ren, S.; Sun, J. Deep residual learning for image recognition. In Proceedings of the IEEE Conference on Computer Vision and Pattern Recognition, Las Vegas, NV, USA, 27–30 June 2016; pp. 770–778. [Google Scholar]
- Lin, T.Y.; Dollár, P.; Girshick, R.; He, K.; Hariharan, B.; Belongie, S. Feature pyramid networks for object detection. In Proceedings of the IEEE Conference on Computer Vision and Pattern Recognition, Honolulu, HI, USA, 21–26 July 2017; pp. 2117–2125. [Google Scholar]
- Ren, S.; He, K.; Girshick, R.; Sun, J. Faster r-cnn: Towards real-time object detection with region proposal networks. IEEE Trans. Pattern Anal. Mach. Intell. 2016, 39, 1137–1149. [Google Scholar] [CrossRef] [PubMed] [Green Version]
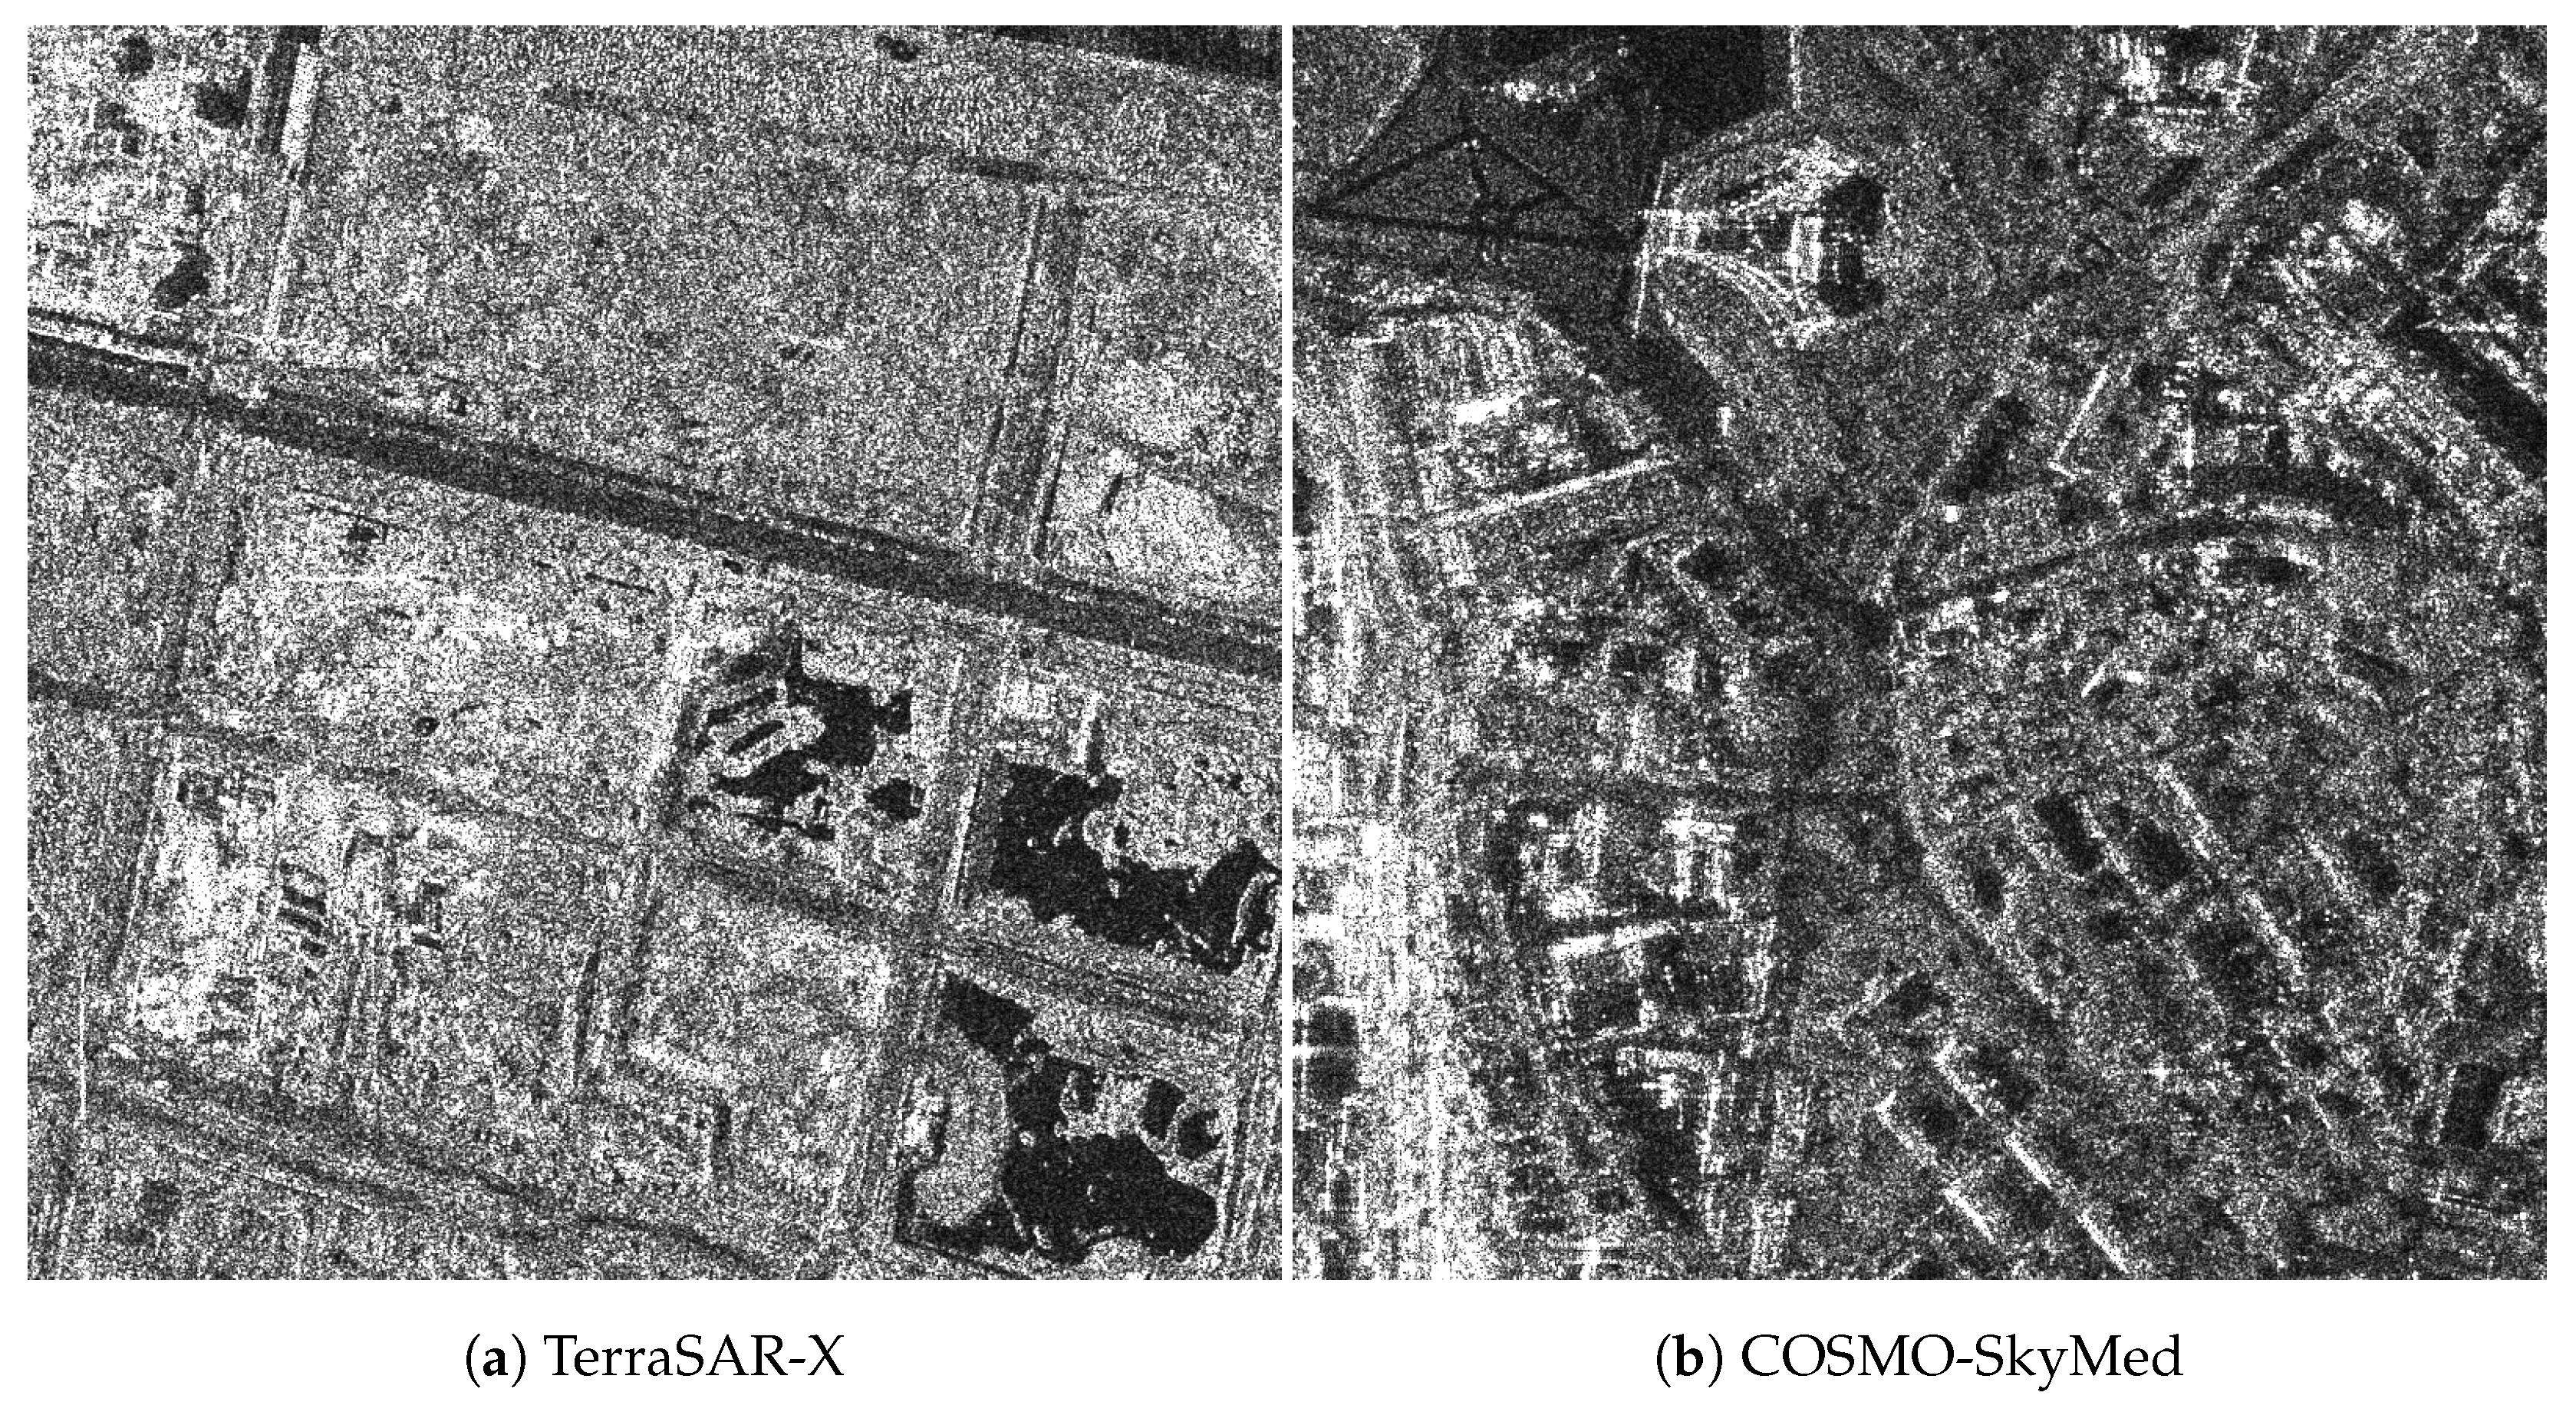
Figure 1.
Examples of the real-world SAR image where noise-like speckle appears.

Figure 2.
Example airplane (top) and ship (bottom) objects in TerraSAR-X image. The groundtruth bounding boxes labeled as corresponding class are plotted in red color.
Figure 2.
Example airplane (top) and ship (bottom) objects in TerraSAR-X image. The groundtruth bounding boxes labeled as corresponding class are plotted in red color.

Figure 3.
Example airplane (top) and ship (bottom) objects in COSMO-SkyMed image. The groundtruth bounding boxes labeled as corresponding class are plotted in red color.
Figure 3.
Example airplane (top) and ship (bottom) objects in COSMO-SkyMed image. The groundtruth bounding boxes labeled as corresponding class are plotted in red color.

Figure 4.
Number of annotated instances per category for TerraSAR-X and COSMO-SkyMed imagery.

Figure 5.
Histogram that exhibits the number of annotated instances with respect to area (width × height) in pixels.
Figure 5.
Histogram that exhibits the number of annotated instances with respect to area (width × height) in pixels.

Figure 6.
Overview of the proposed object detection framework: (1) connecting an unsupervised denoising network to an object detection network for dynamically extracting a denoised SAR image from a given noisy SAR image, and (2) forwarding an image pair of two SAR images to an object detection network and fusing region proposals from the two SAR images for complementarily integrating regional information.

Figure 7.
Overview of the traditional two-stage object detection network given a real or denoised (preprocessed) SAR image as input.
Figure 7.
Overview of the traditional two-stage object detection network given a real or denoised (preprocessed) SAR image as input.

Figure 8.
Two paired examples of noisy SAR (left) and despeckled SAR (right) images. Red bounding boxes for each image enlarge corresponding sub-regions. As shown in the enlarged windows, scattering waves and speckle noises are relatively less observed in denoised examples.
Figure 8.
Two paired examples of noisy SAR (left) and despeckled SAR (right) images. Red bounding boxes for each image enlarge corresponding sub-regions. As shown in the enlarged windows, scattering waves and speckle noises are relatively less observed in denoised examples.

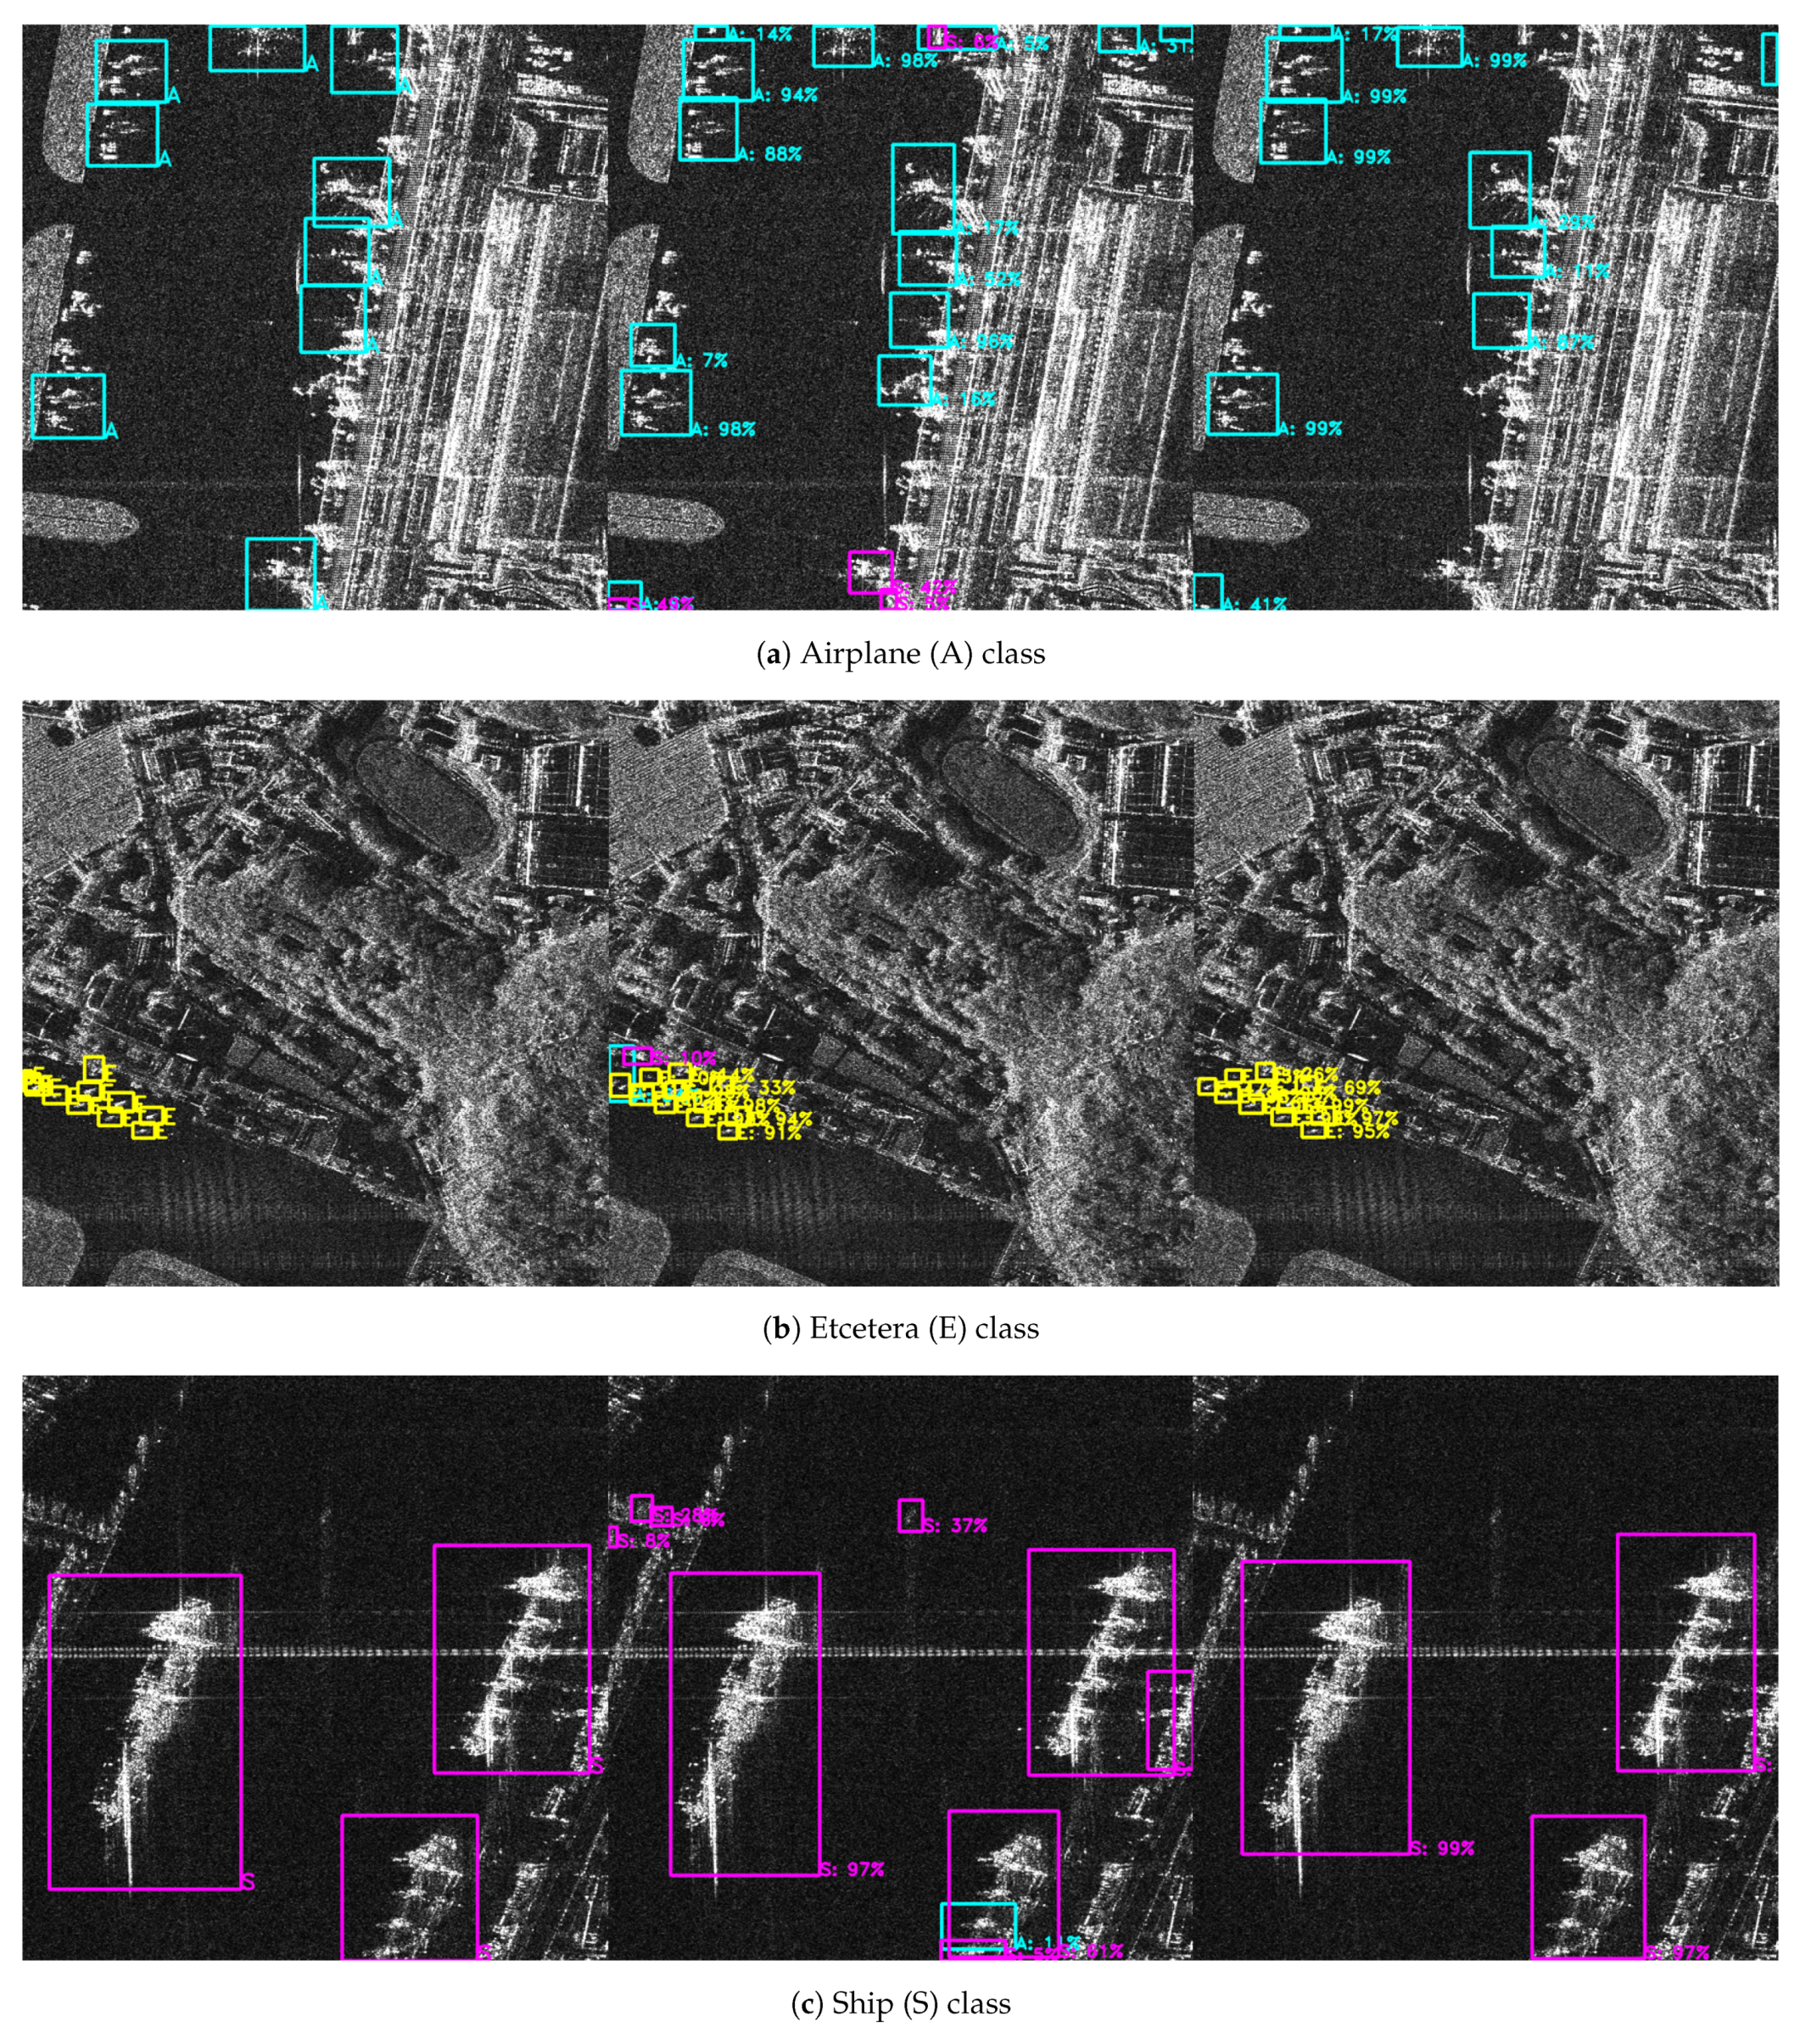
Figure 9.
Image triples are shown in which the left image is groundtruth, while the middle image is for baseline models (traditional two-stage detection models with real SAR images), and the right image is for our models. The groundtruth and predicted bounding boxes are plotted in blue color for A class, yellow color for E class, and pink color for S class. The numbers on the bounding boxes in the middle and right images denote the confidence score for each corresponding category. We visualize all detected bounding boxes after NMS and thresholding detector confidence at 0.05.


Table 1.
Comparison of statistics among multiple datasets. We denote the number of instances, patches, and areas as # Instances, # Patches, and # Areas, respectively.
Table 1.
Comparison of statistics among multiple datasets. We denote the number of instances, patches, and areas as # Instances, # Patches, and # Areas, respectively.
| Dataset | # Instances | # Patches | # Areas | Patch Size | Resolution |
|---|---|---|---|---|---|
| AIR-SARShip-1.0 [16] | 461 | 31 | 4 | 3000 × 3000 | 1∼3 m |
| SSDD [18] | 2540 | 1160 | 15 | 300 × 400 | 1∼10 m |
| SAR-Ship-Dataset [17] | 59,535 | 43,819 | 30 | 256 × 256 | 3∼25 m |
| HRSID [19] | 16,951 | 5604 | 13 | 800 × 800 | 0.6∼3 m |
| Our Dataset | 21,717 | 16,308 | 92 | 800 × 800 | 0.6∼1 m |
Table 2.
Comparison of detection performance on our constructed dataset with TerraSAR-X and COSMO-SkyMed images. By incorporating region proposals from denoised SAR images within detection network, our model shows significant improvement in AP. The entries with the best APs for each object category are highlight in bold.
| Backbone | +Despeckling | AP | Airplane (A) | Etcetera (E) | Ship (S) |
|---|---|---|---|---|---|
| ResNet-50 | - | 52.05 | 53.90 | 54.54 | 47.72 |
| preprocessing (Lee filter [22]) | 53.52 | 54.63 | 56.96 | 48.98 | |
| preprocessing (PPB filter [25]) | 51.16 | 54.35 | 53.68 | 45.44 | |
| within network (ours) | 55.90 | 58.82 | 54.04 | 54.84 | |
| ResNet-101 | - | 54.29 | 54.65 | 59.80 | 48.43 |
| preprocessing (Lee filter [22]) | 56.19 | 58.04 | 60.59 | 49.95 | |
| preprocessing (PPB filter [25]) | 52.96 | 53.16 | 58.17 | 47.54 | |
| within network (ours) | 60.81 | 65.03 | 61.67 | 55.72 |
Table 3.
Ablation study across the input type of detection network and feature map forwarded to subsequent sub-network for classification and bounding box regression for each RoIs. The entries with the best APs for each object category are highlight in bold. The backbone is ResNet-50-FPN.
Table 3.
Ablation study across the input type of detection network and feature map forwarded to subsequent sub-network for classification and bounding box regression for each RoIs. The entries with the best APs for each object category are highlight in bold. The backbone is ResNet-50-FPN.
| Input of DetNet. | Feature Map | AP | Airplane (A) | Etcetera (E) | Ship (S) |
|---|---|---|---|---|---|
| Denoised only | - | 52.96 | 56.71 | 53.59 | 48.57 |
| Real + Denoised | Denoised | 53.96 | 57.16 | 51.17 | 53.54 |
| Real + Denoised | Real (ours) | 55.90 | 58.82 | 54.04 | 54.84 |
Table 4.
Comparison of running times for the time complexity analysis. We evaluated the running times on a patch image sized 800 × 800 with a Titan Xp GPU.
Table 4.
Comparison of running times for the time complexity analysis. We evaluated the running times on a patch image sized 800 × 800 with a Titan Xp GPU.
| Models | Inference Time (sec/patch) |
|---|---|
| Faster RCNN [45] | 0.3854 |
| Faster RCNN + Ours | 0.8190 |
Publisher’s Note: MDPI stays neutral with regard to jurisdictional claims in published maps and institutional affiliations. |
© 2021 by the authors. Licensee MDPI, Basel, Switzerland. This article is an open access article distributed under the terms and conditions of the Creative Commons Attribution (CC BY) license (https://creativecommons.org/licenses/by/4.0/).
Share and Cite
MDPI and ACS Style
Shin, S.; Kim, Y.; Hwang, I.; Kim, J.; Kim, S. Coupling Denoising to Detection for SAR Imagery. Appl. Sci. 2021, 11, 5569. https://0-doi-org.brum.beds.ac.uk/10.3390/app11125569
AMA Style
Shin S, Kim Y, Hwang I, Kim J, Kim S. Coupling Denoising to Detection for SAR Imagery. Applied Sciences. 2021; 11(12):5569. https://0-doi-org.brum.beds.ac.uk/10.3390/app11125569
Chicago/Turabian StyleShin, Sujin, Youngjung Kim, Insu Hwang, Junhee Kim, and Sungho Kim. 2021. "Coupling Denoising to Detection for SAR Imagery" Applied Sciences 11, no. 12: 5569. https://0-doi-org.brum.beds.ac.uk/10.3390/app11125569
Note that from the first issue of 2016, this journal uses article numbers instead of page numbers. See further details here.