
Numerical and Theoretical Study of Performance and Mechanical Behavior of PEM-FC Using Innovative Channel Geometrical Configurations


Abstract
:1. Introduction
- (1)
- There are significant variations between the Young’s modulus as well as Poisson ratios (a rigid with smooth materials).
- (2)
- The layer of GDL remains porous, and due to the drop in pore volume or porosity, the permeability decreases.
- (3)
2. Mathematical Model of PEM and Numerical Method
2.1. Computational Domain
- Steady-state operating conditions for PEM-FC;
- Constant membrane ionic conductivity;
- The reactive gases permeable through the membrane are neglected as the membrane is impermeable to them;
- Isotropic and homogeneous gas diffusion layer;
- The water entering the cell at the entrance to the cell is neglected;
- The water formed is considered in the vapor phase.
2.2. Solid Mechanics Pattern through Assembly
2.3. Compression of PEM-FC’s GDL
2.4. Computational Grid
3. Fuel Cell Performance Calculations
Thermodynamic Characteristics and Governing Equations
4. Results and Discussion
4.1. Analysis of PEM-FC through Assembly
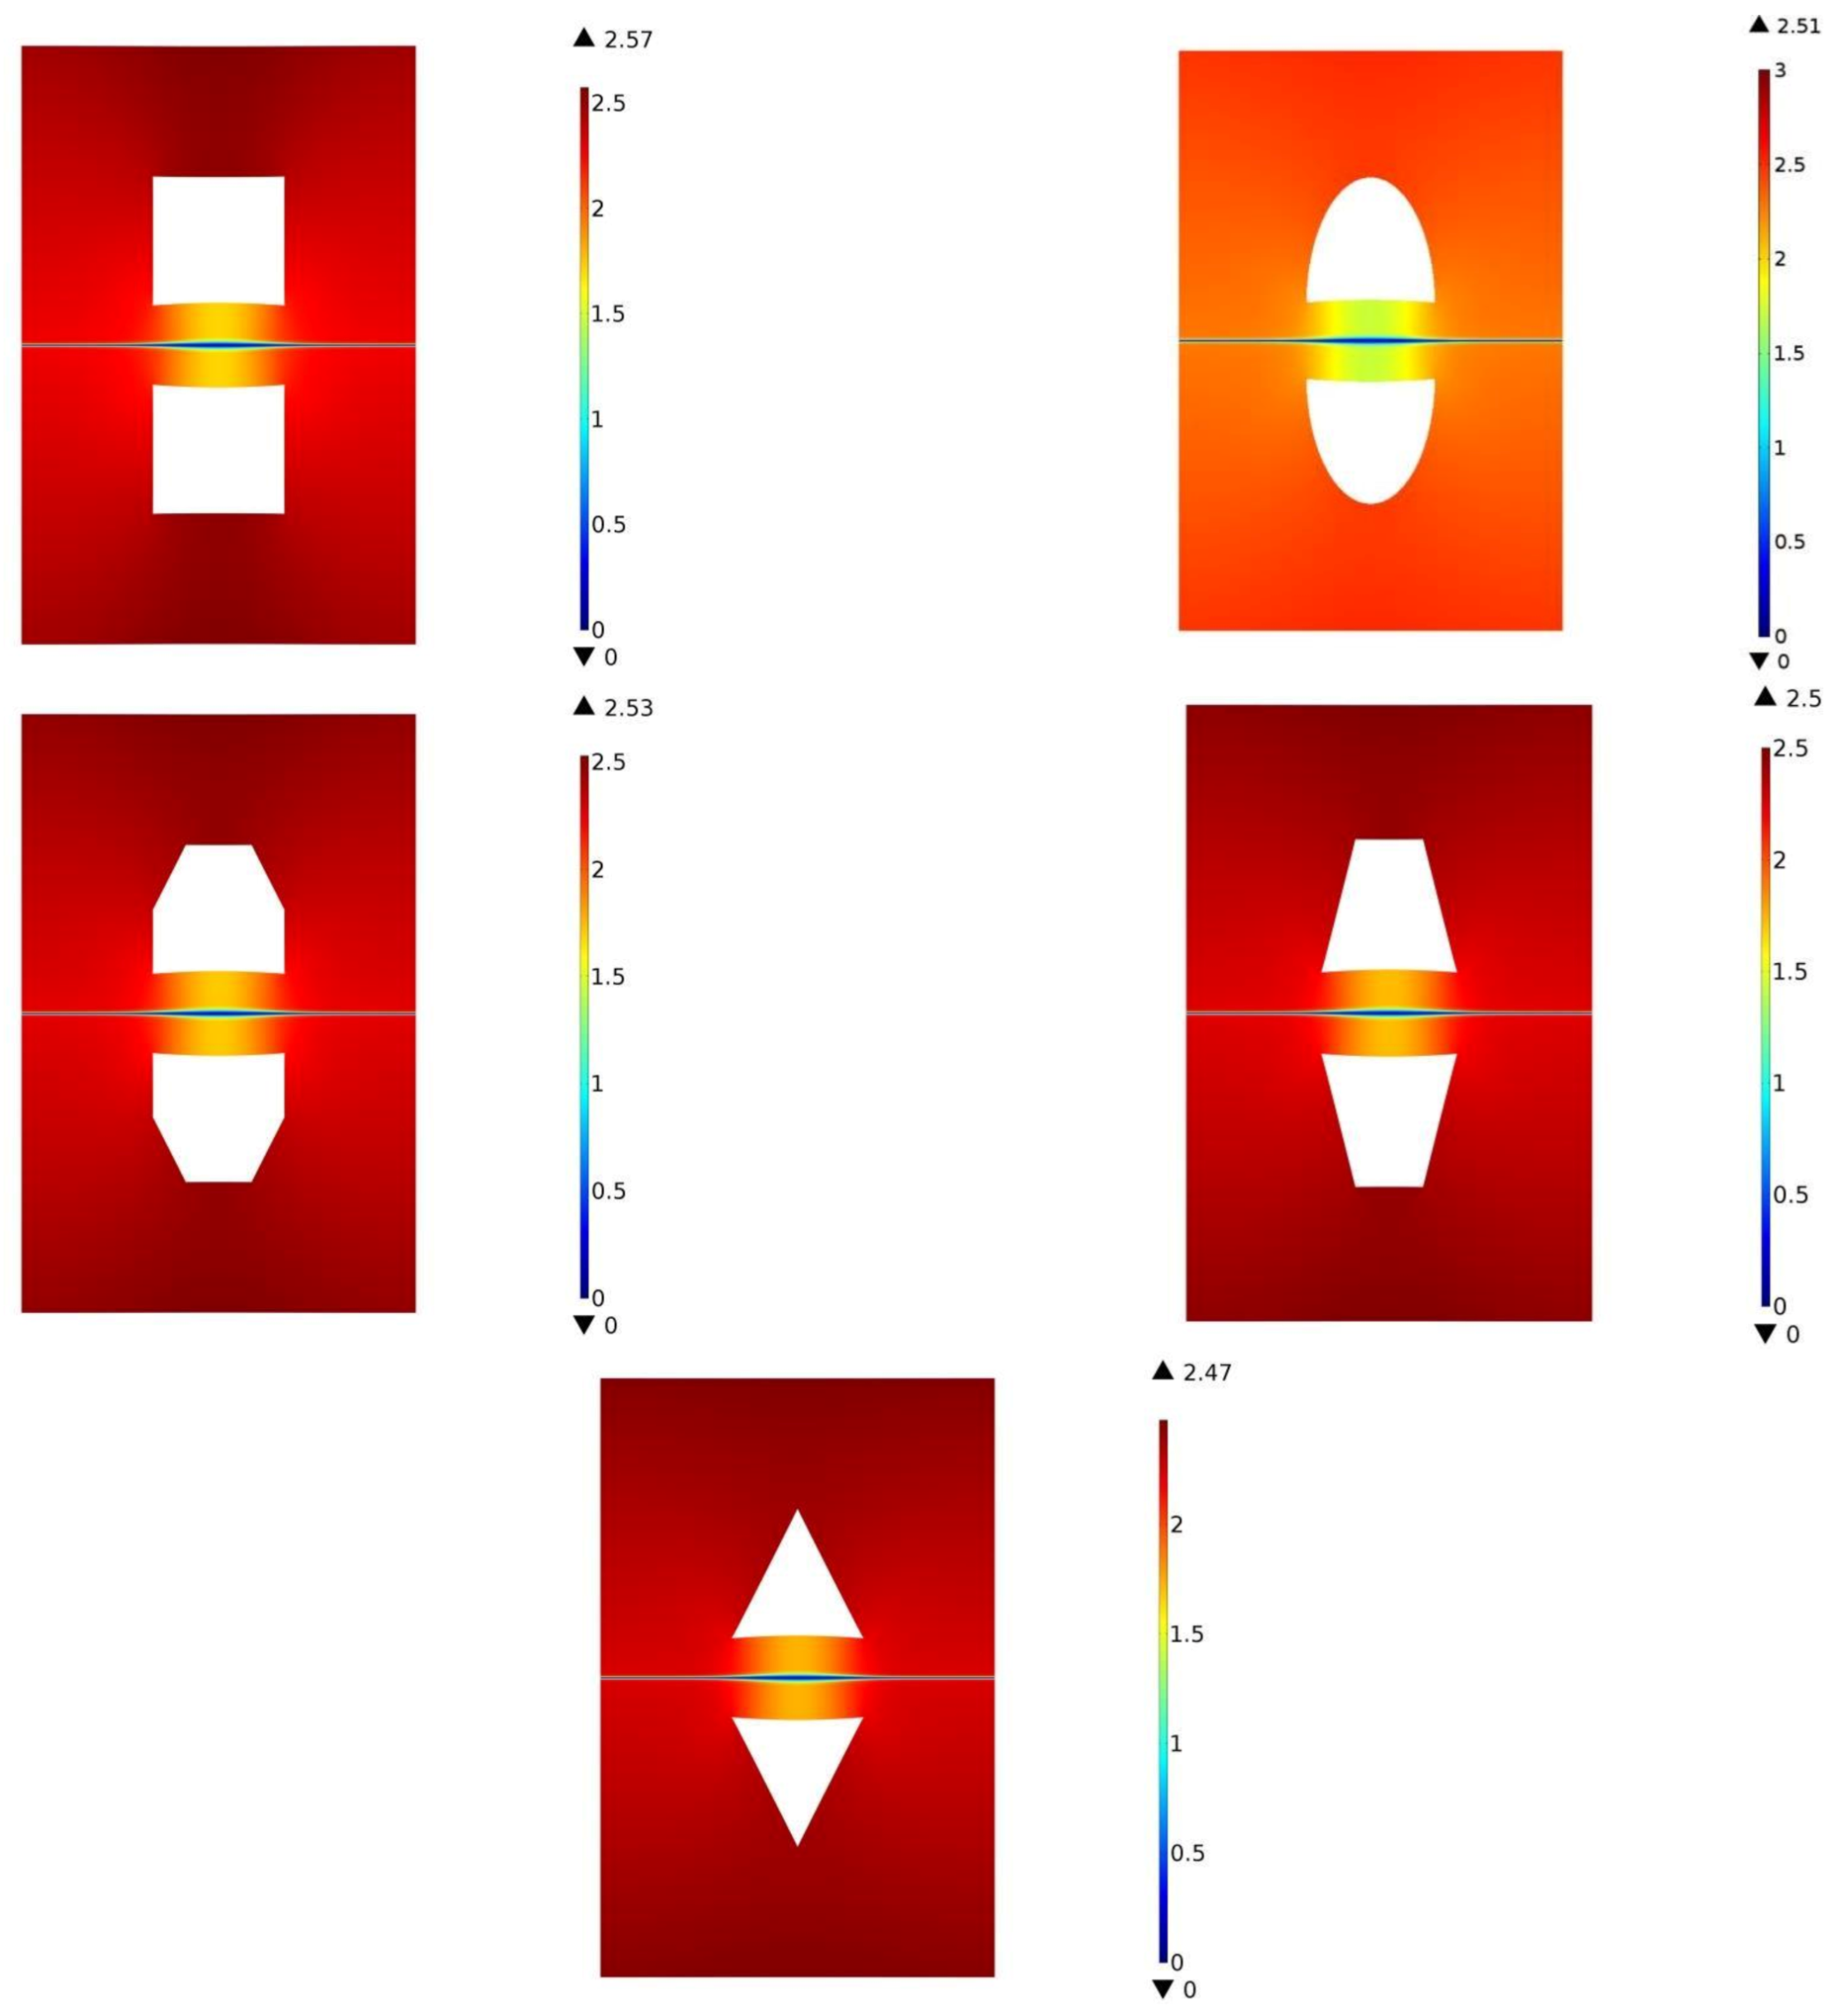
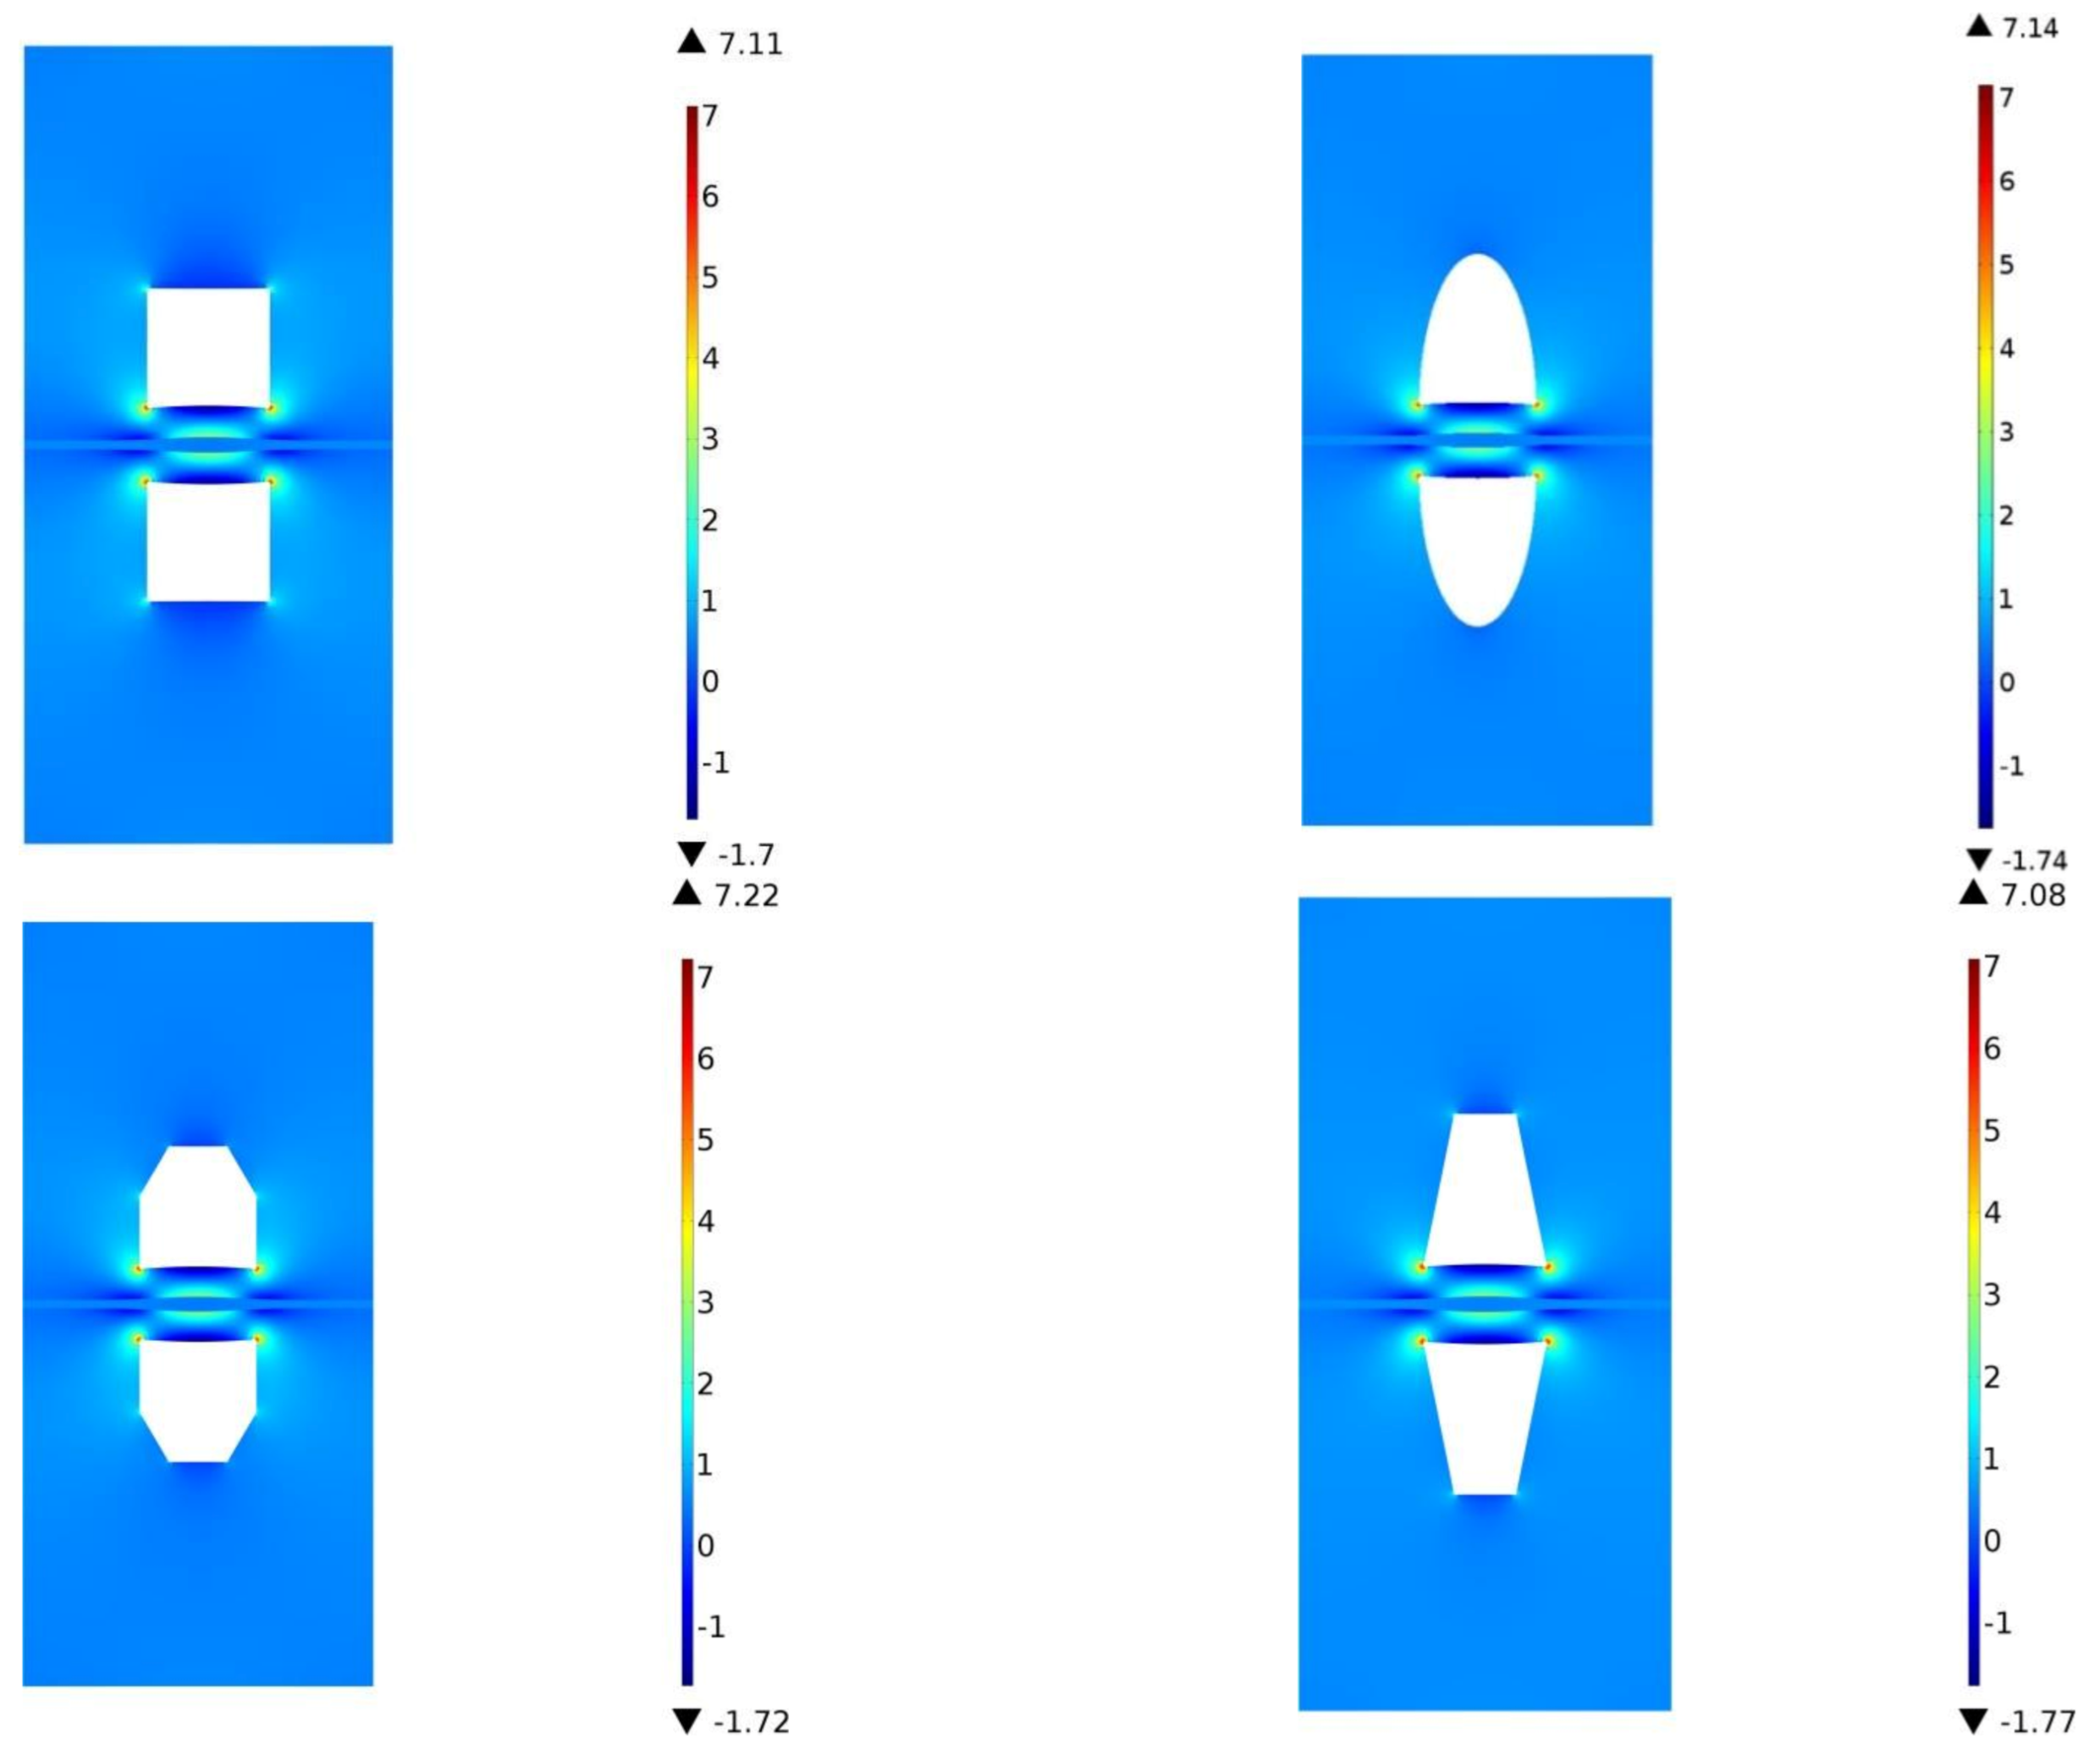
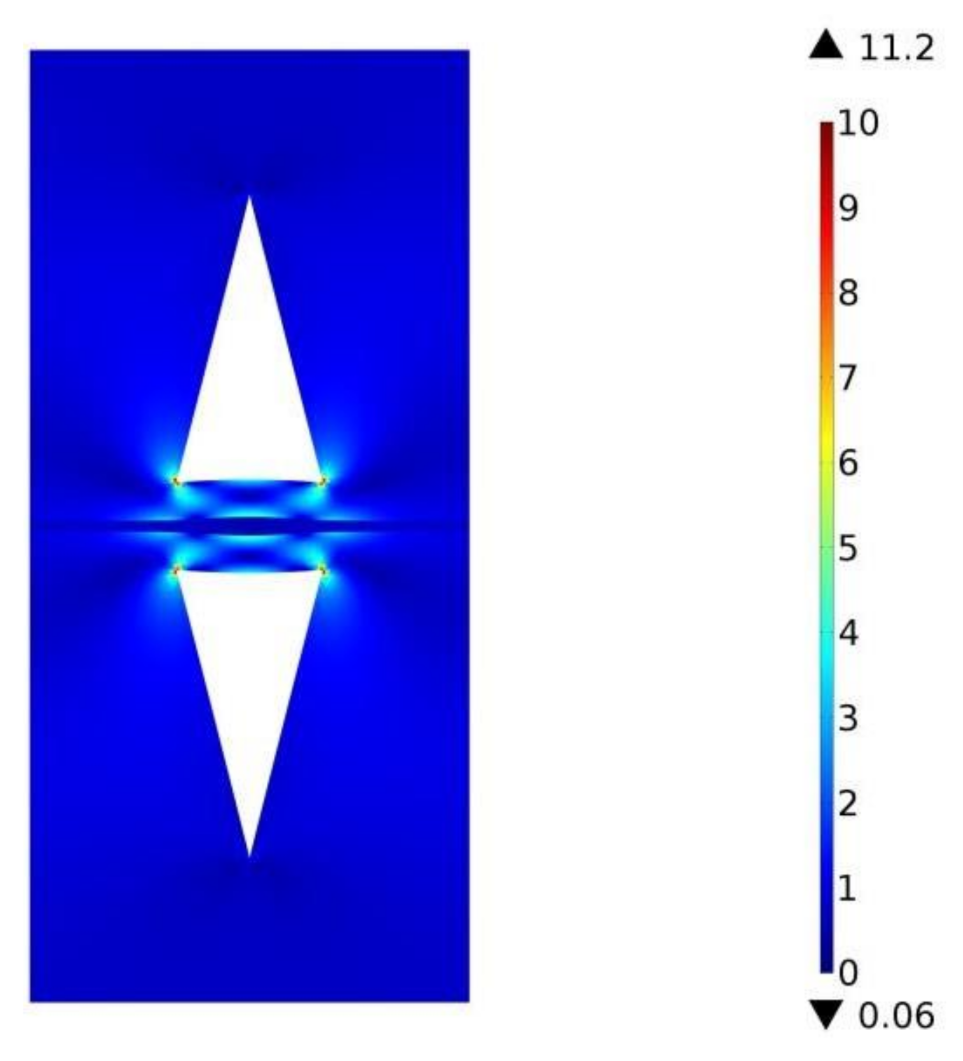
4.1.1. Channel Cross-Sections by an Equivalent Channel Height
4.1.2. Channel Cross-Sections with the identical Cross-Sectional Area
4.2. The Performance of PEM-FC
5. Conclusions
6. Recommendations
- The model is extended from steady-state to transient.
- Use a CFD technique to simulate the PEM-FCs in a 3D model.
- Develop this model to contain the operation conditions (thermal stresses) of the PEM-FC.
Author Contributions
Funding
Institutional Review Board Statement
Informed Consent Statement
Data Availability Statement
Acknowledgments
Conflicts of Interest
Abbreviations
| Nomenclature | |
| u | velocity vector in x-axis (m/s) |
| P | pressure (Pa) |
| T | temperature (K) |
| M | gas molecular weight (kg/mole) |
| x | mole fraction |
| y | mass fraction |
| D | diffusion coefficient (m2/s) |
| Cp | specific heat capacity (J/kg∙K) |
| k | gas thermal conductivity (W/m∙K) |
| kp | hydraulic permeability (m2) |
| F | Faraday’s constant |
| the generated heat (W/m2) | |
| S | specific entropy (J/mole∙K) |
| R | universal gas constant (J/mole∙K) |
| Greek | |
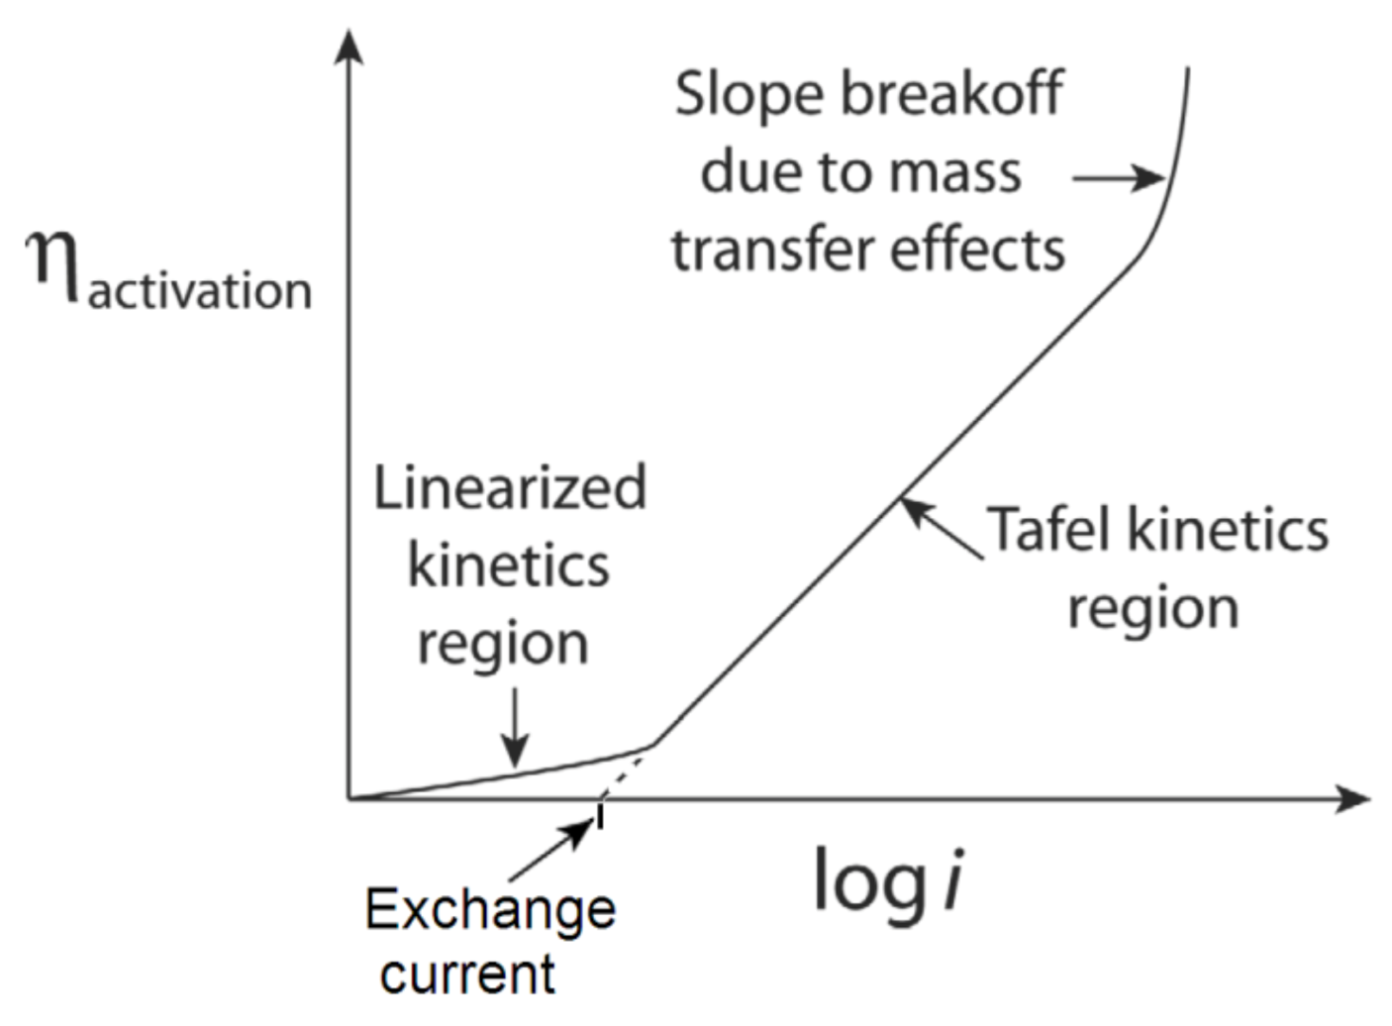
| ηact | activation overpotential |
| ρ | density (kg/m3) |
| porosity | |
| modified convective heat transfer coefficient (W/m3) | |
| λe | electronic conductivity |
| µ | viscosity (kg/m.s) |
| ζ | Stoichiometric flow ratio |
| Subscripts | |
| i | Hydrogen in anode |
| j | Oxygen in cathode |
| w | water |
| mem | membrane |
| a | anode |
| c | cathode |
| l | liquid |
| Acronym | |
| PEM-FC | proton-exchange membrane |
| fuel cell | |
| FC | fuel cell |
| PV | photovoltaic |
| COE | cost of energy |
| GDL | gas diffusion layer |
| CL | catalyst layer |
| ACL | anode catalyst layer |
| CCL | cathode catalyst layer |
| MEA | membrane electrode assembly |
| DBCs | Dirichlet’s boundary conditions |
| NBCs | Neumann’s boundary conditions |
| AGFC | anode gas flow channel |
| CGFC | cathode gas flow channel |
References
- Carral, C.; Charvin, N.; Trouvé, H.; Mélé, P. An experimental analysis of PEMFC stack assembly using strain gage sensors. Int. J. Hydrog. Energy 2014, 39, 4493–4501. [Google Scholar] [CrossRef]
- Gatto, I.; Urbani, F.; Giacoppo, G.; Barbera, O.; Passalacqua, E. Influence of the bolt torque on PEFC performance with different gasket materials. Int. J. Hydrog. Energy 2011, 36, 13043–13050. [Google Scholar] [CrossRef]
- Mason, T.J.; Millichamp, J.; Neville, T.P.; El-Kharouf, A.; Pollet, B.G.; Brett, D. Effect of clamping pressure on ohmic resistance and compression of gas diffusion layers for polymer electrolyte fuel cells. J. Power Sources 2012, 219, 52–59. [Google Scholar] [CrossRef] [Green Version]
- Singdeo, D.; Dey, T.; Ghosh, P.C. Contact resistance between bipolar plate and gas diffusion layer in high temperature polymer electrolyte fuel cells. Int. J. Hydrog. Energy 2014, 39, 987–995. [Google Scholar] [CrossRef]
- Banan, R.; Bazylak, A.; Zu, J. Effect of mechanical vibrations on damage propagation in polymer electrolyte membrane fuel cells. Int. J. Hydrog. Energy 2013, 38, 14764–14772. [Google Scholar] [CrossRef]
- Su, Z.; Liu, C.; Chang, H.; Li, C.; Huang, K.; Sui, P. A numerical investigation of the effects of compression force on PEM fuel cell performance. J. Power Sources 2008, 183, 182–192. [Google Scholar] [CrossRef]
- Tötzke, C.; Gaiselmann, G.; Osenberg, M.; Bohner, J.; Arlt, T.; Markotter, H.; Hilger, A.; Wieder, F.; Kupsch, A.; Muller, B.R.; et al. Three-dimensional study of compressed gas diffusion layers using synchrotron X-ray imaging. J. Power Sources 2014, 253, 123–131. [Google Scholar] [CrossRef]
- Baik, K.D.; Hong, B.K.; Han, K.; Kim, M.S. Effects of anisotropic bending stiffness of gas diffusion layers on the performance of polymer electrolyte membrane fuel cells with bipolar plates employing different channel depths. Renew. Energy 2014, 69, 356–364. [Google Scholar] [CrossRef]
- Nitta, I.; Karvonen, S.; Himanen, O.; Mikkola, M. Modelling the Effect of Inhomogeneous Compression of GDL on Local Transport Phenomena in a PEM Fuel Cell. Fuel Cells 2008, 8, 410–421. [Google Scholar] [CrossRef]
- Manso, A.; Marzo, F.F.; Barranco, J.; Garikano, X.; Mujika, M.G. Influence of geometric parameters of the flow fields on the performance of a PEM fuel cell. A review. Int. J. Hydrog. Energy 2012, 37, 15256–15287. [Google Scholar] [CrossRef]
- Ahmed, D.H.; Sung, H.J. Effects of channel geometrical configuration and shoulder width on PEMFC performance at high current density. J. Power Sources 2006, 162, 327–339. [Google Scholar] [CrossRef]
- Zhang, G.; Bao, Z.; Xie, B.; Wang, Y.; Jiao, K. Three-dimensional multi-phase simulation of PEM fuel cell considering the full morphology of metal foam flow field. Int. J. Hydrog. Energy 2021, 46, 2978–2989. [Google Scholar] [CrossRef]
- Al-Baghdadi, M.A.R.S. Effect of channel geometrical configuration on the pressure distribution and stress failure in a running PEM fuel cell. Int. J. Energy Environ. 2017, 8, 105–126. [Google Scholar]
- Al-Bonsrulah, H.; Alshukri, M.; Mikhaeel, L.; Al-Sawaf, N.; Nesrine, K.; Reddy, M.; Zaghib, K. Design and Simulation Studies of Hybrid Power Systems Based on Photovoltaic, Wind, Electrolyzer, and PEM Fuel Cells. Energies 2021, 14, 2643. [Google Scholar] [CrossRef]
- Lampinen, M.J.; Fomino, M. Analysis of Free Energy and Entropy Changes for Half-Cell Reactions. J. Electrochem. Soc. 1993, 140, 3537–3546. [Google Scholar] [CrossRef]
- Hirschenhofer, J.H.; Stauffer, D.B.; Engleman, R.R.; Klett, M.G. Fuel Cell: A Handbook; U.S. Department of Fossil Energy, Morgantown Energy Technology Center, DOE/NETL: Morgantown, WV, USA, 2002; pp. 11–12. [Google Scholar]
- Chen, E. Thermodynamics and Electrochemical Kinetics. In Fuel Cell Technology Handbook; Iin, G.H., Ed.; CRC Press: Boca Raton, FL, USA, 2003. [Google Scholar]
- Bard, A.J.; Faulkner, L.R. Electrochemical Methods, Fundamentals and Applications, 2nd ed.; Wiley: New York, NY, USA, 2001. [Google Scholar]
- Dhathathreyan, K.; Sridhar, P.; Sasikumar, G.; Ghosh, K.; Velayutham, G.; Rajalakshmi, N.; Subramaniam, C.; Natarajan, R.; Ramya, K. Development of polymer electrolyte membrane fuel cell stack. Int. J. Hydrog. Energy 1999, 24, 1107–1115. [Google Scholar] [CrossRef]
- Minh, N.Q.; Takahashi, T. Science and Technology of Ceramic Fuel Cells, 2nd ed.; Elsevier: New York, NY, USA, 2005. [Google Scholar]
- Ahluwalia, R.K.; Wang, X.; Rousseau, A.; Kumar, R. Fuel economy of hydrogen fuel cell vehicles. J. Power Sources 2004, 130, 192–201. [Google Scholar] [CrossRef]
- Al-Baghdadi, M.A.R.S. Modelling of proton exchange membrane fuel cell performance based on semi-empirical equations. Renew. Energy 2005, 30, 1587–1599. [Google Scholar] [CrossRef]
- Al-Baghdadi, M.A.R.S.; Al-Janabi, H.A.K.S. Optimization Study of Proton Exchange Membrane Fuel Cell Performance. Sci. Technol. Res. Counc. Turk. 2005, 29, 235–240. [Google Scholar]
- Al-Baghdadi, M.A.R.S. A simple mathematical model of performance for proton exchange membrane fuel cells. Int. J. Sustain. Energy 2007, 26, 79–90. [Google Scholar] [CrossRef]
- Al-Baghdadi, M.A.R.S. An investigation on the performance optimization of a PEM hydrogen-oxygen fuel cell. J. Sci. Eng. Res. 2009, 4, 83–97. Available online: https://www.osti.gov/etdeweb/biblio/22122516 (accessed on 11 February 2021).


| Property | GDL | Membrane | Bipolar Plate | CL |
|---|---|---|---|---|
| Material | Carbon Paper | Nafion ® | Carbon Graphite | CCM |
| Width (mm) | 3 | 3 | Channel = 1 m Two ribs = 1 mm each | 3 |
| Specific neat (J ) | 500 | 1050 | 750 | 1050 |
| Poisson’s Ratio | 0.25 | 0.25 | 0.25 | 0.25 |
| Expansion Coefficient () | ||||
| Density (kg/m3) | 400 | 2000 | 1800 | 2000 |
| Channel thickness (mm) with constant cross-sectional area of channel case | 0.26 | 0.24 | Thickness of plate: 3 mm | 0.03 |
| Channel thickness (mm) with constant height of channel case | 0.26 | 0.24 | Height = 1 mm Thickness of plate = 2 mm | 0.03 |
| a | b | c | |
|---|---|---|---|
| 25.84512 | 0.012987 | −3.9 × 10⁻⁶ | |
| 28.91404 | −0.0008400 | 2.01 × 10⁻⁶ | |
| 30.62644 | 0.009621 | 1.18 × 10⁻⁶ |
| Property | Value |
|---|---|
| Fuel | Hydrogen |
| Oxidant | Air |
| Temperature, T | 353.15 (80 °C) |
| Pressure, P | 3 atm |
| Cathode charge transfer coefficient, | 1 |
| Anode charge transfer coefficient, | 0.5 |
| Current loss, | 0.002 A/cm2 |
| Reference exchange current density, io | A/cm2 |
| Limiting current density, iL | 1.4 A/cm2 |
| Internal resistance, rj | 0.15 Ohm.cm2 |
Publisher’s Note: MDPI stays neutral with regard to jurisdictional claims in published maps and institutional affiliations. |
© 2021 by the authors. Licensee MDPI, Basel, Switzerland. This article is an open access article distributed under the terms and conditions of the Creative Commons Attribution (CC BY) license (https://creativecommons.org/licenses/by/4.0/).
Share and Cite
AL-bonsrulah, H.A.Z.; Alshukri, M.J.; Alsabery, A.I.; Hashim, I. Numerical and Theoretical Study of Performance and Mechanical Behavior of PEM-FC Using Innovative Channel Geometrical Configurations. Appl. Sci. 2021, 11, 5597. https://0-doi-org.brum.beds.ac.uk/10.3390/app11125597
AL-bonsrulah HAZ, Alshukri MJ, Alsabery AI, Hashim I. Numerical and Theoretical Study of Performance and Mechanical Behavior of PEM-FC Using Innovative Channel Geometrical Configurations. Applied Sciences. 2021; 11(12):5597. https://0-doi-org.brum.beds.ac.uk/10.3390/app11125597
Chicago/Turabian StyleAL-bonsrulah, Hussein A. Z., Mohammed J. Alshukri, Ammar I. Alsabery, and Ishak Hashim. 2021. "Numerical and Theoretical Study of Performance and Mechanical Behavior of PEM-FC Using Innovative Channel Geometrical Configurations" Applied Sciences 11, no. 12: 5597. https://0-doi-org.brum.beds.ac.uk/10.3390/app11125597