Article

Exploitation and Valorization of Agro-Food Wastes from Grape Harvesting: Production, Characterization of MAE-Extracts from Vitis vinifera Leaves and Stabilization in Microparticulate Powder Form

by
Tiziana Esposito
1,2,†,
Marina Paolucci
3,4,†,
Francesca Sansone
1,2,*,
Teresa Mencherini
1,2,
Severina Pacifico
4 and
Maria Grazia Volpe
5,*
1
Department of Pharmacy, University of Salerno, Via Giovanni Paolo II, 132, 84084 Fisciano, SA, Italy
2
Unesco Chair Salerno, Plantae Medicinales Mediterraneae, University of Salerno, 84084 Fisciano, SA, Italy
3
Department of Science and Technologies, University of Sannio, Via Port’Arsa, 11, 82100 Benevento, Italy
4
Institute of Food Sciences (ISA), National Research Council of Italy (CNR), Via Roma, 64, 83100 Avellino, Italy
5
Department of Environmental Biological and Pharmaceutical Sciences and Technologies, University of Campania “Luigi Vanvitelli”, Via Vivaldi, 43, 81100 Caserta, Italy
*
Authors to whom correspondence should be addressed.
Both these authors contributed equally to this work.
Submission received: 27 May 2021 / Revised: 16 June 2021 / Accepted: 17 June 2021 / Published: 23 June 2021
(This article belongs to the Special Issue Advanced Microencapsulation in Food Science)

Abstract

:

Featured Application

The technological approach can help the health industry access new upcycled plant extracts that the industry could not access before because of the poor sensoriality or difficulty of use, with great sustainability profiles that consumers value very much. The obtained ingredient is stable both under process and harsh storage conditions, is readily water-soluble and easy handling, demonstrating versatility for multiple applications in various industries from cosmetic to nutrition and much more.

Abstract

Grape harvesting generates a high amount of wastes, mostly leaves, which represent an economic and ecological problem for farmers. New products can be generated through these wastes, giving environmental, social, and economic advantages while also meeting the industry demand for novel natural ingredients. In this study, aqueous leaf-extracts from two cultivars of Vitis vinifera Aglianico (Agl) and Greco di Tufo (Gre) were produced by microwave-assisted extraction (MAE) and evaluated in composition by ATR- FTIR and HPLC to identify the main phenolic compounds, especially quercetin and kaempferol. The results showed that leaves extracts confirm to be a potential source of phenolic compounds. Dry extracts, although highly functional, show critical handling characteristics, being sticky and unstable in normal post-processing conditions. A stable and easy handling microparticulate ingredient was produced by spray drying containing the most phenolic-rich obtained extract (AGL-28). The microparticle powder form based on pectin/maltodextrin matrix was produced with high process efficiency. The microstructures were able to confer functional and chemical stability to the extract while also showing good technological characteristics (high water dissolution rate and flow properties), transforming the extract into a handling ingredient able to meet new industrial uses.

1. Introduction

Every year, tons of agricultural waste are produced in the world. Agricultural wastes are rich sources of bioactive compounds or phytochemicals such as phenolic compounds, the largest classes of bioactive compounds with diverse and important biological functions [1]. As matter of fact, food “waste” is the new up and coming commodity and trend in the health industry. Technological innovation, with a view to reusing resources, acts for the healthy industry as a sort of catalyst to improve products quality, and business models as it fits with the circular economy concept. One of the purposes of the circular economy is to reduce the processing waste within a production cycle [2]. The Directive (EU) 2018/851 of the European Parliament, represents a clear guideline regarding the production and management of agri-food waste.
A rational use of natural resources should reduce wastes, improve the quality of the environment, and provide social benefits also through local supply chains. A key work objective is the valorization of products from the agro-industry sector through recovery and reuse of active principles from the waste material through technological models and processes for obtaining natural-derived health products.
Most modern citizens maintain their wellbeing with the assumption of synthetic chemical-based supplements because of the preference for products with a longer shelf life and fast effectiveness [3]. Therefore, there is an opportunity to capture this market through the formulation of a stable natural-based supplement to promote health.
Generally, the grape harvesting generates a high number of wastes, mostly leaves, which represent an economic and ecological problem for farmers. Thus, the objects of this study were the extraction and the characterization of Vitis vinifera leaf bioactive molecules and their transformation in microparticles powder form to improve extracts usability also protecting their antioxidant properties during shelf-life.
The cultivation of citrus, olives, and grape are the most common agricultural activities of Mediterranean areas, which produce tons of waste, whose disposal has serious economic and environmental consequences. In 2018, total wine production in Italy has increased by 23–24%, reaching 54.2 million hectoliters, a huge jump compared to 43.8 million in 2017 and the historical average (2008–2017) of 44 million hectoliters (ISTAT, National Institute of Statistics). Other than grape marc, the traditional grape waste, vine leaf is another waste from the pruning phase. Even though the total concentration of phenolic compounds is higher in grape seeds and skin, vine leaf is an important source of phenolic compounds [4]. Although today vine leaf is used exclusively in the culinary field, scientific studies have underlined that bioactive molecules could be obtained with potential applications in different sectors, such as pharmaceutical and cosmetic [5,6].
Vitis vinifera leaf vegetable matrix represents a waste of the agricultural chain, both during the grape harvesting phase and during the vine pruning phases, necessary for the welfare of the plant and the production of the fruits. With the aim to produce phyto-extracts from the territorial plant matrix of waste, their characterization, and subsequent transformation into functional ingredients with high added value, after the harvesting of the leaves deriving from the pruning of the vine (V. vinifera L., varieties Aglianico and Greco di Tufo), which occurred at different times of the year (October and November), these were subjected to extraction processes using a microwave-assisted technique (MAE). Microwave-assisted extraction (MAE) is a rapid and efficient extraction technique. Several comparative studies have demonstrated the excellent performances, in terms of recovery and precision, obtainable with MAE compared to other traditional extraction techniques (for example extraction with Soxhlet) and its superiority in terms of reduction of solvent consumption and extraction time [7,8]. For example, conventional Soxhlet extraction usually requires long extraction times leading also to thermal degradation of phytoconstituents. During MAE process, the internal pressure of the sample is increased by microwaves in a few minutes with the effect of enhanced extraction efficiency and reduce the deterioration of phenolic compounds [9]. The post-extraction analytical characterization was performed by ATR- FTIR and HPLC, above all to identify the main phenolic compounds, especially quercetin and kaempferol, notoriously characteristic of this plant species [10]. These tandem processing procedures led to evaluate the dependence of phenolic content with respect to both the harvesting time and Aglianico and Greco di Tufo varieties.
The obtained phyto-extracts can be used in fluid form to functionalize healthy products having a liquid phase such as hydrogels, topical emulsions [11] and liquid oral dosage forms (i.e., elixirs, syrups or poisons). Additionally, they can be commonly transformed into dry extracts via various technological approaches such as evaporation, lyophilization or spray drying because of their physical, chemical, and microbiological stability, better standardization, higher concentration of active ingredients and compounds. In all the cases, the process of extracts treatment should aim at obtaining a product which attends market requirements as well as provide efficacy, safety, and quality.
The removal of solvents by evaporation leads to obtain a sticky dry extract that is difficult both to recover from evaporator flasks and incorporate into dosage forms. On the other hand, the lyophilization is particularly expensive tool, also producing a highly hygroscopic powder that must be stored under controlled temperature and humidity conditions; it provides special storage containers and does not guarantee the stability of the product after opening [12].
In the pharmaceutical industry, the use of suitable technological adjuvants along with the technology of spray drying represents an important step in the assurance of adequate stability and quality of plant extracts [13]. Natural extracts present critical physical and organoleptic characteristics that are not compatible with food, food supplements, cosmetics, or health products in general [14,15]. The incorporation of these dry extracts in spry-dried formulations is recommended because they are easily obtained, standardized, industrially scalable and embeddable in dosage forms.
The spray drying technique is a one-step processing operation for turning a liquid feed into a powder product and it can be used as a microencapsulation tool by introducing into the liquid feed, particular carriers as loading/coating agents [16,17]. Common carriers for this encapsulation process include carbohydrates, gums, and cellulose esters. Combinations of carriers are also used to provide stability and high technological characteristics (i.e., size, flowability, water up-take) to particular feed materials such as herbal natural extracts [18,19].
In a previous work, a combination of maltodextrins (M) and pectins (P), was developed as a tandem-polymeric matrix by spray-drying to encapsulate dried herbal extracts [15]. The excellent obtained results led us to apply the same approach to wine leaves extract (Aglianico variety) with the aim to enhance both the usability and stability also verifying the versatility of the spry drying microencapsulation process. The obtained powder was characterized in term of chemical-physical and enhanced technological characteristics. Results report the feasibility of a transformation process within a production flow-chart from the recovery, through the extraction, to the final product.

2. Materials and Methods

2.1. Standards and Reagents

All reagents and solvents were of analytical or HPLC grade. Standards used for identification were gallic acid, caffeic acid, vanillic acid, rutin, kaempferol, quercetin, Trolox, (Sigma-Aldrich, St. Louis, MI, USA). The radical 1,1- diphenyl-2-picrilhydrazilic (DPPH), 2,20-azino-bis (3-ethyl benzothiazoline)-6-sulfonic acid (ABTS), Highly esterificated (DE degree of esterification 70–75%) pectin from apple (PEC) were obtained by Sigma-Aldrich, St. Louis, MI, USA. Maltodextrins (DE dextran equivalents 16, MDX) has been acquired from ACEF s.p.a. (Piacenza, Italy).

2.2. Plant Materials

The leaves of two V. vinifera varieties, one red (‘Aglianico’) and one white (‘Greco di Tufo’), were collected in Irpinia (Campania Region, Italy) after the grape harvest (October and November 2018). Collected leaves were bagged and taken to the laboratory, where they were air-dried to constant weight and then ground using an electric grinder (mod. CBG5 series, Black and Decker Canada Inc., Brockville, ON, Canada). The ground powder was passed through a sieve of 250 µm, collected in airtight bags, and stored at −20 °C until further use.

2.3. Microwave-Assisted Extraction (MAE)

Phyto-chemicals from V. vinifera (Aglianico and Greco di Tufo) leaf powder were extracted using a microwave oven system (Samsung SmartOven MC28H5015AK/ET). One gram of powder for each variety was poured in polytetrafluoroethylene (PTFE) closed vessels (Teflon) with solvent at RT. The MAE extraction parameters were microwave power (180–300 W), extraction time (2–5 min), solid-to-liquid ratio (1:10). Different solvents (ethanol (EtOH), methanol (MeOH), and water (H2O)) in different proportions were used. Extraction parameters and solvents are summarized in Table 1. Each trial was carried out in triplicate. After MAE treatment, the extracts were centrifuged at 4500 rpm at 20 °C, for 20 min, filtered through a 45 μm filter, and stored at −80 °C until further use.

2.4. Total Polyphenol Content (TPC)

The total phenolic content in the extracts was determined by the Folin–Ciocalteu method [20]. The calibration curve was constructed using quercetin. The absorbance was monitored at 765 nm. The assay was carried out in triplicate.

2.5. Acquisition of Attenuated Total Reflectance-Fourier Transform Infrared Spectroscopy (ATR-FTIR) Spectra

The ATR-FTIR analysis was carried out using a Spectrum 400 spectrophotometer (PerkinElmer, Waltham, MA, USA), equipped with a DTGS (deuterated tri-glycine sulfate) detector, as reported in [21], with some modifications. Briefly, 1 µL of the liquid sample was placed directly on the surface of the germanium crystal and dried under room temperature (about 20 °C) within 10 min, or until the recorded spectrum was stabilized. The crystal surface was cleaned after each spectral collection using 0.1% (w/v) Alconox solution (Alconox Inc., New York, NY, USA). The ATR-FTIR spectra were recorded at resolutions of 4 cm−1 with 32 scans in the mid-IR region (4000–650 cm−1). Eight samples for each extract were analyzed in triplicate.

2.6. HPLC Analysis

The identification and quantification of the main phenolic compounds present in each extract were obtained by HPLC-UV analysis. The analysis was performed by LC-4000 Series Integrated HPLC Systems (Jasco Europe s.r.l., Via Luigi Cadorna 123894 Cremella, Italy) consisting of a column oven (model CO-2060 plus), a UV/Vis photodiode array detector (model MD-2018 plus), an intelligent fluorescence detector (model PF-2020 plus), a liquid chromatography pump (model PU-2089 plus), an autosampler (AS-2059 plus) and a ChromNAV software program (Jasco Europe s.r.l., Via Luigi Cadorna 123894 Cremella, Italy). A C18 Luna column 5-μm particle size, 25 cm × 3.00 mm ID (Phenomenex, Torrance, CA, USA) was used. The mobile phase was water with 0.5% formic acid (v/v) (solvent A) and HPLC grade methanol (solvent B). The linear gradient started with 5% B in A to reach 20% B in A at 5 min, 25% B in A at 45 min, 45% B in A at 47 min, 55% B in A at 57 min, and 80% B in A at 67 min. The flow rate was 0.8 mL min−1 and the injection volume of the sample was 20 μL. Each compound was identified by comparing its retention time with pure commercial standards under the same conditions and literature data.

2.7. Microencapsulation Process: Liquid Feed Preparation and Spray-Drying Conditions

A previously studied polymeric matrix [15] was used to encapsulate the leaf extract AGL-28 (which derived from an aqueous process extraction of November harvesting leaves, also showing the highest polyphenol content. Maltodextrin 16 DE (M), used in a range between 5% w/v to 9.5% w/v, was dissolved in 100 mL of water. 0.2%, 0.3%, or 0.4% w/v pectin (P) was separately dissolved in 100 mL of water and added, slowly, to the M solution. Finally, the MP aqueous dispersion was added to 0.5g w/v of V. vinifera Aglianico leaf extract (AGL-28), to obtain different liquid feeds (MPA). All were processed by spray-drying technique (Büchi Mini Spray Dryer B-290, BÜCHI Labortechnik AG, Flawil, Switzerland) under the following experimental conditions: Ø nozzle 0.7 mm, air pressure 6.5 bar, inlet/outlet temperatures 125/85 °C, drying airflow 500–600 L/h, aspirator 100% and spray flow feed rate of 3.3 mL/min. As a reference, MP liquid feeds without the extract were processed in the same conditions to obtain blank powders. All the batches were produced in triplicate, and the obtained powders were stored for 48 h before further experiments.

2.8. Powder Characterization

2.8.1. Production Yield and Encapsulation Efficiency

The production yield was gravimetrically determined (balance crystal 100 CAL-Gibertini) and expressed as a weight percentage of the final product to the total content of the processed material.
The theoretical extract content (TEC) was calculated as the percentage of extract (AGL-28) content compared to the initial total amount of all feed components before spray-drying (Equation (1))
T E C % = w e i g h t   o f   A G L 28   f e d   i n i t i a l l y w e i g h t   o f   a l l   f e e d   c o m p o n e n t s 100
The actual active content (AAC) of the unprocessed extract AGL-28 and spray-dried microparticles MPA was determined by UV method, and expressed as quercetin content percentage to 100 mg of powder.
The actual extract content (AEC) was derived by AAC of MPA and AGL-28 and calculated as (Equation (2)):
A E C % = A A C   M P A A A C   A G L 28 100
The encapsulation efficiency (EE%), is calculated as the ratio between the actual extract content and the theoretical extract content as follows [22] (Equation (3)):
E E % = A E C % T E C % 100

2.8.2. Quantitative Analysis

The extract-content of the spray-dried powder (MPA) was determined by using UV-measurement (UV/Vis spectrometer Lambda 25, Perkin Elmer Instruments, Waltham, MA, USA), using quercetin as standard, at λ 372 nm. To obtain the calibration curve quercetin was dissolved in MeOH in a concentration range of 25–200 mg/L; the interpolation of mean absorbance was used as a function of concentrations (y = 7.1407x − 0.0078, R2 > 0.9995).

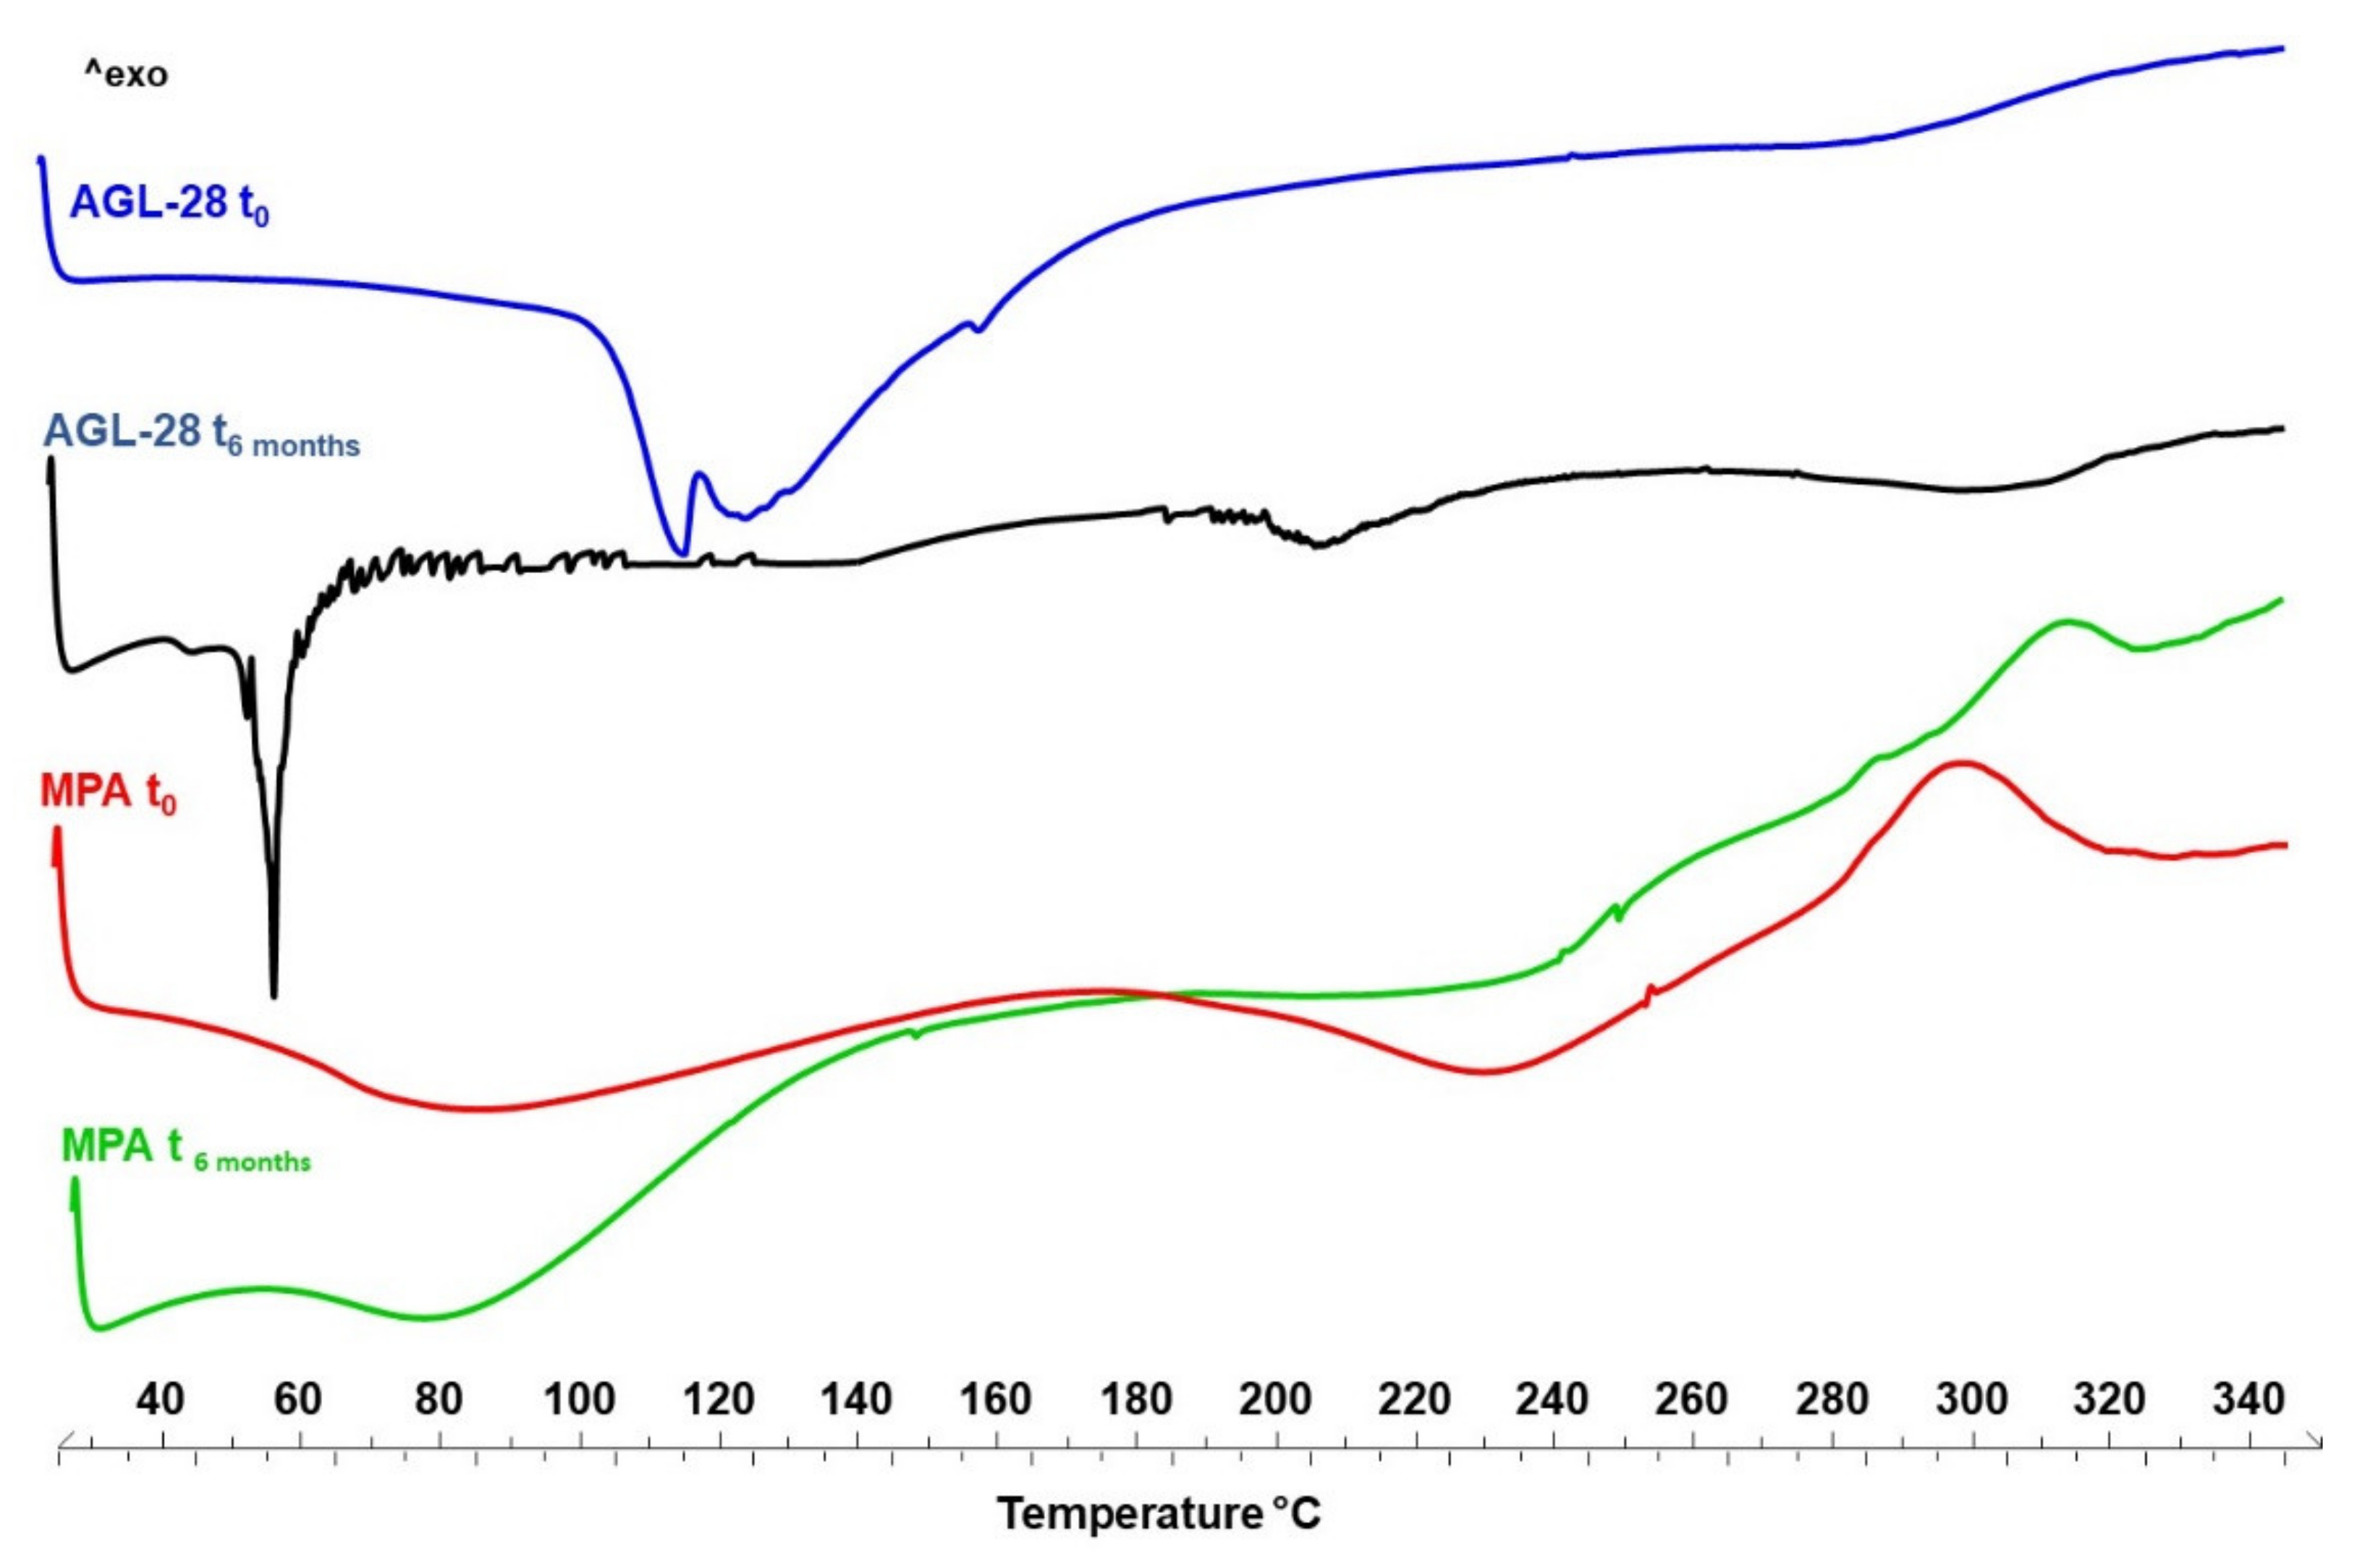
2.8.3. Differential Scanning Calorimetry (DSC)

Differential scanning calorimetry (DSC) is a thermal analysis technique that looks at the thermal transitions of the material; the heat flow is measured as a function of temperature as a sample is heated or cooled. A sample of known mass is heated and the changes in its heat capacity are tracked as changes in the heat flow. This allows the detection transitions in materials.
Experiments were performed on an indium calibrated Mettler Toledo DSC 822e (Mettler Toledo, OH, USA). All the samples were carefully weighed with an MTS Mettler Toledo (OH, USA) microbalance, in aluminum 40 μL crucible, pierced lid. The samples were heated up from 25 to 350 °C with a heating rate of 10 °C/min under a nitrogen atmosphere at 50 mL/min flow rate.

2.8.4. Dimensional Distribution (LLS)

A laser light scattering (LLS) granulometer (Beckman Counter LS 230, Particle Volume Module Plus, Brea, CA, USA) was used to investigate the dimensional distribution of all samples. 20 mg of each sample was suspended in 1 mL of 2-propanol dripping into the cell until the obscuration between 8% and 12%. The particle size distribution was calculated by applying the Fraunhofer model. The results are expressed as the volume diameter at the 50th percentile of the particle size distribution (d50,). The analyses were made in triplicate. The homogeneity in the distribution of the particle size has defined by the SPAN value:
SPAN value = d90 − d10/d50

2.8.5. Morphological Analysis of Materials

Scanning electron microscopy (SEM) was used to analyze the morphology of all powders produced, using a Carl Zeiss EVO MA 10 microscope with a secondary electron detector (Carl Zeiss SMT Ltd., Cambridge, UK) equipped with a LEICA EMSCD005 metallizator producing a deposition of a 200–400. The analysis was conducted at 20 KeV.

2.8.6. Powder Flowability Test

The bulk and tap densities of the powders were determined filling at volume a bottom-sealed plastic syringe (1 mL, Terumo Europe, Leuven, Belgium) and tapped until no change in the volume was observed. The bulk and tap densities values were calculated, respectively, from the ratio between the net weight of the plastic syringe content and the volume in the syringe before and after tapping [23]. Experiments were performed in triplicate. Compressibility index (CI) and Hausner ratio (HR) were calculated as follows:
C o m p r e s s i b i l i t y   I n d e x   C I = ρ t a p ρ b u l k   ρ t a p 100
H a u s m e r   r a t i o   H R = ρ t a p ρ b u l k
The flowability of the powders was compared to the accepted U.S. Pharmacopeia flowability scale (Table 2).

2.8.7. Dissolution/Release Test in Water

Dissolution/release tests were carried out according to the Farmacopea Ufficiale Italiana [24] for conventional oral dosage forms. The MPA spray-dried powder and AGL-28 raw extract total amount used for each dissolution test was 5.28 and 1.94 g, respectively. The samples were poured into 1000 mL of distilled water heated to 37 °C, using a SOTAX AT Smart Apparatus (Basel, Switzerland) dissolving apparatus equipped with paddles (50 rpm) and seven Pyrex vessels (1-L volume) online with the spectrophotometer (spectrometer Specord 200 plus Sotax powered by Analytik Jena, Jena, Germany). To six vessels were added 0.88 g MPA or 0.33 g AGL-28 for each one. The seventh vessel was the control (only water). Each test was conducted three times for six vessels, with 18 total performed tests and the mean values were graphically reported (standard deviations <5%). The amount of dissolved extract was measured as AAC (actual active content) value, expressed as quercetin equivalents, determined by the UV method and calculated as previously reported Section 2.8.1).

2.8.8. Free Radical Scavenging Activity

The free radical scavenging activity was evaluated by DPPH and TEAC assay. DPPH test was conducted dissolving MPA directly in water, in a range between 2 mg/mL to 0.5 mg/mL compared to the raw extract (AGL-28, tested from 0.5 to 80 μg/mL). The results were expressed as EC50 (average effective scavenger concentration) determined as the amount of the sample (in micrograms per milliliter) necessary to decrease the initial concentration of DPPH by 50%. All tests were performed three times. A high free radical scavenging activity was indicated by a low EC50. The TEAC assay was conducted as previously described [25], using a concentration of MPA 0.62 to 0.205 mg/mL, with respect to AGL-28 (range 0.082–0.0205 mg/mL). The results were expressed as the equivalent of Trolox (TE) mM/mg of extracts/MPA or mM of compounds. A high TEAC value corresponds to a high free radical scavenging activity.

2.8.9. Stability Study

Tapped glass vials (n = 3) containing 1 g of sample (AGL-28 or MPA) underwent accelerated stored conditions in a climatic chamber (climatic and thermostatic chamber, Mod. CCP37, AMT Srl, Milan, Italy) for six months, at 40 °C ± 2 °C with 75% RH ± 5% (Accelerated Stability Test, ICH guidelines). During the storage period, the solid-state (previously reported SEM and DSC analysis), chemical content (previously reported UV method), and antioxidant activity (see Section 2.8.8) of spray-dried powder (MPA) compared to the raw extract (AGL-28) were evaluated. Specifically, total phenol content and free radical scavenging activity were evaluated at time 0 and after six months, dissolving MPA directly in water. The Total Phenol Content was determined by Folin–Ciocalteu methods [11].

2.9. Statistical Analysis

The statistical analysis was carried out using GraphPad Prism version 7.00 for Windows, subjecting the results obtained to a one-way analysis of variance (ANOVA), followed by the Tukey HSD test.
ATR-FTIR spectra were analyzed by the software “Spectrum AssureID” (trademark of PerkinElmer, Inc. MA, USA ) Part Number 0993 4516 Release E; Publication Date July 2006; Software Version 4.x). The “Spectrum AssureID” uses the algorithm SIMCA (soft independent modeling class algorithm), as a chemometric approach to separate models (so-called disjointed class models or SIMCA hyperboxes) based on principal component analysis (PCA). Before the statistical analysis, spectra were baseline corrected and normalized, then the potential of the ATR-FTIR to differentiate the spectra of V. vinifera Aglianico and Greco DI Tufo extract were evaluated. The groups were: EtOH (ethanol extracted), MeOH: H2O (extracted with methanol: water 70:30), H2O (extracted with water). Eight samples for each group (EtOH, MeOH: H2O, and H2O) were analyzed. Each sample was analyzed in triplicate. For cluster analysis, the spectral ranges (I) 3000–2800, (II) 1750–1524, (III) 1523–1171 (IV) 11710–945, (V) 944–660, cm−1 were independently analyzed. The spectral ranges were arbitrarily chosen based on the ATR-FTIR profile. The performance of the developed SIMCA model was evaluated through the interclass distance between the groups, the three-dimensional principal component analysis, scores plot, and the recognition and rejection rates of the samples.

3. Results and Discussion

3.1. Microwave-Assisted Extraction

As extraction methods, Microwave-assisted extraction (MAE), interesting alternative to other methods with a lower time and solvent consumption [26], was chosen to produce functional extracts in a rapid and reproducible manner. As reported by Djemaa-Landri et al. [27], the extraction procedure (solvent, power, time, and liquid:solid ratio) was optimized comparing the obtained extracts in term of polyphenol content. MAE allows also to quickly verify the polyphenolic component in the leaves during ripening to select the richest matrices of polyphenolic component to be enhanced in a healthy ingredient.
The content of polyphenols in V. vinifera ‘Aglianico’ and ‘Greco di Tufo’ leaves is presented in Table 3. For all samples, the highest polyphenol concentrations were obtained with H2O as a solvent, followed by MeOH:H2O (70:30) and EtOH. MAE carried out at 300 W for 2 min. gave better results than at 180 W for 5 min. Both ‘Aglianico’ and ‘Greco di Tufo’ collected in November showed a higher polyphenol concentration with respect to ‘Aglianico’ and ‘Greco di Tufo’ collected in October. Microwave-assisted extraction (MAE) is a rapid and efficient extraction technique. Several comparative studies have demonstrated the excellent performances, in terms of recovery and precision, obtainable with MAE compared to other traditional extraction techniques (for example extraction with Soxhlet) and its superiority in terms of reduction of solvent consumption and extraction time [7,8,28]. For example, conventional Soxhlet extraction usually requires long extraction times leading also to thermal degradation of phytoconstituents. During MAE process, the internal pressure of the sample is increased by microwaves in a few minutes with the effect of enhanced extraction efficiency and reduce the deterioration of phenolic compounds [9,27].
The phenolic content of the extracts was quite dependent on the harvest-time, with both Aglianico and Greco di Tufo collected in November showing the highest concentration of total polyphenols (Table 3).
The total polyphenols content in ‘Aglianico’ and ‘Greco di Tufo’ was quite similar in the two cultivars at the same period of harvesting. Interestingly, Katalinik et al. [29] report that vine leaves extracts of six different varieties collected in September were the richest in total phenols, flavonoids, flavonols, and stilbenes, with respect to May and August collection, suggesting that leaves remaining on the vine after the harvest could be promising as an inexpensive source of antioxidants.

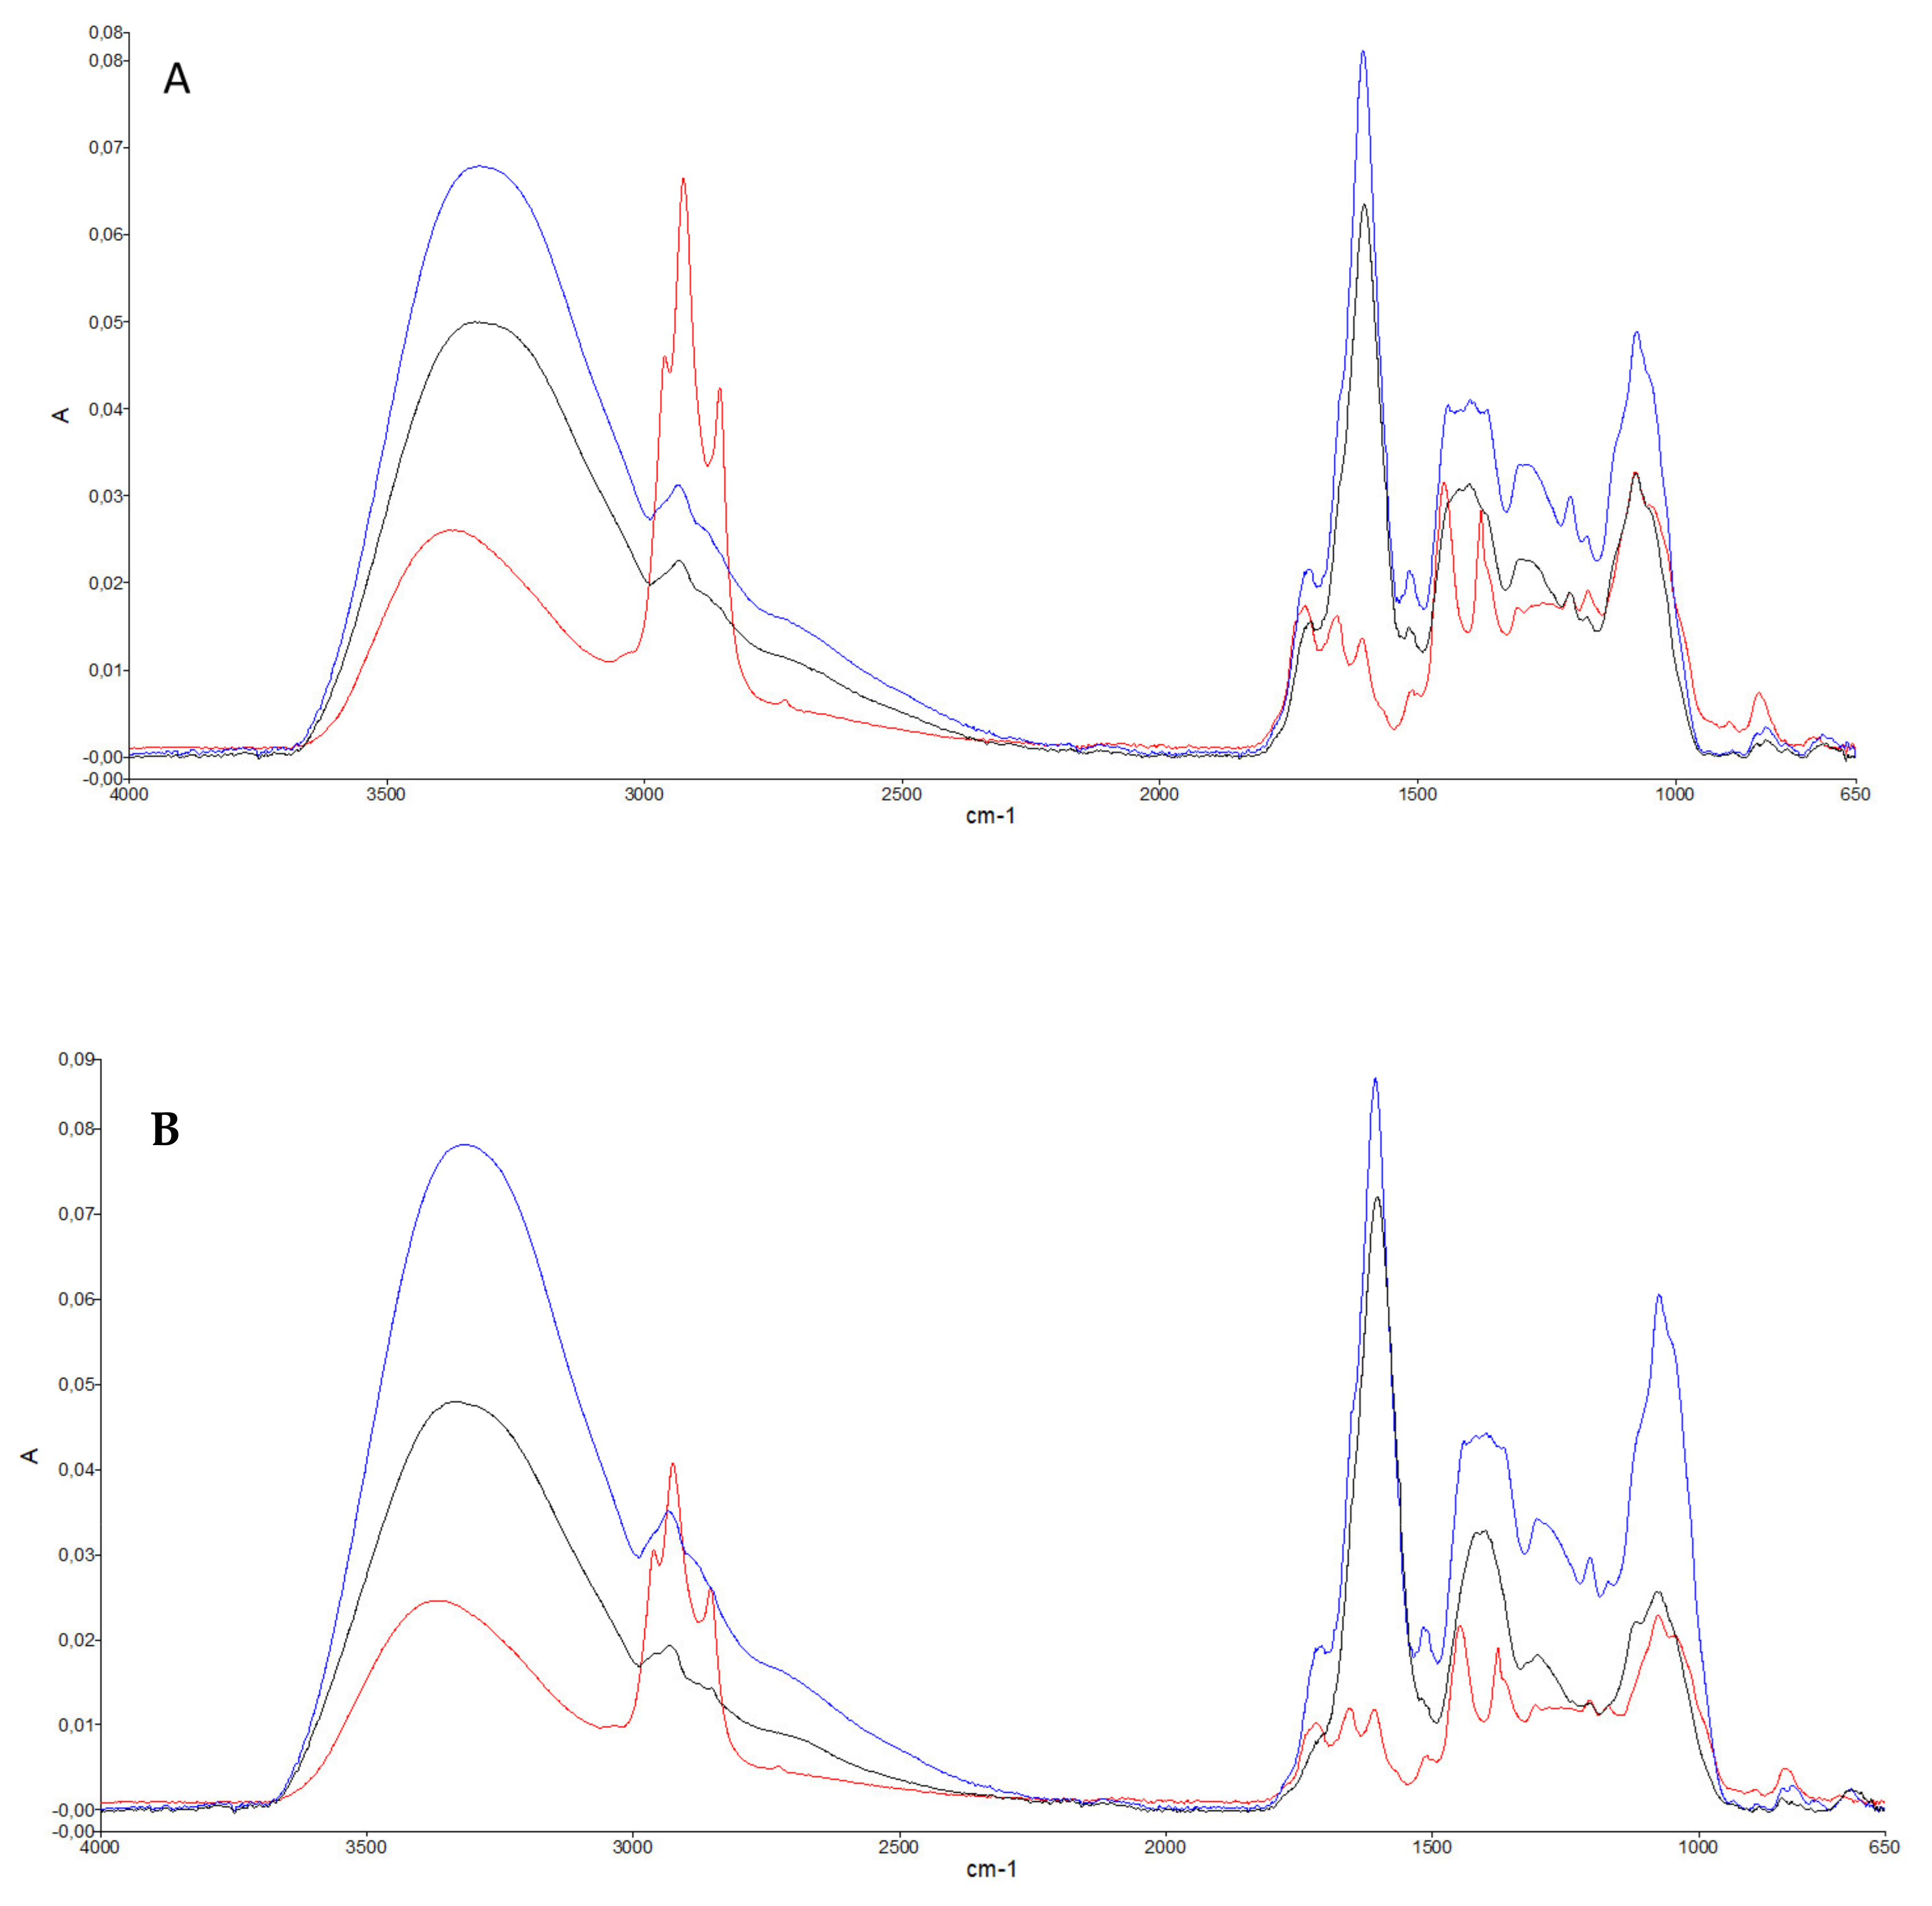
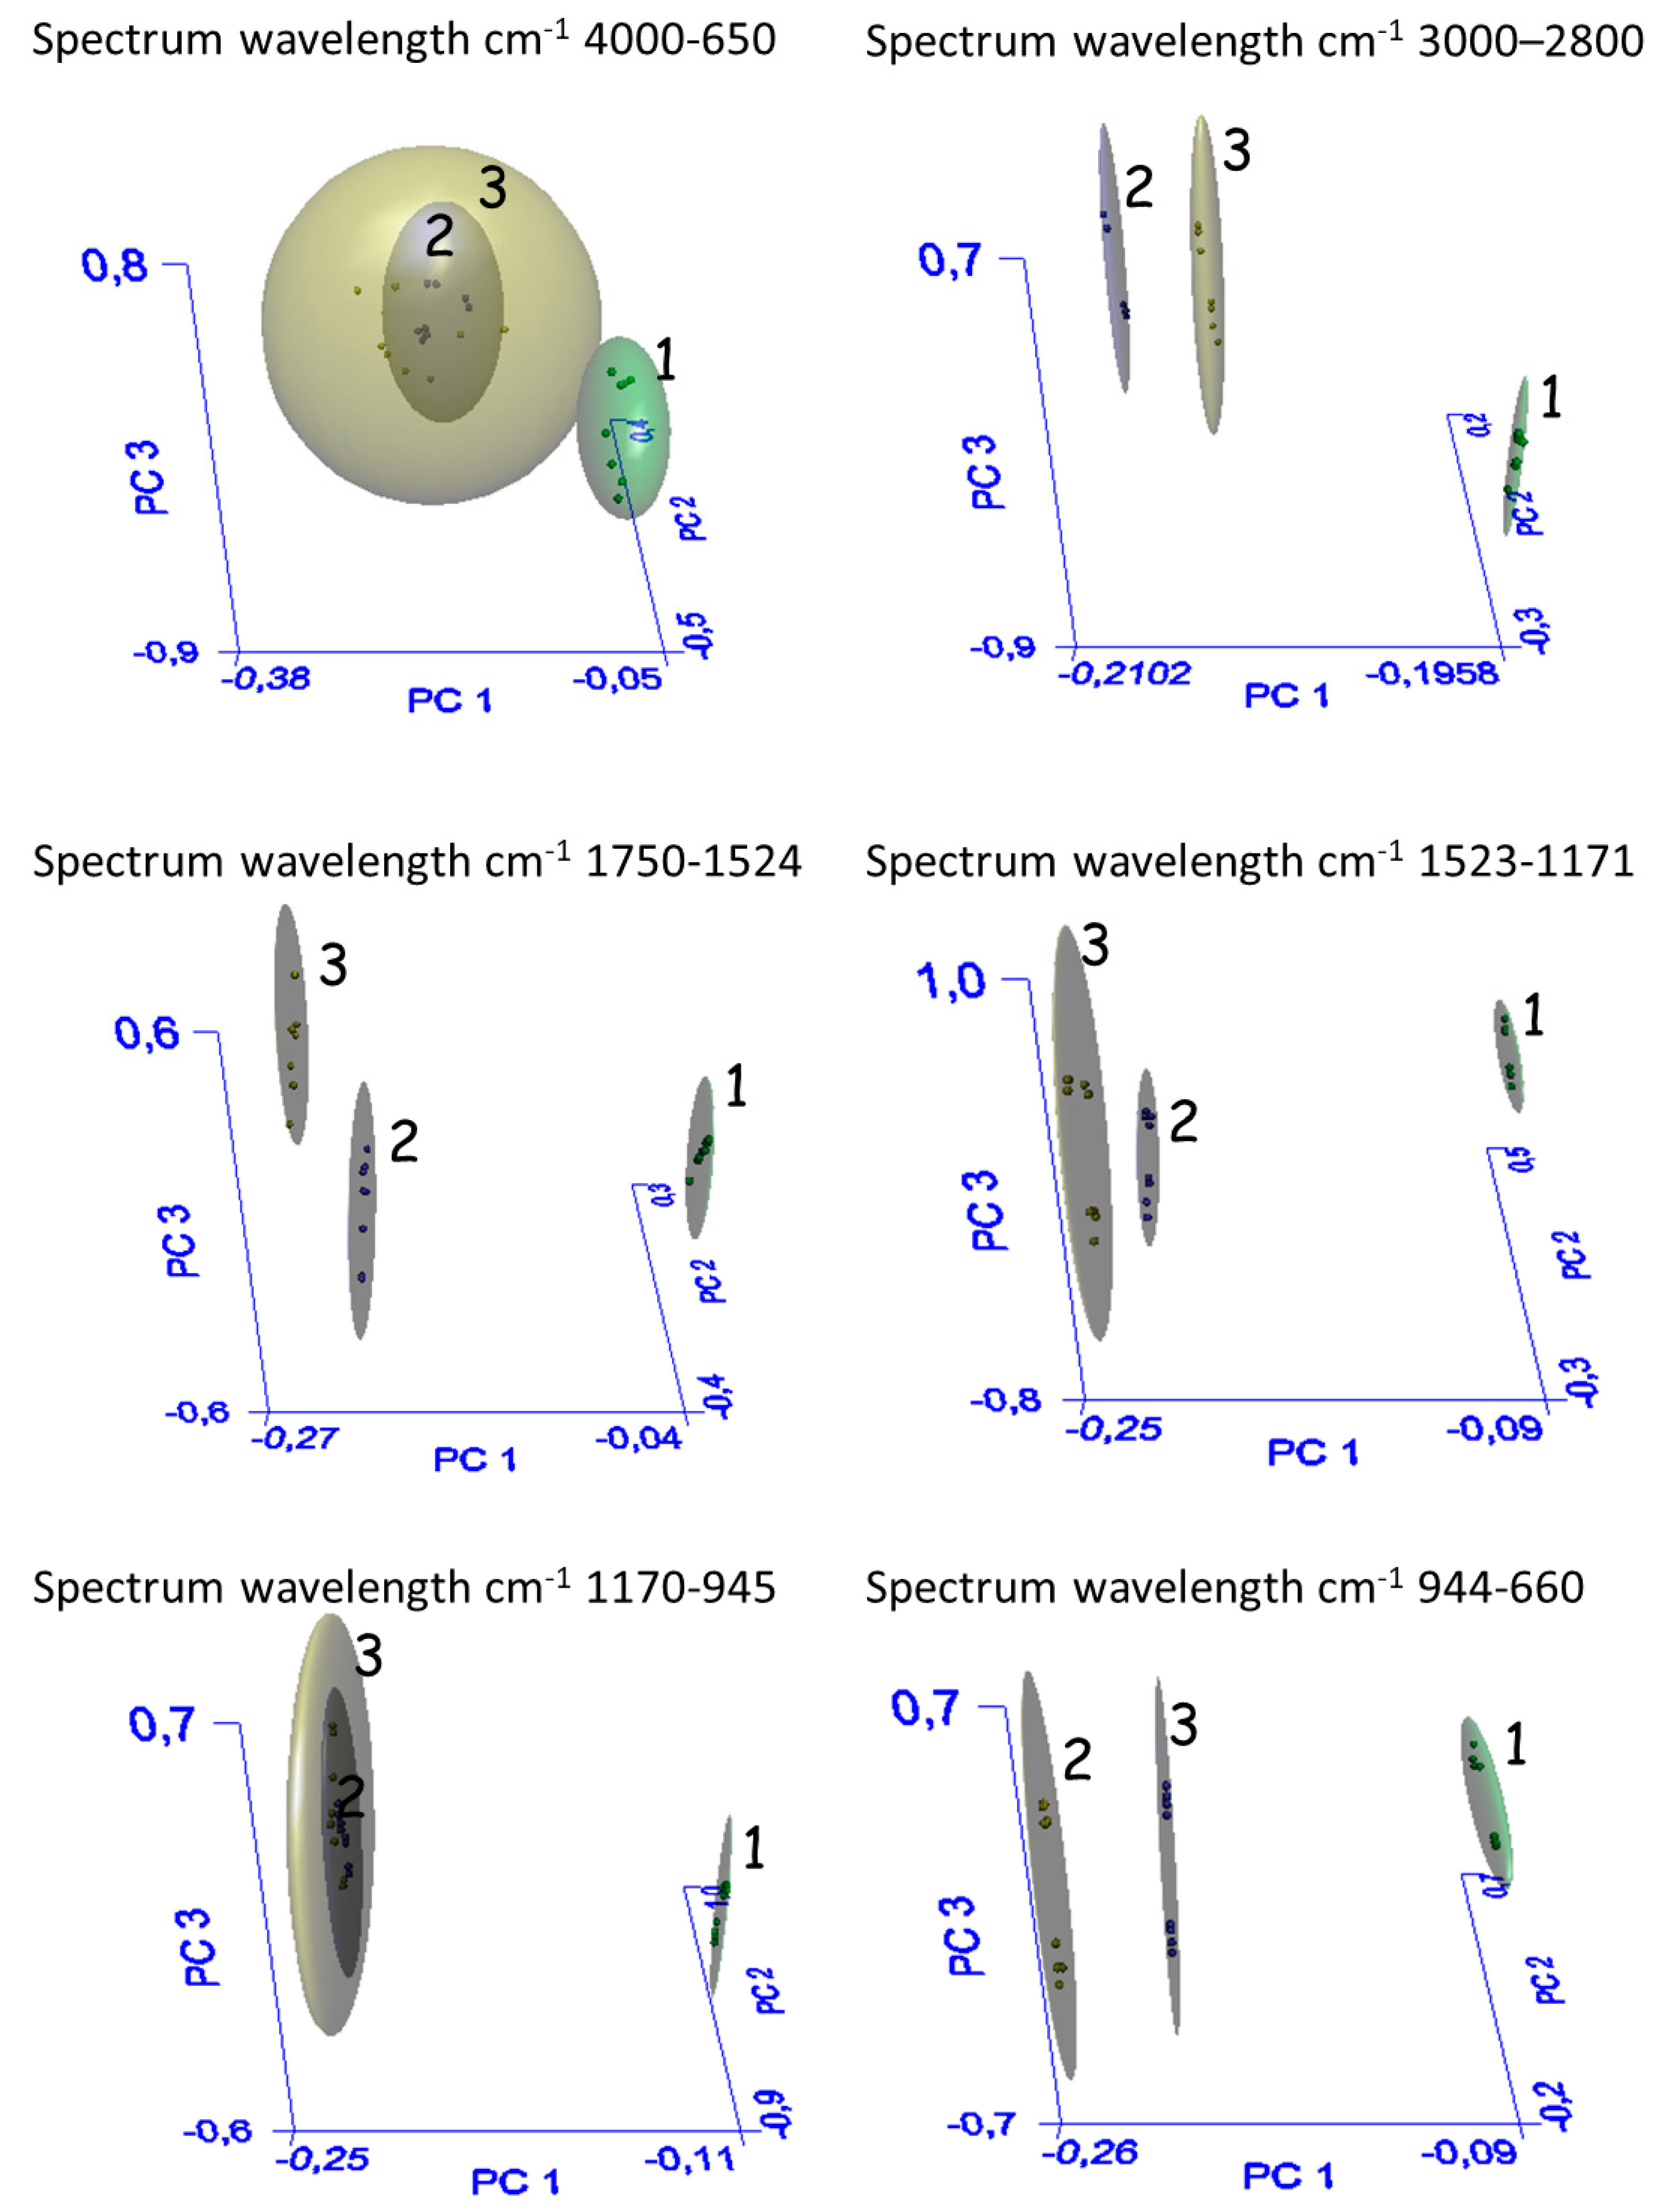
3.2. Spectroscopic Profile by ATR-FTIR

Figure 1 shows an example of the ATR–FTIR spectra of the Aglianico and Greco di Tufo leaf extracts of in the region of 4000–650 cm−1.
The spectrum contains several bands arising from the contribution of the vibrational mode of different functional groups. Vibrational mode and peak assignments are based on literature [30,31,32]. The bands reported in Table 4 are arbitrarily grouped in spectral ranges and analyzed by PCA statistical analysis (SIMCA). The broad peak present in all extracts around 3350–3320 cm−1 is due to hydroxyl groups (–OH) stretching and could derive from the -OH of the ethanol. However, we dried the sample so the interference should be minimized. It is worth noting that phenolic compounds are characterized by the presence of –OH that resonates in this area. Indeed, the strong absorption with a wide and strong band centered at 3350 cm−1 is assigned to the –OH and C–H, typical of the aromatic medium [33]. In the spectral range 3000–2800 cm−1 there are three peaks in the EtOH extract, that are absent in the MetOH:H2O (70:30) and H2O extracts. They are likely due to -CH2 and -CH3 of lipids. In the range, 1750 and 1524 cm−1, three well-resolved peaks can be seen in the ethanol extract (1721, 1655, and 1608 cm−1), while two peaks (1719–1720 and 1606 cm−1) are present in the methanol:water (70:30) and water extracts. The peak at 1720 cm−1 could be due to carboxylic acid structures (C=O) stretching vibrations. In the literature, the hydroxybenzoic and hydroxycinnamic acids show carboxylic acid structures (C=O) stretching vibrations in the 1715–1680 cm−1 region. Gallic acid (hydroxybenzoic acid) and caffeic acid (carboxylic acid) are both present in Greco di Tufo leaf extracts [34]. The aromatic ring with six carbon atoms has links (C=C) which generate bands between 1625 and 1430 cm−1 [35] and that in our case could correspond to the peak at 1608 cm−1 of the ethanol extract and the peak at 1606 cm−1 of the MetOH:H2O (70:30) and H2O extracts. Variations in the vibration frequencies of these bands have been reported by Abbas et al. (2017) [36] and could be due to the ortho-, meta-, and para- position of the substituents. The peak at 1655 cm−1 of the ethanolic extract most likely corresponds to chlorophyll [37].
The range 1475–1171 cm−1 is not highly resolved in the extracts with MeOH:H2O (70:30) and H2O, while it is best resolved with EtOH. This region is generally attributed to proteins, lipids, and nucleic acids. In this range, the ethanol allows a better discrimination MeOH:H2O (70:30) and H2O. The bands around 1263 cm−1 were attributed to Rutin (flavonol) by Kokalj Ladan et al. (2017) [38]. The region 1170–945 cm−1 comprises functional groups, mainly from carbohydrates. Peaks at about 1080 and 1050 cm−1 are assigned to mono- and polysaccharides [31,39]. Below 944 cm−1 there is the so-called fingerprint region that appears very similar in all extracts, with several peaks of variable intensities.
The outcomes of the statistical analysis of FTIR spectra are reported in Table 3 and Figure 2.
Significant interclass differences have been reported between the EtOH extract and the MeOH:H2O (70:30) and H2O extracts. PCA analysis used the SIMCA algorithm, according to which a large interclass distance among groups, indicates a good separation. A distance value lower than 3 is indicative that the samples are not well separated and hence belong to the same class [40]. Other important information concerns belonging to a class by a given sample. The recognition value of 100% means that all samples are correctly classified, while a rejection rate of less than 100% indicates that a percentage of samples cannot be attributed to any class. In this study, the rejection rate for selected regions of the spectrum gave a value lower of 100%, indicating that not all samples could be correctly classified (Table 5). This may be attributed to the complexity of the different molecules contributing to a source of variation which cannot be classified.
Significant interclass differences have been reported between Greco di Tufo leaves harvested in October and Greco di Tufo and Aglianico leaves harvested in November (Table 6).
Values reported in the Table 6 show that all samples were correctly recognized and in the case of significantly different samples (AN:GO) only one sample could not be correctly classified.

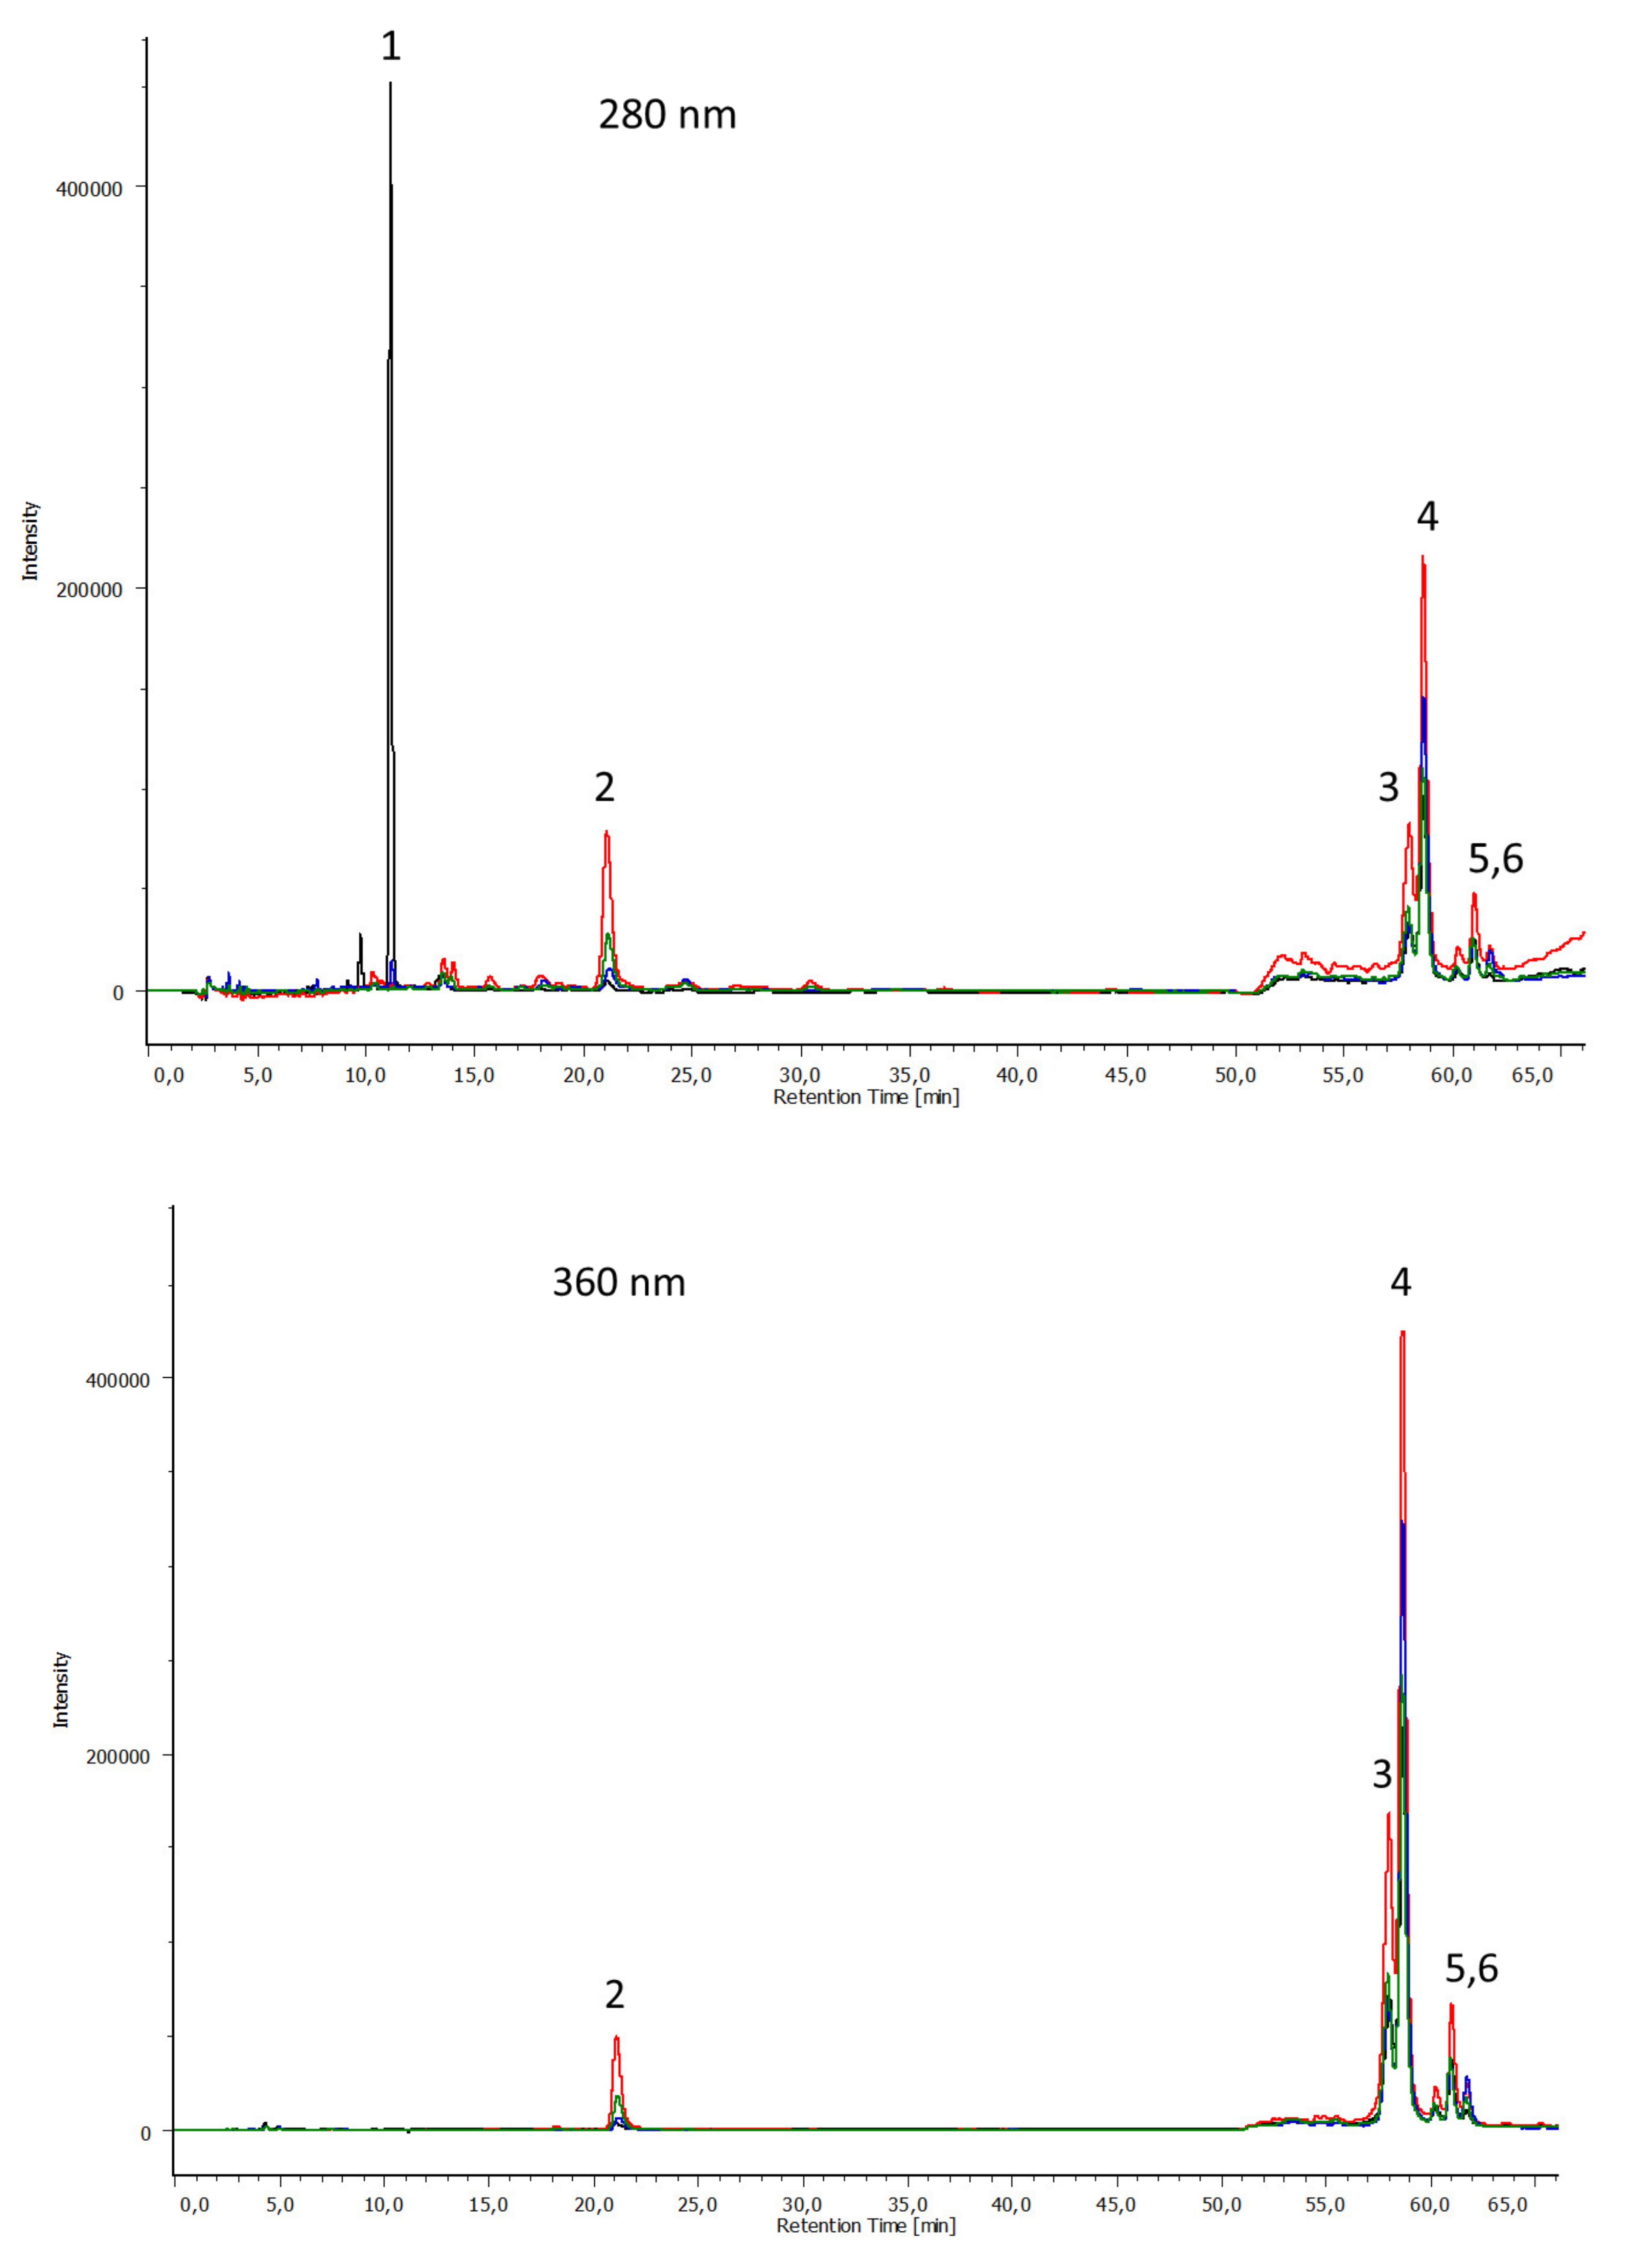
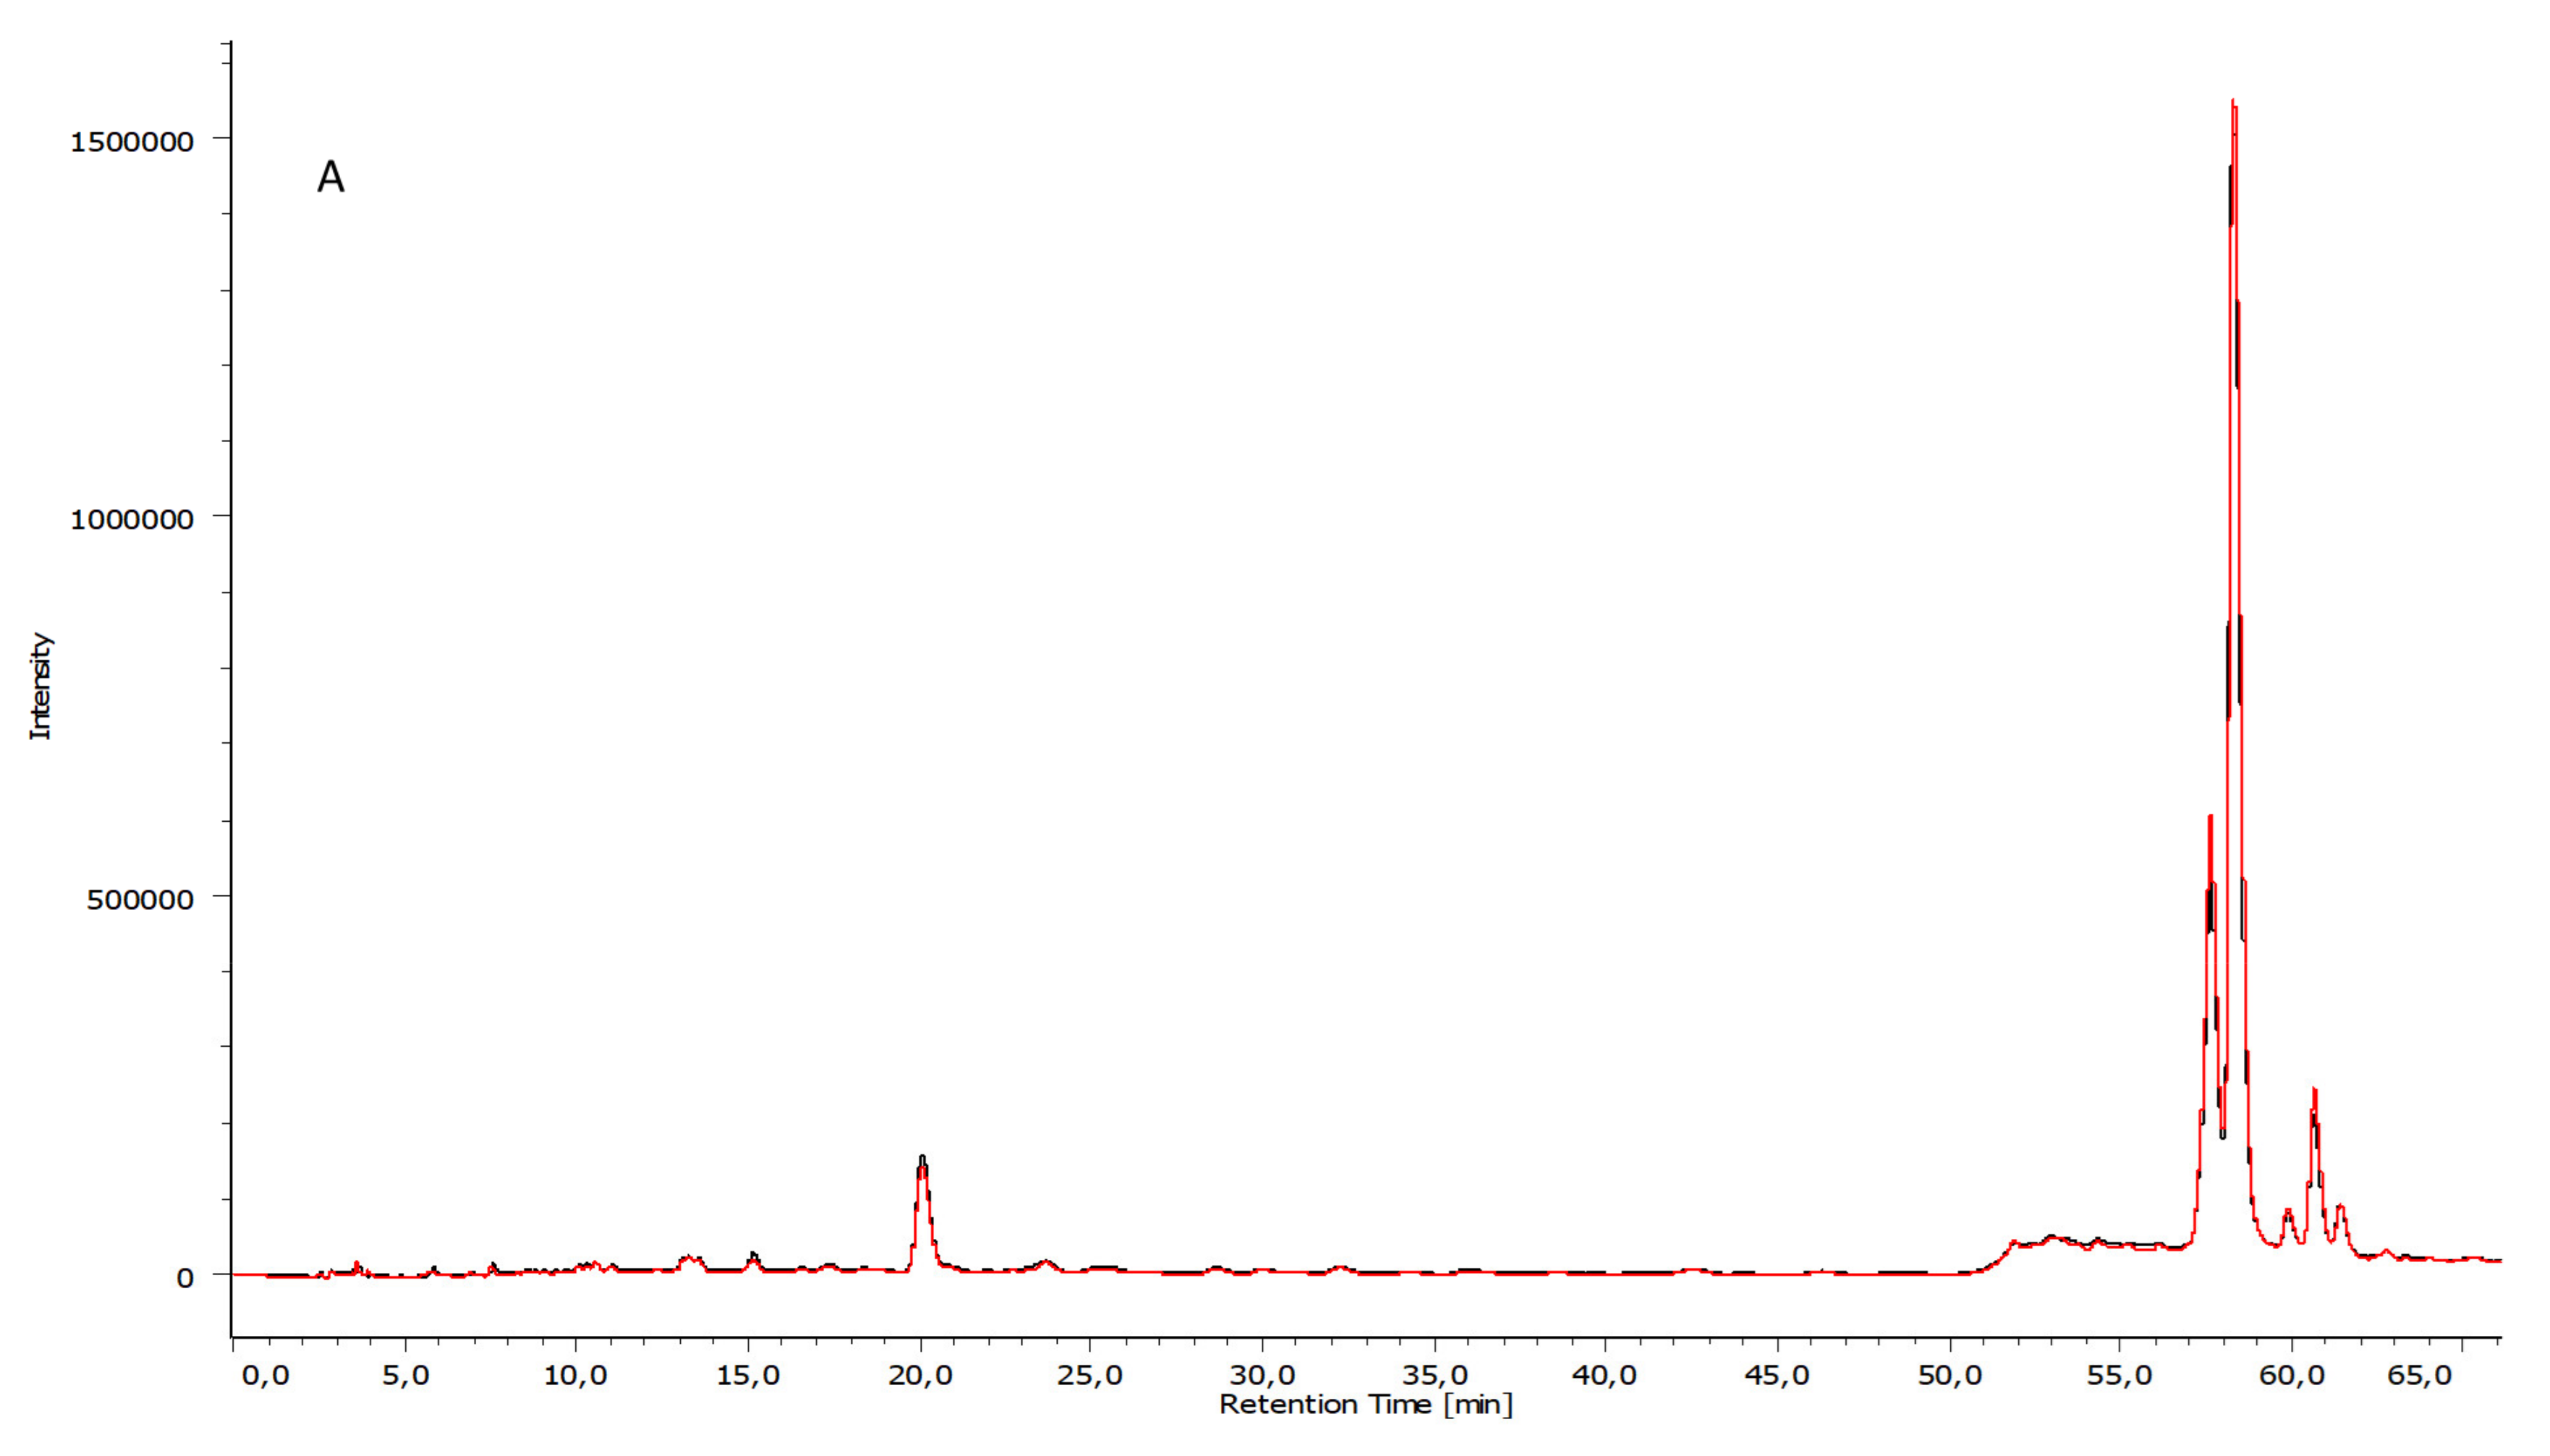
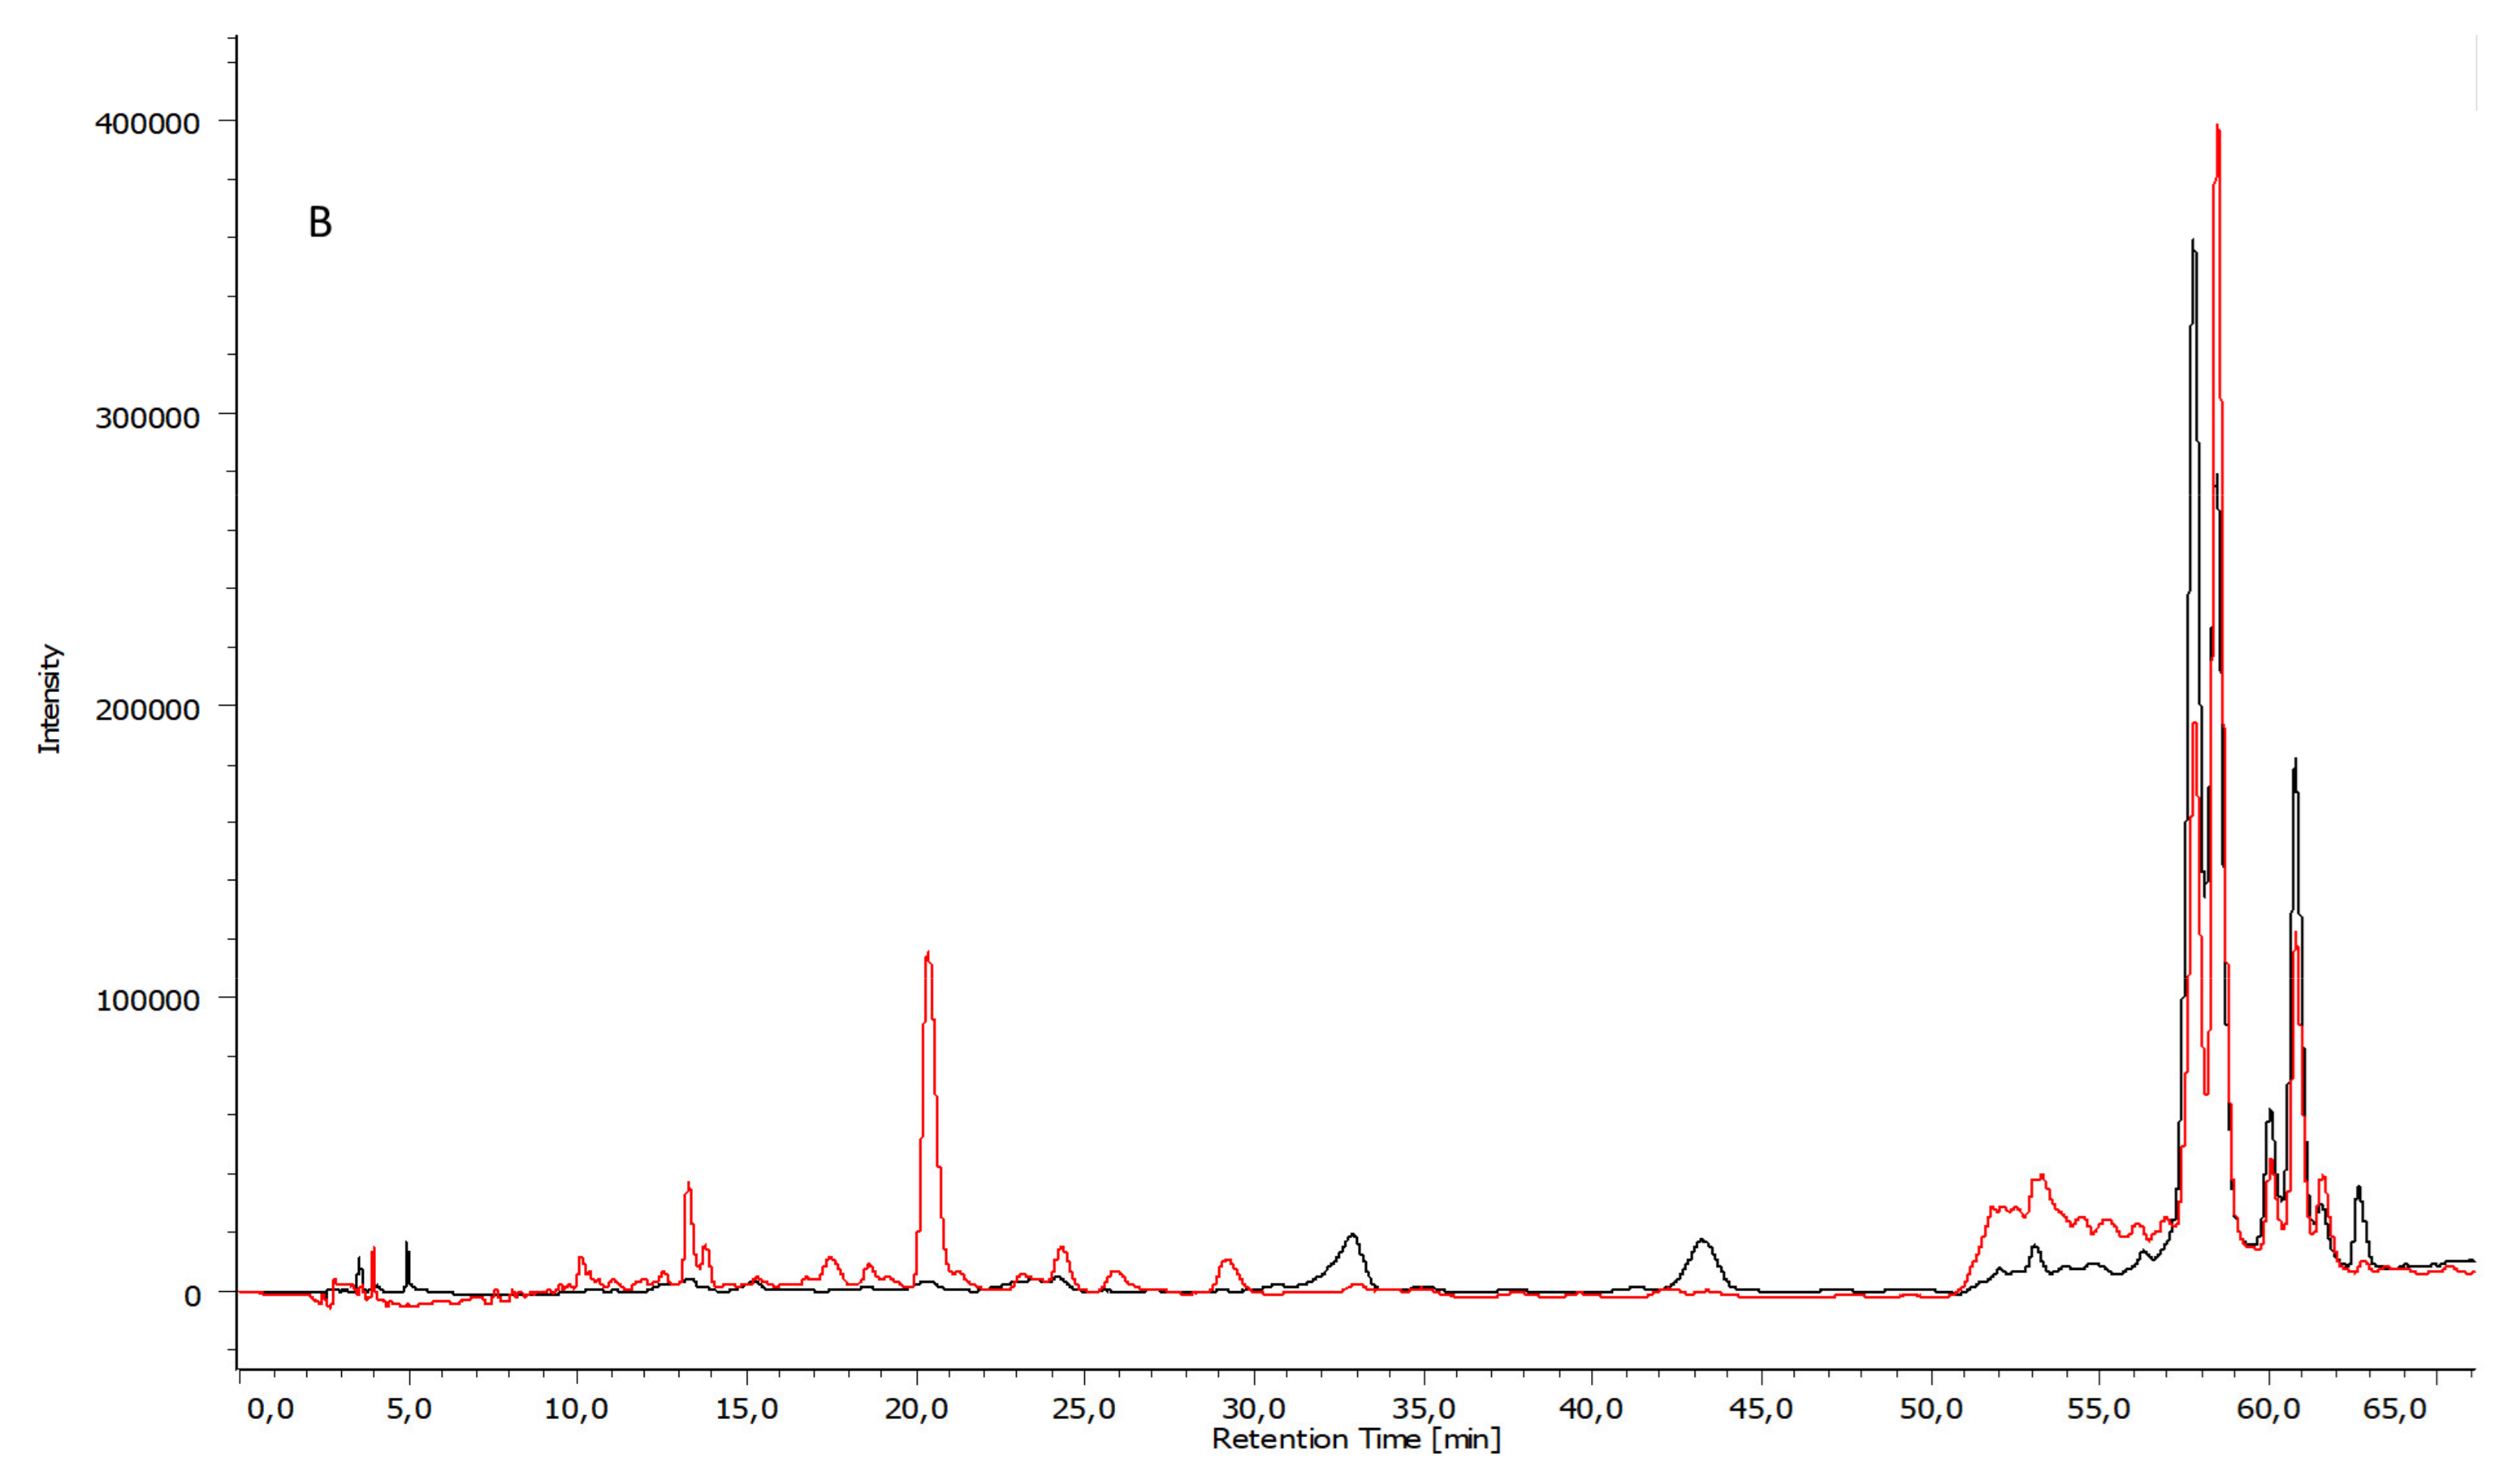
3.3. Chemical Composition by HPLC

Figure 3 reports the HPLC profiles representative of ‘Aglianico’ and ‘Greco di Tufo’ leaves collected in October and November extracted with MeOH:H2O (70:30), at the wavelengths of 280, and 360 nm.
The different absorption characteristics of the present compounds have been exploited to identify phenolic acids at 280 nm and flavonoids at 360 nm. Peak identification is based on standard analysis and literature data [34,41,42,43]. In all samples, the most abundant components are the pair quercetin-3-O-glucoside plus quercetin-3-O-galactoside as reported by Fernandes et al., 2013 [44]. Our results indicate that other than quercetin derivatives, also Kaempferol derivatives are the most abundant phenolic compounds, in agreement with studies by Katalinic et al. (2013) and Portu et al. (2015) [29,45] showing that quercetin and Kaempferol were the major phenolic compounds in the grape plant. V.vinifera is also characterized by the presence of quercetin glycosides [5]. Recently, quercetin glycosidic derivatives have been identified as the most abundant polyphenols in Greco di Tufo leaves [34]. The profiles of ‘Aglianico’ and ‘Greco di Tufo’ of October and ‘Aglianico’ and ‘Greco di Tufo’ of November are widely overlapping, except for a peak of Gallic acid, absent in ‘Aglianico’ leaves of November. As reported by Zeb (2015) [41], Gallic acid was found to give a maximum response at 280 nm rather than 360 nm. Overlapping profiles have been obtained for the Greco di Tufo of October and November.
The extraction was carried out with MeOH:H2O (70:30) and H2O gave similar HPLC profiles (Figure 4A). On the contrary, EtOH extraction gave a profile different from MeOH:H2O (70:30) and H2O, and there were differences in the ratio between the quercetin derivatives(Figure 4B). In conclusion, the extractions with MeOH:H2O (70:30) and H2O lead to overlapping profiles also in the intensity of the peaks, both in the ‘Aglianico’ and ‘Greco di Tufo’ leaves. In both varieties, the extraction with EtOH leads to different profiles compared to MetOH:H2O (70:30) and H2O.

3.4. Microencapsulation Process and Evaluation of Process Efficiency

V. vinifera leave extract represents a rich source of active compounds, but in its concentrated dried form, shows up as a sticky, poor-handling, unstable material negatively affecting its use as a functional ingredient, as well as, in its lyophilized form, if not properly stored, can quickly interact with the humidity of the surrounding environment, and give rise to serious instability phenomena. Thus, based on Sansone et al.’s 2011 study [15], maltodextrins (M) as loading carrier and pectin (P) as coating polymer have been selected to process as extract model the ‘Aglianico’ variety leaves aqueous extract (named AGL-28, obtained from leaves harvested in November using a microwave power of 300 W for 2 min, see Table 3) by spray-drying technique. Previously, a combination of maltodextrins (M) and pectins (P), was developed as a tandem-polymeric matrix by spray-drying to encapsulate dried herbal extracts [15]. The excellent obtained results led us to apply the same approach to AGL-28 with the aim to enhance both the usability and stability also verifying the versatility of the microencapsulation process. To apply the MP spray drying matrix to the new ‘Aglianico’ extract (A), a preliminary study was carried out on the suitable concentration of polymeric matrix (M/P/A ratio and total liquid feed concentration) to be used to obtain satisfactory production yields and encapsulation efficiencies. Several preliminary tests were carried out using M in a range between 9.5% and 5%: percentages lower than 5% determined low process yields due to the dispersion of the material on the walls of the drying chamber, while a concentration higher than 10% determined a reduction of the process yield as well as a bad interaction with the extract in water [46,47]. Pectin was used in a range between 0.4% and 0.2% because a concentration higher than 0.5% causes an increase in liquid feed viscosity with consequent difficulties to be processed by spray-drying.
The most significant results were summarized in Table 7 and compared to each other. A process yields greater than 75% was obtained for the blank powders MP1-MP3 with the best result for the 96/4 M/P ratio. This selected matrix was able to load the 0.5% w/w of AGL-28 raw extract with a very satisfactory process yield (83.26%, Table 5). Furthermore, the actual extract content (AEC), extremely close to the theoretical (TEC), leads to an encapsulation efficiency of 93.96%, confirming an almost complete loading of the extract.

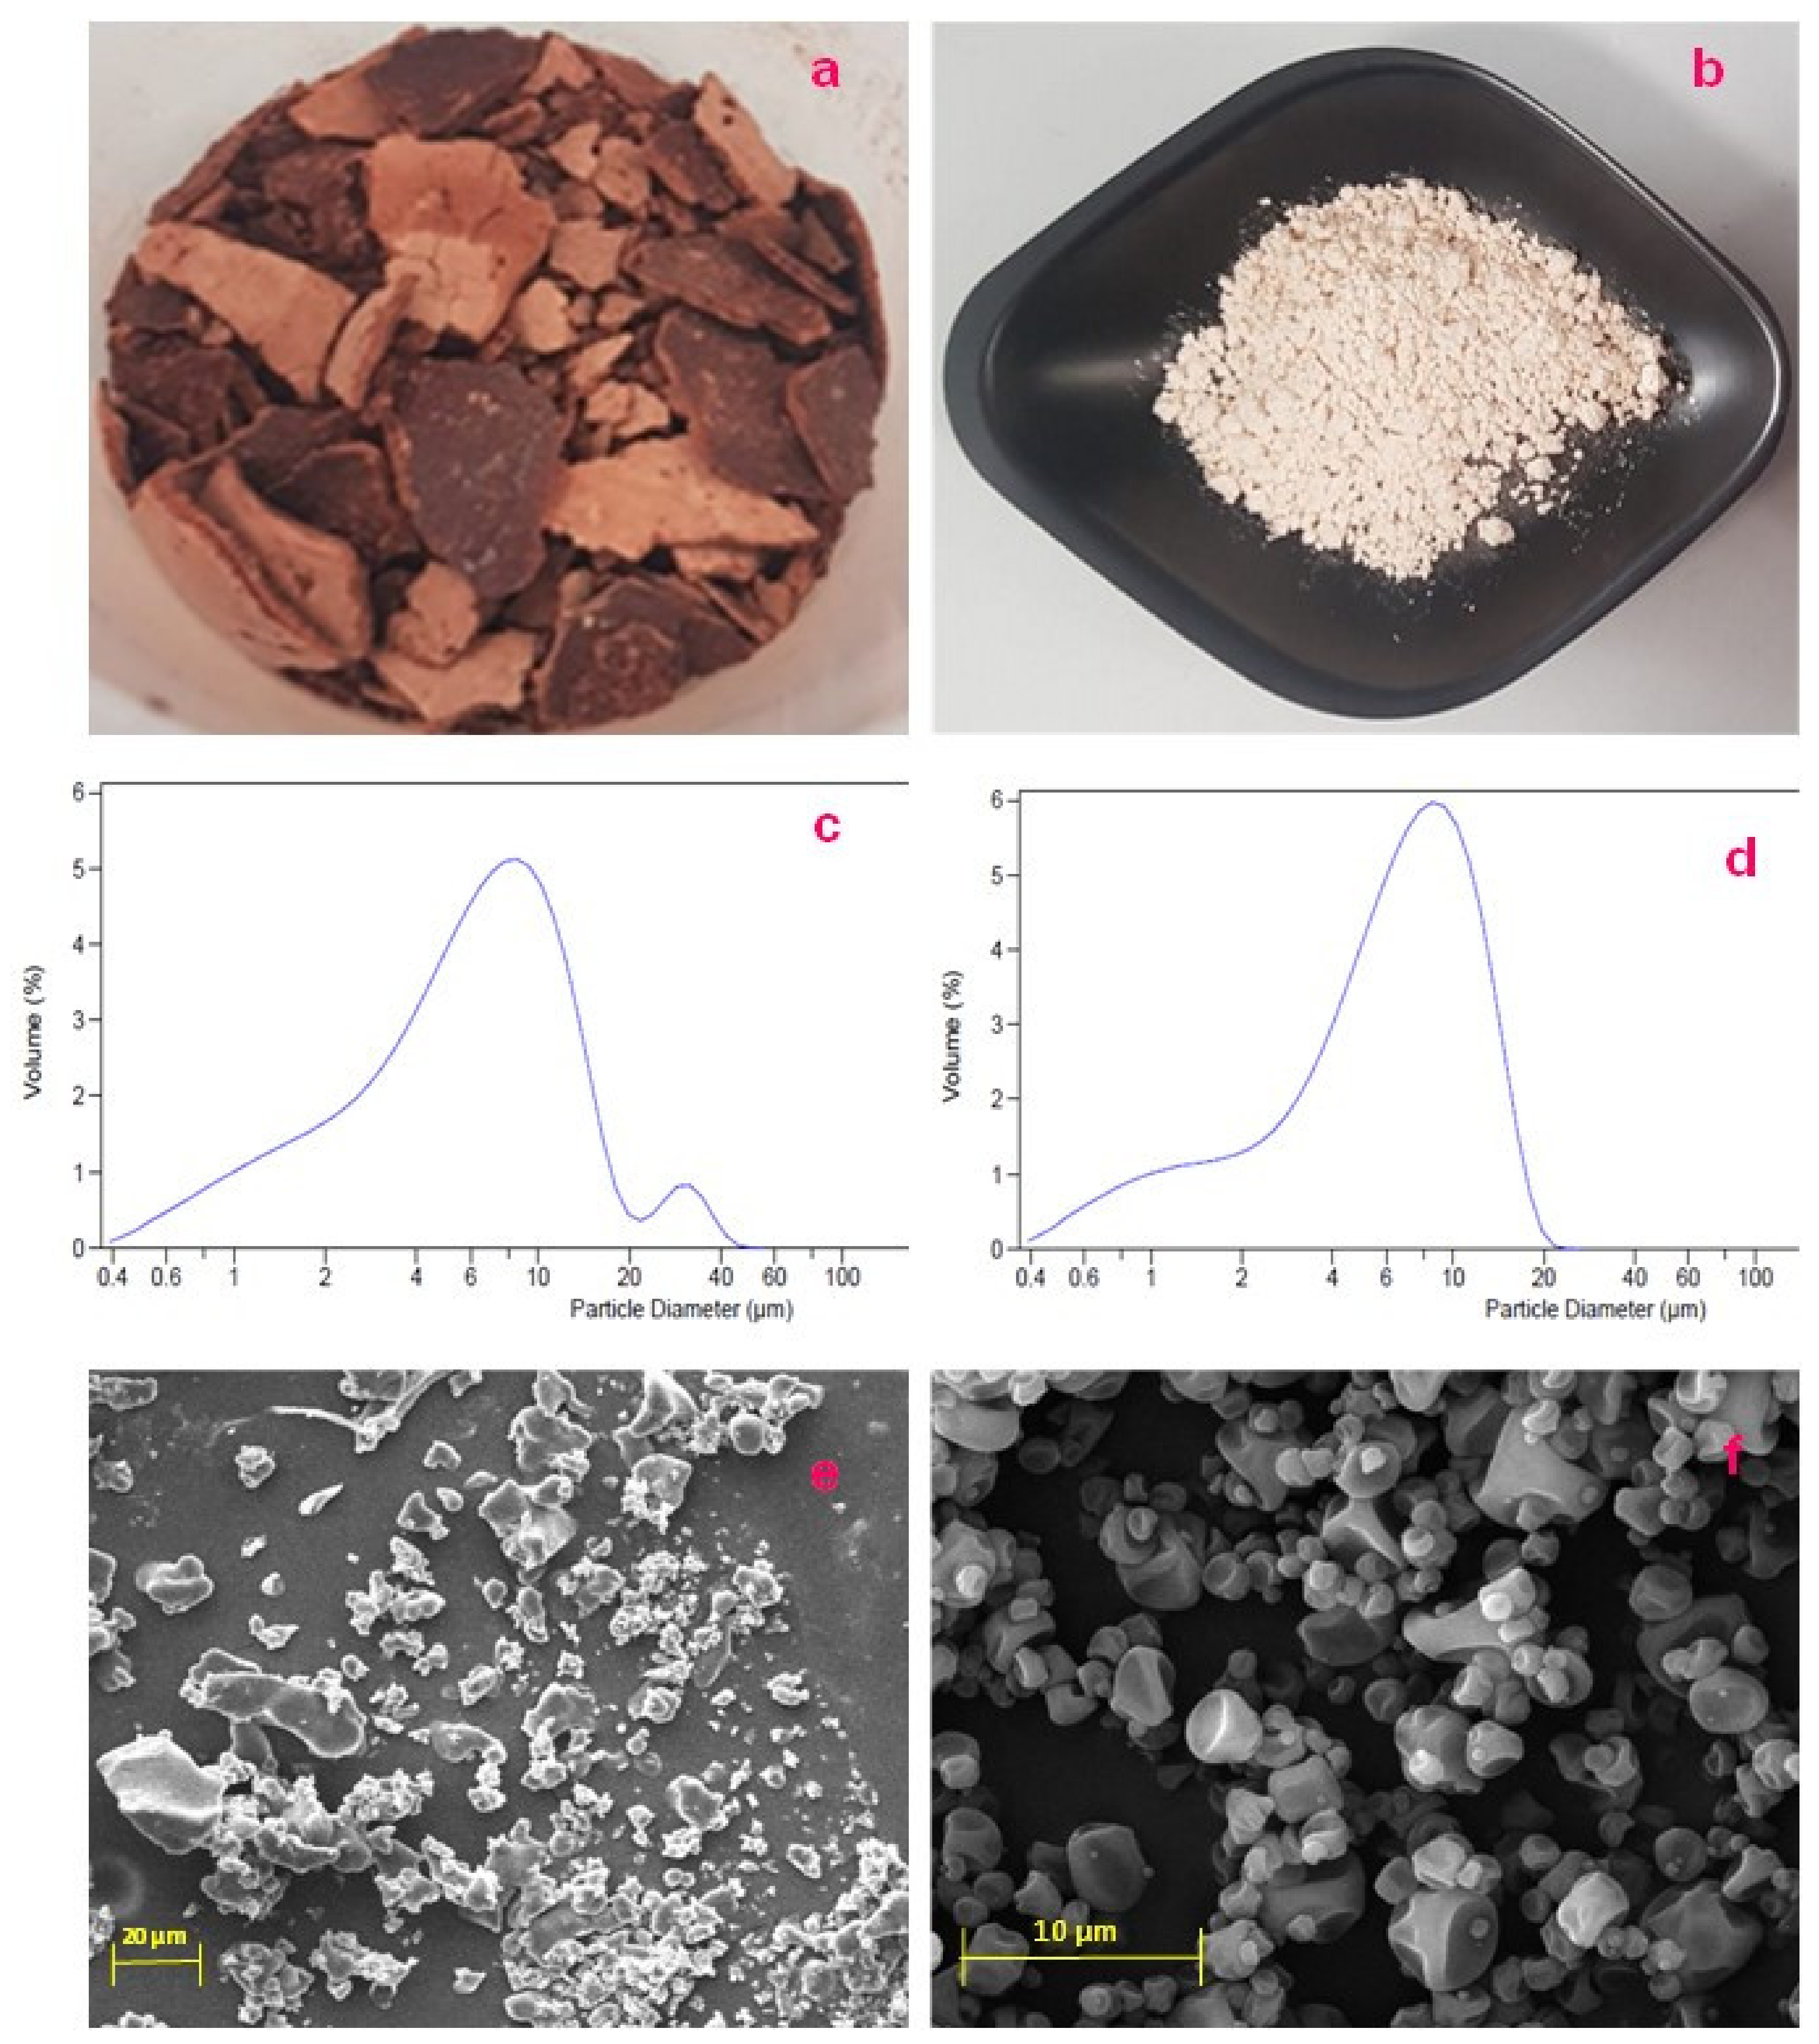
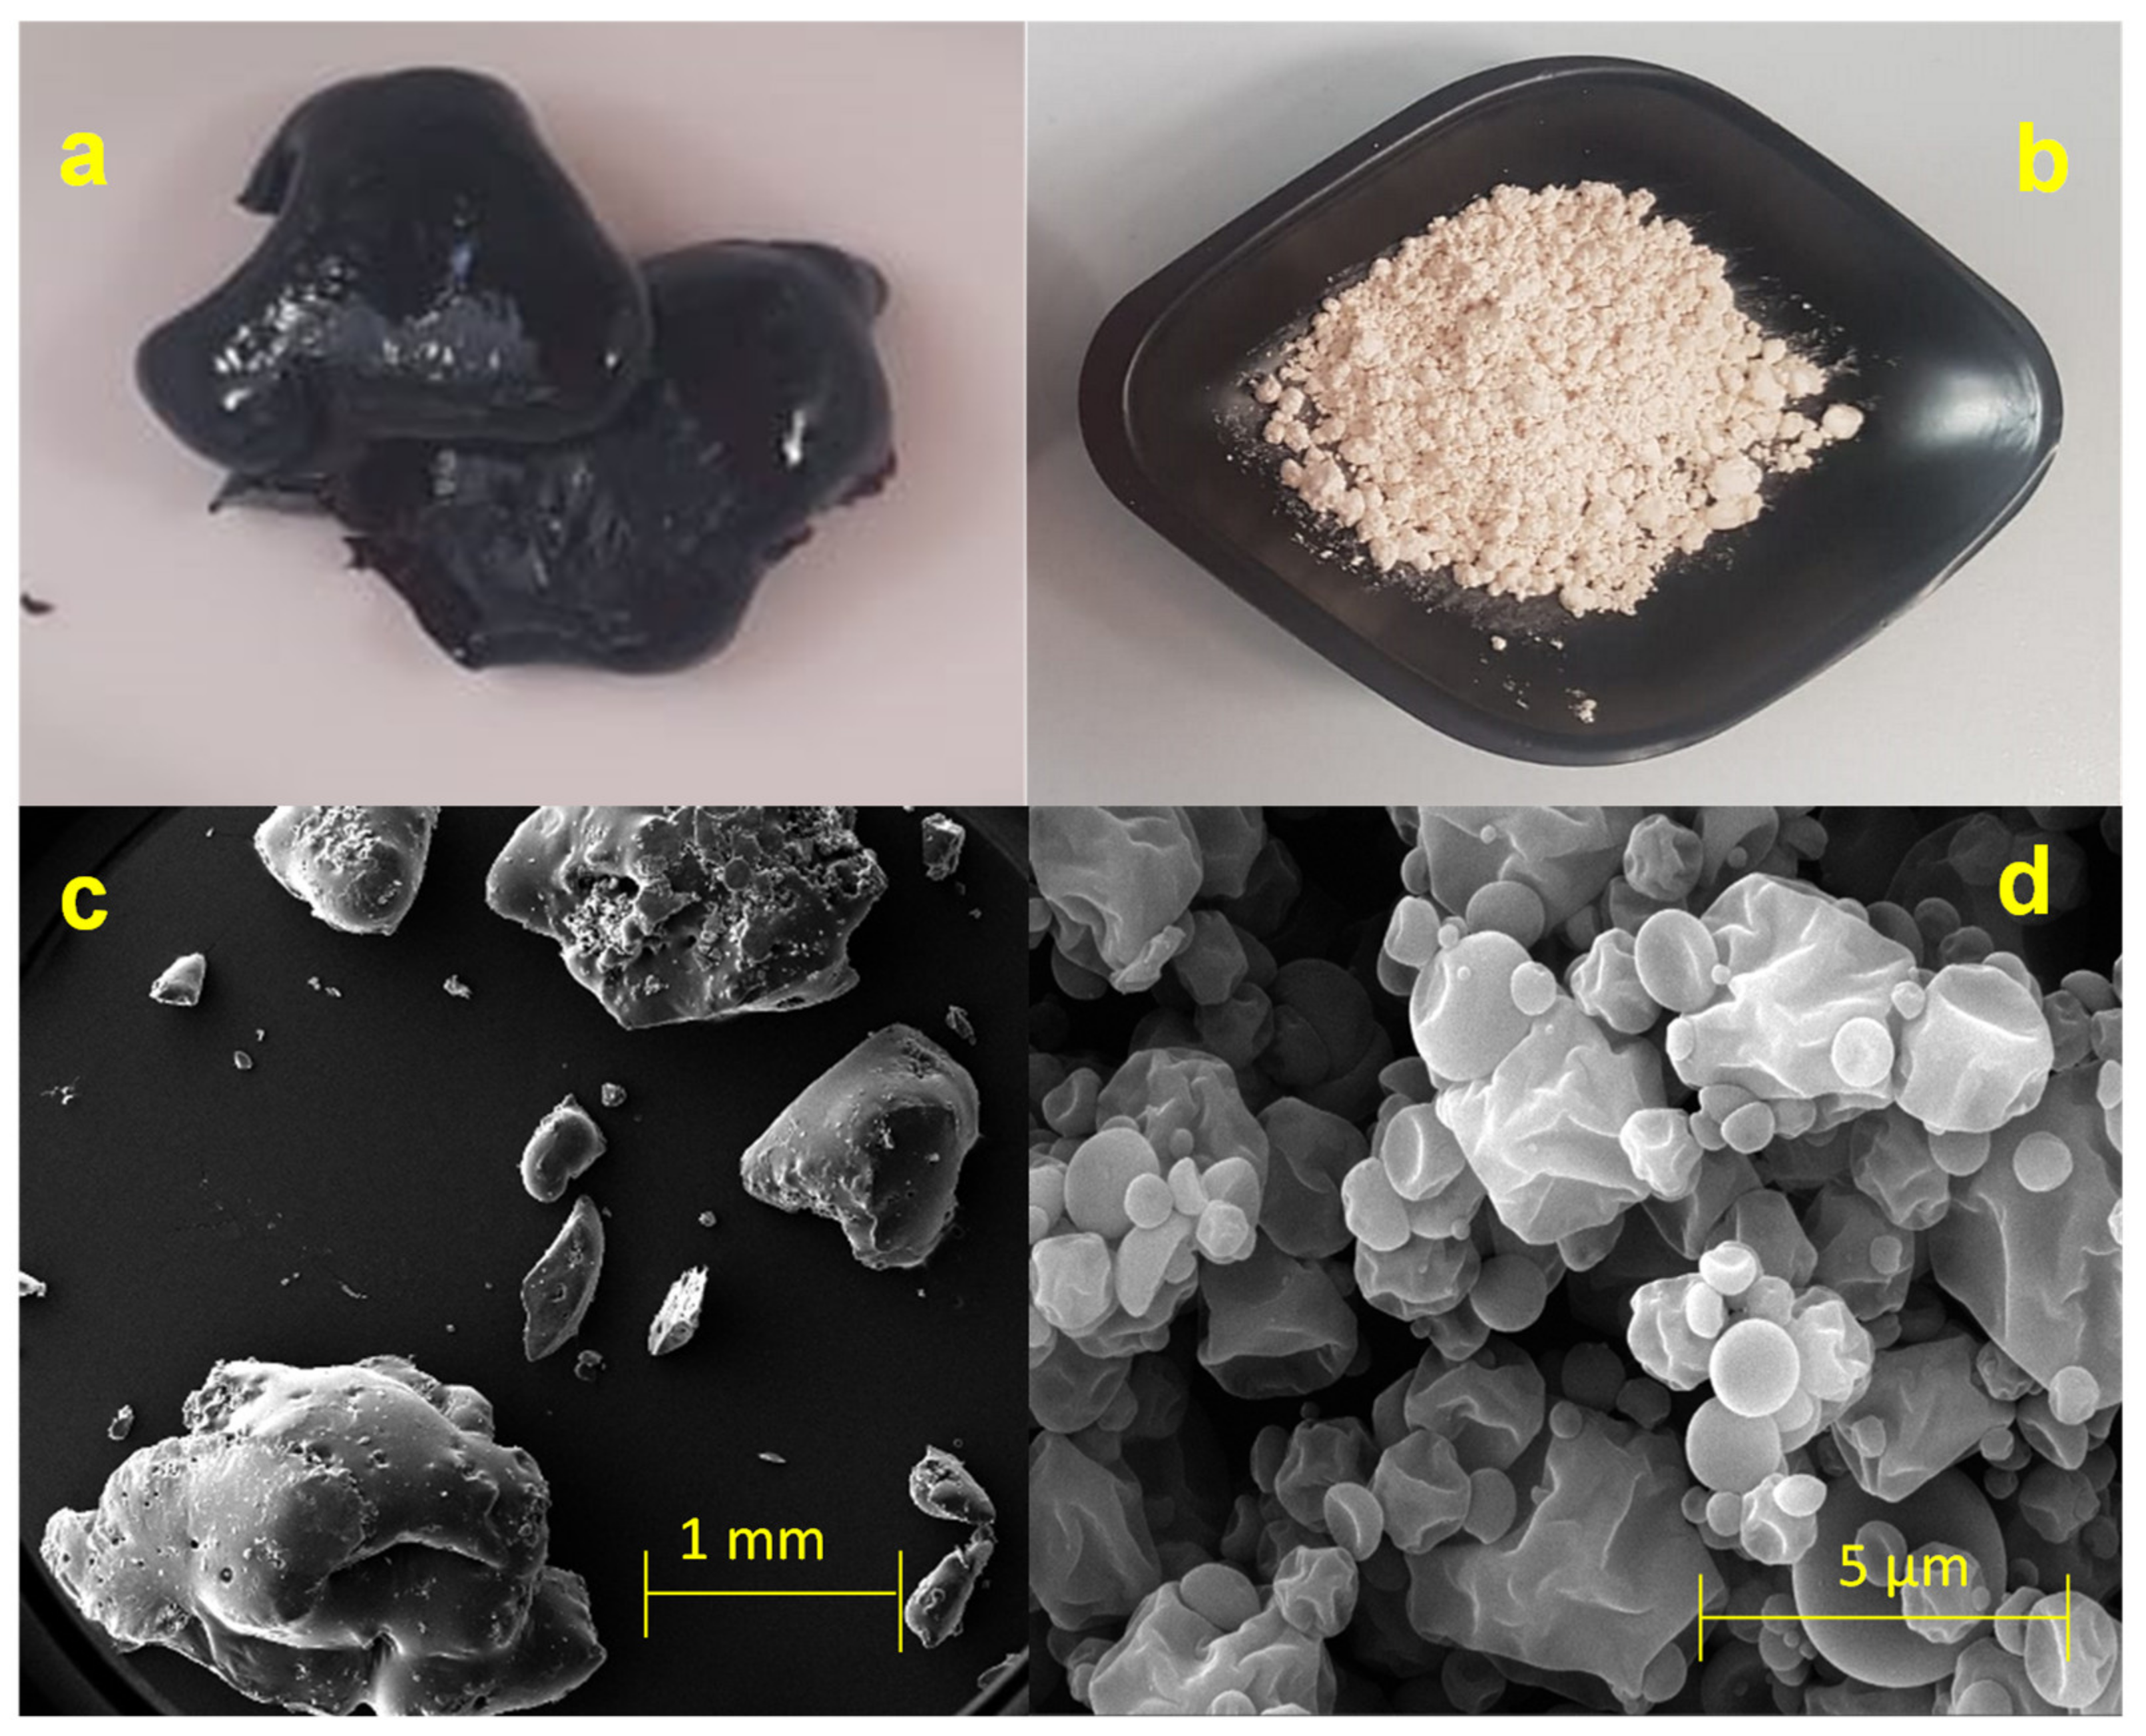
3.5. Powder Characterization: Macroscopic Analysis and Morphology

The transformation of the lyophilized extract (Figure 5a) into a micro-particulate powder form (Figure 5b) was verified by a macroscopic and microscopic analysis of the pre- and post-processing materials. Figure 5a shows the lyophilized sample consisting of reddish, dark material, in flakes of different shapes. The material was made up of solid micro-scales crystalline material even larger than 20µm (Table 7, the higher is the span value the higher the polydispersity index), with a non-homogeneous distribution, as established by the LLS curve, which is almost bidimensional (Figure 5c) and confirmed by SEM analysis (Figure 5e).
Conversely, Figure 5b shows the post-processing material via spray-drying: a fine and slightly pinkish homogeneous powder with a reduced color compared to the starting extract. This outcome highlights the improvement in the resulting powder confirming the success of the technological intervention adopted. Moreover, under the microscope (Figure 5f), such transformation is highlighted by the formation of trendy spherical, small microparticle structures (particle size about 2 µm), well-formed and completely amorphous. The dimensional distribution of 6.17 µm (Figure 5d, Table 7) could be due to the presence of few aggregates on partially collapsed microparticles surface, as also shown by the SEM image. The collapses are probably due to the rapid evaporation of the solvent during the atomization process which causes a slight depression of the internal volume with consequent contraction of the particle surface. This contraction, also due to the presence of the hydrocolloid pectin which confers plasticity to the wall, does not cause fractures that can destabilize the integrity of the particle structure.

3.6. Derived Powder Properties: Powder Flowability

Powder flow properties are a critical attribute that directly affects performance in the manufacturing process. Understanding and controlling the flow properties of powder can help produce handling products with high versatility. A powder form containing a functional extract, as in the case of MPA spray-dried powder, can be used for the preparation of oral dosage forms such as capsules, tablets, or sachets or to become part of a food functionalization process. Thus, information on flowability is very important when an industrial filling process has to be designed or tuned. Based on the Hausner ratio and Carr’s compressibility index, the higher the values of the Carr Index and Hausner ratio, the lower the flowability of the powder, the MPA powder was within excellent flow behavior range according to USP classification (Table 2 and Table 8).

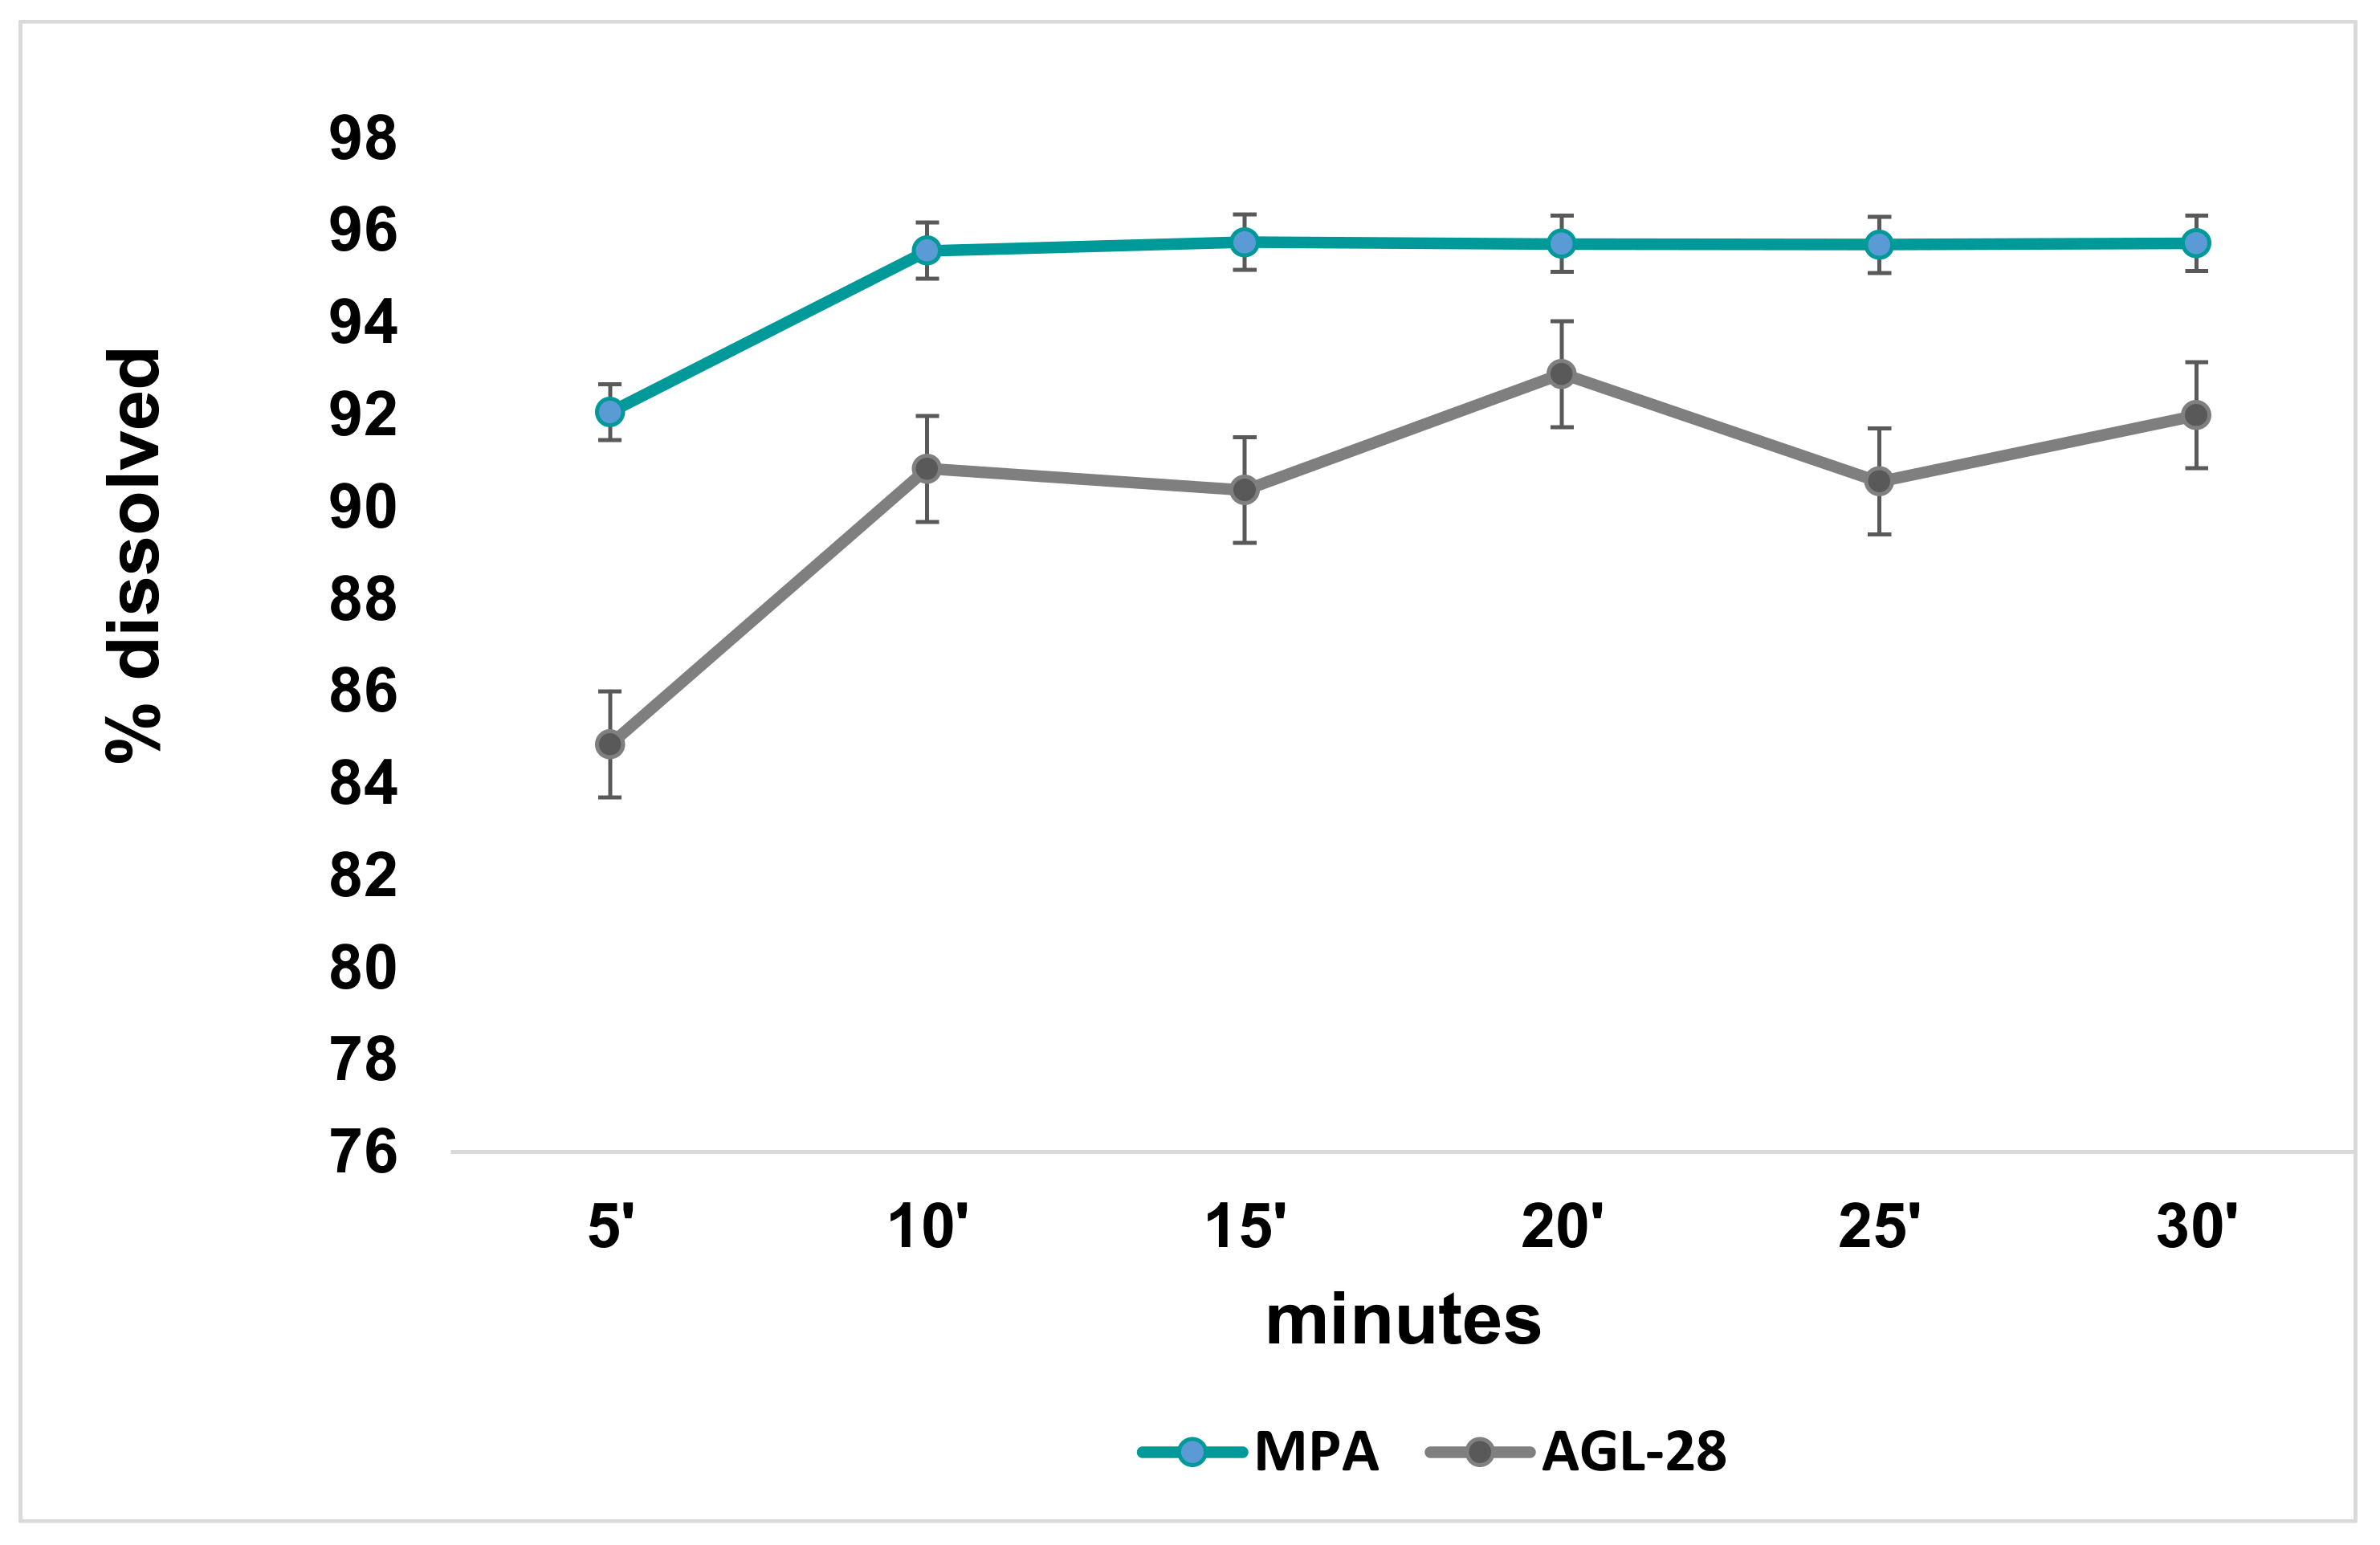
3.7. Dissolution/Release Test

AGL-28 derives from an aqueous extraction process; therefore, it has a good water affinity. As shown by the dissolution graph (Figure 6), the extract dissolves for about 90% in 20 min. Its dissolution profile shows a not particularly linear dissolution behavior over time, probably due to extract solid flakes (Figure 5a) which interact differently with the solvent. At the same time, the particle system MPA dissolves almost completely reaching a 96% dissolution rate with a more linear profile than extract raw. As previously shown by microscopic results, the combination of the polymeric matrix and spray-drying leads to obtain a microparticulate powder form in an amorphous state. The amorphous material has no organization in the solid-state, it is random. This property confers important characteristics to the obtained powder such as enhancement of water interaction and dissolution rate. The microparticles structure offers a greater specific surface area exposed which can favor the interaction with the solvent during dissolution in water by increasing the powder dissolution rate.

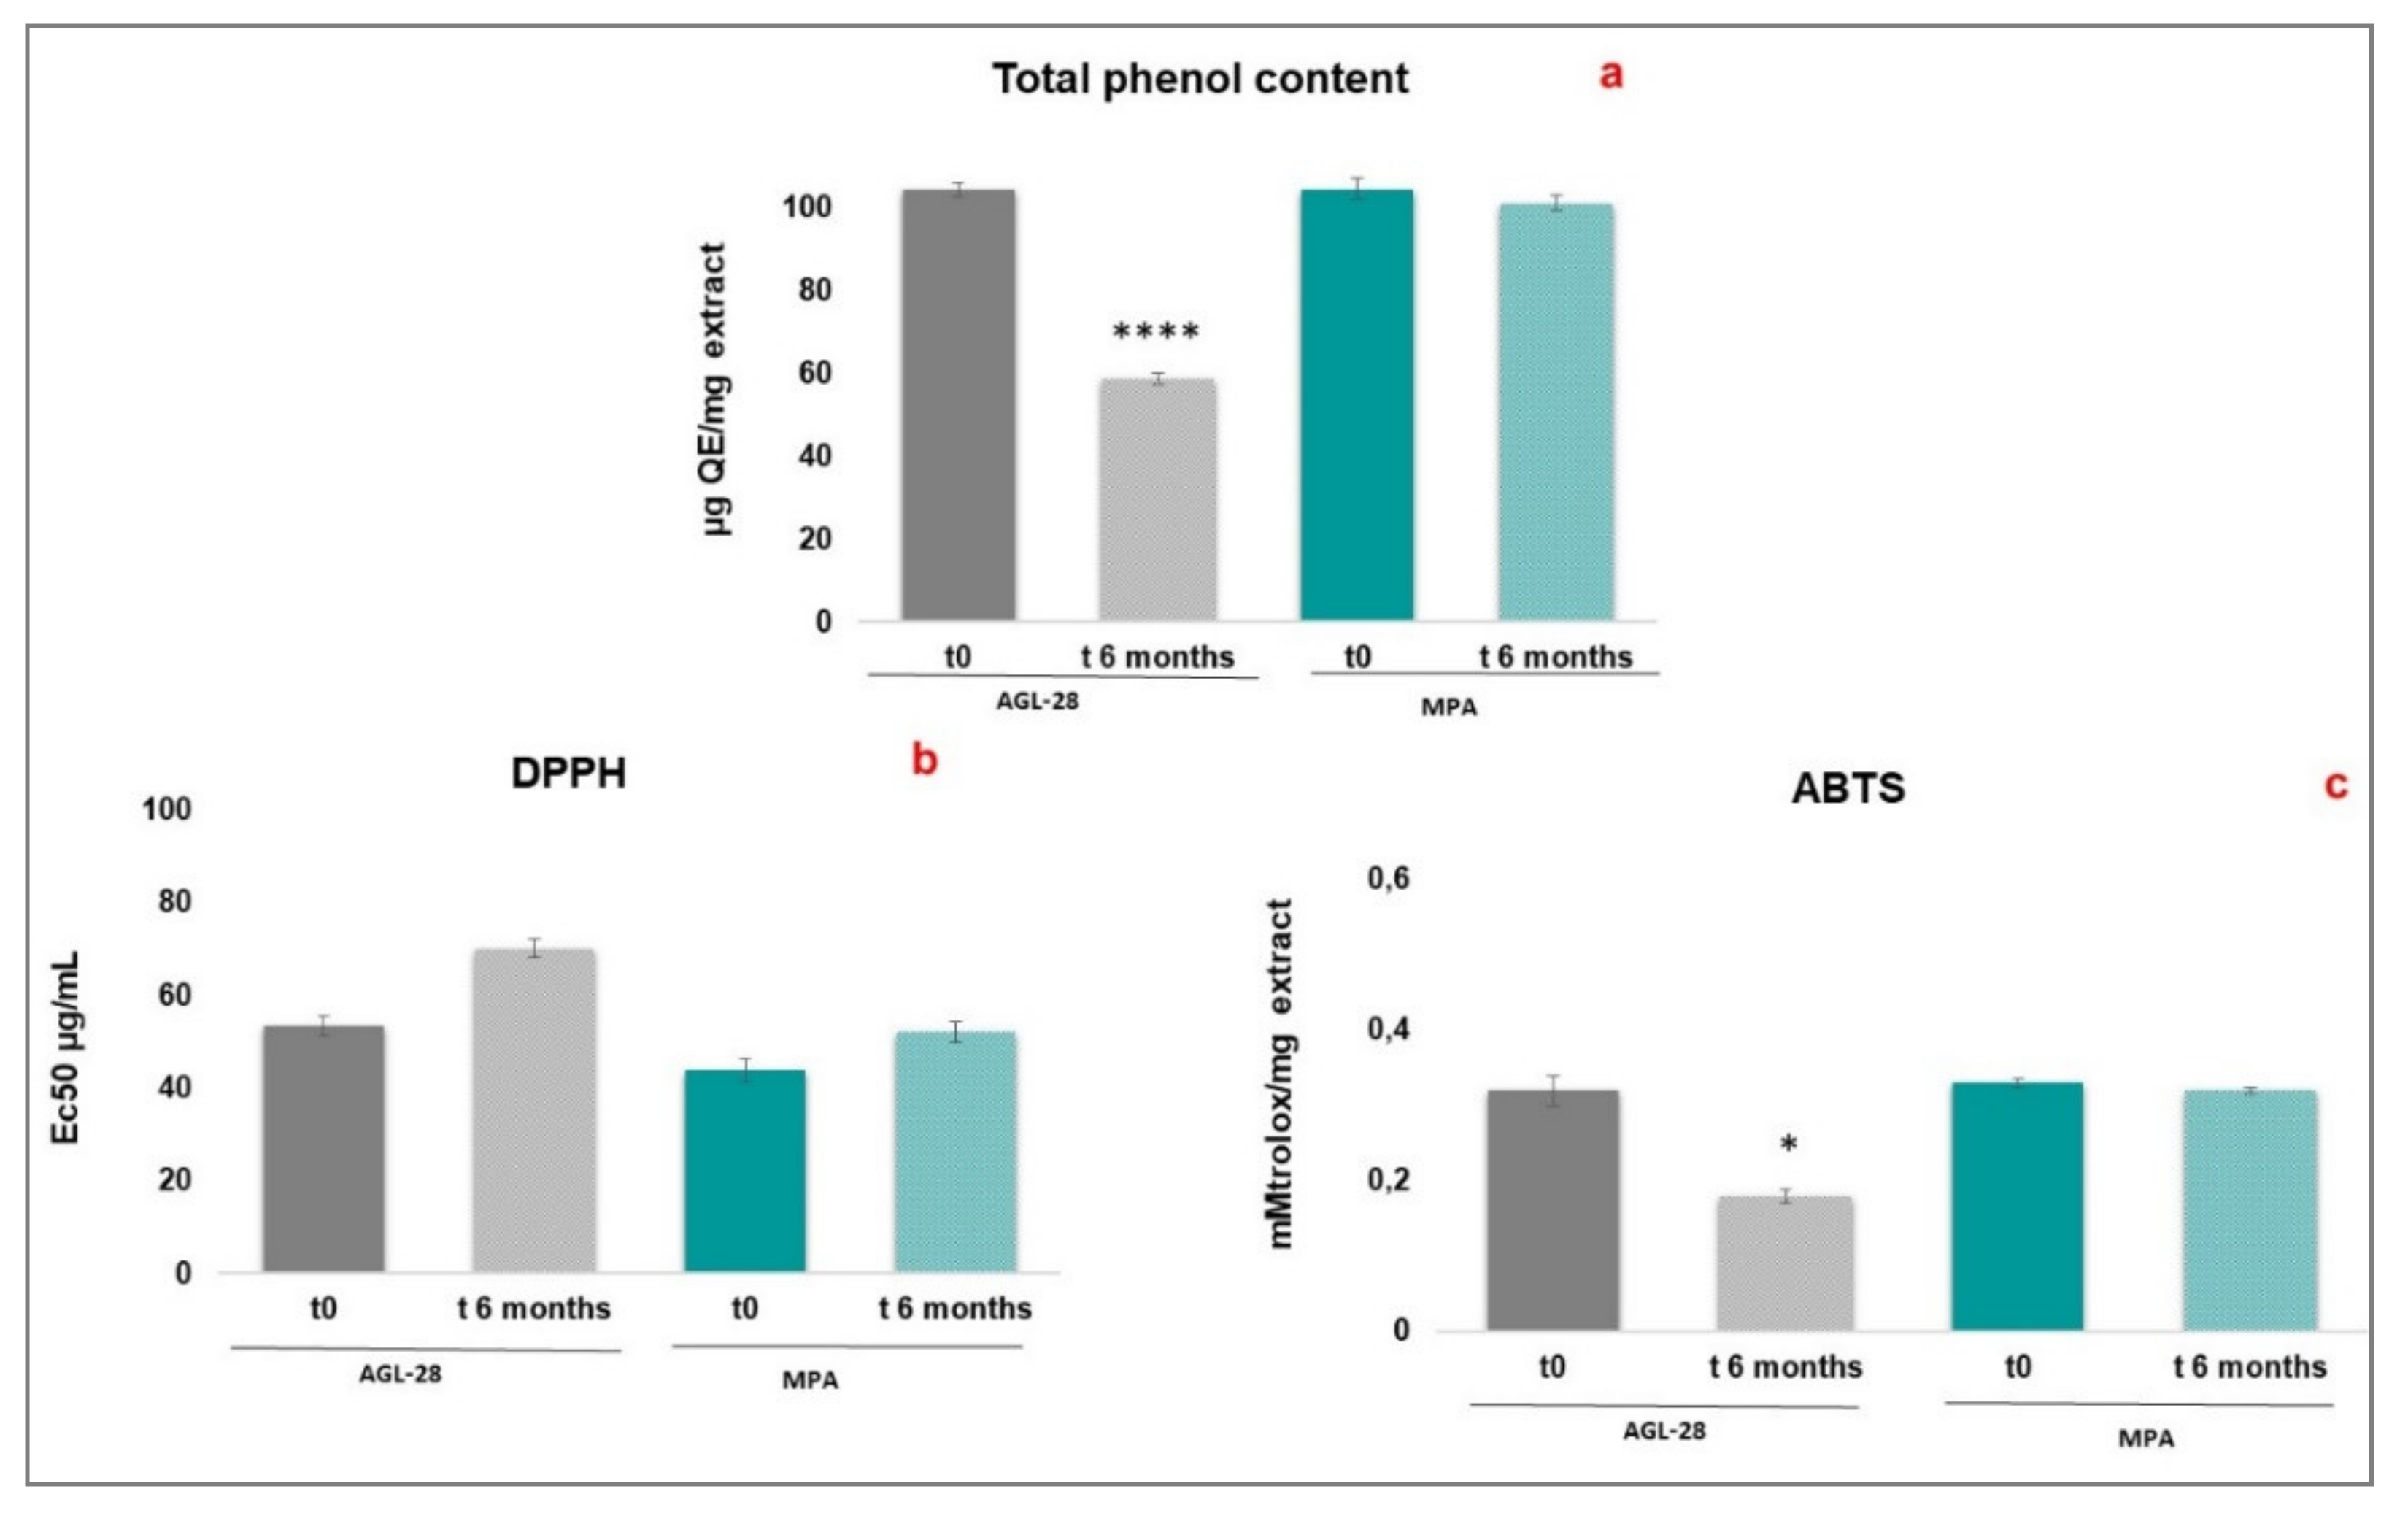
3.8. Evaluation of Physical-Chemical and Functional Stability

‘Aglianico’ leaves extract is an important resource of polyphenols, responsible for numerous beneficial effects. However, they are very susceptible to high temperatures humidity, oxygen, and light [10]. Dried herbal extracts, as well as materials in an amorphous state, generally show high instability to storage with uncontrolled temperature and humidity, can lose their stiffness and flow, and their permeability to gasses increases dramatically leading to increased spoilage in the final products. Amorphous materials can collapse, and their storage life is shortened as degradation or oxidation reactions can increase. To understand whether the encapsulation process might have improved the stability of the extract, the spray-dried powders were stressed under harsh storage conditions and results were compared to the extract raw. The changes in the materials were detected by analyzing their solid-state, as well as the polyphenol stability, which was evaluated verifying their content and the antioxidant capability.
As it is evident from the images in Figure 7a,c, after 6 months of storage, the raw extract is completely physically modified. It is a dark, hard, shapeless, and sticky mass that has lost its original solid-state. Conversely, MPA exhibits no changes in color and solid-state while maintaining a powdery appearance. Macroscopically, some areas of dust compacted into small agglomerates are visible (Figure 7b). SEM analysis confirmed the formation of few particle aggregates which, however, do not affect the microparticle solid-state (Figure 7d). The selection of a hydrocolloid protector as pectins, able to interact in microparticles formation during the spray-drying process, can allow stabilizing the extract within the particles in an amorphous state by providing wall protection.
These results have been also confirmed by thermal analysis (DSC). The thermo-analytical curves of the raw extracts before (blue line) and after the storage (black line) (Figure 8) are completely different. After six months, it is visible a new peak at 60 °C due to the modified physical state. On the contrary, MPA powder, after 6 months of storage does not show new peaks or degradation events confirming the stability of the solid state. As shown by DSC curves (Figure 8, lines red and green) the minimum variation for MPA 6 months storage, is in the thermal trend between 60 and 80 °C which could be due to the surface humidity adsorbed during the storage phase, and which slightly modify the trend of the curve without giving rise to degradation phenomena or the formation of crystalline clusters, evidenced by the absence of new peaks or new endothermic events, also confirming the stability of the amorphous state.
The MPA spray-dried powder maintains its features also under harsh storage conditions (red line and green line, Figure 8) making it an ideal candidate suitable for manufacturing purposes.
Polyphenols are a class of molecules susceptible to high temperatures, oxygen, and light. For this reason, the polyphenol content and the functional activity of AGL-28 were verified after the spray-drying process (MPA) and after six months of storage under accelerated stability conditions. The results obtained were compared with that of the raw extract (AGL-28).
As reported in Figure 9a, AGL-28 exhibited in high phenolic content (104.38 µgQE/mg ex) which is extremely reduced (p < 0.0001, 58.85 µg QE/mg ex) after 6 months of storage at 40 ± 2 °C; 75 ± 2% R.H. At the contrary, in MPA, the extract maintains the polyphenol content unaltered (104.65 µgQE/mg powder, after the spray-drying and 101.30 µgQE/mg powder, after six months).
The results were also confirmed by the evaluation of the free radical scavenging activity examined against DPPH and ABTS radicals. As reported in Figure 9b,c, a reduction of the anti-radical activity is observed for the AGL-28 extract, which can be correlated to the reduction of the polyphenol content. Specifically, in the case of the DPPH test, an increase of about 30% in the EC50 value (from 53.618 to 70.13 µg/mL), and a reduction of about 56% in the TEAC value, (0.32 mM Trolox/mg extract to 0.18 mM Trolox/mg extract) was observed. On the contrary, in the same conditions, the antiradical efficacy of MPA remains more stable (EC50 43.79 and 52.18 µg/mL, 19% of increase, Figure 9b) or unchanged (0.33 mM Trolox/mg MPA 0.32 mM Trolox/mg MPA, Figure 9c). The obtained results showed how the spray-drying technique and the selected carriers (pectin and maltodextrins) can be confirmed as appropriate strategies to improve the quality and the shelf-life of the extract, protecting it from degradation phenomena, and at the same time ensuring an adequate release of bioactive compounds, allowing its potential use in the design and development of health products.

4. Conclusions

Extracts with antioxidant properties are produced from a variety of food and medicinal plants, biowastes and novel sources. Microwave-assisted extraction (MAE) represents an interesting alternative to other methods with a lower time and solvent consumption. V. vinifera leave MAE extract represents a rich source of polyphenols, but in its concentrated dried form presents several challenges, from poor solubility to stickiness, instability, and poor handling state, making them unsuitable for industrial applications. The results obtained in this study report the feasibility of a transformation process within a production flow-chart from the recovery, through the extraction, to the final product. The obtained results showed how the spray-drying technique and the selected carriers (pectin and maltodextrins) can be confirmed as appropriate strategies to improve the quality and the shelf-life of the extract, protecting it from degradation phenomena, and at the same time ensuring an adequate release of bioactive compounds, allowing its potential use in the design and development of health products.

Author Contributions

Conceptualization, F.S. and M.G.V.; investigation, T.M., T.E., F.S., M.P. and S.P.; supervision, F.S. and M.G.V.; project administration, M.G.V.; data curation, T.E. and M.P.; methodology, T.E. and F.S.; writing—original draft, F.S. and M.G.V. All authors have read and agreed to the published version of the manuscript.

Funding

This work was supported by CNR project NUTR-AGE (FOE-2019, DSB.AD004.271).

Conflicts of Interest

The authors declare no conflict of interest.

Sample Availability

Samples of MPA functional ingredient are available from the authors from University of Salerno, Italy.

References

  1. Sagar, N.A.; Pareek, S.; Sharma, S.; Yahia, E.M.; Lobo, M.G. Fruit and Vegetable Waste: Bioactive Compounds, Their Extraction, and Possible Utilization. Compr. Rev. Food Sci. Food Saf. 2018, 17, 512–531. [Google Scholar] [CrossRef] [PubMed] [Green Version]
  2. Geissdoerfer, M.; Savaget, P.; Bocken, N.M.P.; Hultink, E.J. The Circular Economy—A new sustainability paradigm? J. Clean. Prod. 2017, 143, 757–768. [Google Scholar] [CrossRef] [Green Version]
  3. Tristantini, D.; Setiawan, H.; Santoso, L.L. Feasibility assessment of an encapsulated longevity spinach (Gynura procumbens L.) extract plant in Indonesia. Appl. Sci. 2021, 11, 4093. [Google Scholar] [CrossRef]
  4. Pastrana-Bonilla, E.; Akoh, C.C.; Sellappan, S.; Krewer, G. Phenolic content and antioxidant capacity of muscadine grapes. J. Agric. Food Chem. 2003, 51, 5497–5503. [Google Scholar] [CrossRef] [PubMed]
  5. Dresch, R.R.; Dresch, M.K.; Guerreiro, A.F.; Biegelmeyer, R.; Holzschuh, M.H.; Rambo, D.F.; Henriques, A.T. Phenolic Compounds from the Leaves of Vitis labrusca and Vitis vinifera L. as a Source of Waste Byproducts: Development and Validation of LC Method and Antichemotactic Activity. Food Anal. Methods 2014, 7, 527–539. [Google Scholar] [CrossRef]
  6. Tedesco, I.; Moccia, S.; Volpe, S.; Alfieri, G.; Strollo, D.; Bilotto, S.; Spagnuolo, C.; Di Renzo, M.; Aquino, R.P.; Russo, G.L. Red wine activates plasma membrane redox system in human erythrocytes. Free Radic. Res. 2016, 50, 557–569. [Google Scholar] [CrossRef]
  7. Ajila, C.M.; Brar, S.K.; Verma, M.; Tyagi, R.D.; Godbout, S.; Valéro, J.R. Extraction and Analysis of Polyphenols: Recent trends. Crit. Rev. Biotechnol. 2011, 31, 227–249. [Google Scholar] [CrossRef] [PubMed]
  8. Castro-López, C.; Ventura-Sobrevilla, J.M.; González-Hernández, M.D.; Rojas, R.; Ascacio-Valdés, J.A.; Aguilar, C.N.; Martínez-Ávila, G.C.G. Impact of extraction techniques on antioxidant capacities and phytochemical composition of polyphenol-rich extracts. Food Chem. 2017, 237, 1139–1148. [Google Scholar] [CrossRef]
  9. Karami, Z.; Emam-Djomeh, Z.; Mirzaee, H.A.; Khomeiri, M.; Mahoonak, A.S.; Aydani, E. Optimization of microwave assisted extraction (MAE) and soxhlet extraction of phenolic compound from licorice root. J. Food Sci. Technol. 2015, 52, 3242–3253. [Google Scholar] [CrossRef] [Green Version]
  10. Labanca, F.; Faraone, I.; Nolè, M.R.; Hornedo-Ortega, R.; Russo, D.; García-Parrilla, M.C.; Chiummiento, L.; Bonomo, M.G.; Milella, L. New insights into the exploitation of Vitis vinifera L. Cv. aglianico leaf extracts for nutraceutical purposes. Antioxidants 2020, 9, 708. [Google Scholar] [CrossRef]
  11. Sansone, F.; Esposito, T.; Mencherini, T.; Piccinelli, A.L.; Gazzerro, P.; Picerno, P.; Russo, P.; Del Gaudio, P.; Essolito, M.; Campiglia, P.; et al. Annurca peel extract: From the chemical composition, through the functional activity, to the formulation and characterisation of a topical oil-in-water emulsion. Nat. Prod. Res. 2016, 30, 1398–1403. [Google Scholar] [CrossRef]
  12. Menezes Oliveira, D.; Clemente, E.; Afonso, M.R.A.; da Costa, J.M.C. Hygroscopic behavior of lyophilized powder of grugru palm (Acrocomia aculeata). Am. J. Anal. Chem. 2013, 4, 1–7. [Google Scholar] [CrossRef] [Green Version]
  13. Trindade, E.P.; Regis, F.T.; da Silva, G.A.; Aguillar, B.N.; de Paiva Amorim, M.V.; Ramos Ferreira, G.L.; Soares Aragão, C.F.; da Silva Solon, L.G. Laboratory-scale preparation and characterization of dried extract of Muirapuama (Ptychopetalumolacoides Benth) by green analytical techniques. Molecules 2020, 25, 1095. [Google Scholar] [CrossRef] [PubMed]
  14. Esposito, T.; Sansone, F.; Auriemma, G.; Franceschelli, S.; Pecoraro, M.; Picerno, P.; Aquino, R.P.; Mencherini, T. Study on ajuga reptans extract: A natural antioxidant in microencapsulated powder form as an active ingredient for nutraceutical or pharmaceutical purposes. Pharmaceutics 2020, 12, 671. [Google Scholar] [CrossRef] [PubMed]
  15. Sansone, F.; Mencherini, T.; Picerno, P.; D’Amore, M.; Aquino, R.P.; Lauro, M.R. Maltodextrin/pectin microparticles by spray drying as carrier for nutraceutical extracts. J. Food Eng. 2011, 105, 468–476. [Google Scholar] [CrossRef]
  16. Picerno, P.; Sansone, F.; Mencherini, T.; Prota, L.; Aquino, R.P.; Rastrelli, L.; Lauro, M.R. Citrus bergamia juice: Phytochemical and technological studies. Nat. Prod. Commun. 2011, 6, 951–955. [Google Scholar] [CrossRef] [Green Version]
  17. Righi da Rosa, J.; Nunes, G.L.; Motta, M.H.; Fortes, J.P.; Cezimbra Weis, G.C.; Rychecki Hecktheuer, L.H.; Muller, E.I.; Ragagnin de Menezes, C.; Severo da Rosa, C. Microencapsulation of anthocyanin compounds extracted from blueberry (Vaccinium spp.) by spray drying: Characterization, stability and simulated gastrointestinal conditions. Food Hydrocoll. 2019, 89, 742–748. [Google Scholar] [CrossRef]
  18. Rutz, J.K.; Zambiazi, R.C.; Borges, C.D.; Krumreich, F.D.; Da Luz, S.R.; Hartwig, N.; Da Rosa, C.G. Microencapsulation of purple Brazilian cherry juice in xanthan, tara gums and xanthan-tara hydrogel matrixes. Carbohydr. Polym. 2013, 98, 1256–1265. [Google Scholar] [CrossRef]
  19. Sansone, F.; Mencherini, T.; Picerno, P.; Esposito, T.; Del Gaudio, P.; Russo, P.; Pepe, G.; Lauro, M.R.; Aquino, R.P. Microencapsulation by spray drying of Lannea microcarpa extract: Technological characteristics and antioxidant activity. J. Pharm. Pharmacogn. Res. 2014, 2, 100–109. [Google Scholar]
  20. Picariello, G.; De Vito, V.; Ferranti, P.; Paolucci, M.; Volpe, M.G. Species- and cultivar-dependent traits of Prunus avium and Prunus cerasus polyphenols. J. Food Compos. Anal. 2016, 45, 50–57. [Google Scholar] [CrossRef]
  21. Volpe, M.G.; Costantini, S.; Coccia, E.; Parrillo, L.; Paolucci, M. Evaluation of metabolic changes induced by polyphenols in the crayfish Astacus leptodactylus by metabolomics using Fourier transformed infrared spectroscopy. J. Biosci. 2018, 43, 585–596. [Google Scholar] [CrossRef] [PubMed]
  22. Sansone, F.; Esposito, T.; Lauro, M.R.; Picerno, P.; Mencherini, T.; Gasparri, F.; De Santis, S.; Chieppa, M.; Cirillo, C.; Aquino, R.P. Application of spray drying particle engineering to a high-functionality/low-solubility milk thistle extract: Powders production and characterization. Molecules 2018, 23, 1716. [Google Scholar] [CrossRef] [PubMed] [Green Version]
  23. Aquino, R.P.; Auriemma, G.; Conte, G.M.; Esposito, T.; Sommella, E.; Campiglia, P.; Sansone, F. Development of chitosan/mannitol microparticles as delivery system for the oral administration of a Spirulina bioactive peptide extract. Molecules 2020, 25, 2086. [Google Scholar] [CrossRef]
  24. Ministry of Labor, Health and Social Policies—Permanent Commission for Review and the Publication of the Official Pharmacopeia. Farmacopea Ufficiale Italiana, XII ed.; Istituto Poligrafico dello Stato: Roma, Italy, 2008.
  25. Aïssaoui, H.; Mencherini, T.; Esposito, T.; De Tommasi, N.; Gazzerro, P.; Benayache, S.; Benayache, F.; Mekkiou, R. Heliotropium bacciferum Forssk. (Boraginaceae) extracts: Chemical constituents, antioxidant activity and cytotoxic effect in human cancer cell lines. Nat. Prod. Res. 2019, 33, 1813–1818. [Google Scholar] [CrossRef] [PubMed]
  26. Kaufmann, B.; Christen, P. Recent extraction techniques for natural products: Microwave-assisted extraction and pressurised solvent extraction. Phytochem. Anal. 2002, 13, 105–113. [Google Scholar] [CrossRef] [PubMed]
  27. Djemaa-Landri, K.; Hamri-Zeghichi, S.; Valls, J.; Cluzet, S.; Tristan, R.; Boulahbal, N.; Kadri, N.; Madani, K. Phenolic content and antioxidant activities of Vitis vinifera L. leaf extracts obtained by conventional solvent and microwave-assisted extractions. J. Food Meas. Charact. 2020, 14, 3551–3564. [Google Scholar] [CrossRef]
  28. Parthasarathi, S.; Ezhilarasi, P.N.; Jena, B.S.; Anandharamakrishnan, C. A comparative study on conventional and microwave-assisted extraction for microencapsulation of Garcinia fruit extract. Food Bioprod. Process. 2013, 91, 103–110. [Google Scholar] [CrossRef]
  29. Katalinic, V.; Mozina, S.S.; Generalic, I.; Skroza, D.; Ljubenkov, I.; Klancnik, A. Phenolic profile, antioxidant capacity, and antimicrobial activity of leaf extracts from six Vitis vinifera L. Varieties. Int. J. Food Prop. 2013, 16, 45–60. [Google Scholar] [CrossRef]
  30. Movasaghi, Z.; Rehman, S.; Rehman, I.U. Fourier transform infrared (FTIR) spectroscopy of biological tissues. Appl. Spectrosc. Rev. 2008, 43, 134–179. [Google Scholar] [CrossRef]
  31. Baranska, M. Optical Spectroscopy and Computational Methods in Biology and Medicine; Springer Science & Business Media: New York, NY, USA, 2013; ISBN 9789400778320. [Google Scholar]
  32. Baker, M.J.; Trevisan, J.; Bassan, P.; Bhargava, R.; Butler, H.J.; Dorling, K.M.; Fielden, P.R.; Fogarty, S.W.; Fullwood, N.J.; Heys, K.A.; et al. Using Fourier transform IR spectroscopy to analyze biological materials. Nat. Protoc. 2014, 9, 1771–1791. [Google Scholar] [CrossRef] [Green Version]
  33. Wahyono, T.; Astuti, D.A.; Komang Gede Wiryawan, I.; Sugoro, I.; Jayanegara, A. Fourier Transform Mid-Infrared (FTIR) Spectroscopy to Identify Tannin Compounds in the Panicle of Sorghum Mutant Lines. IOP Conf. Ser. Mater. Sci. Eng. 2019, 546, 042045. [Google Scholar] [CrossRef]
  34. Piccolella, S.; Crescente, G.; Volpe, M.G.; Paolucci, M.; Pacifico, S. UHPLC-HR-MS/MS-Guided Recovery of Bioactive. Molecules 2019, 24, 3630. [Google Scholar] [CrossRef] [PubMed] [Green Version]
  35. Hackshaw, K.V.; Miller, J.S.; Aykas, D.P.; Rodriguez-Saona, L. Vibrational Spectroscopy for Identification of Metabolites in Biologic Samples. Molecules 2020, 25, 4725. [Google Scholar] [CrossRef]
  36. Abbas, O.; Compère, G.; Larondelle, Y.; Pompeu, D.; Rogez, H.; Baeten, V. Phenolic compound explorer: A mid-infrared spectroscopy database. Vib. Spectrosc. 2017, 92, 111–118. [Google Scholar] [CrossRef]
  37. Li, X.; Zhou, R.; Xu, K.; Xu, J.; Jin, J.; Fang, H.; He, Y. Rapid determination of chlorophyll and pheophytin in green tea using fourier transform infrared spectroscopy. Molecules 2018, 23, 1010. [Google Scholar] [CrossRef] [PubMed] [Green Version]
  38. Baranska, M.; Movasaghi, Z.; Rehman, S.; Rehman, I.U.; Kokalj Ladan, M.; Straus, J.; Tavčar Benković, E.; Kreft, S.; Samples, B.; Baker, M.J.; et al. FT-IR-based method for rutin, quercetin and quercitrin quantification in different buckwheat (Fagopyrum) species. Appl. Spectrosc. Rev. 2017, 9, 134–179. [Google Scholar]
  39. Lu, X.; Wang, J.; Al-Qadiri, H.M.; Ross, C.F.; Powers, J.R.; Tang, J.; Rasco, B.A. Determination of total phenolic content and antioxidant capacity of onion (Allium cepa) and shallot (Allium oschaninii) using infrared spectroscopy. Food Chem. 2011, 129, 637–644. [Google Scholar] [CrossRef]
  40. He, J.; Rodriguez-Saona, L.E.; Giusti, M.M. Midinfrared spectroscopy for juice authentication-rapid differentiation of commercial juices. J. Agric. Food Chem. 2007, 55, 4443–4452. [Google Scholar] [CrossRef]
  41. Zeb, A. A reversed phase HPLC-DAD method for the determination of phenolic compounds in plant leaves. Anal. Methods 2015, 7, 7753–7757. [Google Scholar] [CrossRef]
  42. Schneider, E.; Von Der Heydt, H.; Esperester, A. Evaluation of polyphenol composition in red leaves from different varieties of Vitis vinifera. Planta Med. 2008, 74, 565–572. [Google Scholar] [CrossRef]
  43. Fernandes, F.; Ramalhosa, E.; Pires, P.; Verdial, J.; Valentão, P.; Andrade, P.; Bento, A.; Pereira, J.A. Vitis vinifera leaves towards bioactivity. Ind. Crops Prod. 2013, 43, 434–440. [Google Scholar] [CrossRef]
  44. Fernandes, F.H.A.; Santana, C.P.; Santos, R.L.; Correia, L.P.; Conceição, M.M.; MacÊdo, R.O.; Medeiros, A.C.D. Thermal characterization of dried extract of medicinal plant by DSC and analytical techniques. J. Therm. Anal. Calorim. 2013, 113, 443–447. [Google Scholar] [CrossRef]
  45. Portu, J.; López-Alfaro, I.; Gómez-Alonso, S.; López, R.; Garde-Cerdán, T. Changes on grape phenolic composition induced by grapevine foliar applications of phenylalanine and urea. Food Chem. 2015, 180, 171–180. [Google Scholar] [CrossRef]
  46. Caliskan, G.; Nur Dirim, S. The effects of the different drying conditions and the amounts of maltodextrin addition during spray drying of sumac extract. Food Bioprod. Process. 2013, 91, 539–548. [Google Scholar] [CrossRef]
  47. Mishra, P.; Mishra, S.; Mahanta, C.L. Effect of maltodextrin concentration and inlet temperature during spray drying on physicochemical and antioxidant properties of amla (Emblica officinalis) juice powder. Food Bioprod. Process. 2014, 92, 252–258. [Google Scholar] [CrossRef]
Figure 1. FTIR absorption spectrum ‘Aglianico’ (A) and ‘Greco di Tufo’ (B) leaf extract with EtOH (red line), MetOH:H2O (70:30) (black line), H2O (blue line). The measured absorbance spectrum reported was baseline corrected. Peaks are identified by numbers. The wavelength of the peak absorbance is indicated in Table 4.
Applsci 11 05827 g001
Figure 2. Three-dimensional principal component analysis (PCA) score plot of ‘Aglianico’ and ‘Greco di Tufo’ leaf extract with EtOH, MetOH:H2O (70:30), H2O, derived from SIMCA. Data analysis was performed in smaller ranges of spectrum reported above each plot. The spectrum ranges correspond to those reported in Table 3. 1 = EtOH extract; 2 = MetOH:H2O (70:30) extract; 3 = H2O extract.
Applsci 11 05827 g002
Figure 3. HPLC profile of leaf extract of Aglianico of October (black line), Aglianico of November (red line), Greco di Tufo of October (blue line), and Greco di Tufo of November (green line) at 280 NM and 360 NM. 1 = gallic acid, 2 = vanillic acid, 3–4 = quercetin derivatives, 5–6 = Kaempferol derivatives.
Applsci 11 05827 g003
Figure 4. HPLC profile of Aglianico of November leaf extract at 280 nm. (A) MeOH:H2O (70:30) (red line) and H2O (black line). (B) MetOH:H2O (70:30) (red line) and EtOH (black line).
Applsci 11 05827 g004aApplsci 11 05827 g004b
Figure 5. Macroscopic image, dimensional distribution curve and SEM image of lyophilized Aglianico raw extract AGL-28 (a,c,e) and MPA powders (b,d,f).
Applsci 11 05827 g005
Figure 6. In-vitro dissolution profile in water of the raw extract (AGL-28 dark green line) and MPA powder (light green line).
Applsci 11 05827 g006
Figure 7. Macroscopic and microscopic images of AGL-28 extract (a,c) and MPA powder (b,d) after 6 months of harsh storage conditions.
Applsci 11 05827 g007
Figure 8. Thermal behavior by DSC analysis of AGL-28 extract (blue and black lines) and MPA powder (red and green lines) before and after 6 months of harsh storage conditions.
Applsci 11 05827 g008
Figure 9. t-test, means ± SD, * p < 0.05 and **** p < 0.0001; (a) total phenol content; (b) EC50 ± standard deviation; In a unit of µg of unprocessed AGL-28 or µg of AGL-28 in MPA; (c) TEAC value ± standard deviation; TEAC value in unit of mM Trolox/mg of AGL-28 or mg of AGL-28 in MPA.
Applsci 11 05827 g009
Table 1. Instrumental and process conditions of the MAE extraction method.
Power (Watt)SolventExtraction Time (min)Solid:Liquid Ratio
180EtOH51:10
MeOH:H2O (70:30)51:10
H2O51:10
300EtOH21:10
MeOH:H2O (70:30)21:10
H2O21:10
Table 2. Flowability scale accepted and published on the U.S. Pharmacopeia.
Compressibility IndexFlow EvaluationHausner Ratio
≤10Excellent1.00–1.11
11–15Good1.12–1.18
16–20Fair1.19–1.25
21–25Passable1.26–1.34
26–31Poor1.35–1.45
32–37Very poor1.46–1.59
>38Very, very poor>1.60
Table 3. Polyphenol concentrations in Vitis vinifera ‘Aglianico’ and ‘Greco di Tufo’ leaves (mg/g of leaf powder extract) after MAE with different solvents and extraction conditions. Ethanol extract (EtOH), methanol:water extract 70:30 (MeOH:H2O), water (H2O) extract.
Polyphenols (mg/g)
180 W 5 minExtraction Solvent
EtOHMeOH:H2OH2O
Aglianico October (AGL-1)24.92 ± 3.1140.69 ± 3.7675.39 ± 6.93
Aglianico November (AGL-2)26.14 ± 1.9854.99 ± 4.9983.61 ± 7.45
Greco di Tufo October (GRC-1)17.43 ± 2.1245.34 ± 3.5679.18 ± 6.43
Greco di Tufo November (GRC-2)28.80 ± 3.7125.76 ± 2.4187.79 ± 7.51
300 W 2 min
EtOHMeOH:H2OH2O
Aglianico October (AGL-18)16.00 ± 1.1126.16 ± 2.0583.99 ± 7.49
Aglianico November (AGL-28)23.42 ± 1.5743.64 ± 3.94100.67 ± 9.29
Greco di Tufo October (GRC-18)26.07 ± 1.9935.47 ± 3.1280.96 ± 7.50
Greco di Tufo November (GRC-28)8.65 ± 0.7522.36 ± 2.1095.63 ± 9.51
Table 4. Vibrational mode of ‘Aglianico’ and ‘Greco di Tufo’ leaf extract spectra based on current literature. Range values of the peaks for ‘Aglianico’ and ‘Greco di Tufo’ harvested in October and November are reported.
Spectral Ranges Analyzed with SIMCAPeak Wavelength (cm−1)Vibrational Mode
Solvent
EthanolMethanol–Water (70:30)Water
3600–30003353-33223332OH and C-H stretch.
2999–28002961- CH2 and CH3 stretching vibrations
2926-29322932
2855-
1750–15241721-17191720Carbonyl C=O streching
1655- Aromatic ring C=C stretching
1608-16061606
1523–11711449-
13981398C–O stretching vibrations
1376
130813081308
125112641260
120412021200
1170–945107810751076Aromatic C–H in plane bend. C–O stretching vibrations
944–66092092092C–H deformation vibrations, out-of-plane bend
895895893
823820820
778778779
712712712
Table 5. Interclass distance of ethanol (EtOH), methanol:water (MeOH:H2O) and water (H2O) extracts.
Spectrum Wavelength cm−1 4000–650
GroupsRecognition (%) aRejection (%) bInterclass Distance c
EtOH100(8/8)100(16/16)EtOH-MeOH:H2O140
MeOH: H2O100(8/8)93(15/16)EtOH-H2O83
H2O100(8/8)75(12/16)MeOH: H2O-H2O2
Spectrum wavelength cm−1 3000–2800
GroupsRecognition (%) aRejection (%) bInterclass distance c
EtOH100(8/8)100(16/16)EtOH-MeOH:H2O23
MeOH: H2O100(8/8)93(15/16)EtOH-H2O24
H2O100(8/8)50(8/16)MeOH: H2O-H2O2
Spectrum wavelength cm−1 1750–1524
GroupsRecognition (%) aRejection (%) bInterclass distance c
EtOH100(8/8)100(16/16)EtOH-MeOH:H2O90
MeOH: H2O100(8/8)87(14/16)EtOH-H2O670
H2O100(8/8)100(16/16)MeOH: H2O-H2O4
Spectrum wavelength cm−1 1523–1171
GroupsRecognition (%) aRejection (%) bInterclass distance c
EtOH100(8/8)100(16/16)EtOH-MeOH:H2O18
MeOH: H2O100(8/8)100(16/16)EtOH-H2O30
H2O100(8/8)87(14/16)MeOH: H2O-H2O3
Spectrum wavelength cm−1 1170–945
GroupsRecognition (%) aRejection (%) bInterclass distance c
EtOH100(8/8)100(16/16)EtOH-MeOH:H2O7
MeOH: H2O100(8/8)93(15/16)EtOH-H2O5
H2O100(8/8)50(8/16)MeOH: H2O-H2O4
Spectrum wavelength cm−1 944–660
GroupsRecognition (%) aRejection (%) bInterclass distance c
EtOH100(8/8)100(16/16)EtOH-MeOH:H2O59
MeOH: H2O100(8/8)81(13/16)EtOH-H2O31
H2O100(8/8)62(10/16)MeOH: H2O-H2O2
Notes: a Percentage of recognition in optimal model shall be as close to 100%; b Percentage of rejection in optimal model shall be as close to 100%; c Interclass distances should be as high as possible, minimum 3.
Table 6. Interclass distance of V. vinifera extratcs of leaves of ‘Aglianico’ harvested in October (AO), ‘Aglianico’ harvested in November (AN), Greco di Tufo harvested in October (GO) and ‘Greco di Tufo’ harvested in November (GN).
Vitis vinifera VarietiesSpectrum Wavelength cm−1 4000–650
GroupsRecognition (%) aRejection (%) bInterclass Distance c
AglianicoOctober100(8/8)12(2/16)AO:AN1.35
November100(8/8)6(15/16)AN:GO3.38
AO:GO1.29
Greco di tufoOctober100(8/8)100(0/16)GO:GN3.40
November100(8/8)31(5/16)GN:AN1.97
GN:AO1.69
Notes: a Percentage of recognition in optimal model shall be as close to 100%; b Percentage of rejection in optimal model shall be as close to 100%; c Interclass distances should be as high as possible, minimum 3.
Table 7. Composition and characteristics of raw materials and spray-drying powders.
SampleM/P
g/100 mL
AGL-28
g/100 mL
Yield
%
TEC a
%
TAC b
%
AEC c
%
AAC d
%
EE e
%
d50 µm
(Span) f
AGL-28------10.4 ± 1.5 d 20.22 (8.13)
MP010/0.1-61.84 ± 2.14-----n.d.
MP110/0.2-62.43 ± 3.36--- n.d.
MP210/0.3-69.84 ± 2.14
MP310/0.4-77.88 ± 0.17-----6.46
(1.74)
MP410/0.5-78.04 ± 1.21-----5.34
(1.99)
MPA10/0.40.583.26 ± 0.344.8 ± 0.31 f0.48 ± 0.05 f4.51 ± 0.630.45 ± 0.0893.966.17
(2.02)
MPA/110/0.50.577.57 ± 2.06n.d. gn.d.n.d.n.d.n.d.5.27
(1.47)
M: maltodextrin; P: pectin; AGL-28: ‘Aglianico’ raw extract; a theoretical extract content; b theoretical active content; c actual extract content; d actual active content; e encapsulation efficiency; f span value calculated as (d90 − d10)/d50; g not determined.
Table 8. Flow properties of MPA powder.
SampleBulk Density (g/cm3) ± S.D. *Tap Density (g/cm3) ± S.D.HR ± S.D.CI ± S.D.Flow Character
MPA245.70 ± 7.16269.99 ± 9.191.10 ± 0.019.00 ± 0.01Excellent
* Standard deviation; the results are expressed as an average of triplicate analyses. Data are mean ± S.D.
Publisher’s Note: MDPI stays neutral with regard to jurisdictional claims in published maps and institutional affiliations.

