1. Introduction
Recently, there has been increased focus on energy efficiency, with the aim of reducing the harmful effects of global warming. The construction industry accounts for a great amount of the energy consumed around the world, which is predominantly utilized for cooling and heating purposes. This has led to the development of ‘energy-efficient’ structures, in which comfortable temperatures are sustained during winter months with no requirement for heating systems, and during summer with no air-conditioning. Numerous passive design approaches have been proposed in recent years with the aim of improving buildings’ thermal efficiency in a cost-effective manner by using solar energy. At the same time, the development of active design technologies has enabled the efficiency of building services applications to be enhanced, with buildings consuming lower amounts of energy when performing identical functions. When passive approaches and active technologies are accurately combined regarding designing buildings, this can lead to a substantial enhancement in the performance of the buildings, along with optimized energy savings.
Changes in the climate, along with its associated issues, particularly global warming, are triggering the necessity for people to use more energy to cool and heat buildings [
1]. Increased energy usage, particularly from energy generated by fossil fuels, causes a rise in the amount of greenhouse gases (GHG) released into the atmosphere, which further increases global warming, and this presents a dilemma. More than 83% of GHG emissions are associated with the generation and usage of energy [
2]. While numerous countries have realized that energy sourced from fossil fuels is non-renewable, and there has been increased usage of perpetual sources (solar energy) as well as renewable energy such as wind, which has led to a reduction in the amount of GHG released into the atmosphere, the utilization of such energy sources remains restricted. This motivates the need to prioritize the conservation of energy, because a single unit of energy saved equates to the production of two energy units [
2].
The majority of countries have specifically focused on the buildings sector, as it is one of the primary users of environmental resources. For example, according to the International Energy Agency (IEA), one-third of total energy and one-third of total CO
2 emissions are attributed to buildings (IEA) [
3], because energy and water wastage continues to be one of the most significant environmental economic uses related to buildings as a result of their permanence and continuity during the entire period in which the building is operational [
4]. The consumption of energy by buildings around the world is projected to increase by an average annual rate of 1.5% between 2012 and 2040 [
4]. The energy consumption of Jordanian residential structures equates to approximately 22% of the overall energy consumed, and close to 43% of all electricity consumed [
5]. Furthermore, 49% of the energy consumed in residential structures in the city of Amman is utilized for cooling and heating [
6].
1.1. Passive Design for Efficient Buildings
Therefore, this has led to the development of the idea of ‘energy-efficient’ structures, in which temperatures are sustained at comfortable levels during winter without the necessity of operating heating systems, and during summer with no air-conditioning. In recent years, numerous passive design approaches have been proposed to enhance the thermal efficiency of buildings in a cost-effective manner using solar energy, which mirrors the increased focus on lowering the consumption of energy around the world. At the same time, the development of active design technologies has made building service applications more efficient, thus requiring a reduced amount of energy to fulfill the same purpose. If passive approaches and active technologies can be accurately combined when designing buildings, this can produce significant energy savings, considering that the optimal time at which passive approaches should be integrated is the design stage [
7,
8].
Passive design involves the determination of the shape and orientation of buildings, window magnitude, type of glazing, the materials utilized for wall construction and for isolating the inner part of the envelope from the environment, and the thermal mass within the building in terms of the storage of thermal energy [
4,
8]. On the other hand, active design concentrates on improving the efficiency of building systems, including heating, ventilation, air-conditioning (HVAC), lighting, and other appliances within the building. Passive approaches are highly dependent on the climate features in the location, meaning that strategies that are effective in arid and hot zones differ from those that function in zones that are temperature or hot/humid [
5].
Passive design approaches have gained the interest of architects and scholars over the years because of the minimal additional investment required [
8]. Numerous scholars have investigated building design criteria that are capable of reducing the energy required to heat and cool buildings, including orientation, envelope systems, shape, passive cooling and heating systems, shading, and glazing using a variety of techniques—for instance mathematical equations, small-scale building modules, or building information modeling (BIM) and energy simulation programs for the purpose of recommending the optimal properties for every criterion used in passive design according to where the structure is located (climate region) [
1,
3,
4,
5,
9,
10,
11,
12]. For instance, all studies conducted thus far using the abovementioned techniques have affirmed that building orientations are optimized where the long axis and the large glazing area face the north for buildings located in the Southern hemisphere [
11], and the south in the Northern hemisphere [
3,
4,
5,
10].
1.2. WWR Standards and Daylighting Codes
The light levels required for the efficient and accurate completion of tasks will be achieved by using natural light, electrical light, or by combining the two. In general, there is a strong preference for windows in buildings due to the provision of natural light as well as the views they allow of external environments. However, it is critical that windows are designed in such a way that the visual and thermal comfort of occupants is not impacted and their privacy is not violated. Daylight has the potential to save energy and it is also important regarding occupants’ health and wellbeing.
Recently, standards for all European countries were established by the CEN (European Committee for Standardization). While multiple standards exist, those with the highest importance are EN 12464 Lighting for Workplaces, which stipulates the minimum criteria for lighting within buildings (Part 1) [
13]. EN 12464-1:2011 considers the significance of natural light; and its lighting criteria for most interior work environments with respect to the amount and standards of lighting normally apply regardless of whether they are satisfied by natural light, electric lighting, or a mixture of the two. EN 15193-1:2017 (Building Energy Performance—Energy Criteria for Lighting) takes into consideration the impact of natural light on lighting energy consumption (monthly and yearly) and classifies the availability of natural light as a function of the natural light factor.
In EN 15193, the European Energy Performance of Buildings Directive describes a method that can be used to estimate the consumption of energy that extends beyond overall installed loads. The lighting energy numerical indicator is used as a measurement of the overall consumption of energy for lighting for a specific space for a whole year, divided by the space’s area. The unit of measurement is kWh/m
2 per annum, which provides a plausible estimate of the amount of energy used by a given lighting fixture [
14].
Currently, a single standard (ISO 10916:2014) is applicable for techniques used to calculate daylight in both extant structures and when designing new or renovation construction projects. ISO 10916:2014 provides a definition of the calculation approach that should be used to determine the volume of functional natural light that penetrates commercial buildings via vertical facades or skylights on a monthly or yearly basis, as well as the impact it has on the artificial lighting demand. It can be employed for current structures and for designing new buildings and in renovation projects. ISO 10916:2014 stipulates the general lighting energy balance equation associated with the installed power density of the artificial system of lighting with a supply of natural light and controllable lighting (the proof calculation technique).
Several independent bodies have published guidance resources and established the requirements for best practices in the field. These include the Chartered Institution of Building Service Engineers, a London-based organization that has produced a series of lighting guides on daylighting, which present recommendations for building services engineers on minimizing the WWR of bedrooms and sitting rooms in the range between 15% and 50% [
15]. A standard was published by the Illuminating Engineering Society of North America (IESNA) on an accepted technique for WWR with a threshold of 40%. The window-to-wall ratio was restricted to 40% by the IES Spatial Daylight Autonomy (SDA) and Annual Sunlight Exposure (ASE), which presents a new collection of metrics for measuring the daylighting performance of both extant buildings and new projects, from the conception stage through to construction documents.
Various recognized and frequently techniques utilized to assess, rate, and certify building sustainability, including LEED (Leadership in Energy and Environmental Design), BREEAM (Building Research Establishment Environmental Assessment Methodology), and German society for sustainable building DGNB (Deutsche Gesellschaft für nachhaltiges Bauen). These methods have provided daylighting recommendations within their evaluation strategies. Generally, while the daylight factor is a commonly used indicator, there are variations in terms of the methods used for calculation and benchmarking. In addition to the daylight factor, other indicators used to describe visual comfort include external views, glare management, and lighting levels [
16,
17].
1.3. LED and Building Design Parameters
Additionally, researchers have investigated the impact of enhancing the efficiency of active technologies to lower the energy demands of buildings, including heating, lighting, ventilation, and air-conditioning systems, on the energy used throughout the building [
13]. For instance, all researchers who have investigated this area so far have recommended that that the compact fluorescent lamp (CFL) bulbs should be replaced with energy-efficient LED lights throughout buildings to lower the amount of energy consumed and decrease the amount of GHG released by buildings [
18,
19,
20].
The integration of daylight into building plans is a critical design strategy that is applied with the purpose of enhancing both the performance and design of the structure. Windows are crucial architectural features that enable natural light to enter buildings and allow residents to connect visually with the external surroundings. However, when window sizes are out of proportion, this can cause heat to be lost or gained, which can have a negative impact on the thermal efficiency of the structure. The application of passive design approaches such as WWR will affect the usage of energy of buildings in the future, and stresses the importance of analyzing the effect of the magnitude of windows on overall energy usage.
In a recent study, Zahra Zolfaghari explored the impact of using LED bulbs on the optimum WWR and the overall consumption of energy in Open Offices using energy simulation software. The findings revealed the impact of such lighting systems on the overall consumption of energy and demonstrated the possibility of reduction of the optimum WWR by between 40% and 20% using LED lighting rather than fluorescent lighting, which produces increased energy savings [
21].
Windows account for approximately 50% of lost heating in buildings [
22]. As a result of the significance of window size for the level of energy consumed in buildings, this has attracted the interest of multiple researchers. All researchers that have investigated this topic thus far have affirmed that optimal WWR is the key to reducing heat loss via windows during winter and summer heat gain. Additionally, it has been consistently demonstrated that the thermal efficiency of buildings is reduced when the window sizes are larger.
Table 1 summarizes the studies selected in this review of the literature on the optimum window-to-wall ratio.
In the literature, numerous studies have investigated the design criteria of buildings that have the potential to diminish the demand for energy for cooling and heating buildings; including shape, orientation, envelope mechanisms, materials used in insulation, type of glazing, and others, employing a variety of techniques—such as mathematical equations or building modules utilizing BIM and energy simulation programs—for the purpose of recommending optimal conditions for every criterion in passive design according to the building location and associated climate and microclimate. Additionally, studies have explored the impact of enhancing the efficiency of active technologies on reducing the energy demand of buildings, including lighting, heating, ventilation, and air-conditioning systems, on the total consumption of energy. Nevertheless, there has been minimal focus on the impact of enhancing the efficiency of active technologies on the optimal passive approaches [
26].
The envelopes of the majority of buildings experience considerable heat loss or gain via windows, which has a subsequent impact on the thermal comfort of those in the building. Without windows, buildings can save energy, but this is not feasible in reality because occupants require natural light for reasons of comfort and physiological effects. The selection of suitable window dimensions is a complicated procedure, given that it requires the factors of energy savings, external view, and daylighting to be taken into account at the same time [
27].
It is recognized that increasing the efficiency of active technologies can impact buildings’ optimal passive strategies. Nevertheless, there has been minimal focus in the literature on how increasing the efficiency of active technologies impacts on optimal passive approaches; hence, the aim of this study is to investigate the effects of enhancing the efficiency of lighting systems on the optimum WWR of residential structures in Jordan. Additionally, this research intends to emphasize the significance of these types of studies on ameliorating ‘energy-efficient’ buildings. The results were generated from an intricate simulated model of a standard Jordanian residential building, utilizing DesignBuilder.
Nevertheless, there has been minimal focus on the impact of enhancing the efficiency of active technologies on the optimal passive approaches; hence, this study investigates the effects of making lighting systems more efficient on the optimum WWR of residential structures in Jordan. This study proposes the hypothesis that the WWR of a residential structure with artificial lighting systems with high efficiency installed will be lower in comparison with a building in which solar lighting is used.
Optimization of WWR offers a balanced solution to the contradictions involved in selecting an appropriate WWR in future building design to sustain occupants’ thermal comfort with the least amount of heating, cooling, and lighting energy. Although increasing the efficiency of active technologies impacts the passive approaches used in buildings, for future sustainable building design, it is essential to find the optimal WWR for minimizing cooling and heating loads, as well as ensuring an appropriate level of lighting.
In this study the main aim is to investigate the effects of enhancing the efficiency of lighting systems on the optimum WWR of residential structures within Jordan. Additionally, this research intends to emphasize the significance of these types of studies on enhancing ‘energy-efficient’ buildings. The results are based on an intricate simulation of a standard residential building in Jordan, utilizing the energy simulation software DesignBuilder.
2. Materials and Methods
DesignBuilder was employed to simulate an intricate model of a standard Jordanian residential building for the purpose of exploring the impact of LED, a state-of-the-art efficient lighting system, on the optimum WWR of Jordanian residential structures.
DesignBuilder has been developed based on the EnergyPlus program, EnergyPlus software has been created by the US Department of Energy (DOE), to evaluate the environmental performance of new or existing buildings. It can provide sufficient analysis of Energy and comfort inside the building, HVAC, day lighting, cost, design optimization, etc. [
28].
The methodology steps in this analysis are as follows:
Modeling the building geometry in the environment of DesignBuilder.
Assigning thermal zones and all fixed building parameters.
Running the simulation for various WWR scenarios, from no glazing to 100% with 10 percent increment.
Jordan is located between the Arabian Desert and the eastern Mediterranean area, which explains the climatic conditions of the country—characterized by long, hot, and dry summers and short and cold winters. In fact, December, January, and February are the coldest months, with averages of maximum/minimum temperatures equivalent to 10 °C and 5 °C, respectively. However, July, August, and September are considered as the hottest months, with averages of maximum/minimum temperatures of 35 °C and 20 °C. During the summer, daily temperature increases considerably until reaching or exceeding 40 °C in some cases—especially when a hot, dry, and southeastern wind blows. Generally, in winter, significant amounts of precipitation fall, between 200–400 mm, which decrease/stop during the summer season.
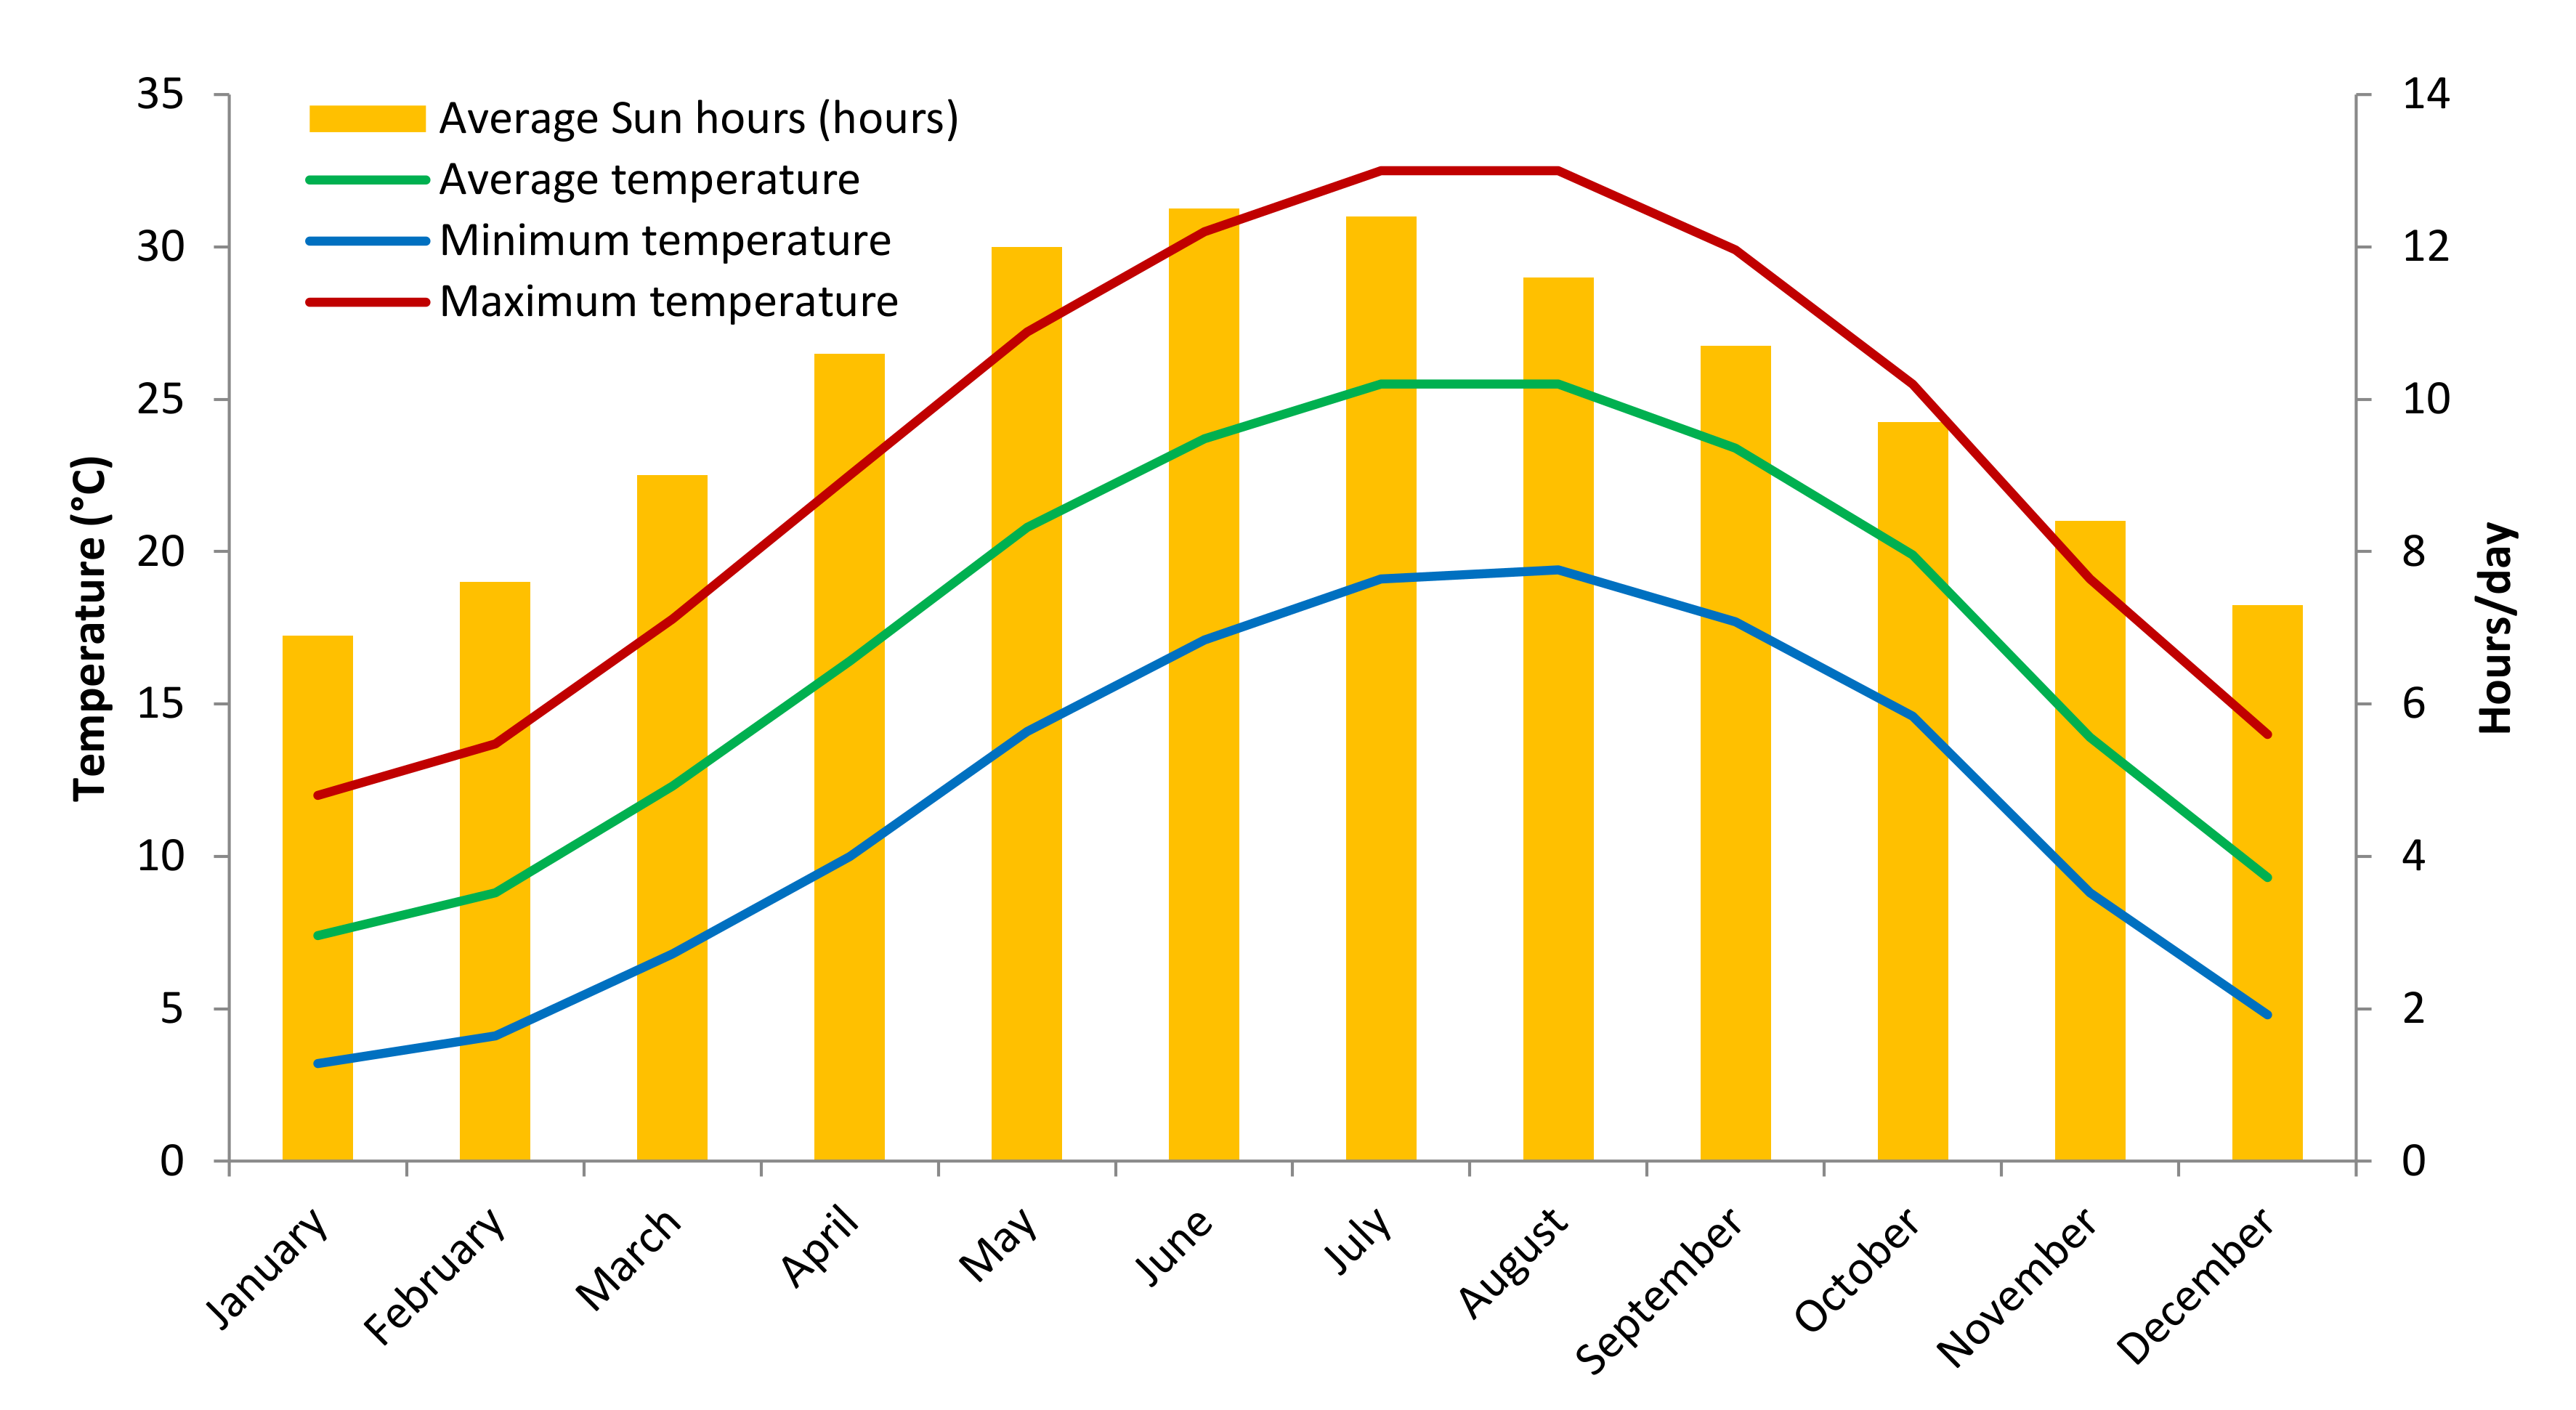
There are different climate zones in Jordan. Some zones are like the Mediterranean climate, and the others are almost like the desert climate. The Jordanian weather is characterized by four distinct seasons, where autumn and spring are the ideal human comfort range. The capital of Jordan, Amman, is classified as sub-humid Mediterranean. The sub-humid Mediterranean climate is characterized by hot, dry summers and rainy winters. This climate has an average temperature of around 3 °C in the coolest winter months. It has a dry summer month with average temperature in the warmest month reaching up to 34 °C, and the sun hours range from 7 h in the winter months and up to 13 h in the summer months [
29] as shown in
Figure 1.
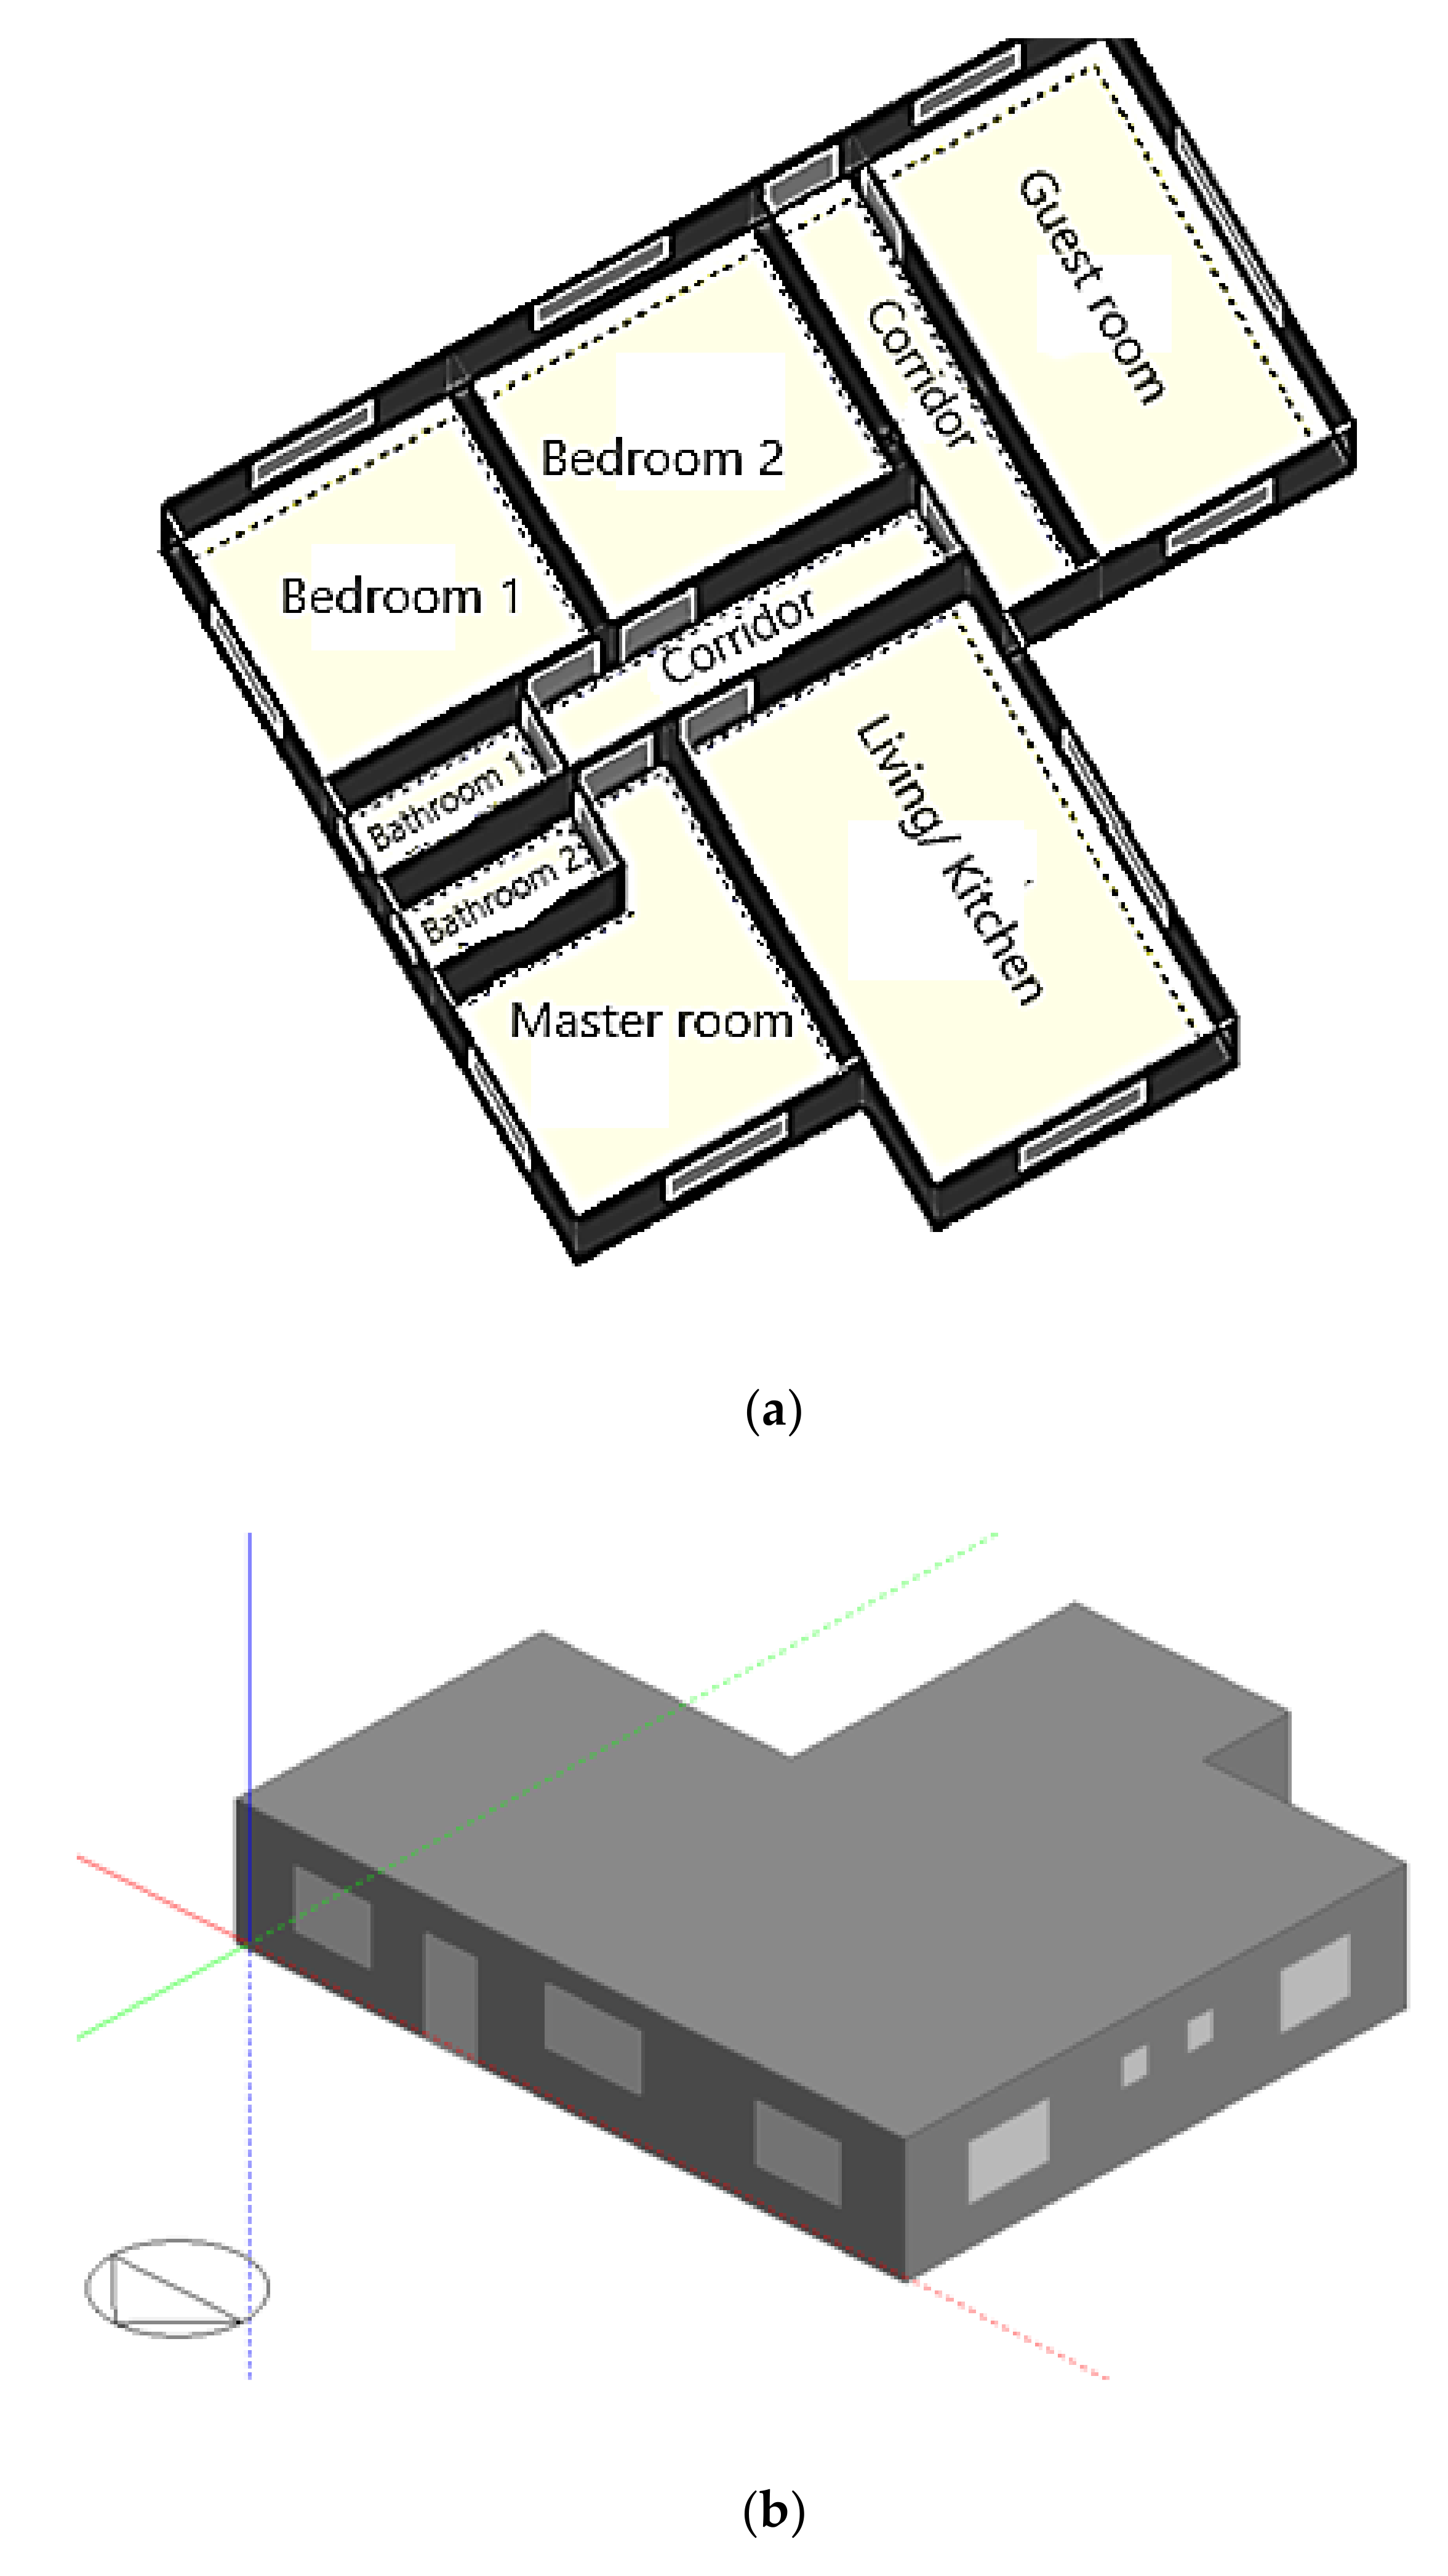
A house with an area of 130 m
2, located in Amman, Jordan (31.98° N latitude; 35.98° W longitude; 779 m above sea level), is selected as a case study. Amman is in the Mediterranean climate zone (ASHRAE climate zone: 3C).
Figure 2 shows the schematic design of the house.
As the building’s geometry approaches a square shape, the effect of orientation is decreased [
10]. Thus, the orientation of this case-study building can be ignored since both axes are 15 m. Also, it’s assumed that the building has not been affected by nearby objects, e.g., buildings or trees. Thus, the potential effects of shading were ignored.
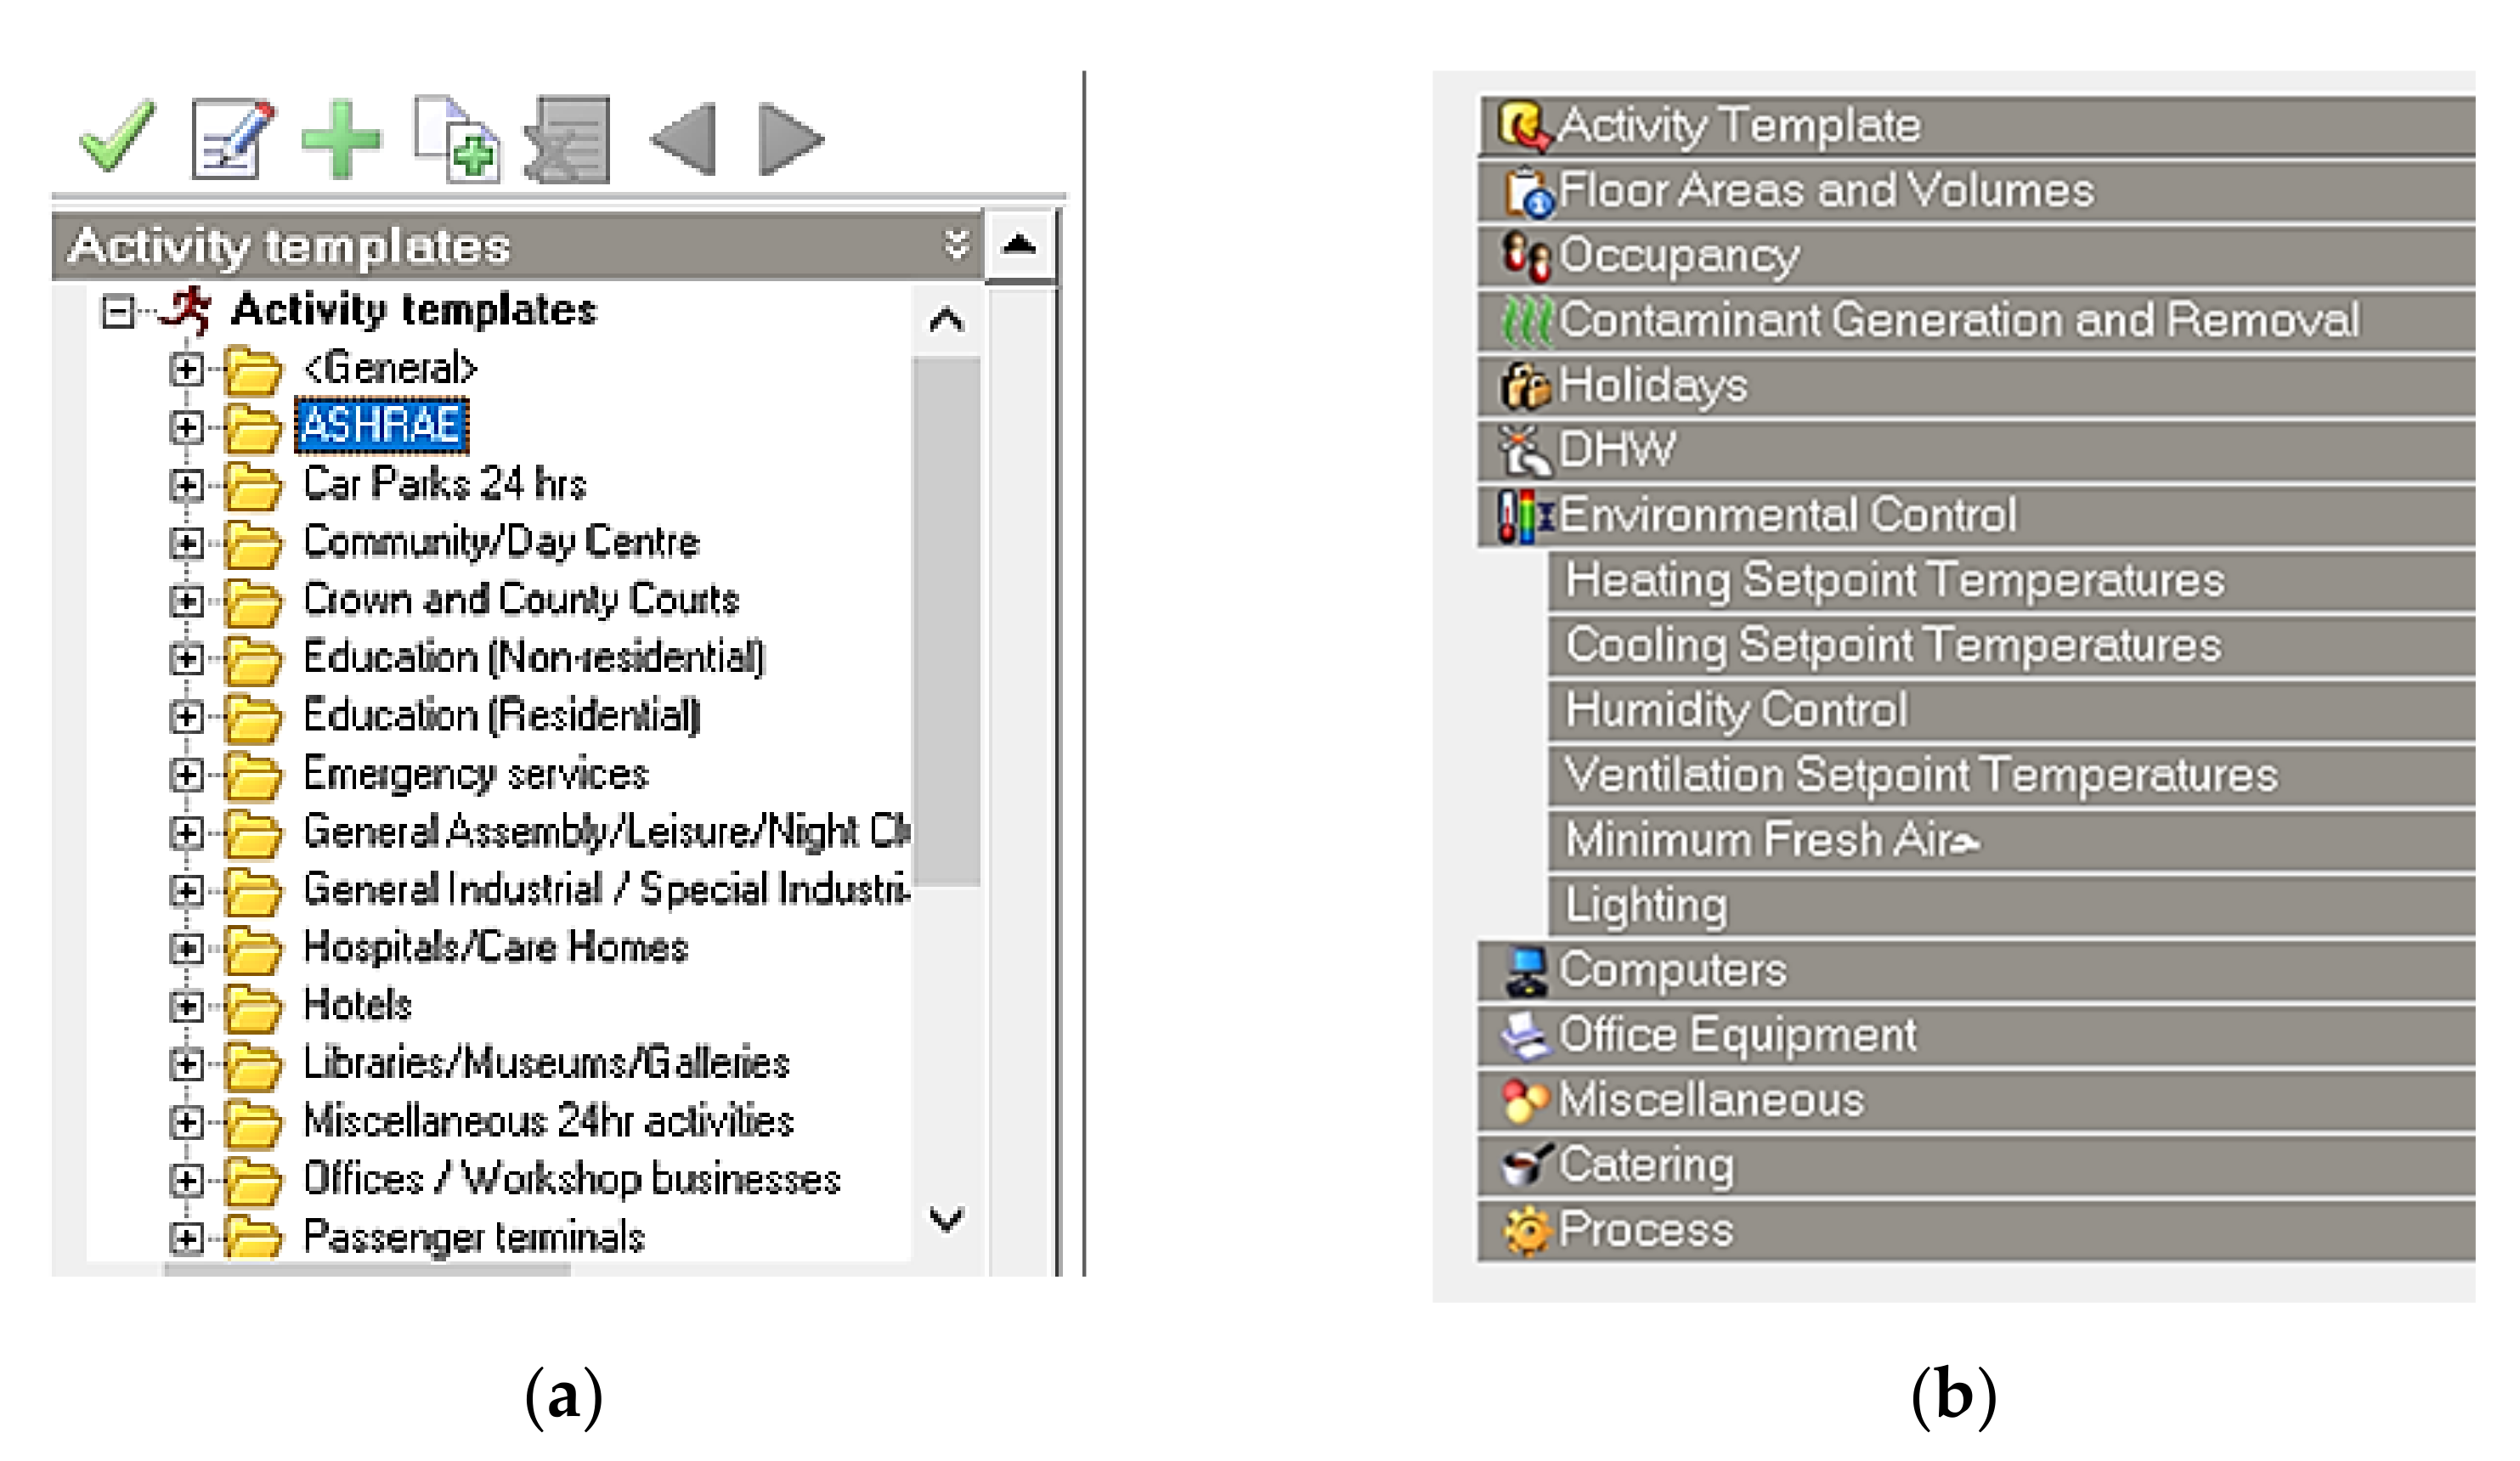
After modeling the building’s geometry in the environment of DesignBuilder, setting the building activity template would be the next step. DesignBuilder includes many activity templates, shown in
Figure 3a, that contain pre-determined parameters such as metabolism rate, rate of occupancy, type of clothing, etc. In this simulation, the default parameters included in the residential/dwelling unit (with kitchen) are adopted, except that the heating and cooling set point temperatures were changed to 19 °C and 27 °C respectively, as shown in
Figure 3b, according to the recommendation of [
30]. The occupancy tab in DesignBuilder allows selection of the number of family members, which is important to determine the occupancy in the building, and occupancy is represented as an area for each member (m
2/person), but in this evaluation, the default settings will be kept. However, all the parameters can be altered by the user, which will impact the results.
The construction and materials details of the building envelope have been chosen such that they can represent the parameters used for a typical family house in Jordan. (walls, floor, roof, and external windows’ glass and frame materials are detailed in
Table 2).
The external windows’ glass layers consist of 6 cm thick generic BLUE, then an air gap of 6 cm, followed by 6-cm-thick generic CLEAR glazing with an overall U-value of 3.1 W/m2·K. There is a total solar transmission (SHGC) of 0.7, direct solar transmission of 0.6, and light transmission of 0.781. Window dimensions will be changed consecutively in 11 different situations, with a preferred height of 1.5 m.
Building air infiltration is an important parameter response of carrying the external cold air into the internal building environment, which significantly increases the heating load during winter. Building airtightness allows significant energy savings with a low cost [
31,
32]. In the DesignBuilder updated version, 0.35 air changes per hour value were adopted. This value has been set according to ASHRAE codes [
33].
Our case-study building is a typical Jordanian building; the materials (defined in
Table 2) have been selected according to the local building codes. The area of the house chosen for the study represents an average area of Jordanian housing. Since in DesignBuilder all of the parameters can be altered by the user, which will impact the results, we have mentioned in detail which of the other parameters were kept as the program default settings, and which were changed according to the recommendation of recent studies. In the building, thermal performance energy simulation and daylighting analysis has been established; and modeling tools have been developed, such as DesignBuilder and DAYSIM for climate-based daylighting with the use of radiance engine and incorporating EnergyPlus for single-thermal-zone energy simulation. However, each program has different capabilities and limitations as they use different simulation engines and default input sets by each tool [
34].
The main advantages of DesignBuilder are using the detailed HVAC design option with user-friendly graphic user interface and capability of using quick and easy single-point-in-time radiance daylighting analysis. On the other hand, DAYSIM does not have an advanced HVAC design, or energy simulation settings compared with DesignBuilder, and an absence of multi-zone thermal analysis.
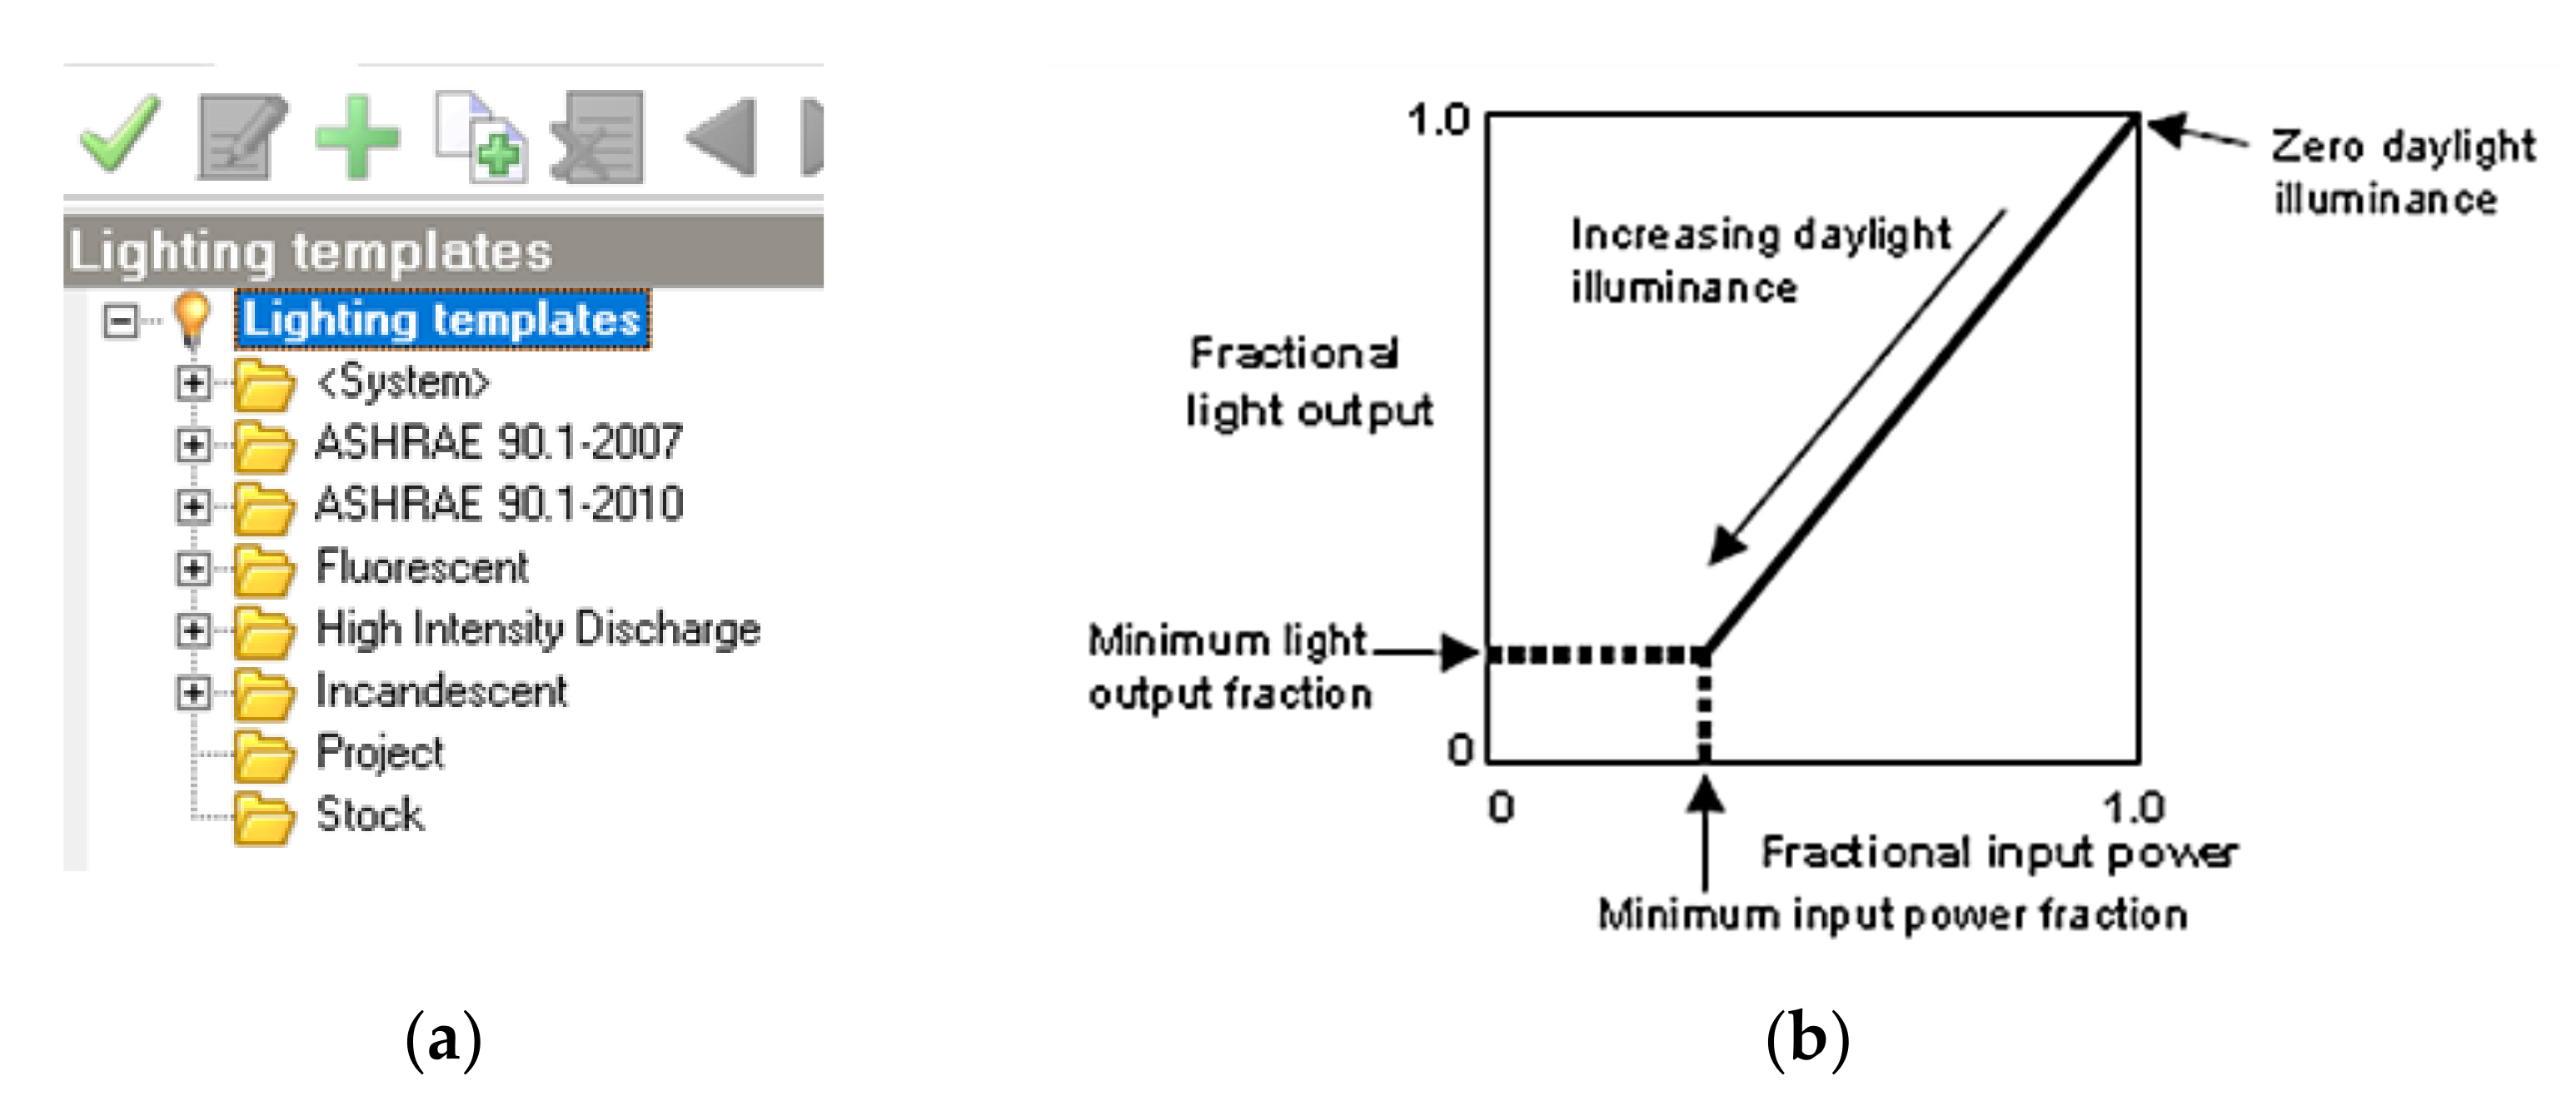
DesignBuilder includes many lightning templates, shown in
Figure 4a; ‘LED with linear control’ was chosen in this simulation. Every lighting template has many parameters that can be altered by the user, which will impact the results. For this simulation, the “Linear/off” control type was chosen, with a minimum output fraction of 0.1 and minimum input fraction of 0.1, a working plane height of 0.8 m, and maximum allowable glare index of 22, the lighting will be on for 18 h per day and the rest of the parameters kept as default. For the “Linear/off” control, the overhead lights dim continuously and linearly from maximum electric power, maximum light output to minimum electric power, minimum light output as the daylight illuminance increases, shown in
Figure 4b. The lights switch off completely when the minimum dimming point is reached, with further increase in the daylight illuminance. Normalized power density of the artificial lighting system: 2.50 (W/m
2-100 lux), model design illuminance: 300 lux, visible fraction of 0.18, radiation fraction of 0.42.
DesignBuilder includes five luminaire types, which affect the output data of lighting loads. The “Suspended” luminaire type was chosen in this simulation. These lights hang from the ceiling by a rod, cord, or chain; suspended fixtures provide uniform light distribution. The house is heated and cooled using an HVAC template (fan coil unit (4-pipe), air-cooled chiller) as the default setting in DesignBuilder.
Because buildings are formed of numerous integrated systems, changes made to a specific element can affect other connected elements. Therefore, to determine the impact of efficient lighting systems on the size of windows, each of the building parameters was set as previously described: a total of 11 WWR situations, ranging from 0% to 100% with increments of 10%, were evaluated for various design options to determine the optimum WWR for the LED system. The height of the windows was fixed at 1.5 m for the external windows layout.
After the completion of all the necessary steps in the preparation of the model to simulate energy as described, the simulation was performed and a general DesignBuilder report was produced for the different WWR situations.
3. Results and Discussion
It is critical for the sustainability of future projects that recommendations are provided, such that WWR can be optimized to reduce cooling and heating loads while still retaining an appropriate level of lighting. The impact of making active technologies more efficient than the suggested passive strategies can be identified by utilizing various techniques, one of which involves the use of simulation programs.
The present study explores the effect of utilizing LED for lighting systems in residential structures on the optimum WWR purely based on energy consumed. Therefore, the simulation was performed and a general DesignBuilder report was produced for different WWR situations, as described in the methodology part. The results have been presented graphically to facilitate understanding. After this, a comparison between the results was made to make appropriate decisions.
A simulation-based approach, utilizing DesignBuilder, was employed for studying and examining the impacts of lighting systems on the optimum WWR for a standard residential building in Jordan. The findings offer beneficial guidance that emphasizes the effects that lighting systems have on window sizes and their mutual impacts on the overall energy consumption. While the optimum WWR proposed in this research only pertains to the consumption of energy, if this is are integrated with the preferences of building occupants, a satisfactory WWR can be generated that meets both design quality criteria and ensures building performance.
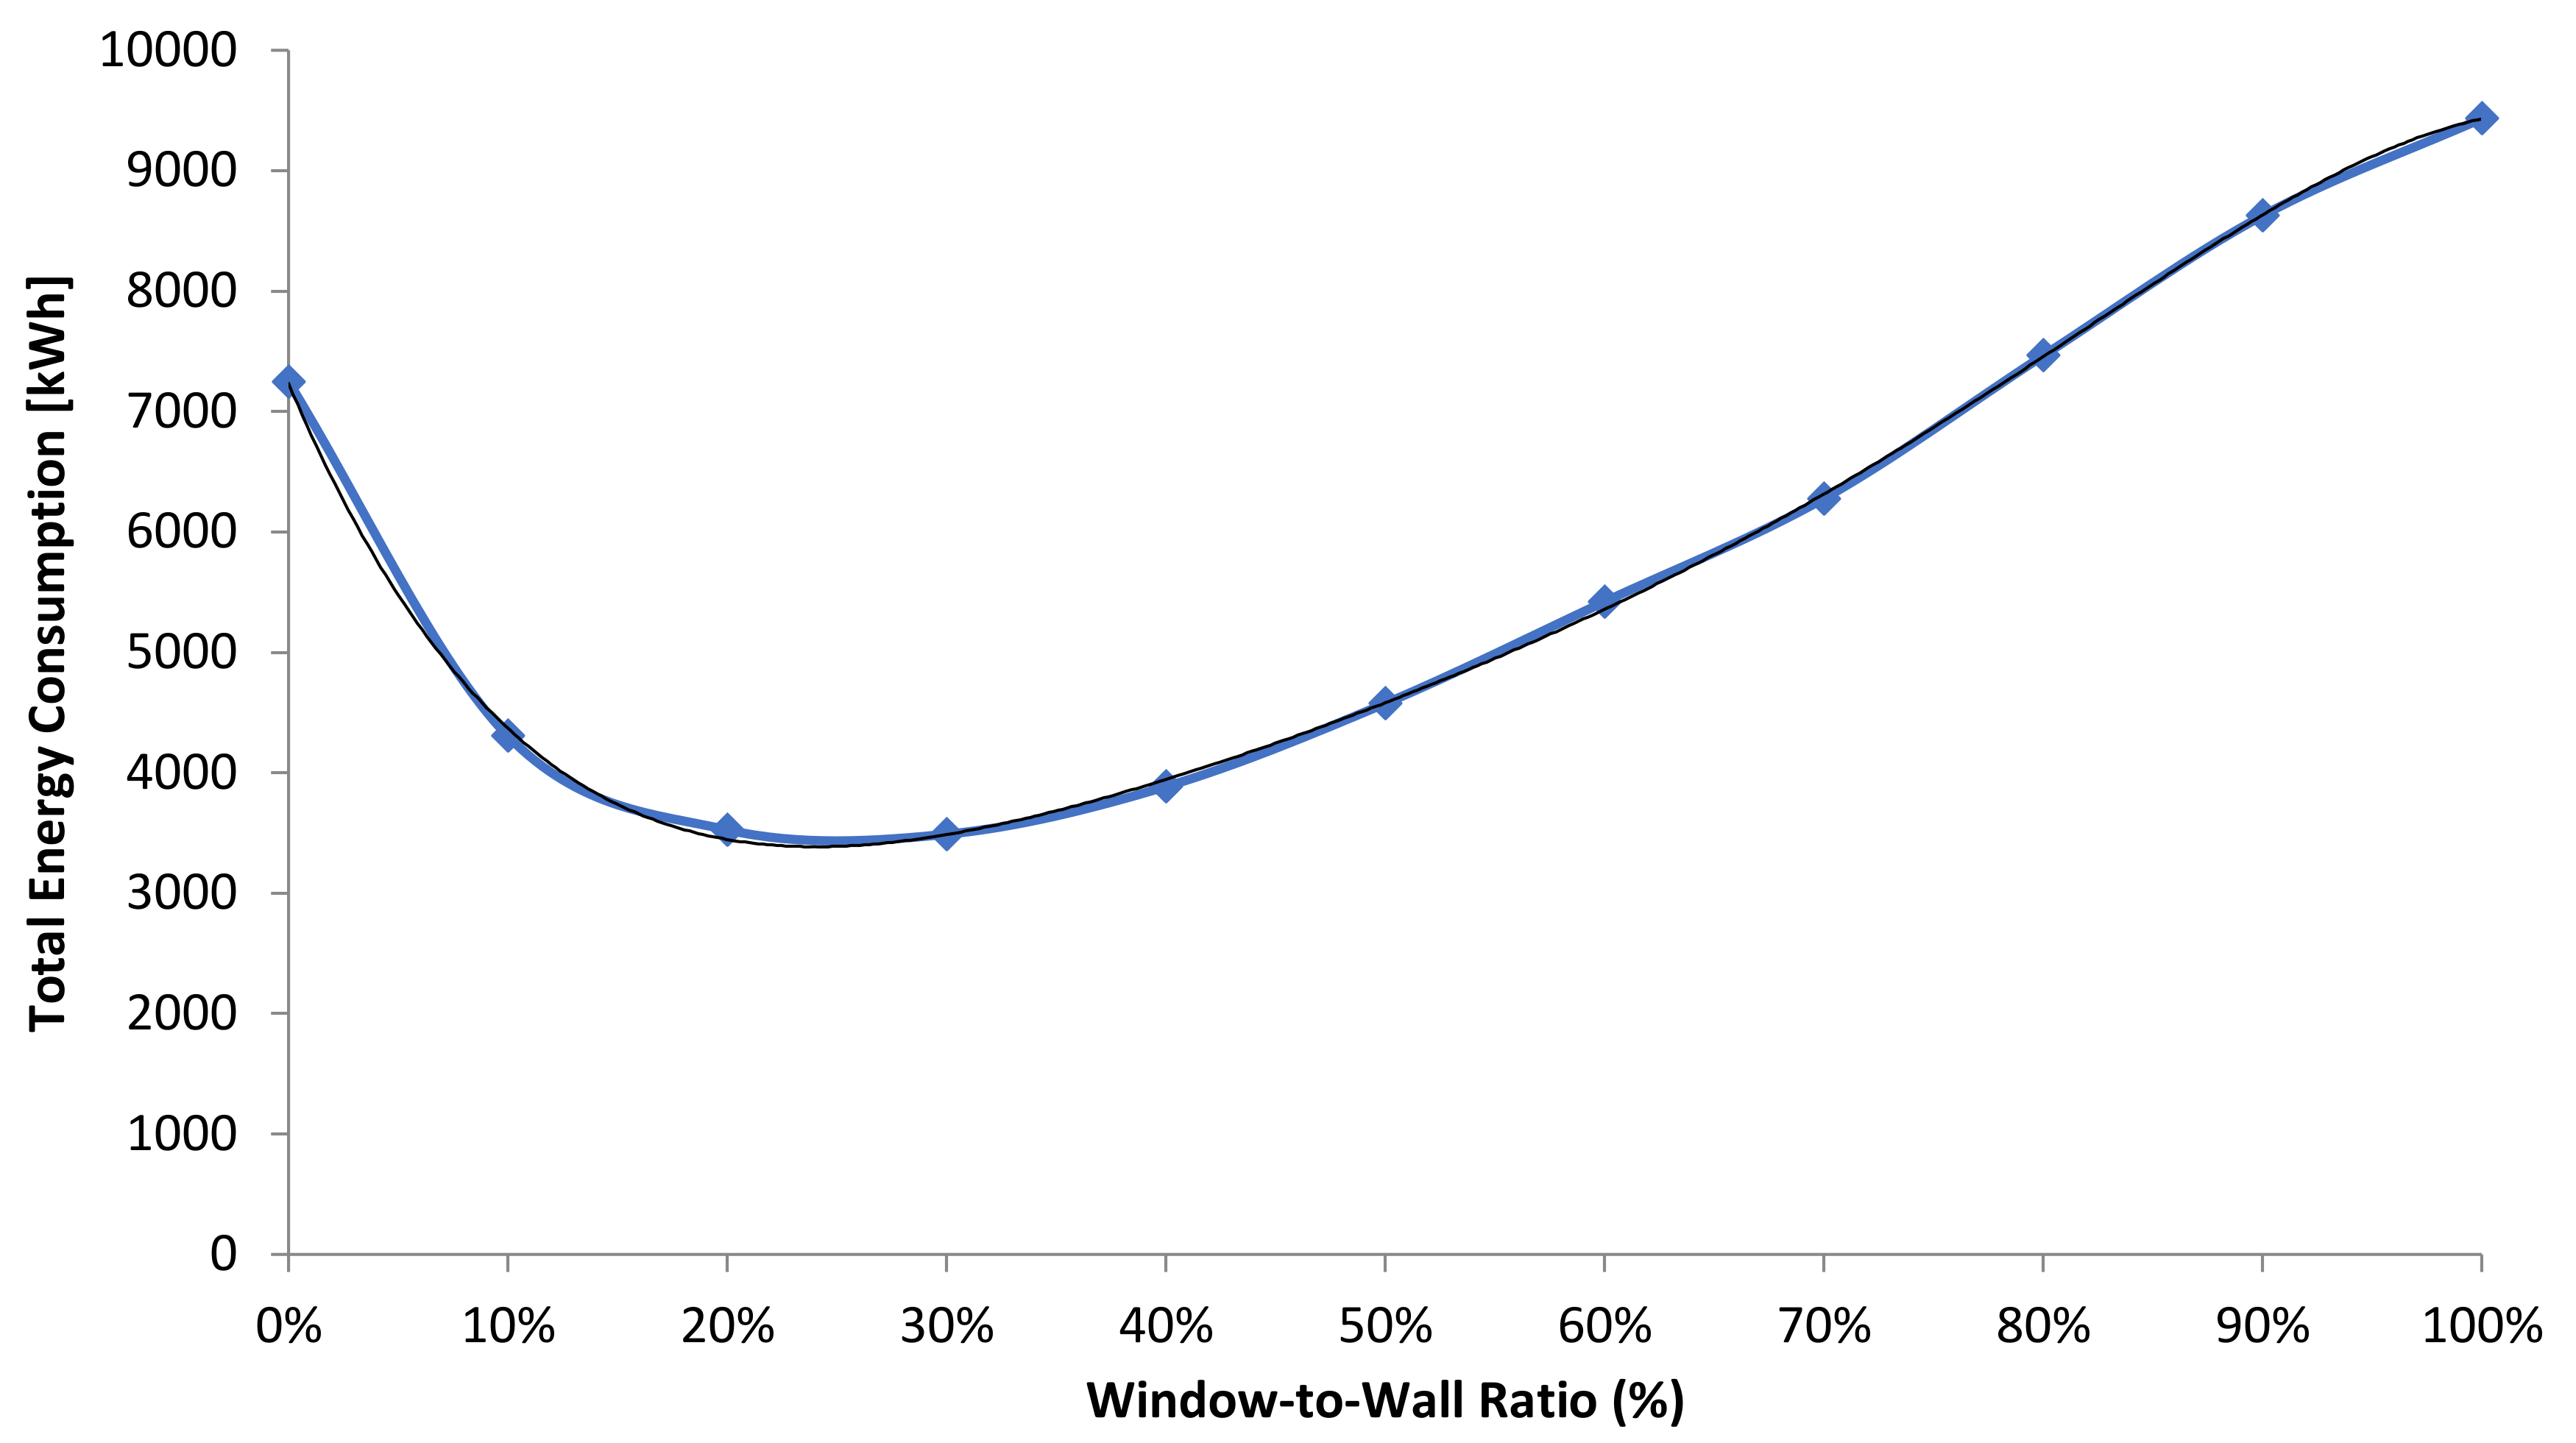
The overall site energy in the 0% and 80% scenarios exhibited strong similarities as shown in
Figure 5. Although the overall site energy was elevated in the 0% case, it showed a significant decrease in the 10% case. Similar reductions were observed in the 20% and 30% cases, but the overall site energy began to increase in a linear manner after the 30% case, reaching the maximum value in the 100% case.
Increasing WWR from 0% to 10% saves around 41% of the total energy consumption; increasing WWR from 10% to 20% saves around 18%; followed by almost 1% when increasing WWR from 20% to 30%; and afterward, an increase in the total energy consumption by 11%; on average, 18% for each 10% increment in WWR.
The following equation (Equation (1)) represents the relation between total building energy consumption (kWh) with different WWR (
x):
Such variations in the overall building energy in different WWR scenarios imply that if glazing is not present, which prevents heat and light transfer from occurring, the energy consumption of the residential structure is greater due to the increased window-to-wall ration, but the addition of a lower percentage of WWR causes the overall site energy to decrease.
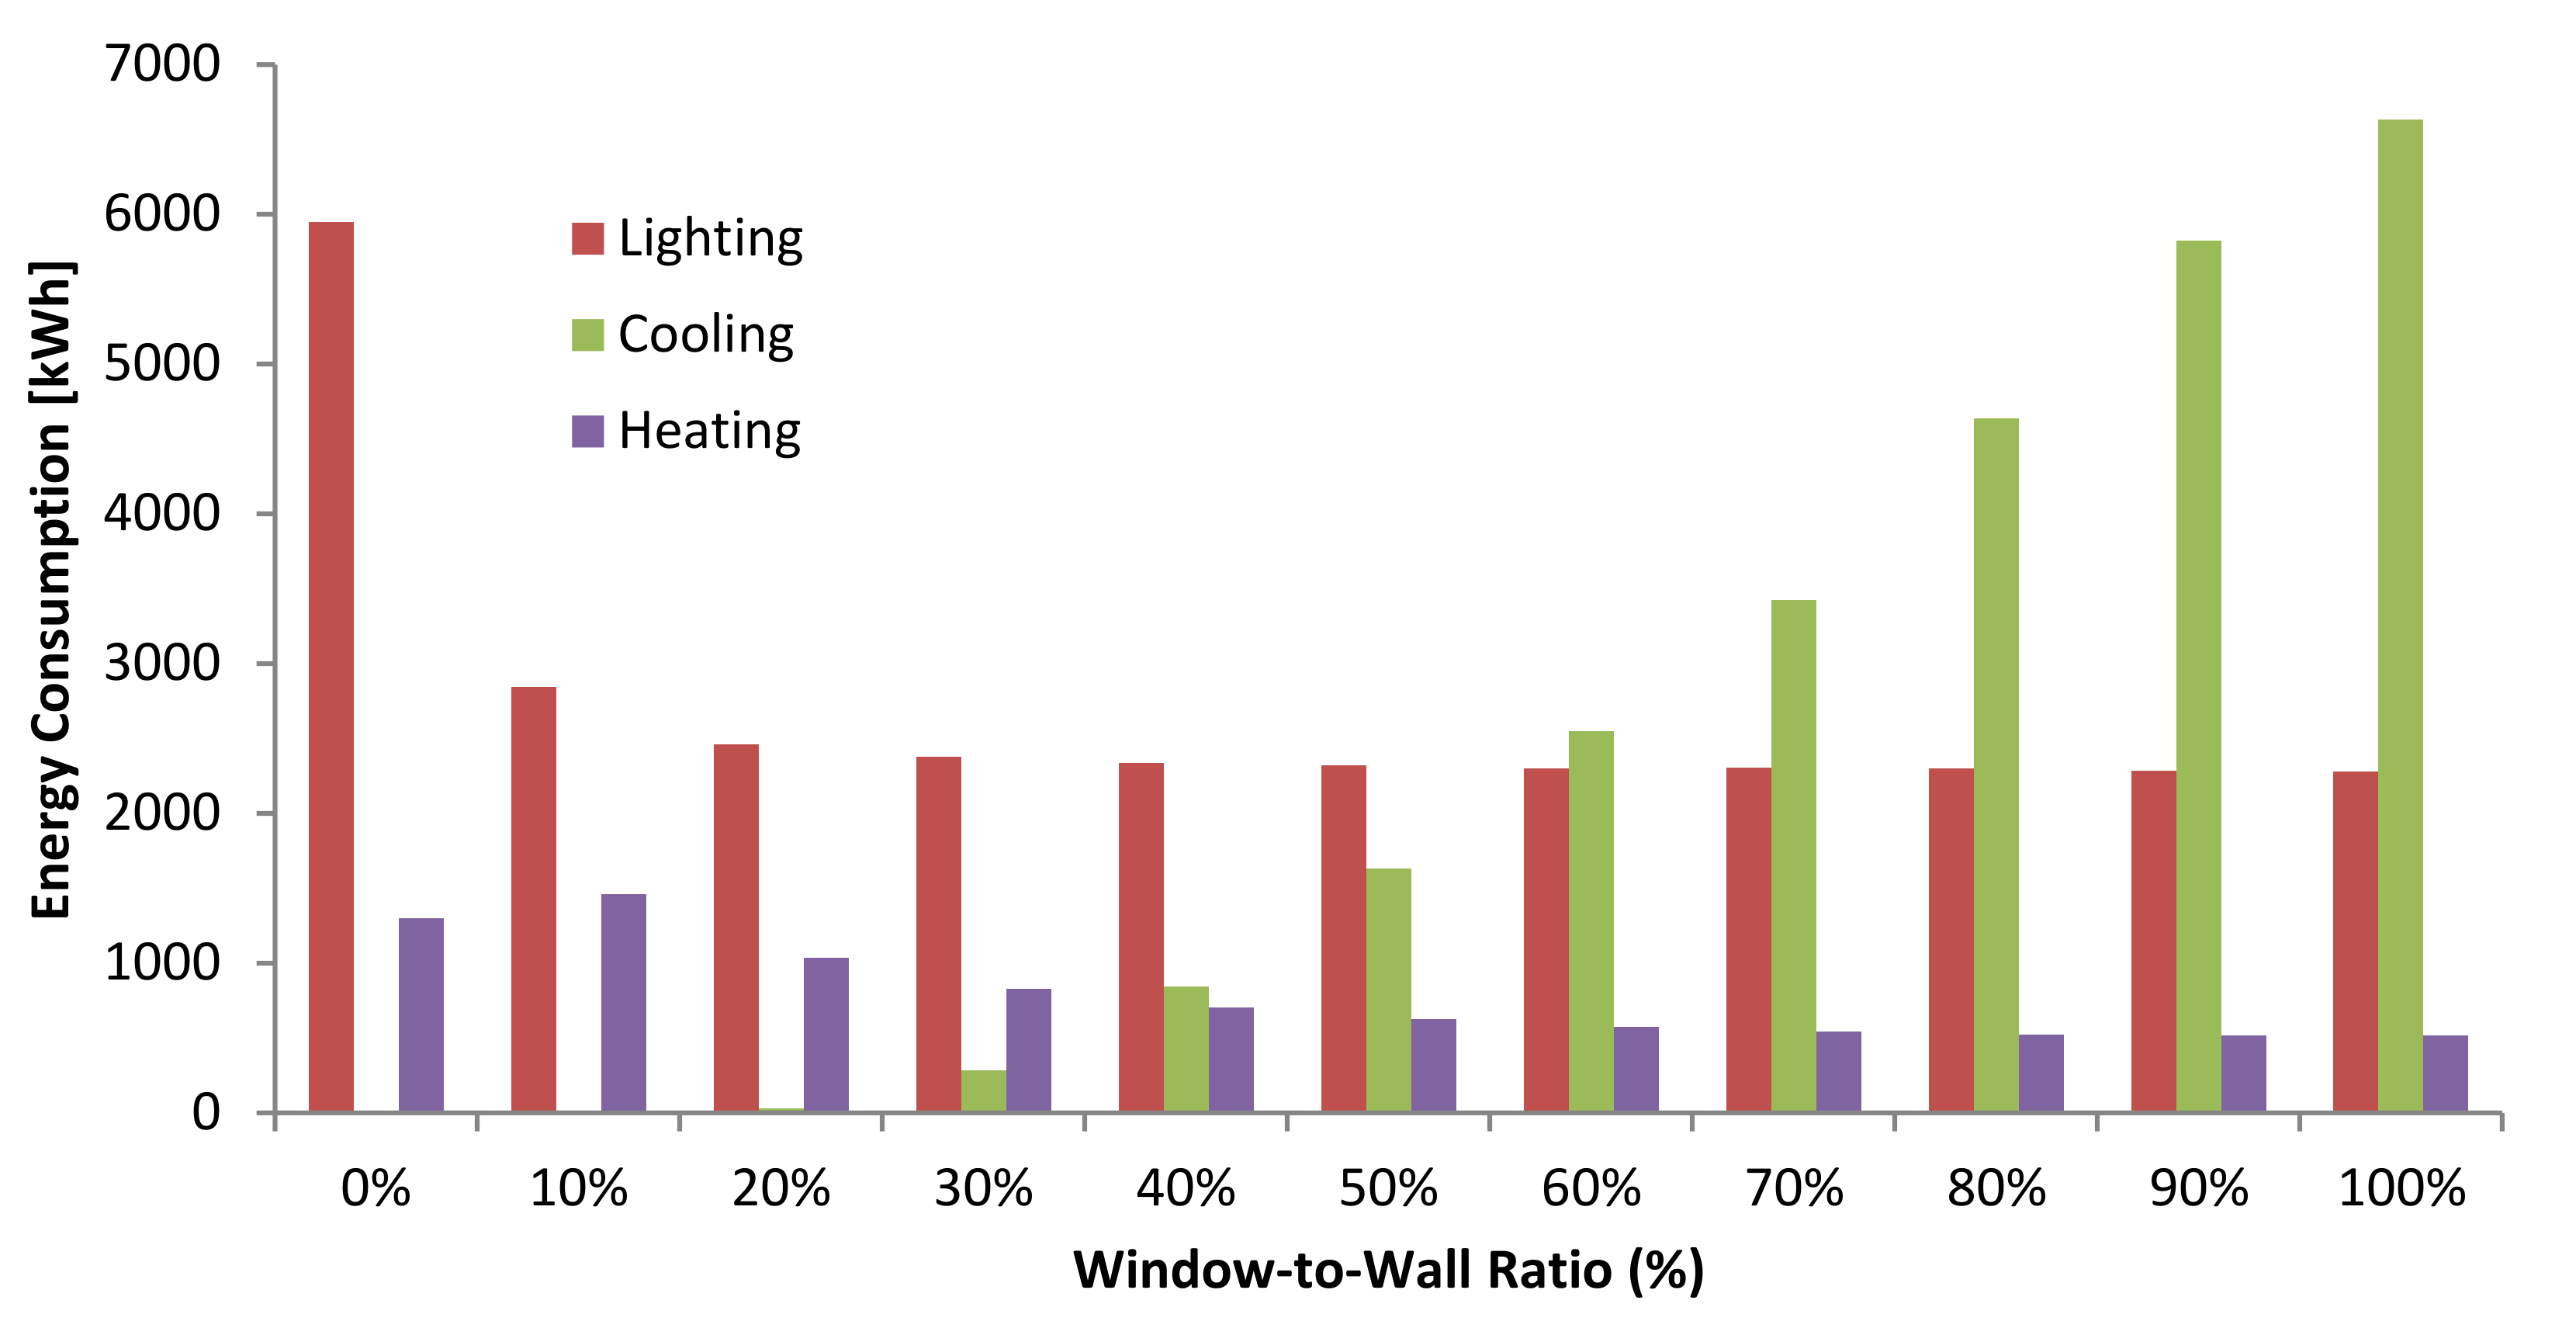
As illustrated in
Figure 6, as the WWR percentage increases, the cooling load rises; whereas decreases in lighting and loads occur. In the 0% case, the yearly consumption of lighting energy was elevated, but a significant decrease occurred in the 10% case. Nevertheless, from the 20% to 100% cases, only marginal differences were observed in terms of the diminishment of lighting energy.
Prior to the 20% scenario, the yearly consumption of energy for cooling was insignificant. However, a linear increase was then observed, starting from the 30% scenario, which reached a peak in the 20% scenario. Conversely, the consumption of energy for heating exhibited a linear decrease in terms of WWR percentage, apart from in the 10% case. Nevertheless, the reduction began to be insignificant from the 40% scenario onwards.
It was clear that the energy used for cooling spaces changed more significantly in comparison with the energy consumed for lighting and heating. Contrastingly, significant changes in terms of lighting energy only occurred between the 0% and 20% scenarios, but then stayed largely constant for the remainder of the scenarios.
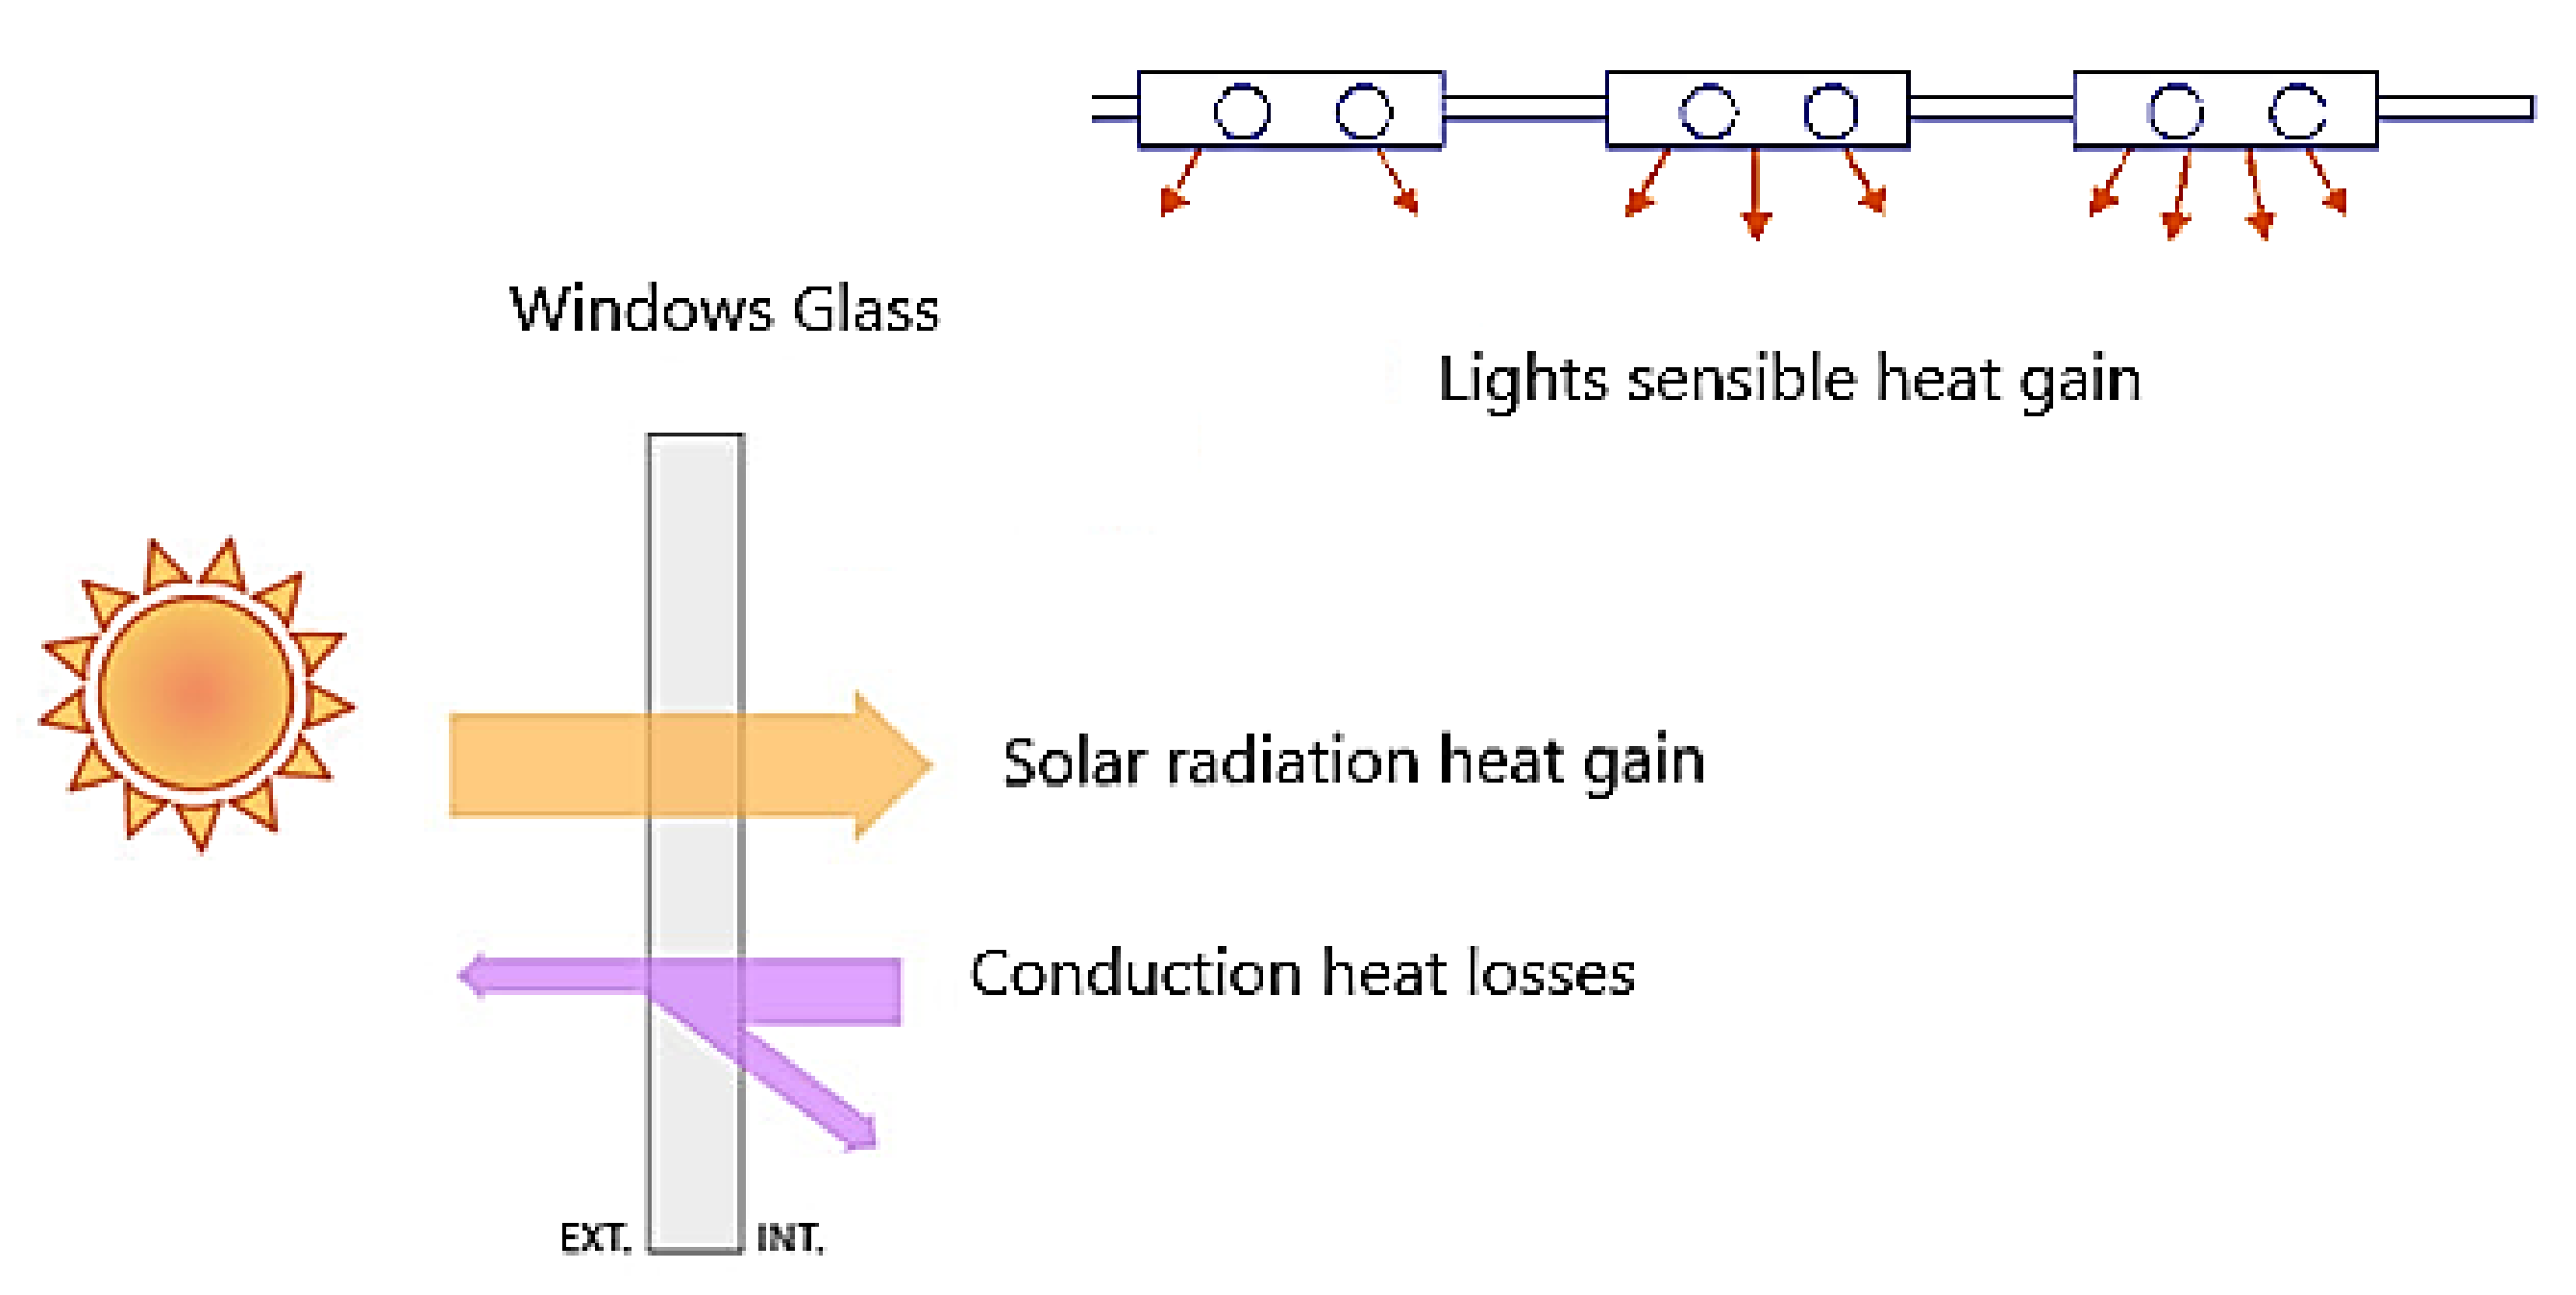
In general, the building gains heat through lights and solar radiation penetrating into the building through the glass, and the building lose some of the heat through the glass by conduction heat losses, as illustrated in
Figure 7.
The total annual heat gained and lost by the windows is summarized in
Figure 8; the red and green bars denote the yearly heat gain from windows and lighting, respectively, whereas yearly heat loss via windows is depicted by the blue bars.
When transitioning between the 0% and 100% scenarios, the yearly heat gain from windows exhibited a linear increase, while there was a decrease in the yearly sensible heat gain from light. Nonetheless, the variation in diminishment in the energy from light began to be insignificant between the 20% and 100% scenarios. Contrastingly, a linear increase in the yearly heat loss via windows occurred as the window-to-wall ratio increased. Because the rise in heat loss is not the same as the rise in heat gain, it is necessary to achieve a balance between light and solar heat gain to completely exploit energy from solar sources with no reverse impacts.
Energy simulation software was used to precisely determine the WWR for the residential structure in the design stage, between 25% and 30%, because altering an individual building element can affect different associated elements.
Exploiting daylight using windows assists with partially offsetting the demand for electric lighting and lowers the overall consumption of energy by the building. This can be achieved through the utilization of glazed materials to allow daylight to enter, as well as systems for controlling lighting that are capable of dynamically responding to the level of light. Nevertheless, if passive daylighting approaches are not implemented correctly, this can cause the energy consumption to increase. A factor that accompanies sunlight is solar heat radiation, which can cause a space’s HVAC load to increase and reduces the energy savings generated from daylighting.
Thus, it is necessary to achieve a balance between solar heat and light gain to effectively exploit solar energy with no reverse impacts. About this balance, because of technological developments achieved in lighting, it is questionable whether natural light is effective in lowering the overall energy consumed by buildings. As a result of the increased energy efficiency of LED luminaires, the energy consumption from light is relatively low, even in situations where the lighting system is functioning at peak capacity. Thus, it is not clear whether the solar energy entering via glazed materials is advantageous or disadvantageous for the overall consumption of energy in buildings.
This study proposes that the typical WWR for residential buildings containing a LED lighting system could be lowered to the range of 25–30%, which is lower than the maximum WWR of 40% stipulated in the ASHRAE standard [
35]. Furthermore, this study recommends that energy simulation programs should be utilized in the design stage to identify the optimum WWR, between 25% and 30%, for the design of residential structures in the future, because alterations to a single building element can affect a number of associated elements. Even though the optimum WWR can vary between 25% and 30%, it is still an effective representation of the reduction that can be achieved by making the lighting system more efficient.
4. Conclusions
Optimization of WWR offers a balanced solution to the contradictions involved in selecting an appropriate WWR in future building design to sustain occupants’ thermal comfort with the least amount of heating, cooling, and lighting energy. Although increasing the efficiency of active technologies impacts the passive approaches used in buildings, there has been minimal focus on this topic in the literature. Hence, the aim of this study is to investigate the effects of enhancing the efficiency of lighting systems on the optimum WWR of residential structures in the city of Amman in Jordan. Additionally, this research intends to emphasize the significance of these types of studies on enhancing ‘energy-efficient’ buildings. The results are based on an intricate simulation of a standard residential building in Jordan by utilizing the energy simulation software DesignBuilder.
Simulations were performed on 11 distinct WWRs ranging from 0% to 100%, with increments of 10%. The results generated by the simulation demonstrate the impact of enhancing the efficiency of the lighting system on the window size and emphasize the significance of combining optimum passive strategies with the most efficient active technologies when designing the building to maximize the overall energy savings while minimizing costs.
The findings refute the popular belief in terms of increasing size of windows to confirm that the building has enough lighting and using heating to lower the overall energy consumption, due to the variations in the overall site energy in different WWR scenarios that suggest that the highest amount of energy was used in the 0% scenario rather than the 80% scenario. Nevertheless, a low percentage of WWR caused the overall demand for energy to increase up to 30%. The findings offer useful guidance that stresses the significance of enhancing the efficiency of lighting systems on reducing the size of windows.
The results clearly revealed that there were more significant changes in terms of the space-cooling energy in comparison with the lighting and heating energy. Conversely, significant changes in lighting energy only occurred when transitioning from the 0% to the 20% scenario, but then stayed largely constant for the remainder of the scenarios. A factor that accompanies natural light is solar heat radiation, which can lead to considerable increases in terms of the building’s cooling and heating loads. Hence, it is necessary to strike a balance between solar heat and light gain to completely exploit solar energy with no reverse impacts. LED with linear control can be considered a cost-effective lighting strategy, which has been demonstrated to be effective in minimizing the energy consumed and therefore the volume of CO2 emitted.
This study proposes that the typical WWR for residential buildings containing a LED lighting system could be lowered to the range of 25–30%, which is lower than the maximum WWR of 40% stipulated in the ASHRAE standard. In addition, this study recommends that energy-simulation software is essential for use in the building designing process to precisely determine the WWR for the residential structure, between 25% and 30%, since changes made to an individual element can affect different associated elements, as quantitative strategies are limited in the settings and presumed properties of the models in this work, in the context of the Jordanian climate, and using local construction materials.
Finally, although the optimum WWR can range between 25% and 30%, it still provides a good indication of the reduction that can be achieved by enhancing the efficiency of lighting systems, because it is critical for the sustainability of future projects that recommendations are provided to determine the optimal WWR for minimizing cooling and heating loads, as well as ensuring an appropriate level of lighting. Additionally, this research intends to emphasize the significance of these types of studies on enhancing ‘energy-efficient’ structures.


 ,
, 


