Article

Polarization Measurements and Evaluation Based on Multidimensional Polarization Indices Applied in Analyzing Atmospheric Particulates

1
Guangdong Research Center of Polarization Imaging and Measurement Engineering Technology, Shenzhen Key Laboratory for Minimal Invasive Medical Technologies, Tsinghua Shenzhen International Graduate School, Tsinghua University, Shenzhen 518055, China
2
Department of Physics, Tsinghua University, Beijing 100084, China
3
Department of Biomedical Engineering, Tsinghua University, Beijing 100084, China
4
School of Mechanical and Precision Instrument Engineering, Xi’an University of Technology, Xi’an 710048, China
5
Center for Precision Medicine and Healthcare, Tsinghua-Berkeley Shenzhen Institute, Shenzhen 518071, China
*
Authors to whom correspondence should be addressed.
These authors contributed equally to this work.
Submission received: 24 May 2021 / Revised: 20 June 2021 / Accepted: 23 June 2021 / Published: 28 June 2021
(This article belongs to the Special Issue Advances in Gaseous and Particulate Air Pollutants Measurement)

Abstract

:
Online identification and characterization of suspended aerosols can provide a scientific basis for understanding aerosol transformations, quantitatively evaluating the impacts on air quality, public health, and the source apportionment of different atmospheric particulate matters. In this study, we confirm the validity of our developed high-throughput multi-angle polarized scattering vector detection of aerosols and multidimensional polarization scattering index systems. By observation of the mean values, variance, and Wilk’s Lambda of multidimensional polarization indices for different aerosol types, the polarization index shows unique characterization abilities for aerosol properties, and the optimal combination of polarization indices can always be found for a specific aerosol category with a high resolution and discrimination. Clearly, the multidimensional polarization indices of individual aerosols are more suitable for online and real-time aerosol identification and even help to explain the in situ microphysical characteristics of aerosols or evaluate the dynamic evolution of aerosols.

1. Introduction

The properties and distribution of aerosol particles in the atmosphere are attracting more and more research interest due to their impact on the climate system, air quality, and human health [1,2]. Particles with aerodynamic diameters smaller than 2.5 µm (PM2.5) have received considerable attention because of their great damage to human health, especially their ability to penetrate deep into the lungs and cause great damage. Particulate matter in the atmosphere has a variety of components, including carbonaceous material, sulfate, nitrate, ammonium, microorganisms, trace metals, sea salts, and crustal elements [3,4]. These particles suspended in the air have complex physical and chemical properties, such as wider size distribution, irregular morphology, and different optical absorption. Measuring these properties can help classify and recognize different kinds of aerosols, and even evaluate their possible source, which can be very important for the control of atmospheric environmental pollution and also to better understand atmospheric dynamics and long-range transport [5].
Various methods and technologies have been used to determine aerosol types [6,7,8,9]. A lidar system can provide altitude-resolved information. Based on extensive parameters, such as the scattering angstrom exponent (SAE), absorption angstrom exponent (AAE), and single scattering albedo (SSA) retrieved from Raman lidar systems [10] or high spectral resolution lidar (HSRL) systems [11], different aerosol types were distinguished by Silke Groß et al. [12] and Schmeisser et al. [5]. Some advanced lidar systems with polarization detection can improve the estimation of the microphysical properties of aerosols, allowing the backscattering separation of spherical particles from any other non-spherical particle [13].
In recent years, there have been many methods based on single-particle scattering in aerosol observation and analysis instruments [14,15,16], among which the aerosol optical counter (AOC) is most representative [17]. Research has revealed that the angular distribution of scattered light can be used to estimate a particle’s nature. For example, the signal around 12° scattering angle is sensitive to particle size, and the signal around 60° is sensitive to the refractive index of particles. Combining measurements at the two angles, a light optical aerosol counter (LOAC) can provide the size distribution and differentiate some kinds of particles like droplets, carbonaceous particles, salts, and mineral particles [18]. The polarization version of AOC that detects horizontal and vertical polarization components at a scattering angle of 120°, namely a polarization optical particle counter (POPC), is capable of classifying three aerosol types, mineral dust, air pollution, and sea-salt particles [19]. Our previous work also shows that the polarization index of S2/S0 at the scattering angle 115° can been used to differentiate soot from salt and sand [20].
A wealth of information, such as the size, composition, and morphology of particles, are contained in polarization properties. Extracting information based on the polarization method has been widely used in atmospheric, marine, and biomedicine applications [21,22]. Saeedesadat combined Mueller matrix polar decomposition (MMPD), frequency distribution histogram (FDH), and the central moment analysis method to distinguish qualitatively different bacterial colonies [23]. Li used polarization characterization [24,25] to distinguish different kinds of marine algae.
In this paper, we need an online dynamic monitoring system to analyze atmospheric suspended particulates one by one. It is difficult to obtain the full Mueller matrix of a single particle in real-time. Herein, we detect the Stokes vector of the suspended particles, and we can improve the information dimension of aerosol polarization signals by collecting the multi-angle scattering Stokes vectors synchronously. This paper presents a series of 24-dimension polarization indices from high throughput in situ measurements of various types of aerosol samples, and then we investigate the connection between aerosol properties and polarization scattering indices. Finally, we demonstrate how these polarization characteristics can help us to understand different particle attributes and evaluate the microphysical characteristics from different pollution sources.

2. Experimental Setup and Methods

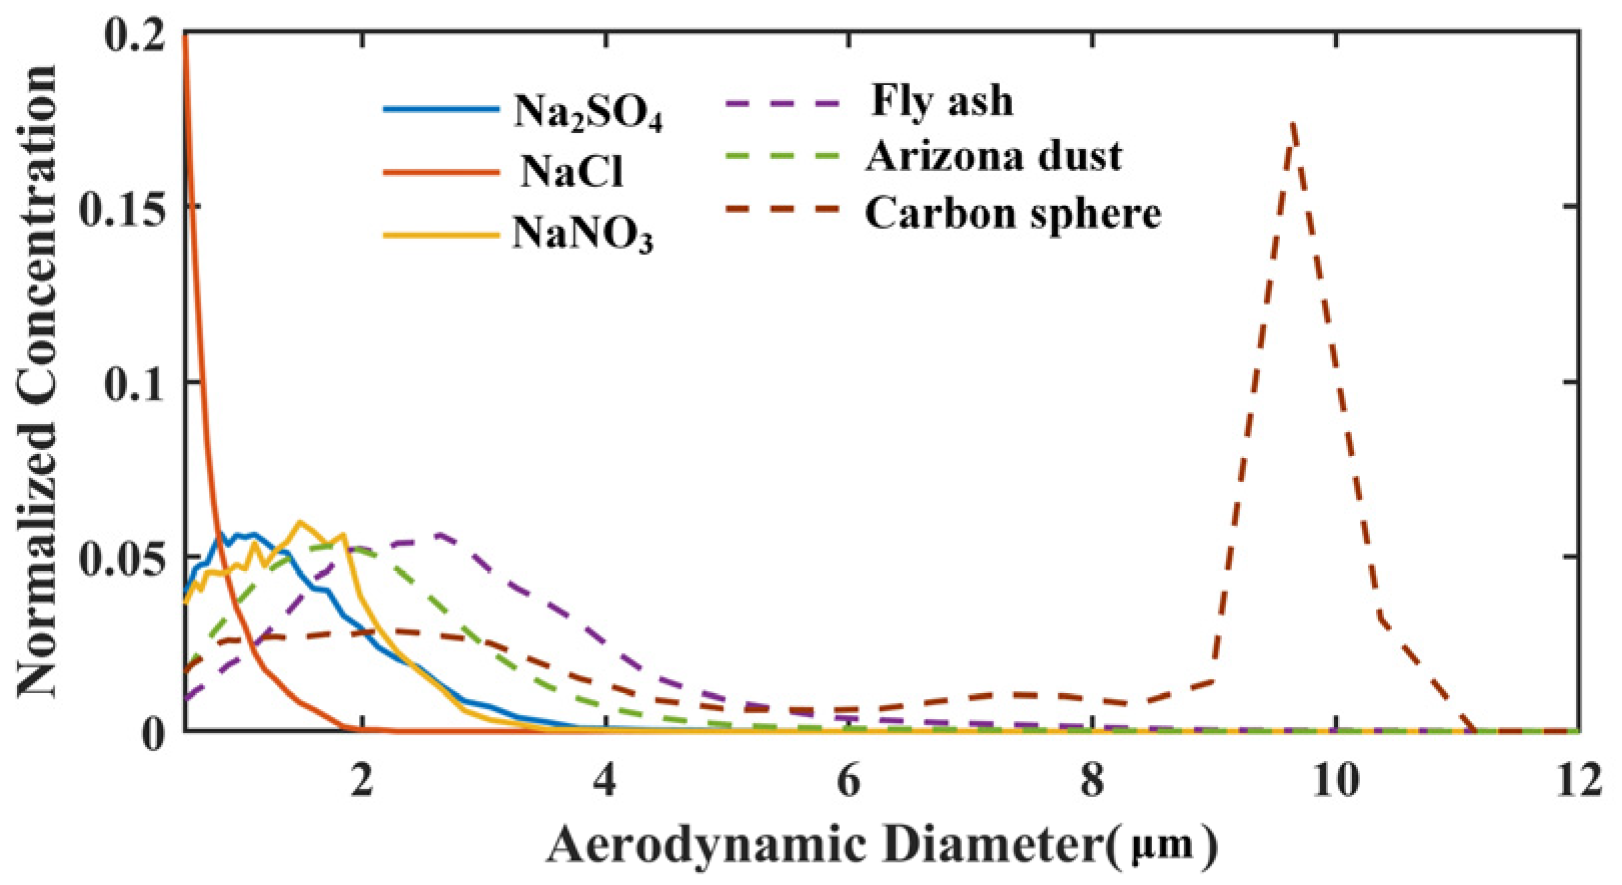
2.1. Sample Preparation

In this study, we employed twelve kinds of aerosols whose properties are listed in Table 1. During experiments, we used two kinds of aerosol generators. The water-soluble samples were generated by a Met One 255 atomizer (Met One Instruments, Inc., Medford, OR, USA). These samples were delivered to a diffusion dryer and a dilution chamber. The powder-based samples were generated by a solid particle aerosol generator (TSI-3400A) and diluted in a dilution chamber. The experimental conditions for aerosol generation were strictly controlled to ensure the stability and consistency of the experiments. The size distributions of experimental samples were monitored synchronously by an aerodynamic particle sizer (TSI, 3321). As shown in Figure 1, each type of aerosol shows a unique particle-size distribution, so the size distributions can be used as an important identifying feature. However, due to considerable overlaps of the size distributions shown in Figure 1, it is not enough to classify all these aerosol types only by aerosol size. To classify aerosol types unambiguously, more properties, such as refractive index, absorption, or morphology, should be considered and evaluated.
In the experiments, three polystyrene latex particles with different diameters were selected as standard samples that are uniform spheres and have no optical absorption effect. Na2SO4, NaCl, and NaNO3 are typical water-soluble salts and can be generated as quasi-spherical aerosols. The complex refractive index of carbon particles has a non-negligible imaginary part; we selected several carbon samples with various morphological features for experiments. Arizona dust is road dust from Arizona in the United States and can be divided into various categories based on different sizes, which has been used as a standard test for dust and particulate matter for decades. Fly ash is a kind of coal combustion product, which is approximately spherical and contains a variety of metal elements.

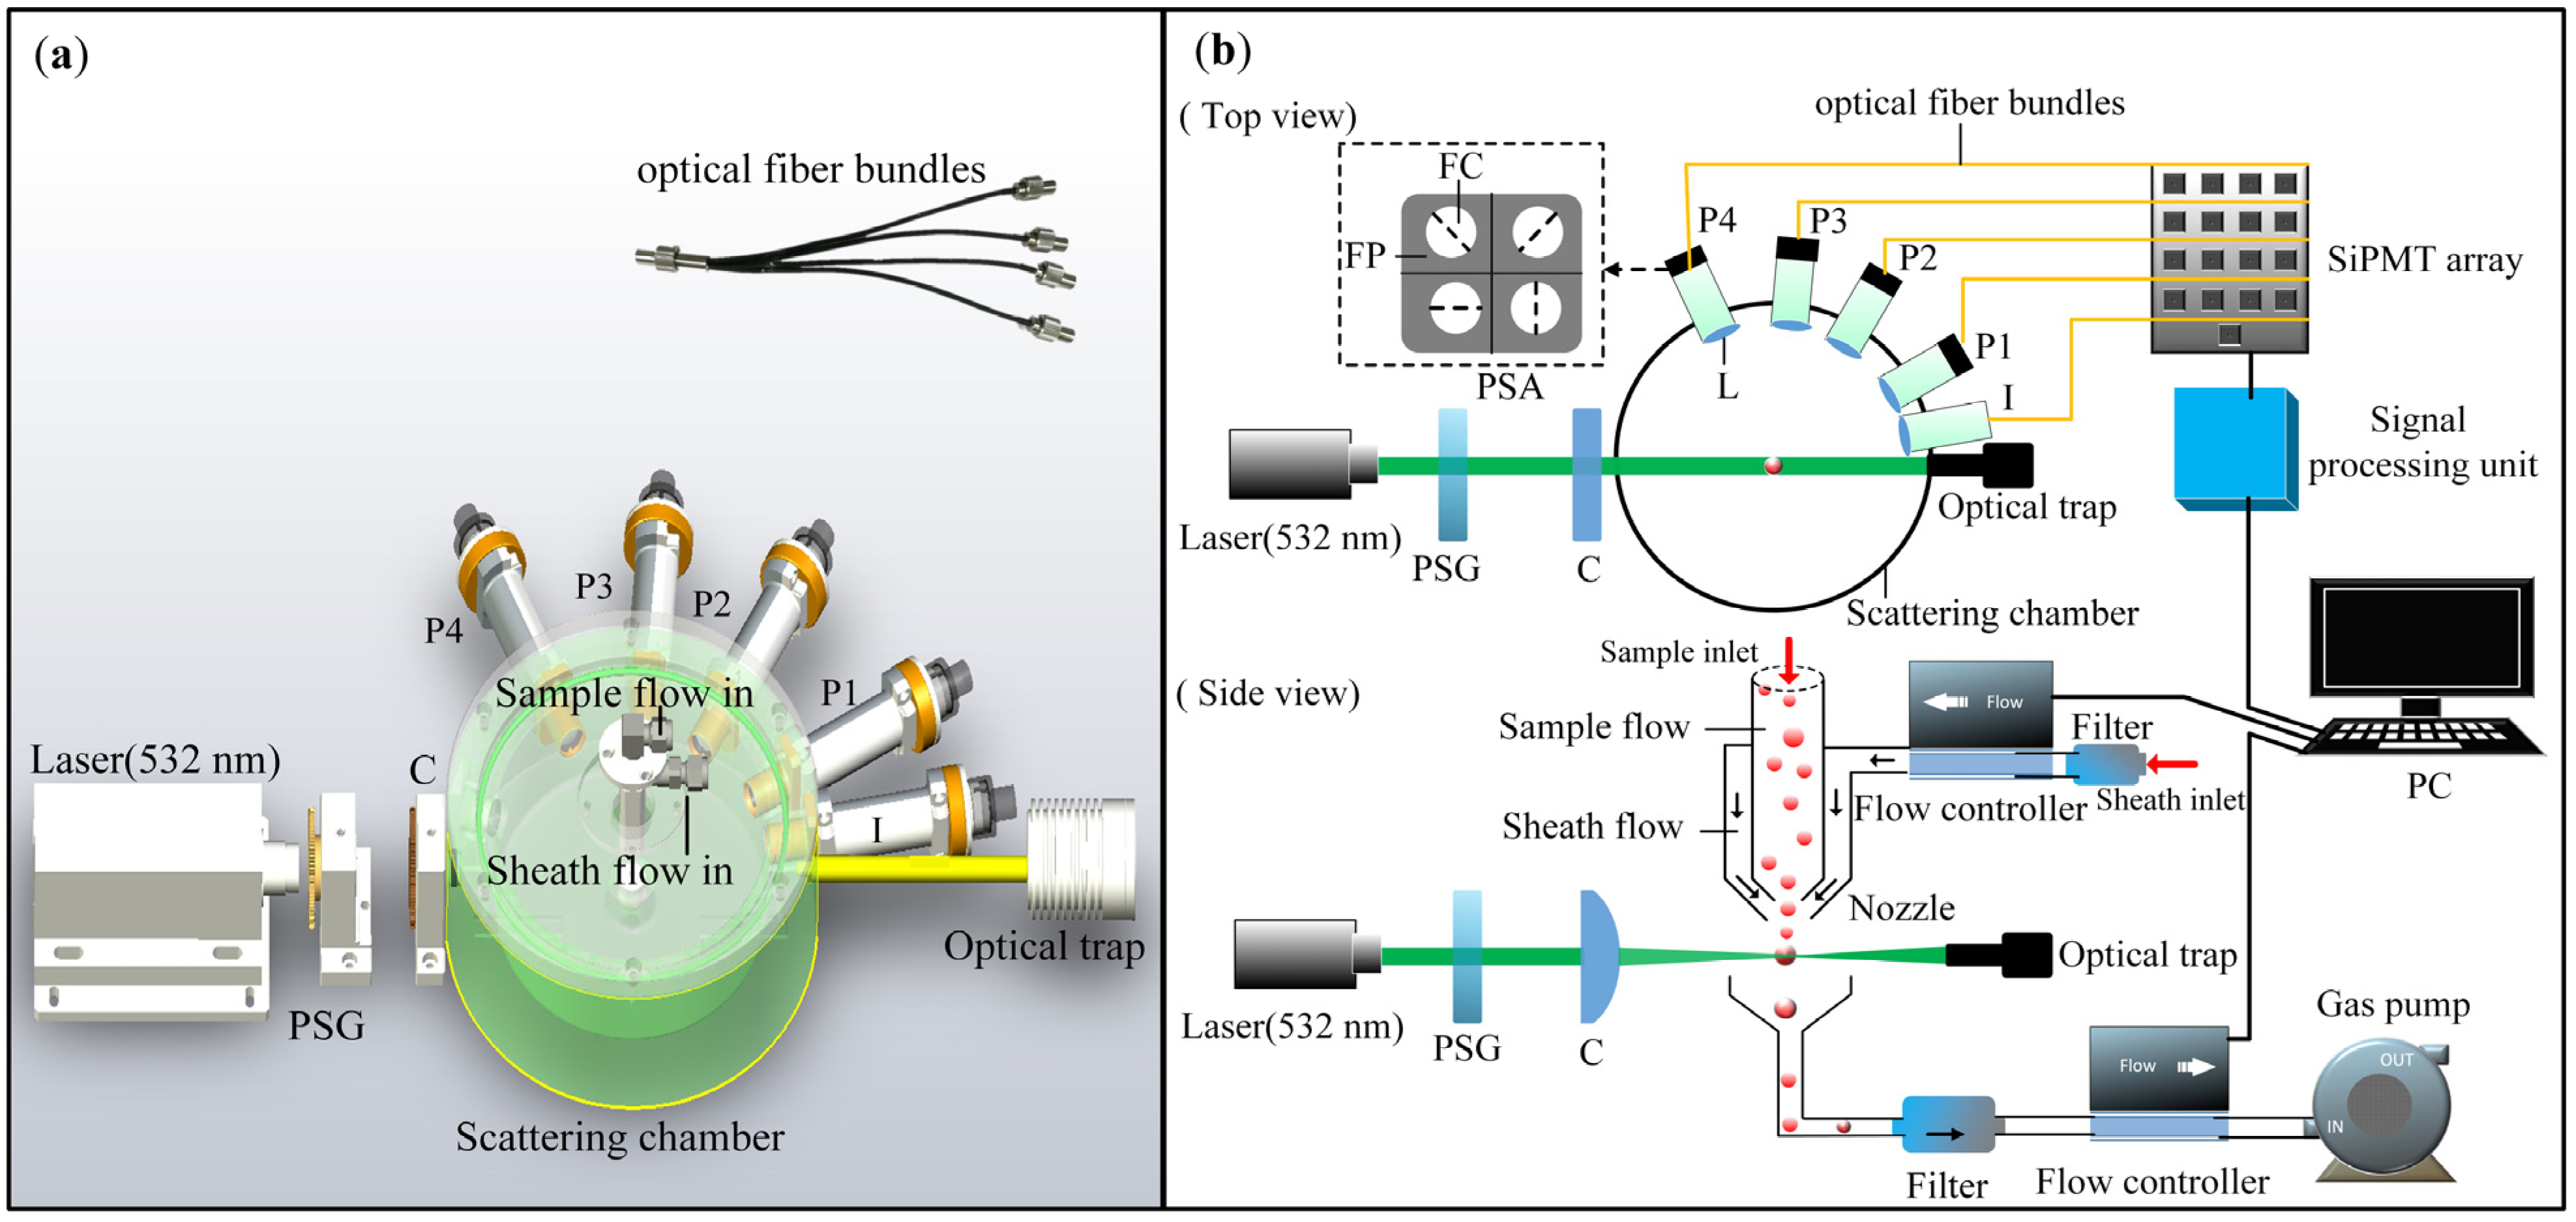
2.2. Experimental Setup

In our experimental setup, as shown in Figure 2, the airflow of particulate matter is collected from the real environment or the aerosol generator and then passes through the optical detection area from an optimally designed sheath nozzle. The velocity of flow of the collected particle sample is limited to 1.2 L/min composed of 0.6 L/min sample flow and 0.6/min sheath flow by two flow controllers and a gas pump. In Figure 2, two red arrows are used to mark the particle inlet and the sheath gas inlet. The sample inlet is at the top of the sample airflow. When the particles to be measured enter the flow channel from the inlet, they will be wrapped in the sheath flow and then dispersed and diluted.
In the optical system, a horizontally polarized laser beam (532 nm, 100 mW, MSL-III-532, Changchun New Industries Optoelectronics Technology Co., Ltd.) passes through a polarization state generator that can modulate the incident light to horizontal (H), 45° (P) linear polarization state, and right (R) circular polarization state, respectively. The polarized light is focused to form a light sheet by a cylindrical lens and then incident on the airflow channel of the aerosol particles. The width and height of the laser spot are 1 mm and 0.04 mm, respectively. To reduce the influence of stray lights, the scattering chamber is coated with high absorption material, and the forward non-scattered beam is absorbed by an optical trap at the end of the chamber.
The scattered light is measured by four polarization detection channels at the scattering angle 30° (P1), 60° (P2), 85° (P3), and 115° (P4), respectively, and the intensity detected at the scattering angle 10° (I) is the reference channel. Each polarization detection channel is equipped with a spatial filtering module and fiber bundles are connected to the detection module, which is composed of a silicon photomultiplier tubes (SiPMT) array. The signal-processing unit mainly includes a current-to-voltage converter and a signal amplifier. Then, signals of 17 channels (including 16 polarization-integrated signals and 1 intensity signal) were collected by an acquisition device (DAQ) (FCFR-USB2068, Fcctec Technology, China) with a sampling rate of 1 M/s simultaneously. The scattering response pulse width for each aerosol is about 5–10 µs and the Stokes vectors of 10,000 particles per minute are recorded.
In experiments, three instruments with different polarization states of incident light (horizontal (H), 45° (P) linear polarization, and right (R) circular polarization, respectively) worked simultaneously to form a set of multidimensional polarization online analysis systems. To make sure the suspended particles pass through the optical detection area one by one, the collected particles are first drawn into a dilution chamber and then diluted by clean air. The sample from the dilution chamber is evenly divided into three parts and fed to different instruments.

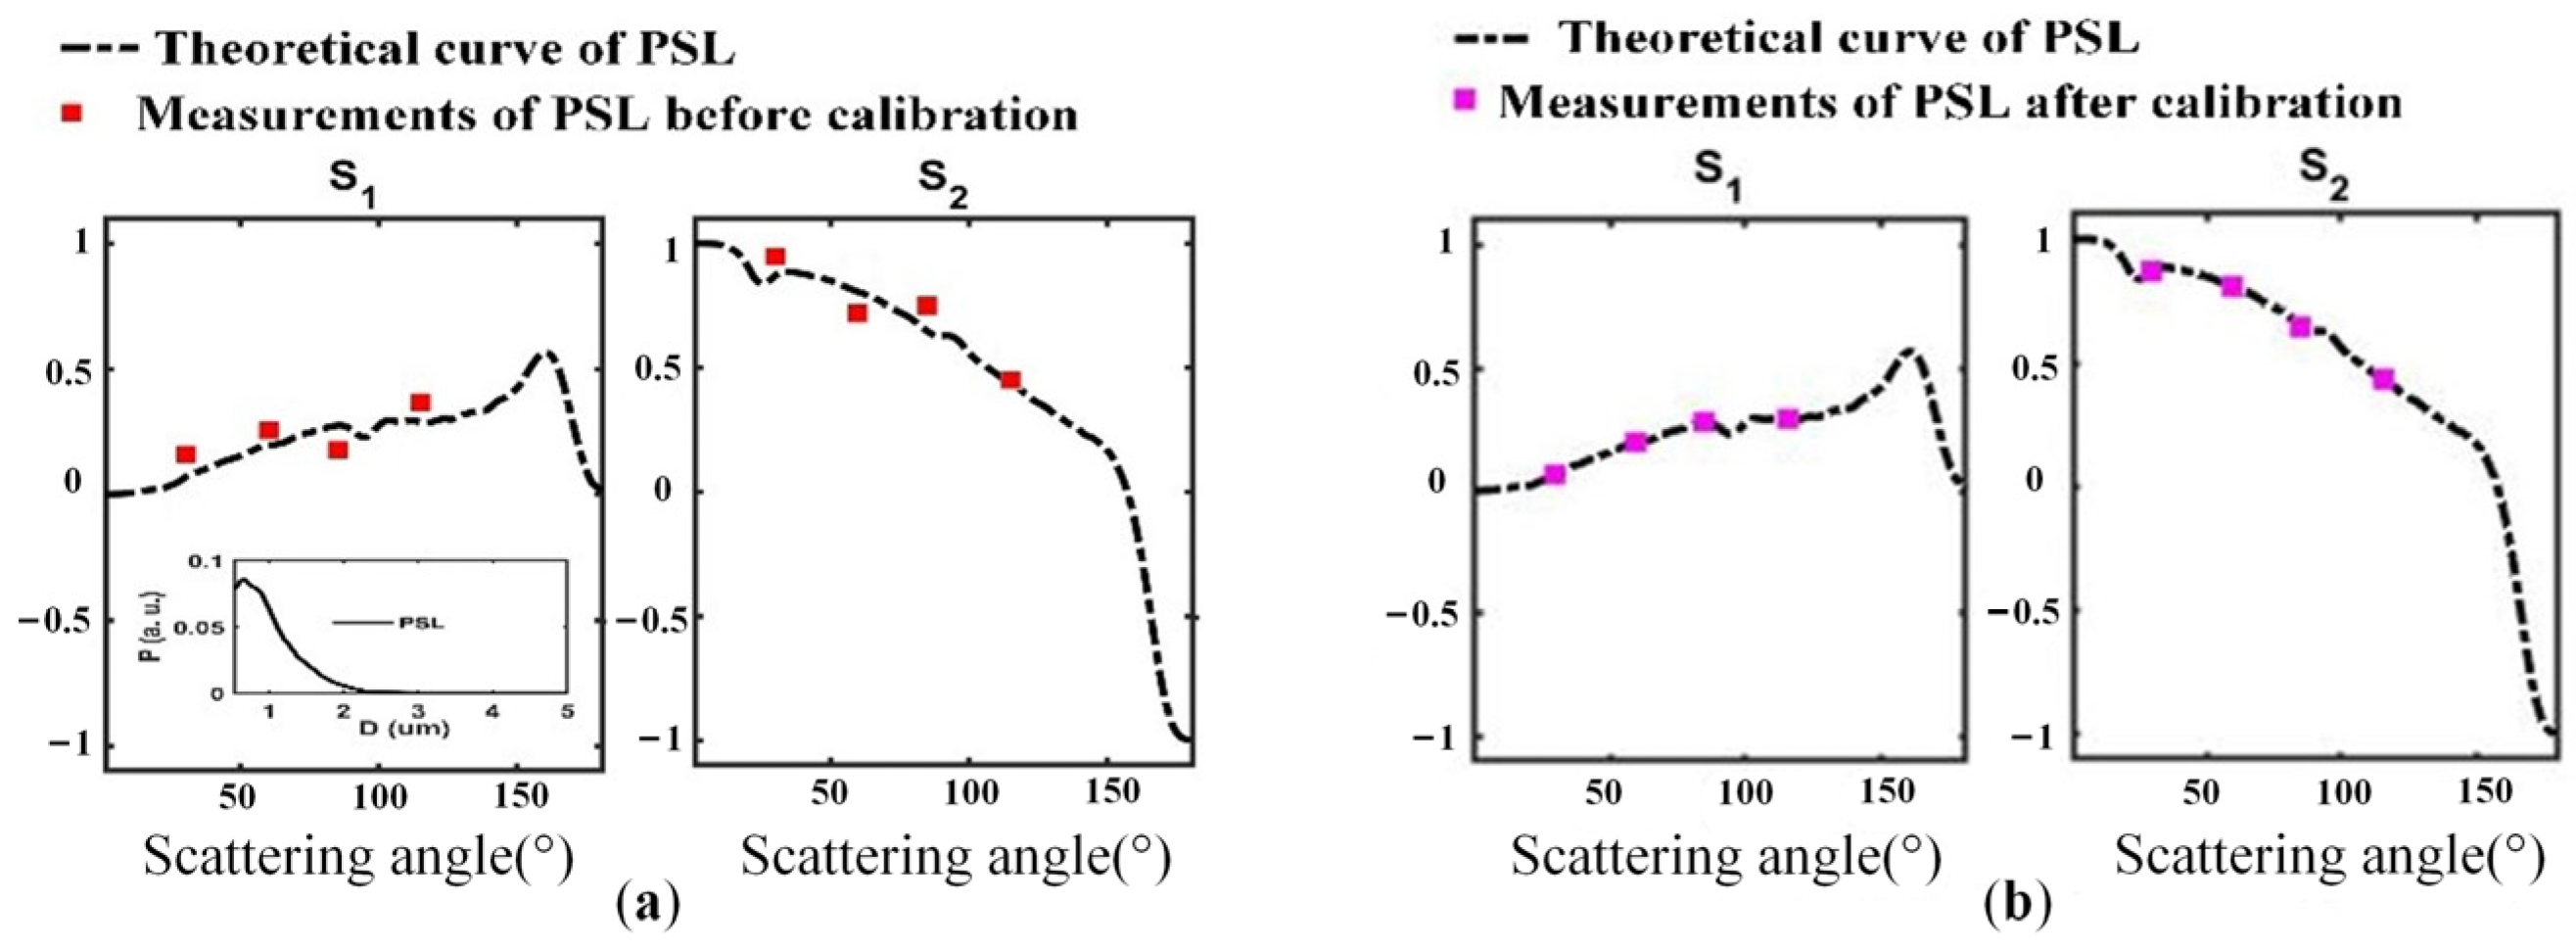
2.3. Signal Processing and System Calibration

In this paper, for the scattering signals of one individual detected particle, the detected partial Stokes vector at each scattering angle can be calculated as follows:
S = [ s 0 s 1 s 2 ] = [ I 0 + I 90 I 0 I 90 I 45 I 135 ]
where I0, I90, I45, and I135 are the intensity detected by four linear polarization analyzers at the four scattering angles. After normalization by the intensity components S0, the polarization components (S1, S2) can be transferred as follows:
H d o p = S 1 s S 0 s ; P d o p = S 2 s S 0 s
Six polarization indices at each scattering angle can be obtained, including H-Hdop, H-Pdop, P-Hdop, P-Pdop, R-Hdop, and R-Pdop, where the capitals before ‘‘-’’ refer to the polarization state of the incident light, including horizontal (H), 45° (P) linear polarization and right (R) circular polarization, respectively. So for each sample, by the parallel measurements of three devices with a four-angle synchronous measuring system, we can get a dataset composed of 24-dimensional polarization index groups.
Before detecting real aerosols, we calibrated our experimental apparatus with the Mie theory as follows. Firstly, we compared the forward scattering intensity of three kinds of monodisperse polystyrene microspheres (PSL) with different sizes with the theoretical calculations based on Mie theory. Secondly, using PSL with a diameter of 1 µm as the standard particle sample, we further compared the experimental multi-angle scattering polarization parameters with the theoretical calculations. The above agreement between experiments and theoretical calculations can roughly confirm the validity of our polarization measurements.
However, due to the oscillating scattering angle spectrum of a single particle size, it is difficult to achieve accurate calibrations of polarization signals at several angles. Therefore, we propose a calibration method for the multi-channel polarization signals of our measurement system based on a monodisperse polystyrene sample. By comparison with the theoretical curves shown as a dotted line, we can get a quantitative calibration accuracy of the measured Stokes vectors. As shown in Figure 3, the red markers and the pink markers are experimental results of monodisperse polystyrene particles before and after numerical calibration. The mean deviation of the absolute value of all Stokes parameters is less than 0.07, as shown in Figure 3a, which is determined by the only hardware modification of the optical system, and the final mean deviation of the absolute value of all Stokes parameters is less than 0.01, as shown in Figure 3b, which is the optimal result according to the subsequent numerical calibration.
In addition, during every group of experiments of the same sample, we repeat the measurements several times to observe the stability of the original polarization analyzing signals and their distribution curves.
To verify the performances of our instrument, we tested three kinds of polystyrene latex (PSL) spheres and recorded polarization scattering pulses. Intensity channel and R-Pdop at 85° are demonstrated in Figure 4; both parameters show the stability of continuous measurements and a significant difference between samples with different sizes. However, the polarization signal and the light-intensity signal show completely different behaviors.
As shown in Figure 4c, the standard deviation of original R-Pdop data at 85° for three different-sized PSL spheres is greater than 0.08. With the increase of the average points, the standard deviation first declines sharply and then becomes smooth at 300 points. The single-scattering signals of suspended particles can be influenced by the spatial orientation and position of particles. Therefore, to mitigate the effects mentioned above, in the follow-up studies, our polarization scattering results are treated by 300-point average processing for a single-component aerosol sample.
In this work, we defined polarization feature resolution (PFR), as PFR = 2 *standard deviation, to reflect the stability of the measured polarization index and to quantitatively evaluate how much difference between polarization indices is enough to distinguish different samples.
In the following section, several types of aerosols with various complex refractive index values and micromorphology were analyzed to assess the aerosol recognition capability based on our multidimensional polarization index system.

3. Results and Discussion

In this part, the 24-dimensional polarization indices of 12 samples are individually measured. We compare the differences between the polarization indices to evaluate their capabilities for aerosol identification and classification. At the same time, we can evaluate the sensitivity and resolution of these indicators applied in the online measurements.

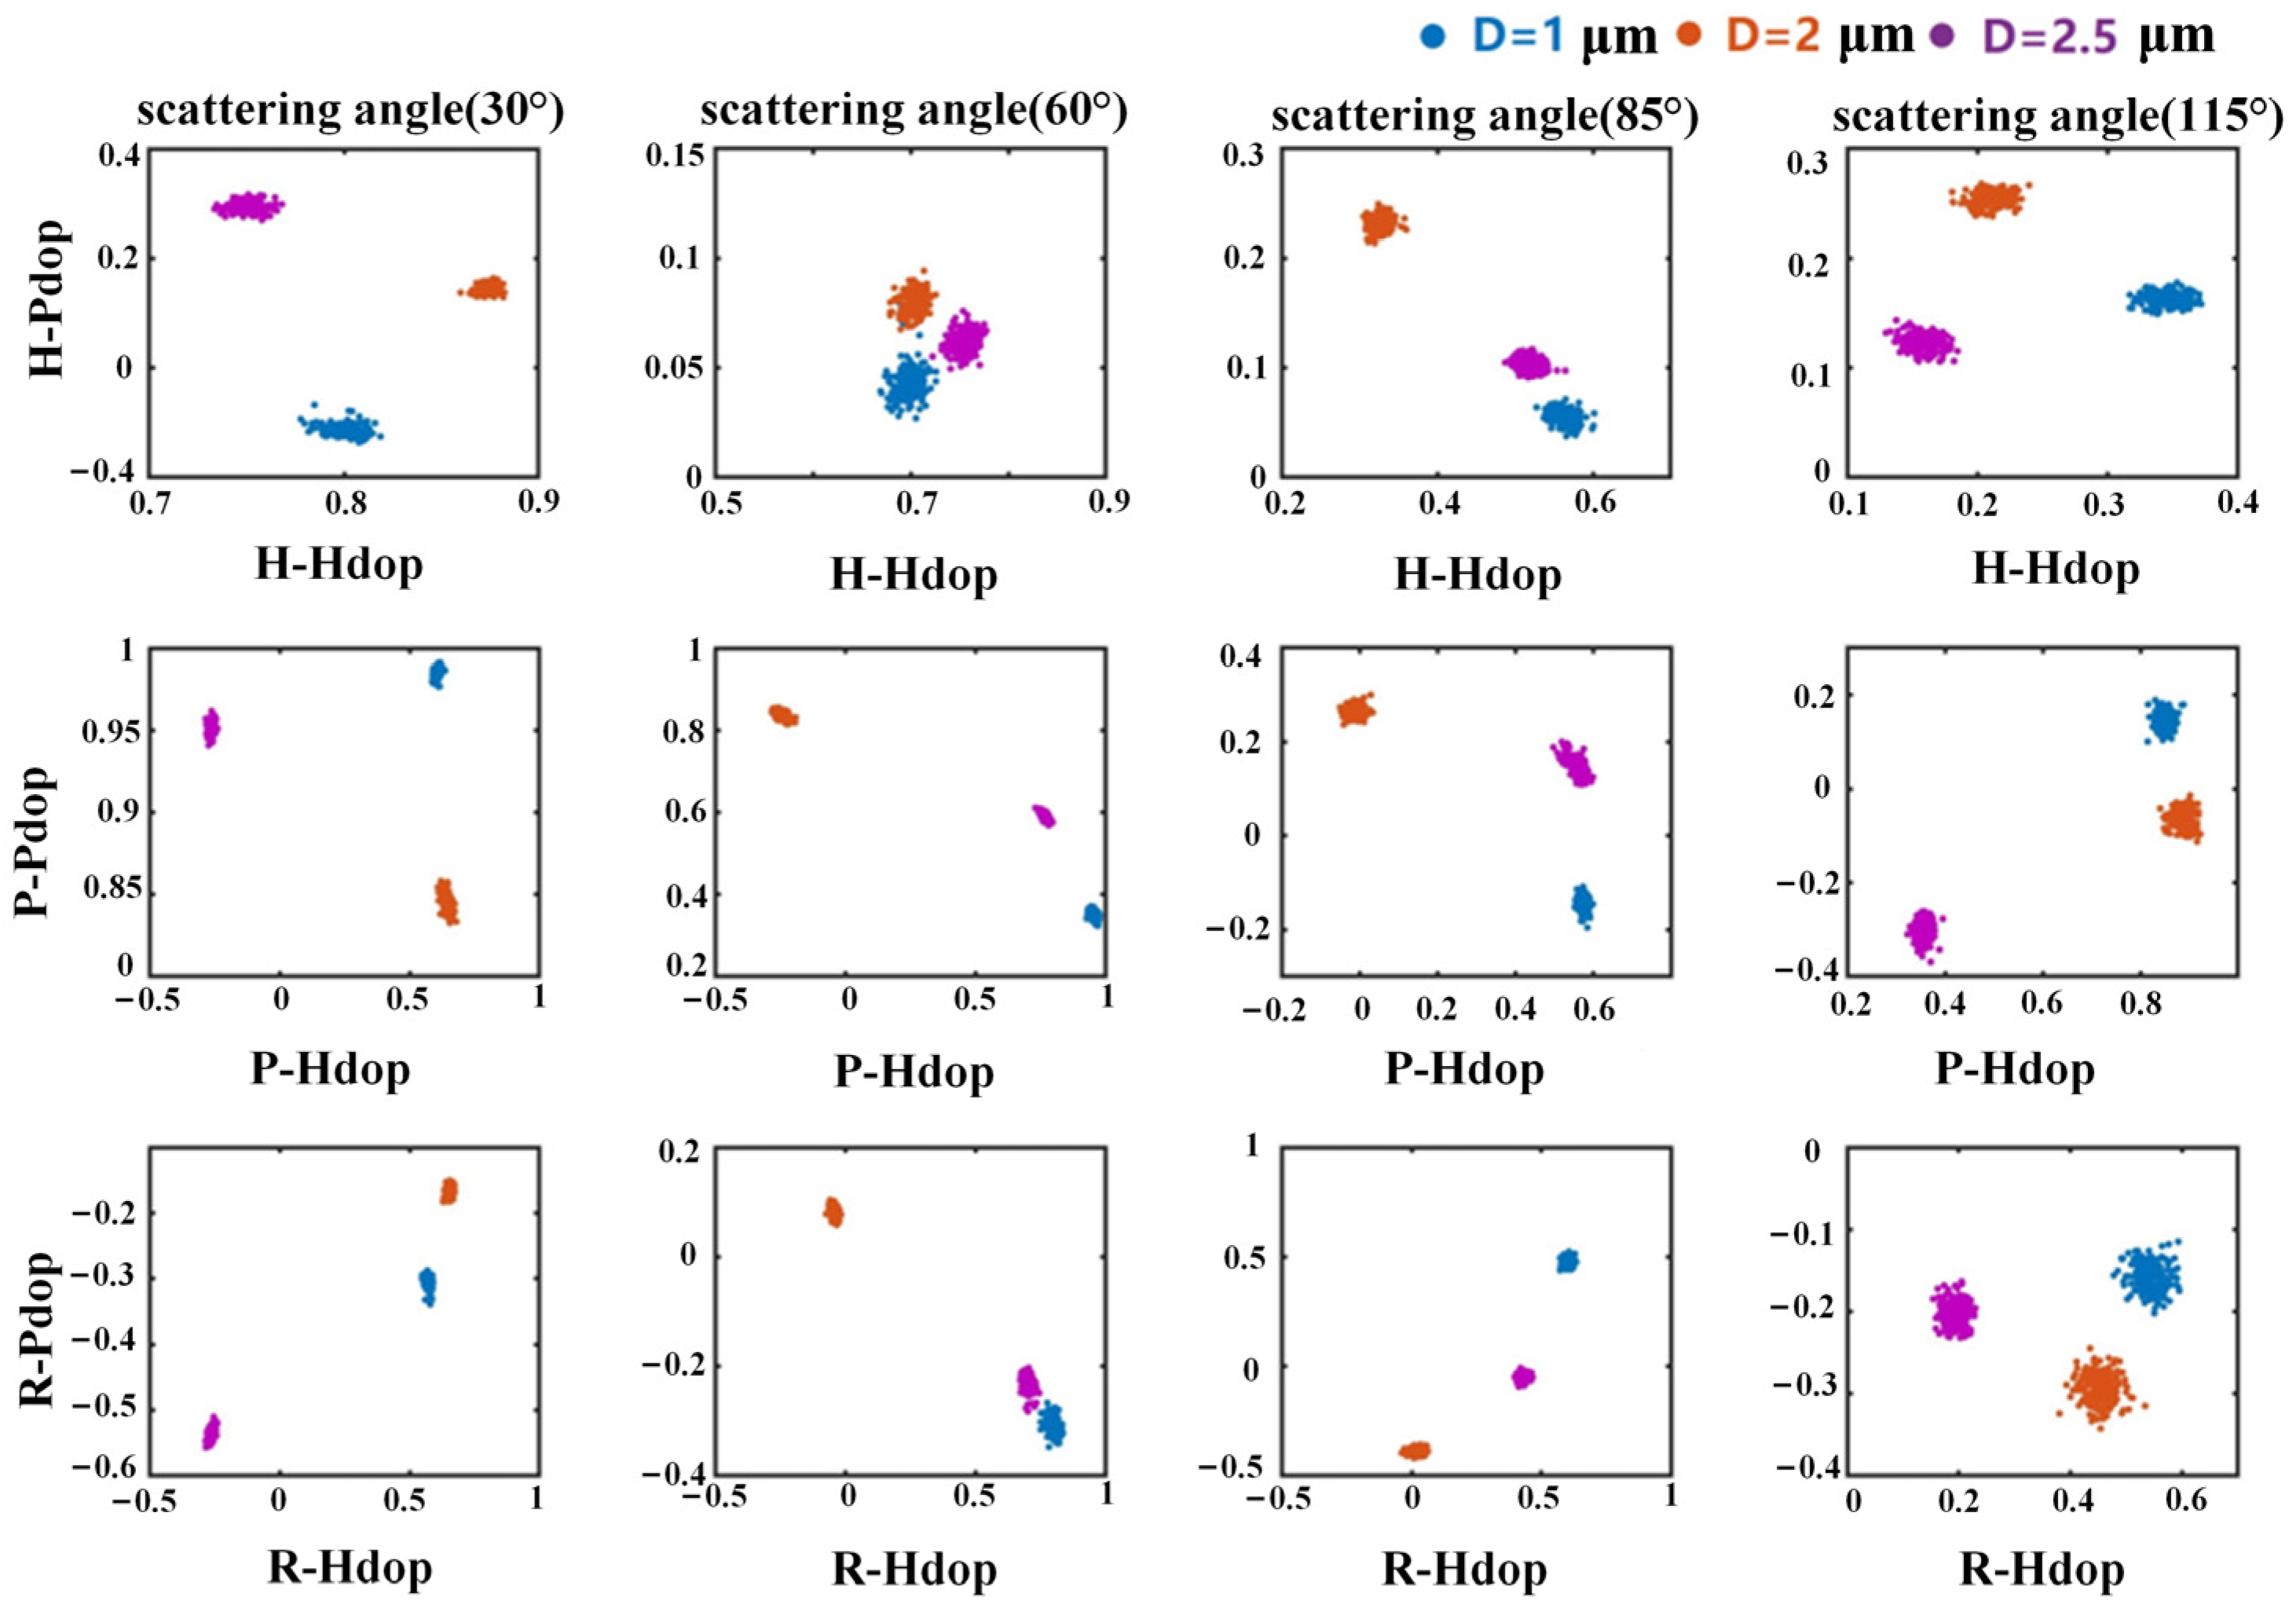
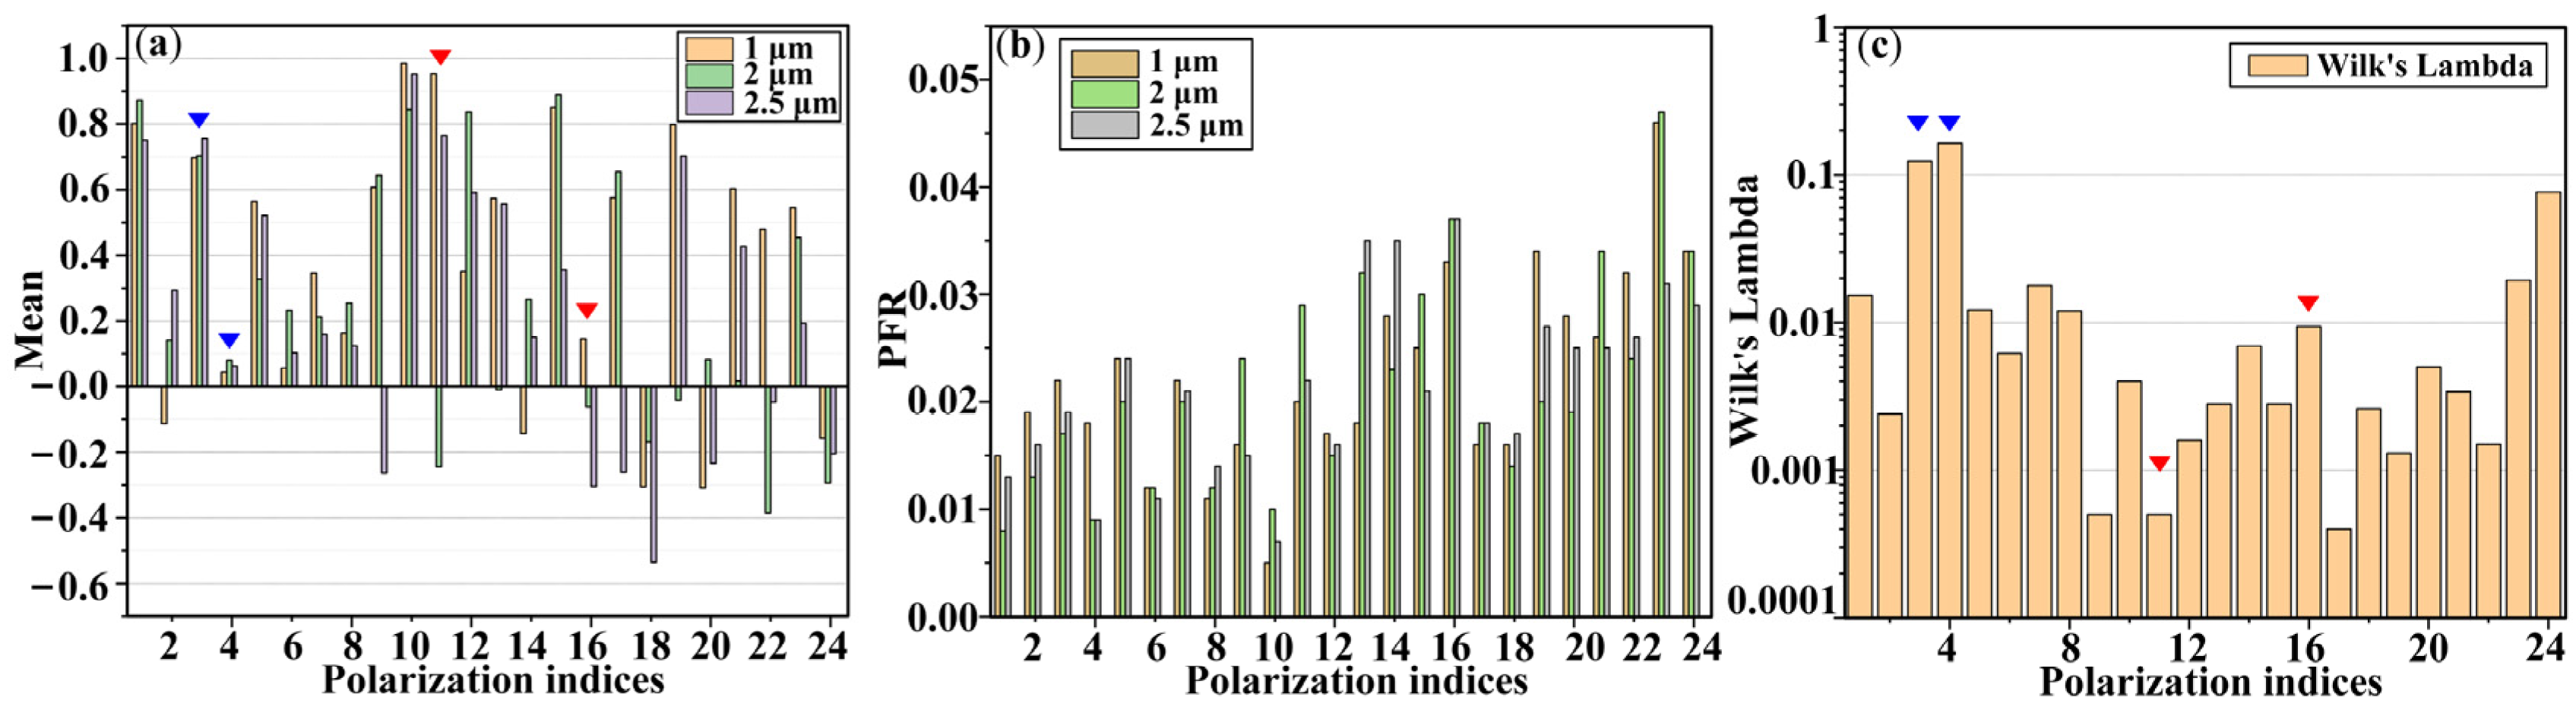
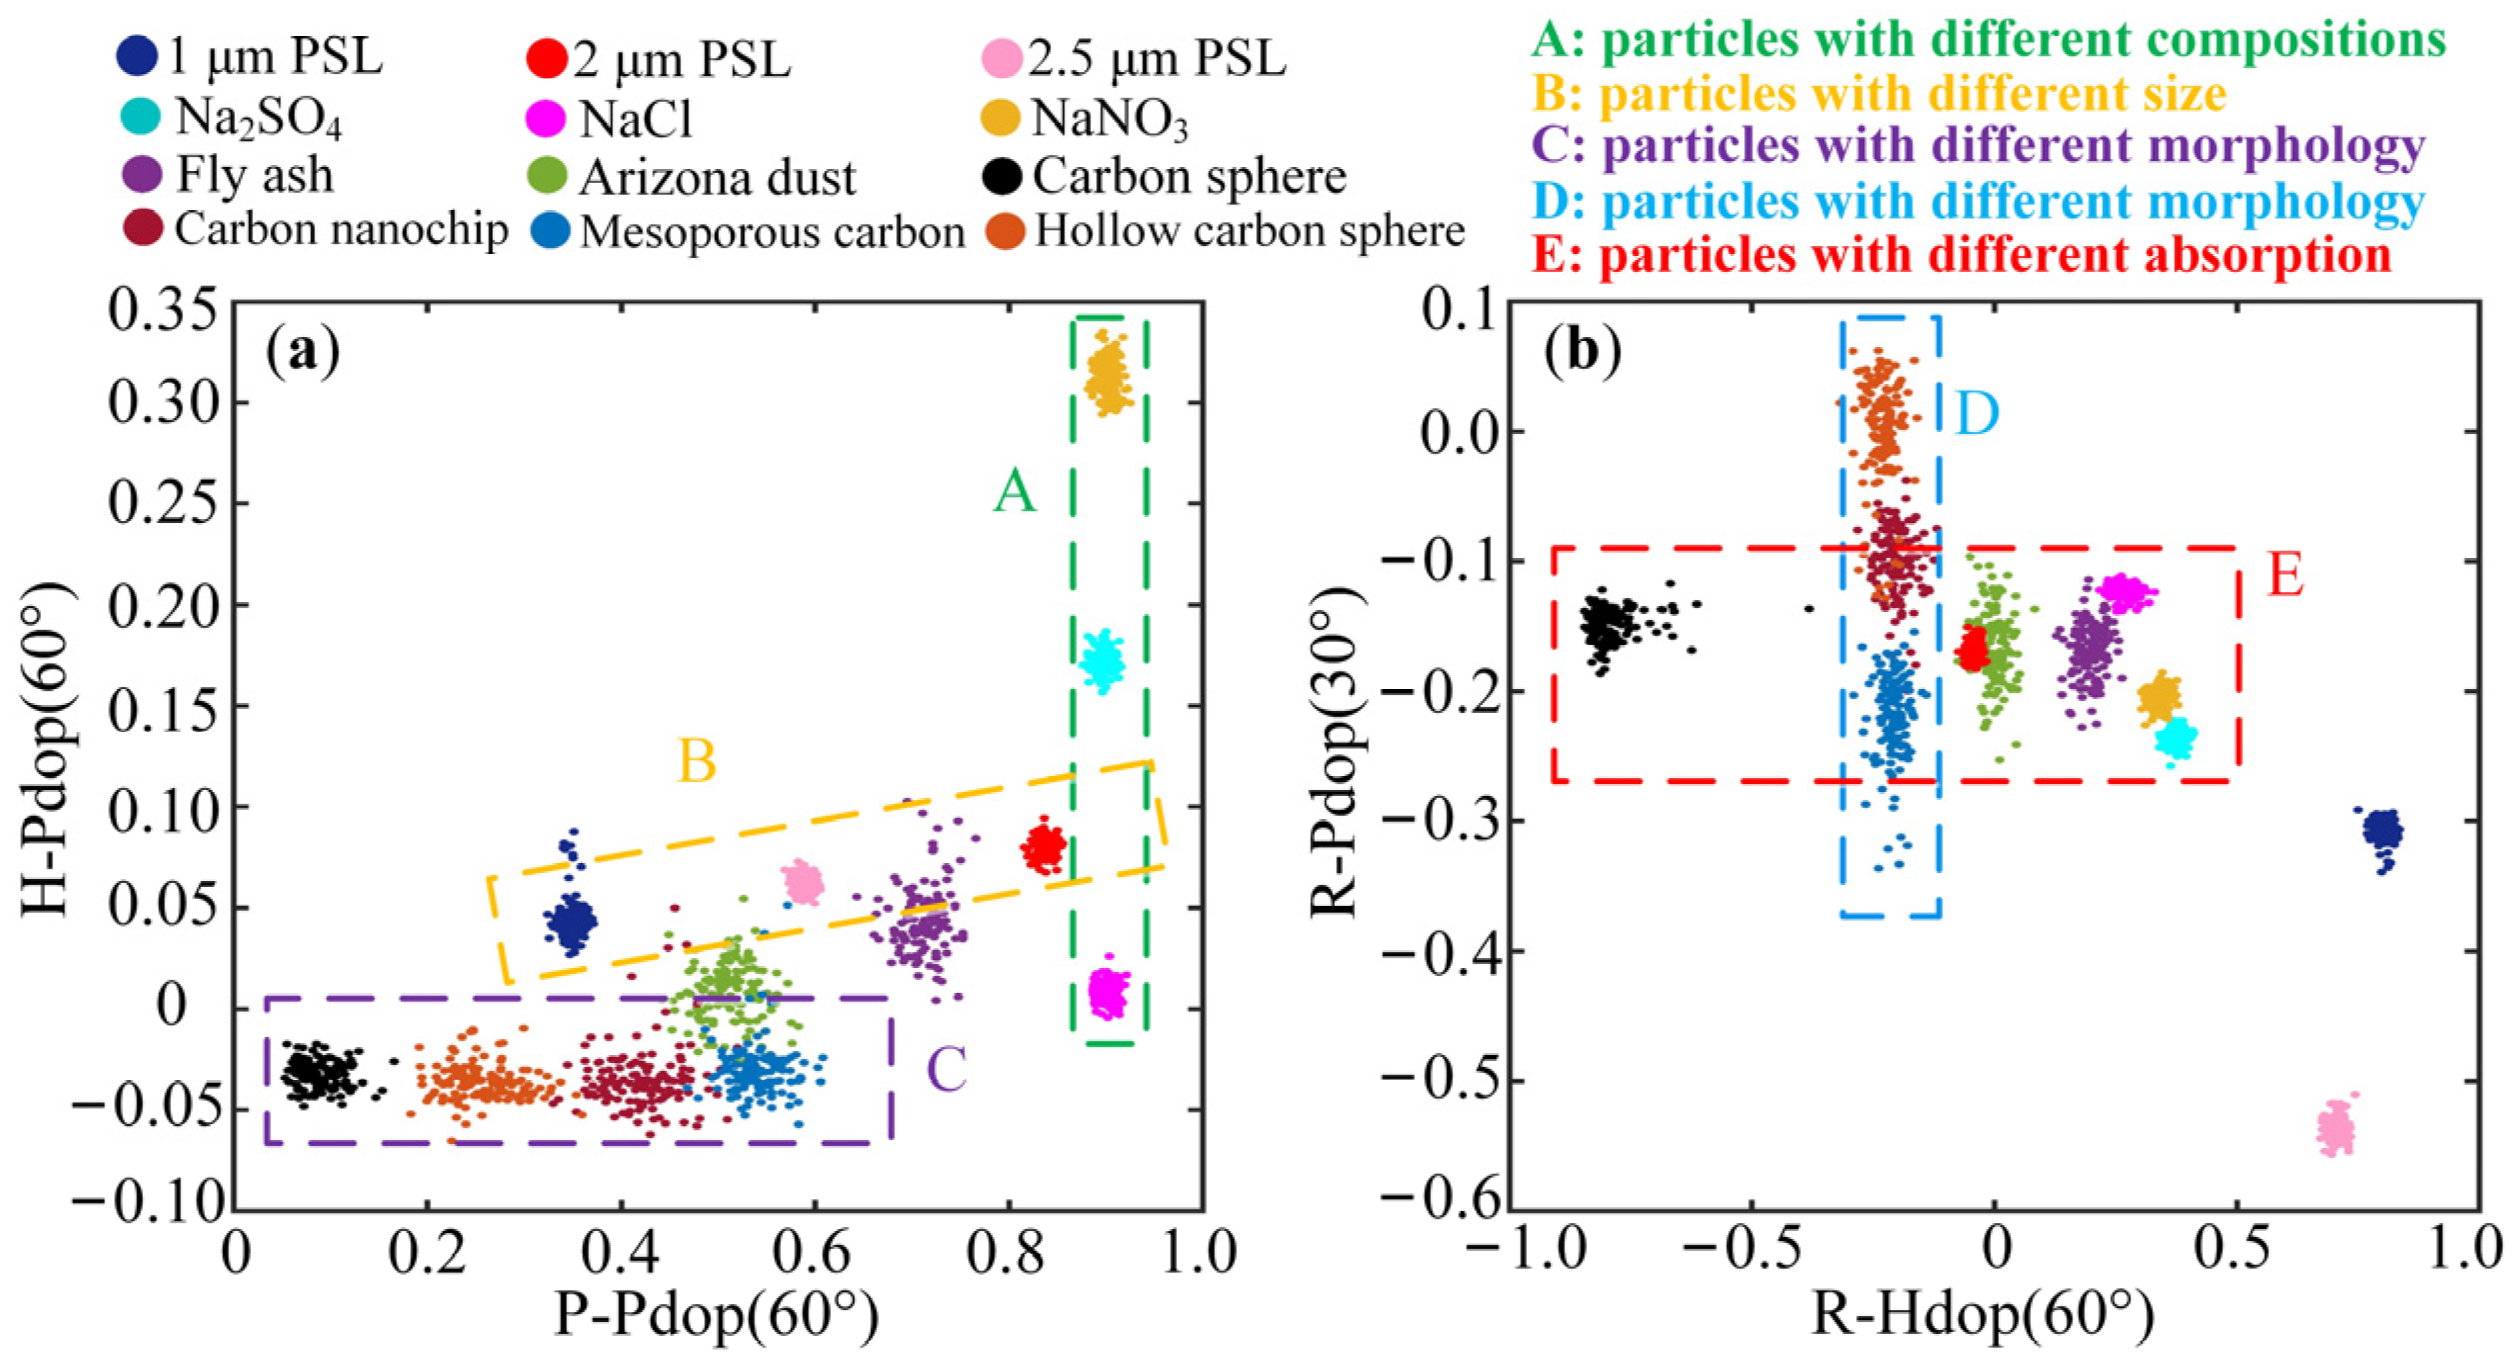
3.1. Polarization Characteristics of Particle Size

Our experiments start with aerosol samples with different particle sizes. Figure 5 shows 12 two-dimensional scatterplots with 24 polarization indices, corresponding to three kinds of monodisperse polystyrene spheres with different sizes. For each polarization index, the mean value, PFR, and Wilk’s Lambda of the measured data are shown in Figure 6 and can be thought of as quantitative evaluation of the experimental results in Figure 5. Herein Wilk’s Lambda is calculated as the ratio of intraclass variance and the population variance. The smaller ratio of intraclass variance means better interclass discrimination:
W i l k s L a m b d a = σ intra 2 σ total 2
Figure 5 shows the different intraclass dispersion and class separation distances of different PSL aerosols. Although all the scatter plots can separate three types of PSL samples, the discrimination ability of polarization indices is different. Figure 6 shows the mean values, PFR, and Wilk’s Lambda parameters of multidimensional polarization results, respectively. The horizontal axis represents the numbering order of polarization indices listed in Table 2.
Generally, for some specific polarization indices, the difference of mean value points out the distinction between classes and also implies the sensitivity of this index to some microphysical feature of aerosol samples. For samples shown in Figure 5, the main difference between these three types of samples is particle size. So it can be seen that P-Hdop (60°), R-Pdop (60°), P-Pdop (115°), and R-Pdop (85°) can be used to distinguish three kinds of PSL samples from Figure 5. However, the PFR parameters show the data dispersion of many single aerosol measurements, corresponding to the resolution of measurement results. Considering the definition of the Wilk’s Lambda parameter, the proper polarization parameters among the whole index group suitable for aerosol identification should have a larger mean difference and a smaller Wilk’s Lambda. For the experiments shown in Figure 6a, P-Hdop (60°) is a better indicator than P-Pdop (115°) (marked by the red inverted triangle). On the other hand, whether based on mean value or Wilk’s Lambda, we can see that H-Hdop (60°) and H-Pdop (60°) are not usable in classifying the three types of samples in Figure 6a, and it seems that the two parameters are possibly less sensitive to aerosol size (marked by the blue inverted triangle).
Because we have recorded the polarization scattering indices of aerosols one by one in the experiments, we can extract not only the average measurement results of aerosol samples but also statistical indicators such as PFR and Wilk’s Lambda parameters. Through a comprehensive analysis of single-particle polarization scattering signals, we can reasonably understand the feasibility and possibility of various polarization indices applied to field measurements.
According to a comparison of incident polarization states from Figure 5 and Figure 6, the incident light with a P (45°) linear polarized state is more likely to achieve better aerosol classification due to particle size differences. Moreover, we can see that the scattering angle at 60° can be selected as a suitable detection angle in this case.

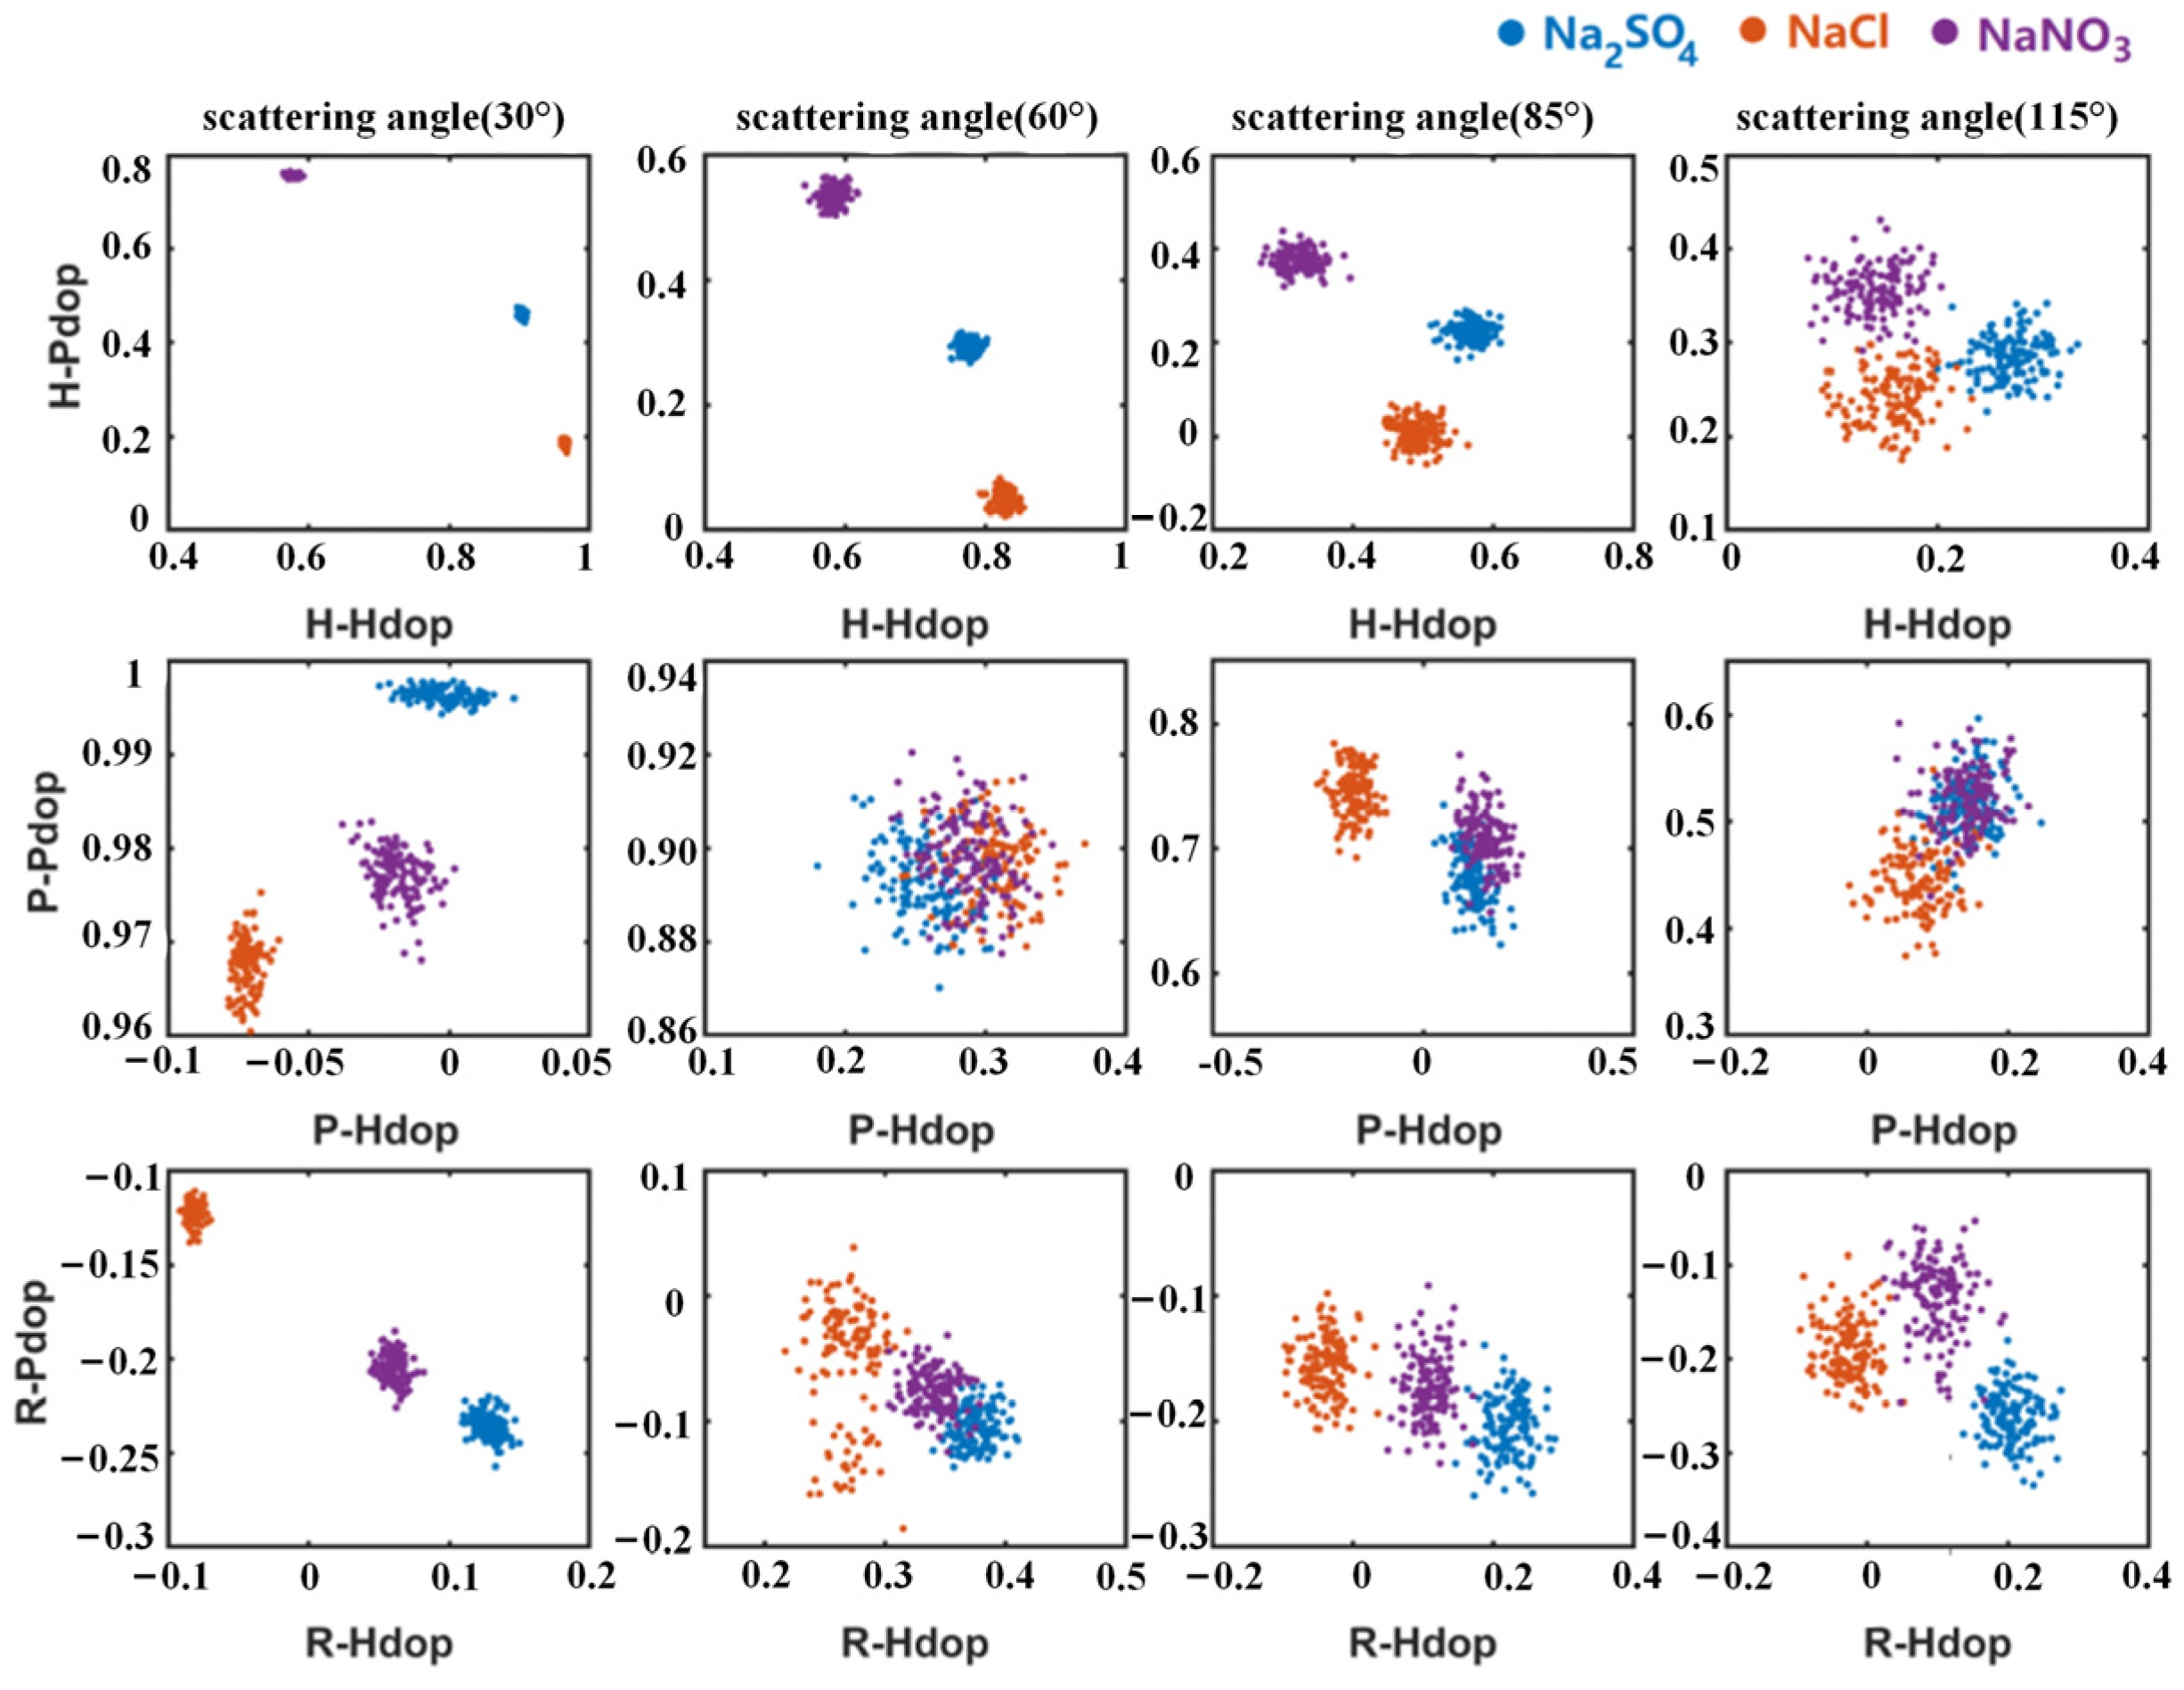
3.2. Polarization Characteristics of Particle Composition

Our second set of experimental samples is three kinds of water-soluble salts: Na2SO4, NaCl, and NaNO3. The scatter plot of polarization data has been shown in Figure 7, and the corresponding mean values, PFR and Wilk’s Lambda of the experimental polarization indices are shown in Figure 8. The water-soluble salt samples are generated in the form of spray, which have similar particle size ranges less than 4 µm and a nearly spherical shape. Thus, Figure 8 can be used to evaluate the connection between polarization parameters with the refractive index of aerosols.
From Figure 8a, H-Pdop (30°), H-Pdop (60°), and H-Pdop (85°) can separate three types of samples better than other polarization indices. Then, according to Figure 8b,c, H-Pdop (30°) can show relatively optimal resolution and discrimination due to smaller PFR and Wilk’s Lambda (marked by the red inverted triangle). On the other hand, if we want to find out which polarization parameter is insensitive to the composition of water-soluble aerosols, we can select P-Pdop (30°), P-Hdop (60°), P-Pdop (60°), and R-Pdop (85°). Besides, the P-Pdop (60°) seems a better stable indicator unaffected by the refractive index difference between the three kinds of water-soluble salts.
The main difference between these water-soluble aerosols is the refractive index due to different compositions. In this case, if we consider various incident polarization states and scattering angles, the incident light with an H (horizontal) linear polarized state and the 30° detection angle seem to be the proper choice.

3.3. Polarization Characteristics of Absorption Effects

Aerosols with optical absorption effects often have an important impact on atmospheric visibility. In this part, we selected four kinds of aerosols with different absorption characteristics as our third experimental sample group: Na2SO4, fly ash, Arizona dust, and carbon spheres, whose polarization data have also been shown in Figure 9. According to their appearance and references [26,28], carbon spheres are light-absorbing particles, and Na2SO4 particles almost have no absorption effect. The reported imaginary parts of the refractive index of fly ash and Arizona dust [27,30,31] are within the range 0.002–0.03, meaning possible weak absorption effects. Based on the mean values, PFR and Wilk’s Lambda of the experimental polarization indices in Figure 10, we can examine the influence of aerosol absorption on multidimensional polarization indices.
From the scatter distribution of 24-dimensional polarization indices in Figure 9, the four types of sample data show different divisions and clustering. From Figure 10a, P-Hdop (60°), P-Pdop (60°), P-Pdop (85°), and R-Hdop (60°) can distinguish the four types of samples clearly. Besides, Figure 9 and Figure 1 also show similar monotonic changes of these polarization indices, that is, the values of polarization parameters decrease with the increasing particle absorption characteristics (marked by red inverted triangle symbols). This experimental phenomenon is consistent with our previous research reports [32]. We can also see that, in H-Hdop (30°), only the Na2SO4 that has no absorption effect is separated clearly.
In this case, the incident light with a P (horizontal) linear polarized state and the 60° detection angle can achieve better discrimination of aerosols with different absorption characteristics. And based on the trend of polarization parameters, it is further possible to estimate the change of aerosol absorption property or absorption-type particle proportion.

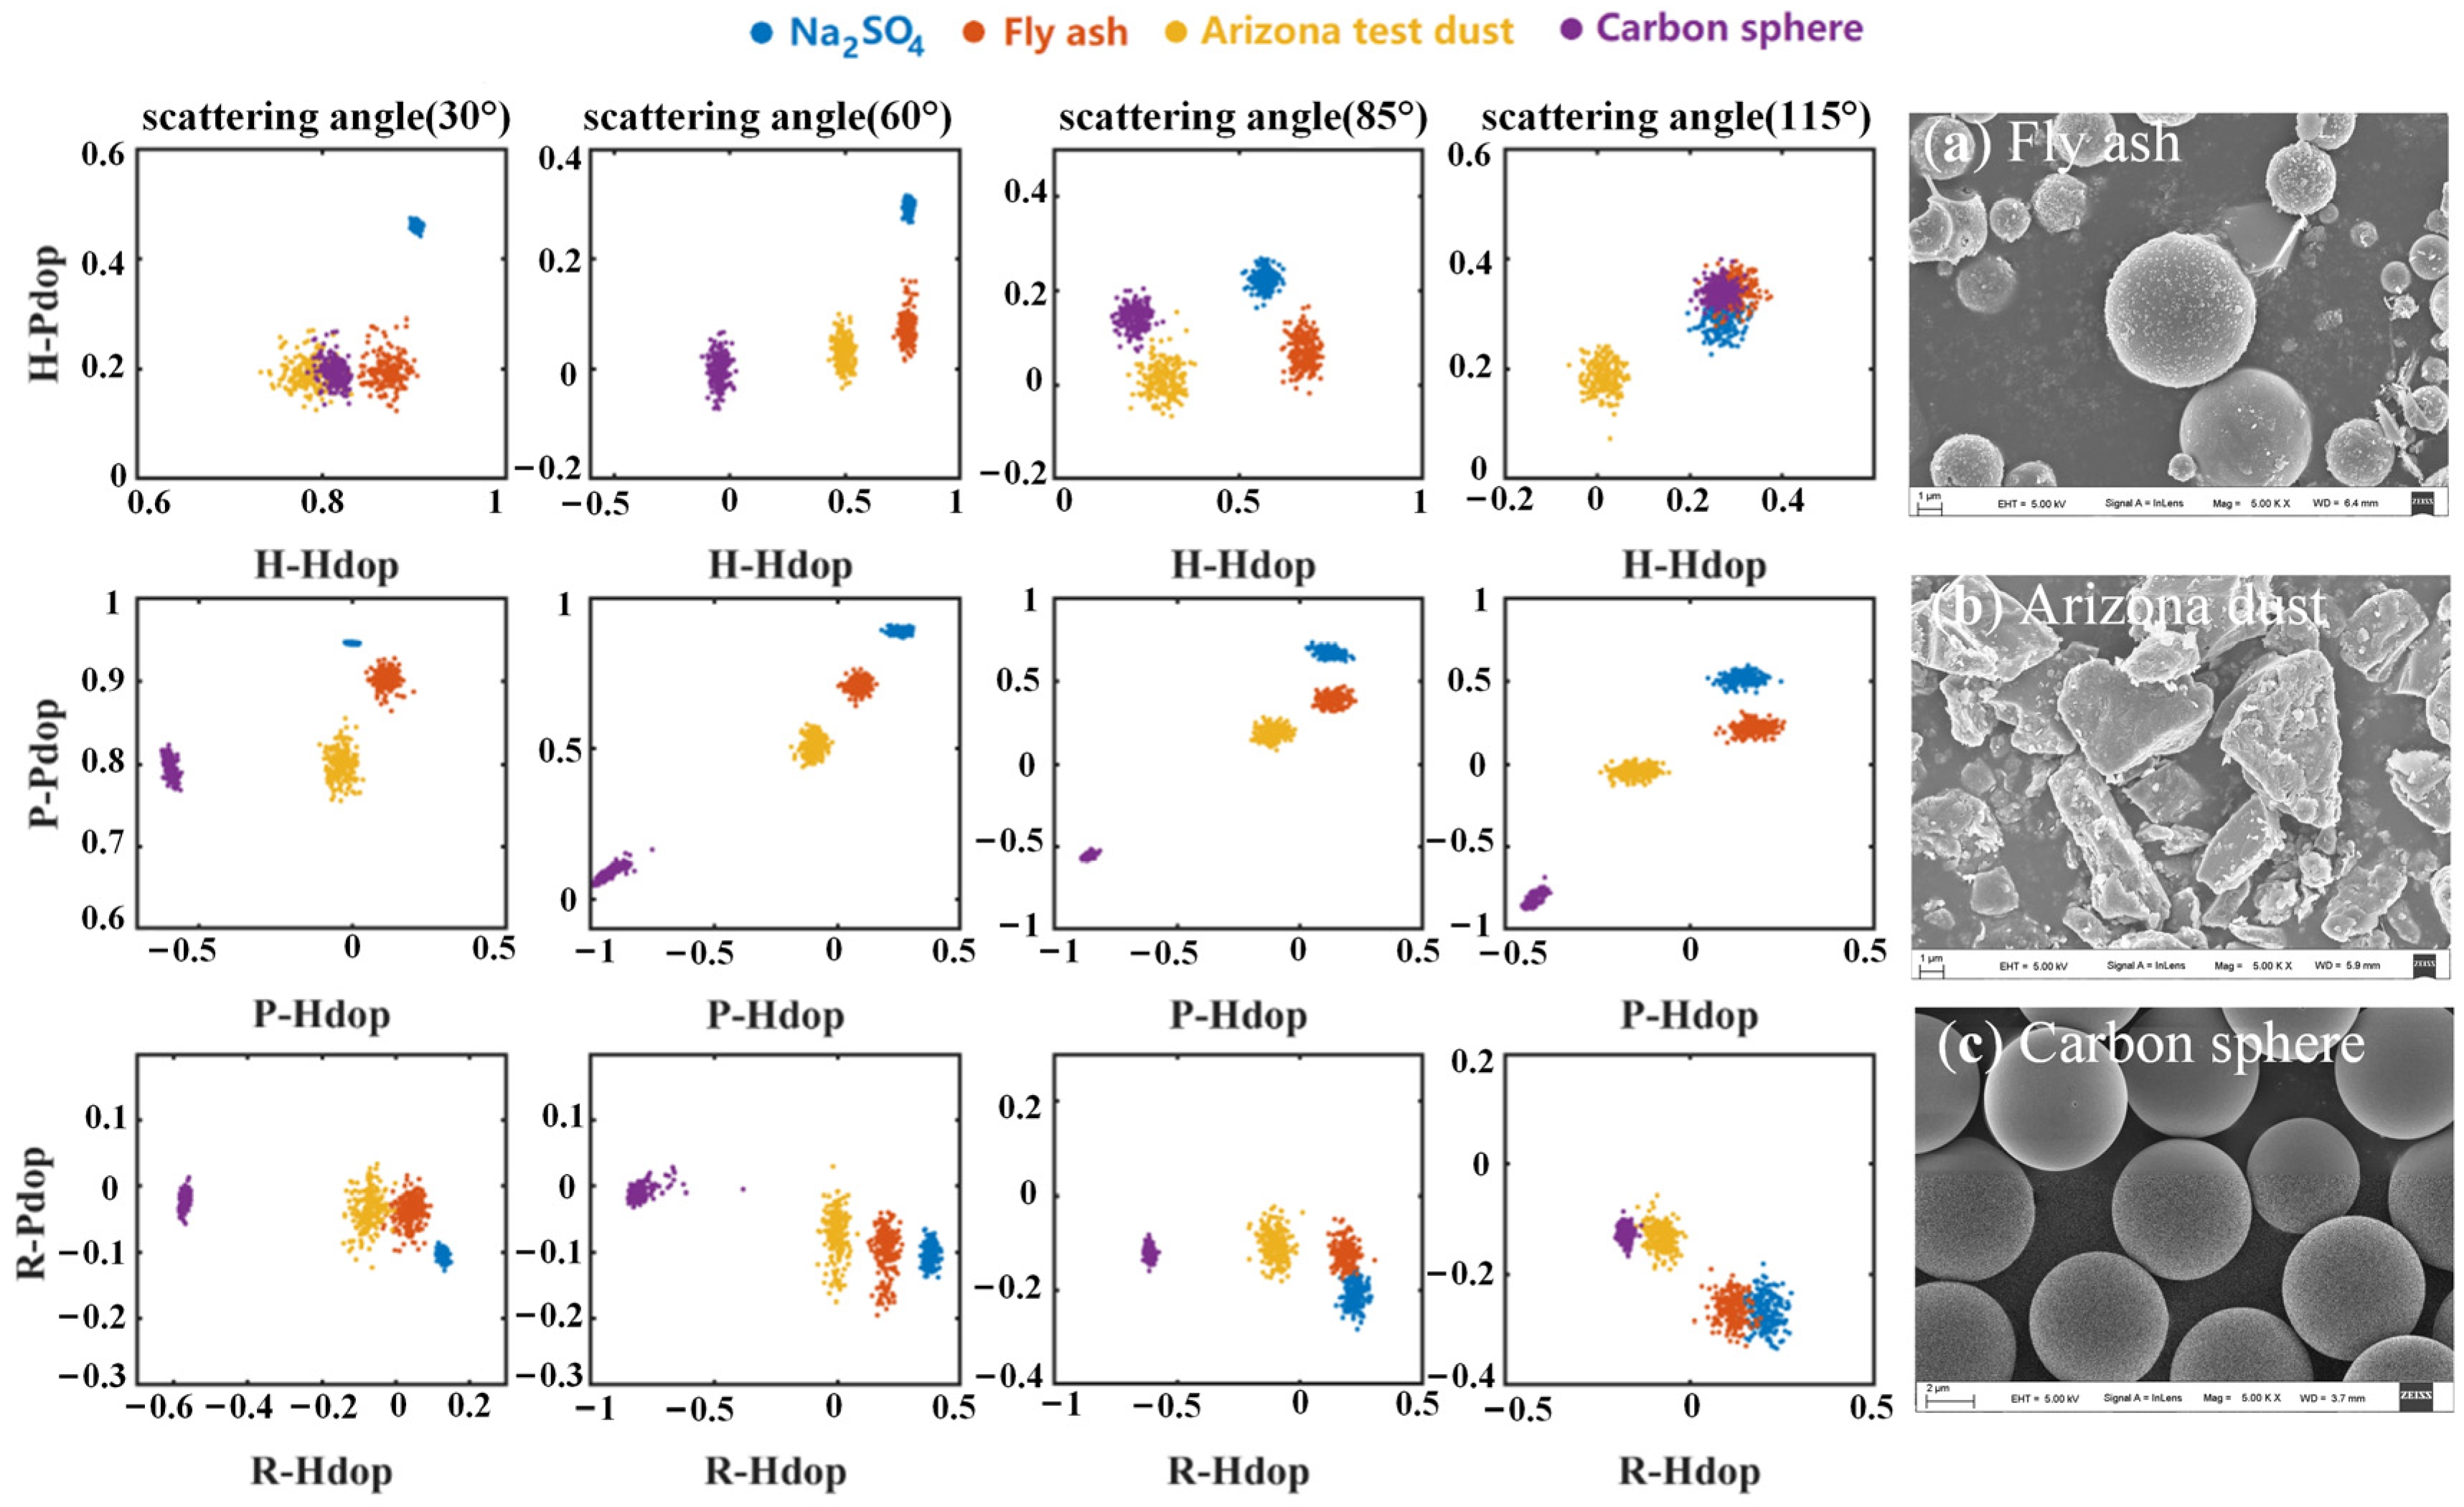
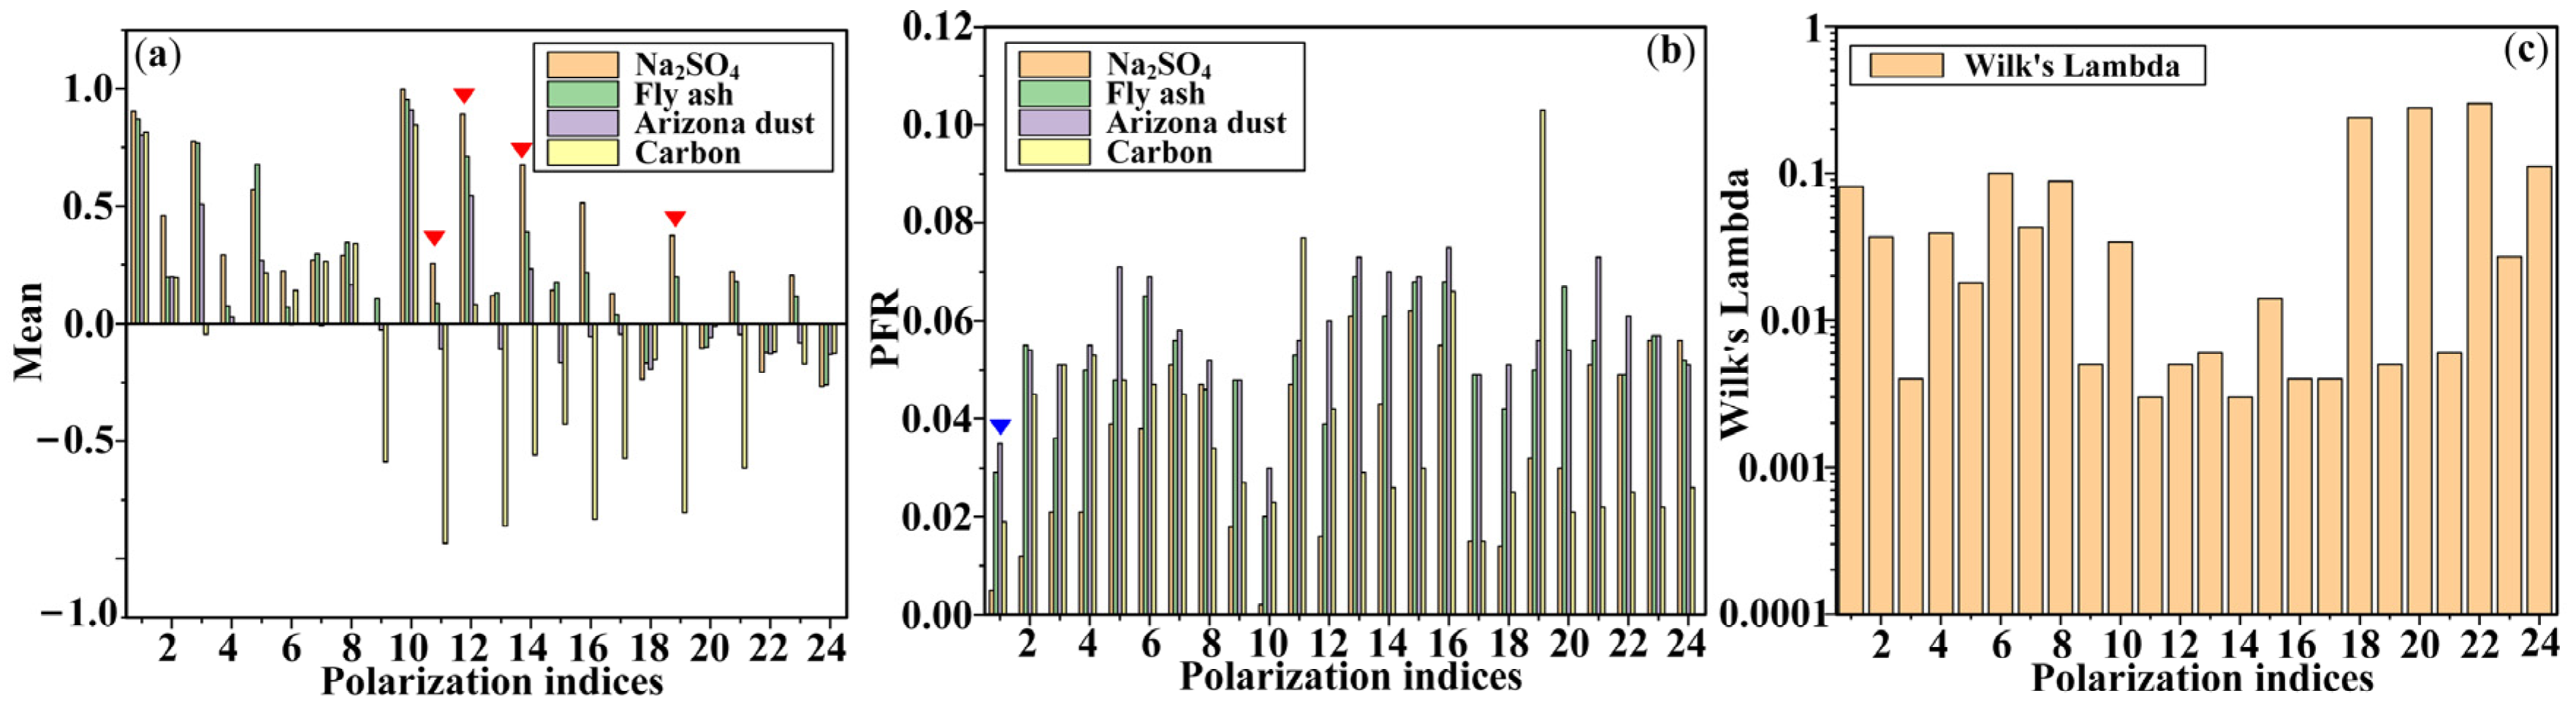
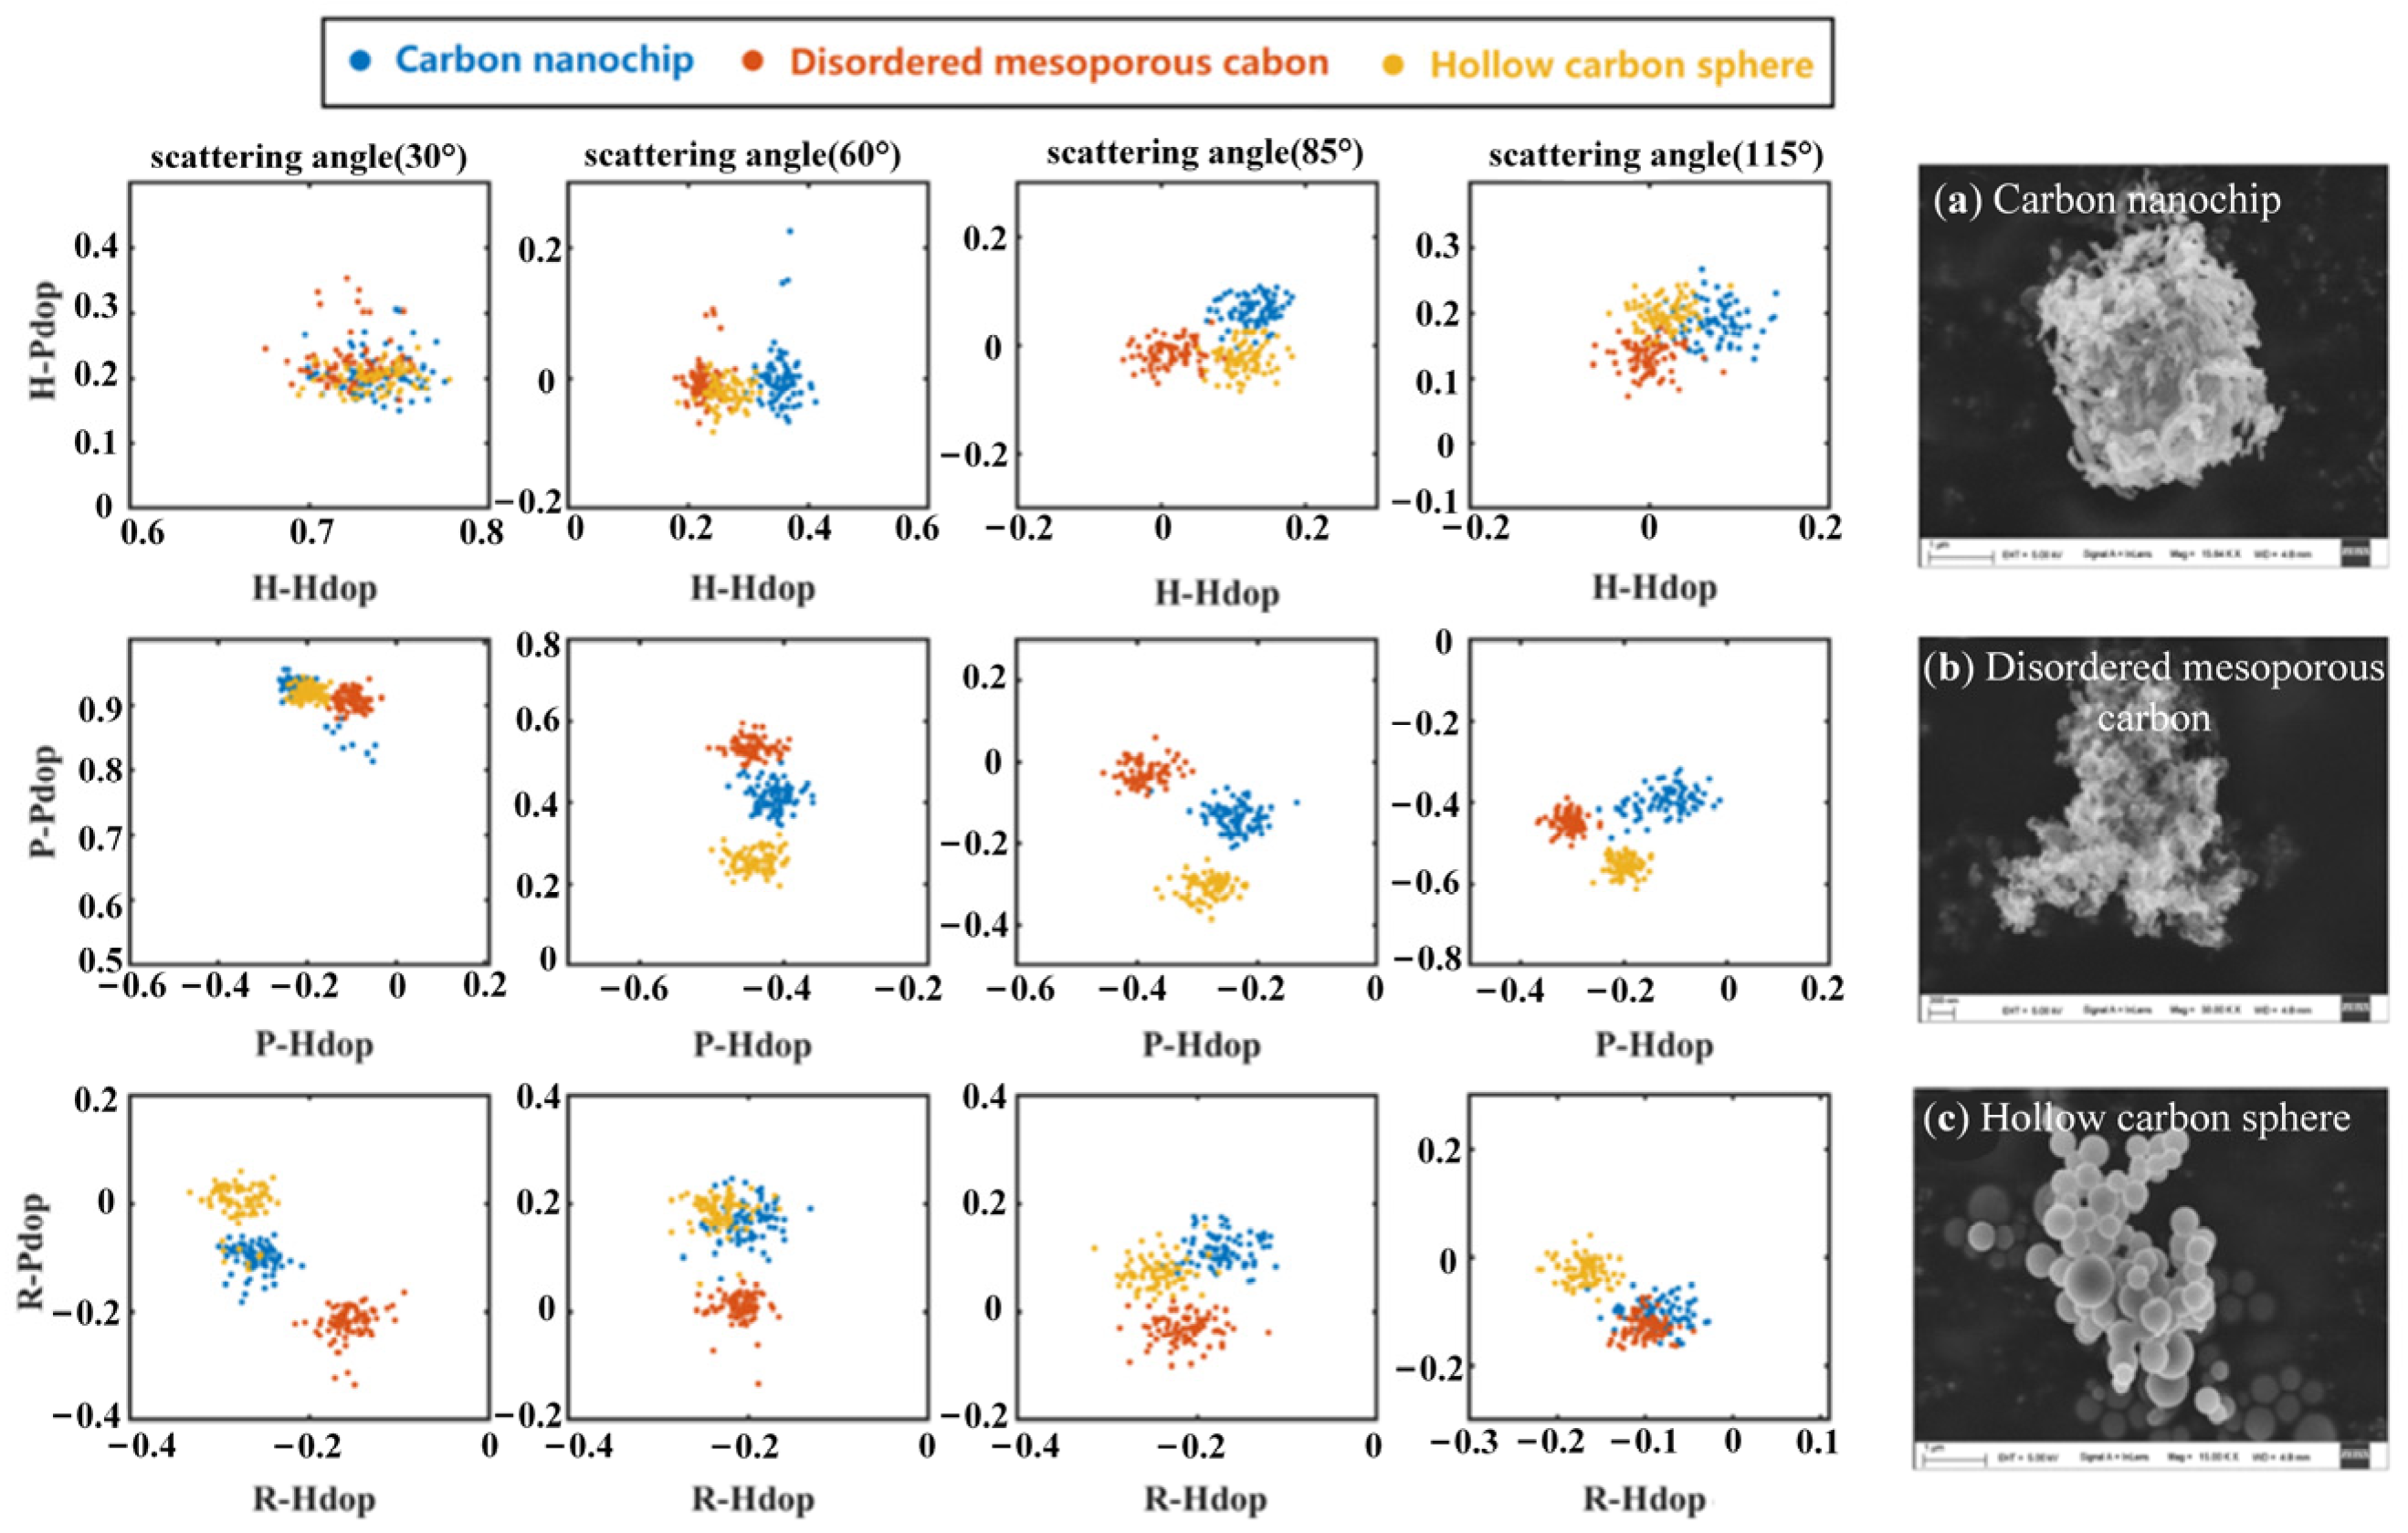
3.4. Polarization Characteristics of Particle Shape

Real atmospheric aerosols usually have complex irregular morphology. For example, carbon aerosols can have different microscopic characteristics, such as nanochips, disordered mesoporous particles, and hollow spheres, as shown in Figure 11a–c. Particles are more likely to cluster together in a real environment, which makes them more difficult to measure and analyze. Herein, we measured three kinds of aerosols, and polarization indices are shown in Figure 11 and Figure 12.
In general, the PFR and Wilk’s Lambda values of these irregular carbon samples are greater than the three groups of aerosol samples mentioned above. From the perspective of the Wilk’s Lambda index, the larger intraclass distance and smaller interclass difference are the main reasons that make it difficult to distinguish morphological attributes. Our previous studies [33] proposed using one specific polarization index to distinguish spherical, ellipsoidal, and fibrous suspended particles. However, from the electron microscope pictures, the morphological characteristics of these carbon aerosols are not simple shapes. Considering the in situ suspension status of measured aerosols, polarization characterization based on multidimensional indices can better identify and distinguish aerosol types because of the improvement of information dimensions.
According to Figure 12a, P-Pdop (60°), P-Pdop (85°), P-Hdop (115°), and R-Pdop (30°) of the four types of samples can be well-differentiated. However, through comprehensive consideration combined with PFR and Wilk’s Lambda factors in Figure 12b,c, P-Pdop (60°) and P-Pdop (85°) show feasibility in practical measurement and analysis. Additionally, from Figure 11 and Figure 12a, H-Hdop (30°), H-Pdop (30°), H-Pdop (60°), and R-Hdop (60°) seems insensitive to the aerosol appearances of black carbon samples.
For these aerosol samples with similar compositions but irregular morphology, the characterization ability of polarization indices is quite different. From the analysis of the experiments, it can be seen that the 45° linearly polarized incident state is most suitable for the characterization and differentiation of particulate matter. However, if we employ an H (horizontal) linear polarized state, the influence of particle morphology on polarization scattering is not obvious.

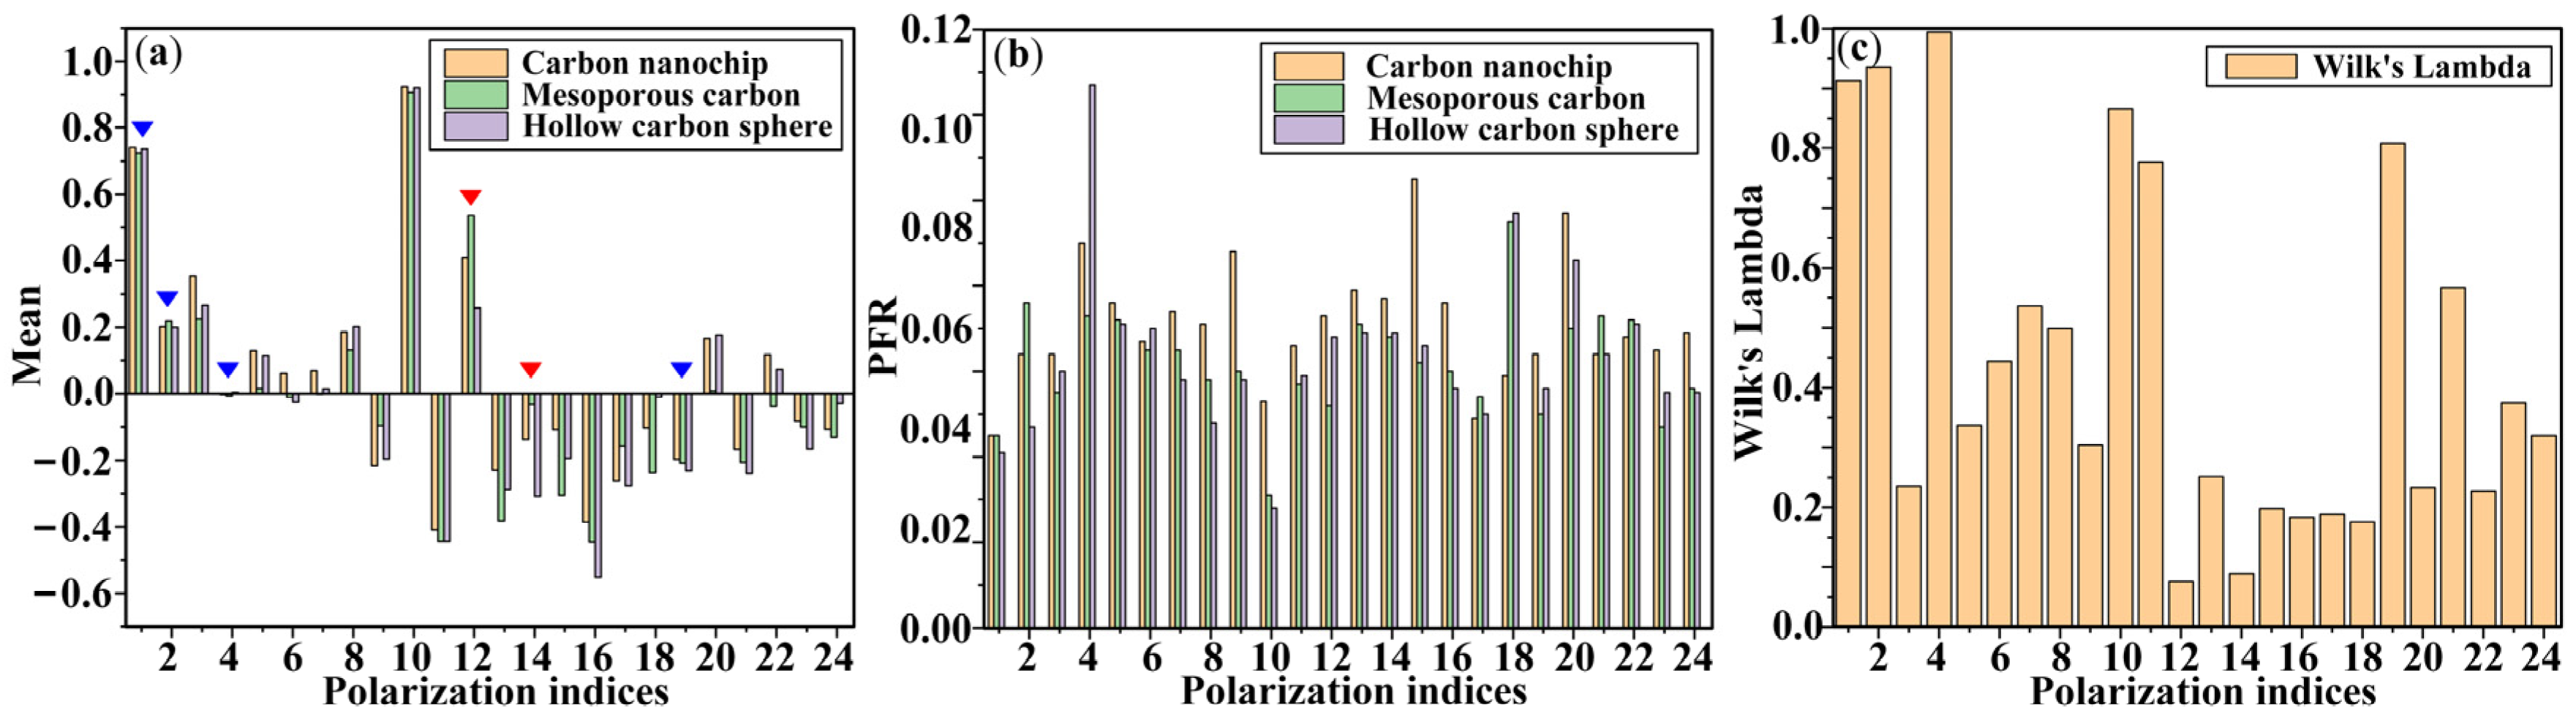
3.5. Optimal Combination of Polarization Indicators

Based on the above experimental results, it is clear that various properties of aerosol can affect the process of polarized light scattering, so we can classify and identify different types of aerosols by polarization characterization. The complex properties of aerosol samples and in-situ measurements in real environments make it difficult to obtain enough aerosol information only by a few specific polarization indicators, which implies the important potential of the fine recognition of aerosol types by the combination of multipolarization parameters. It should be noted that different polarization indices have different sensitivity and discrimination. In general, monodisperse particles show the smallest PFR values as shown in Figure 6b, but the polydispersity in aerosol scale and irregularity in morphology will cause a larger PFR. According to four groups of experimental results, it is easy for polarization characterization to distinguish the microphysical properties of aerosol samples. In our first group of experiments, the PSL particles with different sizes were clearly identified. Besides, polarization characterization also works well in distinguishing different aerosol compositions, especially for absorption characteristics, which can be supported by our second and third groups of experiments.
Finally, we select four polarization parameters from the above experimental results and show the scatter data distribution of the 12 types of aerosol samples used in this paper. Five boxes are used to mark some regular phenomena of polarization indices between different samples. If we observe the green frame A in Figure 13a, we can find that three water-soluble salts are completely indistinguishable based on P-Pdop (60°). Actually, according to the above figures, it can be noticed that P-Pdop (60°) is easily influenced by many aerosol features, such as particle size, morphology, and optical absorption. Based on their distribution perpendicular to the horizontal axis (P-Pdop (60°)), the key attribute difference among three water-soluble aerosol samples is the refractive index connected with different compositions. The H-Pdop (60°) of various aerosol samples marked by the yellow frame B and purple frame C also can be supported by the above experimental data. H-Pdop (60°) is a good indicator to distinguish aerosol composition but is insensitive to aerosol size and morphology; therefore, in group C, the polarization index distributions of four types of carbon samples with respective morphological characteristics are perpendicular to the vertical axis (H-Pdop (60°)). The case of three PSL particles with different sizes in frame B can be explained in a similar way. Furthermore, based on the above experiments, R-Hdop (60°) is sensitive to aerosol absorption and insensitive to aerosol morphology, and R-Pdop (30°) is not easily affected by optical absorption. So, in blue frame D, the polarization data distribution of three aerosol samples with different morphologies is perpendicular to the horizontal axis (R-Hdop (60°)). If combined with the regular pattern in Figure 13a, we can easily estimate whether morphology or size is the key difference of aerosol properties among various samples. For the red frame E in Figure 13b, the polarization data are distributed perpendicular to the vertical axis (R-Pdop (30°)), corresponding to the inherent absorption attributes from strong to weak.
In summary, Figure 13 shows the potential of multidimensional polarization indicators in aerosol classification and identification analysis. It is generally known that the properties of suspended aerosols can change dynamically with environmental factors. Figure 13 implies a feasible way to evaluate the changes of aerosol microphysical characteristics by the distribution of the polarization indices, and follow-up studies are in progress.

4. Conclusions

When suspended aerosols pass through the optical detection area of our multidimensional polarization analysis system one by one, their microphysical features, such as size, morphology, and refractive index, can affect the polarization status of scattered light. In this work, we employ a self-developed multi-angle Stokes vector analyzer to obtain 24-dimensional polarization indices simultaneously from 12 kinds of suspended particles. Experimental results make it clear that one or two selected polarization scattering optical indices cannot ensure that aerosols with complex properties in real atmospheric environments can be well-distinguished and identified. Different polarization indicators have respective discrimination for different aerosol categories and attributes, so a combination of multidimensional indices can be employed as a fingerprint-type optical feature to improve the refinement and specificity of aerosol recognition. If we have prior knowledge of aerosol types, such as water-soluble salts or carbonaceous particles, the mean, PFR, and Wilk’s Lambda values from the multidimensional polarization index system in this paper can provide some subsidiary basis to select the optimal indicators for specific aerosol type. Moreover, based on the sensitivity of different polarization indicators to aerosol properties, we can explain the microphysical characteristics of aerosols from various emission sources or describe the microphysical feature in the process of aerosol dynamic evolution.

Author Contributions

Conceptualization, R.L.; methodology, R.L.; software, R.L.; validation, R.L.; formal analysis, W.G. and N.Z.; investigation, W.G.; data curation, W.G.; writing—original draft preparation, R.L. and W.G.; writing—review and editing, W.G. and N.Z.; supervision, N.Z., Y.H. and H.M.; project administration, J.G., H.D. and D.H.; funding acquisition, N.Z. and H.M. All authors have read and agreed to the published version of the manuscript.

Funding

This work has been supported by National Key Program of Science and Technology Supporting Economy of China (2020YFF01014500ZL); Science and Technology Research Program of Shenzhen Grant (JCYJ20200109142820687).

Institutional Review Board Statement

Not applicable.

Informed Consent Statement

Not applicable.

Data Availability Statement

Data is contained within the article.

Conflicts of Interest

The authors declare no conflict of interest.

References

  1. Block, M.L.; Calderon-Garciduenas, L. Air pollution: Mechanisms of neuroinflammation and CNS disease. Trends Neurosci. 2009, 32, 506–516. [Google Scholar] [CrossRef] [Green Version]
  2. Maher, B.A.; Ahmed, I.A.; Karloukovski, V.; MacLaren, D.A.; Foulds, P.G.; Allsop, D.; Mann, D.M.; Torres-Jardon, R.; Calderon-Garciduenas, L. Magnetite pollution nanoparticles in the human brain. Proc. Natl. Acad. Sci. USA 2016, 113, 10797–10801. [Google Scholar] [CrossRef] [Green Version]
  3. Han, L.; Zhou, W.; Li, W.; Li, L. Impact of urbanization level on urban air quality: A case of fine particles (PM(2.5)) in Chinese cities. Environ. Pollut. 2014, 194, 163–170. [Google Scholar] [CrossRef]
  4. Huang, R.J.; Zhang, Y.; Bozzetti, C.; Ho, K.F.; Cao, J.J.; Han, Y.; Daellenbach, K.R.; Slowik, J.G.; Platt, S.M.; Canonaco, F.; et al. High secondary aerosol contribution to particulate pollution during haze events in China. Nature 2014, 514, 218–222. [Google Scholar] [CrossRef] [Green Version]
  5. Schmeisser, L.; Andrews, E.; Ogren, J.A.; Sheridan, P.; Jefferson, A.; Sharma, S.; Kim, J.E.; Sherman, J.P.; Sorribas, M.; Kalapov, I.; et al. Classifying aerosol type using in situ surface spectral aerosol optical properties. Atmos. Chem. Phys. 2017, 17, 12097–12120. [Google Scholar] [CrossRef] [Green Version]
  6. Aiken, A.C.; Decarlo, P.F.; Kroll, J.H.; Worsnop, D.R.; Huffman, J.A.; Docherty, K.S.; Ulbrich, I.M.; Mohr, C.; Kimmel, J.R.; Sueper, D.; et al. O/C and OM/OC ratios of primary, secondary, and ambient organic aerosols with high-resolution time-of-flight aerosol mass spectrometry. Environ. Sci. Technol. 2008, 42, 4478–4485. [Google Scholar] [CrossRef]
  7. Ajtai, T.; Filep, Á.; Schnaiter, M.; Linke, C.; Vragel, M.; Bozóki, Z.; Szabó, G.; Leisner, T. A novel multi−wavelength photoacoustic spectrometer for the measurement of the UV–vis-NIR spectral absorption coefficient of atmospheric aerosols. J. Aerosol Sci. 2010, 41, 1020–1029. [Google Scholar] [CrossRef]
  8. Groß, S.; Freudenthaler, V.; Wirth, M.; Weinzierl, B. Towards an aerosol classification scheme for future EarthCARE lidar observations and implications for research needs. Atmos. Sci. Lett. 2015, 16, 77–82. [Google Scholar] [CrossRef] [Green Version]
  9. Sousa, G.; Gaulier, G.; Bonacina, L.; Wolf, J.P. Discriminating Bio-aerosols from Non-Bio-aerosols in Real-Time by Pump-Probe Spectroscopy. Sci. Rep. 2016, 6, 33157. [Google Scholar] [CrossRef] [PubMed] [Green Version]
  10. Ansmann, A.; Wandinger, U.; Riebesell, M.; Weitkamp, C.; Michaelis, W. Independent measurement of extinction and backscatter profiles in cirrus clouds by using a combined Raman elastic-backscatter lidar. Appl. Opt. 1992, 31, 7113. [Google Scholar] [CrossRef]
  11. Costabile, F.; Barnaba, F.; Angelini, F.; Gobbi, G.P. Identification of key aerosol populations through their size and composition resolved spectral scattering and absorption. Atmos. Chem. Phys. 2013, 13, 2455–2470. [Google Scholar] [CrossRef] [Green Version]
  12. Groß, S.; Tesche, M.; Freudenthaler, V.; Toledano, C.; Wiegner, M.; Ansmann, A.; Althausen, D.; Seefeldner, M. Characterization of Saharan dust, marine aerosols and mixtures of biomass-burning aerosols and dust by means of multi-wavelength depolarization and Raman lidar measurements during SAMUM 2. Tellus B 2017, 63, 706–724. [Google Scholar] [CrossRef]
  13. Okamoto, H.; Sato, K.; Nishizawa, T.; Sugimoto, N.; Makino, T.; Jin, Y.; Shimizu, A.; Takano, T.; Fujikawa, M. Development of a multiple-field-of-view multiple-scattering polarization lidar: Comparison with cloud radar. Opt. Express 2016, 24, 30053–30067. [Google Scholar] [CrossRef]
  14. Jurányi, Z.; Burtscher, H.; Loepfe, M.; Nenkov, M.; Weingartner, E. Dual-wavelength light-scattering technique for selective detection of volcanic ash particles in the presence of water droplets. Atmos. Meas. Tech. 2015, 8, 5213–5222. [Google Scholar] [CrossRef] [Green Version]
  15. Muñoz, O.; Hovenier, J.W. Laboratory measurements of single light scattering by ensembles of randomly oriented small irregular particles in air. A review. J. Quant. Spectrosc. Radiat. Transf. 2011, 112, 1646–1657. [Google Scholar] [CrossRef]
  16. Renard, J.B.; Thaury, C.; Mineau, J.L.; Gaubicher, B. Small-angle light scattering by airborne particulates: Environnement S.A. continuous particulate monitor. Meas. Sci. Technol. 2010, 21, 085901. [Google Scholar] [CrossRef]
  17. Iwasaka, Y.; Shi, G.Y.; Shen, Z.; Kim, Y.S.; Trochkine, D.; Matsuki, A.; Zhang, D.; Shibata, T.; Nagatani, M.; Nakata, H. Nature of Atmospheric Aerosols over the Desert Areas in the Asian Continent: Chemical State and Number Concentration of Particles Measured at Dunhuang, China. Water Air Soil Pollut. Focus 2003, 3, 129–145. [Google Scholar] [CrossRef]
  18. Renard, J.-B.; Dulac, F.; Berthet, G.; Lurton, T.; Vignelles, D.; Jégou, F.; Tonnelier, T.; Jeannot, M.; Couté, B.; Akiki, R.; et al. LOAC: A small aerosol optical counter/sizer for ground-based and balloon measurements of the size distribution and nature of atmospheric particles—Part 1: Principle of measurements and instrument evaluation. Atmos. Meas. Tech. 2016, 9, 1721–1742. [Google Scholar] [CrossRef] [Green Version]
  19. Kobayashi, H.; Hayashi, M.; Shiraishi, K.; Nakura, Y.; Enomoto, T.; Miura, K.; Takahashi, H.; Igarashi, Y.; Naoe, H.; Kaneyasu, N.; et al. Development of a polarization optical particle counter capable of aerosol type classification. Atmos. Environ. 2014, 97, 486–492. [Google Scholar] [CrossRef]
  20. Li, D.; Zeng, N.; Zhan, D.; Chen, Y.; Zeng, M.; Ma, H. Differentiation of soot particulates in air using polarized light scattering method. Appl. Opt. 2017, 56, 4123–4129. [Google Scholar] [CrossRef] [PubMed]
  21. Weinzierl, B.; Sauer, D.; Esselborn, M.; Petzold, A.; Veira, A.; Rose, M.; Mund, S.; Wirth, M.; Ansmann, A.; Tesche, M.; et al. Microphysical and optical properties of dust and tropical biomass burning aerosol layers in the Cape Verde region—An overview of the airborne in situ and lidar measurements during SAMUM-2. Tellus B 2017, 63, 589–618. [Google Scholar] [CrossRef] [Green Version]
  22. Omar, A.H. Development of global aerosol models using cluster analysis of Aerosol Robotic Network (AERONET) measurements. J. Geophys. Res. 2005, 110. [Google Scholar] [CrossRef]
  23. Badieyan, S.; Dilmaghani-Marand, A.; Hajipour, M.J.; Ameri, A.; Razzaghi, M.R.; Rafii-Tabar, H.; Mahmoudi, M.; Sasanpour, P. Detection and Discrimination of Bacterial Colonies with Mueller Matrix Imaging. Sci. Rep. 2018, 8, 10815. [Google Scholar] [CrossRef] [Green Version]
  24. Li, X.; Liao, R.; Zhou, J.; Leung, P.T.Y.; Yan, M.; Ma, H. Classification of morphologically similar algae and cyanobacteria using Mueller matrix imaging and convolutional neural networks. Appl. Opt. 2017, 56, 6520–6530. [Google Scholar] [CrossRef]
  25. Li, X.; Liao, R.; Ma, H.; Leung, P.T.Y.; Yan, M. Polarimetric learning: A Siamese approach to learning distance metrics of algal Mueller matrix images. Appl. Opt. 2018, 57, 3829–3837. [Google Scholar] [CrossRef] [PubMed]
  26. Tang, I.N. Chemical and size effects of hygroscopic aerosols on light scattering coefficients. J. Geophys. Res. Atmos. 1996, 101, 19245–19250. [Google Scholar] [CrossRef]
  27. Wyatt, P.J. Some chemical, physical, and optical properties of fly ash particles. Appl. Opt. 1980, 19, 975–983. [Google Scholar] [CrossRef] [PubMed]
  28. Alexander, D.T.; Crozier, P.A.; Anderson, J.R. Brown carbon spheres in East Asian outflow and their optical properties. Science 2008, 321, 833–836. [Google Scholar] [CrossRef] [PubMed]
  29. Jiang, R.T.; Acevedo-Bolton, V.; Cheng, K.C.; Klepeis, N.E.; Ott, W.R.; Hildemann, L.M. Determination of response of real-time SidePak AM510 monitor to secondhand smoke, other common indoor aerosols, and outdoor aerosol. J. Environ. Monit. 2011, 13, 1695–1702. [Google Scholar] [CrossRef] [PubMed]
  30. Kandler, K.; Benker, N.; Bundke, U.; Cuevas, E.; Ebert, M.; Knippertz, P.; Rodriguez, S.; Schuetz, L.; Weinbruch, S.J.A.E. Chemical composition and complex refractive index of Saharan Mineral Dust at Izaa, Tenerife (Spain) derived by electron microscopy. Atmos. Environ. 2007, 41, 8058–8074. [Google Scholar] [CrossRef]
  31. Miffre, A.; Mehri, T.; Francis, M.; Rairoux, P. UV-VIS depolarization from Arizona Test Dust particles at exact backscattering angle. J. Quant. Spectrosc. Radiat. Transf. 2016, 169, 79–90. [Google Scholar] [CrossRef]
  32. Liao, R.; Zeng, N.; Zeng, M.; He, Y.; Ma, H. Estimation and extraction of the aerosol complex refractive index based on Stokes vector measurements. Opt. Lett. 2019, 44, 4877. [Google Scholar] [CrossRef] [PubMed]
  33. Chen, Y.; Zeng, N.; Chen, S.; Zhan, D.; He, Y.; Ma, H. Study on morphological analysis of suspended particles using single angle polarization scattering measurements. J. Quant. Spectrosc. Radiat. Transf. 2019, 224, 556–565. [Google Scholar] [CrossRef]
Figure 1. Size distribution of particles measured by an aerodynamic particle sizer.
Applsci 11 05992 g001
Figure 2. Schematic and experimental setup: (a) 3D view of the optical system; (b) schematic diagram of the experimental device. PSG: polarization state generator; C: cylindrical lens; I: intensity channel at 10°; P1–P4: polarization signal receivers at 30°, 60°, 85°, and 115° respectively; L: a spatial filtering lens module; PMT array: silicon photomultiplier tubes (SiPMT) array; PSA: polarization state analyzer. Each PSA is composed of four film polarizers (FP) fixed at the receiving end where the four FPs work as a four-quadrant polarization analyzing channel to separate the scattering light with different polarization states. The red arrows are the sample inlet and sheath inlet.
Applsci 11 05992 g002
Figure 3. Calibration results of monodisperse polystyrene spheres. (a) Measurements of PSL before calibration. (b) Measurements of PSL after calibration.
Applsci 11 05992 g003
Figure 4. (a) Intensity channel at 10° (each measurement point represents a particle); (b) 85-degree R-Pdop of different PSLs (each point in the figure is averaged over 300 particles); (c) relationship between standard deviation and average number at R-Pdop (85°) (each measurement point represents a particle).
Applsci 11 05992 g004
Figure 5. 24-dimensional polarization indices distribution of PSL samples with different sizes.
Applsci 11 05992 g005
Figure 6. (a) Mean values of multidimensional polarization indices; (b) PFR indices; (c) Wilk’s Lambda indices. The red triangles mark index 11 (P-Hdop (60°)) and index 16 (P-Pdop (115°)), and the blue triangles are index 3 (H-Hdop (60°)) and index 4 (H-Pdop (60°)).
Applsci 11 05992 g006
Figure 7. 24-dimensional polarization indices distribution of aerosol samples with different refractive indices.
Applsci 11 05992 g007
Figure 8. (a) Mean values of multidimensional polarization indices; (b) PFR indices; (c) Wilk’s Lambda indices. The red triangles mark index 2 (H-Pdop (30°)), index 4 (H-Pdop (60°)), index 16 (P-Pdop (115°)), and the blue triangles mark index 10 (P-Pdop (30°)), index 11 (P-Hdop (60°)), index 12 (P-Pdop (60°)).
Applsci 11 05992 g008
Figure 9. 24-dimensional polarization indices distribution of aerosol samples with different absorption effects. The SEM image of samples are listed in the right column: (a) Fly ash (b) Arizona dust; (c) Carbon sphere.
Applsci 11 05992 g009
Figure 10. (a) Mean values of multidimensional polarization indices; (b) PFR indices; (c) Wilk’s Lambda indices. The red triangles mark index 11 (P-Hdop (60°)), index 12 (P-Pdop (60°)), index 14 (P-Pdop (85°)), index 19 (R-Hdop (60°)), and the blue triangle marks index 1 (H-Hdop (30°)).
Applsci 11 05992 g010
Figure 11. 24-dimensional polarization indices distribution of four kinds of aerosol samples with irregular morphology. The SEM image of samples are listed in the right column: (a) Carbon nanochip; (b) Disordered mesoporous carbon; (c) Hollow carbon sphere.
Applsci 11 05992 g011
Figure 12. (a) Mean values of multidimensional polarization indices; (b) PFR indices; (c) Wilk’s Lambda indices. The red triangles mark index 12 (P-Pdop (60°)) and index 14 (P-Pdop (85°)), and the blue triangles mark index 1 (H-Hdop (30°)), index 2 (H-Pdop (30°)), index 4 (H-Pdop (60°)), index 19 (R-Hdop (60°)).
Applsci 11 05992 g012
Figure 13. (a) P-Pdop (60°) versus H-Pdop (60°) to identify aerosol features of previous sets of experiments: compositions (Box A, water-soluble salt), particle size (Box B, PSLs), optical absorption, and morphological characteristics (Box C, carbon samples). (b) R-Hdop (60°) versus R-Pdop (30°) to identify aerosol features: morphological characteristics (Box D, carbon samples) and the optical absorption effect (Box E, absorption effect from strong to weak).
Applsci 11 05992 g013
Table 1. Properties of the aerosol types included in this paper.
Shape Aerosol Type Manufacturer Complex Refractive Index Generator
SpherePSL (1, 2, 2.5 μm)Sigma-Aldrich1.590–0.000iMet-one 255
Quasi-sphericalNa2SO4Hong-Meng Beijing1.480–0.001i [26]Met-one 255
NaClHong-Meng Beijing1.540–0.001i [26]Met-one 255
NaNO3Hong-Meng Beijing1.587–0.001i [26]Met-one 255
Fly ashAIOFM1.570–0.010i [27]TSI-3400A
Carbon sphereNano-Micro Tech1.670–0.270i [28]TSI-3400A
Highly irregular shapeArizona dustPower Technology1.540–0.020i [29]TSI-3400A
Carbon nanochipSigma-Aldrich1.670–0.270i [28]TSI-3400A
Mesoporous carbonXFNANO1.670–0.270i [28]TSI-3400A
Hollow carbon sphereXFNANO1.670–0.270i [28]TSI-3400A
Table 2. The numbering order of polarization index in the figures.
Number Index Number Index Number Index
1H-Hdop (30°)9P-Hdop (30°)17R-Hdop (30°)
2H-Pdop (30°)10P-Pdop (30°)18R-Pdop (30°)
3H-Hdop (60°)11P-Hdop (60°)19R-Hdop (60°)
4H-Pdop (60°)12P-Pdop (60°)20R-Pdop (60°)
5H-Hdop (85°)13P-Hdop (85°)21R-Hdop (85°)
6H-Pdop (85°)14P-Pdop (85°)22R-Pdop (85°)
7H-Hdop (115°)15P-Hdop (115°)23R-Hdop (115°)
8H-Pdop (115°)16P-Pdop (115°)24R-Pdop (115°)
Publisher’s Note: MDPI stays neutral with regard to jurisdictional claims in published maps and institutional affiliations.

