Article

FruiTemp: Design, Implementation and Analysis for an Open-Source Temperature Logger Applied to Fruit Fly Host Experimentation

by
Evmorfia P. Bataka
1,*,
Vasilis G. Rodovitis
2,
Kostas D. Zarpas
2,
Nikos T. Papadopoulos
2 and
Christos T. Nakas
1,3
1
Laboratory of Biometry, Department of Agriculture, Crop Production and Rural Environment, University of Thessaly, Fytokou St., 384 46 Volos, Greece
2
Laboratory of Entomology and Agricultural Zoology, Department of Agriculture, Crop Production and Rural Environment, University of Thessaly, Fytokou St., 384 46 Volos, Greece
3
University Institute of Clinical Chemistry, Inselspital, Bern University Hospital, University of Bern, 3010 Bern, Switzerland
*
Author to whom correspondence should be addressed.
Submission received: 18 May 2021 / Revised: 23 June 2021 / Accepted: 25 June 2021 / Published: 28 June 2021
(This article belongs to the Special Issue Applied Agri-Technologies 2)

Abstract

:

Featured Application

Overwintering and aestivation studies for endophytic insects, development and population growth under field conditions, demographic analysis of field populations.

Abstract

FruiTemp is an open-source prototype developed to study the response of endophytic insect species such as fruit flies (Diptera: Tephrtidae) to variable temperature conditions including the controlled laboratory and fluctuating field settings. The system is a three-channel temperature sensor that consists of two precision thermistors that measure the temperature in the core and the surface of a fruit on a tree and a Harsh Environment thermistor that measures the air temperature surrounding the host at a rate of one measurement per 15 min. The sample rate can be adjusted according to the researcher’s needs. The system was successfully tested in field and laboratory experimental conditions using apples as the fruit model. The measurements on apples on trees lasted five consecutive days and produced a range of reliable data. After assessing statistical agreement and precision, the results revealed a differential bias of 0.331 °C and a proportional bias of a magnitude of 0.982. This work promotes open-source implementations allowing inexpensive solutions aiding experimentation procedures by significantly lowering operating costs.

1. Introduction

Development of technological applications in monitoring of environmental traits involves countless custom-made and/or industrial devices. These serve for overviewing smart greenhouses, in applications in precision agriculture, in smart farms [1,2], in recording climatic conditions, in applications of sensors for camera trap devices, in recording behavior of wildlife using tracking devices [3], etc. Our goal in this study was to create an inexpensive custom-made device that records core, surface and external temperature of a fruit and test it in laboratory conditions and further in field experiments of interest. The essential specifications for the device are the portability, power efficiency, user-friendly interface and a weatherproof enclosure. The sensor specifications include: sensor tips as less invasive as possible in order to reduce the insertion hole diameter on the fruit, accurate and precise readings. Additionally, an important consideration was the reduction of its development cost that would make feasible to bulk produce in-house for increased sample size in experimental trials.
The Mediterranean fruit fly (medfly), Ceratitis capitata (Wiedemann) (Diptera Tephritidae) is one of the most notorious agricultural pests worldwide. Medfly originated from the Afrotropical region and exist in wide range of climates in many parts of the world [4,5,6,7]. It is an extremely polyphagous species that completes many generations per year according to environmental conditions. It can infest approximately 353 hosts from 67 different families [4,8,9]. It is extremely damaging for many fruit species and cultivars since the infestation rates may reach 100% [5,10,11]. In Greece, it completes 3–7 generations per year. It overwinters at the larval stage, in locations where the temperature during the cold months is low, inside infested fruits, mostly in apples and bitter oranges [8]. Those fruits, such as apples remaining on the trees in autumn, often after harvest, provide the last breeding resources for female medflies and they receive the last ovipositions [11]. Prevailing climatic conditions determine both developmental process and survival of these last immatures and whether the life cycle can be completed yielding adults, next spring. The rate of successful overwintering and hence the fate of these individuals largely determine the population growth and infestation rates of the next season [12].
Being ectotherm, as all arthropods, egg and larvae development and survival of medflies depend on the temperature conditions within the last infested fruit. Living at the edge of environmental stress (i.e., winter conditions of temperate areas) small fluctuations may become detrimental for immatures survival within fruit. On the other hand, collectively small fluctuation may greatly affect the developmental process that are extremely low under such conditions [13]. Hence, acquiring precise data on temperature fluctuation are important for studying overwintering dynamics for medfly and other similar insect species. Thus far, most population growth models rely on air or soil temperature data and often place little emphasis on the overwintering generation and its particulates [14,15,16,17]. As mentioned above, medfly’s larvae overwintering success is determined by the temperature and the type of the host [8,12,13]. Thus, measuring the core temperature of the fruit and comparing it with its surface temperature and the temperature of the environment, would greatly enhance our understanding of the overwintering dynamics of medfly in temperate areas and would pave the way for furthermore detailed approaches on insects overwintering. Agreement between core temperature and fruit surface temperature needs to be established to use the latter as a proxy for the former in fruit fly related experiments allowing for the least possible damage and intervention regarding the host.
An open-source [18,19] logger integrated with precise and slightly intrusive point medical temperature sensors was developed to conduct a series of experiments regarding the FF-IPM project [20]. There are many devices available in the market to measure the inner fruit temperature [21,22] but most of them are either expensive, highly intrusive or incapable of logging temperature in remote places or outdoors in general, such as a tree, for many days. FruiTemp is an open-source system designed to measure accurately and precisely the temperature inside the core and the surface of a fruit and the environment surrounding it. We used the thermistor probes to precise the estimation of the temperature inside the apples which are considered ideal winter hosts of medfly.
The paper is organized as follows. The design of the device and its key components are introduced in Section 2.1 and statistical agreement is assessed in Section 2.2. The experimental design is described in Section 2.3. Results are described in Section 3. The discussion of the development and its future perspectives are described in Section 4. Conclusions are drawn in Section 5.

2. Materials and Methods

The workflow of our research is summarized in Figure 1.

2.1. Design of the Device

The device (Figure 2) is a portable, waterproof temperature data logger that is equipped with two fine precision medical temperature sensors and a harsh environment temperature probe. It can log data according to the interval prespecified by the user and has low power consumption needs. It is equipped with a real time clock powered by a backup battery to include a time stamp for every reading and a micro-SD card module to store the data.

2.1.1. Hardware

The main parts of the system are the microcontroller (Adafruit feather 32u4 proto board [23]), which is the processing part that coordinates all the others. The second most important parts are the Amphenol NTC thermistor MC65 series [24] and the Amphenol Industrial Temperature Sensor JS8746A [25]. The former sensor is a very fine point medical temperature sensor (1.65 mm diameter maximum), and the latter is a harsh-environment sensor for air temperature with a cylindrical enclosure. The size of the MC65 series makes it the best available solution for the experiment, which requires the least intrusive way to measure the temperature of the fruit’s core. Furthermore, we did not choose a smaller diameter for the sensing part although available, because, as the thermistor is inserted in the core of the fruit it might be damaged due to the friction between the flesh of the fruit and the thermistor during its insertion. The vital parts that contribute to the precision and accuracy of the system are the ADS1115 16-bit ADC—4 channel with Programmable Gain Amplifier [26]—which increases the ADC resolution from 10 to 15 bits and amplifies the analog signal of the sensor and the LM4040 Voltage Reference Breakout [27], which stabilizes the reference voltage to achieve more accurate readings. Table A1 displays the specification of the thermistors used.
The battery used for the system to be portable is a 1200 Mah Li-po battery, which can be recharged by means of a micro-USB connector while in operation. The use of headers in a Printed Circuit Board (PCB) allows the researchers to easily replace parts that might be damaged or not working properly. The detailed list of the components can be found in Appendix A.
The design is simple but efficient and is based on open-source technology. We have used a 32u4, 8-bit microcontroller, clocked in 8 Mhz. This choice was based on low consumption of the microcontroller and the vast number of guides and tutorials available that can provide guidance even for amateur users [23]. Since the 32u4 is equipped with a 10-bit analog to digital converter and the input range to the ADC is 0 to 2.048 Volts, a 16-bit analog to digital converter (ADS1115) equipped with an amplifier was added to the device. The readings from the thermistor are sent directly to the ADS1115, which uses an I2C connection with the microcontroller and the signal is amplified and digitized using 15 bits, instead of the microcontroller’s 10-bit ADC. The amplification gain according to the datasheet and the input voltage from the thermistor is 2, which means that the Vcc used in order to calculate the value of the thermistor in volts (Table A2, Appendix B, ADC value formula) is 2.048 Volts. Moreover, since the microcontroller reference voltage is not stable, an LM4040 voltage reference breakout is used (0.1% output voltage tolerance) by defining the reference as 2.048 volts. Last, all the reference resistors used to create a voltage divider to read the resistance of each thermistor are of high precision and are described in details in Appendix A. A logger shield [28] was used to write all the data to a micro-SD card integrated with a timestamp. The current time was acquired by the Real time clock PCF8523. The logger shield uses a 3 V CR1220 battery to keep track of the time even if the power is cut from the microcontroller to the logger shield. The schematic is available on Figure A1 (Appendix B).

2.1.2. Software

The datasheet of the ADS1115 includes the choice of samples per second that has a range of 8 to 860 samples per second. We used the Adafruit library for the ADS1115 [29] which by default uses 128 samples per second.
The logging interval is adjusted according to the users’ needs. For the FF-IPM experiments we used 1 and 15-min intervals.
The code was based on GitHub, OSBSS [30] and the instructions to provide it are in the supplementary material S1. The GitHub example is based on another thermistor of the manufacturer Vishay, the ADS1115 usage, the Hoge-2 equation, the resistance reading and the manual sample average. We added the logger functionality by adding the Real Time Clock, the SD-card, the sleep functionality for the MCU to reduce power consumption and the reduction of the self-heating effect functionality by powering the thermistor only when a measurement is taken. The coefficients of the thermistors were configured accordingly using the method described on Section 2.1.4.

2.1.3. Physical Features of the Device

The dimensions of the device (Figure 3b) are 136 mm × 83 mm × 44 mm. The box is equipped with mount holes useful in securing the device on the tree with nylon plastic cable ties. The MC65 (Figure 3c) and JS8746A (Figure 3d) sensors’ length is 400 mm and 1000 mm, respectively. Heat-Tubes are used to protect the MC65 sensors and silicone is applied in the junction between the sensor and the heat-tube to make it stiff and protect it from damage while we insert it in the fruit.

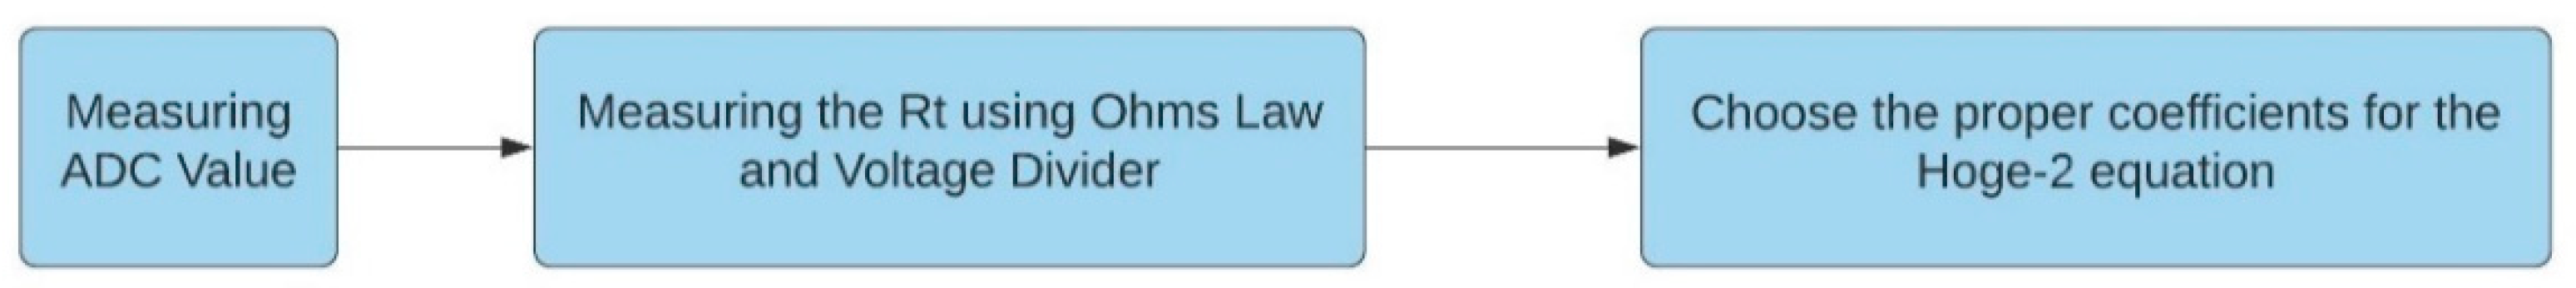
2.1.4. Calibration Method

The thermistors were calibrated using conventional non-expensive methods by accessing the sensors temperature resistance curves [31]. The procedure was based on Ohm’s Law and the Hoge-2 equation [32]. Only the MC65 thermistor is described since the JS8746A was calibrated the same way. The procedure is summarized in Figure A2 (Appendix B).
First, we had to read the resistance ratio of the thermistor in a range of 0 to 44 degrees of Celsius to choose the category of coefficients according to Table A3. We managed to do this by using a voltage divider and the formula Rt in Table A2. The reference resistance is 10 KOhms with a tolerance of 0.05%. The ADCvalue in the formula corresponds to the readings of the ADS1115 analog to digital converter (15 bits of precision and 1 bit for the sign) and amplifier which we used in order to increase the precision and resolution of the reading since the ADC of the microcontroller is only 10 bits. We calculated the ADC value by using the formula in Table A2. Vcc on gain two is 2.048 as the dataset of the ADS1115 suggests. We amplified the signal by only a gain of two since the output of the thermistor can only range between 0 and less than 2.048 volts. We used the LM4040 to have a reference of 2.048 with a 0.1% tolerance. This addition improved the accuracy and precision of the system since it keeps the voltage reference stable and the values will not fluctuate. The first formula on Table A2 calculates the resistance of the thermistor. The value 10,000 is the reference resistance and 32,767 is 215 − 1 which is the ADC number of bits.
The material of the thermistor is type F. For that reason, we used Table A3 to choose which coefficients were appropriate to form the Hoge-2 equation which is the best calibration equation comparing to nine more for the MF501 NTC thermistor according to Liu [33]. In our case the values of the resistor ranged between 0.5 to 3.223 so we used the second row (0.36035 to 3.274), this ratio is close to optimal linearity, according to Rudtsch [34] who states that for a microK-type of instrument, optimum linearity is achieved in the resistance ratio range between 0.2 and 1.2.

2.1.5. Power Consumption and Techniques Used for Its Reduction

FruiTemp runs on a 1200 mAh Li-po battery which can be recharged by means of a micro-USB connector while in operation. Power consumption reduction was achieved using software and hardware techniques. The microcontroller periodically goes to sleep, and the watchdog timer [35] awakes it for temperature sampling. The microcontroller is clocked at a low frequency of 8 Mhz. When the device is measuring and recording, which means that it is awake from the sleep function, it takes 6 s to measure and log the data and has an averaged power consumption of approximately 9.735 mAh. When the device enters sleep mode the power consumption drops to an average 1.944 mAh approximately. The average consumption of the device including both modes is 3.148 mAh, for a logging interval of 1 sample per minute.

2.1.6. Cost of the Device

The trade-off between cost and linearity [36] affected the design. The thermistor manufacturer suggests a circuit including a differential amplifier that improves the linearity of the thermistor. Since the ADS1115 includes 4 single channels or 2 differentials, we decided to use the single ones because the sensors were 3, leaving one channel unused. By using 2 differential channels, only 2 thermistors can be supported.
Other devices, like HOBO MX2303 which is weatherproof, power efficient, has high accuracy (±0.2 °C) and has an additional Bluetooth connection, could be a good fit to the experiments demand but it is only equipped with two probe sensors and not three, the diameter of the sensors (0.53 cm) is wider than the proposed system’s internal sensors (0.165 cm) and the housing of the sensor is a cylindrical stainless steel compared to the proposed system’s internal sensor, which is a point epoxy material which senses a significantly smaller area than the HOBO MX2303. Overall, the HOBO MX2303 is inappropriate because it provides only two sensors, compared to our device, which provides three, and the sensors of the HOBO MX2303 are much more intrusive comparing to the proposed systems sensors. Lastly, the Hengko temperature and relative humidity data recorder sensor is specifically made for fruits and vegetables, but it only provides one sensor, has an a non-acceptable for the experiment accuracy (±0.5 °C) and its probe is highly intrusive comparing to the proposed system.
The total cost was around EUR 110 (end 2020 market costs) which can be reduced substantially by not using breakout and prototype boards (for example adafruit 32u4 proto), instead create a PCB that include only the vital parts for the system that will also decrease the size of the device.

2.1.7. Bias Removing Techniques, Accuracy and Measurement Range

According to Ebrahimi-Darkhaneh [37], a thermistor dissipates power in the form of heat when current flows through it due to its nature since thermistors are resistors. For that reason, we connected the input voltage of the LM4040 to pin 6 of the MCU and adjusted the code to power the thermistor only when a reading is going to take place.
We also added manual averaging to the code. The function was getting 50 readings using a 10-millisecond interval, which according to Goumopoulos [38] for the thermistor the author used, 50 readings for every cycle delivered an optimal accuracy after proper calibration.
The MC65 thermistor reports an accuracy of 0.05 °C and the JS8746A reports an accuracy of 0.15 °C according to the manufacturer’s datasheet. The external ADC and the bias removing techniques we have used are not expected to add extra bias. The measuring range of the MC65 as reported in the datasheet is −40 °C to 105 °C and for JS8746A is −40 °C to 120 °C, but since the coefficients used to form the Hoge-2 equations were retrieved for a range of 0 °C to 44 °C, the present configuration suggests using this measurement range and is not limiting the device since it can be programmed to switch the parameters when the temperature is below 0 °C or above 44 °C.

2.2. Design of the Agreement Study: Measuring the Agreement Between the Core and the Surface Thermistor

The difference between the core and the surface temperature of apples was tested by inserting the green MC65 sensor (Figure 3c) in the core, 3.3 cm below the surface and the yellow MC65 sensor, 0.5 cm below the surface of 80 apples of the cultivar “Golden Delicious”. The apples had similar diameter (mean = 6.94 cm, st.dev = 0.355) and firmness (mean = 7.49 and st.dev = 0.535). We used 8 fixed temperature conditions of 2 °C, 5 °C, 15 °C, 20 °C, 27 °C, 30 °C, 34 °C and 43 °C.
The external temperature sensor was measuring the fixed temperature during the experiment since all devices like fridges or furnaces fluctuate within an interval around the fixed value. The values of the readings are provided in Table 1. For the first fixed temperature condition the apples were placed in a commercial fridge (PITSOS P1KCL3606D) set at a fixed temperature of 2 °C. For the 5 °C condition we placed the apples in a commercial fridge with a fixed temperature of 5 °C. For the 15 °C condition we placed 10 apples inside an Elvem CLP 600 chamber fixed at 15 °C. For the 20 °C we placed the apples in a controlled temperature room fixed at 20 °C.
For the rest of the temperature conditions, we used a WTC binder 78,532 furnace and set the temperature for 27 °C, 34 °C, 30 °C and 43 °C.
To reach the desired temperature the apples were placed for 15 h in the commercial fridges, chamber and the controlled environment room and 4 h in the furnace per desired temperature. Then, we picked one apple, pierced it with a sharp needle of 33 mm length and 3 mm diameter, inserted the green sensor and fixed it with sticky tape, pierced the apple 0.5 cm below the surface, inserted the yellow sensor, fixed it with duct tape and placed the apple in one of the aforementioned places with the logger. After 15 min, we switched on the logger to make the temperature stable in case it increased/decreased during the insertion routine and 15 measurements were taken every 3 s. The procedure was repeated for 10 apples per fixed temperature.

Agreement Techniques

The study of agreement comprises of two important parts. The first part is to quantify the extent of agreement between two measurement methods/instruments/or procedures and to determine whether this is sufficient so that they can be used ‘interchangeably’. The second part is to compare important characteristics of the measurement methods such as bias and precision [39]. The first goal of our study is the quantification of the difference between the core and the surface temperature. The second goal is the comparison of important characteristics such as bias and precision of the measurements since the bias reveals the trend of the difference along various ranges of temperature between the core and surface temperature of the fruit. The precision might reveal possible fluctuations of the temperature readings probably due to difference in temperature fluctuations in the two points of interest.
The official and valid approach used to compare two different measurement methods or instruments lies in the field of statistical agreement [39]. We followed the approach proposed by Taffe [40] and Taffe et al. [41] based on measurement error models that predict the true latent trait using an empirical Bayes approach. An R package is available for the implementation of the method [42]. A graphical illustration of the estimated bias between measurement approaches and the precision of each is allowed as well. Since the package focuses on recalibration of the two methods the source code of the package is modified to remove the recalibration step, which is not relevant in our case. The adapted code is presented in detail in Supplementary Materials S2. The model used is the following [40]:
y 1 i j = β 0 + β 1 x i j + ε 1 i j ,   ε 1 i j | x i ~ N ( 0 , σ ε 1 2 ( x i j ; θ 1 ) )
y 2 i j = x i j + ε 2 i j ,   ε 2 i j | x i ~ N ( 0 , σ ε 2 2 ( x i j ; θ 2 ) )
x i ~ f x ( μ x , σ x 2 )
where y 1 i j is the proxy surface measurement for i = 1 , , 8 subjects, j = 1 , , 15 is the number of replications per subject, y 2 i j is the reference measurement (fruit core temperature in our case). The parameters β 0 and β 1 are the differential and proportional biases, respectively, while x i j is a latent variable with density f x representing the true unknown trait value, true temperature for individual i in our case. As a result, x i j   x i . Method by subject interactions are absorbed into the measurement error terms. The quantities ε 1 i j , ε 2 i j represent measurement errors for measurements at the surface (1) and the core (2), respectively. It is assumed that the variances of these errors are heteroscedastic and increase/decrease with the level of the true latent trait x i j in a way that depends on the parameter θ 1 and θ 2 . These parameters quantify the trend of the variance’s fluctuation.
The regression model for y 2 i j is estimated by marginal maximum likelihood accounting non-parametrically for the heteroscedasticity by allowing the variance of ε 2 i j to be different for each decile of the empirical distribution of y 2 i ¯ (i.e., the mean of the individual repeated measurements y 2 i j ¯ is used as a rough approximation to x i ). Then, an empirical bias is adopted to predict x i by the mean of its posterior distribution (i.e., the mean of the conditional distribution of x i given the vector   y 2 i of observations for individual i by method 2), which is the best linear unbiased prediction (BLUP) for x i [29].
A smooth estimate of the (heterogeneous) variance of the measurement errors is computed by regressing the absolute values of the residuals ε 2 i j * ^ , from the linear regression model y 2 i j = a 2 * + β 2 * x i ^ + ε 2 i j * ^ , on x i ^ by ordinary least squares (OLS)
| ε 2 i j * ^   | = θ 2 ( 0 ) + θ 2 ( 1 ) x i ^ + v i j
We chose this configuration since the goal of the field experiment targets the difference between the core and the surface temperature of the fruit (see Introduction). We also added a scatterplot to examine the structure of the data and a Bland–Altman plot to check for trends and outliers.
Alternative approaches using mixed effect models or measurement error models were considered [39] but their implementation was not as straightforward as the preferred one.

2.3. Design of the Field Experiment

The experiment took place in apple orchards, in the mountainous village of Drakeia, south Pelion, at 500 m altitude, Volos, Greece. The climatic conditions of the area during the summer months exceed 30 °C and during the winter can drop below zero especially during nighttime. We installed the sensors in apple varieties Granny Smith and Red Delicious (Starking) after the harvest period. First, we randomly selected a tree and installed the first FruiTemp logger on the peak of a tree’s crown, the second to the east side of the tree, and the third on a low full shaded point. The selection of fruits/subjects varied according to their daily sun exposure. The apple located on the peak of the tree was exposed to the sun continuously during the day, the apple located to the south-east side of the tree was exposed to the sun for less time than the one on the peak and the last one was full shaded during the whole day. One sensor (MC65) was placed inside the core of the apple just before the side of sperm and the other (MC65) 1.5–2 mm away from the surface of the fruit. The third sensor (JS8746A) was placed also on the tree next to the fruit to measure the temperature of the environment (Figure 4). The system logging interval was adjusted to 15 min. After 24 h the next apple was measured for a total of 15 fruits. After the 24-h procedure each fruit was evaluated for its qualitative characteristics.

3. Results

Table 1 displays the temperature for every fixed condition (fixed temperature inside the fridges, room and furnaces described in Section 2.2) during the laboratory experiment, measured by the external temperature sensor, including the mean and standard deviations. The external sensor was placed 20 cm away from the fruit in all cases.
According to the scatterplot in Figure 5a the pairs of the measurements do not seem to deviate more than 0.5 units from the identity line. This is interpreted as minor differences among the core and surface temperatures especially for temperatures ranging from 9 °C to 19 °C. In Figure 5b the Bland–Altman and Limits of Agreement (LOA) plot is displayed [43,44,45], which were generated using the ‘MethodCompare’ package in R version 4.0.2 (The R Foundation for Statistical Computing, Vienna, Austria). The limits of agreement in the plot (blue dashed lines and a solid line for the regression) indicate that there is a positive bias of the measurement method for low temperature values and a negative bias for high values. The linear trend of the Bland–Altman plot indicates possible correlation between differences and averages, and difference in precision of the methods which is confirmed in the precision plot (Figure 6b). There were no outliers detected.
After the analysis, the results revealed a differential bias of 0.331 (95% CI: 0.299, 0.363) and a proportional bias of 0.982 (95% CI: 0.981, 0.983). The bias is positive for low values and negative for high values. Table 2 summarizes the biases with their corresponding 95% confidence intervals. The differential bias is a constant that the method adds to its measurements regardless of the true value being measured as per Choudhary [39]. The proportional bias is the amount of change observed by the method if the true value changes by one unit [43]. The Bland–Altman LOA plot on the other hand estimates a differential bias of 0.958 (95%CI: 0.658, 1.28) and a proportional bias of 0.976 (95%CI: 0.958, 0989) revealing the inadequacy of the specific method since it only assesses the variability of the differences but not each method separately.
The bias is displayed in Figure 6a and decreases as the true values increase until it reaches 0 at around 19 degrees of Celsius then increases at the opposite direction. Specifically, almost a zero bias was found around 19 °C, −0.2 °C at 30 °C and almost −0.4 °C at 40 °C. According to our results for a temperature of 40 °C in the core, the surface sensor will measure 39.612 (0.331 + 0.982*40), which gives a total bias of −0.4 °C compared to the core. The precision of each sensor is displayed in Figure 6b indicating that the core measurements are more precise than the surface temperatures revealing fluctuations of maximum 0.1 °C on absolute value when the surface temperature is measured and a constant difference of precision between the core and the surface of 0.2 °C with the core being more precise. This indicates that the core retains the temperature for more time than the surface much more in lower temperatures rather than in higher.

4. Discussion

The FruiTemp prototype was built to aid the needs of gathering data for the overwintering dynamics of medfly in marginal for its existence areas in the frameworks of the Horizon 2020 funded project FF-IPM. The system promotes the open-source community and inexpensive methods that can be adopted in other studies in entomology and agriculture. This project can be a guide for non-specialized researchers to build systems that can aid them on a wide range of similar experiments.
The proposed device has low cost, fine sensors, portability, energy efficiency and accuracy as assessed in laboratory conditions. A field experiment was further designed and implemented successfully. The proposed device combines all the characteristics that can be found in widely used commercial devices such as the Hobo Mx2303 [22] and the Hengko [21] which are much more expensive.
Agreement methods utilized were straightforward to implement and graphical tools makes it easier for an individual with basic statistical background to interpret the results.
Other upgrades and optimizations can be applied to increase the reliability, precision, and accuracy of the device. The method described by Liu [33] can be used to retrieve the coefficients for the Hoge-2 equation, to improve the calibration part. Since the thermistor curves provided from the manufacturer delivers a typical scenario of the sensors, an oil bath can be used to retrieve the Hoge-2 coefficients. In that case, the calibration can be applied for each individual thermistor.
Moreover, other parts can be added, such as a GSM module that directly sends the data retrieved on a fixed time interval, on a server. This addition will aid the researcher/individual as the remote access will notify for possible errors or will grant direct data access. Finally, if the device is established in an open field exposed to sunlight, a solar panel can be added, and power efficiency can be achieved for a longer period.
The FruitTemp prototype could be easily adapted to serve additional experimental needs in entomology and in ecology. Understanding insect phenology (seasonal occurrence), population growth and dynamics, as well as patterns of aging in the wild is still a major challenge in both applied ecology and entomology. Precise temperature recording in micro-habitats, such as a host fruit for medfly larvae, is of paramount importance for gaining insights regarding field biology of pikilotherms. The FruitTemp provides an inexpensive open-source system that can be used in a wide range of studies besides overwintering. The data generated from these kinds of experiment will feed population modeling with reliable data that increase the precision of the projection and assist the management activities often implemented against insect pests.
Future research involves a detailed assessment of temperature fluctuations in the core of the fruit given standard temperature external conditions and the study of different hosts.

5. Conclusions

Our device was successfully tested in the lab and field in a wide range of temperature settings. Quantitative assessment can be efficiently performed via methods based on statistical analysis of agreement that are implemented in open-source software. The results revealed a fixed bias of 0.331 and a proportional bias of 0.982 between the core and the surface temperature.
The field experiment that followed was designed and conducted for five consecutive days. The device confirmed its power efficiency during the five consecutive days of its function. Measurements were successfully logged, with the device having no failure in any of the 15- or 1-min intervals along the course of this study.
The device can be used in similar applications, e.g., other hosts, and in a wide variety of environmental conditions. Moreover, it promotes open-source, custom made solutions for conducting experiments with small cost allowing for relatively large sample sizes that can achieve the anticipated by design statistical power in formal hypothesis testing.
Last, it can be easily modified by researchers depending on their experimental needs. Any part can be replaced in case of malfunction, without affecting its performance.

Supplementary Materials

The following are available online at https://0-www-mdpi-com.brum.beds.ac.uk/article/10.3390/app11136003/s1, S1: The arduino code for the FruiTemp system, S2: The adapted code from the methodCompare package. Only the modified lines are presented. The enumeration of the lines follows the source code website’s format [46], S3: The raw data of the laboratory experiment.

Author Contributions

Conceptualization, E.P.B., C.T.N. and N.T.P.; methodology, E.P.B., V.G.R., K.D.Z., N.T.P. and C.T.N.; software, E.P.B.; validation, E.P.B. and V.G.R.; formal analysis, E.P.B.; resources, E.P.B., V.G.R., N.T.P. and C.T.N.; data curation, E.P.B.; writing—original draft preparation, E.P.B., V.G.R., N.T.P. and C.T.N.; writing—review and editing, E.P.B., V.G.R., K.D.Z., N.T.P. and C.T.N.; visualization, E.P.B.; supervision, N.T.P. and C.T.N.; project administration, E.P.B., N.T.P. and C.T.N.; funding acquisition, N.T.P. All authors have read and agreed to the published version of the manuscript.

Funding

This study was funded by the European Union’s Horizon 2020 Research and Innovation Program FF-IPM (grant agreement No 818184).

Institutional Review Board Statement

Not applicable.

Informed Consent Statement

Not applicable.

Data Availability Statement

Data is contained within the article or supplementary material. The data presented in this study are available in supplementary material S3.

Acknowledgments

The authors thank four (4) anonymous reviewers for their feedback that significantly improved the manuscript.

Conflicts of Interest

The authors declare no conflict of interest. The funders had no role in the design of the study; in the collection, analyses, or interpretation of data; in the writing of the manuscript, or in the decision to publish the results.

Appendix A

Detailed list of the components.
  • Amphenol NTC thermistor MC65 series, 10K 25 °C is a precision solid state temperature sensor. The tolerance and interchangeability of this sensor is ±0.05 °C. It is resin coated for good mechanical strength and resistance to solvents. The sensor itself is a 1.65 mm diameter “point”-sensor with 0.1 mm diameter heavy isomid insulated bifilar nickel lead wires. Its thermal time constant is 0.5 s in stirred oil an d8 s in still air. The datasheet is available in the reference [24].
  • Metal Film Resistor Vishay/Dale [47]. Through Hole 1/4-watt 10 Kohms with 0.05% tolerance and 5 ppm.
  • Metal Film Resistor Vishay/Dale [47]. Through Hole 1/4-watt 10 Kohms 0.1% tolerance 5 ppm.
  • Amphenol Industrial Temperature Sensor JS8746A [25]. The tolerance and interchangeability of this sensor is ±0.15 °C. According to the manufacture notes [21] the sensor has been designed to address all aspects of temperature measurement for HVAC (Heating, Ventilation and air conditioning) control systems. Employing materials and build standards that enhance the sensor’s ability to withstand water ingression and degradation, the sensor meets statutory requirements for temperature measurement and performance expectations. It is equipped with environmental protection IP68, it is resistant to salt solutions, ozone, UV and a variety of marine environment cleaning detergents. It is equipped with stainless steel hard shell, with class corrosion resistance A2 or better according to ISO3506.
  • Precision LM4040 Voltage Reference Breakout 2048 V and 4096 V [27]. This breakout was used due to the noisy voltage reference of the adafruit feather 32u4. To achieve high precision, we used the breakout to have a reference of 2048 V for the thermistors. Using Ohm’s Law, the reference had to be stable as possible to calculate the temperature with high precision and accuracy.
  • ADS1115 16-bit ADC-4 channels with Programmable Gain Amplifier [26]. This part was used due to the lack of the feather’s 32u4 precision in the conversion of analog to digital signal. The feather has a 10-bit precision ADC, so we used this part to reach a 16-bit ADC for the system to be more sensitive to small changes of the voltage. For that reason, the system can be more precise. Moreover, we used the amplifier of the part to amplify the signal. We kept the amplification factor low to make the noise as low as possible.
  • Adafruit Feather 32u4 Basic Proto [23]. We used this development board because the microcontroller has proven to be robust and tested for many years since it was released. The MCU is clocked at 8 Mhz and at 3.3 V logic. It has a built-in USB-to-serial program and debug capability built in. Additionally, it is a low consumption microcontroller and the board is equipped with a connector for any 3.7 Lithium Polymer battery and built in charging.
  • Adafruit Adalogger FeatherWing [29]. This shield is equipped with an SD-card module and a battery-packed Real Time Clock. It can be plugged on top of the microcontroller board and can be easily used.
  • Lithium Polymer single cell 3.7 Volt and a capacity of 1200 mah.
  • A switch [48].
  • A switch waterproof cap [48].
  • Cable Glands pg7 [49].
  • An IP 54 box by HAMMOND [50].
  • Heat-Shrinkable tubes, 3 mm and 0.8 mm.
  • Prototyping hook-up single wires 22 AWG.
  • Double-Side Printed Circuit Board.
  • Radiation shield. A custom-made radiation shield made of plastic was design and constructed using CNC machinery.

Appendix B

Figure A1. The circuit sketch describes the connections among the electronic parts. For the sketch of the circuit, we used the open-source schematic maker Fritzing [51].
Applsci 11 06003 g0a1
Table A1. Specifications of the thermistors.
ThermistorTolerance Resistance   at   25   ° C   Nominal Thermistor Diameter
MC65F103A 0.05   ° C 10   KOhms 1.65 mm
maximum
JS8746A-0.15 0.15   ° C 10   KOhms 5.8 mm
Table A2. Formulas used to calculate the resistance of the thermistor (Rt), the temperature reading (Hoge-2) and the ADC value.
RTTemperature Reading (Hoge-2)ADC Value
10,000 32,767 A D C v a l u e 1 1 ( A   +   B · l o g ( R t R r e f )   +   C · ( l o g ( R t R r e f ) ) 2   +   D · ( l o g ( R t R r e f ) ) 3 ) a d c · V c c   o n   g a i n   t w o V c c   R e f e r e n c e
Table A3. The coefficients of the Hoge-2 equation based on the values of the fraction Rt/R25, which is the value of the resistance measured using Ohm’s Law over the value of the reference resistance (10 KOhm in our case).
Rt/R25 Rangeabcd
68.600 to 3.274 3.3538646 × 10 3 2.5654090 × 10 4 1.9243889 × 10 6 1.0969244 × 10 7
3.274 to 0.36036 3.3540154 × 10 3 2.5654090 × 10 4 2.0829210 × 10 6 7.300320 × 10 6
0.36036 to 0.06831 3.3539264 × 10 3 2.5609446 × 10 4 1.9621987 × 10 6 4.6045930 × 10 8
0.06831 to 0.01872 3.3368620 × 10 3 2.4057263 × 10 4 2.6687093 × 10 6 4.0719355 × 10 7
Figure A2. Calibration procedure.
Applsci 11 06003 g0a2

References

  1. Ferrandez-Pastor, F.J.; Alcaniz-Lucas, S.; Carcia-Chamizo, J.M.; Platero-Horcajadas, M. Smart Environments Design on Industrial Automated Greenhouses. In Proceedings of the 13th International Conference on Ubiquitius Computing and Ambient Intelligence UCAml, Toledo, Spain, 2–5 December 2019. [Google Scholar] [CrossRef] [Green Version]
  2. Ni, J.; Zhang, J.; Wu, R.; Pang, F.; Zu, Y. Development of an Apparatus for Crop-Growth Monitoring and Diagnosis. Sensors 2018, 18, 3129. [Google Scholar] [CrossRef] [Green Version]
  3. Bouten, W.; Baaij, E.W.; Shamoun-Baranes, J.; Camphuysen, K.C.J. A flexible GPS tracking system for studying bird behaviour at multiple scales. J. Ornithol. 2012, 154, 571–580. [Google Scholar] [CrossRef] [Green Version]
  4. Liquido, N.J.; Shinoda, L.A.; Cunningham, R.T. Host Plants of the Mediterranean Fruit Fly (Diptera: Tephritidae): An Annotated World Review; Miscellaneous publications of the Entomological Society of America: Annapolis, MD, USA, 1991; p. 77. [Google Scholar]
  5. White, I.M.; Elson-Harris, M.M. Fruit Pest Species. In Fruit Flies of Economic Significance: Their Identification and Bionomics, 1st ed.; CAB: Wallingford, UK, 1992; pp. 291–297. [Google Scholar]
  6. De Meyer, M.; Copeland, R.S.; Wharton, R.A.; McPheron, B.A.; Barnes, B.N. On the Geographic Origin of the Medfly Ceratitis Capitata (Wiedemann) (Diptera: Tephritidae). In Proceedings of the 6th International Fruit Fly Symposium, Stellenbosch, South Africa, 6–10 May 2002; Isteg Scientific Publications: Irene, South Africa, 2002. [Google Scholar]
  7. Papadopoulos Nikos, T.; Plant, R.E.; Carey, J.R. From trickle to flood: The large-scale, cryptic invasion of California by tropical fruit flies. Proc. R. Soc. B Biol. Sci. 2013, 280, 1768. [Google Scholar] [CrossRef] [PubMed] [Green Version]
  8. Papadopoulos, N.T.; Carey, J.R.; Katsoyannos, B.I.; Kouloussis, N.A. Overwintering of the Mediterranean Fruit Fly (Diptera: Tephritidae) in Northern Greece. Ecol. Popul. Biol. 1996, 89, 526–534. Available online: https://0-academic-oup-com.brum.beds.ac.uk/aesa/article/89/4/526/62776 (accessed on 5 March 2021). [CrossRef]
  9. Badii, K.B.; Billah, M.K.; Afreh Nuamah, K.; Obeng Ofori, D.; Nyarko, G. Review of the pest status, economic impact and management of fruit-infesting flies (Diptera: Tephritidae) in Africa. Afr. J. Agric. Res. 2015, 10, 1488–1498. [Google Scholar] [CrossRef] [Green Version]
  10. Fimiani, P. Mediterranean Region. In Fruit Flies: Their Biology, Natural Enemies and Control; World crop pests; Robinson, A.S., Hooper, G., Eds.; Elsevier: Amsterdam, The Netherlands, 1989; Volume 3A, pp. 39–50. [Google Scholar]
  11. Tzanakakis, M.E.; Katsoyannos, B.I. Insect Pests of Citrus spp. In Insects of Fruit Trees and Grapevine, 2nd ed.; Agrotypos: Athens, Greece, 2003; pp. 213–219. [Google Scholar]
  12. Papadopoulos, N.T.; Katsoyannos, B.I.; Carey, J.R.; Kouloussis, N.A. Seasonal and Annual Occurrence of the Mediterranean Fruit Fly (Diptera: Tephritidae) in Northern Greece. Ann. Entomol. Soc. Am. 2001, 94, 41–50. Available online: https://0-academic-oup-com.brum.beds.ac.uk/aesa/article/94/1/41/120967 (accessed on 5 March 2021). [CrossRef]
  13. Papadopoulos, N.T.; Katsoyannos, B.I.; Kouloussis, N.A.; Economopoulos, A.P.; Carrey, J.R. Effect of adult age, food, and time of day on sexual calling incidence of wild and mass-reared Ceratitis capitata males. Entomol. Exp. Appl. 1998, 89, 175–182. [Google Scholar] [CrossRef]
  14. Gutierrez, A.P.; Ponti, L.; Cossu, Q.A. Effects of climate warming on Olive and olive fly (Bactrocera oleae (Gmelin)) in California and Italy. Clim. Chang. 2009, 95, 195–217. [Google Scholar] [CrossRef]
  15. Gutierrez, A.P.; Ponti, L. Assessing the invasive potential of the Mediterranean fruit fly in California and Italy. Biol. Invasions 2011, 13, 2661–2676. [Google Scholar] [CrossRef] [Green Version]
  16. Ponti, L.; Antoniocossu, Q.; Gutierrez, A.P. Climate warming effects on the Olea europaea-Bactrocera oleae system in Mediterranean islands: Sardinia as an example. Glob. Chang. Biol. 2009, 15, 2874–2884. [Google Scholar] [CrossRef]
  17. Vera, M.T.; Rodriguez, R.; Segura, D.F.; Cladera, J.L.; Sutherst, R.W. Potential geographical distribution of the Mediterranean fruit fly, Ceratitis capitata (Diptera: Tephritidae), with emphasis on Argentina and Australia. Environ. Entomol. 2002, 31, 1009–1022. [Google Scholar] [CrossRef] [Green Version]
  18. Introduction to the Open-Source Philosophy and the Benefits of Sharing. Available online: https://www.academia.edu/44461841/Introduction_to_the_Open_Source_Philosophy_and_The_Benefits_of_Sharing (accessed on 10 March 2021).
  19. Community and Collaboration Open-Source Initiative. Available online: https://opensource.org/community (accessed on 19 April 2021).
  20. FF-IPM. Available online: https://fruitflies-ipm.eu/ (accessed on 20 April 2021).
  21. Hengko. Handheld Temperature and Relative Humidity Data Recorder Sensor in Fruit and Vegetable Warehouses Glasshouses. Available online: https://www.hengko.com/control-the-atmosphere-relative-humidity-and-temperature-sensor-in-fruit-and-vegetable-warehouses-glasshouses-products/ (accessed on 2 April 2021).
  22. Hobo Mx2303 Two External Temperature Sensors Data Logger. Available online: https://www.onsetcomp.com/products/data-loggers/mx2303 (accessed on 2 April 2021).
  23. Adafruit Feather 32u4 Basic Proto. Datasheet and Tutorial of the Feather 32u4 Basic Proto. Available online: https://learn.adafruit.com/adafruit-feather-32u4-basic-proto (accessed on 20 April 2020).
  24. Amphenol. NTC Interchangeable Type 65 Series, Thermometrics, Thermistors Datasheet. Available online: https://gr.mouser.com/datasheet/2/18/AAS-920-306C-NTC-Type-65-Series-031314-web-1315871.pdf (accessed on 20 April 2020).
  25. Amphenol. JS8746 Harsh Environment Temperature Sensor Datasheet. Available online: https://gr.mouser.com/datasheet/2/18/Amphenol_07152019_AAS-920-747B-Thermometrics_JS874-1622552.pdf (accessed on 20 April 2020).
  26. Texas Instruments. ADS1115 Ultra-Small, Low-Power, 16-Bit, Analog-to-Digital Converter with Internal Reference. Available online: https://cdn-shop.adafruit.com/datasheets/ads1115.pdf (accessed on 20 April 2020).
  27. Texas Instruments. LM4040-N/LM4040Q-N Precision Micropower Shunt Voltage Reference Datasheet. Available online: https://cdn-shop.adafruit.com/datasheets/lm4040-n.pdf (accessed on 20 April 2020).
  28. Adafruit Adalogger Feather Wing Tutorial. Available online: https://learn.adafruit.com/adafruit-adalogger-featherwing (accessed on 20 April 2020).
  29. Github. Adafruit ADS1x15. Available online: https://github.com/adafruit/Adafruit_ADS1X15 (accessed on 20 April 2020).
  30. Github. OSBSS/Thermistor v_2. Available online: https://github.com/OSBSS/Thermistor_v2 (accessed on 20 April 2020).
  31. Amphenol. Sensor Temperature Resistance Curves, Reference Guide. Available online: https://amphenol-sensors.com/en/component/edocman/292-thermometrics-temperature-resistance-curves-reference-guide/download?Itemid=8466%20%27 (accessed on 20 April 2020).
  32. Hoge, H.J. Useful procedure in least squares, and tests of some equations for thermistors. Rev. Sci. Instrum. 1988, 59, 975–979. [Google Scholar] [CrossRef]
  33. Guang, L.; Liang, G.; Ghunlong, L.; Qingwen, W. Evaluation of Different Calibration Equations for NTC Thermistor Applied to High-Precision Temperature Measurement. Measurement 2018, 120, 21–27. [Google Scholar] [CrossRef]
  34. Rudtsch, S.; Rohden, C. Calibration and self-validation of thermistors for high precision temperature measurements. Measurement 2015, 76, 1–6. [Google Scholar] [CrossRef]
  35. WatchDog Library. Available online: https://www.arduinolibraries.info/libraries/watch-dog (accessed on 11 May 2021).
  36. Application Spotlight-NTC Sensor Linearization-Amphenol. Available online: https://www.amphenol-sensors.com/en/literature/459-thermometrics-application-spotlight-ntc-sensor-linearization/download (accessed on 20 April 2020).
  37. Ebrahimi-Darkhaneh, H. Measurement Error Caused by Self-Heating in NTC and PTC Thermistors. Available online: https://www.ti.com/lit/an/slyt774/slyt774.pdf?ts=1624707191874 (accessed on 20 April 2020).
  38. Goumopoulos, C. A High Precision, Wireless Temperature Measurement System for Pervasive Computing Applications. Sensors 2018, 18, 3445. [Google Scholar] [CrossRef] [PubMed] [Green Version]
  39. Choudhary, P.K.; Nagaraja, H.N. Measuring Agreement, 1st ed.; Wiley: Hoboken, NJ, USA, 2017; pp. 1–251. [Google Scholar]
  40. Taffe, P. Assessing bias, precision, and agreement in method comparison studies. Stat. Methods Med. Res. 2020, 29, 778–796. [Google Scholar] [CrossRef]
  41. Taffe, P.; Halfon, P.; Halfon, M. A new statistical methodology overcame the defects of the Bland-Altman method. J. Clin. Epidemiol. 2020, 124, 1–7. [Google Scholar] [CrossRef] [PubMed]
  42. Taffe, P.; Peng, M.; Stagg, V.; Williamson, T. MethodCompare: An R package to assess bias and precision in method comparison studies. Stat. Methods Med. 2019, 28, 2557–2565. [Google Scholar] [CrossRef] [PubMed]
  43. Altman, D.G.; Bland, J.M. Measurement in medicine: The analysis of method comparison studies. J. R. Stat. Soc. 1983, 32, 307–317. [Google Scholar] [CrossRef]
  44. Bland, J.M.; Altman, D.G. Statistical methods for assessing agreement between two methods of clinical measurement. Lancet 1986, 327, 307–310. [Google Scholar] [CrossRef]
  45. Bland, J.M.; Altman, D.G. Measuring agreement in method comparison studies. Stat. Methods Med. Res. 1999, 8, 135–160. [Google Scholar] [CrossRef] [PubMed]
  46. MethodCompare: Bias and Precision Plots to Compare Two Measurements with Possibly Heteroscedastic Measurement Errors: Source Code. Available online: https://rdrr.io/cran/MethodCompare/src/R/measure_compare.R (accessed on 30 April 2021).
  47. Vishay, Metal Film Resistors, Axial, High Precision, High Stability Datasheet. Available online: https://gr.mouser.com/datasheet/2/427/ptf-1763051.pdf (accessed on 20 April 2020).
  48. Switch and Waterproof Cap Datasheet. Available online: http://www.massuse-relay.com/details/MTSSeries.pdf (accessed on 20 April 2020).
  49. Cable Glands, Strain Reliefs & Cord Grips Pg7. Available online: https://gr.mouser.com/ProductDetail/Phoenix-Contact/1424485?qs=5aG0NVq1C4zcxLN1LlxTtw%3D%3D (accessed on 20 April 2020).
  50. Hammond Manufacturing. ABS Plastic Multi-Purpose Enclosures w/PC Board Standoffs. Available online: https://gr.mouser.com/ProductDetail/546-1591XXSSFLBK (accessed on 20 April 2020).
  51. Fritzing, Open Source CAD software. Available online: https://fritzing.org/ (accessed on 20 April 2020).
Figure 1. Initially the device was designed according to the specifications based on the nature of the experiment. Then, the laboratory experiment was designed and data collection followed. Data analysis involved statistical methods to assess the Agreement. Our findings confirmed the initial hypothesis which allowed us to design the field experiment.
Applsci 11 06003 g001
Figure 2. The device consists of two precise medical sensors inserted in the fruit and an environment temperature probe. There is also an On/Off waterproof switch. The box is waterproof (IP 54) and flanged.
Applsci 11 06003 g002
Figure 3. (a) The data logger interior consists of an Adafruit 32u4 proto, an Adafruit featherwing logger, an ADS1115 ADC with a gain amplifier and an LM4040 Voltage reference breakout. (b) The case of the system is an IP 54 flanged box. (c) The MC65 precise medical sensors. (d) The JS8746A environment temperature probe with its enclosure.
Applsci 11 06003 g003
Figure 4. (a) The proposed device set during the field experiment. (b) The proposed device set in the Elvem CLP 600 chamber during the laboratory experiment.
Applsci 11 06003 g004
Figure 5. (a) Scatterplot of measurement pairs including the identity line. (b) Bland–-Altman LOA plot. The blue dashed lines are the limits of agreement, and the solid blue line is the regression line.
Applsci 11 06003 g005
Figure 6. (a) The Bias Plot. The bias is displayed as the red line and reveals the bias throughout the range of measurements. For the value of 30 °C the bias is approximately −0.2. The black horizontal line is the zero reference, the blue and black line is regression of the Surface and Core temperature readings, respectively. (b) Precision plot showing the precision of each measurement method. The blue dots correspond to the precision of the surface readings along the temperature and the black dots to the precision of the core.
Applsci 11 06003 g006
Table 1. The means and standard deviations of the reference temperatures measured by the external temperature sensor per fixed condition.
2 °C5 °C15 °C20 °C25 °C27 °C34 °C43 °C
Mean3.6635.89715.43918.826.94833.93131.41443.289
Standard Deviation1.880.9540.0490.2370.3760.5540.5541.156
Table 2. Differential and Proportional bias for the measurement at the surface relative to the measurement at the core of the fruit and associated 95% confidence intervals.
BiasEstimate2.5%97.5%
Differential0.3310.2990.363
Proportional0.9820.9810.983
Publisher’s Note: MDPI stays neutral with regard to jurisdictional claims in published maps and institutional affiliations.

