
The Bimodal Neutron and X-ray Imaging Driven by a Single Electron Linear Accelerator


1
Department of Engineering Physics, Tsinghua University, Beijing 100084, China
2
Key Laboratory of Particle & Radiation Imaging, Tsinghua University, Ministry of Education, Beijing 100084, China
*
Author to whom correspondence should be addressed.
Appl. Sci. 2021, 11(13), 6050; https://0-doi-org.brum.beds.ac.uk/10.3390/app11136050
Submission received: 28 May 2021
/
Revised: 25 June 2021
/
Accepted: 26 June 2021
/
Published: 29 June 2021
(This article belongs to the Special Issue Advances in Neutron Imaging)
Abstract
:Both X-ray imaging and neutron imaging are essential methods in non-destructive testing. In this work, a bimodal imaging method combining neutron and X-ray imaging is introduced. The experiment is based on a small electron accelerator-based photoneutron source that can simultaneously generate the following two kinds of radiations: X-ray and neutron. This identification method utilizes the attenuation difference of the two rays’ incidence on the same material to determine the material’s properties based on dual-imaging fusion. It can enhance the identification of the materials from single ray imaging and has the potential for widespread use in on-site, non-destructive testing where metallic materials and non-metallic materials are mixed.
1. Introduction
Both X-ray imaging and neutron imaging have proven capabilities in non-destructive assays (NDAs) [1]. Unlike the cross sections of photons sensitive to the atomic number, neutrons are sensitive to nuclides but not elements. In the imaging process, whether for photons or neutrons, the attenuation is determined by the product of (1) the inspected object’s mass thickness (g/cm2) and (2) its mass attenuation coefficient (cm2/g). In most cases, the inspected object’s mass thickness is unknown and material identification cannot be accomplished merely by the photon or the neutron attenuation information. In this context, some researchers began investigating fusing X-ray imaging and neutron imaging technologies to enhance the capability for identifying materials [2]. Combining the two imaging technologies can be beneficial in the study of renewable energies [3], biology [4], paleontology [5], porous media [6], and cultural heritage [7]. This bimodal imaging approach was first implemented by E.H. Lehmann in 2006 by two separate facilities for X-ray and neutron radiography [8,9,10,11]. Analogous facilities were later constructed by many institutes such as NIST and ILL [12,13]. All the studies are conducted on large neutron sources (reactor or spallation neutron sources) with the addition of a 100~200 kV X-ray tube. However, material identification based on the fusion of neutron and X-ray imaging technology can hardly be applied in situ for the following two reasons: (1) due to the high cost, the construction of a large neutron source for industrial applications is less probable; and (2) the neutron and X-ray imaging cannot share the same imaging beam geometry. The different imaging beam geometries introduce a difficulty to form a bivariate histogram for the pixel-wise comparison between the images from two modalities [9]. Usually, the computerized tomography for both neutrons and photons is necessary to align the two images via linear translation, rotation, scaling, or skew.
Using two different imaging systems within a state-of-the-art bimodal imaging system also requires oversight to avoid interference. For example, the neutron detector perhaps shadows the photons before they penetrate the object being inspected [9]. Although this problem could be partially resolved by increasing the distance between the detector and the sample, the deterioration of imaging sharpness caused by penumbra blurring for photons and neutrons must be considered. Thus, using a one-source-one-detector system, instead of a two-source-two-detector system, would reduce such inaccuracies and simplify data processing.
Besides the research reactor and the spallation neutron sources, a variety of low energy accelerators, in which the charged particles are accelerated to decades of MeV, are used to deliver neutrons. The accelerated charged particles could be hadrons, such as the proton, deuteron, or other heavier nuclei, or the lepton, mainly the electron. As the hadrons are usually not the so-called MIPs (minimum ionizing particles), whose kinetic energies are about three times of their rest masses, they transfer most of their kinetic energies to the target atom’s orbital electrons but not the target nuclei, and the short range in the target limits their neutron yield (n/hadron) within the range of 1/1000 to 1/100, far smaller than the typical neutron yield (20 n/GeV proton) of the spallation neutron source [14]. When the e-LINAC (electron linear accelerator), which accelerates the electrons, is used to produce neutrons, energetic bremsstrahlung photons are first generated and then the photoneutron reaction will be involved to liberate neutrons from the target nuclei. Due to the competing of the photoatomic reactions, the photoneutron reaction is not the dominating reaction when energetic photons interact with matter. The microscopic cross section of the total photoatomic reactions is 100 to 1000 times higher than that of the photonuclear reactions; then, given that a photon-to-neutron convertor with sufficient thickness (the scale of mean free path of photons in the convertor) is used, the neutron yield (n/e- or n/γ) for a photoneutron source will also be within the range of 1/1000 to 1/100, almost the same as the low energy hadrons-based neutron sources. Despite the same neutron yield, the e-LINAC driven photoneutron sources might be a more attractive neutron source for the bimodal imaging application, in which the flux of photons should be several orders of magnitude higher than that of neutrons, because the X-rays present in the bimodal imaging have the typical energy of hundreds of keV, and for the detector, the relating microscopic cross sections of photoatomic reactions cannot be as high as that for thermal neutrons with some special nuclides (3He, 6Li, 10B, 113Cd, or 155,157Gd). The mechanism of the photoneutron production guarantees the X-rays’ flux is at least two orders of magnitude higher than the photoneutrons’ flux. Another benefit provided by the e-LINAC driven photoneutron source is that, benefiting from the high penetrating capability of energetic electrons, the photon-to-neutron convertor can be placed outside the e-LINAC and bombarded by the electrons penetrating a thin foil window (for example, 50 μm Ti) of the e-LINAC, leading to a flexible neutron convertor/moderator design and a more effective heat dissipation of the power deposited by bombarding electrons, which is a key technical problem to improve the intensity of neutrons by increasing the power of the charged particles bombarding the target.
In this article, we propose a technology that realizes both neutron imaging and photon imaging within one single e-LINAC driven system. The experimental results demonstrate that both the photon image and the neutron image can be acquired successively with a short time delay, ranging from 50 μs to 10 ms, and be almost free from the different imaging beam geometries at the current spatial resolution. The pixel-wise matching of the two images can be efficiently conducted to form the inspected object’s bivariate histogram to identify different materials of various mass thicknesses. In the case that the inspected sample is evolving with time or stochastic processes, the traditional two-source-two-detector system may inevitably introduce an error in fusing the two images, because each imaging mode may take several hours or even longer and the inspected sample is perhaps not identical for the two imaging modes. In this study, the time delay between the two imaging modes can be as small as 10 ms (when the e-LINAC works at the repetition rate of 100 Hz), which ensures that the inspected sample is identical for the two imaging modes. Consequently, being suitable to inspect a sample evolving with time repetitively would be an intrinsic advantage with the one-source-one-detector system presented in this study.
2. Materials and Methods
2.1. System Overview
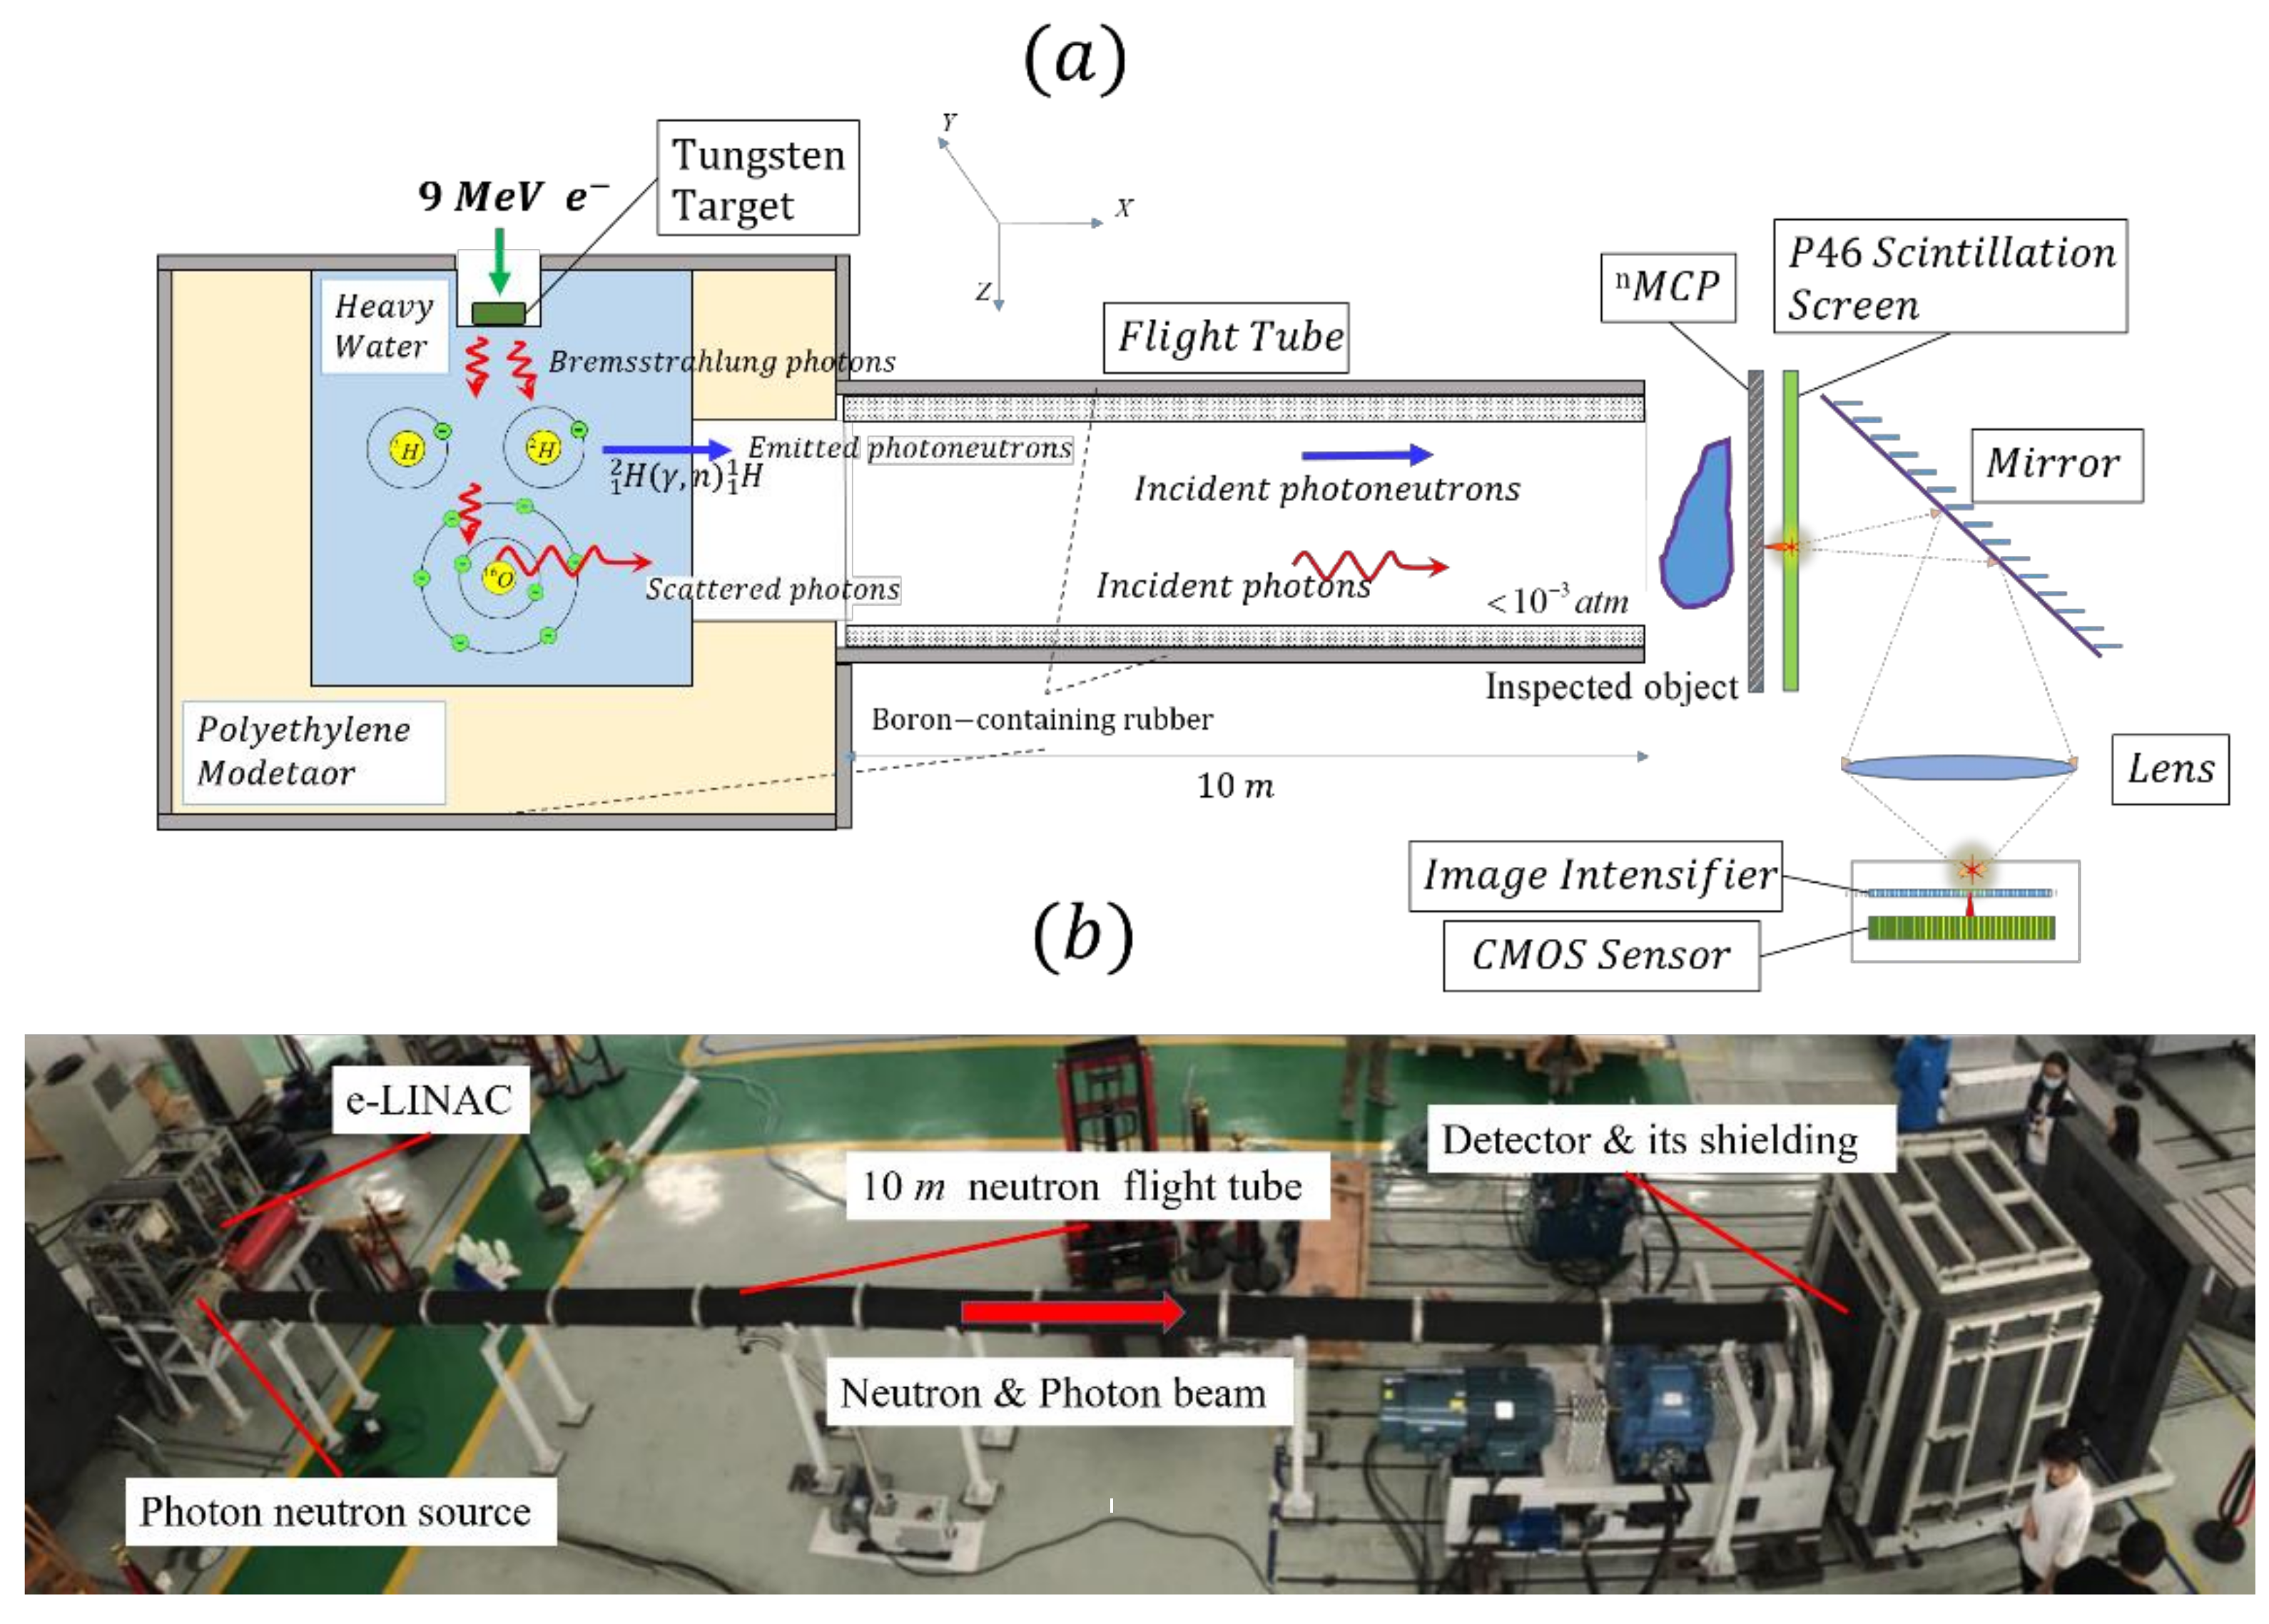
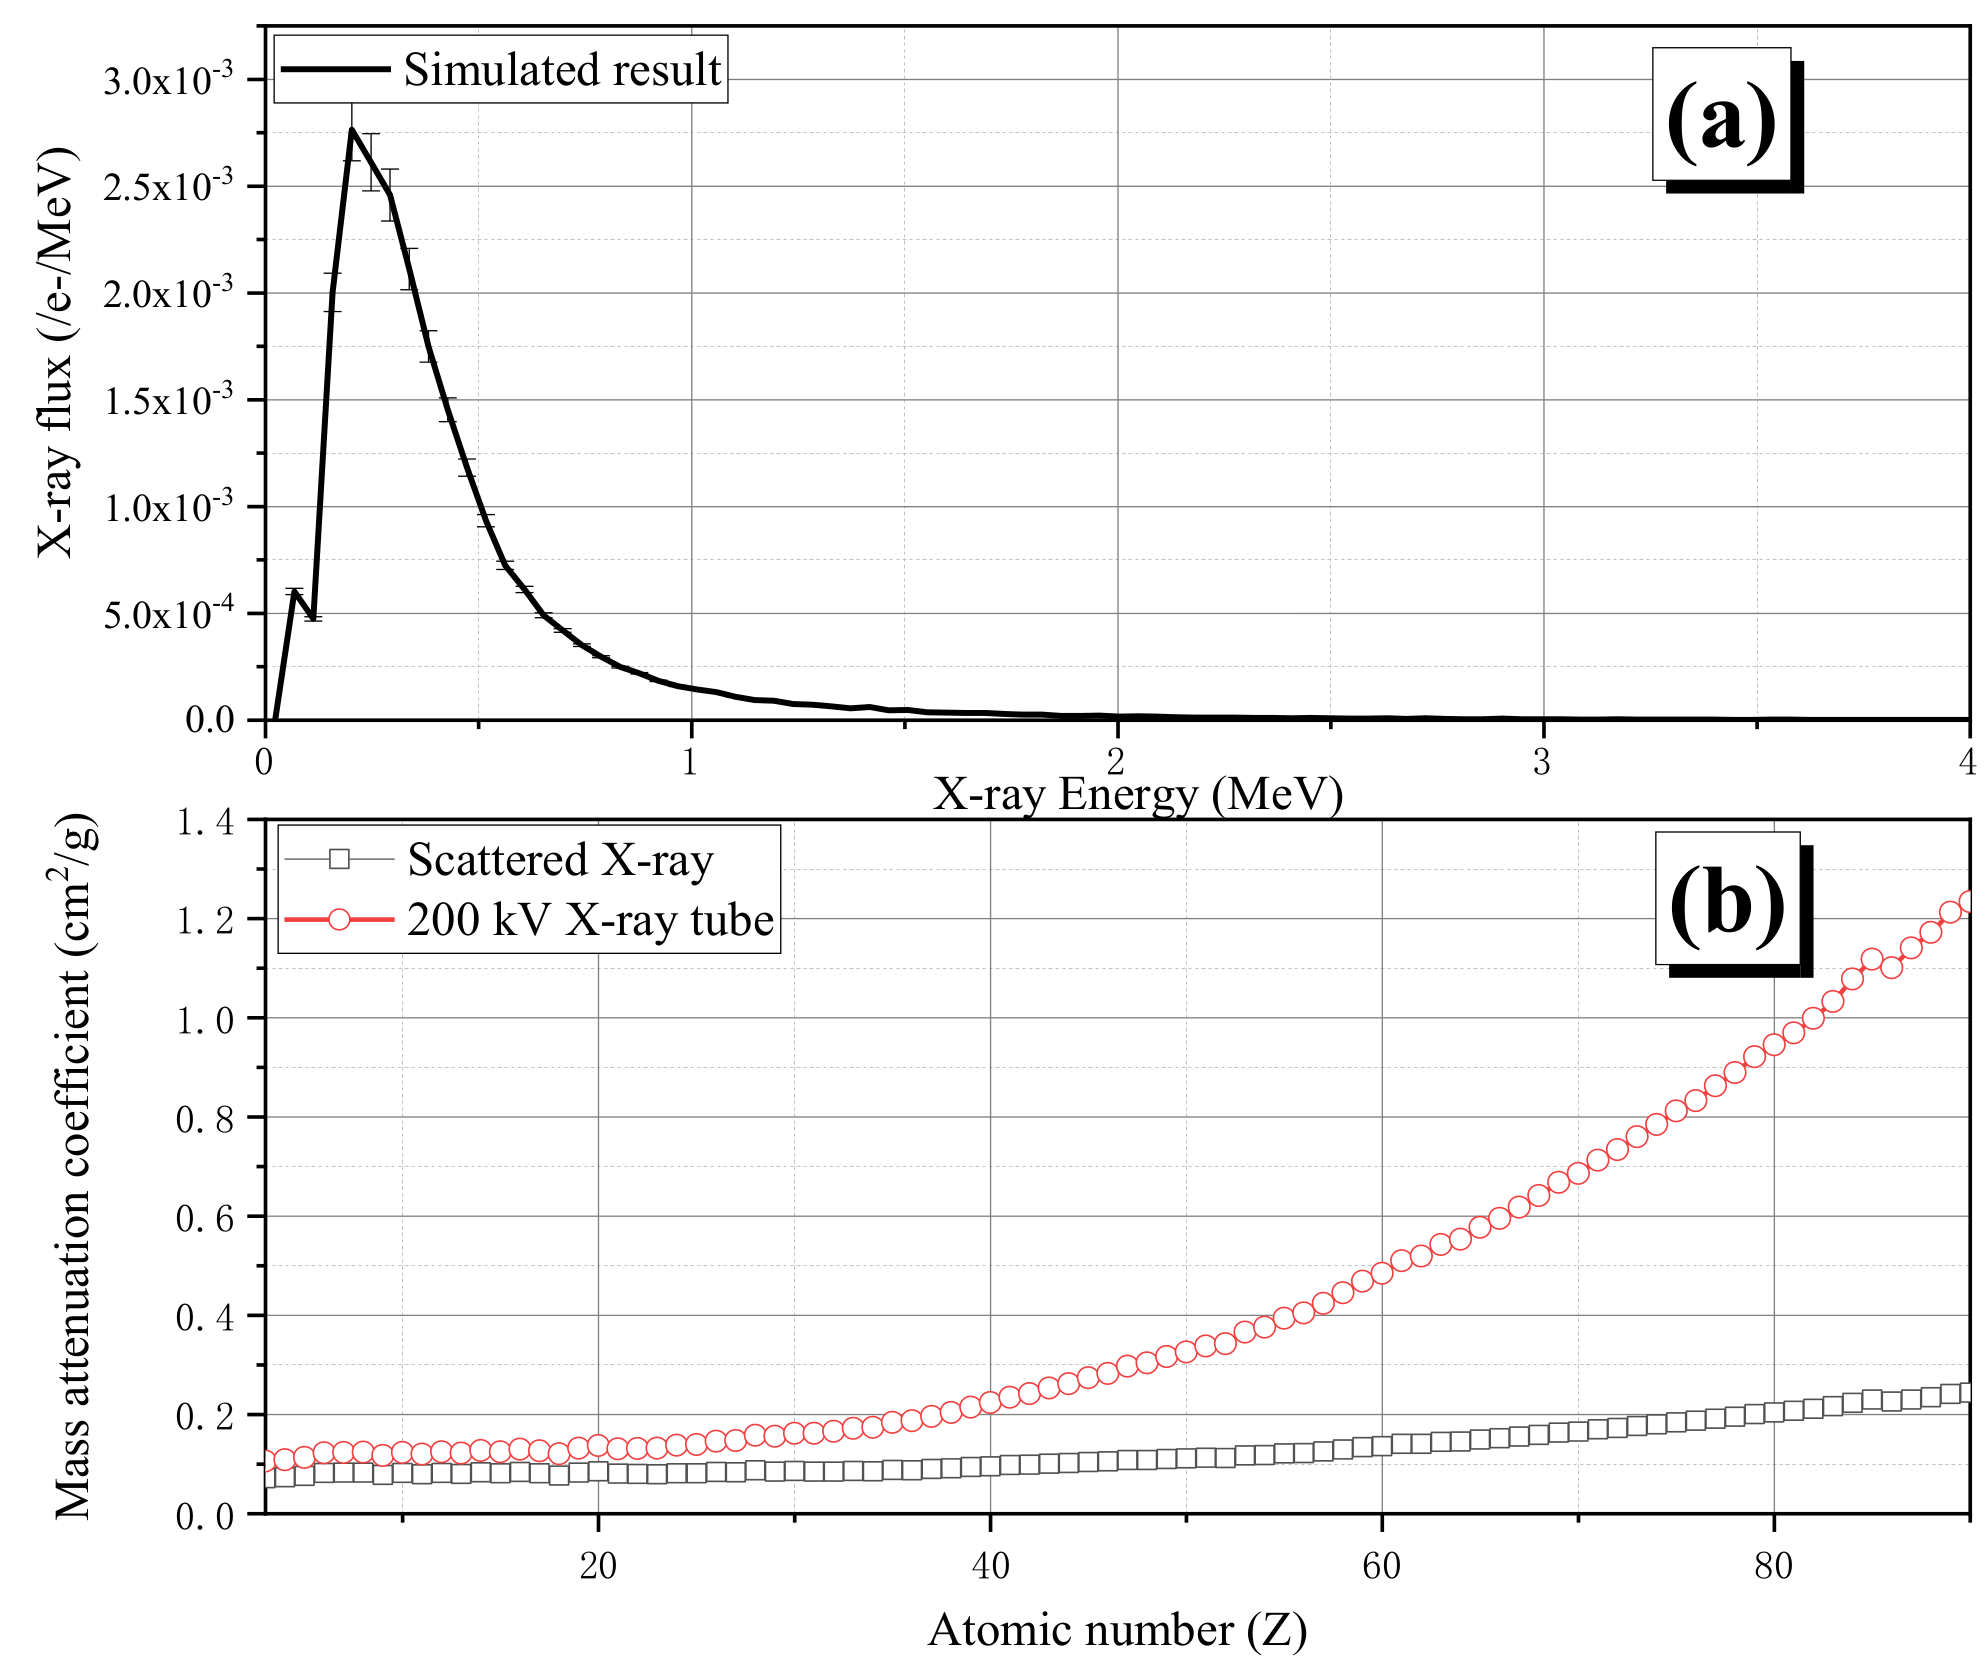
In Figure 1, we illustrate the principle to produce neutrons and photons used for the bimodal imaging driven by a single e-LINAC system (Appendix A.1). The 9 MeV electrons are very energetic, and hence the bremsstrahlung photons generated on the tungsten target are forward emitted. A heavy water convertor (Appendix A.2) is placed ahead of the tungsten target to generate both the imaging neutrons and photons. Heavy water is chosen as the material to convert bremsstrahlung photons to neutrons due to (1) the low (γ,n) threshold of 2H (Eth = 2.223 MeV) and (2) the superb neutron moderation capability of 2H and 16O. The neutron moderation (Appendix A.3) capability is critical in this study because the fast photoneutrons produced by the 2H(γ,n)1H reaction, in general, should be decelerated to slow neutrons to improve the imaging sensitivity. The orbital electrons of the 16O atoms and those of the 2H atoms can induce the scattering of bremsstrahlung photons. When the emitting angle of scattered photons is chosen as 90°, the energy of incident photons interrogating the inspected object will typically be less than 511 keV (due to the Compton scattering), as shown in Figure 2a. Photons with such an energy spectrum mainly interact with atoms via Compton scattering, which shows an almost constant mass attenuation coefficient for different elements [15], and hence are helpful to analyze the mass thickness of the inspected object compared with X-ray tube measurements, as shown in Figure 2b.
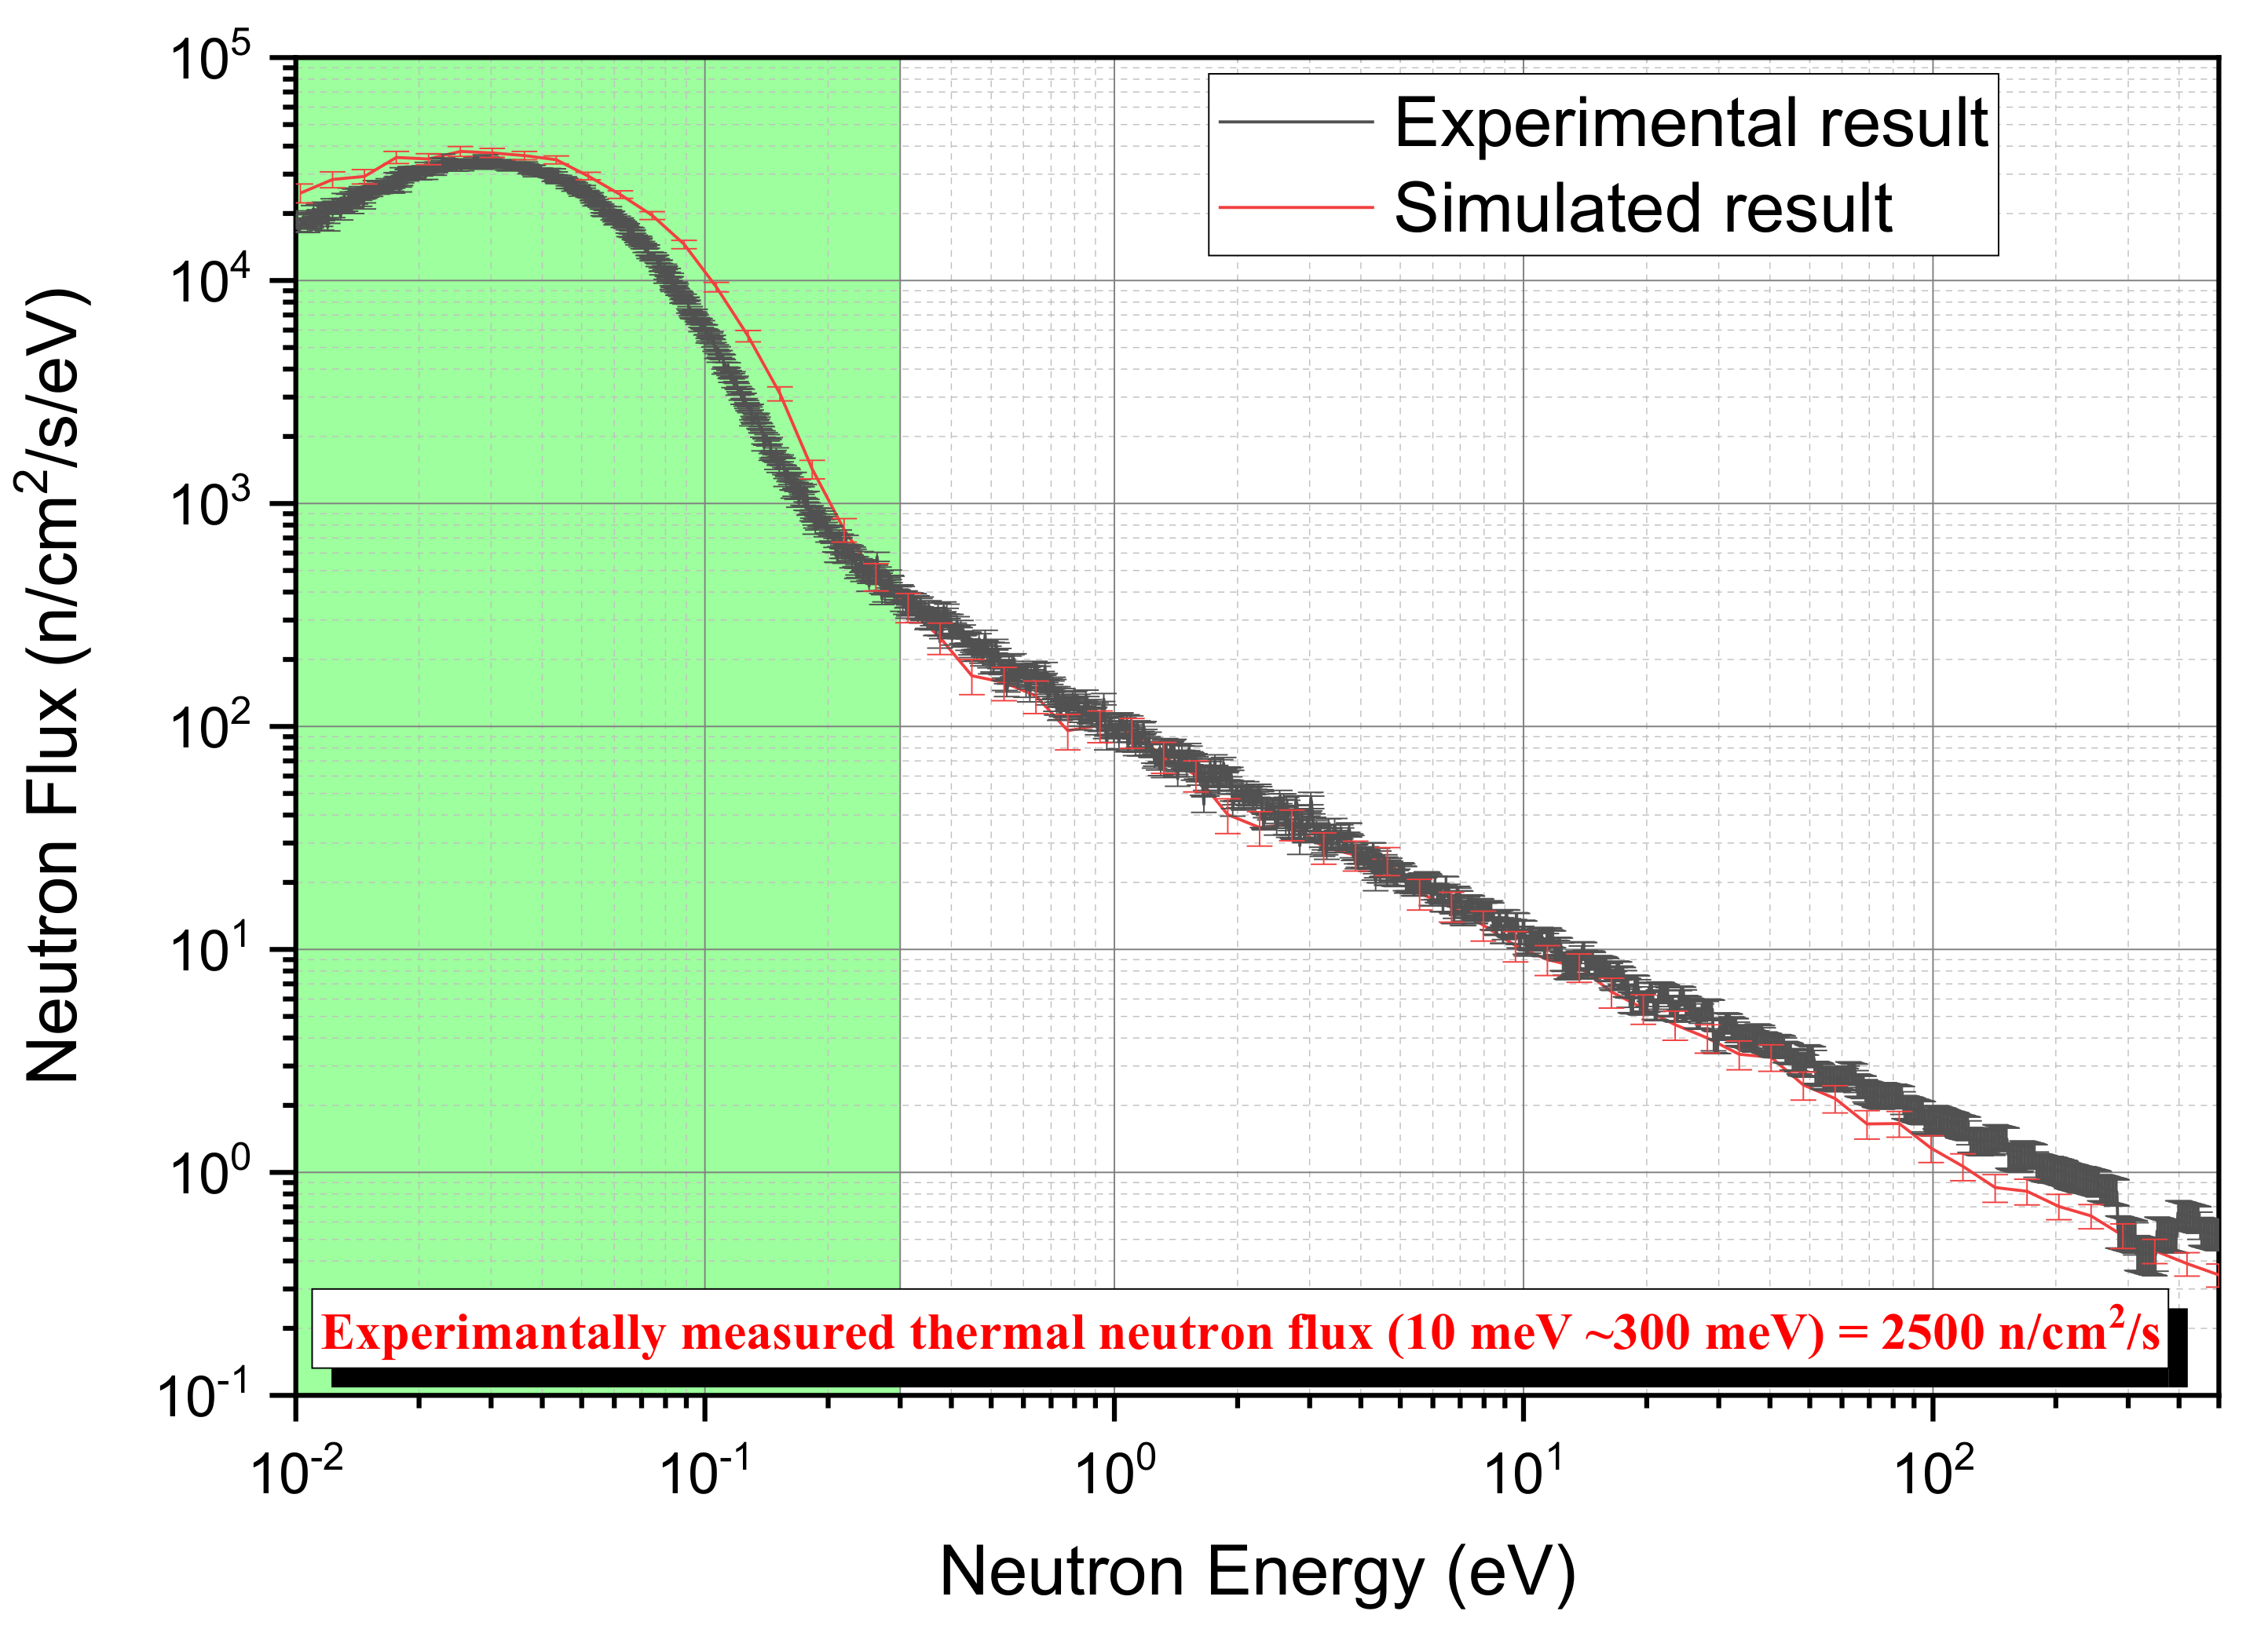
The neutron emission direction should be the same as the photons to conform to the photon imaging geometry. In fact, the energy spectrum of emitted neutrons is not sensitive to the emission direction due to the almost isotropic moderation process of neutrons within the heavy water converter. In Figure 3, we present the neutron energy spectrum measured with the time of flight (TOF) method by a 4-atm 3He counter placed 10 m away from the heavy water converter at an angle of 90°. The simulated neutron energy spectrum is also shown, and the two spectra match fairly well. The experimental results show that when the 9 MeV e-LINAC works at a 100 μA current, a 2500 neutron/cm2/s thermal neutron flux 10 m away can be acquired for the neutron imaging. Its counterpart for photons is 108 photon/cm2/s.
2.2. Imaging Sequence
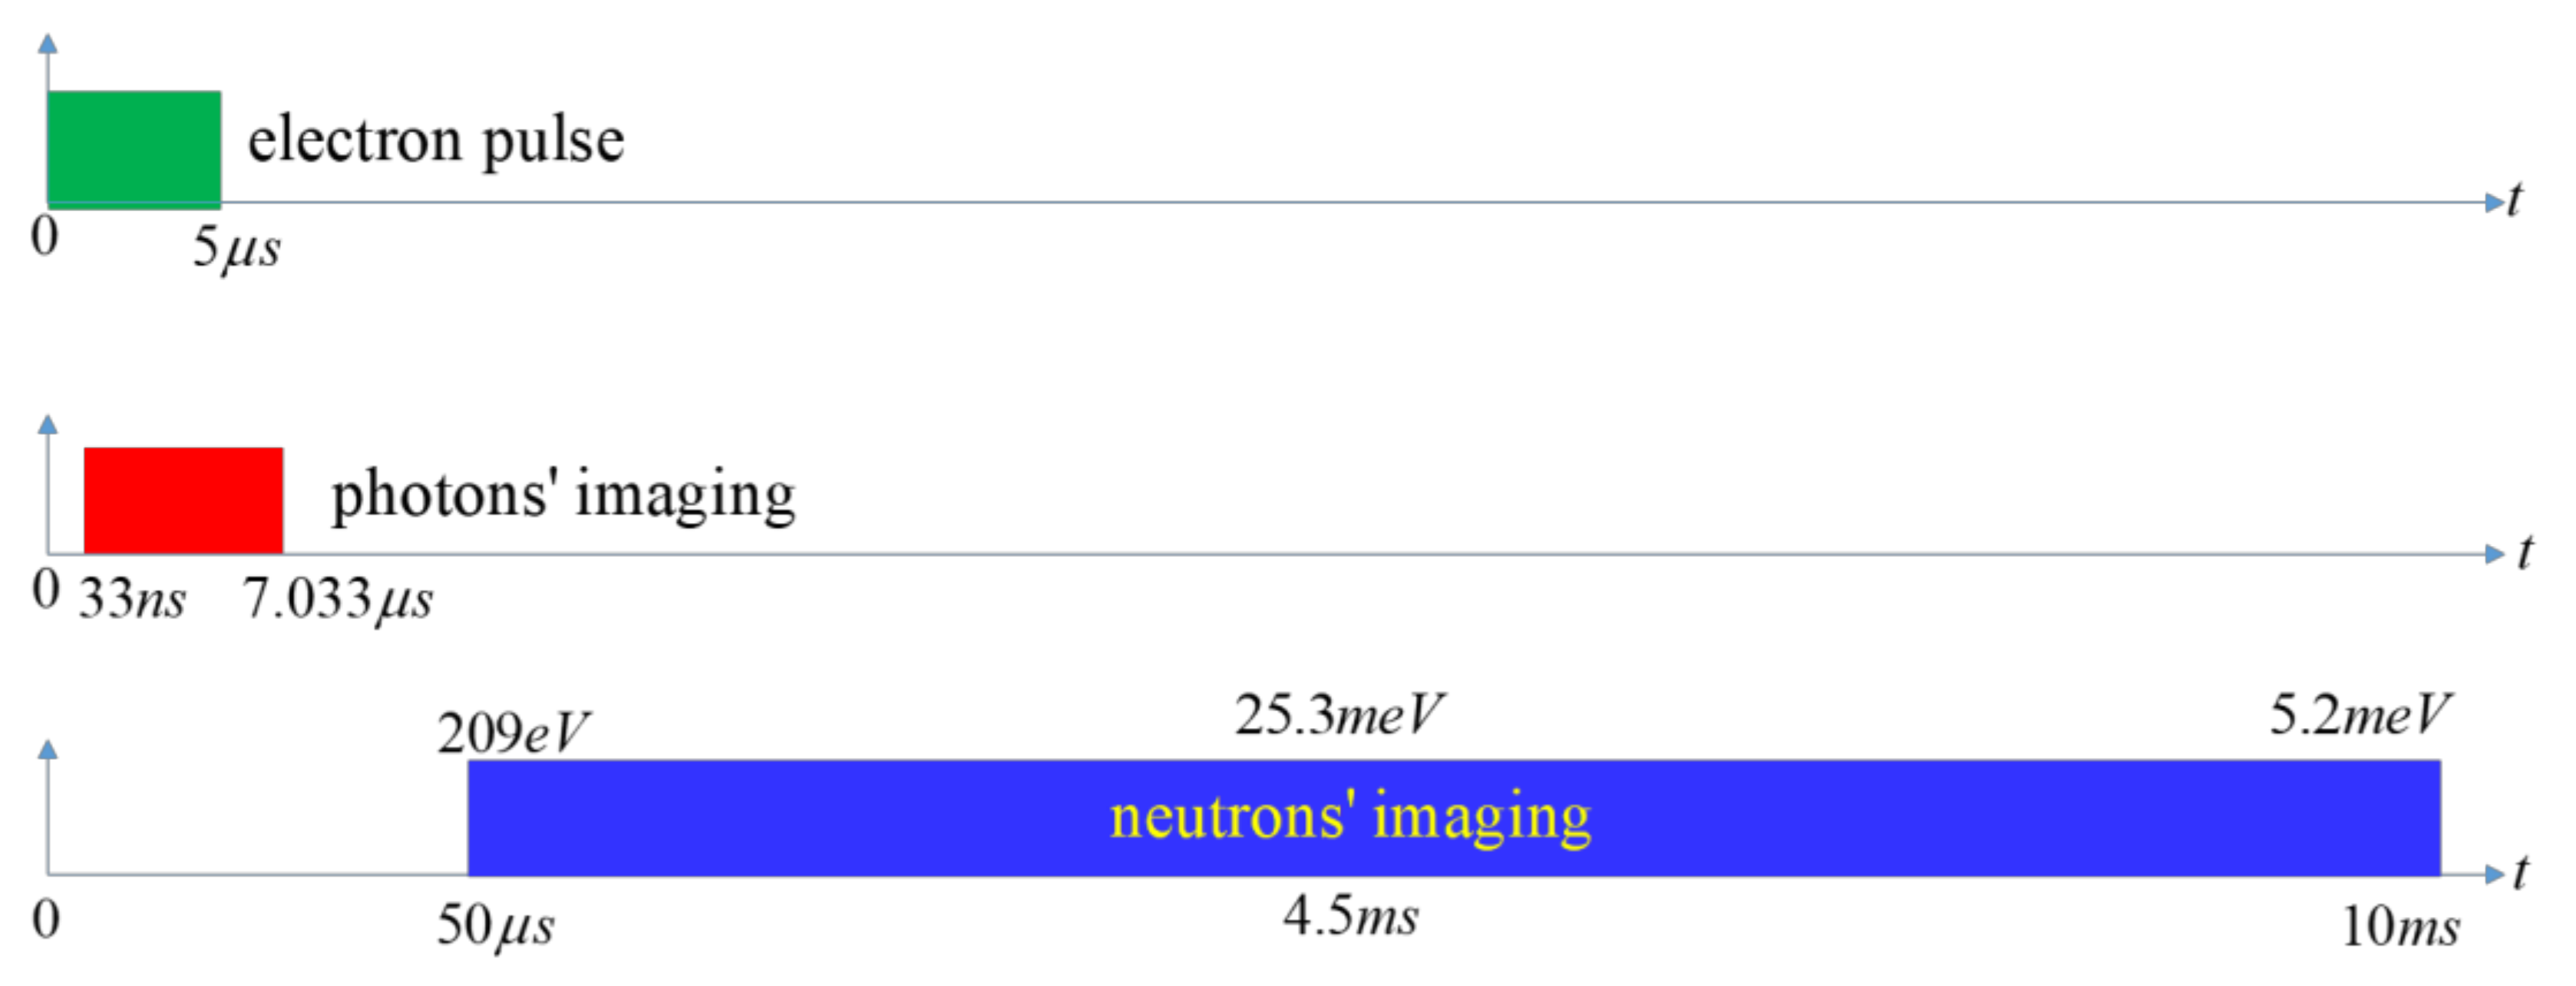
Although imaging photons and neutrons produced by the bremsstrahlung photons share the same imaging geometry, their imaging processes’ interference should be considered. As e-LINAC works at a pulse mode of 5 μs duration and a 100 Hz repetition rate, the photon flight time from the heavy water converter to the detector is merely 5.033 μs, in which the 5 μs is the pulse width of photons and the 0.033 μs is the photon’s flight time across 10 m. Considering the decay time for the light emitted by the scintillation screen is 0.2 μs, in order to let the photons’ influence on the detection system die away, an additional time delay of 2 μs after the last photon bombarding the nMCP detector (Appendix A.5) should be set for the photon imaging and before triggering the acquisition of neutron imaging. Therefore, in principle, the duration of (7.033 μs, 10 ms) after each electron pulse can be assigned to neutrons for neutron imaging. In the experiments, we chose (50 μs, 9.95 ms) as the duration for neutron imaging to avoid the mutual interference between the two imaging processes. The thermal neutrons used for neutron imaging have a characteristic speed of 2200 m/s and require 4.5 ms for the 10-meter flight. Thus, both the photon imaging and neutron imaging can be perfectly accommodated by the (33 ns, 7.033 μs) and (50 μs, 9.95 ms) durations, respectively, as shown in Figure 4. Neutrons with energy smaller than 5.2 meV might be detected in the next period and cannot be temporally separated from the next X-ray pulse, their influence on the X-ray imaging can be neglected due to the number of cold neutrons, which are unintentionally delivered by the room-temperature moderator and measured within the 5-microsecond duration, is far smaller than that of the X-rays.
2.3. The Spatial Distribution of Imaging Neutrons and Imaging Photons
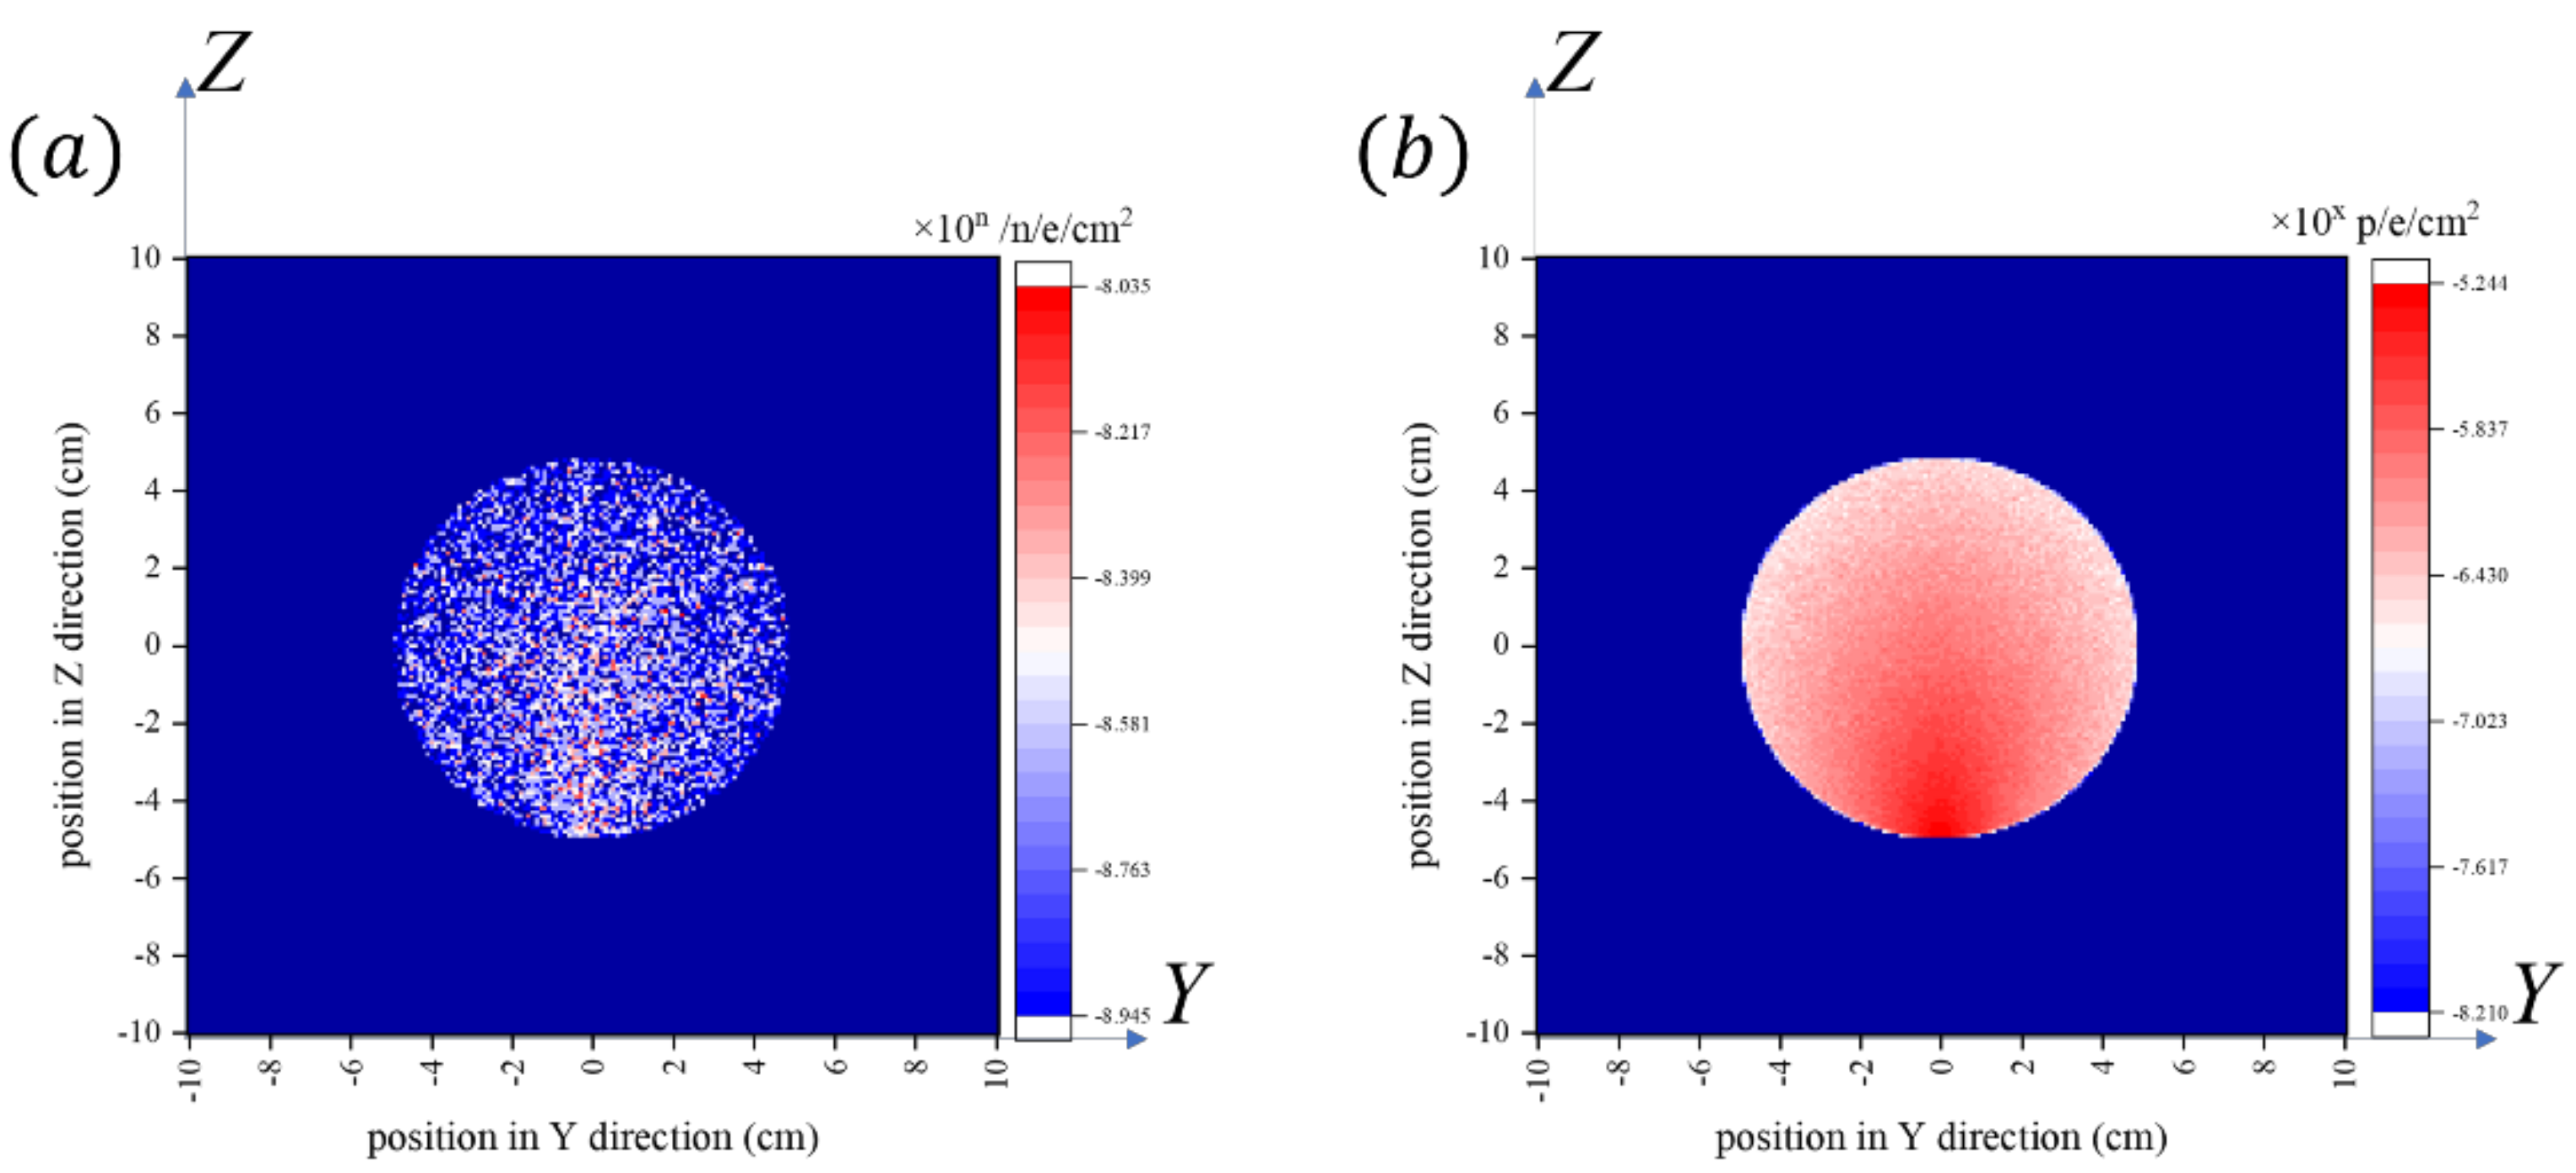
Analysis of the last collision positions of neutrons inside the heavy water converter indicates that the heavy water converter acts as a volumetric neutron source. As the detector system is typically placed 10 m from the heavy water converter, this volumetric neutron source will be reduced to a surface source with a disk shape, as shown in Figure 5a, with its counterpart for photons shown in Figure 5b. The centers of gravity for neutrons and photons are (Y = −0.29 cm, Z = −0.0061 cm) and (Y = −1.31 cm, Z = 0.0037 cm), respectively. The 1.02-centimeter distance between them is caused by the different scattering physics of neutrons and photons. The difference between the centers of gravity of neutrons and X-rays will lead to a mismatching error between the two images. This mismatching error could be very trivial as the distance from the inspected object to the detector is 2 cm, 1/500 of the distance from the moderator to the detector. This mismatching can be estimated as 20 μm by 1.02 cm/500. The full width at half maximum (FWHM) along the Y or Z directions for neutrons and photons is calculated as FHWMn = 5.5 cm, and FWHMp = 5.2 cm, which can introduce a penumbra blurring of 110 and 104 μm for neutron imaging and photon imaging, respectively.
3. Results
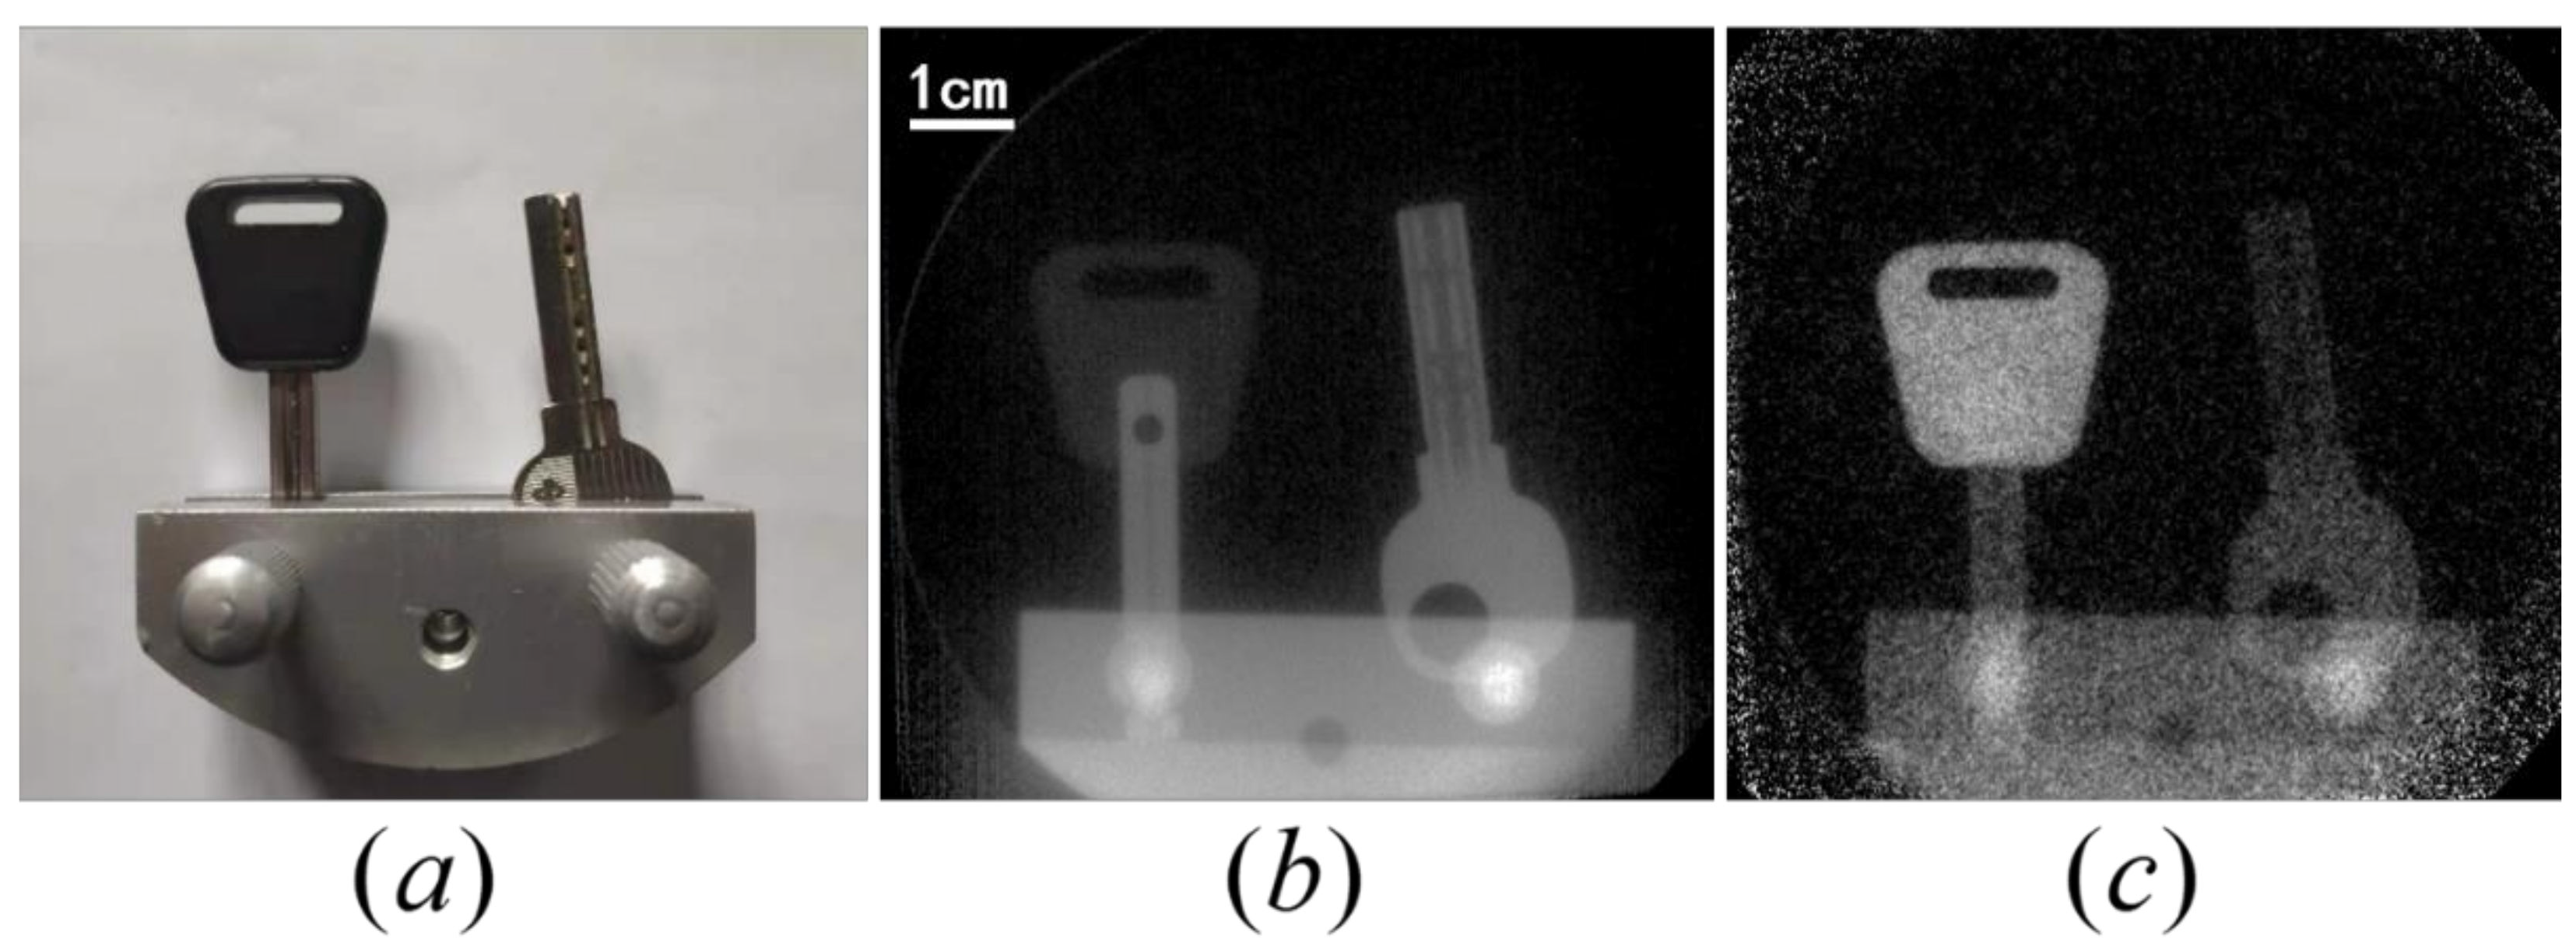
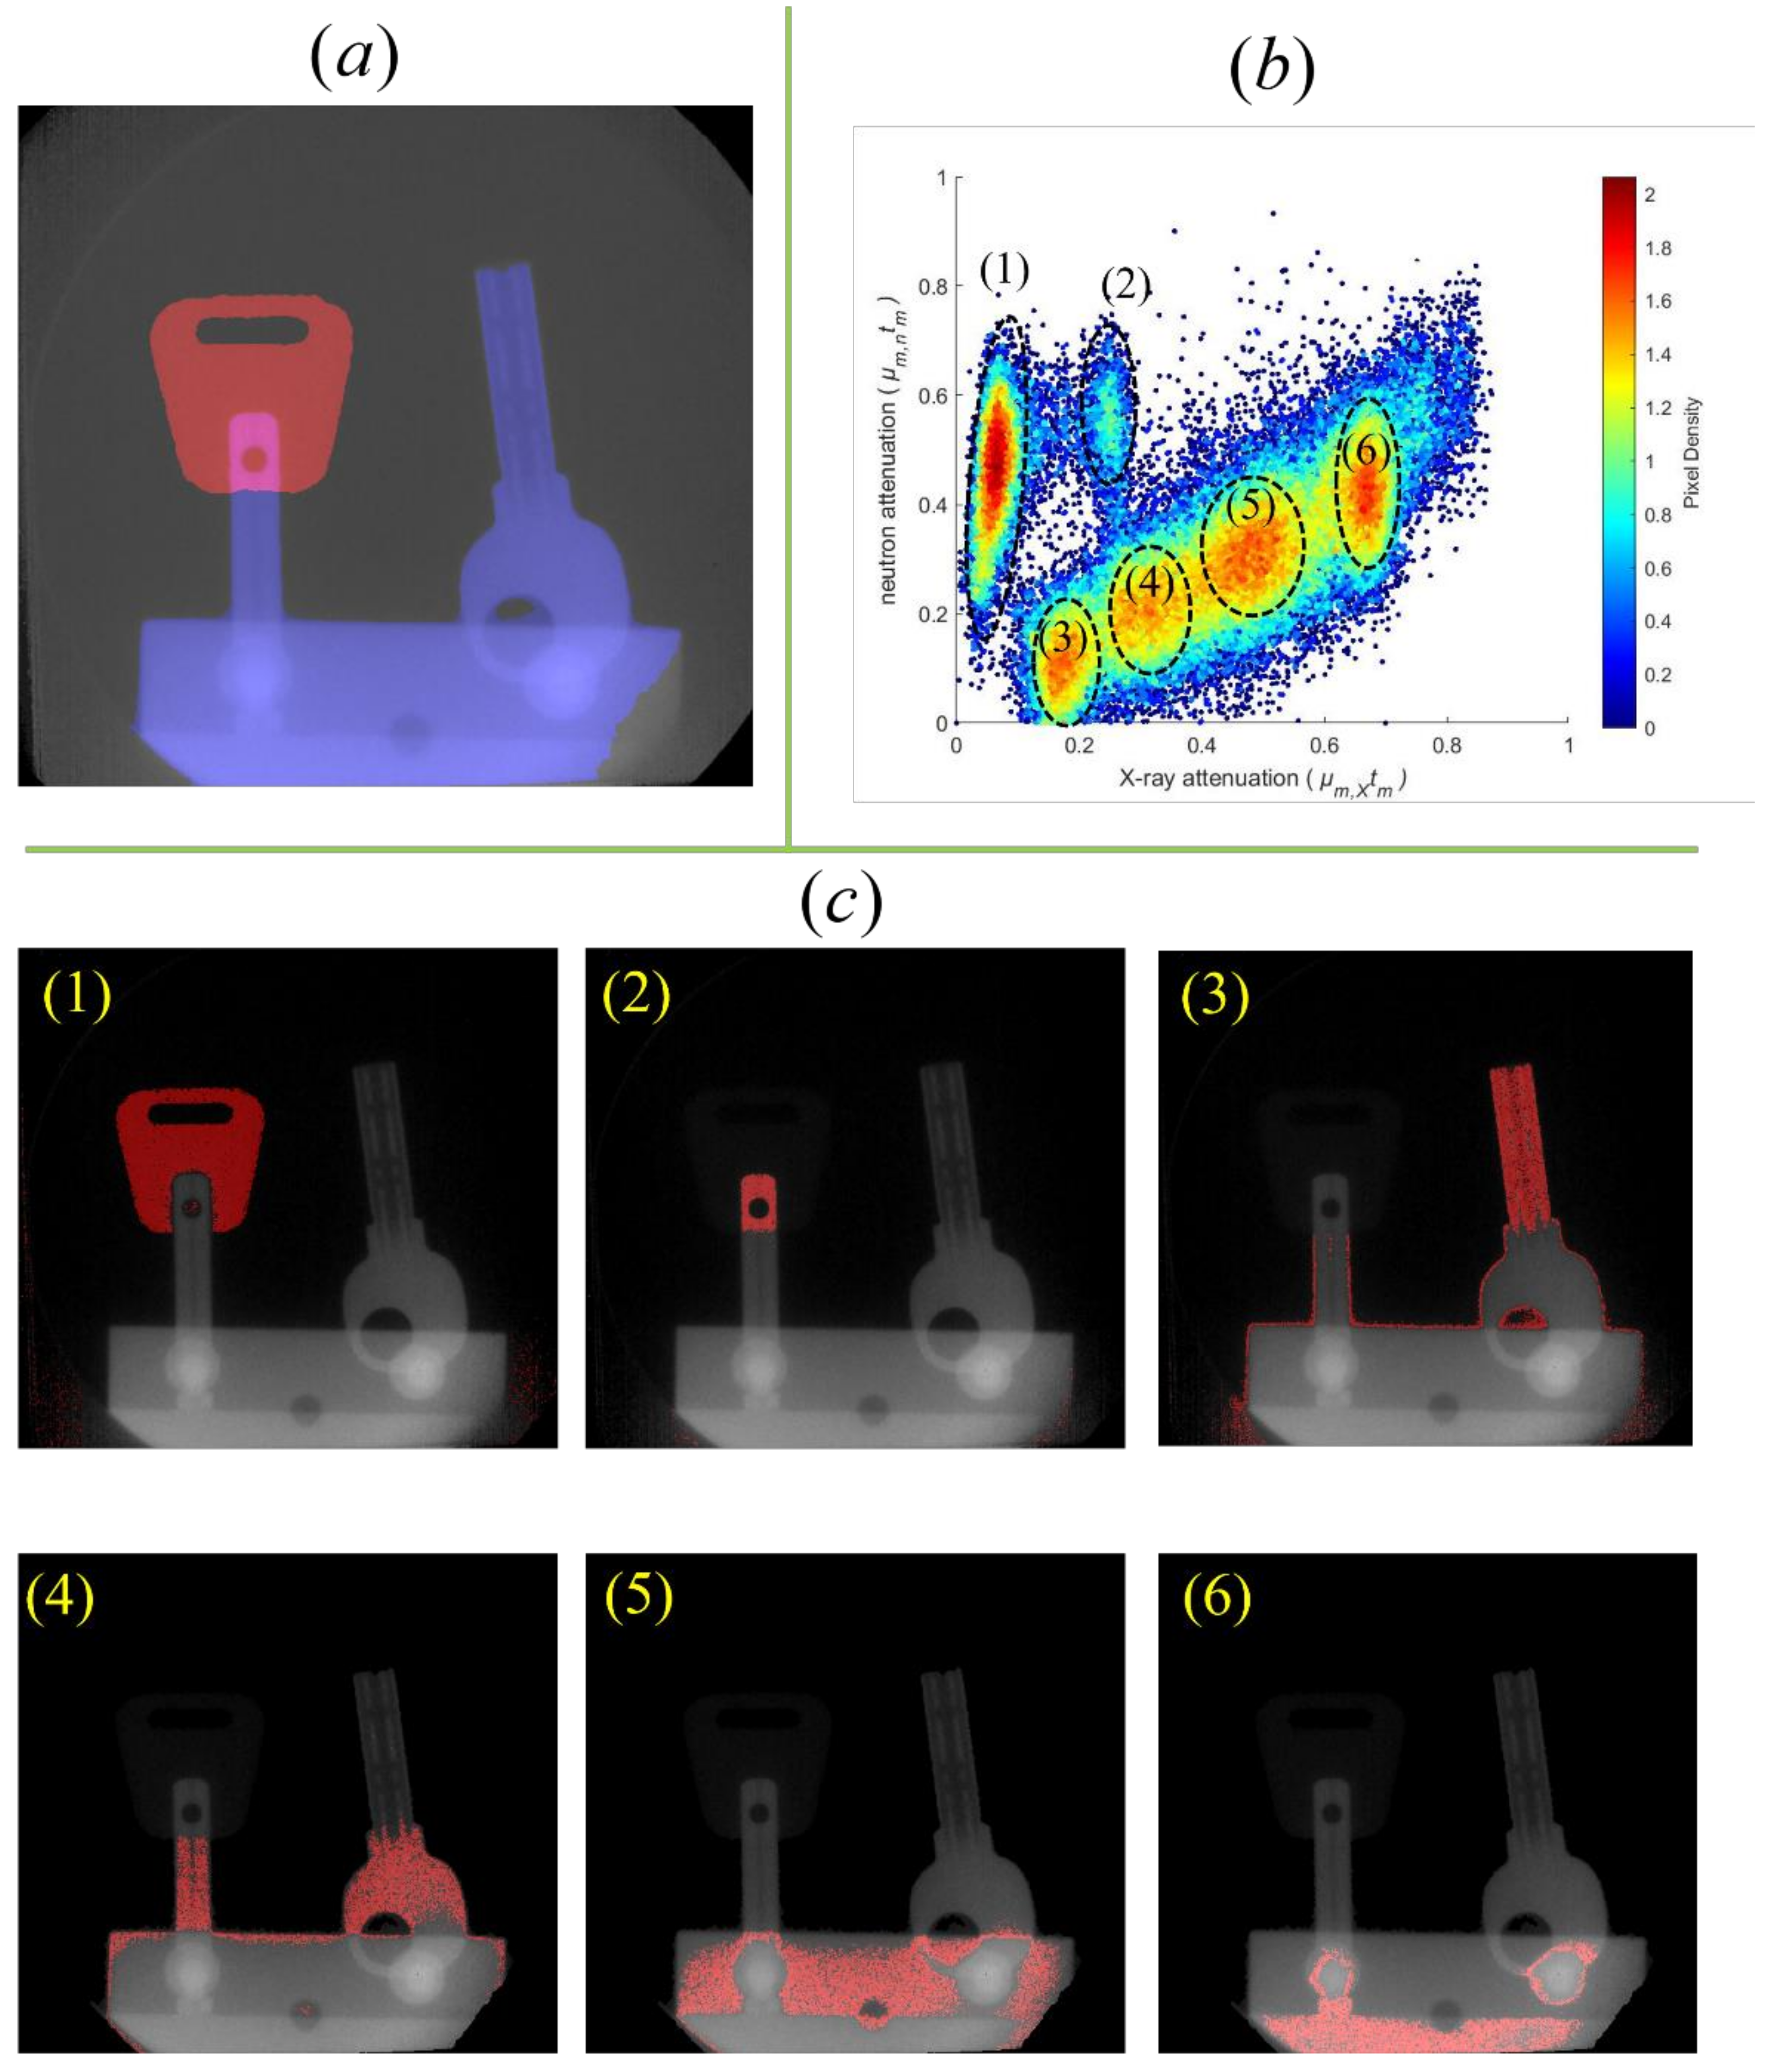
With the imaging sequence shown in Figure 4, the same inspected object’s neutron image and photon image can be acquired successively within a single e-LINAC operation. As shown in Figure 6a, two keys clamped by an aluminum holder are inspected. Figure 6b,c shows the photon image and neutron image, respectively. The difference between Figure 6b,c is apparent. The key’s plastic handle can hardly be noticed in Figure 6b, while it is evident in Figure 6c. On the contrary, the aluminum key is clear in Figure 6b, while almost transparent in Figure 6c. The underlying principle is that the cross section of 1H is large (80.2 [email protected] meV) for neutrons but very small for photons (0.406 barn@200 keV), while the opposite is true for 27Al (1.68 [email protected] meV for neutrons and 5.48 barns@200 keV for photons). Figure 7a shows the fused image from Figure 6b,c, in which the color indicates the type of the material, while the shade may reflect the mass thickness of the inspected object. There are 512 × 512 pixels of 200-micrometer size in the image. For each pixel, its neutron attenuation and photon attenuation will determine the coordinate of a point in Figure 7b. All the pixels in Figure 6b,c, thus, help form Figure 7b, in which we can see six clusters. Cluster (1) shows a large neutron attenuation and a small photon attenuation, and Figure 7c(1) indicates it is the plastic handle of the key. Cluster (2) shows both strong attenuation for neutrons and photons, and Figure 7c(2) indicates this zone has both plastic and aluminum. Clusters (3) to (6) have the same slope, which is the ratio of neutron attenuation to photon attenuation, implying that they are the same material. Their different distances to the origin reflect the various mass thicknesses of the aluminum material in the key. The results shown in Figure 7 indicate that bimodal imaging can be a very effective method to identify different materials with various mass thicknesses.
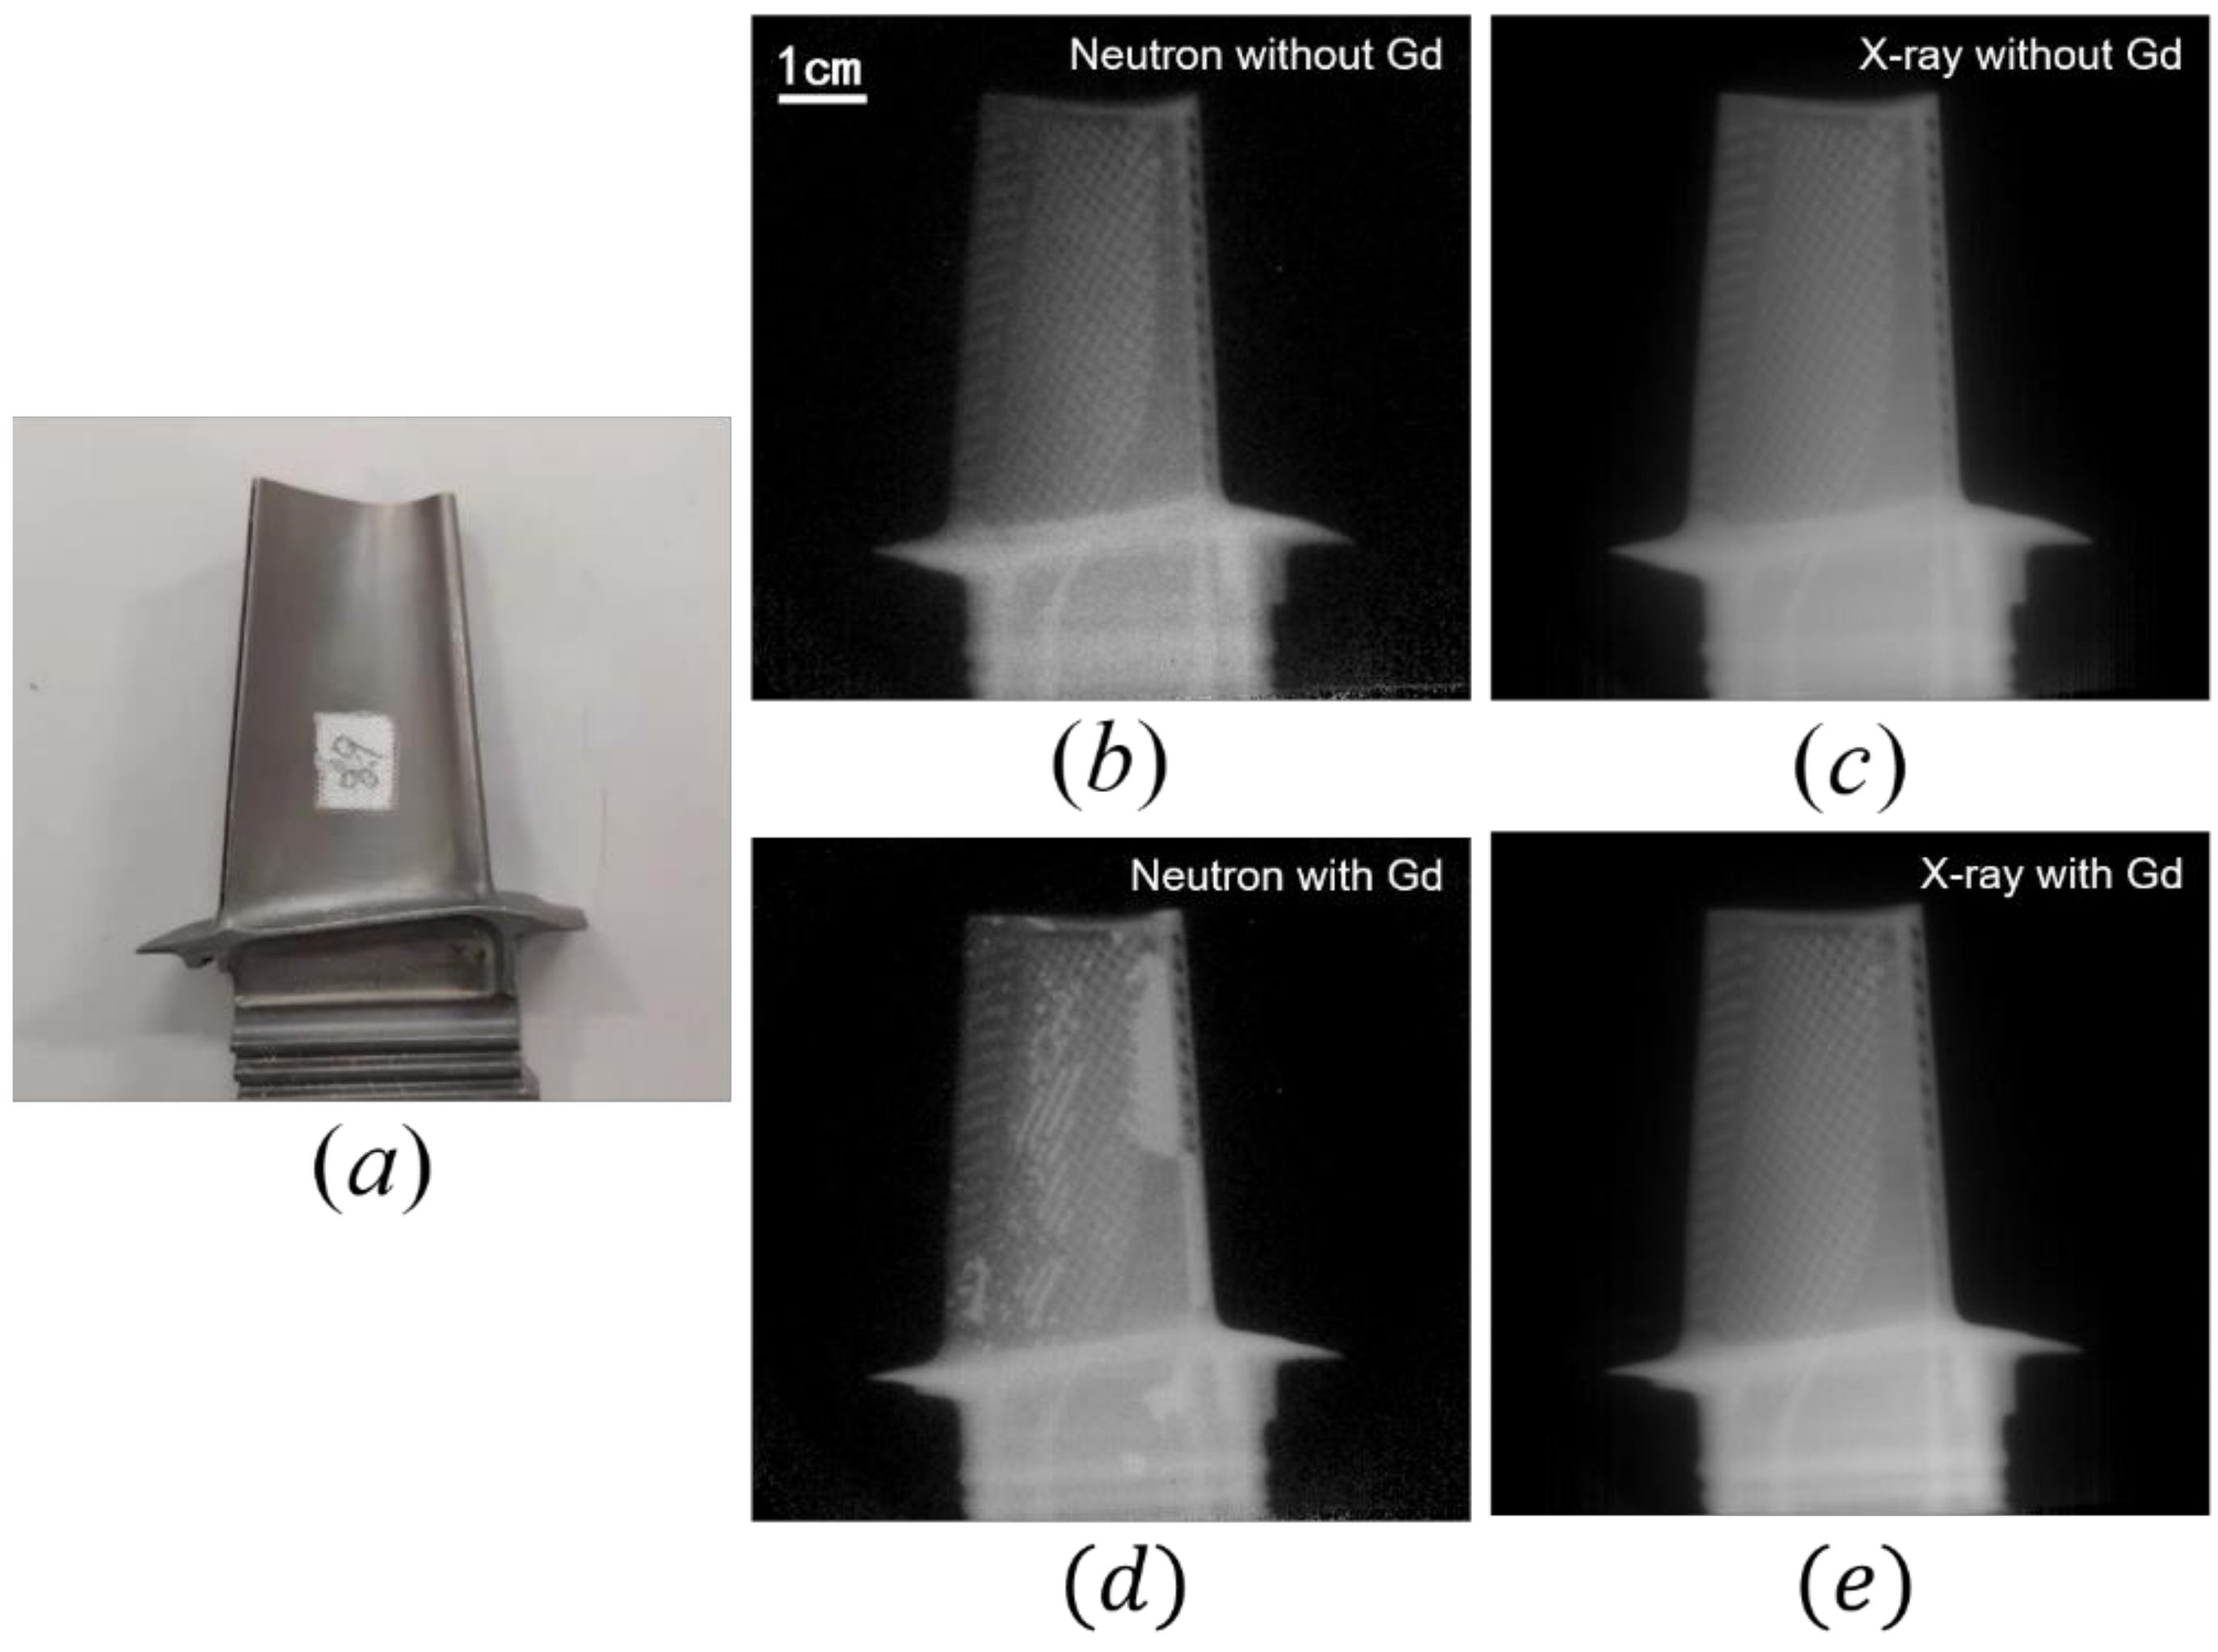
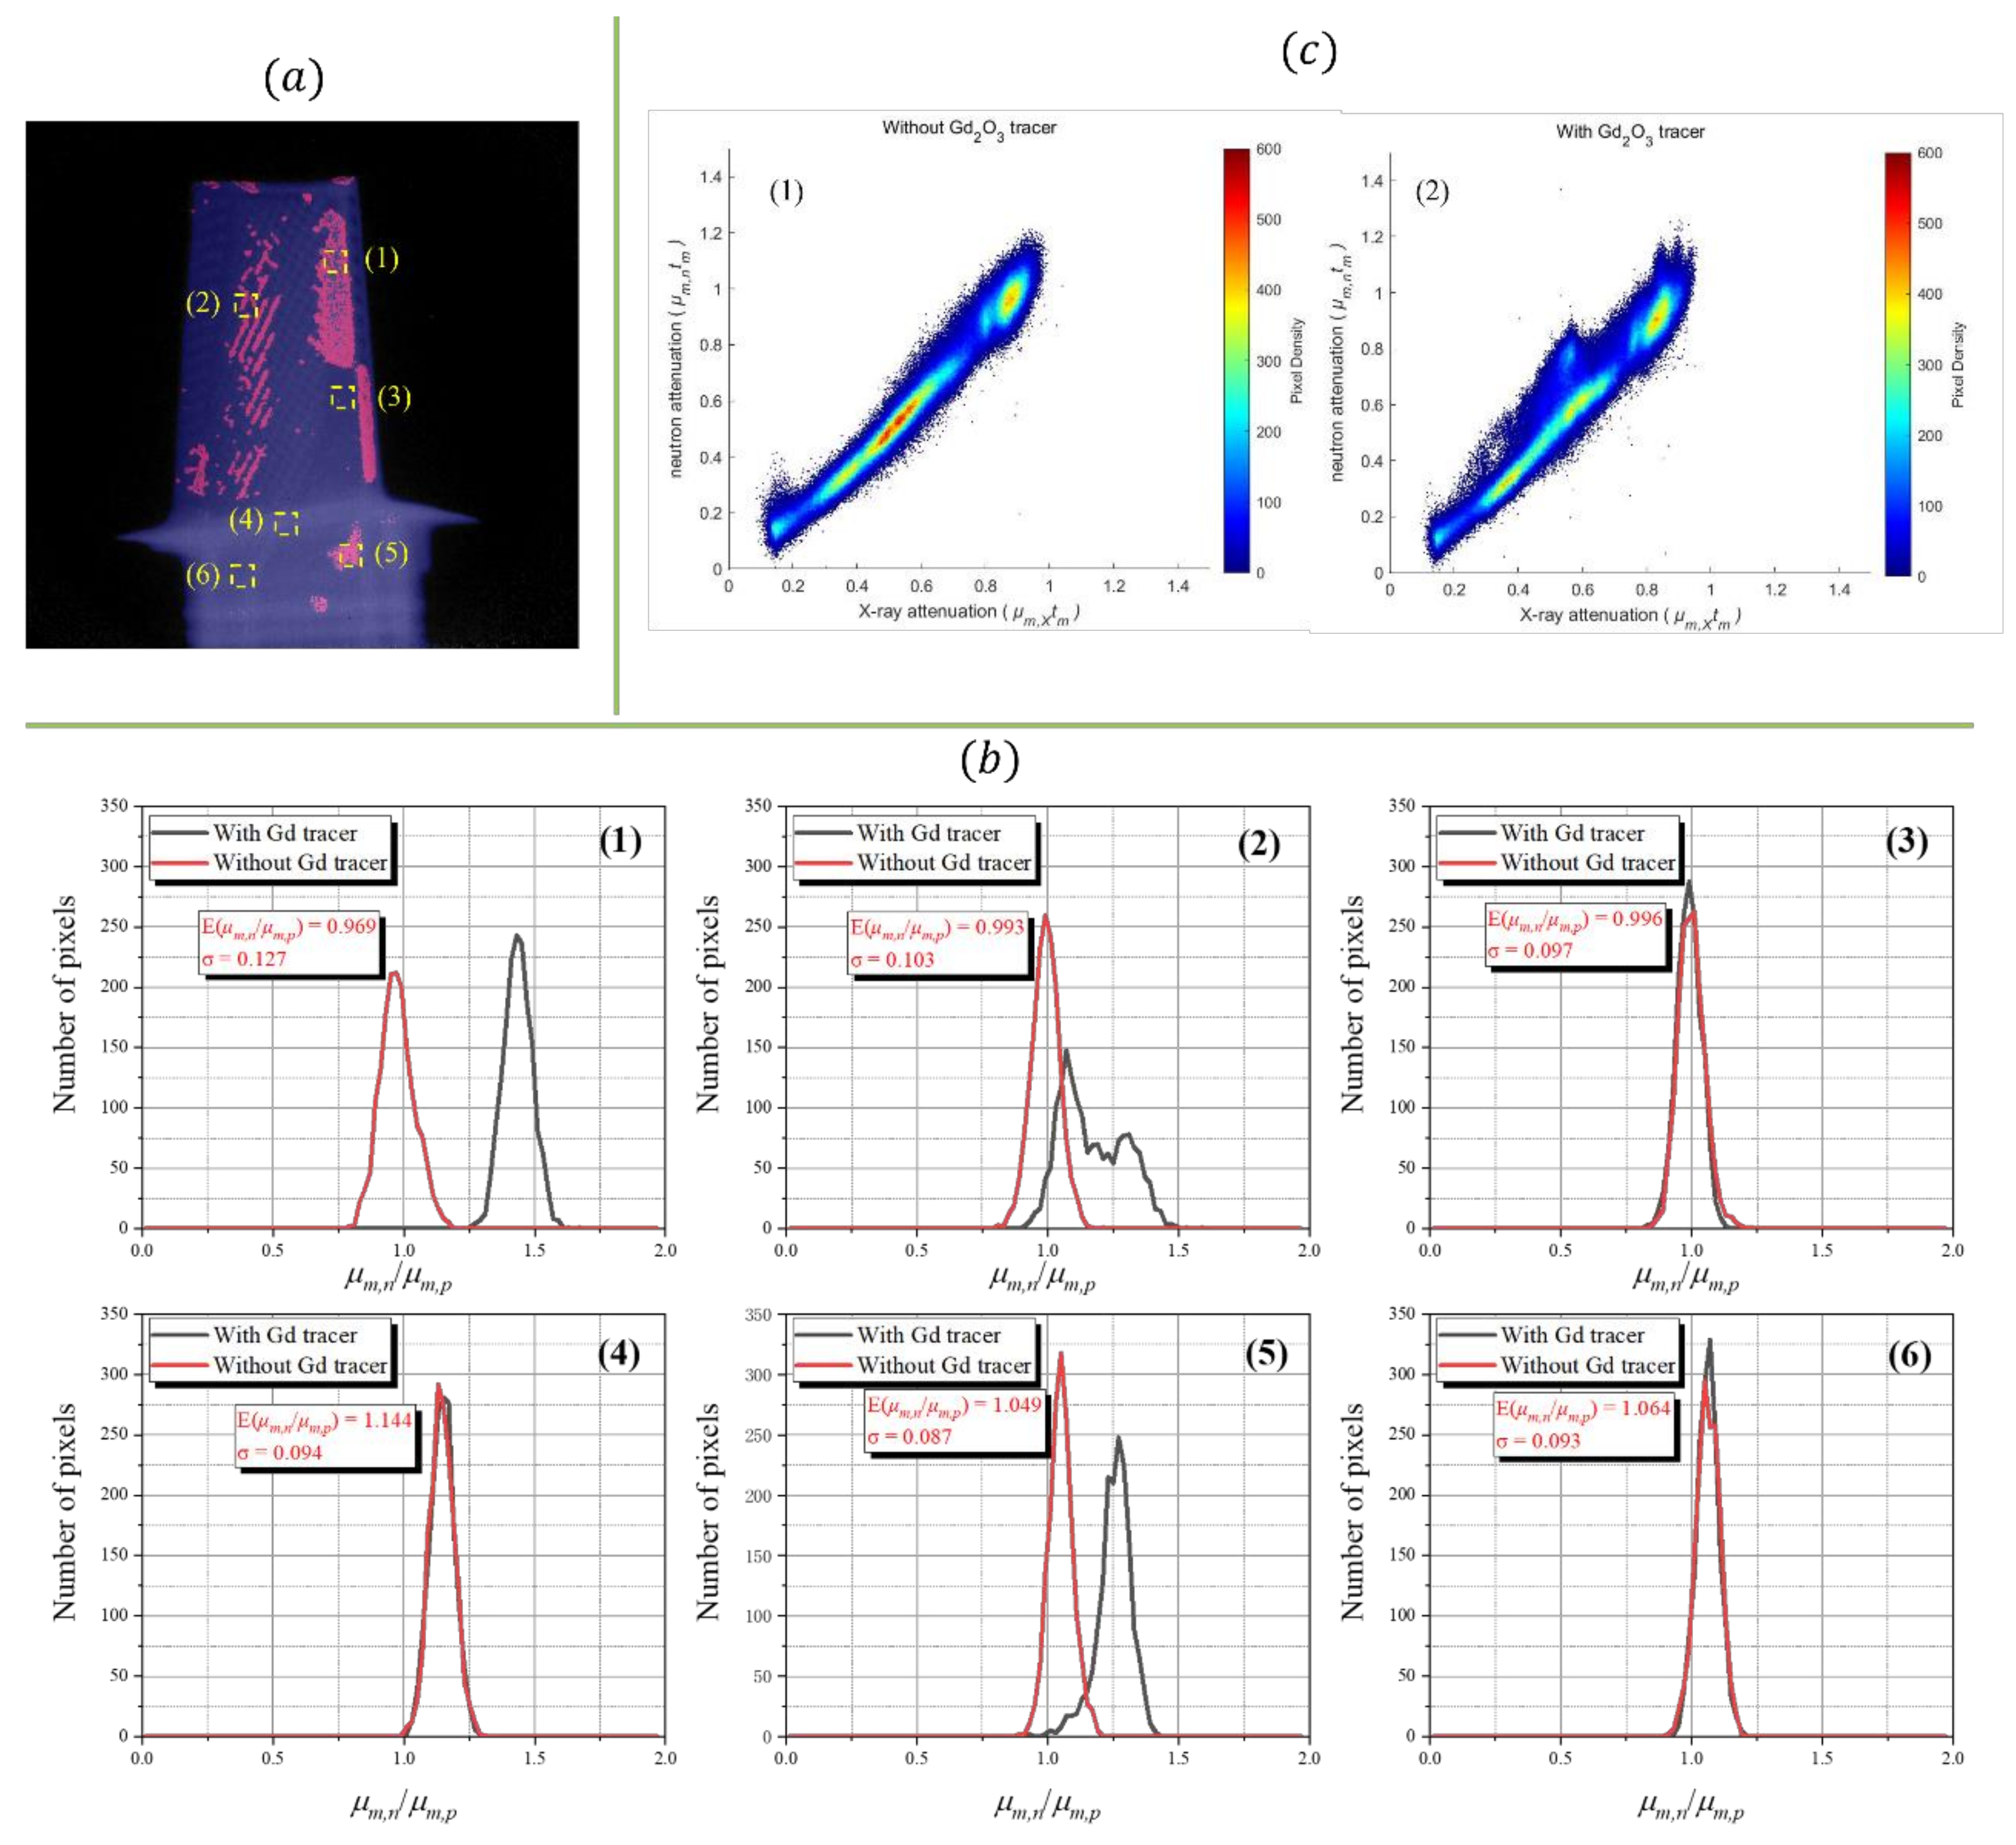
Benefitting from the drastic difference between the attenuation coefficients for neutrons and photons, this technology can help find the residual core material in the cast turbine blade [16]. Figure 8b,c is the neutron image and photon image for a blade without residual gadolinium tracer, respectively, while Figure 8d,e is that for a blade with residual gadolinium tracer (gadolinium oxide powder in this study), respectively. There is no significant difference that can be noticed between Figure 8c,e, indicating the inability of photons to investigate the residual gadolinium tracer inside the blade. On the contrary, the difference between Figure 8b,d is evident, implying that the blade with residual gadolinium tracer can be effectively discriminated by neutrons. By fusing the images of Figure 8d,e, a new image reflecting the position distribution of residual gadolinium tracer inside the blade is formed and shown in Figure 9a. To conduct a more quantitative comparison between the blades with or without gadolinium tracer, the distributions of the value, which is the ratio between the mass attenuation coefficient of neutrons and that of photons, of each pixel in the six squares of Figure 9a are calculated and shown in Figure 9b(1)~(6), with their counterparts for the blade without gadolinium tracer are also shown for comparison. Due to the existence of the gadolinium tracer, the separation between the two curves in Figure 9b(1)(2)(5) is evident. Due to the lack of a gadolinium tracer in Figure 9b(3)(4)(6), the two curves conform to each other and do not show a significant difference. The deviations of the peak positions of the two curves in Figure 9b(4)(6) are mainly caused by the hardening effect of penetrating photons. Figure 9c(1)(2) shows the bivariate histograms of turbine blades without or with gadolinium tracer. The turbine blade with gadolinium tracer differs obviously from that without gadolinium tracer.
4. Discussion
The industrial applications of neutron imaging have long suffered from the lack of a suitable neutron source that can deliver an intense neutron beam with a long lifespan [1]. Reactor sources, or spallation neutron sources, are reluctantly ruled out for their high construction and operating costs. Isotopic neutron sources cannot provide the necessary brilliant neutron beam, and some suffer from short half-lives [16]. Therefore, only the accelerator-driven neutron sources would be considered, in which the e-LINAC can deliver high fluxes for both neutrons and photons, and the even higher flux of X-rays fortunately compensates for the relatively low intrinsic detection efficiency of the detector for several hundred keV to MeV photons. Therefore, besides the relatively low cost and modest footprint [17], the most attractive property of the e-LINAC-driven system is that it can provide the imaging photon beam and neutron beam almost simultaneously with a negligible difference between their imaging beam geometries because both the two radiations are emitted from the same volumetric photoneutron source. The successive photon imaging and neutron imaging measurements within one e-LINAC operation facilitate the fusion of the photon image and the neutron image. This unique property makes the e-LINAC driven system be a promising bimodal imaging system.
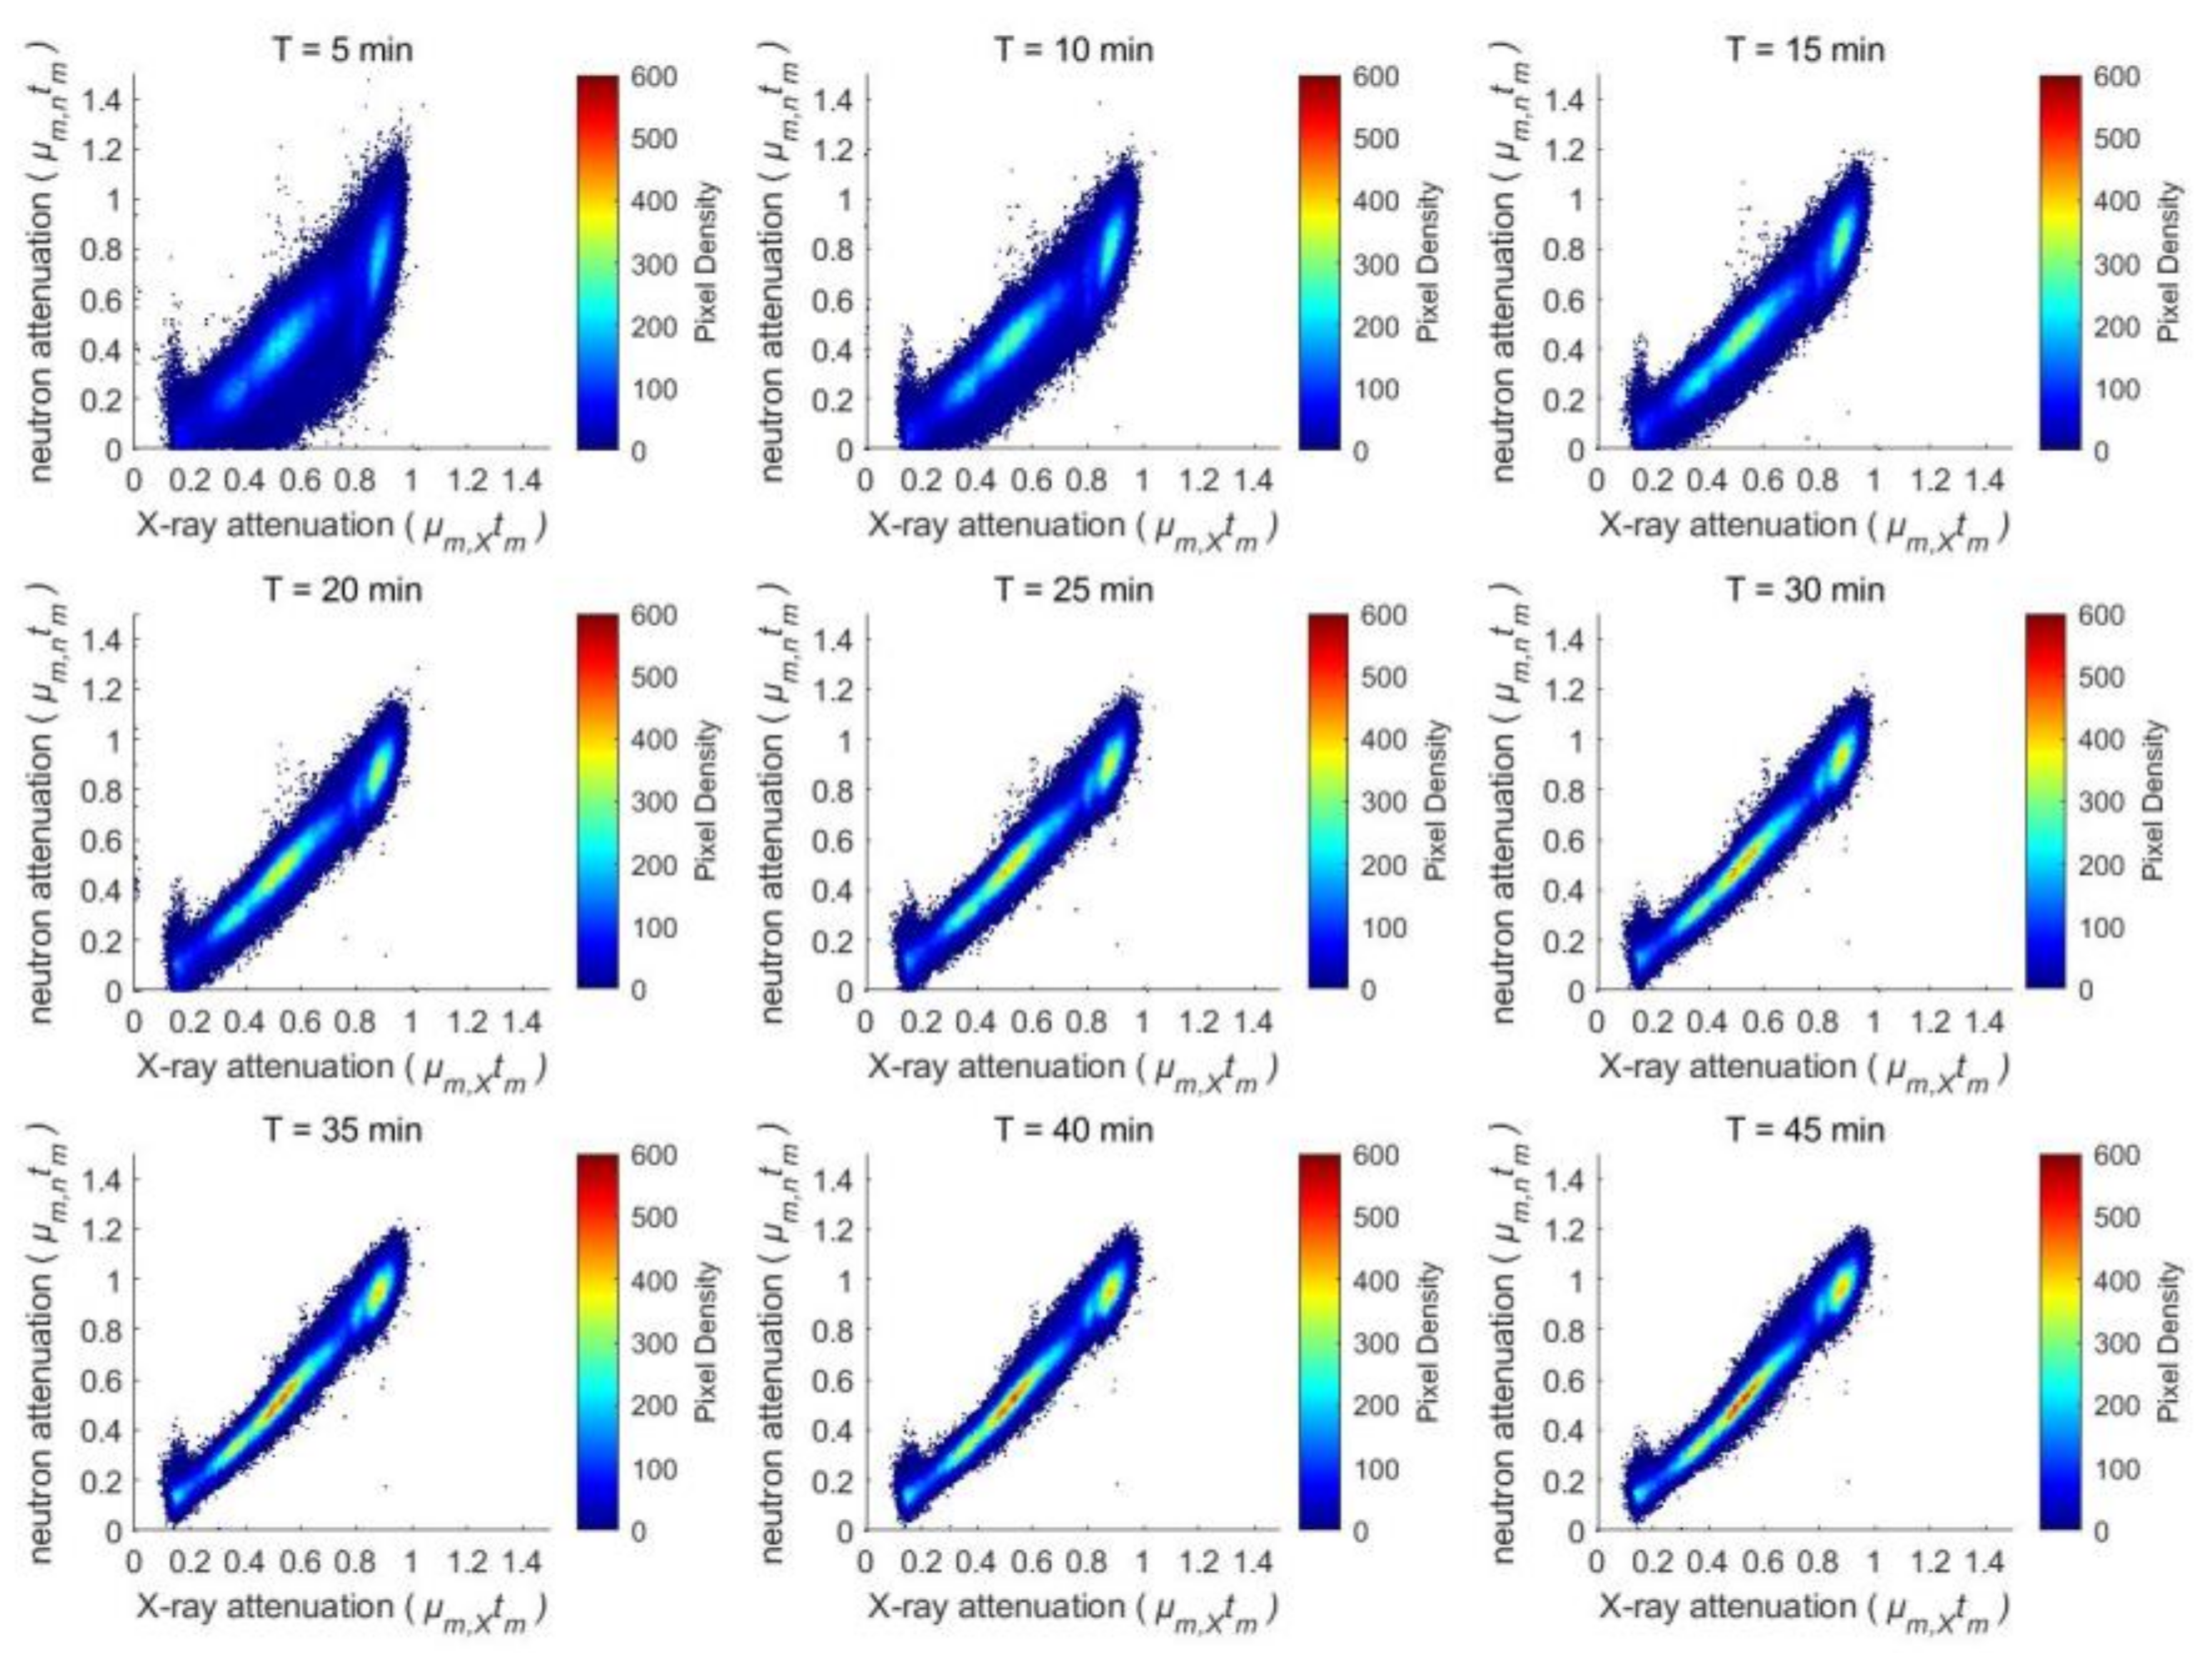
4.1. The Influence of Counting Statistics on Identifying the Material
Figure 10 presents the bivariate histograms of the inspected turbine blade with various measurement times. As the turbine blade made of nickel is free of a gadolinium tracer, in principle the slope (Appendix A.6), which is the ratio between μm,ntm and μm,Xtm in each histogram, should be a certain value. However, the statistical error contaminates the results and spreads the two-dimensional distributions in the histograms. The value of the slope in the bivariate diagram is as follows:
where and are the logarithm of the attenuation of neutrons and X-rays, respectively; and are the numbers of incident and transmitted neutrons, respectively; and and are that for X-rays, respectively. As the mass attenuation coefficient is the ratio of the microscopic cross section with the mass of the nucleus (for neutron) or the atom (for X-ray), this equation can be further expressed as follows:
where and are the microscopic cross sections of neutrons/X-rays with the nuclei/atoms of the inspected object, respectively; and and are the masses of the nuclei and the atoms, respectively, with the approximation of . Then, the expectation value of the slope can be expressed as follows:
The fractional error of slope can be analyzed by the error propagation formula as follows:
Because
and the and can be measured in advance with the high precision, their contributions to the fractional error of slope can be neglected. The fractional error of slope is as follows:
Considering the counting statistics of X-rays are far better (about 1000 times better in this study) than that of neutrons, the fractional error can be approximately determined only by the measured neutrons, as follows:
where is the neutron’s count rate per pixel free of the inspect object and T is the measuring time. For an inspected object of 5-millimeter-thick nickel (the substrate material of the turbine blade), , , the fractional error is as follows:
A 60-minute measurement then leads to a fractional error of 4.91% for the 5-millimeter-thick nickel. This error can be further reduced when more than one pixel can be involved to realize even better counting statistics, which is possible when the ROI (region of interest) to be identified consists of many pixels.
4.2. To Improve the Neutron Yield of the Photoneutron Source
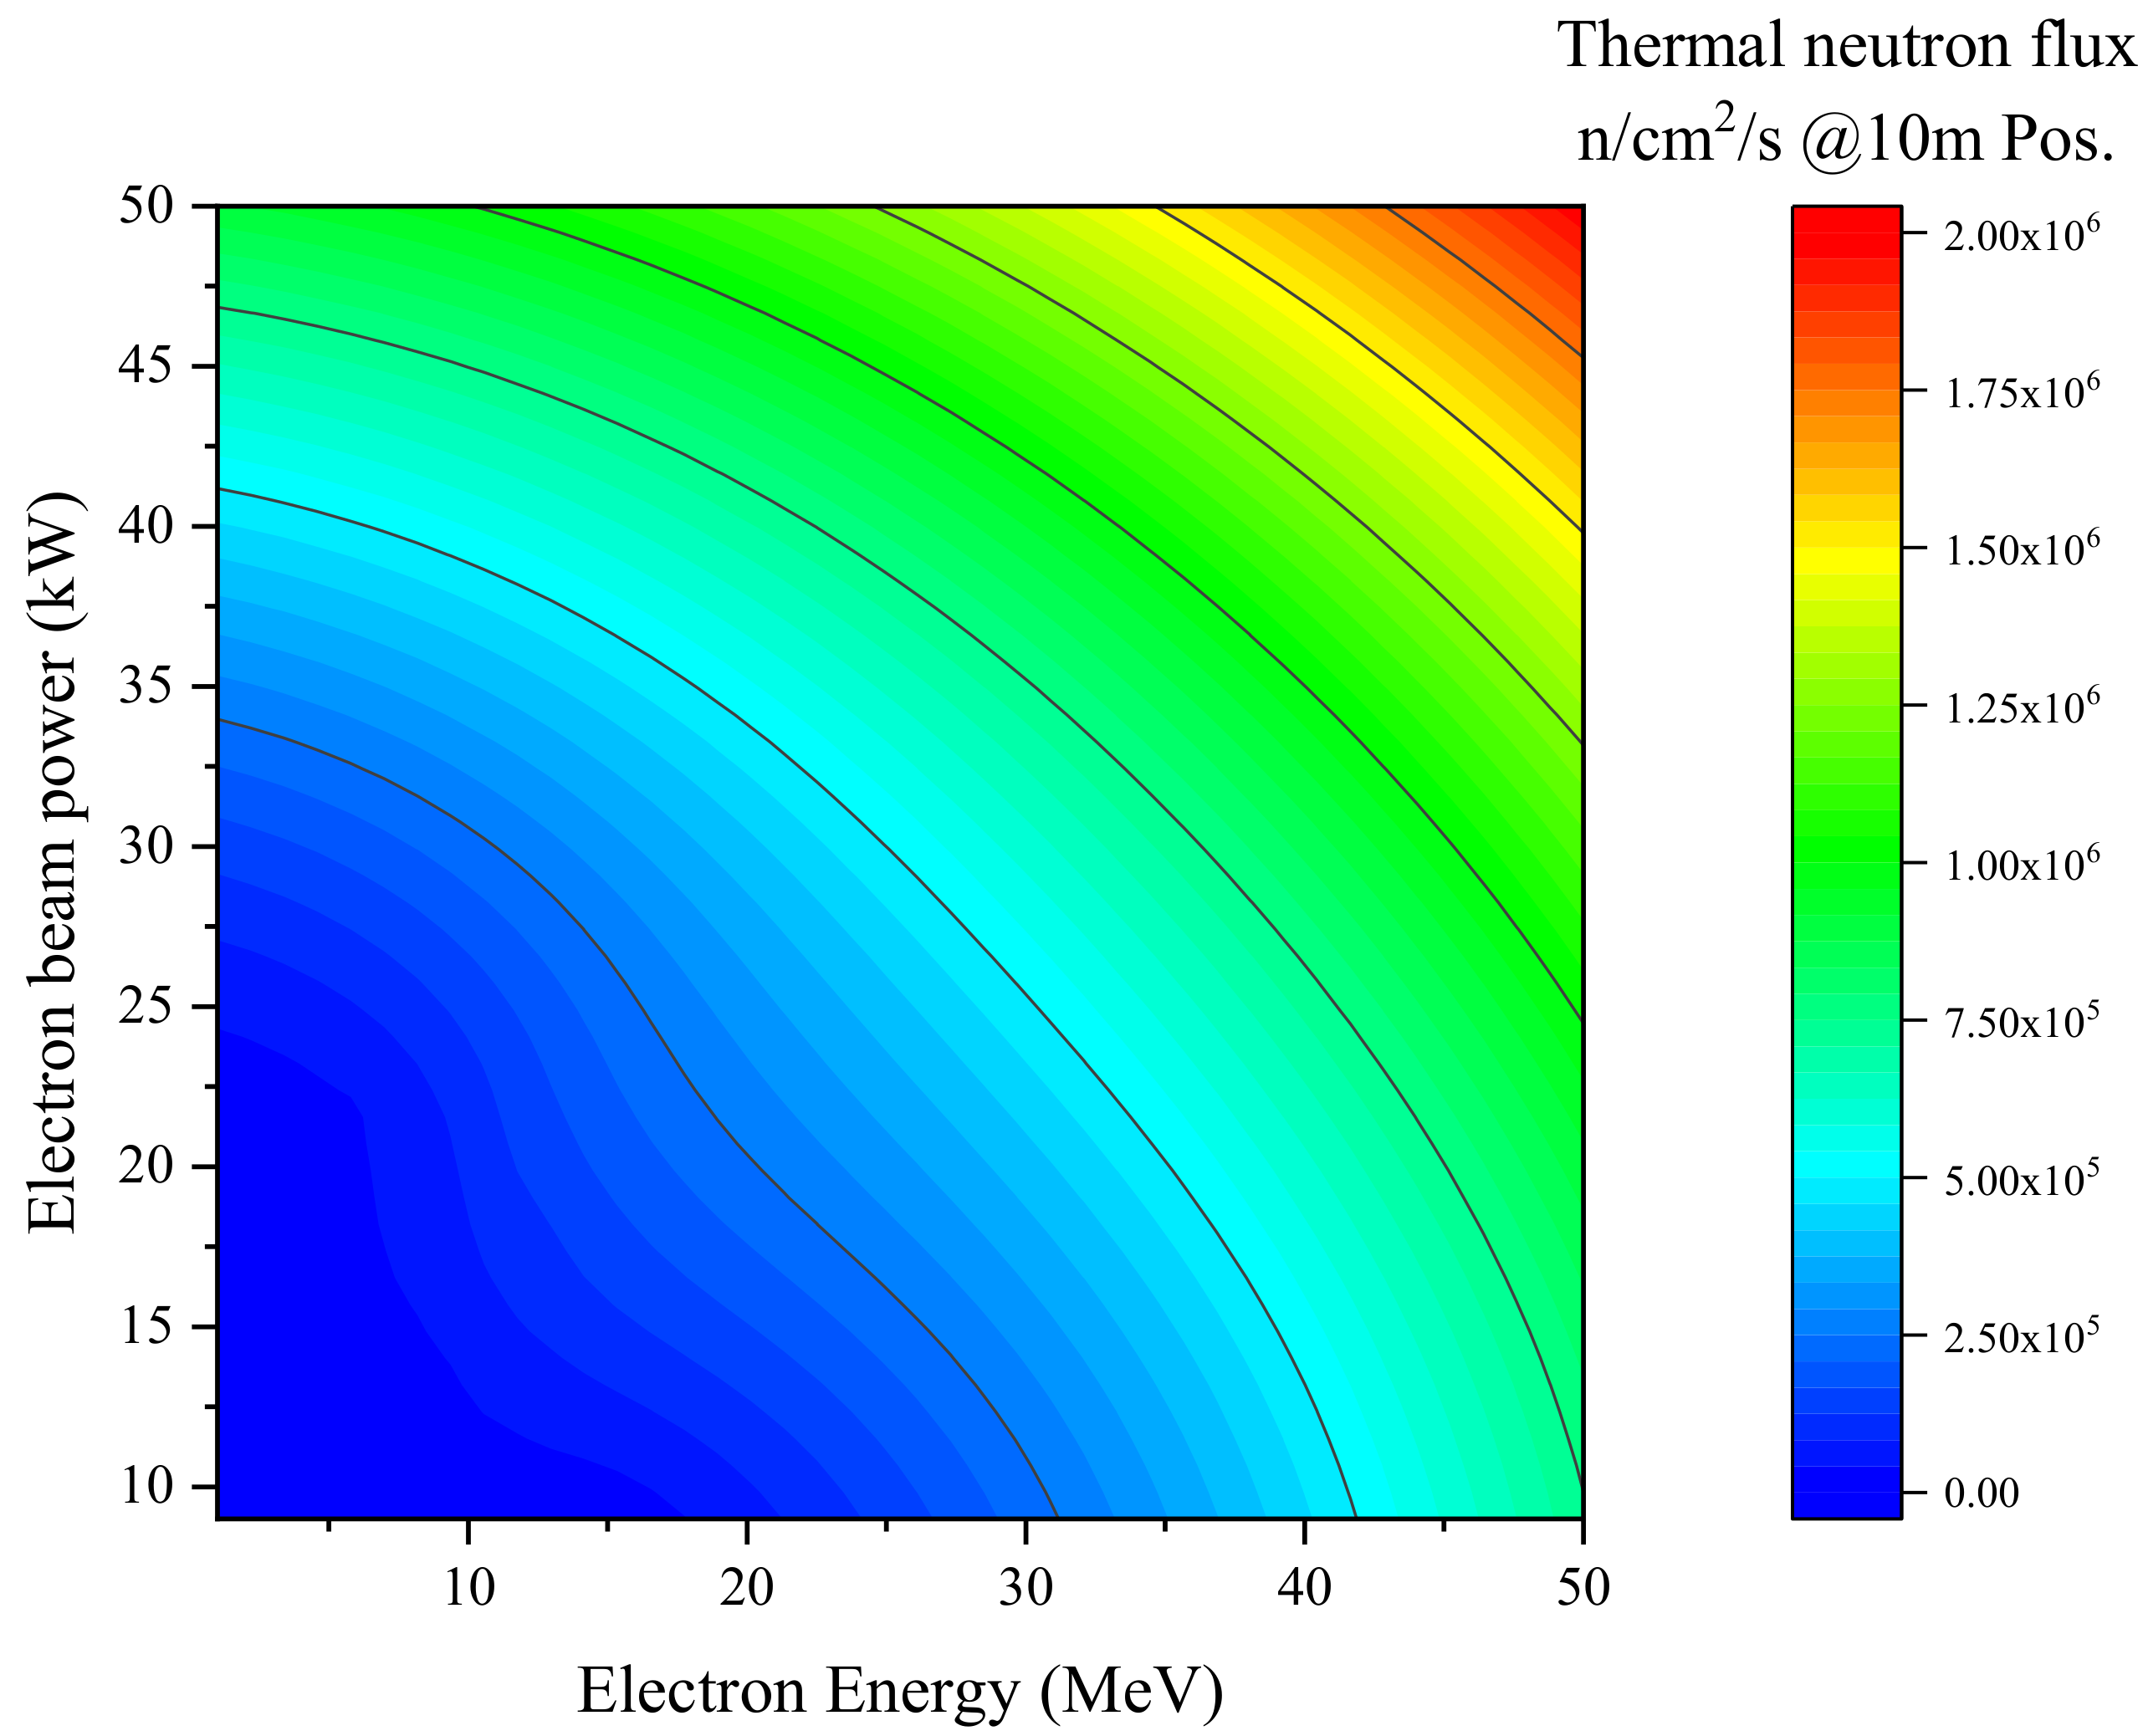
Besides increasing the inspection time, improving the neutron yield is also necessary to improve the performance of the bimodal imaging. The neutron yield of the photoneutron source is proportional to the power of bombarding electrons and can also be increased drastically with the larger energy of bombarding electrons with a suitable target. The enlarged electron’s energy boosts the average energy of bremsstrahlung photons, leading to an even large inner product of the spectrum of bremsstrahlung photons and the cross section curves of the (γ,n) reaction, which in turn cause a larger neutron yield. Due to the larger cross sections, a high-Z target is usually used for the photoneutron production when the bombarding energy of electrons is higher than 10 MeV. Shown in Figure 11 is the Geant4 simulated results of the thermal neutrons flux 10 m away from the photoneutron source, when different energies of electrons with varied powers are used to produce photoneutrons with the tungsten target and polyethylene moderator. A 2.5 × 10⁶ n/cm2/s thermal neutron flux at the detector’s position can be anticipated with a 50 MeV/50 kW photoneutron source.
4.3. The Hardening Effect
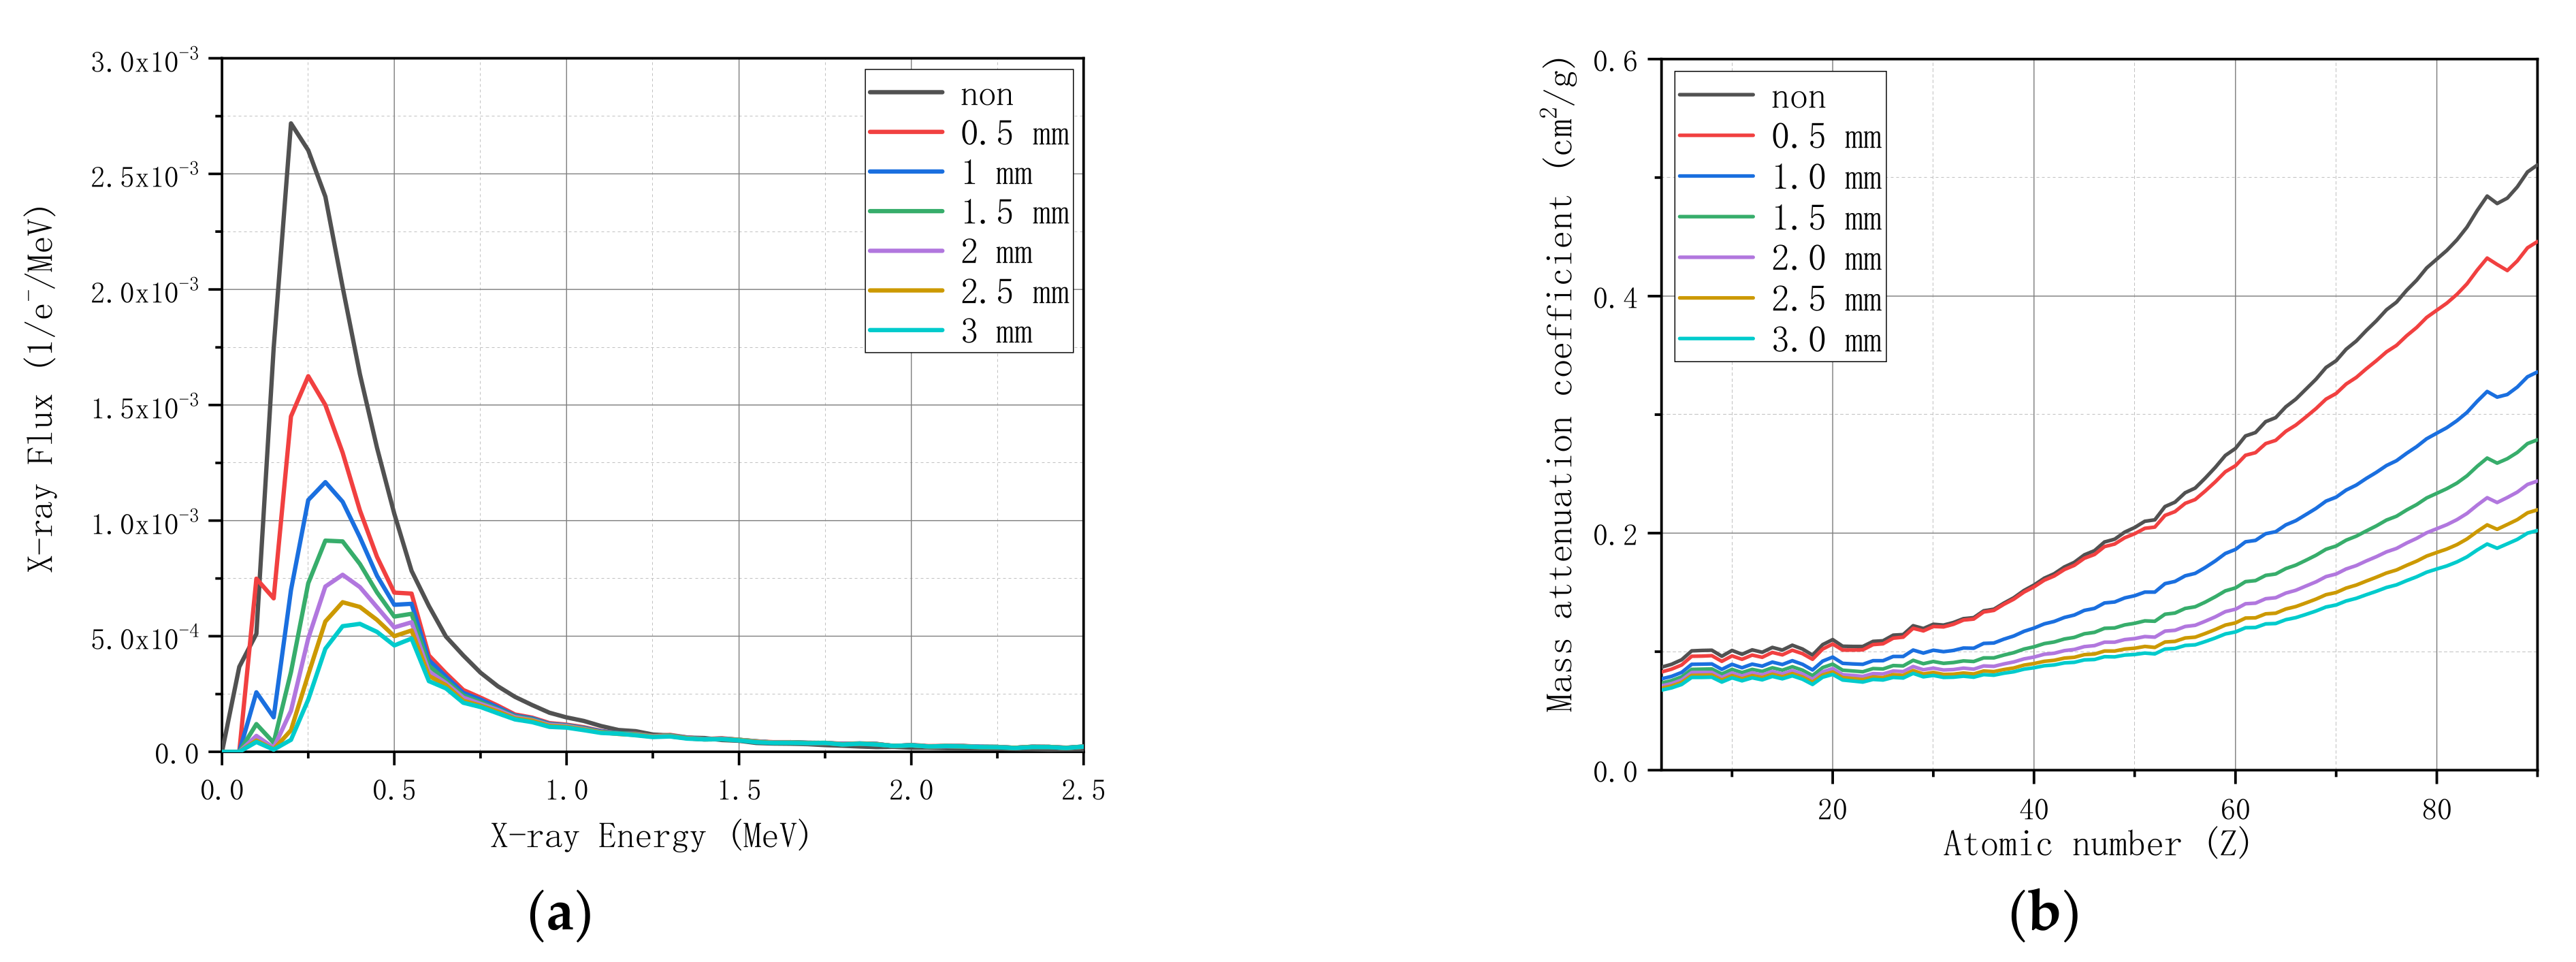
The spectra of photons and neutrons would undergo the hardening process when they penetrate inspected objects of various mass thicknesses. Therefore, the ratio between the neutron attenuation and photon attenuation might not be constant even for a particular material. Although the hardening effect cannot vanish completely, it can be somewhat alleviated when a high-Z material layer is used to tailor the penetrating X-rays’ spectrum. Shown in Figure 12a,b are the spectra and average mass attenuation coefficients for the X-rays, respectively, when a lead layer of various thicknesses is placed at the exit of the photoneutron source to shield the low energy photons via the photoelectric absorption and the high energy photons via the pair production. The mass attenuation coefficients for the elements with Z < 50 can be deemed as constant when a 3-millimeter-thick lead layer is used, indicating that Compton scattering is now the dominating photoatomic reaction and the spectrum of X-rays will stably stay within the MeV region, where the hardening effect for photons is not significant.
As thermal neutrons are mainly used in neutron imaging and the microscopic cross sections of neutron absorption obey the 1/v law, the hardening effect for the neutrons will not be important because the distribution of thermal neutrons’ energies is determined by the temperature of the moderator but not the inspected object.
4.4. The Capability for Nuclides Sensitive Imaging
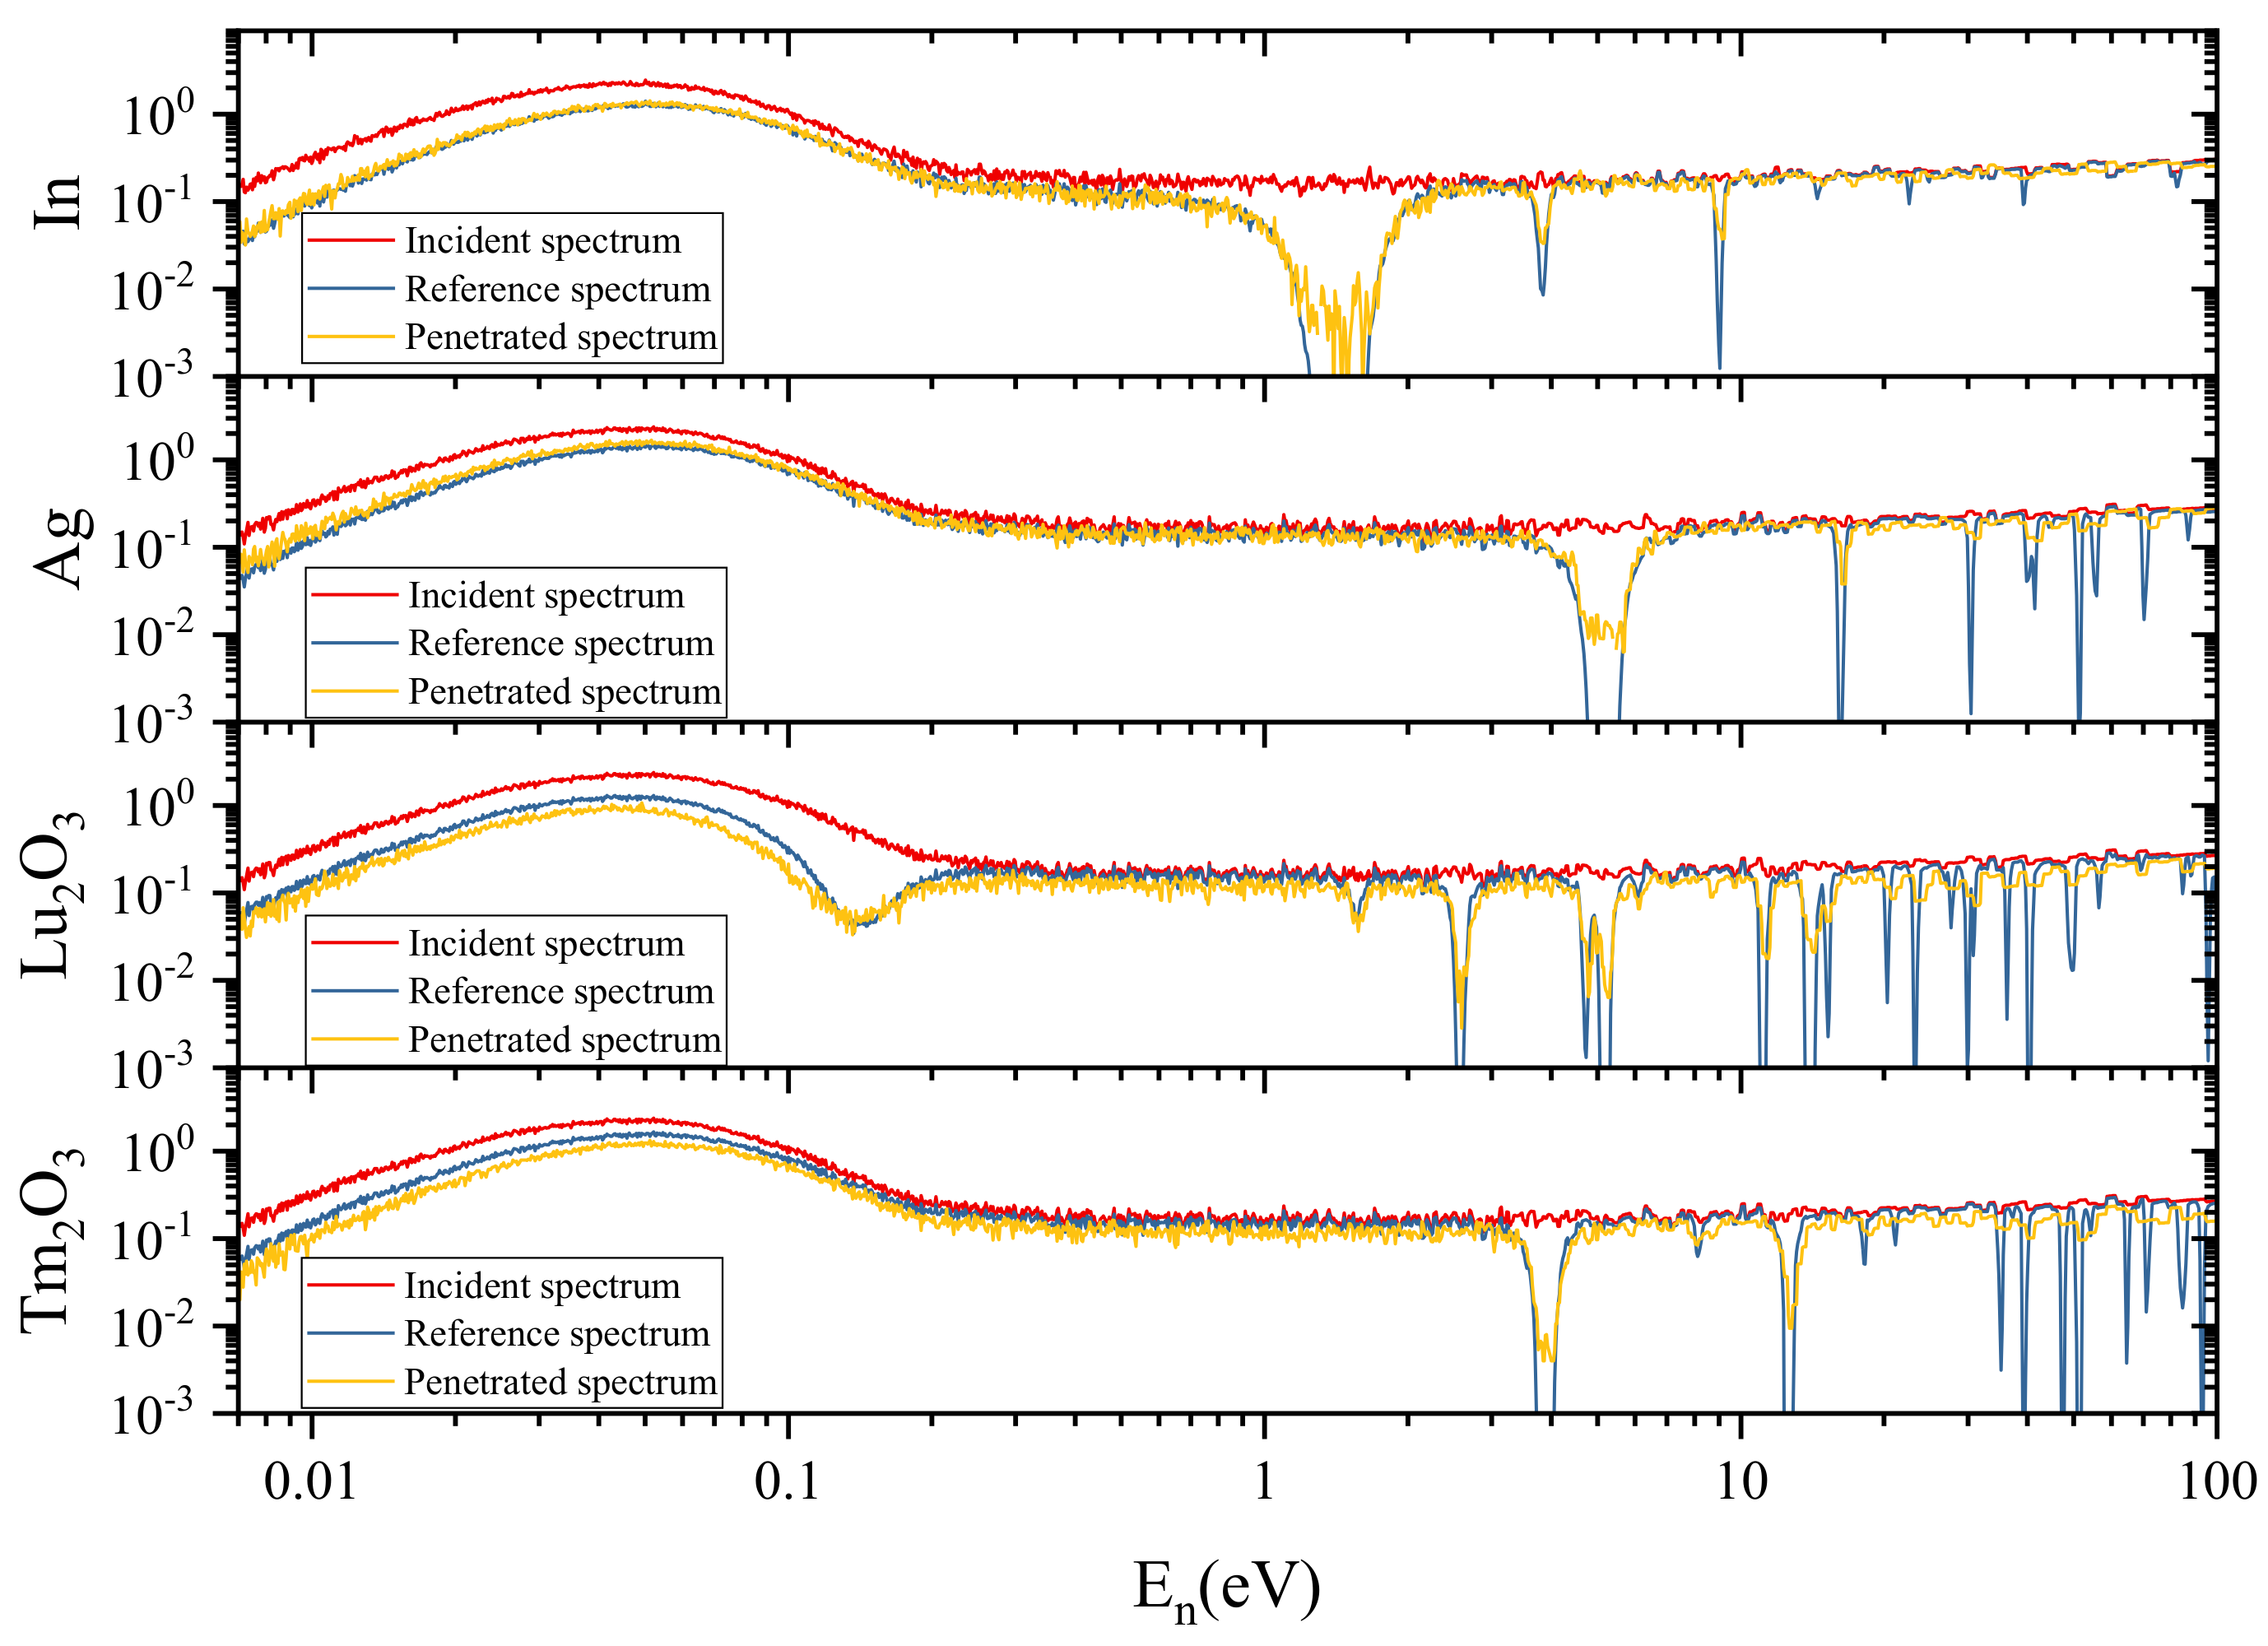
Shown in Figure 13 is the 4-atm 3He counter measured neutron spectra of materials containing In, Ag, Lu and Tm, with the time-of-flight method. The observed resonant dips conform to the reference spectra acquired from the ENDF/B-VIII.0 well. The results demonstrate the potential of this system for energy selective imaging to identify the middle- or high-Z nuclides. A new nMCP detector that can record the flight time of each measured neutron, with the readout of cross delay line or cross strip, will be upgraded to conduct the nuclides sensitive imaging.
4.5. The Applcation in Fast Process Imaging
Benefitting from the periodical working mode of the e-LINAC, this system can be used for the investigation of fast repetitive processes. When the e-LINAC works at the typical repetition frequency of 100 Hz, the engine mentioned in [18] can be inspected with a running speed as high as 6000 rpm. The e-LINAC will be triggered by the synchronization signal provided by the engine, with an adjustable time delay, to produce X-rays and neutrons. The adjustable time delay permits the X-ray pulses to inspect the working engine for the user-specified phases. The 10-minute-flight-time for thermal neutrons ranges from 1.32 ms (300 meV neutron) to 7.23 ms (10 meV neutron); thus, the nMCP detector with high temporal resolution readout should be applied to successively register the image slices of the working engine. As the sub-microsecond temporal resolution can be easily realized with the readouts of cross delay line [19], cross strip [20], or Medipix/Timepix [21], successively acquiring the neutrons’ images of the working engine would not be difficult. However, it must be pointed out that, as the e-LINAC works at the pulsed mode, the fluxes of both X-rays and neutrons are not temporally uniform. In each period of the e-LINAC, the flux of X-rays (4 × 10⁵/cm2 incident photons within the 5 μs X-ray emission duration) is far larger than that of thermal neutrons (10/cm2 incident thermal neutrons within about the ~10 ms duration) at the position of the detector; therefore, the throughput of the detector system should be large enough, and perhaps Timepix is the only proper choice for the readout. Although the neutron yield of the e-LINAC driven neutron source in this stage is quite low, the repetitive processes permit a long acquisition time for the detection system to achieve the good enough counting statistics.
In the case of non-repetitive processes [22], the detection system has no opportunity to investigate the same phase of the inspected object for the second time, the poor counting statistics then prohibit the application of bi-modal imaging with this system in practice. Apparently, increasing the neutron yield is the only way to fulfill the requirements for the inspection of non-repetitive processes. However, increasing the neutron yield of the e-LINAC photoneutron source as high as that of the spallation neutron source, for example, 1017 n/s, would be a formidable challenge, as the heat power deposited on the target by the bombarding electrons will be as high as decades of megawatt.
5. Conclusions
This study is the first time bimodal imaging has been applied within a one-source-one-detector system for both neutrons and photons. The pixel-wise matching between a neutron image and a photon image can be conducted directly with negligible mismatching. Thus, the bivariate histogram provides a convenient way of separating various materials without prior knowledge of the inspected object. This system’s modest environmental footprint and cost imply that this technology is promising for in situ industrial applications and other purposes.
Author Contributions
Conceptualization, Y.Y. (Yigang Yang); methodology, Y.Y. (Yangyi Yu), R.Z., and L.L.; formal analysis, Y.Y. (Yigang Yang); investigation, Y.Y. (Yangyi Yu), R.Z., L.L., and Y.Y. (Yigang Yang); resources, Y.Y. (Yigang Yang); writing—original draft preparation, Y.Y. (Yangyi Yu); writing—review and editing, Y.Y. (Yigang Yang); funding acquisition, Y.Y. (Yigang Yang). All authors have read and agreed to the published version of the manuscript.
Funding
This research was funded by the National Natural Science Foundation of China under Grant 11735008.
Institutional Review Board Statement
Not applicable.
Informed Consent Statement
Not applicable.
Data Availability Statement
The data presented in this study are available on request from the corresponding author.
Acknowledgments
The authors thank Xuewu Wang for the discussion of the idea of bimodal imaging. We also thank Yulan Li and Zhi Zhang for the funding support from Department of Engineering Physics. The authors thank LetPub (www.letpub.com (accessed on 24 February 2021)) for its linguistic assistance during the preparation of this manuscript.
Conflicts of Interest
The authors declare no conflict of interest.
Appendix A
Appendix A.1. Electron Linear Acceleractor
The electron linear accelerator used in this study is a 9 MeV e-LINAC manufactured by NUCTECH Co. Ltd. Beijing, China, which can deliver 9 MeV electron pulses of a 5-microsecond width. The repetition rates are adjustable, ranging from 20 to 250 Hz, and the corresponding electron gun current ranges from 8 to 100 μA.
Appendix A.2. Heavy Water Converter
Heavy water is used as the photon-to-neutron converter. After the 9 MV bremsstrahlung photons are generated from the 9 MeV electrons bombarding the 1.5-millimeter-thick tungsten target, the photoneutron is produced when an energetic photon breaks the 2H nucleus into proton and neutron. Monte Carlo simulations were carried out to determine the geometry of the heavy water converter to achieve a high neutron flux of a suitable energy spectrum in the detector position. A total weight of 6.5 kg heavy water is contained within an aluminum vessel of Φ16 cm × 28 cm and 3-millimeter-thickness.
Appendix A.3. Neutron Moderator
The neutron moderator is made up of high-density polyethylene and heavy water. The generated fast neutrons undergo collisions with the light nuclei in moderators such as 1H, 2H, 12C, and 16O. From the collisions, the velocity of the neutrons will gradually decrease to the thermal neutron region. The optimized outer size of the polyethylene element is Φ 36 cm × 44 cm, and the mean energy of the emitted neutrons is 44.26 meV.
Appendix A.4. Shielding and Collimator
A 10-meter-long vacuum tube is designed for neutron transport and collimation. Eleven ring-shaped neutron absorbers made of boron carbide ceramics are placed inside the vacuum tube with an interval of 1 m between each other to collimate the neutrons traveling inside the tube. The tube’s outer surface is covered by boron-containing rubber with 60 wt.% boron to absorb the neutrons that may escape from inside the tube. The detector is placed in a shielded container, from inside to outside, by 10 cm lead, 0.5 cm boron-containing rubber, and 30 cm boron-containing polyethylene. The S/B (signal neutrons versus background neutrons, where signal neutrons are the neutrons that travel directly from the heavy water converter, and background neutrons stand for those undergo scattering in the circumstances) ratio of this system is larger than 200.
Appendix A.5. Detector
Both neutrons and photons are measured using the same detector, a neutron-sensitive micro-channel plate (nMCP) produced by Photonis Co. Ltd. Sturbridge, MA, USA. Its sensitive area is 95 mm × 95 mm. The neutron or X-ray will be converted to avalanched electrons by the nMCP at first. After the absorption of each neutron or photon, the avalanched electrons then produce fluorescence on the P46 scintillation screen with a decay time of 200 ns. The pictures present in the P46 scintillation screen will be registered using a CMOS camera (Andor iStar series with image intensifier) with the aid of an optical system that provides a 90° reflection and scaling for matching the sensitive area of the CMOS camera. The shutter of the CMOS camera can be set with a variable time delay with respect to the triggering signal that indicates the production of an X-ray pulse to separate the acquisition of the photon image and the neutron image.
Appendix A.6. Fusion of Images
Benefiting from the almost same imaging beam geometries for neutrons and photons, the pixel-wise matching between the neutron image and photon image can be conducted directly, without additional linear translation, rotation, scaling, or skew. For the same pixel of the inspected object’s images, the corresponding values of neutron attenuation and photon attenuation can be extracted from the two images compared with the images of “air” of neutrons or photons, respectively. The value for neutron attenuation and that for photon attenuation of the same pixel determine a point in the coordinate system whose x-axis is the photon attenuation, and y-axis is the neutron attenuation. By analyzing all the pixels present in the two images, a bivariate histogram, in which different materials with various mass thicknesses can be identified, is formed.
For both neutrons and photons, the attenuation can be calculated as follows:
where is the attenuation of neutrons or photons, equal to the product of and , which are the mass attenuation coefficients for neutrons or photons and the mass thickness of the inspected objects, respectively; and are the measured counts for neutrons or photons penetrating “air” or the inspected object, respectively. The ratio that determines a slope in the bivariate histograms to identify different materials is given by the following:
where subscript n and X stand for neutrons and photons, respectively; and the cancels because it is the same for neutron penetration and photon penetration. Therefore, when the hardening effect is not severe (the energy spectra of neutrons or photons are not significantly influenced when the inspected object’s mass thickness is varied), in the bivariate histogram, a specific material will have a certain slope. In the case that several different materials are successively penetrated by neutrons and photons, the slope might be modified as follows:
where N is the number of materials. In general, we cannot separate three or more materials with the information provided by the bivariate histogram. However, considering that the pulse working mode of the e-LINAC-driven system enables energy-resolving neutron imaging, a multivariate histogram can be formed for the further identification of materials. We have successfully conducted an isotope identification experiment, which realizes the energy-resolving neutron measurement, demonstrating the possibility of the multivariate image data acquisition within the framework of the system in this study.
References
- Anderson, I.S.; Robert, L.M.; Bilheux, H.Z. Neutron Imaging and Applications; Springer: Berlin/Heidelberg, Germany, 2009; p. 987. [Google Scholar]
- Banhart, J.; Borbély, A.; Dzieciol, K.; Garcia-Moreno, F.; Manke, I.; Kardjilov, N.; Kaysser-Pyzalla, A.R.; Strobl, M.; Treimer, W. X-ray and neutron imaging–Complementary techniques for materials science and engineering. Int. J. Mater. Res. 2010, 101, 1069–1079. [Google Scholar] [CrossRef]
- Horn, Q.C.; Yang, S.-H. Morphology and spatial distribution of ZnO formed in discharged alkaline Zn/MnO2 AA cells. J. Electrochem. Soc. 2003, 150, A652. [Google Scholar] [CrossRef]
- Tötzke, C.; Kardjilov, N.; Lenoir, N.; Manke, I.; Oswald, S.E.; Tengattini, A. What comes NeXT?—High-speed neutron tomography at ILL. Opt. Express 2019, 27, 28640–28648. [Google Scholar] [CrossRef] [PubMed]
- De Beer, F.C. Neutron and X-ray tomography at Necsa. J. South. Afr. Inst. Min. Metall. 2008, 108, 613–620. [Google Scholar]
- Clark, T.; Burca, G.; Boardman, R.; Blumensath, T. Correlative X-ray and neutron tomography of root systems using cadmium fiducial markers. J. Microsc. 2020, 277, 170–178. [Google Scholar] [CrossRef] [PubMed] [Green Version]
- Lehmann, E.H.; Vontobel, P.; Deschler-Erb, E.; Soares, M. Non-invasive studies of objects from cultural heritage. Nucl. Instr. Methods Phys. Res. Sect. A Accel. Spectr. Detect. Assoc. Equip. 2005, 542, 68–75. [Google Scholar] [CrossRef]
- Carminati, A.; Kaestner, A.; Lehmann, P.; Flühler, H.; Lehmann, E.; Hassanein, R.; Vontobel, P.; Stampanoni, M.; Groso, A. Monitoring water flow in soils, using neutron and x-ray tomography. PSI Sci. Rep. 2005, 2006, 28–29. [Google Scholar]
- Kaestner, A.P.; Hovind, J.; Boillat, P.; Muehlebach, C.; Carminati, C.; Zarebanadkouki, M.; Lehmann, E.H. Bimodal imaging at ICON using neutrons and X-rays. Phys. Procedia 2017, 88, 314–321. [Google Scholar] [CrossRef]
- Fedrigo, A.; Marstal, K.; Bender Koch, C.; Andersen Dahl, V.; Bjorholm Dahl, A.; Lyksborg, M.; Gundlach, C.; Ott, F.; Strobl, M. Investigation of a Monturaqui Impactite by means of bi-modal X-ray and neutron tomography. J. Imaging 2018, 4, 72. [Google Scholar] [CrossRef] [Green Version]
- Lehmann, E.H.; Mannes, D.; Kaestner, A.P.; Hovind, J.; Trtik, P.; Strobl, M. The XTRA Option at the NEUTRA Facility—More Than 10 Years of Bi-Modal Neutron and X-ray Imaging at PSI. Appl. Sci. 2021, 11, 3825. [Google Scholar] [CrossRef]
- LaManna, J.M.; Hussey, D.S.; Baltic, E.; Jacobson, D.L. Neutron and X-ray Tomography (NeXT) system for simultaneous, dual modality tomography. Rev. Sci. Instr. 2017, 88, 113702. [Google Scholar] [CrossRef] [PubMed]
- Tengattini, A.; Lenoir, N.; Andò, E.; Giroud, B.; Atkins, D.; Beaucour, J.; Viggiani, G. NeXT-Grenoble, the Neutron and X-ray tomograph in Grenoble. Nucl. Instr. Methods Phys. Res. Sect. A Accel. Spectr. Detect. Assoc. Equip. 2020, 968, 163939. [Google Scholar] [CrossRef]
- Development Opportunities for Small and Medium Scale Accelerator Driven Neutron Sources; IAEA-TECDOC-1439; IAEA: Vienna, Austria, 2005.
- Knoll, G.F. Radiation Detection and Measurement; John Wiley & Sons: Hoboken, NJ, USA, 2010. [Google Scholar]
- Tsukimura, R.R.; Meren, A.W.; Scott, V.P. Detection of residual core in air-cooled turbine blades using neutron radiography. In Proceedings of the SPIE 2455, Nondestructive Evaluation of Aging Aircraft, Airports, Aerospace Hardware, and Materials, Oakland, CA, USA, 7 July 1995. [Google Scholar] [CrossRef]
- Ziegler, J.F.; Ziegler, M.D.; Biersack, J.P. SRIM–The stopping and range of ions in matter. Nucl. Instr. Methods Phys. Res. Sect. B Beam Interact. Mater. Atoms 2010, 268, 1818–1823. [Google Scholar] [CrossRef] [Green Version]
- Gruenzweig, C. Visualization of a Fired Two-Stroke Chain Saw Engine Running at Idle Speed by Dynamic Neutron Radiography; SAE Technical Paper 2010-32-0013; SAE International: Warrendale, PA, USA, 2010. [Google Scholar] [CrossRef]
- Wang, Y.; Yang, Y.; Wang, X.; Li, Y. Readout for a large area neutron sensitive microchannel plate detector. Nucl. Instr. Methods Phys. Res. Sect. A Accel. Spectr. Detect. Assoc. Equip. 2015, 784, 226–231. [Google Scholar] [CrossRef]
- Siegmund, O.H.; Vallerga, J.V.; Tremsin, A.S.; Mcphate, J.; Feller, B. High spatial resolution neutron sensing microchannel plate detectors. Nucl. Instr. Methods Phys. Res. Sect. A Accel. Spectr. Detect. Assoc. Equip. 2007, 576, 178–182. [Google Scholar] [CrossRef]
- Tremsin, A.S.; Vallerga, J.V. Unique capabilities and applications of Microchannel Plate (MCP) detectors with Medipix/Timepix readout. Radiat. Meas. 2020, 130, 106228. [Google Scholar] [CrossRef]
- Trtik, P.; Morgano, M.; Bentz, R.; Lehmann, E. 100 Hz neutron radiography at the BOA beamline using a parabolic focussing guide. MethodsX 2016, 3, 535–541. [Google Scholar] [CrossRef] [PubMed]
Figure 1.
(a) The principle to produce imaging neutrons and photons simultaneously. Energetic electrons are delivered by a 9 MeV e-LINAC and bombard the tungsten target to produce bremsstrahlung photons. The bremsstrahlung photons then hit the 2H nuclei to produce the photoneutrons via the 2H(γ,n)1H reaction and the electrons surrounding the 16O nuclei to produce scattered photons, respectively. Both the neutrons and photons will penetrate the inspected object and be collected by a neutron-sensitive microchannel plate (nMCP) detector and converted to electron clouds, leading to a scintillation on the scintillation screen and formation of the photon and neutron images successively. A complementary metal oxide semiconductor (CMOS) camera then registers the two images with the aid of an optical system composed of the mirror and lenses. (b) Photograph of the bimodal imaging system driven by a 9 MeV e-LINAC.

Figure 2.
(a) The simulated spectrum of photons along the 90° direction for photon imaging. (b) Mass attenuation coefficients of 90° scattered X-rays (“□”) and 200 kV X-rays (“○”).
Figure 2.
(a) The simulated spectrum of photons along the 90° direction for photon imaging. (b) Mass attenuation coefficients of 90° scattered X-rays (“□”) and 200 kV X-rays (“○”).

Figure 3.
The simulated and experimentally measured spectra of neutrons at the detector’s position.

Figure 4.
The measuring time sequence for photon imaging and neutron imaging.

Figure 5.
The 2-dimensional distributions of (a) neutrons and (b) photons observed by the detector placed 10 m away.
Figure 5.
The 2-dimensional distributions of (a) neutrons and (b) photons observed by the detector placed 10 m away.

Figure 6.
(a) The photo of the clamped keys; (b) the photon image of the keys; (c) the neutron image of the keys. (Measuring time is 30 min).
Figure 6.
(a) The photo of the clamped keys; (b) the photon image of the keys; (c) the neutron image of the keys. (Measuring time is 30 min).

Figure 7.
(a) The image fused from the neutron image and photon image; (b) the material identification based on the information from neutron attenuation and photon attenuation; (c) The six clusters in (b) are related to different zones of the inspected object, as shown in (1) to (6). Pixel density is the number of pixels in the area of 0.0075 μt × 0.0075 μt.

Figure 8.
(a) The photo of an inspected turbine blade; (b) the neutron image and (c) the X-ray image of the blade without gadolinium tracer; (d) the neutron image and (e) the X-ray image of the blade with gadolinium tracer (Measuring time is 60 min for each pair of imaging).
Figure 8.
(a) The photo of an inspected turbine blade; (b) the neutron image and (c) the X-ray image of the blade without gadolinium tracer; (d) the neutron image and (e) the X-ray image of the blade with gadolinium tracer (Measuring time is 60 min for each pair of imaging).

Figure 9.
(a) Fused image of the turbine blade; (b) the distributions of μm,n/μm,X for turbine blades with or without gadolinium tracer, for six different positions of the turbine blade (selected region is 40 × 40 pixels); (c)(1) the bivariate histograms for turbine blades with gadolinium tracer and (c)(2) without gadolinium tracer. Pixel density is the number of pixels in the area of 0.0075 μt × 0.0075 μt.

Figure 10.
The bivariate histograms of the turbine blade (without gadolinium tracer) measured with different acquisition times.
Figure 10.
The bivariate histograms of the turbine blade (without gadolinium tracer) measured with different acquisition times.

Figure 11.
Thermal neutron flux at the detector’s position 10 m away from the photoneutron source, with the varied electron energies and beam powers.
Figure 11.
Thermal neutron flux at the detector’s position 10 m away from the photoneutron source, with the varied electron energies and beam powers.

Figure 12.
(a) the energy spectra of X-rays penetrating the lead layer of different thicknesses; (b) their average mass attenuation coefficients for different elements.
Figure 12.
(a) the energy spectra of X-rays penetrating the lead layer of different thicknesses; (b) their average mass attenuation coefficients for different elements.

Figure 13.
The measured spectra of neutrons penetrating different materials with the time-of-flight method. The corresponding reference spectra are also shown for the comparison.
Figure 13.
The measured spectra of neutrons penetrating different materials with the time-of-flight method. The corresponding reference spectra are also shown for the comparison.

Publisher’s Note: MDPI stays neutral with regard to jurisdictional claims in published maps and institutional affiliations. |
© 2021 by the authors. Licensee MDPI, Basel, Switzerland. This article is an open access article distributed under the terms and conditions of the Creative Commons Attribution (CC BY) license (https://creativecommons.org/licenses/by/4.0/).
Share and Cite
MDPI and ACS Style
Yu, Y.; Zhang, R.; Lu, L.; Yang, Y. The Bimodal Neutron and X-ray Imaging Driven by a Single Electron Linear Accelerator. Appl. Sci. 2021, 11, 6050. https://0-doi-org.brum.beds.ac.uk/10.3390/app11136050
AMA Style
Yu Y, Zhang R, Lu L, Yang Y. The Bimodal Neutron and X-ray Imaging Driven by a Single Electron Linear Accelerator. Applied Sciences. 2021; 11(13):6050. https://0-doi-org.brum.beds.ac.uk/10.3390/app11136050
Chicago/Turabian StyleYu, Yangyi, Ruiqin Zhang, Lu Lu, and Yigang Yang. 2021. "The Bimodal Neutron and X-ray Imaging Driven by a Single Electron Linear Accelerator" Applied Sciences 11, no. 13: 6050. https://0-doi-org.brum.beds.ac.uk/10.3390/app11136050
Note that from the first issue of 2016, this journal uses article numbers instead of page numbers. See further details here.