Article

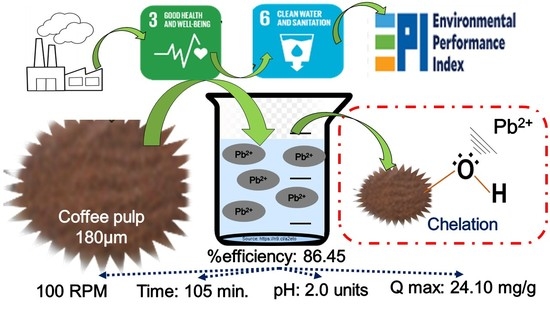
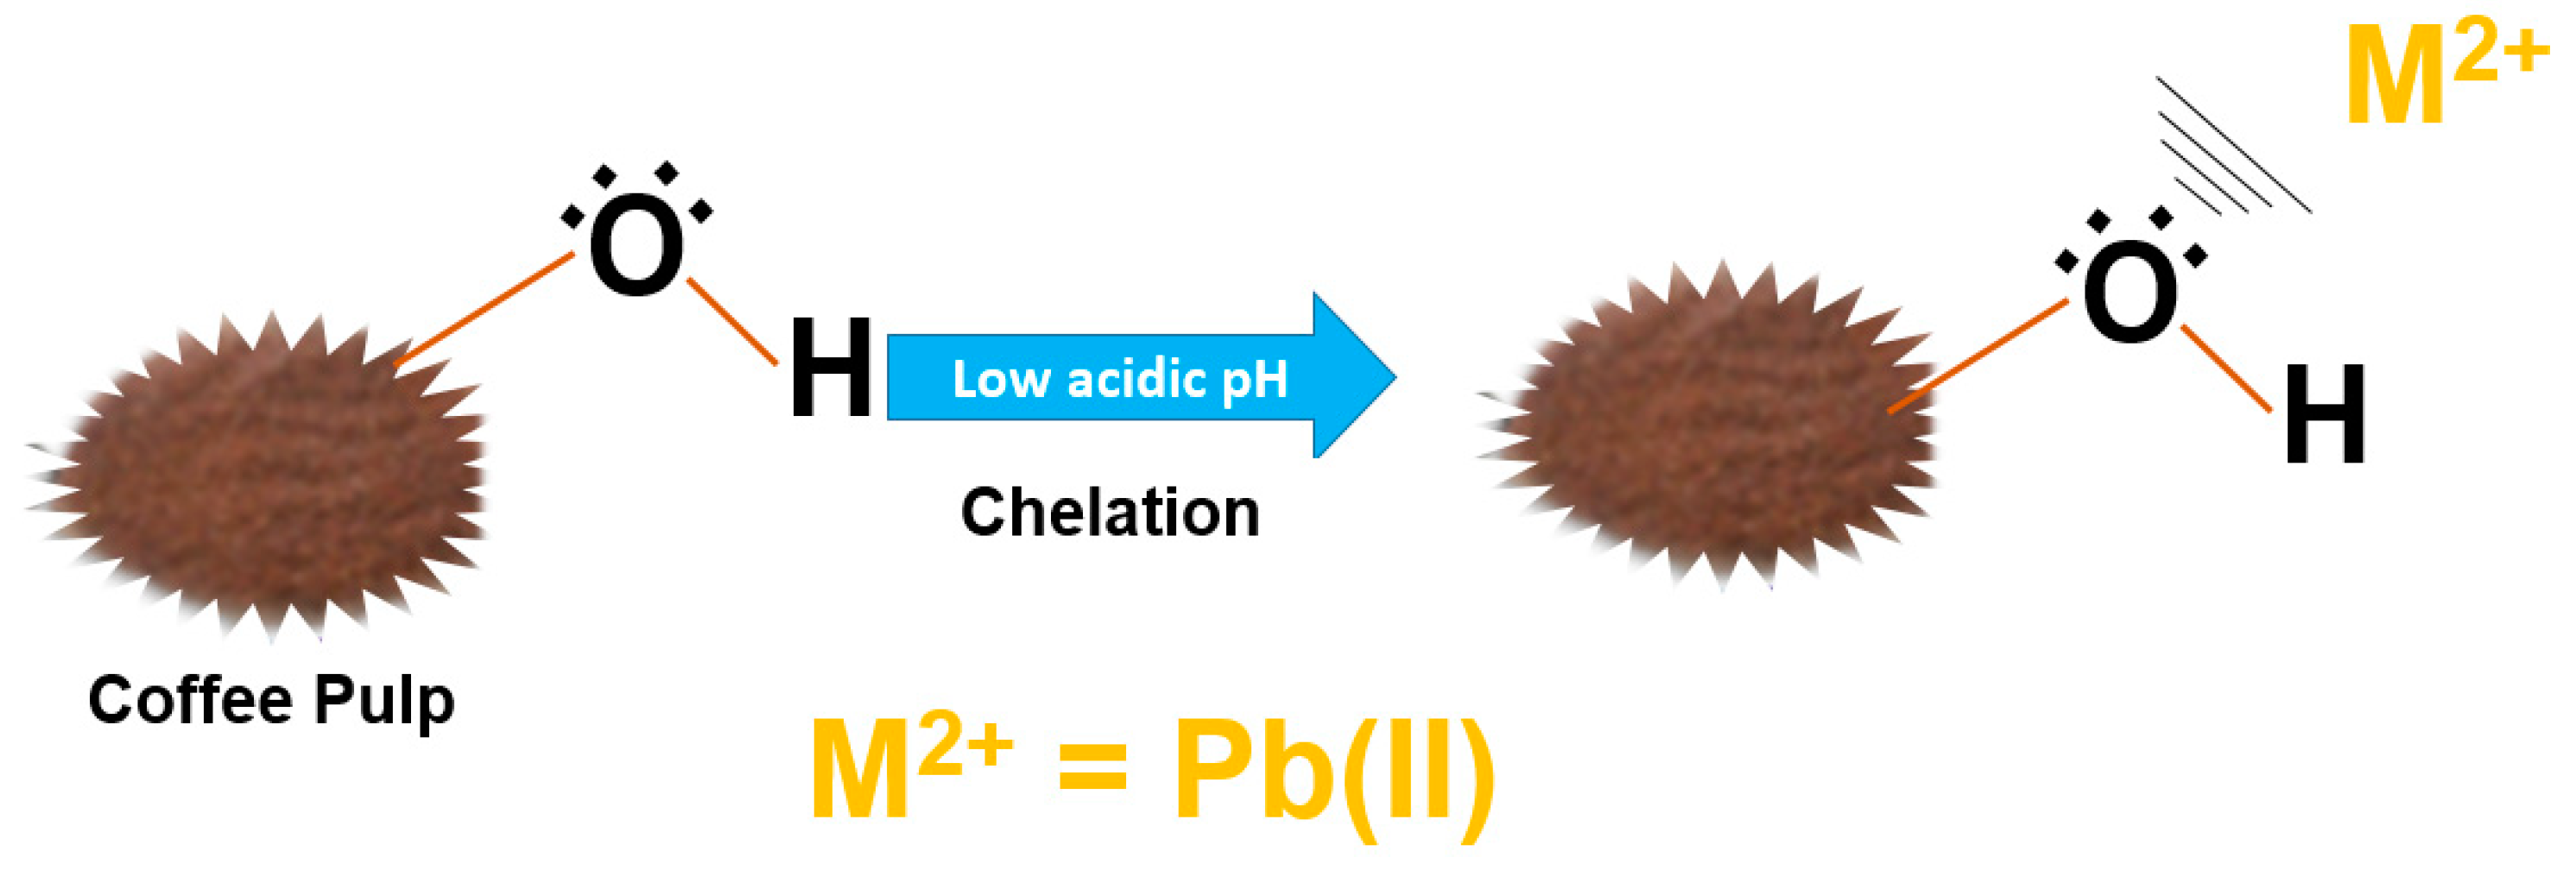
Biosorption of Pb(II) Using Coffee Pulp as a Sustainable Alternative for Wastewater Treatment

by
Dora Luz Gómez-Aguilar
1,*,
Juan Pablo Rodríguez-Miranda
2,
Deisy Baracaldo-Guzmán
1,
Octavio José Salcedo-Parra
3 and
Javier Andrés Esteban-Muñoz
1
1
Departamento de Química, Universidad Pedagógica Nacional, Bogotá 110231, Colombia
2
Facultad del Medio Ambiente y Recursos Naturales, Universidad Distrital Francisco José de Caldas, Bogotá 110231, Colombia
3
Facultad de Ingeniería, Universidad Distrital Francisco José de Caldas, Universidad Nacional de Colombia, Bogotá 110231, Colombia
*
Author to whom correspondence should be addressed.
Submission received: 17 May 2021 / Revised: 17 June 2021 / Accepted: 22 June 2021 / Published: 30 June 2021

Abstract

:
The present research shows the results obtained from the biosorption process of Pb, using coffee pulp as a biosorbent in synthetic waters. To do this, the lignin and cellulose content and the percentage of removal of Pb2+ ions was determined; additionally, the sorption’s optimal variables, such as the optimum pH, the point of zero charge (pHpzc), the kinetics and the adsorption isotherm, were determined. A comparison was made with other by-products derived from coffee crops. According to the results obtained in this research, the cellulose percentage was 29.12 ± 0.22% and the lignin percentage was 19.25 ± 0.16% in the coffee pulp, the optimum pH was 2.0 units and the kinetic model, which adjusted to the biosorption’s process, was the pseudo-second order of Ho and McKay, presenting an isotherm of Langmuir’s model and pHpzc of 3.95 units. Lastly, the removal of the pollutant was 86.45%, with a capacity of maximum adsorption of 24.10 mg·g−1 obtained with a particle size of 180 µm, time of contact of 105 min and at 100 RPM. Finally, we express that (a) the coffee pulp can be used as a sustainable alternative for the removal of the pollutant mentioned in synthetic and/or industrial wastewater matrices, to meet goals 3.9 and 6.9 of the Sustainable Development Goals of the 2030 agenda, and (b) the novelty of this research is the use of an agricultural waste of easy acquisition as a sorbent, without chemical modification, since it presented a high percentage of efficiency in the removal of Pb2+ ions. In turn, the challenge of this research is implementing this green technology on a pilot, semi-industrial and/or industrial scale in wastewater treatment systems.

Graphical Abstract

1. Introduction

Currently, heavy metals are considered as priority inorganic environmental pollutants, and these substances have become one of the most serious environmental problems that must be mitigated to protect humans and the environment [1]. There is a great need to reduce the pollutant load generated by these substances in water, soil and air, since they are not biodegradable and tend to bio-accumulate and bio-magnify in living organisms, they are highly toxic in cells, and in humans, they can be carcinogenic, mutagenic and teratogenic. Due to the above, heavy metals are present in the environmental policies of countries worldwide, with the purpose of improvement and meeting the Sustainable Development Goals (SDGs). As a contribution to this, Yale and Columbia Universities have formulated and divulged an Environmental Performance Index (EPI), which considers heavy metals as a category in its Environmental Health objective [2].
The EPI developed and published every two years by Yale and Columbia Universities—in collaboration with the World Economic Forum and the support of foundations such as McCall MacBain and Mark T. De Angelis—ranks 180 countries, considering 32 indicators and 11 environmental categories formulated until 2020, regarding two main objectives that go hand in hand with the SDGs: environmental health (with a weight of 40%) and ecosystem vitality (with a weight of 60%) [2]. This metric seeks to provide the countries with information about how close they are to the goals set out in their environmental policies, with the aim of improving them to become sustainable leaders. High scores, or close to 100, indicate commitments to protect public health, the preservation of natural resources and the reduction of the levels of emissions of greenhouse gasses (GHGs) from the different economic activities, while low values, or close to 0, are indicative of the need to make sustainability efforts, especially in the cleaning of air quality, the protection of biota and the reduction of GHGs [2]. EPI 2020 is based on the collection of data on 32 individual environmental performance metrics, with 11 problem categories: environmental health (air quality, sanitation and drinking water, heavy metals, solid waste management), and ecosystem vitality (biodiversity and habitat, ecosystem services, fisheries, climate change, pollutant emissions, water resources, agriculture). Likewise, the common scale assigned corresponds to 0 (indicating the worst performance) and 100 (indicating the best performance) [2].
In the case of heavy metals, the institutions mentioned previously consider the exposure to lead (Pb)—the metal of this research—in the Environmental Health objective, with a weight of 2% in the EPI. Wendling et al. [2] clarified that the selection of lead by the Yale and Columbia Universities team is due to the fact that this metal is the one that has been most studied by international organizations, such as the World Health Organization (WHO), and because Pb persists in several places in the world, it has led to a constant reduction in the pollution generated by it, as well as in the diseases that it produces. According to the Institute for Health Metrics and Evaluation, in 2015, Pb exposure accounted for nearly 0.5 million deaths and 9.3 million years of life lost (DALY) among adults aged 15 years and older, with higher incidence in developing regions [3]. It is one of the metals that most affects the child population and pregnant women [3,4]. At the environmental level, it can be found in air, dust, soil, water and in plants, due to the use of gasoline and emissions in industries that use it [3].
Figure 1 shows some countries, located by continent, according to their current position in relation to the lead exposure index score.
According to Figure 1, among the leaders in sustainability were countries on the European continent, such as Finland and Denmark, as opposed to countries on the Asian and African continents, such as Afghanistan, Sudan and Egypt, which were near the end of the ranking. Due to this aspect, the EPI requires the collection of data in the areas of water resources, sustainable agriculture, waste management, threats to biodiversity and heavy metals—different from lead—that are in the list of the thirteen mentioned by the WHO [2]. According to the high ratings and the positions assigned by the mentioned indicator, among the reasons that justify these ratings in countries such as Finland, Germany, Japan and Sweden, with a score close to or equal to 100, are that they had adequately managed pollution by this metal, which can be attributed to the progressive elimination of gasoline with lead since the 1970s, and to the strengthening of public health surveillance mechanisms, as well as policies for Pb waste incineration facilities in the late 1990s and the banning of paints containing this pollutant [5,6]. In contrast to the world leaders cited for this indicator, countries such as Egypt, Nepal, Honduras, India, Sudan, Bangladesh, Pakistan, Haiti and Afghanistan obtained the lowest ratings, because these countries are in the process of mitigating the Pb exposure and/or have very weak or even non-existent chemical safety standards and regulations, as well as detailed risk investigations or prevention strategies in response to lead poisoning [2].
It is noted that this highly toxic heavy metal (lead)—with atomic number 82, atomic density 11.35 g·mL−1, atomic mass 207.2 g·mol−1 and oxidation states 2+ and 4+—is the only metal that appears in the EPI, as previously mentioned, contemplating the global epidemiological studies of the Global Burden of Disease Study (GBD) Health Assessment, since it is considered one of the most important environmental threats to the health of pregnant women and children [2]. Landrigan et al. [3] claim that the WHO estimated in 2012 that lead was responsible for causing mental retardation of a mild to moderate degree in 0.6 million children per year, given that they can absorb four to five times more of this contaminant than adults, since the brain and the nervous system (NS) of children are more sensitive to the harmful effects of this contaminant [7]. In the case of pregnancy, Pb can be stored in the maternal bone, where it can mobilize into the bloodstream, transferring from the mother to the child. In addition, high levels of this metal can cause miscarriages, premature births and fetal malformations [8].
At the level of affectations in the bone system, Pb interferes with the function of calcium, hemoglobin synthesis and causes neurological damage, since it can persist for up to 20 years. Likewise, in the central nervous system (CNS), Pb generates paresthesia effects, pain and muscle weakness, and affects the kidneys with oliguria and albuminuria [9], while in the male reproductive system, it affects sperm motility. One of the most well-known diseases produced by the high concentration of this metal corresponds to plumblism, saturnism or lead poisoning, which can cause gastrointestinal symptoms, encephalopathy and renal failure [10]. Regarding industrial activities and the importance of this metal, Moreno and Granada [11] state that Pb is used in the manufacture of car batteries, gasoline additives, wire coating, production of pipes and cisterns, manufacture of pigments for paints and varnishes, manufacture of crystals, glazing of ceramics, welding of cans and in cosmetics, toys and antiseptics. On the other hand, the WHO classified Pb as one of the 13 heavy metals of importance for human and environmental health as well as arsenic (As), cadmium (Cd), cobalt (Co), chromium (Cr ), copper (Cu), mercury (Hg), manganese (Mn), nickel (Ni), lead (Pb), tin (Sn), selenium (Se), titanium (Ti) and zinc (Zn) [12].
Given these applications, use and discharge of wastewater with this metal, conventional and advanced techniques have been used for the treatment of untreated aqueous matrices, and among these are the use of chemical precipitation, activated carbon, ultrafiltration, microfiltration, cementation and ion exchange, among others [4,13]. However, although their efficiency is high, these techniques have disadvantages in terms of maintenance and implementation in wastewater treatment systems (WWTS), as well as considerable sludge production. Due to this, biosorption methods using agro-industrial wastes—with and without physical and/or chemical modification—for the treatment of wastewater that incorporate heavy metals such as those mentioned above, is a field that has been widely consolidated and investigated, and given their high efficiency, low cost of implementation and maintenance, these techniques are environmentally friendly and do not generate sludge [4].
It is also worth highlighting the valorization of coffee crop residues, which have been used for the production of biofuels (biodiesel, bioethanol, bio-hydrogen and biogas), glycerin, pharmaceutical products, biochar, compost, polymers and bio-active compounds [14]. Additionally, some coffee subprocesses were used for the removal of contaminants in aqueous matrices, such as Zn, Pb, Cr, Cu, Cr, Cd, dyes and anionic surfactants, among others [15]. On the other hand, it is important to note that, regarding the concentration of Pb in river sediments, for the case of Colombia, Espitia [16] conducted a characterization of heavy metals, Hg, Cd, Pb, Cr, Ni and Fe, in sediments from the water bodies of the Canal del Dique (artificial arm of the Magdalena River), finding that the concentrations of these pollutants are within the permitted limits. In the case of lead, in the surface sediments of the populations studied and the control point, they were not detected by the methodology used (detection limit = 1 μg·mL−1). Likewise, in Colombia, 10 determinations of heavy metals were carried out on the Sinú river and for Pb levels ranging between 10.10 and 8.08 μg·kg−1 in rainy and dry weather seasons [17]. In turn, in other countries, lead records have been found in Arctic Lakes, Canada (10.33 μg·kg−1), Thompson Canyon, USA (38–42 μg·kg−1), Lake Michigan and some European Rivers (50–712 μg·kg−1). In relation to other world records, there was a characterization carried out in 22 samples of the sediments of the Olt River, which is part of the Danube River basin, where based on the Pb analysis, levels between 1.74 and 49.63 mg·kg−1 were detected [18]. In addition, it is worth mentioning that the Canadian legislation reports a limit of 35 mg·kg−1 for sediments [19].
Given the panorama presented, in this research, we used the coffee pulp (CP) variety Castillo—taken from a coffee farm located in the city of Manizales (Colombia)—as a sustainable alternative in the biosorption of Pb2+ ions from synthetic wastewater. This was developed in two stages: the first was to perform the quantification of lignin and cellulose; in the second step, the optimal variables of sorption of the contaminant were identified, corresponding to contact time (min), the optimum adsorption pH, kinetics and adsorption isotherms, pHpzc, as well as the elucidation of a possible sorption’s mechanism. Finally, we made a comparison between residues from coffee crops that have been investigated in the removal of Pb2+ ions, with and without chemical modification. In view of this type of research, the challenge is that industries that discharge untreated industrial waters and incorporate this pollutant use biosorption technology with these types of agro-industrial wastes to prevent the discharge of Pb2+ ions into water sources and meet the current environmental regulations. Likewise, implementing this type of method as a pilot project with those industries that use this substance aims at contributing to environmental policies, which in turn are linked to the EPI. Additionally, it aims to comply with goals 3.9 (“reduce the number of diseases and deaths caused by soil, air and water pollution, by 2030”) [20] and 6.9 (“reduce untreated water discharges and improve water quality, by 2030”) [21] proposed in the SDGs of the 2030 agenda. One of the advantages of this research is the use of an agro-industrial waste to depurate untreated water, so that it is not disposed directly in soils, avoiding the production and emission of GHGs. In the case of the disadvantages, it is necessary to carry out studies of desorption, since if this is not done, the material would remain contaminated by this metal.
It should be mentioned that the desorption process is important since the lignocellulosic material used as a sorbent could be reusable and incorporated again into the removal cycle [22,23]. Additionally, 4% HCl, NaOH 0.1 N, HNO3 0.05–0.3 M [24,25], Ca(NO3)2 10 mM [26], EDTA 0.001–0.1 M and HCl 0.1–1 M [22] have been used to perform Pb desorption using sorbents such as corn husk, coffee pulp and grape pulp respectively.

2. Materials and Methods

2.1. Collection Site and Physical Treatment of the CP

The coffee pulp (CP), Castillo variety, was collected from the coffee farm “El Bosque”, Maracas, in the municipality of Manizales (Colombia): 2.0 kg of fresh sample was taken, which was dried at a temperature of 60 °C, and then ground with a Thomas–Wiley mill to a particle size of 180 µm [27,28].

2.2. Cellulose and Lignin Content in the CP

The ANSI (American National Standards Institute, Washington, DC, USA)/ASTM (American Society for Testing and Materials, West Conshohocken, PA, USA) techniques were used for the determination of the lignocellulosic content [29].

2.3. Quantification of Pb(II)

For the determination of the concentration of Pb(II) in synthetic wastewaters (SWWs), the reference method 3111 B of standard methods was used (Atomic Absorption Spectrophotometry (AAS), direct method of air-acetylene flame), with a VARIAN AA 140 kit, for which Pb(NO3)2 (analytical reagent) was used to perform the calibration curve. Deionized water was used for the tests and all tests were performed at room temperature.

2.4. Determination of the Optimum pH of Adsorption of Pb(II)

SWWs of 25 mL of Pb(II) with an initial concentration of 100 mg·L−1 were prepared with 0.500 g of coffee pulp [30,31], and the pH of these were adjusted to 1, 2, 3 and 4 units with HNO3 1 M in triplicate for each pH. We did not use higher pH values because Pb precipitated as Pb(OH)2 when alkalinizing [32]. These dissolutions were stirred for 105 min at 100 RPM and then filtered on Whatman No.1 qualitative filter paper with retention of 11 µm, to determine the final concentration. Subsequently, the free software XLSTAT by Addinsoft was used for the statistical analysis of the results found in this section.

2.5. Determination of the Adsorption Kinetics for Pb(II)

SWWs of 25 mL of Pb(II) were prepared at a concentration of 100 mg·L−1, adjusted to the optimum adsorption pH determined in Section 2.4 (pH 2.0), mass of 0.500 g of CP, stirred at 100 RPM, and then these were left at different contact times (5, 10, 15, 30, 45, 60, 60, 75, 90, 105 and 120 min) and filtered on Whatman No.1 qualitative filter paper with retention of 11 µm, to finally determine the final concentration.

2.6. Determination of the Adsorption Isotherm for Pb(II)

SWWs of 25 mL of Pb(II) were prepared at different concentrations (20, 50, 100, 150, 250 and 500 mg·L−1), adjusted to the optimum adsorption pH determined in Section 2.4 (pH 2.0), mass of 0.500 g of CP, with a stirring rate of 100 RPM, and these were left at the optimum adsorption time determined in Section 2.5 (105 min) and then filtered on Whatman No.1 qualitative filter paper, with retention of 11 µm, to determine the final concentration.

2.7. Determination of the Point of Zero Charge (pHpzc) in the CP

For this case, the methodology described by Gómez et al. [29] was used for the determination of the pHpzc in the CP. From this, an elucidation of the possible adsorption mechanism that could be occurring in the Pb(II) biosorption process was performed.
Note: The percentage of removal was calculated as:
% Removal = Initial   C Final   C Initial   C × 100

3. Results and Discussion

The results obtained for coffee pulp (CP) are presented according to the methodology described in Section 2.1, Section 2.2, Section 2.3, Section 2.4, Section 2.5, Section 2.6 and Section 2.7.

3.1. Lignocellulosic Content of the CP

Table 1 presents the results of the content of cellulose and lignin in the CP.
Table 1 shows the results obtained in the research on the quantification of lignin and cellulose in the CP. As it can be seen, the value of cellulose is higher than that of lignin, and these are within the bibliographic reports presented in the literature. Likewise, this parameter was performed in order to quantify the presence of lignin and cellulose in CP because these compounds are located on the outside of the cell wall of these wastes [39] (p. 5). These compounds have functional groups such as hydroxyl, methoxy and carbonyl [40]. These groups are characterized by interacting with the pollutant, allowing to carry out the removal of Pb2+ ions in wastewater, under optimal conditions (temperature, particle size, amount of biomass, pH, pHpzc, agitation time, initial concentration and volume).
Similarly, this is in agreement with Gómez et al. [29], in relation to the elucidation of the functional groups of coffee pulp using the analytical technique of infrared spectroscopy and the relationship between acidic and basic groups, where the former prevail over the latter. It is important to mention that coffee pulp contains a third polysaccharide known as hemicellulose, and the research carried out by Carvajal and Marulanda [23] reported a value of 2.3% for this compound. Likewise, McNutt and He [41] exposed a value of 39.10 ± 1.94 g of CP per dry matter. Finally, Cerino-Córdova et al. [15] reported a range of 5–10% for this compound.

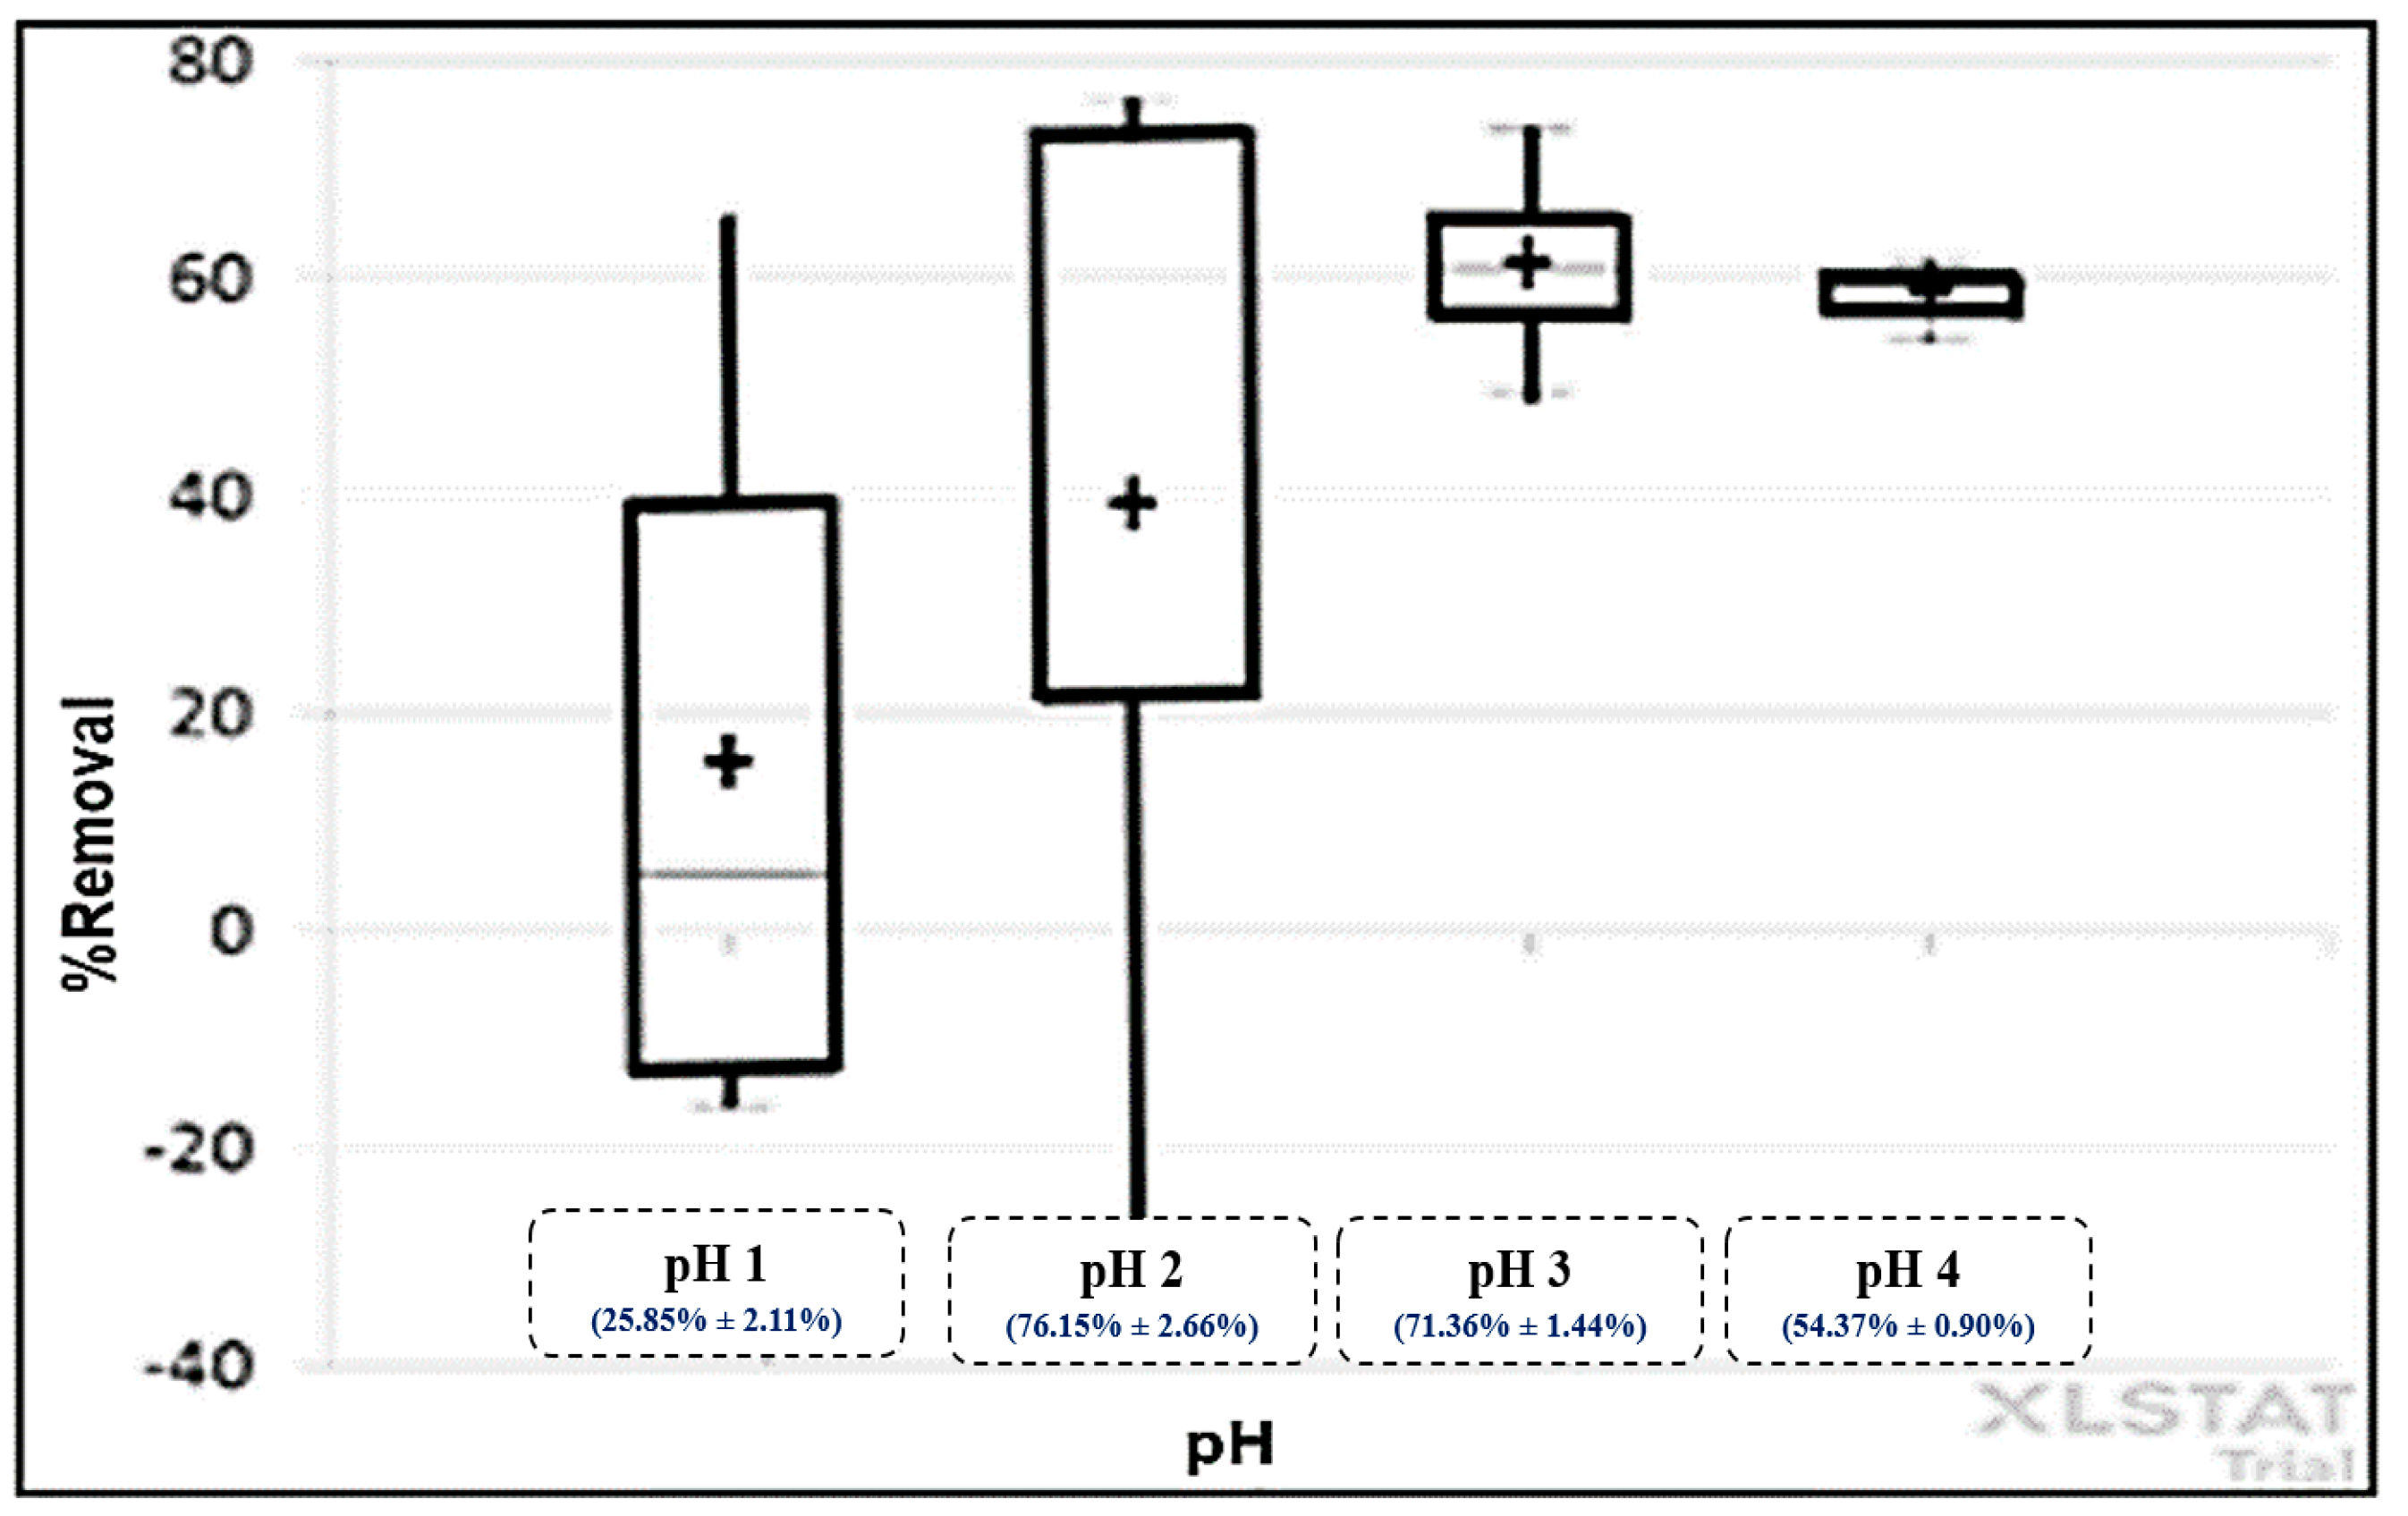
3.2. Determination of Optimum pH of Pb(II) with CP

The removal percentages that we obtained for each pH were: pH 1 (25.85 ± 2.11%), pH 2 (76.15 ± 2.66%), pH 3 (71.36 ± 1.44%) and pH 4 (54.37 ± 0.90%). The free software XLSTAT was used to obtain Figure 2 (boxplot). The optimum pH determined was 2.0 units, obtained with a size of 180 µm, 0.500 g of biomass (CP), room temperature, agitation for 60 min and 100 RPM.
According to Palomino et al. [32] and Stumm and Morgan (1996, cited in Moreno, 2007) [42], with respect to the optimum pH exposed, it should be clarified that the chemical species of lead found in aqueous solution corresponds to Pb(II) and to a pH higher than 8 units, and based on the Pourbaix diagram, lead precipitates as Pb(OH)2.

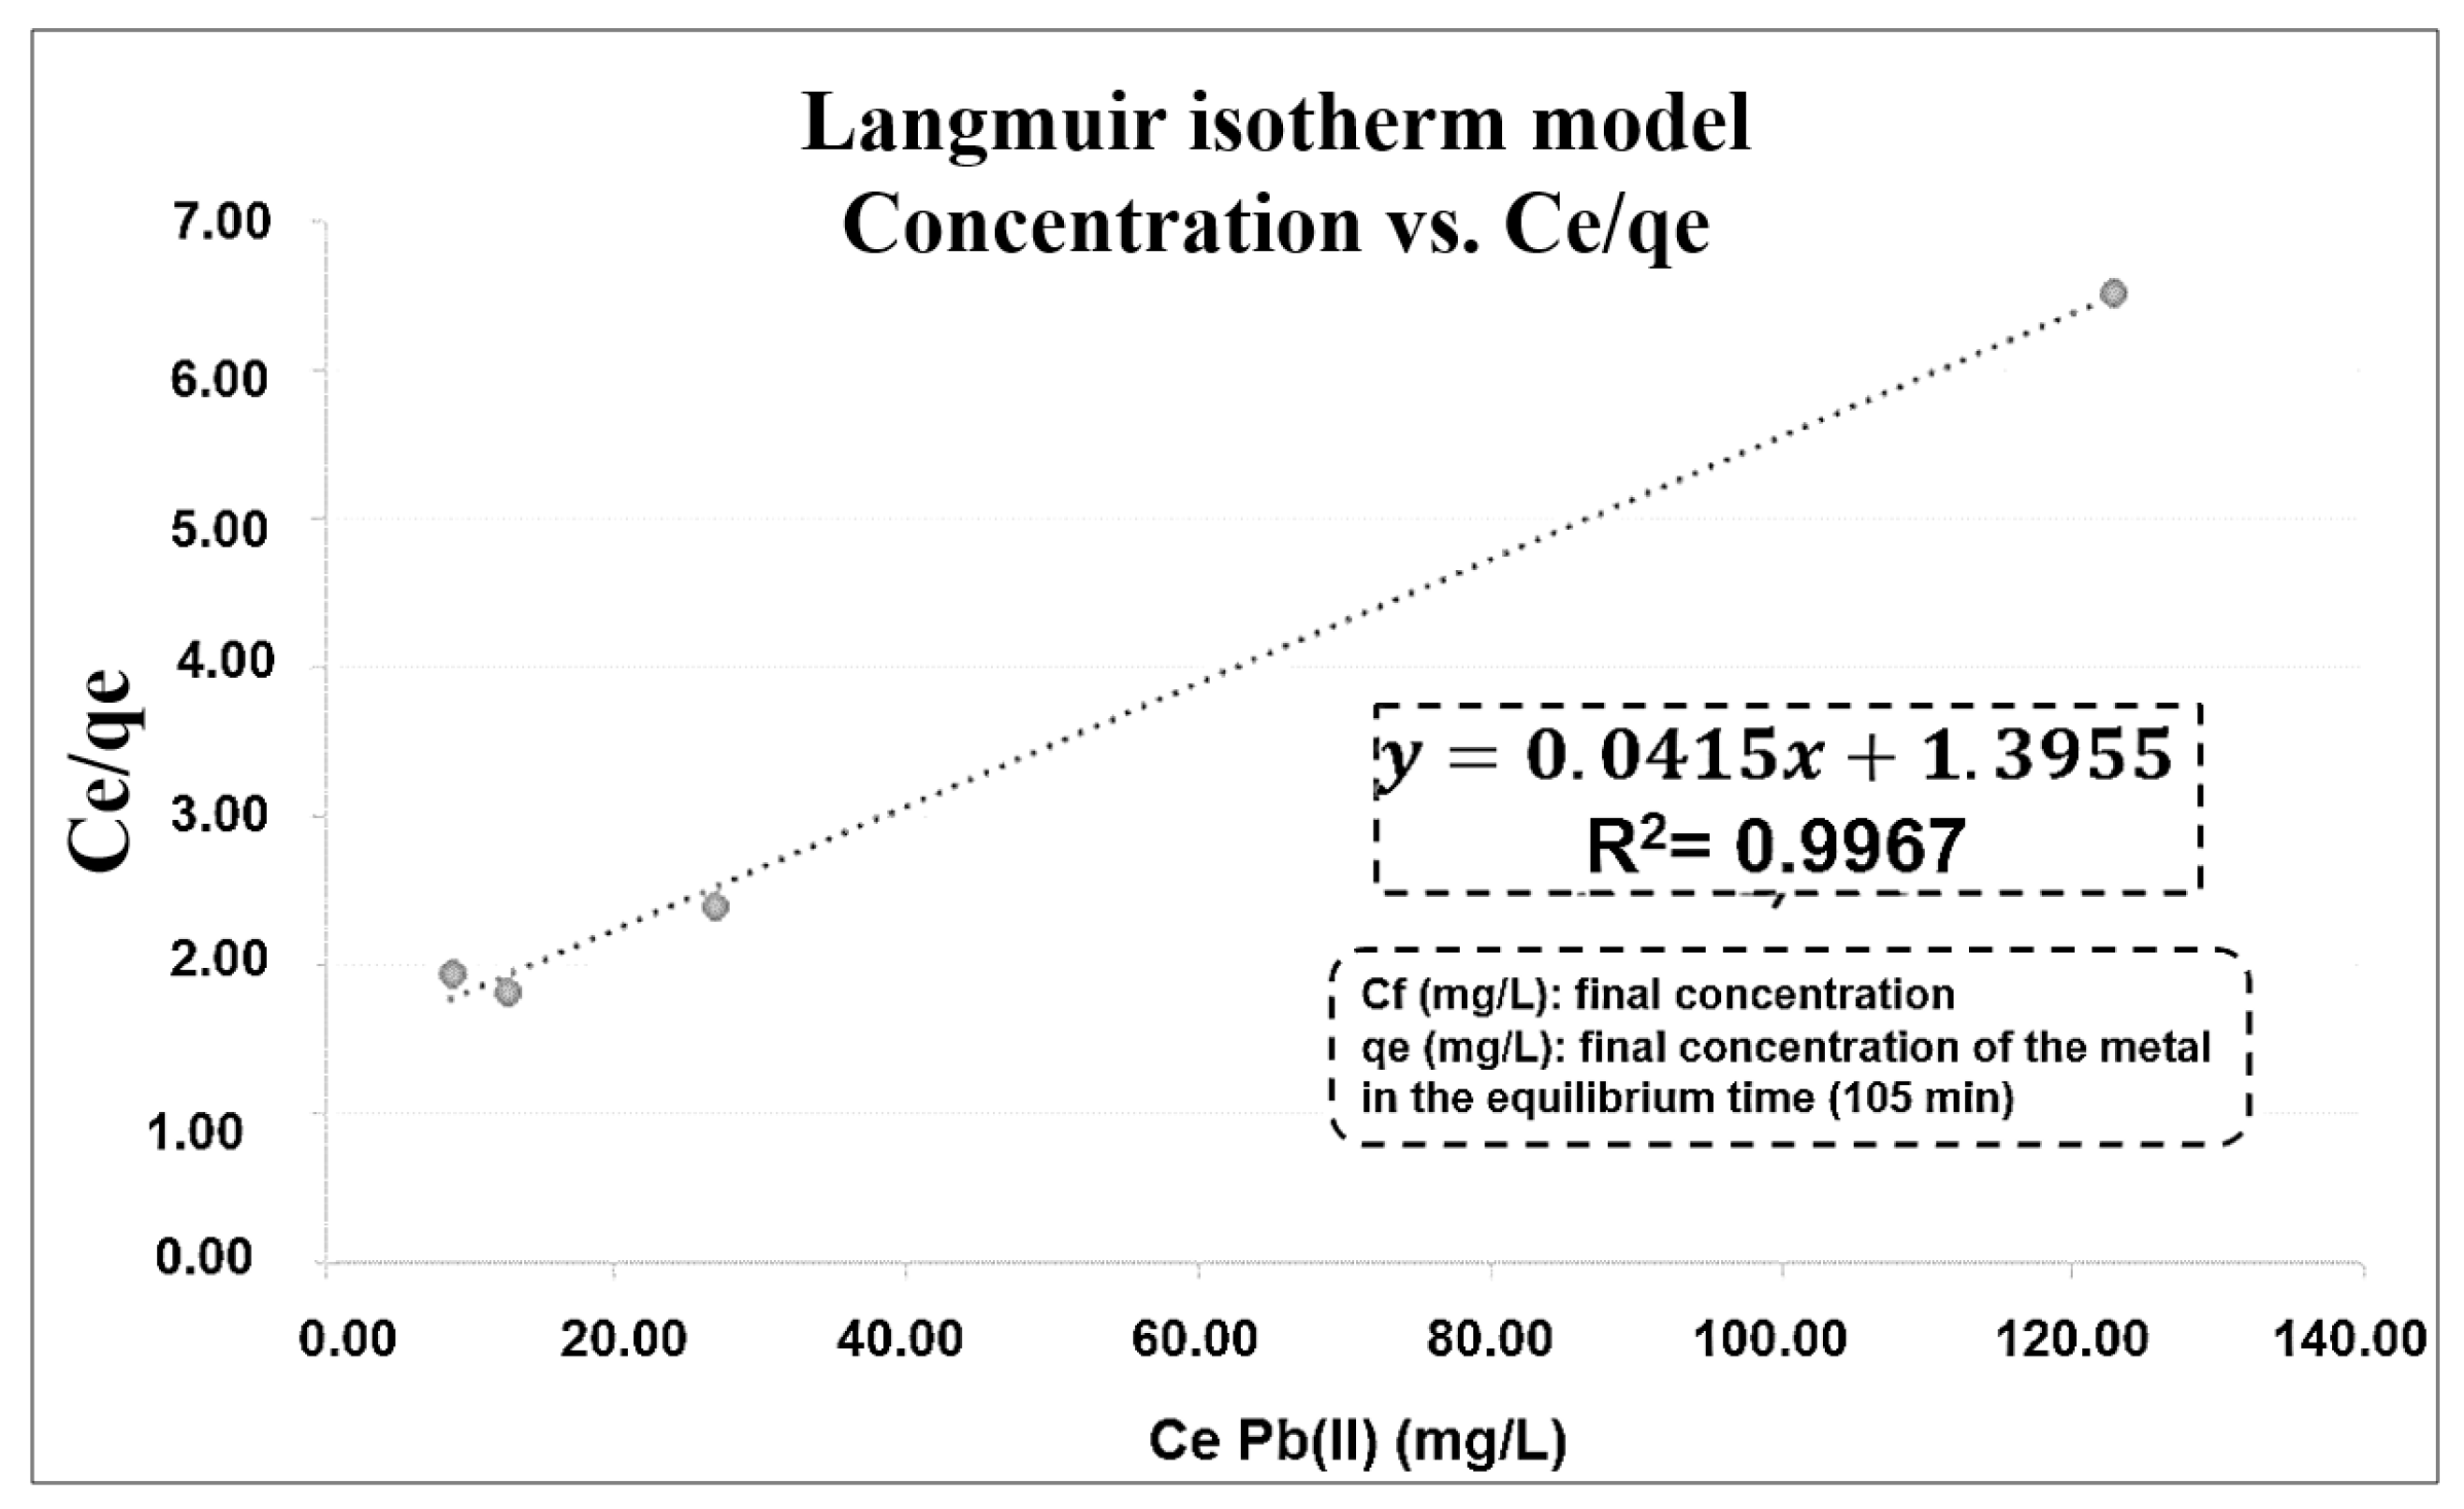
3.3. Kinetics and Adsorption Isotherm

According to the kinetics models applied to the Pb(II) biosorption process (see Table 2), the best fit was the pseudo-second order model of Ho and McKay, with an equilibrium time of 105 min and a removal percentage of 86.45%, under the optimum conditions described in Section 3.2 (see Figure 3).
Table 3 shows that the isotherm model that best fitted to the sorption of Pb(II) was the Langmuir’s model (it was obtained applying d q d t = K   ( q e q t ) 2 ), allowing to establish three hypotheses for the sorption phenomenon according to Cooney (1998) and Do (1998), both cited in Moreno [42]: (a) the first one indicates that the sorption of the Pb(II) pollutant occurs only on specific active sites—functional groups exposed in Section 3.1—located on the CP surface, (b) the second states that each metal adsorbs only on each active site (c) and the third assumption suggests that there is no interaction between adjacent adsorbed metals on the CP surface.
For the sorption isotherm obtained (see Figure 4) under the conditions described earlier, the CP presented a capacity of maximum adsorption of 24.10 mg·g−1 for this metal without chemical modification. In relation to this value, we performed a bibliographic review to carry out a comparative analysis with wastes derived from crops of coffee (modified and not chemically modified) based on the capacity of maximum adsorption for the removal of Pb(II). In Table 4 and Table 5, the respectively consolidated values are reported.
Table 4 presents the capacities of maximum adsorption of coffee wastes without chemical modification, while Table 5 reports this parameter but with chemical modification, where citric acid and pyrolysis methods were used. For each one, an interval was proposed which was carried out taking into account the lower value with respect to the upper value of those reported by the cited references for the same waste, and it was found that the value of the present research, in relation to the coffee beans, was below the exposed range, unlike raw coffee beans and coffee husk/pulp, that were in the range of unmodified residues.
Similarly, when carrying out the same comparative analysis, but with chemically modified coffee residues, the value presented in this study was below the minimum value of the range. It should be added that the objective of carrying out a chemical modification of a sorbent is performed in order to increase the active sites (functional groups) on its surface and thus augment the removal of the contaminant in the aqueous solution and its capacity of maximum adsorption.
Additionally, Gómez et al. [4] presented some non-conventional technologies used for the removal of Pb2+ in aqueous matrices in the years 2010–2019, among which the use of biopolymers, bio-remediation techniques (algae, fungi, yeasts and bacteria) and agro-industrial wastes were highlighted. Within the aforementioned techniques, the percentage of efficiency ranged between 80% and 100% for the removal of this metal ion, with the exception that agricultural wastes showed a higher efficiency compared to the others, including guava seeds and melon peels with maximum adsorption capacities of approximately 96 mg·g−1.

3.4. Determination of Point of Zero Charge (pHpzc) for the CP

From Table 6, it is established that the optimum pH is lower than pHpzc, leading to the conclusion that the sorbent surface is positively charged. This implies that there are no electrostatic interactions between the contaminant and the sorbent. To explain this sorption phenomenon, possibly, the chelation is present between the hydroxyl groups coming from the lignin and cellulose and the cationic species [54]. Given this, the possible mechanism of sorption is illustrated in Figure 5.

3.5. Techno-Economics Aspects and Future Research

Regarding the techno-economic aspects [55] of a possible implementation of biosorption technology using coffee pulp as a sorbent for Pb2+ ions in wastewater at the pilot scale, Figure 6 shows a proposal for the stages and inputs involved in this process.
Finally, it is expressed that future research should be related to the desorption processes of coffee pulp, without and with physical and chemical modification, used for the removal of Pb2+ ions, and additionally, in the implementation of the sorbent in industrial aqueous matrices and the number of reuse cycles and selectivity in synthetic and real multi-metallic aqueous systems.

4. Conclusions

At the level of adsorption parameters, this research concluded that the optimum pH for the removal of Pb(II) with coffee pulp was 2.0 units, and the kinetic adsorption model that adjusted the most was the pseudo-second order model of Ho and McKay, with a Langmuir isotherm and pHpzc of 3.95 units. The removal of Pb2+ ions with the coffee pulp was 86.45%, and the capacity of maximum adsorption was 24.10 mg·g−1 using a particle size of 180 µm, and a contact time of 105 min at 100 RPM at room temperature in synthetic wastewater.
Finally, we expressed that coffee pulp can be used as a sustainable alternative for the removal of lead in synthetic and real wastewater, which would contribute to achieving goal 3.9 of Goal 3 “Health and Well-being” and goal 6.9 of Goal 6 “Clean Water and Sanitation” of the SDGs of the 2030 agenda. Coffee pulp can also be used to remove other inorganic pollutants that have a high environmental impact on the ecosystem.

Author Contributions

Performed the experimental methodology, systematization, and analytical treatment of the experimental data obtained, D.L.G.-A.; guided the research conducted, J.P.R.-M., D.B.-G., and O.J.S.-P.; drafted the manuscript, J.A.E.-M. and D.L.G.-A.; translated the article and reviewed the writing and citation of the bibliographic references, J.P.R.-M., D.B.-G., and O.J.S.-P. All authors have read and agreed to the published version of the manuscript.

Funding

This research received no external funding.

Institutional Review Board Statement

Not applicable.

Informed Consent Statement

Not applicable.

Data Availability Statement

Not applicable.

Acknowledgments

We thank Crispin Celis (head of the chemistry department) and Oscar Rodríguez (Pontificia Universidad Javeriana) for all the support and encouragement they gave us during the time we spent undertaking this research work.

Conflicts of Interest

The authors declare no conflict of interest.

References

  1. Fu, F.; Wang, Q. Removal of heavy metal ions from wastewaters: A review. J. Environ. Manag. 2011, 92, 407–418. [Google Scholar] [CrossRef]
  2. Wendling, Z.A.; Emerson, J.W.; Esty, D.C.; Levy, M.A.; de Sherbinin, A.; Esty, D.; Hoving, K.; Ospina, C.; Murray, J.; Jacob, M.; et al. Report 2020-EPI for Heavy Metals. 2020. Available online: https://epi.yale.edu/downloads/epi2020report20210112.pdf (accessed on 10 July 2019).
  3. Landrigan, P.J.; Fuller, R.; Acosta, N.J.R.; Adeyi, O.; Arnold, R.; Basu, N.; Baldé, A.B.; Bertollini, R.; Bose-O’Reilly, S.; Boufford, J.I.; et al. The Lancet Commission on pollution and health. Lancet 2017, 391, 462–512. [Google Scholar] [CrossRef] [Green Version]
  4. Gómez Aguilar, D.L.; Esteban Muñoz, J.A.; Baracaldo Guzmán, D. Tecnologías no convencionales para la remoción de plomo presente en aguas residuales: Una revisión bibliográfica 2010–2019. Tecnura 2020, 24, 97–116. [Google Scholar] [CrossRef]
  5. Yoshinaga, J. Lead in the Japanese living environment. Environ. Health Prev. Med. 2012, 17, 433–443. [Google Scholar] [CrossRef] [PubMed] [Green Version]
  6. Gottesfeld, P. Time to Ban Lead in Industrial Paints and Coatings. Front. Public Health 2015, 3, 144. [Google Scholar] [CrossRef] [Green Version]
  7. Meyer, P.A.; Brown, M.J.; Falk, H. Global approach to reducing lead exposure and poisoning. Mutat. Res. 2008, 659, 166–175. [Google Scholar] [CrossRef]
  8. World Health Organization. Fact Sheet: Lead Poisoning and Health. 2017. Available online: http://www.who.int/mediacentre/factsheets/fs379/en/ (accessed on 10 July 2019).
  9. Londoño Franco, L.F.; Londoño Munoz, P.T.; Muñoz Garcia, F.G. Los riesgos de los metales pesados en la salud humana y animal. Biotechnol. Sec. Agropecu. Agroind. 2016, 14, 145–153. [Google Scholar] [CrossRef]
  10. Valdivia, M.M. Intoxicación por plomo. Rev. Soc. Per. Med. Interna 2005, 18, 22–27. [Google Scholar]
  11. Moreno, A.; Granada, J. Intoxicación por Plomo: Diagnóstico Diferencial de Dolor Abdominal Crónico. Reporte de Caso y Revisión de Tema. Univ. Med. 2012, 53, 199–207. Available online: http://www.redalyc.org/resumen.oa?id=231024382008 (accessed on 19 July 2019). [CrossRef]
  12. World Health Organization (WHO). Adverse Health Effects of Heavy Metals in Children. 2011. Available online: https://www.who.int/ceh/capacity/heavy_metals.pdf (accessed on 10 July 2019).
  13. Caviedes Rubio, D.I.; Muñoz Calderón, R.A.; Perdomo Gualtero, A.; Rodríguez Acosta, D.; Sandoval Rojas, I.J. Tratamientos para la remoción de metales pesados comúnmente presentes en aguas residuales industriales. Una Revisión. Ing. Reg. 2015, 13, 73–90. [Google Scholar] [CrossRef]
  14. Atabani, A.E.; Al-Muhtaseb, A.H.; Kumar, G.; Saratale, G.D.; Aslam, M.; Khan, H.A.; Said, Z.; Mahmoud, E. Valorization of spent coffee grounds into biofuels and value-added products: Pathway towards integrated bio-refinery. Fuel 2019, 254, 115640. [Google Scholar] [CrossRef]
  15. Cerino-Córdova, F.; Dávila-Guzmán, N.; García León, A.; Salazar-Rabago, J.; Soto-Regalado, E. Revalorization of Coffee Waste. In Coffee—Production and Research; Castanheira, D.T., Ed.; IntechOpen: London, UK, 2020; Available online: https://www.intechopen.com/books/coffee-production-and-research/revalorization-of-coffee-waste (accessed on 14 June 2021).
  16. Espitia, N. Determinación de metales pesados en sedimentos superficiales en cuerpos de agua del canal del dique en las poblaciones de Gambote y Soplaviento (Bolívar). Rev. Inst. Investig. Fac. Ing. Geo. Min. Metal. Geo. 2014, 17. [Google Scholar] [CrossRef]
  17. John Jairo, F.; José Luis, M.; Humberto, G. Heavy Metals in Sinú River, Department of Córdoba, Colombia, South America. Rev. Fac. Ing. Univ. Antioq. 2010, 55, 35–44. Available online: http://www.scielo.org.co/pdf/rfiua/n55/n55a04.pdf (accessed on 19 July 2019).
  18. Iordache, M.; Iordache, A.M.; Sandru, C.; Voica, C.; Zgavarogea, R.; Miricioiu, M.G.; Ionete, R.E. Assessment of Heavy Metals Pollution in Sediments from Reservoirs of the Olt River as Tool for Environmental Risk Management. Rev. Chim. 2019, 70, 4153–4162. Available online: https://revistadechimie.ro/pdf/5%20IORDACHE%20M%2012%2019.pdf (accessed on 19 July 2019).
  19. Quintero Rendón, L.A.; Agudelo, E.A.; Quintana Hernández, Y.A.; Cardona Gallo, S.A.; Osorio Arias, A.F. Determinación de Indicadores Para la Calidad de Agua, Sedimentos y Suelos, Marinos y Costeros en Puertos Colombianos. Gest. Ambiente 2010, 13, 51–64. Available online: https://revistas.unal.edu.co/index.php/gestion/article/view/25414 (accessed on 19 July 2019).
  20. United Nations (UN). Goal 3: Ensure a Healthy Life and Promote Well-Being for All People at All Ages. 2017. Available online: https://www.un.org/sustainabledevelopment/es/health/ (accessed on 19 July 2019).
  21. United Nations (UN). Goal 6: Ensure Water Availability, Sustainable Management and Sanitation for All. 2017. Available online: https://www.un.org/sustainabledevelopment/es/water-and-sanitation/ (accessed on 10 July 2019).
  22. Hidalgo, S. Reutilización de Residuos de Rapa Para la Eliminación de Metales Tóxicos en Efluentes Líquidos. 2004. Available online: https://upcommons.upc.edu/handle/2099.1/3673 (accessed on 14 June 2021).
  23. Carvajal-Flórez, E.; Marulanda-Giraldo, L. Uso de residuos de café como biosorbente para la remoción de metales pesados en aguas residuales. Ing. USBMed 2020, 11, 44–55. [Google Scholar] [CrossRef]
  24. Pintado, K. Comparación de la Biosorción y Desorción de Metales Pesados Mediante el uso de Marlo de Maíz (Zea mays) en Aguas Contaminadas. Ph.D. Thesis, Universidad Politécnica Salesiana, Cuenca, Ecuador, 2018. Available online: https://dspace.ups.edu.ec/bitstream/123456789/16226/1/UPS-CT007883.pdf (accessed on 19 July 2019).
  25. Oré Jiménez, F.; Lavado Meza, C.; Bendezú Montes, S. Biosorción de Pb (II) de Aguas Residuales de Mina Usando el Marlo de Maíz (Zea mays). Rev. Soc. Quim. Peru 2015, 81, 122–134. Available online: http://www.scielo.org.pe/pdf/rsqp/v81n2/a05v81n2.pdf (accessed on 19 July 2019). [CrossRef]
  26. Duarte Zaragoza, V.M.; Carrillo, R.; Gutiérrez Castorena, C.M. Lead sorption–desorption from organic residues. Environ Technol. 2011, 32, 353–361. [Google Scholar] [CrossRef] [PubMed]
  27. Shafiq, M.; Alazaba, A.; Amin, M. Removal of Heavy Metals from Wastewater using Date Palm as a Biosorbent: A Comparative Review. Sains Malays. 2018, 47, 35–49. [Google Scholar] [CrossRef]
  28. Acosta, I.; Sandoval, P.; Bautista, D.; Hernández, N.; Cárdenas, J.; Martínez, V. Bioadsorción de cromo (VI) por la cáscara de Mamey (Mammea americana L.). Av. Cienc. Ing. 2012, 3, 1–9. [Google Scholar] [CrossRef] [Green Version]
  29. Gómez Aguilar, D.L.; Rodríguez Miranda, J.P.; Esteban Muñoz, J.A.; Betancur, P.; Fredy, J. Coffee Pulp: A Sustainable Alternative Removal of Cr (VI) in Wastewaters. Process 2019, 7, 403. [Google Scholar] [CrossRef] [Green Version]
  30. Ahmed, H. Removal of heavy metals from wastewater using agricultural and industrial wastes as adsorbents. HBRC J. 2013, 9, 276–282. [Google Scholar]
  31. Anastopoulos, I.; Karamesouti, M.; Mitropoulos, A.C.; Kyzas, G.Z. A review for coffee adsorbents. J. Mol. Liq. 2016, 229, 555–565. [Google Scholar] [CrossRef]
  32. Palomino, C.C.; Vargas Parker, R.; Visitación Figueroa, L. Aprovechamiento de pelos de vacuno del proceso de pelambre enzimático de las curtiembres en la remoción de plomo. Rev. Soc. Quim. Peru 2016, 82, 183–195. [Google Scholar] [CrossRef] [Green Version]
  33. ASTM International. ANSI/ASTM D1106-56: Standard Test Method for Acid-Insoluble Lignin in Wood; ASTM International (ASTM): West Conshohocken, PA, USA, 2001. [Google Scholar]
  34. Salmones, D.; Mata, G.; Waliszewski, K. Comparative culturing of spp. on coffee pulp and wheat straw: Biomass production and substrate biodegradation. Bioresour. Technol. 2005, 96, 537–544. [Google Scholar] [CrossRef]
  35. Menezes, E.G.T.; do Carmo, J.R.; Alves, J.G.L.F.; Menezes, A.G.T.; Guimarães, I.C.; Queiroz, F.; Pimenta, C.J. Optimization of alkaline pretreatment of coffee pulp for production of bioethanol. Biotechnol. Prog. 2014, 30, 451–462. [Google Scholar] [CrossRef]
  36. Juliastuti, S.R.; Widjaja, T.; Altway, A.; Sari, V.A.; Arista, D.; Iswanto, T. The effects of microorganism on coffee pulp pretreatment as a source of biogas production. MATEC Web Conf. 2018, 156, 2–10. [Google Scholar] [CrossRef]
  37. Phuong, D.V.; Quoc, L.P.T.; Tan, P.V.; Duy, L.N.D. Production of bioethanol from Robusta coffee pulp (Coffea robusta L.) in Vietnam. Foods Raw Mater. 2019, 7, 10–17. [Google Scholar] [CrossRef]
  38. ASTM International. ANSI/ASTM D1103-60: Method of Test for Alpha-Cellulose in Wood; ASTM International (ASTM): West Conshohocken, PA, USA, 1960. [Google Scholar]
  39. Yazán, D. Descomposición Microbiológica de Desechos Orgánicos Vegetales Originados en la Universidad Central del Ecuador. Bachelor’s Thesis, Universidad Central del Ecuador, Quito, Ecuador, 2013. Available online: http://www.dspace.uce.edu.ec/bitstream/25000/2122/1/T-UCE-0017-49.pdf (accessed on 19 July 2019).
  40. Gómez, D. Remoción de Manganeso en Aguas Residuales Industriales, Empleando Pulpa de Café; Resumen de Presentación Oral, 33° Congreso Latinoamericano de Química (CLAQ), X Congreso de Ciencias Químicas, Tec-nología e Innovación; Químicuba: Manizales, Colombia, 2018; Available online: https://drive.google.com/file/d/1tQHEi__y16Q-vPaCl4cXERVWVVNFGZlZ/view (accessed on 19 July 2019).
  41. McNutt, J.; He, Q. Spent coffee grounds: A review on current utilization. J. Ind. Eng. Chem. 2019, 71, 78–88. [Google Scholar] [CrossRef]
  42. Moreno, J. Importancia y Aplicaciones de la Adsorción en Fase Líquida. In Sólidos Porosos; Universidad de los Andes: Bogotá, Colombia, 2007; pp. 155–207. [Google Scholar]
  43. Ayawei, N.; Ebelegi, A.N.; Wankasi, D. Modelling and Interpretation of Adsorption Isotherms. J. Chem. 2017, 2007, 3039817. [Google Scholar] [CrossRef]
  44. Dávila-Guzmán, N.E.; Cerino-Córdova, F.; Soto-Regalado, E.; Rangel-Méndez, J.R.; Díaz-Flores, P.E.; Garza-González, M.T.; Loredo-Medrano, J.A. Copper Biosorption by Spent Coffee Ground: Equilibrium, Kinetics, and Mechanism. J. Clean Soil Air Water 2013, 41, 557–564. [Google Scholar] [CrossRef]
  45. Cerino-Córdova, F.J.; Díaz-Flores, P.E.; García-Reyes, R.B.; Soto-Regalado, E.; Gómez-González, R.; Garza-González, M.T.; Bustamante-Alcántara, E. Biosorption of Cu (II) and Pb (II) from aqueous solutions by chemically modified spent coffee grains. Int. J. Environ. Sci. Technol. 2013, 10, 611–622. [Google Scholar] [CrossRef] [Green Version]
  46. Bustamante, E. Adsorción de Metales Pesados en Residuos de Café Modificados Químicamente. Universidad Autónoma de Nuevo León, 2011. Available online: http://eprints.uanl.mx/2323/1/1080223849.pdf (accessed on 10 July 2019).
  47. Wu, C.H.; Kuo, C.Y.; Guan, S.S. Adsorption kinetics of lead and zinc ions by coffee residues. Pol. J. Environ. Stud. 2016, 24, 761–767. [Google Scholar] [CrossRef]
  48. Papa, E.F. Batch and Fixed Bed Column Studies on Cadmium (I) and Lead (II) Adsorption from Aqueous Solution by Coffee Pulp Biochar. In Proceedings of the 5th International Conference on Civil, Architecture, Environment and Waste Management (CAEWM-17), Singapore, 29–30 March 2017; pp. 284–289. [Google Scholar]
  49. Alhogbi, B.G. Potential of coffee husk biomass waste for the adsorption of Pb (II) ion from aqueous solutions. Sustain. Chem. Pharm. 2017, 6, 21–25. [Google Scholar] [CrossRef]
  50. Barón, L.J. Evaluación de la Cascarilla de Café Como Material Adsorbente Para la Remoción de Iones Plomo Pb2+ Presente en Soluciones Acuosas. 2014. Available online: http://repository.unilibre.edu.co/bitstream/handle/10901/11234/ (accessed on 10 July 2019).
  51. Naga, A.; Reddy, D.S.; Kumar, G.S.; Ravindhranath, K.; Krishna Mohan, G.V. Removal of lead and fluoride from contaminated water using exhausted coffee grounds based bio-sorbent. J. Environ. Manag. 2018, 218, 602–612. [Google Scholar] [CrossRef] [PubMed]
  52. Gómez-González, R.; Cerino-Córdova, F.J.; García-León, A.M.; Soto-Regalado, E.; Dávila-Guzmán, N.E.; Salazar-Rabago, J.J. Lead biosorption onto coffee grounds: Comparative analysis of several optimization techniques using equilibrium adsorption models and ANN. J. Taiwan Inst. Chem. Eng. 2016, 68, 201–210. [Google Scholar] [CrossRef]
  53. Seniūnaitė, J.; Vaiškūnaitė, R.; Bolutienė, V. Coffee grounds as an adsorbent for copper and lead removal from aqueous solutions. In Proceedings of the 9th International Conference “Environmental Engineering”, Vilnius, Lithuania, 22–23 May 2014; pp. 1–6. [Google Scholar] [CrossRef]
  54. Sutirman, Z.A.; Sanagi, M.M.; Abd, K.; Wan, W.; Jume, B. Equilibrium, Kinetic and Mechanism Studies of Cu(II) and Cd(II) Ions Adsorption by Modified Chitosan Beads. Int. J. Biol. Macromol. 2018, 116, 255–263. [Google Scholar] [CrossRef]
  55. Thomassen, G.; Van Dael, M.; Van Passel, S.; You, F. How to assess the potential of emerging green technologies? Towards a prospective environmental and techno-economic assessment framework. Green Chem. 2019, 21, 4868–4886. [Google Scholar] [CrossRef]
Figure 1. Environmental Performance Index (EPI) for Pb exposure in the category of heavy metals within the environmental health objective [2]. (Measure of lead exposure using age-standardized number of disability-adjusted life years (DALY) lost per 100,000 people due to this risk. Data on DALY rates of lead exposure come from the Health Metrics Institute and Assessment of the Global Burden of Disease Study (GBD), which is the most comprehensive global epidemiological study of lead exposure to date.)
Applsci 11 06066 g001
Figure 2. Boxplot of optimum pH for removal of Pb(II) with CP obtained with XLSTAT software.
Applsci 11 06066 g002
Figure 3. Adsorption kinetics for Pb(II) with CP.
Applsci 11 06066 g003
Figure 4. Adsorption isotherm for Pb(II) with CP.
Applsci 11 06066 g004
Figure 5. Adsorption mechanism of Pb(II) sorption with CP proposed by the authors based on Sutirman [54].
Applsci 11 06066 g005
Figure 6. Stages and inputs involved in the Pb biosorption process in wastewater at the pilot scale.
Applsci 11 06066 g006
Table 1. Lignin and cellulose content in CP.
ParameterValue of This Research
n = 3
Method UsedBibliographic Report and ReferenceInterval
Lignin
(%m/m)
19.25 ± 0.16ANSI/ASTM D1106-56
[33]
25–26 [34]5.21–26
23.8–17.4 [35]
5.21 [36]
9.0–22.0 [37]
Cellulose
(%m/m)
29.93 ± 0.21ANSI/ASTM D1103-60
[38]
23–24.5 [34]13–57.9
18–13 [35]
57.9 [36]
16.0–25.88 [37]
Table 2. Kinetic models applied to the biosorption process, parameters and R2.
Order KineticKinetic ParametersR2
0Time (t) vs. Concentration Pb(II) (C)0.4725
1t vs. Ln C0.6868
2t vs. 1 C 0.8469
Pseudo-first ordert vs. Log (qe – qt)0.5112
Pseudo-second ordert vs. t q t 0.9997
qe: concentration of Pb(II) in the equilibrium; qt: concentration of Pb(II) in a specific time. The equations that were applied to the isotherm’s models were taken from Ayawei et al. [43].
Table 3. Isotherm models applied to the biosorption process and R2.
Isotherms ModelsHenryFreundlichLangmuir
R20.82880.94160.9967
Constant (K)0.134 L·g−13.683 mg·L−10.030 L·mg−1
Table 4. Capacity of maximum adsorption in coffee wastes without chemical modification.
Lignocellulosic Wastes Derived from Coffee CropsBiosorption CharacteristicsQ max.
Interval
Reference
pH
(pH Units)
Capacity of Maximum Adsorption (Q max.) (mg·g−1 )
Spent coffee powder/coffee grounds4.566.3049.73–159.50[44]
3.549.73[45]
3.5159.50
4.0158.70[46]
Coffee waste (instant coffee beans)5. 09.709. 70[47]
Coffee shell/pulp5.054.054.80–230.00[48]
N/A37.04[49]
4.54.80[50]
0.5–9.07.20[31]
0.5–9.0230.00
2.0–9.050.80
2.024.10This study
Raw coffee beans6.061.6022.90–61.60[51]
5.022.90[52]
3.0–4.096%[50]
N/A87.2087.02–159.54[53]
Spent coffee beans3.0–4.087.02[50]
2.0–12.093.24
2.0–12.0159.54
Table 5. Capacity of maximum adsorption of coffee wastes with chemical modification.
Lignocellulosic Waste
Derived from Coffee
Biosorption CharacteristicsReference
pH
(pH units)
Q max.
(mg·g−1)
Chemical Modification
Spent coffee powder/coffee grounds3.5159.50Citric acid[45]
4.0158.70Citric acid[46]
Coffee shell/pulp5.054.05Pyrolysis[48]
Table 6. pHpzc for the CP and its relation to the optimum pH.
Optimum pH pHpzc for CPChemical Species in Aqueous DissolutionConclusion
2.03.95Pb2+ [21,30]pH < pHpzc
The surface of the biosorbent is positively charged.
Publisher’s Note: MDPI stays neutral with regard to jurisdictional claims in published maps and institutional affiliations.

