
A Multi-User Interactive Coral Reef Optimization Algorithm for Considering Expert Knowledge in the Unequal Area Facility Layout Problem


Abstract
:1. Introduction
2. Problem Formulation
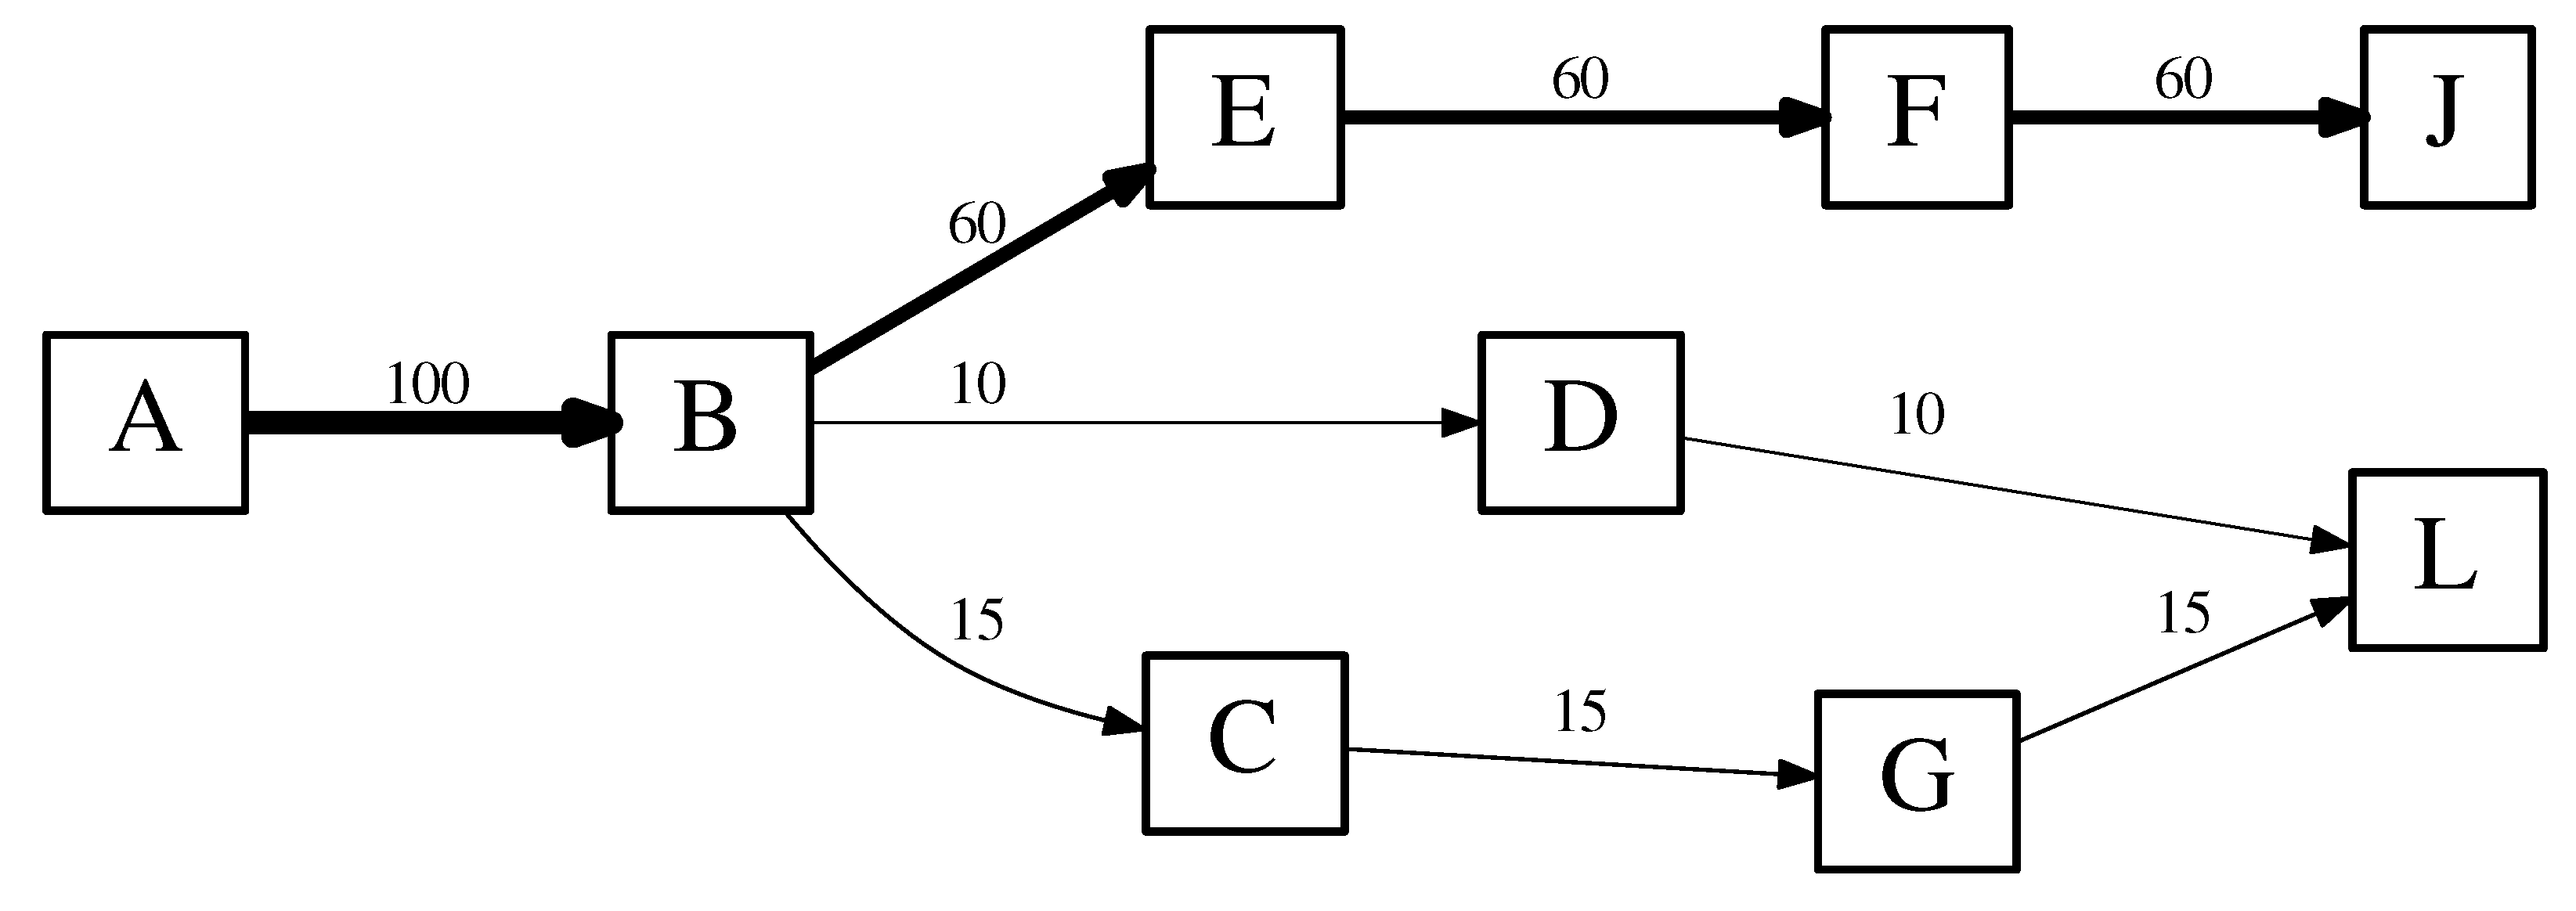
2.1. Fitness Function
- is the value of the fitness function with penalty for a specific plant.
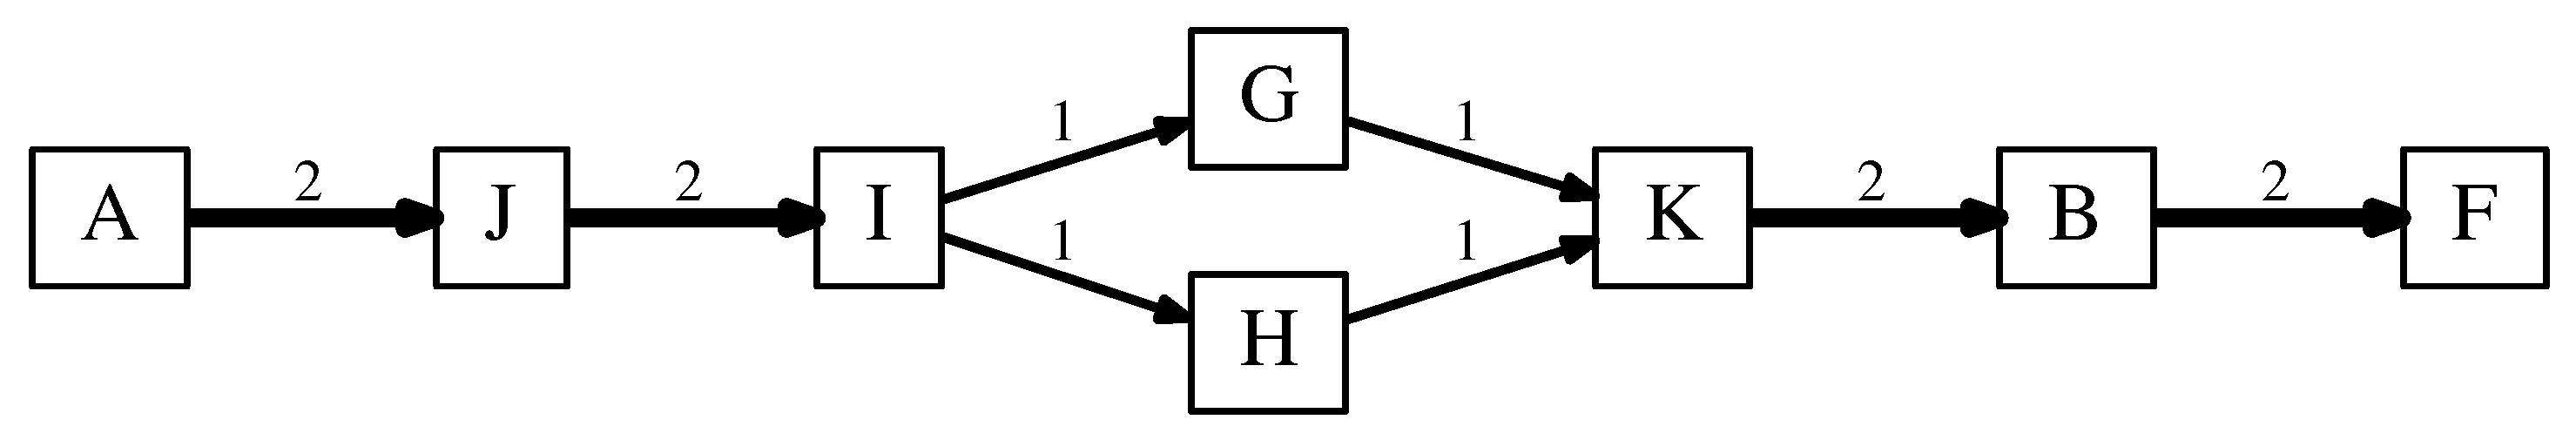
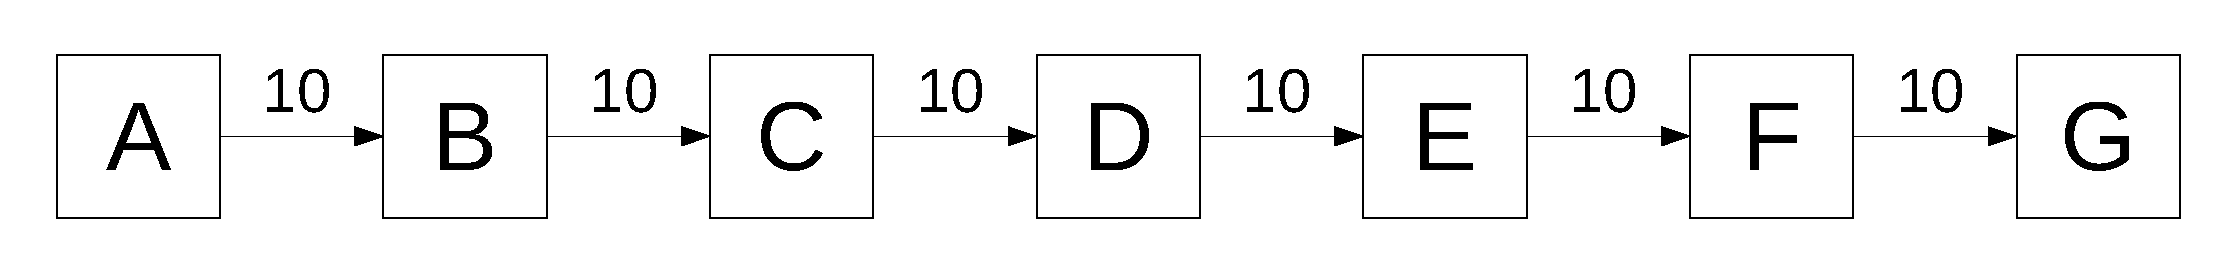
- and are the material flows between departments and the distances between centroids, respectively.
- is the number of unfeasible facilities.
- k is a penalty parameter that adjusts the grade of penalization (set to 3, according to Tate and Smith [51]).
- is the best fitness value found in the set of feasible solutions.
- is the overall best fitness value found.
- is the factor for the extra penalty.
- x is the evaluation assigned by the expert.
- n is the plant’s number of facilities.
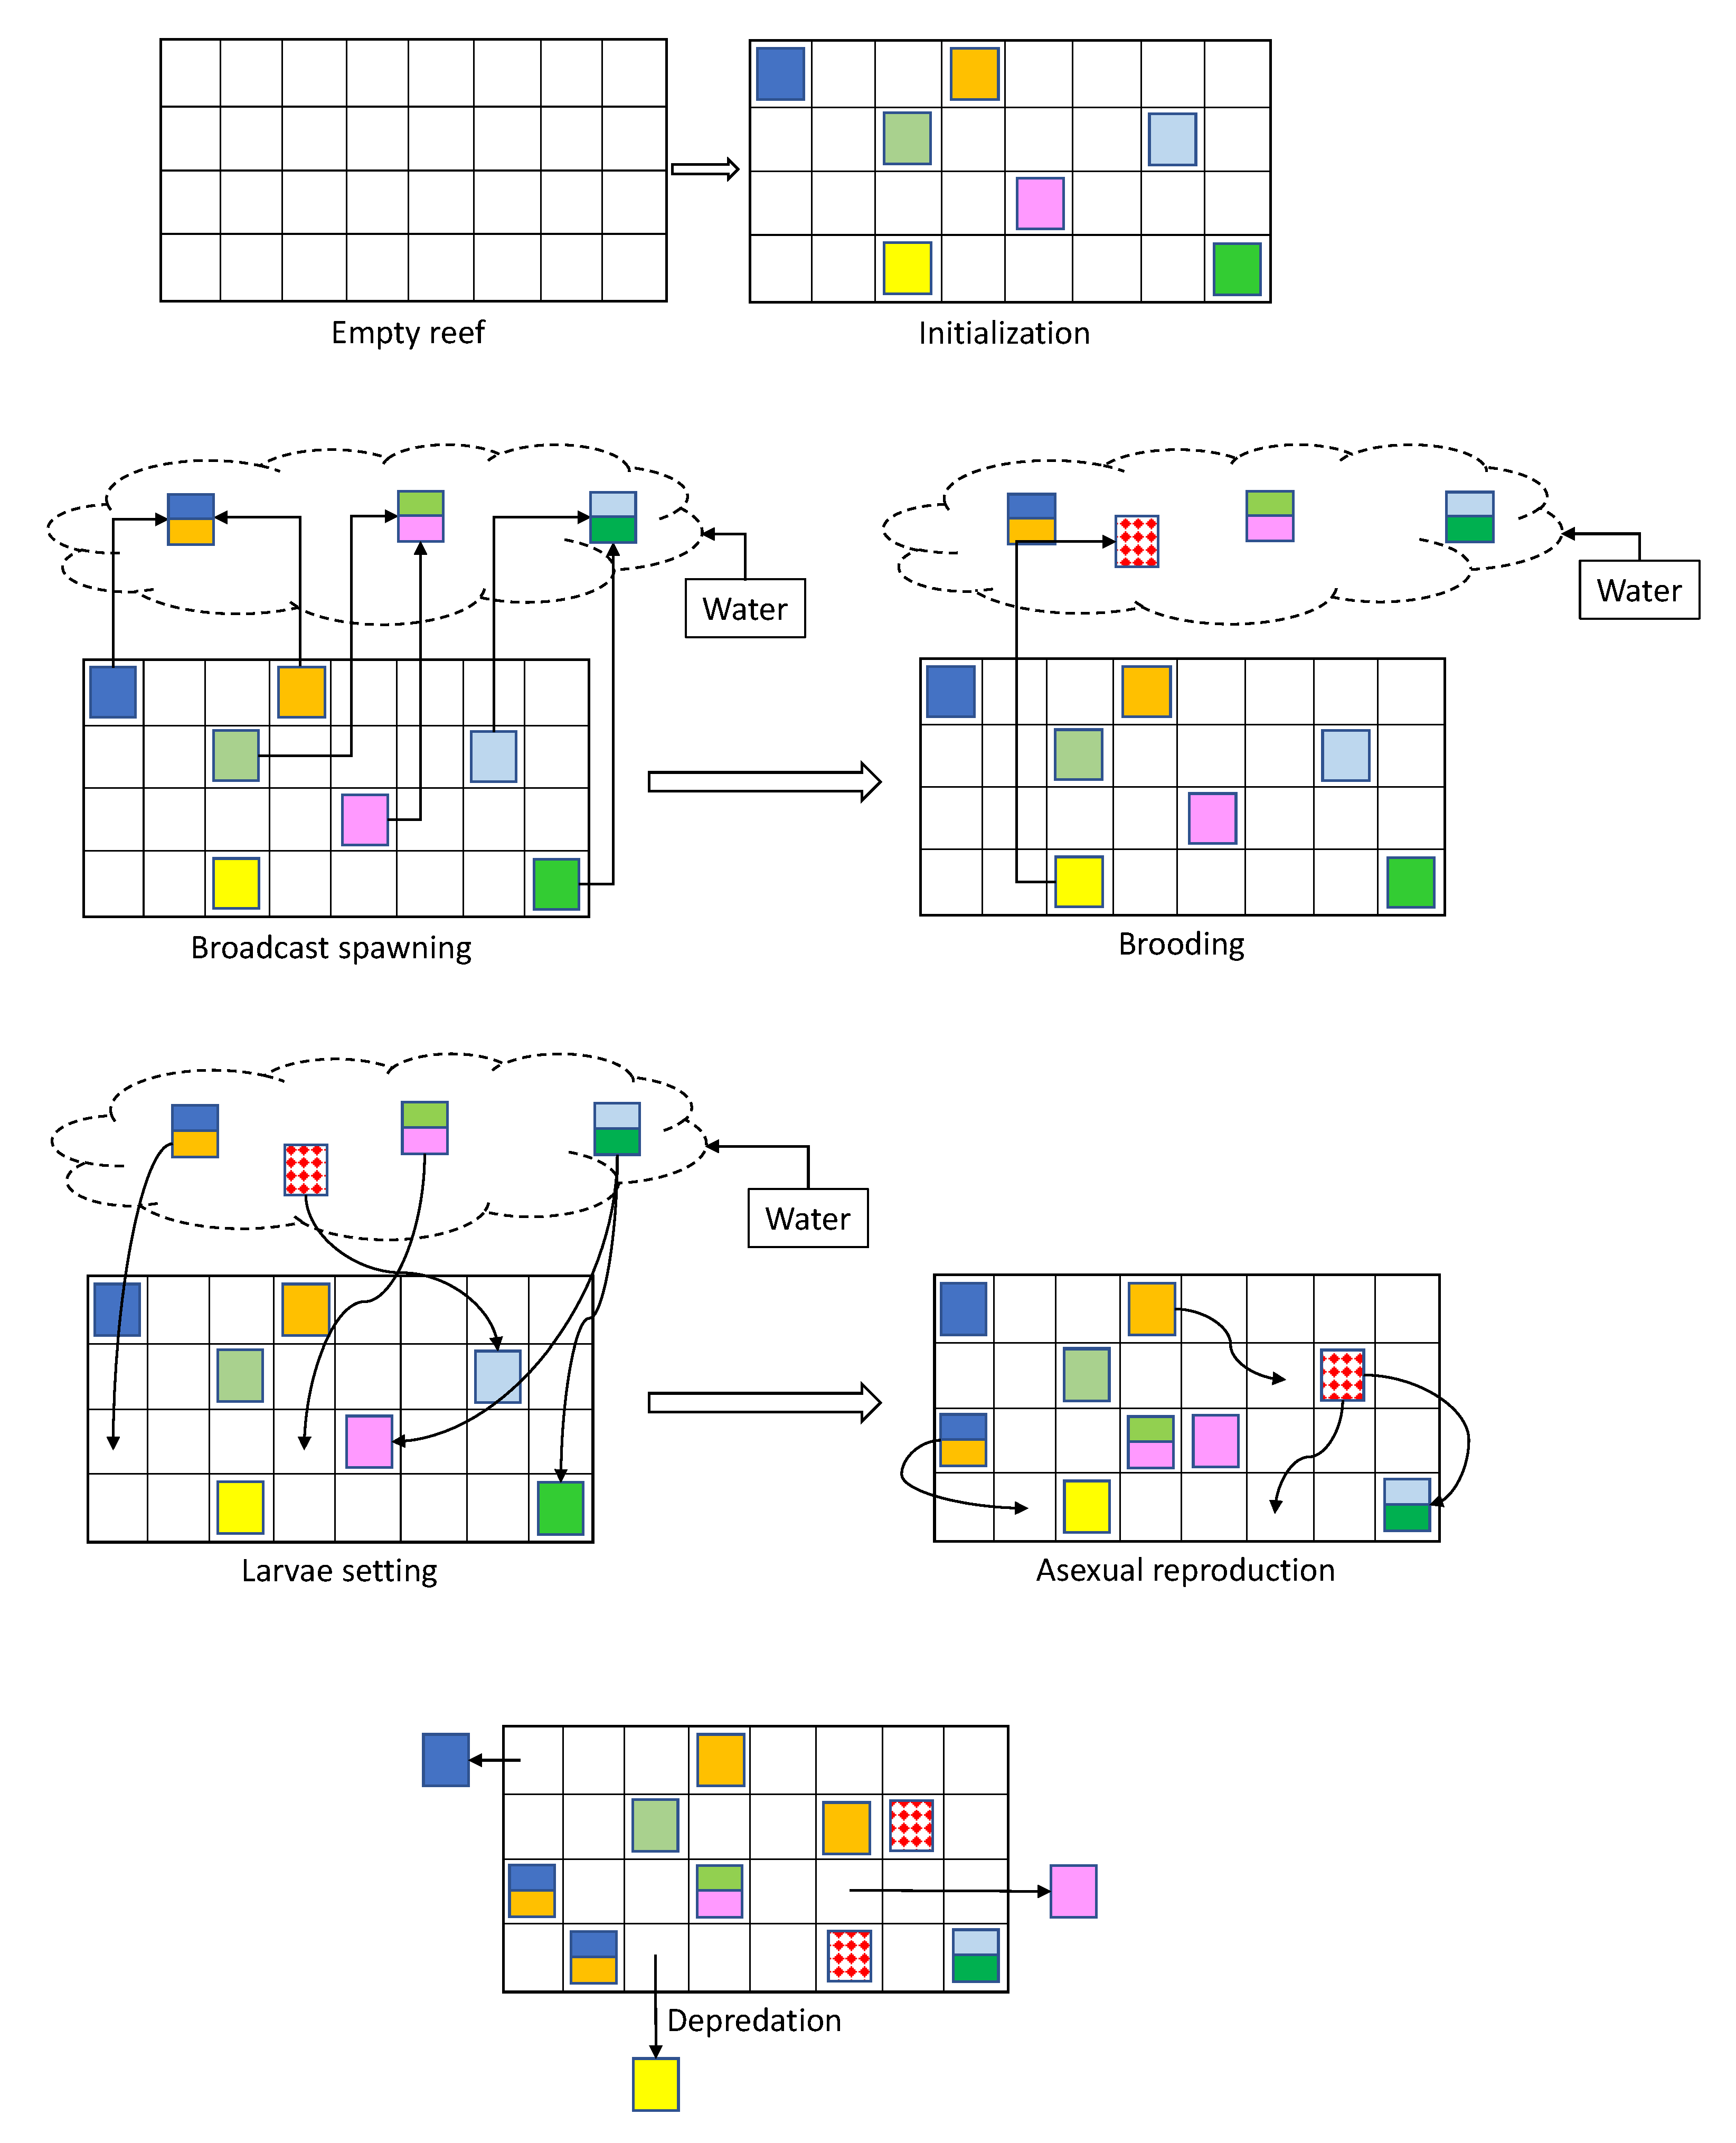
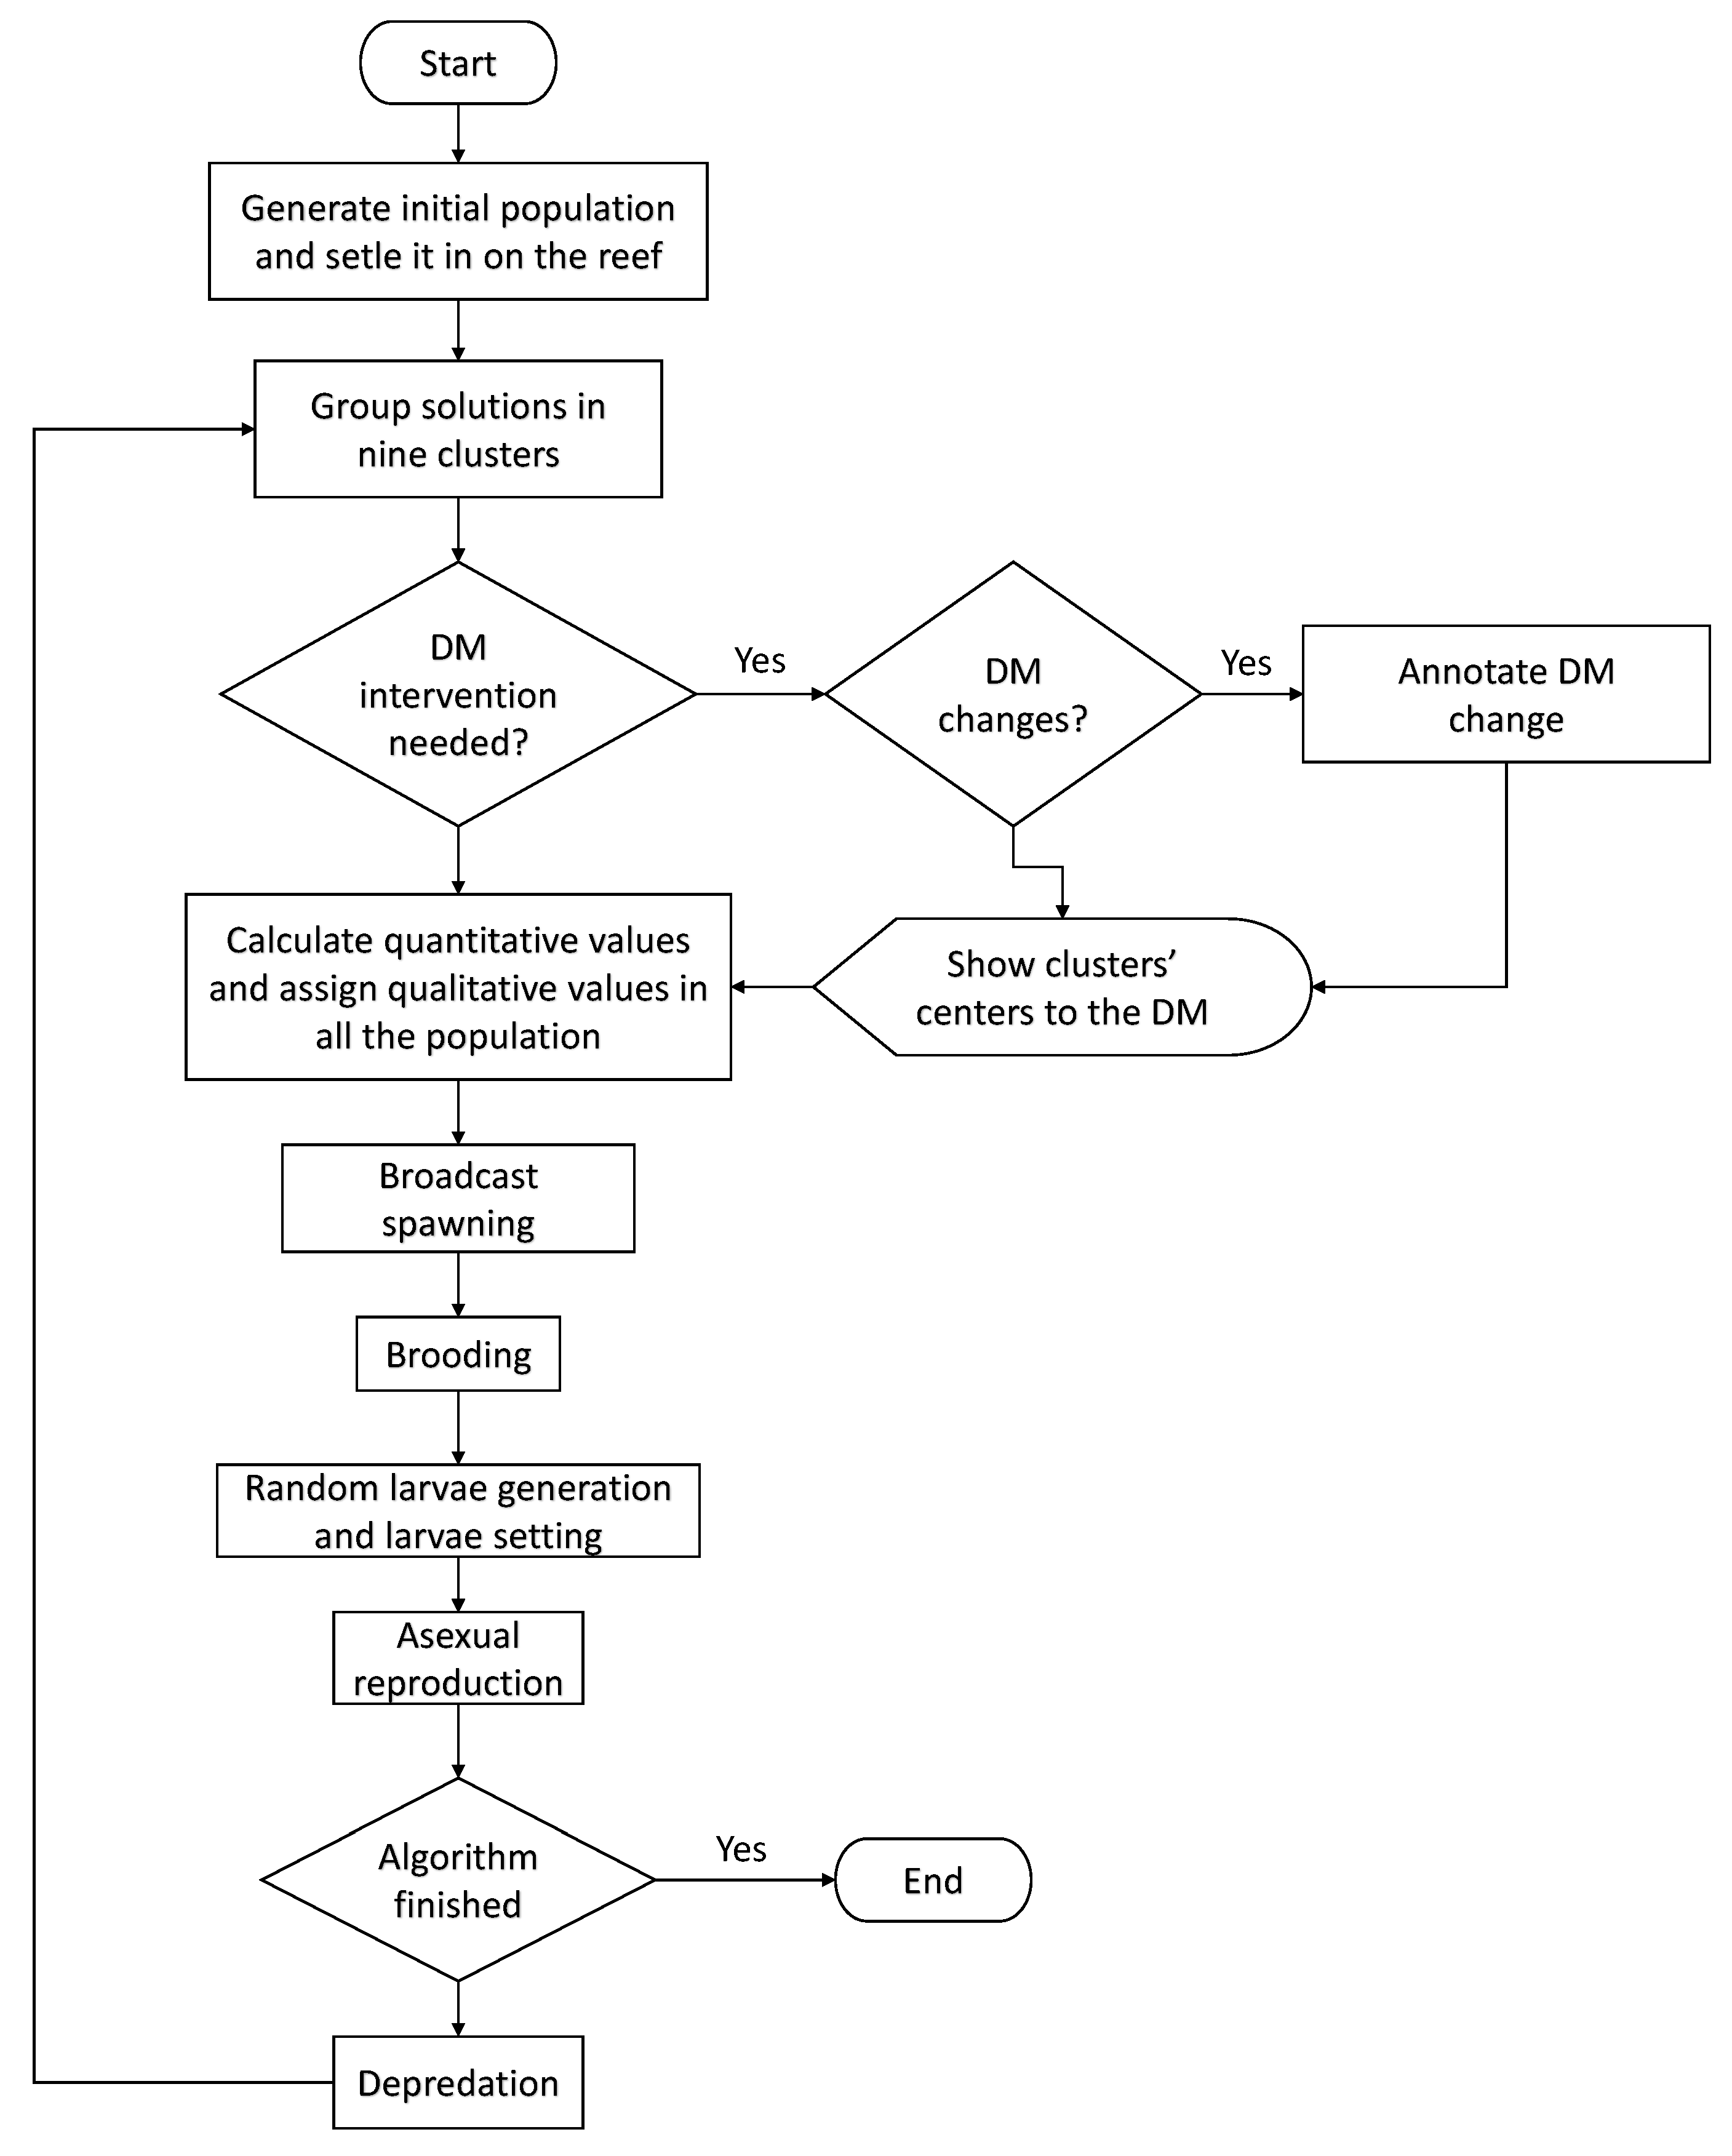
2.2. Evolutionary Strategy
| Algorithm 1 CRO algorithm pseudocode |
| Input Reef dimensions , Initial occupation rate , Fraction of broadcast spawning , Fraction of asexual reproduction , Predation fraction , Predation probability Output Solution with best fitness |
|
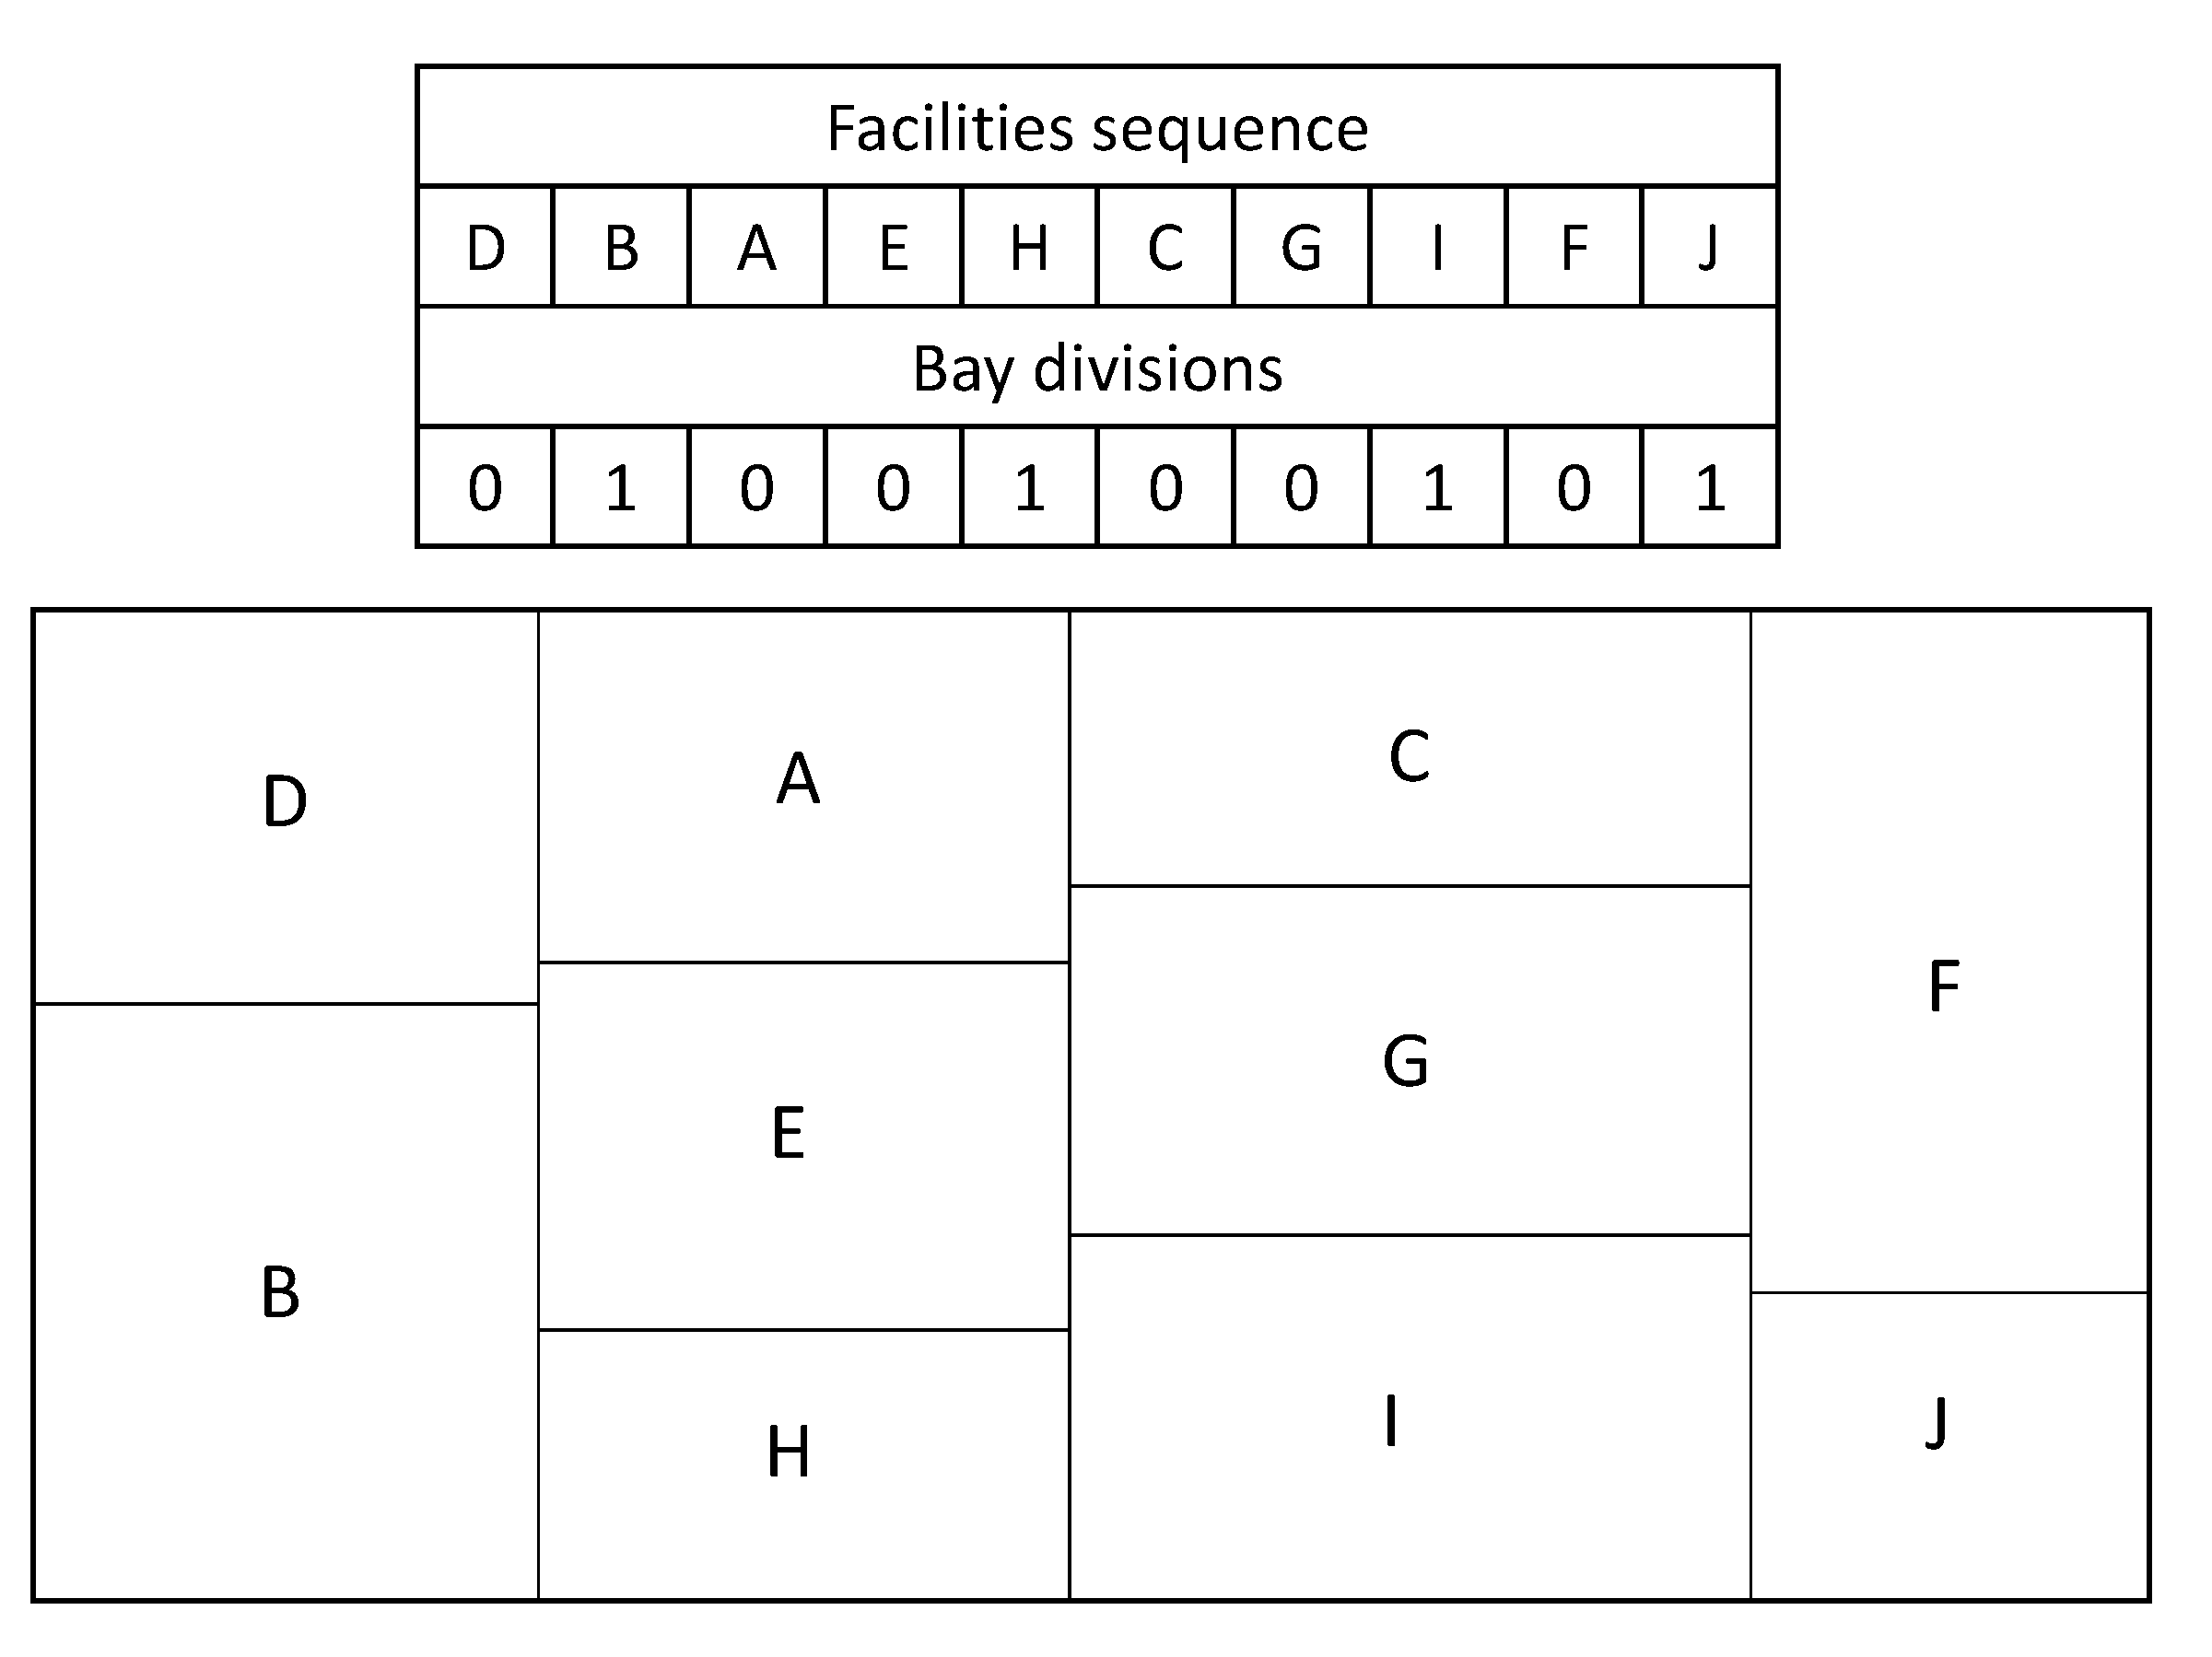
2.3. Individual Codification
2.4. Multi-User Evaluation
3. Experimentation
4. Results
5. Conclusions
Author Contributions
Funding
Institutional Review Board Statement
Informed Consent Statement
Data Availability Statement
Conflicts of Interest
References
- Tompkins, J.; White, J.; Bozer, Y.; Tanchoco, J. Facilities Planning, 4th ed.; Wiley: New York, NY, USA, 2010. [Google Scholar]
- Kouvelis, P.; Kurawarwala, A.A.; Gutierrez, G.J. Algorithms for robust single and multiple period layout planning for manufacturing systems. Eur. J. Oper. Res. 1992, 63, 287–303. [Google Scholar] [CrossRef]
- Aiello, G.; Scalia, G.L.; Enea, M. A non dominated ranking multi objective genetic algorithm and electre method for unequal area facility layout problems. Expert Syst. Appl. 2013, 40, 4812–4819. [Google Scholar] [CrossRef]
- Sun, X.; Lai, L.-F.; Chou, P.; Chen, L.-R.; Wu, C.-C. On GPU implementation of the island model genetic algorithm for solving the unequal area facility layout problem. Appl. Sci. 2018, 8, 1604. [Google Scholar] [CrossRef] [Green Version]
- Armour, G.C.; Buffa, E.S. A heuristic algorithm and simulation approach to relative location of facilities. Manag. Sci. 1963, 9, 294–309. [Google Scholar] [CrossRef]
- Lin, Y.Z.; Lin, Y.C. Applying an immune ant colony system algorithm to solve an integrated flexible bay facility layout problem with input/output points design. Lect. Notes Manag. Sci. 2015, 7, 56–62. [Google Scholar]
- Besbes, M.; Zolghadri, M.; Costa Affonso, R.; Masmoudi, F.; Haddar, M. A methodology for solving facility layout problem considering barriers: Genetic algorithm coupled with A* search. J. Intell. Manuf. 2020, 31, 615–640. [Google Scholar] [CrossRef]
- Drira, A.; Pierreval, H.; Hajri-Gabouj, S. Facility layout problems: A survey. Annu. Rev. Control 2007, 31, 255–267. [Google Scholar] [CrossRef]
- Aiello, G.; Enea, M.; Galante, G.; La Scalia, G. Multi objective genetic algorithms for unequal area facility layout problems: A survey. In Proceedings of the Summer School Francesco Turco, Senigallia, Italy, 11–13 September 2013; pp. 95–100. [Google Scholar]
- García-Hernández, L.; Salas-Morera, L.; Carmona-Muñoz, C.; Abraham, A.; Salcedo-Sanz, S. A novel multi-objective Interactive Coral Reefs Optimization algorithm for the Unequal Area Facility Layout Problem. Swarm Evol. Comput. 2020, 55, 100688. [Google Scholar] [CrossRef]
- Salas-Morera, L.; García-Hernández, L.; Antolxix-Cabrera, A.; Carmona-Muñoz, C. Using eye-tracking into decision makers evaluation in evolutionary interactive UA-FLP algorithms. Neural Comput. Appl. 2020, 32, 13747–13757. [Google Scholar] [CrossRef]
- Mls, K.; Cimler, R.; Vaščák, J.; Puheim, M. Interactive evolutionary optimization of fuzzy cognitive maps. Neurocomputing 2017, 232, 58–68. [Google Scholar] [CrossRef]
- García-Hernández, L.; Arauzo-Azofra, A.; Salas-Morera, L.; Pierreval, H.; Corchado, E. Recycling plants layout design by means of an interactive genetic algorithm. Intell. Autom. Soft Comput. 2013, 19, 457–468. [Google Scholar] [CrossRef]
- Sakai, M.; Takenouchi, H.; Tokumaru, M. Design support system with votes from multiple people using digital signage. In Proceedings of the 2014 IEEE International Symposium on Independent Computing (ISIC), Orlando, FL, USA, 9–12 December 2014; pp. 7–12. [Google Scholar]
- Takenouchi, H.; Tokomaru, M.; Muranaka, N. Tournament Evaluation System Considering Multiple People’s Kansei Evaluation. Kansei Eng. Int. J. 2010, 9, 43–50. [Google Scholar] [CrossRef] [Green Version]
- Nomura, K.; Fukumoto, M. Asynchronous distributed interactive genetic algorithm for creating music melody reflecting multiple users’ feelings. In Proceedings of the 18th IEEE/ACIS International Conference on Software Engineering, Artificial Intelligence, Networking and Parallel/Distributed Computing, SNPD 2017, Kanazawa, Japan, 26–28 June 2017; pp. 645–650. [Google Scholar]
- Nomura, K.; Fukumoto, M. Music Melodies Suited to Multiples Users’ Feelings Composed by Asyncrhronous Distributed Interactive Genetic Algorithm. Int. J. Softw. Innov. 2018, 6, 26–36. [Google Scholar] [CrossRef] [Green Version]
- Palomo-Romero, J.M.; Salas-Morera, L.; García-Hernández, L. An island model genetic algorithm for unequal area facility layout problems. Expert Syst. Appl. 2017, 68, 151–162. [Google Scholar] [CrossRef]
- Hosseini-Nasab, H.; Fereidouni, S.; FatemiGhomi, S.M.T.; Fakhrzad, M.B. Classification of facility layout problems: A review study. Int. J. Adv. Manuf. Technol. 2018, 94, 957–977. [Google Scholar] [CrossRef]
- Montreuil, B. A modelling framework for integrating layout design and flow network design. In Material Handling ’90; Springer: Berlin/Heidelberg, Germany, 1991; pp. 95–115. [Google Scholar]
- Meller, R.; Narayanan, V.; Vance, P. Optimal facility layout design. Oper. Res. Lett. 1998, 23, 117–127. [Google Scholar] [CrossRef]
- Konak, A.; Kulturel-Konak, S.; Norman, B.; Smith, A. A new mixed-integer programming formulation for unequal area facility layout problem in a continuous plane. In Proceedings of the IIE Annual Conference and Exhibition 2004, Hilton Americas, Houston, TX, USA, 15–19 May 2004; p. 63. [Google Scholar]
- Konak, A.; Kulturel-Konak, S.; Norman, B.; Smith, A. A new mixed integer formulation for optimal facility layout. Oper. Res. Lett. 2006, 34, 660–672. [Google Scholar] [CrossRef]
- Chae, J.; Regan, A.C. Layout design problems with heterogeneous area constraints. Comput. Ind. Eng. 2016, 102, 198–207. [Google Scholar] [CrossRef]
- Aiello, G.; Enea, M.; Galante, G. A multi-objective approach to facility layout problem by genetic search algorithm and electre method. Robot. Comput. Integr. Manuf. 2006, 22, 447–455. [Google Scholar] [CrossRef]
- Wong, K.Y. Applying ant system for solving unequal area facility layout problems. Eur. J. Oper. Res. 2010, 202, 730–746. [Google Scholar]
- Liu, J.; Liu, J. Applying multi-objective ant colony optimization algorithm for solving the unequal area facility layout problems. Appl. Soft Comput. 2019, 74, 167–189. [Google Scholar] [CrossRef]
- Pourvaziri, H.; Naderi, B. A hybrid multi-population genetic algorithm for the dynamic facility layout problem. Appl. Soft Comput. J. 2014, 24, 457–469. [Google Scholar] [CrossRef]
- Chwif, L.; Pereira Barretto, M.R.; Moscato, L.A. A solution to the facility layout problem using simulated annealing. Comput. Ind. 1998, 36, 125–132. [Google Scholar] [CrossRef]
- Jerin Leno, I.; Saravana Sankar, S.; Ponnambalam, S.G. An elitist strategy genetic algorithm using simulated annealing algorithm as local search for facility layout design. Int. J. Adv. Manuf. Technol. 2016, 84, 787–799. [Google Scholar] [CrossRef]
- Matai, R. Solving multi objective facility layout problem by modified simulated annealing. Appl. Math. Comput. 2015, 261, 302–311. [Google Scholar] [CrossRef]
- Turgay, S. Multi objective simulated annealing approach for facility layout design. Int. J. Math. Eng. Manag. Sci. 2018, 3, 365–380. [Google Scholar] [CrossRef]
- Al-Saleh, M.A.; Mir, M.; Hassanin, A. Comparison of enhanced constructive layout optimization technique with Tabu-search and Particle Swarm Optimization methodologies. In Proceedings of the IEOM 2015—5th International Conference on Industrial Engineering and Operations Management, Dubai, United Arab Emirates, 3–5 March 2015. [Google Scholar]
- Jeong, D.; Seo, Y. Golden section search and hybrid tabu search-simulated annealing for layout design of unequal-sized facilities with fixed input and output points. Int. J. Ind. Eng. Theory Appl. Pract. 2018, 25, 297–315. [Google Scholar]
- McKendall, A.R.; Hakobyan, A. Heuristics for the dynamic facility layout problem with unequal-area departments. Eur. J. Oper. Res. 2010, 201, 171–182. [Google Scholar] [CrossRef]
- Liu, J.; Wang, D.; He, K.; Xue, Y. Combining Wang–Landau sampling algorithm and heuristics for solving the unequal-area dynamic facility layout problem. Eur. J. Oper. Res. 2017, 262, 1052–1063. [Google Scholar] [CrossRef]
- Derakhshan Asl, A.; Wong, K.Y. Solving unequal-area static and dynamic facility layout problems using modified particle swarm optimization. J. Intell. Manuf. 2017, 28, 1317–1336. [Google Scholar] [CrossRef]
- Jolai, F.; Tavakkoli-Moghaddam, R.; Taghipour, M. A multi-objective particle swarm optimisation algorithm for unequal sized dynamic facility layout problem with pickup/drop-off locations. Int. J. Prod. Res. 2012, 50, 4279–4293. [Google Scholar] [CrossRef]
- Liu, J.; Zhang, H.; He, K.; Jiang, S. Multi-objective particle swarm optimization algorithm based on objective space division for the unequal-area facility layout problem. Expert Syst. Appl. 2018, 102, 179–192. [Google Scholar] [CrossRef]
- Salcedo-Sanz, S.; Del Ser, J.; La-Torres, I.; Gil-López, S.; Portilla-Figueras, J.A. The Coral Reefs Optimization Algorithm: A Novel Metaheuristic for Efficiently Solving Optimization Problems. Sci. World J. 2014, 2014, 739768. [Google Scholar] [CrossRef]
- Durán-Rosal, A.M.; Gutiérrez, P.A.; Salcedo-Sanz, S.; Hervxaxs-Martínez, C. Dynamical memetization in coral reef optimization algorithms for optimal time series approximation. Prog. Artif. Intell. 2019, 8, 253–262. [Google Scholar] [CrossRef]
- Camacho-Gómez, C.; Marsa-Maestre, I.; Gimenez-Guzman, J.M.; Salcedo-Sanz, S. A Coral Reefs Optimization algorithm with substrate layer for robust Wi-Fi channel assignment. Soft Comput. 2019, 23, 12621–12640. [Google Scholar] [CrossRef]
- Salcedo-Sanz, S.; García-Herrera, R.; Camacho-Gómez, C.; Alexre, E.; Carro-Calvo, L.; Jaume-Santero, F. Near-optimal selection of representative measuring points for robust temperature field reconstruction with the CRO-SL and analogue methods. Glob. Planet. Chang. 2019, 178, 15–34. [Google Scholar] [CrossRef]
- Tsai, C.W.; Chang, W.Y.; Wang, Y.C.; Chen, H. A high-performance parallel coral reef optimization for data clustering. Soft Comput. 2019, 23, 9327–9340. [Google Scholar] [CrossRef]
- Camacho-Gomez, C.; Sanchez-Montero, R.; Martínez-Villanueva, D.; López-Espxix, P.-L.; Salcedo-Sanz, S. Design of a Multi-Band Microstrip Textile Patch Antenna for LTE and 5G Services with the CRO-SL Ensemble. Appl. Sci. 2020, 10, 1168. [Google Scholar] [CrossRef] [Green Version]
- Azgomi, H.; Sohrabi, M.K. A novel coral reefs optimization algorithm for materialized view selection in data warehouse environments. Appl. Intell. 2019, 49, 3965–3989. [Google Scholar] [CrossRef]
- Martín, A.; Vargas, V.M.; Gutiérrez, P.A.; Camacho, D.; Hervás-Martxixnez, C. Optimising Convolutional Neural Networks using a Hybrid Statistically-driven Coral Reef Optimisation algorithm. Appl. Soft Comput. J. 2020, 90, 106144. [Google Scholar] [CrossRef]
- García-Hernández, L.; Salas-Morera, L.; Garcxixa-Hernxaxndez, J.; Salcedo-Sanz, S.; de Oliveira, J.V. Applying the coral reefs optimization algorithm for solving unequal area facility layout problems. Expert Syst. Appl. 2019, 138, 112819. [Google Scholar] [CrossRef]
- García-Hernández, L.; Salas-Morera, L.; Carmona-Muñoz, C.; Garcia-Hernez, J.; Salcedo-Sanz, S. A novel Island Model based on Coral Reefs Optimization algorithm for solving the unequal area facility layout problem. Eng. Appl. Artif. Intell. 2020, 89, 103445. [Google Scholar] [CrossRef]
- García-Hernández, L.; Garcxixa-Hernxaxndez, J.A.; Salas-Morera, L.; Carmona-Muñoz, C.; Alghamdi, N.S.; de Oliveira, J.V.; Salcedo-Sanz, S. Addressing Unequal Area Facility Layout Problems with the Coral Reef Optimization algorithm with Substrate Layers. Eng. Appl. Artif. Intell. 2020, 93, 103697. [Google Scholar] [CrossRef]
- Tate, D.M.; Smith, A.E. Unequal area facility layout using genetic search. IIE Trans. 1995, 27, 465–472. [Google Scholar] [CrossRef]
- Gomez, A.; Fernez, Q.; laFuenteGarcia, D.D.; Garcia, P. Using genetic algorithms to resolve layout problems in facilities where there are aisles. Int. J. Prod. Econ. 2003, 84, 271–282. [Google Scholar] [CrossRef]
- Dunn, J.C. A fuzzy relative of the isodata process and its use in detecting compact well-separated clusters. J. Cybern. 1973, 3, 32–57. [Google Scholar] [CrossRef]
- García-Hernández, L.; Pierreval, H.; Salas-Morera, L.; Arauzo-Azofra, A. Handling qualitative aspects in unequal area facility layout problem: An interactive genetic algorithm. Appl. Soft Comput. 2013, 13, 1718–1727. [Google Scholar] [CrossRef]
- Salas-Morera, L.; Cubero-Atienza, A.; Ayuso-Munoz, R. Computer-aided plant layout|Distribucion en planta asistida por ordenador. Inf. Tecnol. 1996, 7, 39–46. [Google Scholar]
- García-Hernández, L.; Arauzo-Azofra, A.; Salas-Morera, L.; Pierreval, H.; Corchado, E. Facility layout design using a multi-objective interactive genetic algorithm to support the DM. Expert Syst. 2015, 32, 94–107. [Google Scholar] [CrossRef]


| Parameter | Value |
|---|---|
| Number of generations | 100 |
| Reef size | |
| 0.6 | |
| 0.7 | |
| 0.2 | |
| 0.1 | |
| 0.15 | |
| 0.2 | |
| User interaction Frequency |
| Id | Facility | Area (m) | Aspect Ratio |
|---|---|---|---|
| A | Stables | 570 | 4 |
| B | Slaughter | 206 | 4 |
| C | Entrails | 150 | 4 |
| D | Leather and skin | 55 | 4 |
| E | Aeration chamber | 114 | 4 |
| F | Refrigeration chamber | 102 | 4 |
| G | Entrails chamber | 36 | 4 |
| H | Boiler room | 26 | 4 |
| I | Compressor room | 46 | 4 |
| J | Shipping | 109 | 4 |
| K | Offices | 80 | 4 |
| L | Byproduct shipping | 40 | 4 |
| DM | Preference 1 | Preference 2 | Preference 3 |
|---|---|---|---|
| DM1 | A must be in the perimeter of the plant | L must be in the perimeter of the plant | J must be in the perimeter of the plant |
| DM2 | K must be far from A | K must be far from I | L must be far from J |
| DM3 | B must be far from J | I must be far from A | H must be close to C |
| Id | Facility | Area (m) | Aspect Ratio |
|---|---|---|---|
| A | Raw Material | 40 | 4 |
| B | Finished products | 40 | 4 |
| C | Repair shop | 20 | 4 |
| D | Offices | 50 | 4 |
| E | Staff WC | 20 | 4 |
| F | Expedition | 40 | 4 |
| G | Hydraulic 1 | 20 | 4 |
| H | Hydraulic 2 | 20 | 4 |
| I | Crushing | 20 | 4 |
| J | Circ. saw | 10 | 4 |
| K | Heat exchange | 10 | 4 |
| DM | Preference 1 | Preference 2 | Preference 3 |
|---|---|---|---|
| DM1 | A must be in the perimeter of the plant | F must be in the perimeter of the plant | D must be in the perimeter of the plant |
| DM2 | D must be far from C | D must be close to A | D must be close to F |
| DM3 | D must be far from G | D must be far from H | D must be far from I |
| Id | Facility | Area (m) | Aspect Ratio |
|---|---|---|---|
| A | Reception | 35 | 4 |
| B | Raw material | 50 | 4 |
| C | Washing | 15 | 4 |
| D | Drying and skin | 24 | 4 |
| E | Chopped | 35 | 4 |
| F | Finished product | 30 | 4 |
| G | Expedition | 25 | 4 |
| I | Office | 30 | 4 |
| J | Toilets | 15 | 4 |
| K | Repair shop | 20 | 4 |
| Z | Empty space | 21 |
| DM | Preference 1 | Preference 2 | Preference 3 |
|---|---|---|---|
| DM1 | I must be in the end of the plant | K must be in the perimeter of the plant | J must be close to I |
| DM2 | K must be close to E | I must be close to G | G must be in the end of the plant |
| DM3 | Z must be in the end of the plant | Z must be close to I | E must be far from I |
| Problem/ DMs Intervention | Best MHC | Layout | MHC of Best Qualitative | Layout |
|---|---|---|---|---|
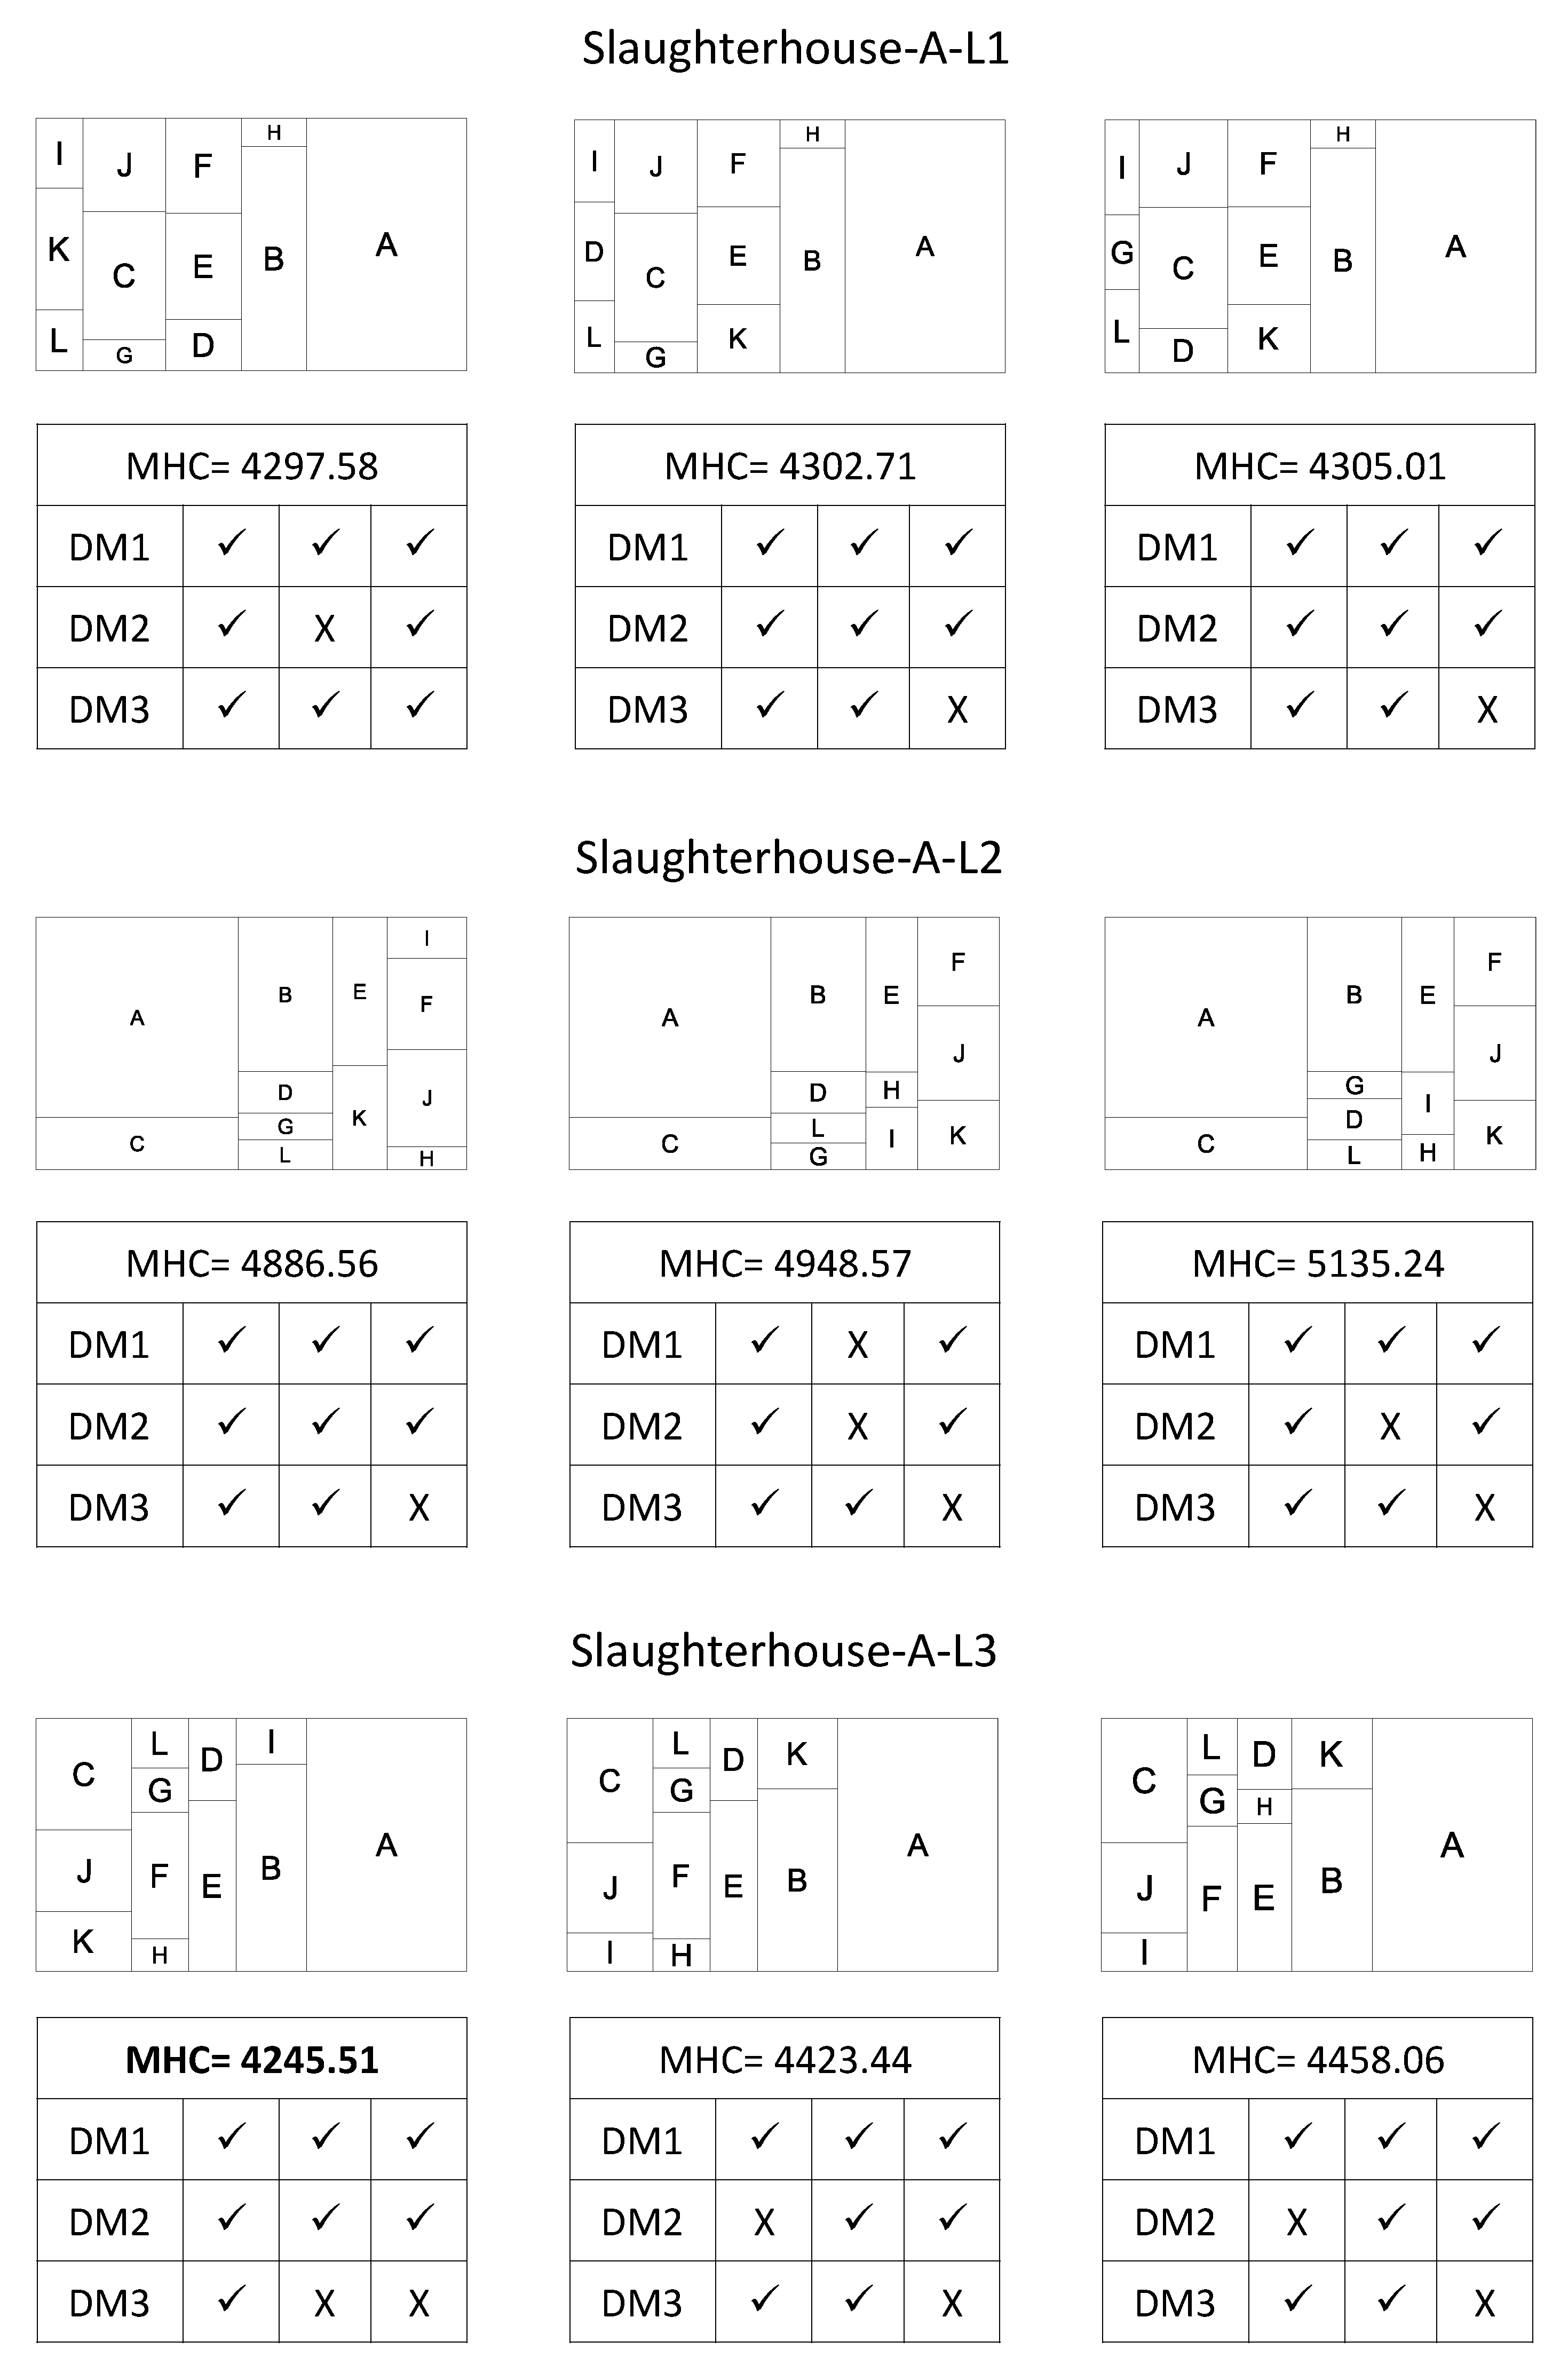
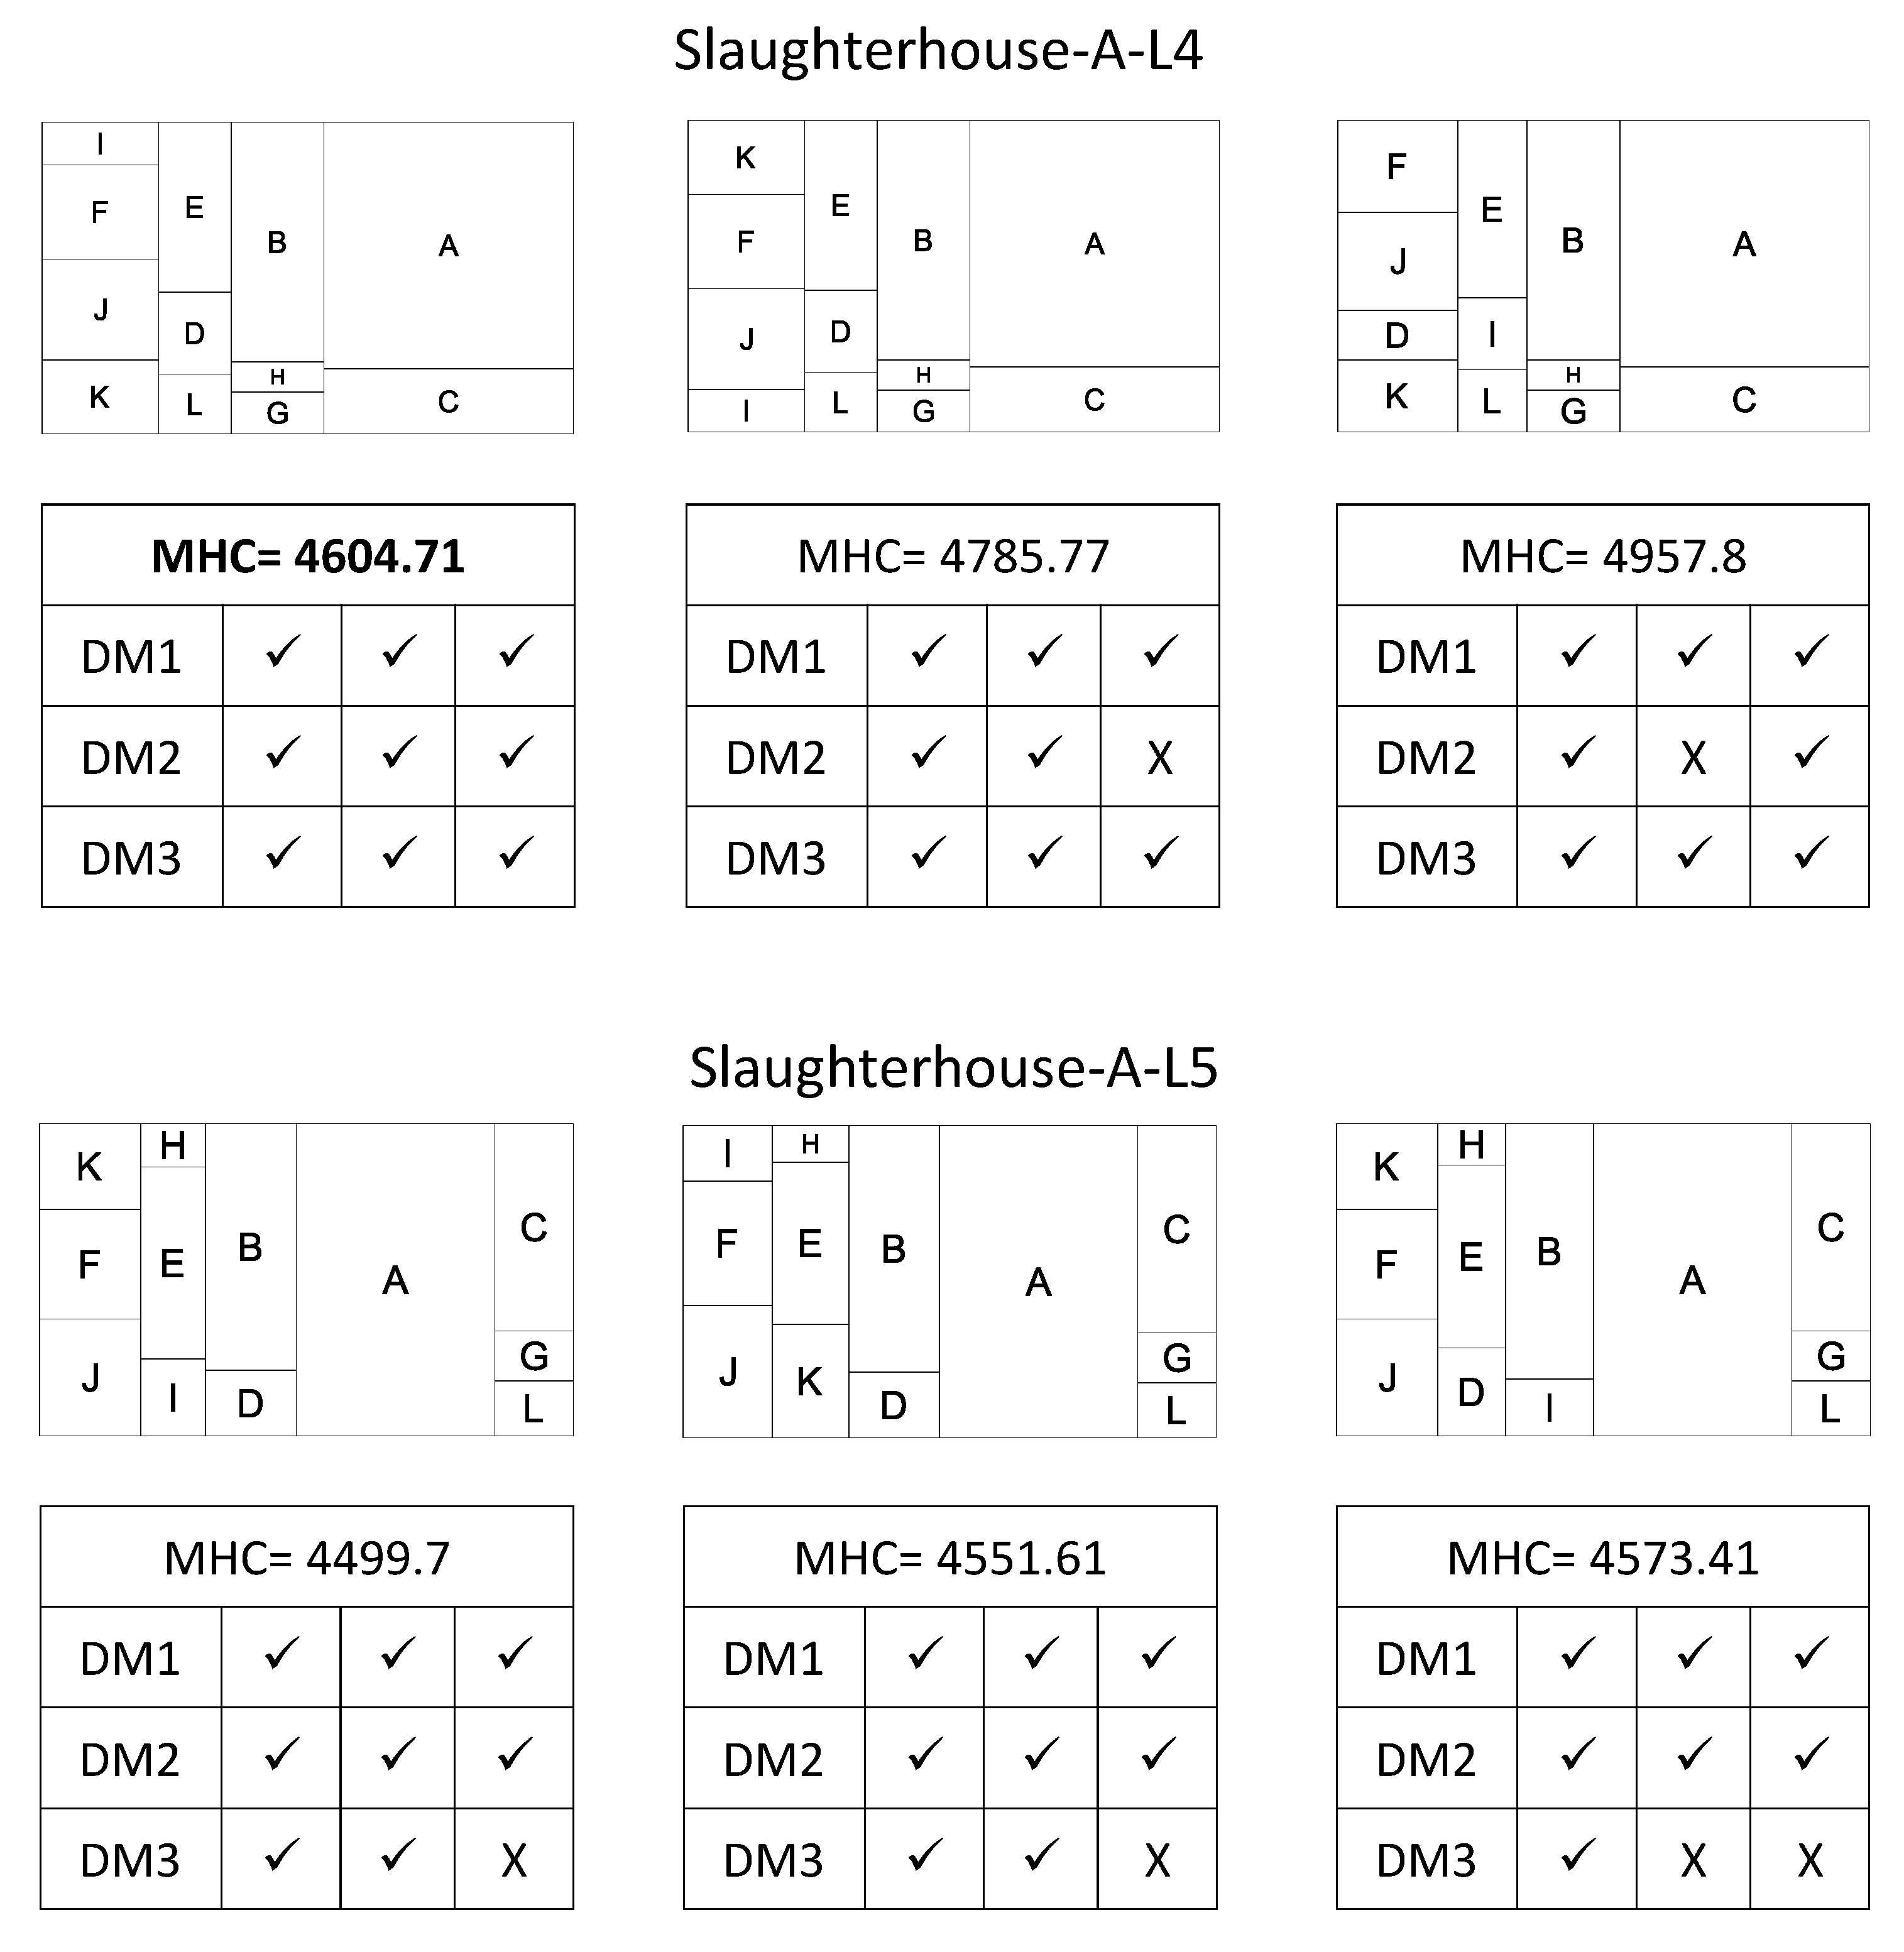
| Slaughterhouse/ Alternative | 4245.51 | CJK | LGFH | DE | IB | A | 4604.71 | IJFK | EDL | BHG | AC |
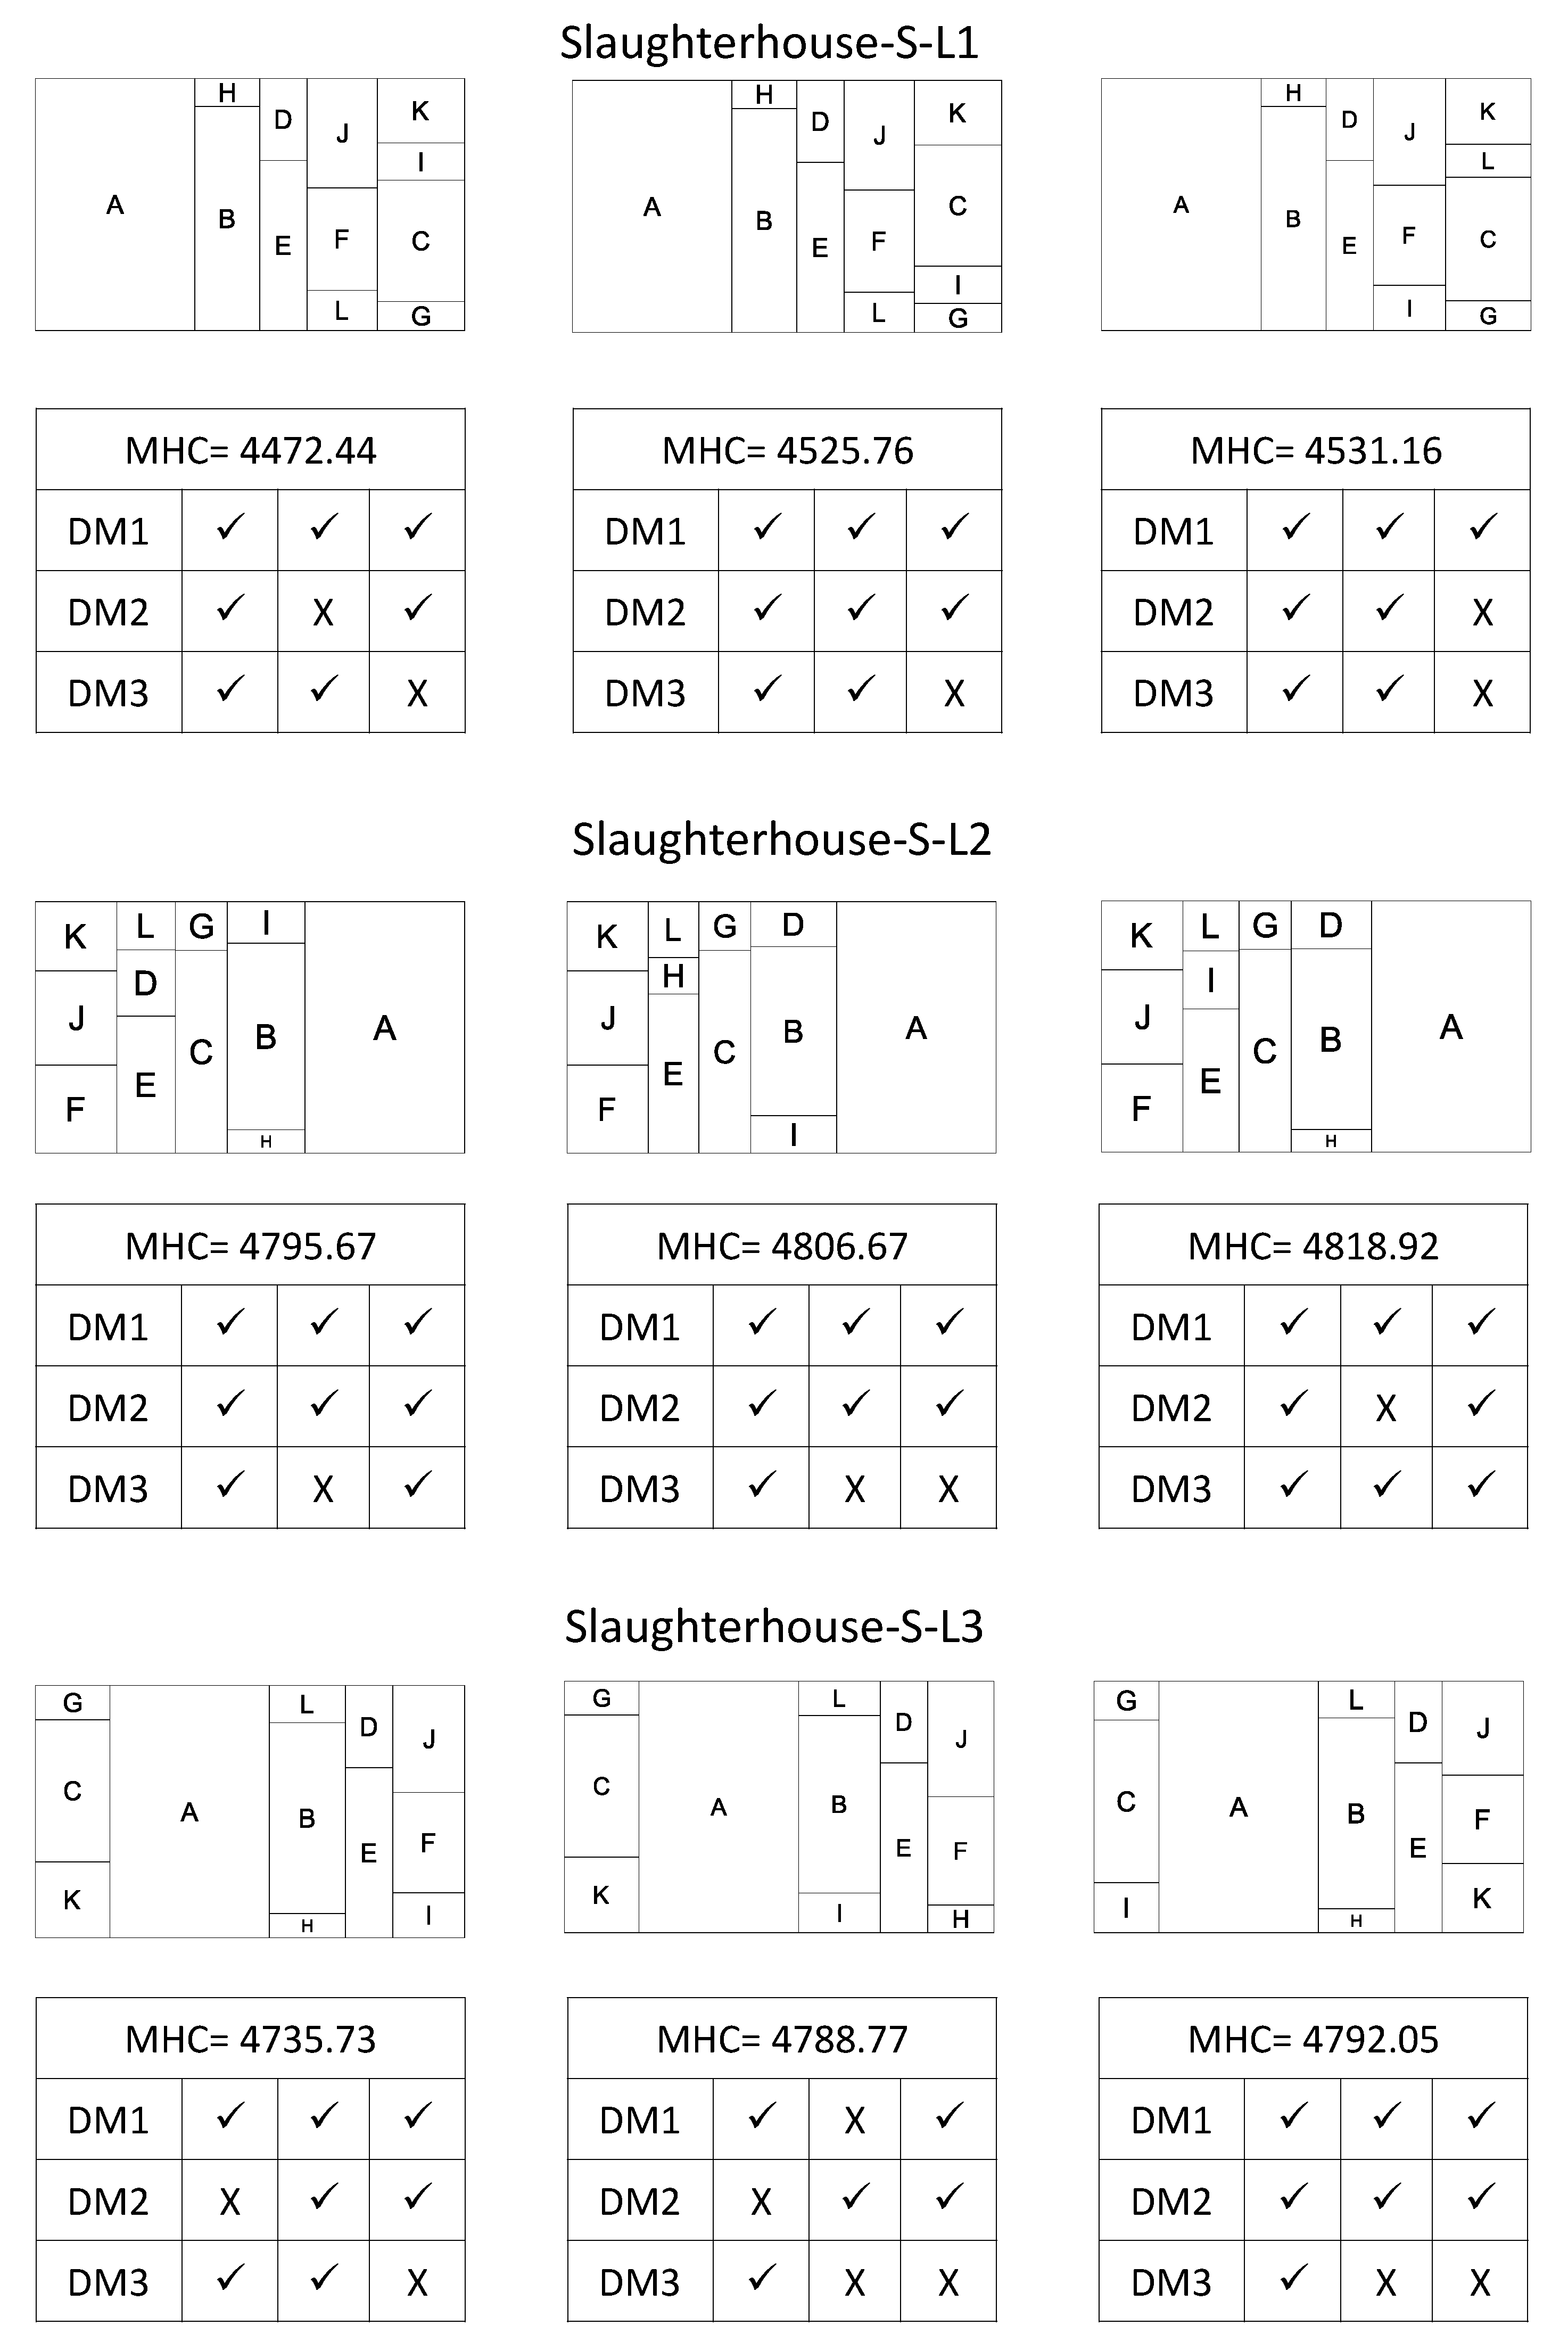
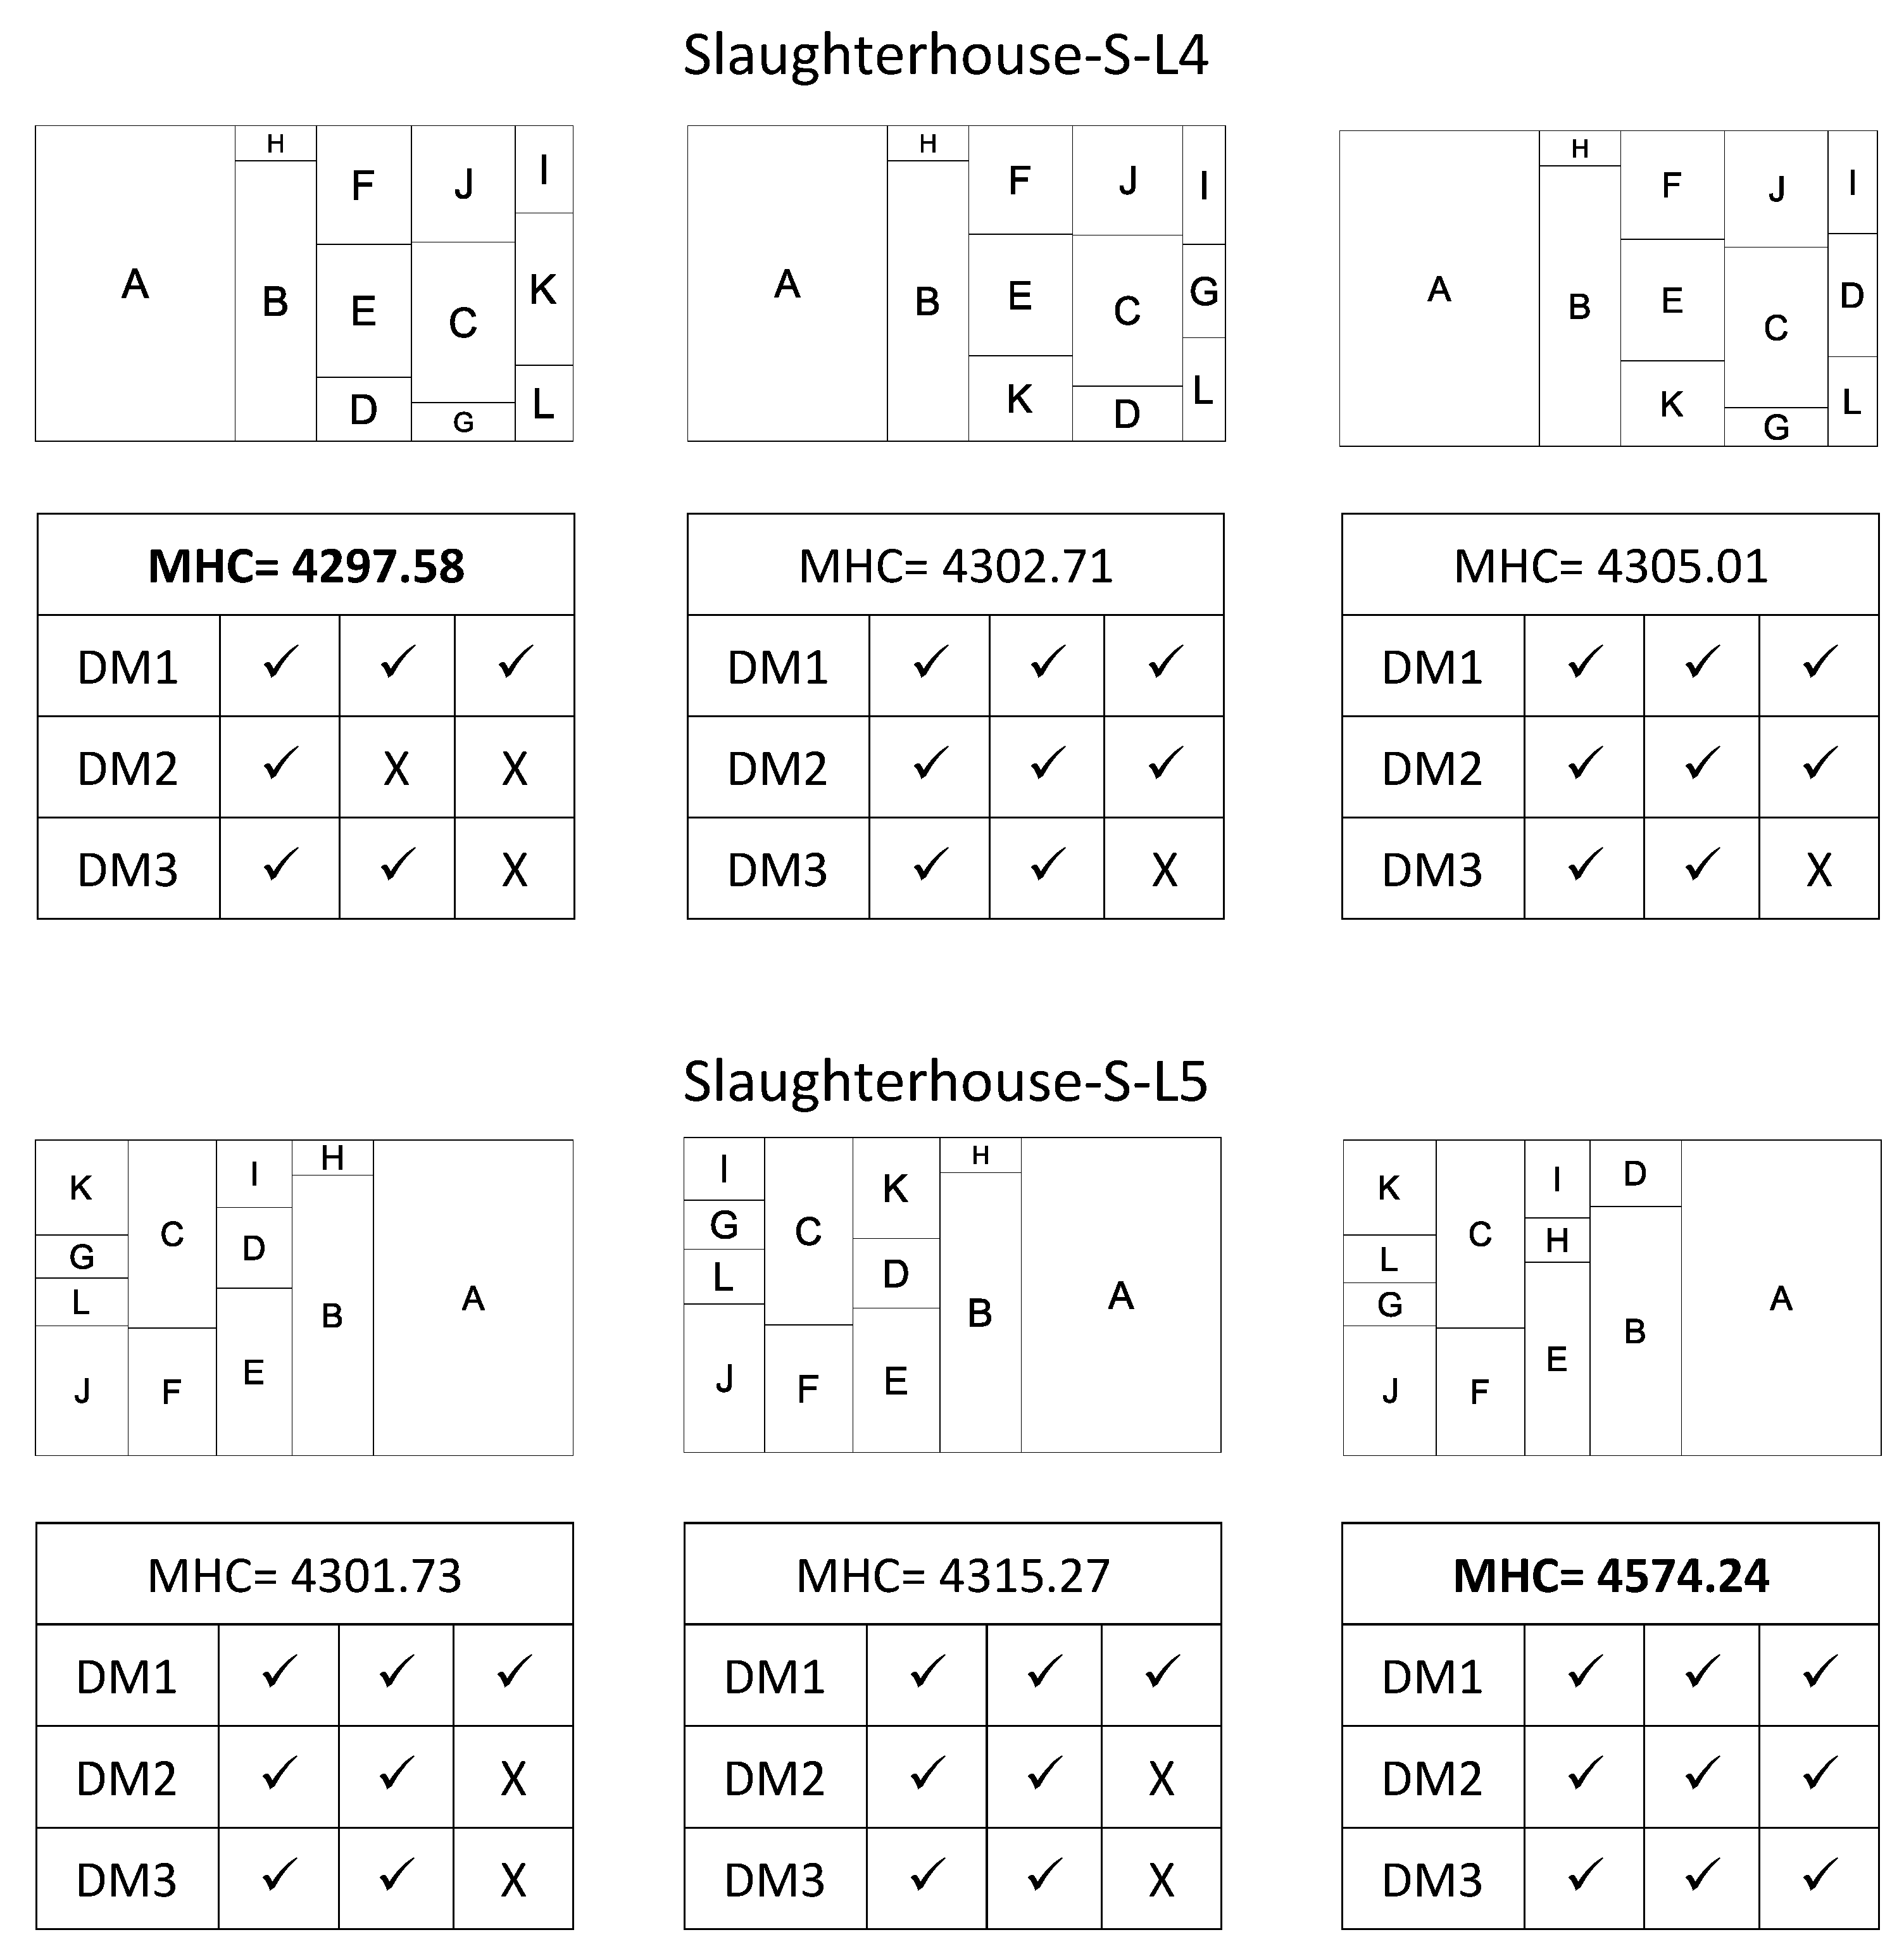
| Slaughterhouse/ Sequential | 4297.58 | A | HB | FED | JCG | IKL | 4574.24 | KLGJ | CF | IHE | DB | A |
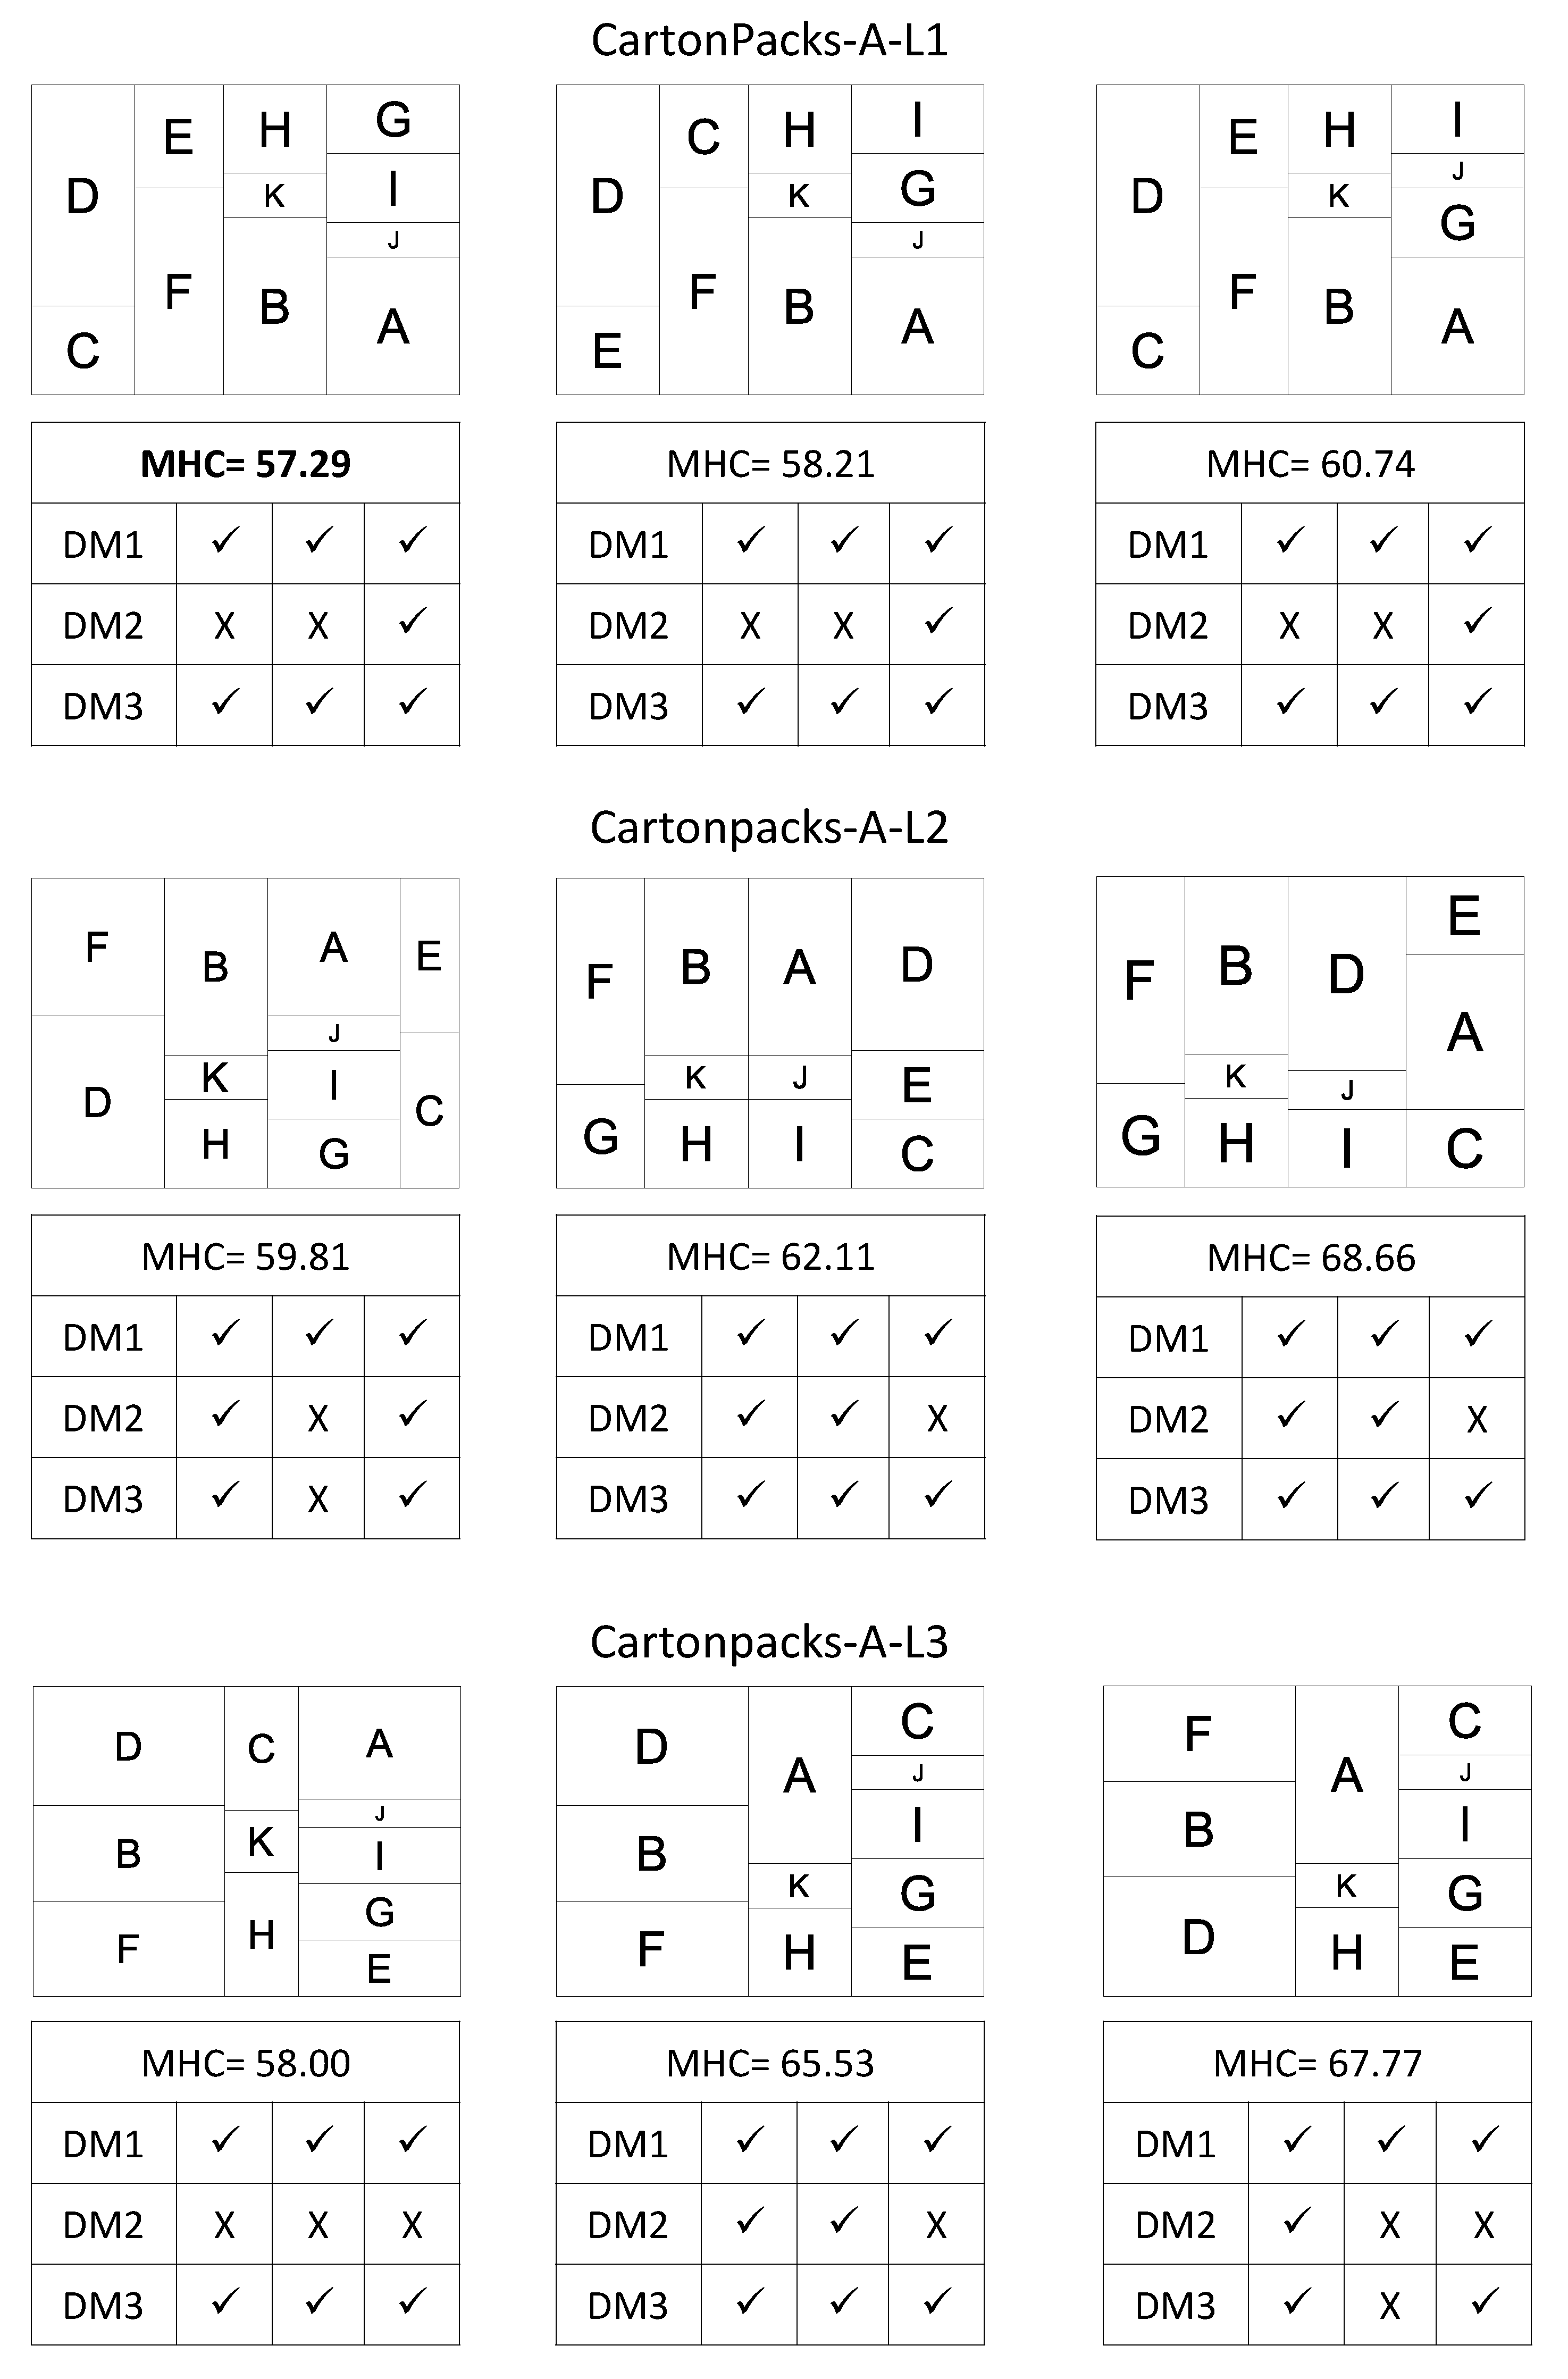
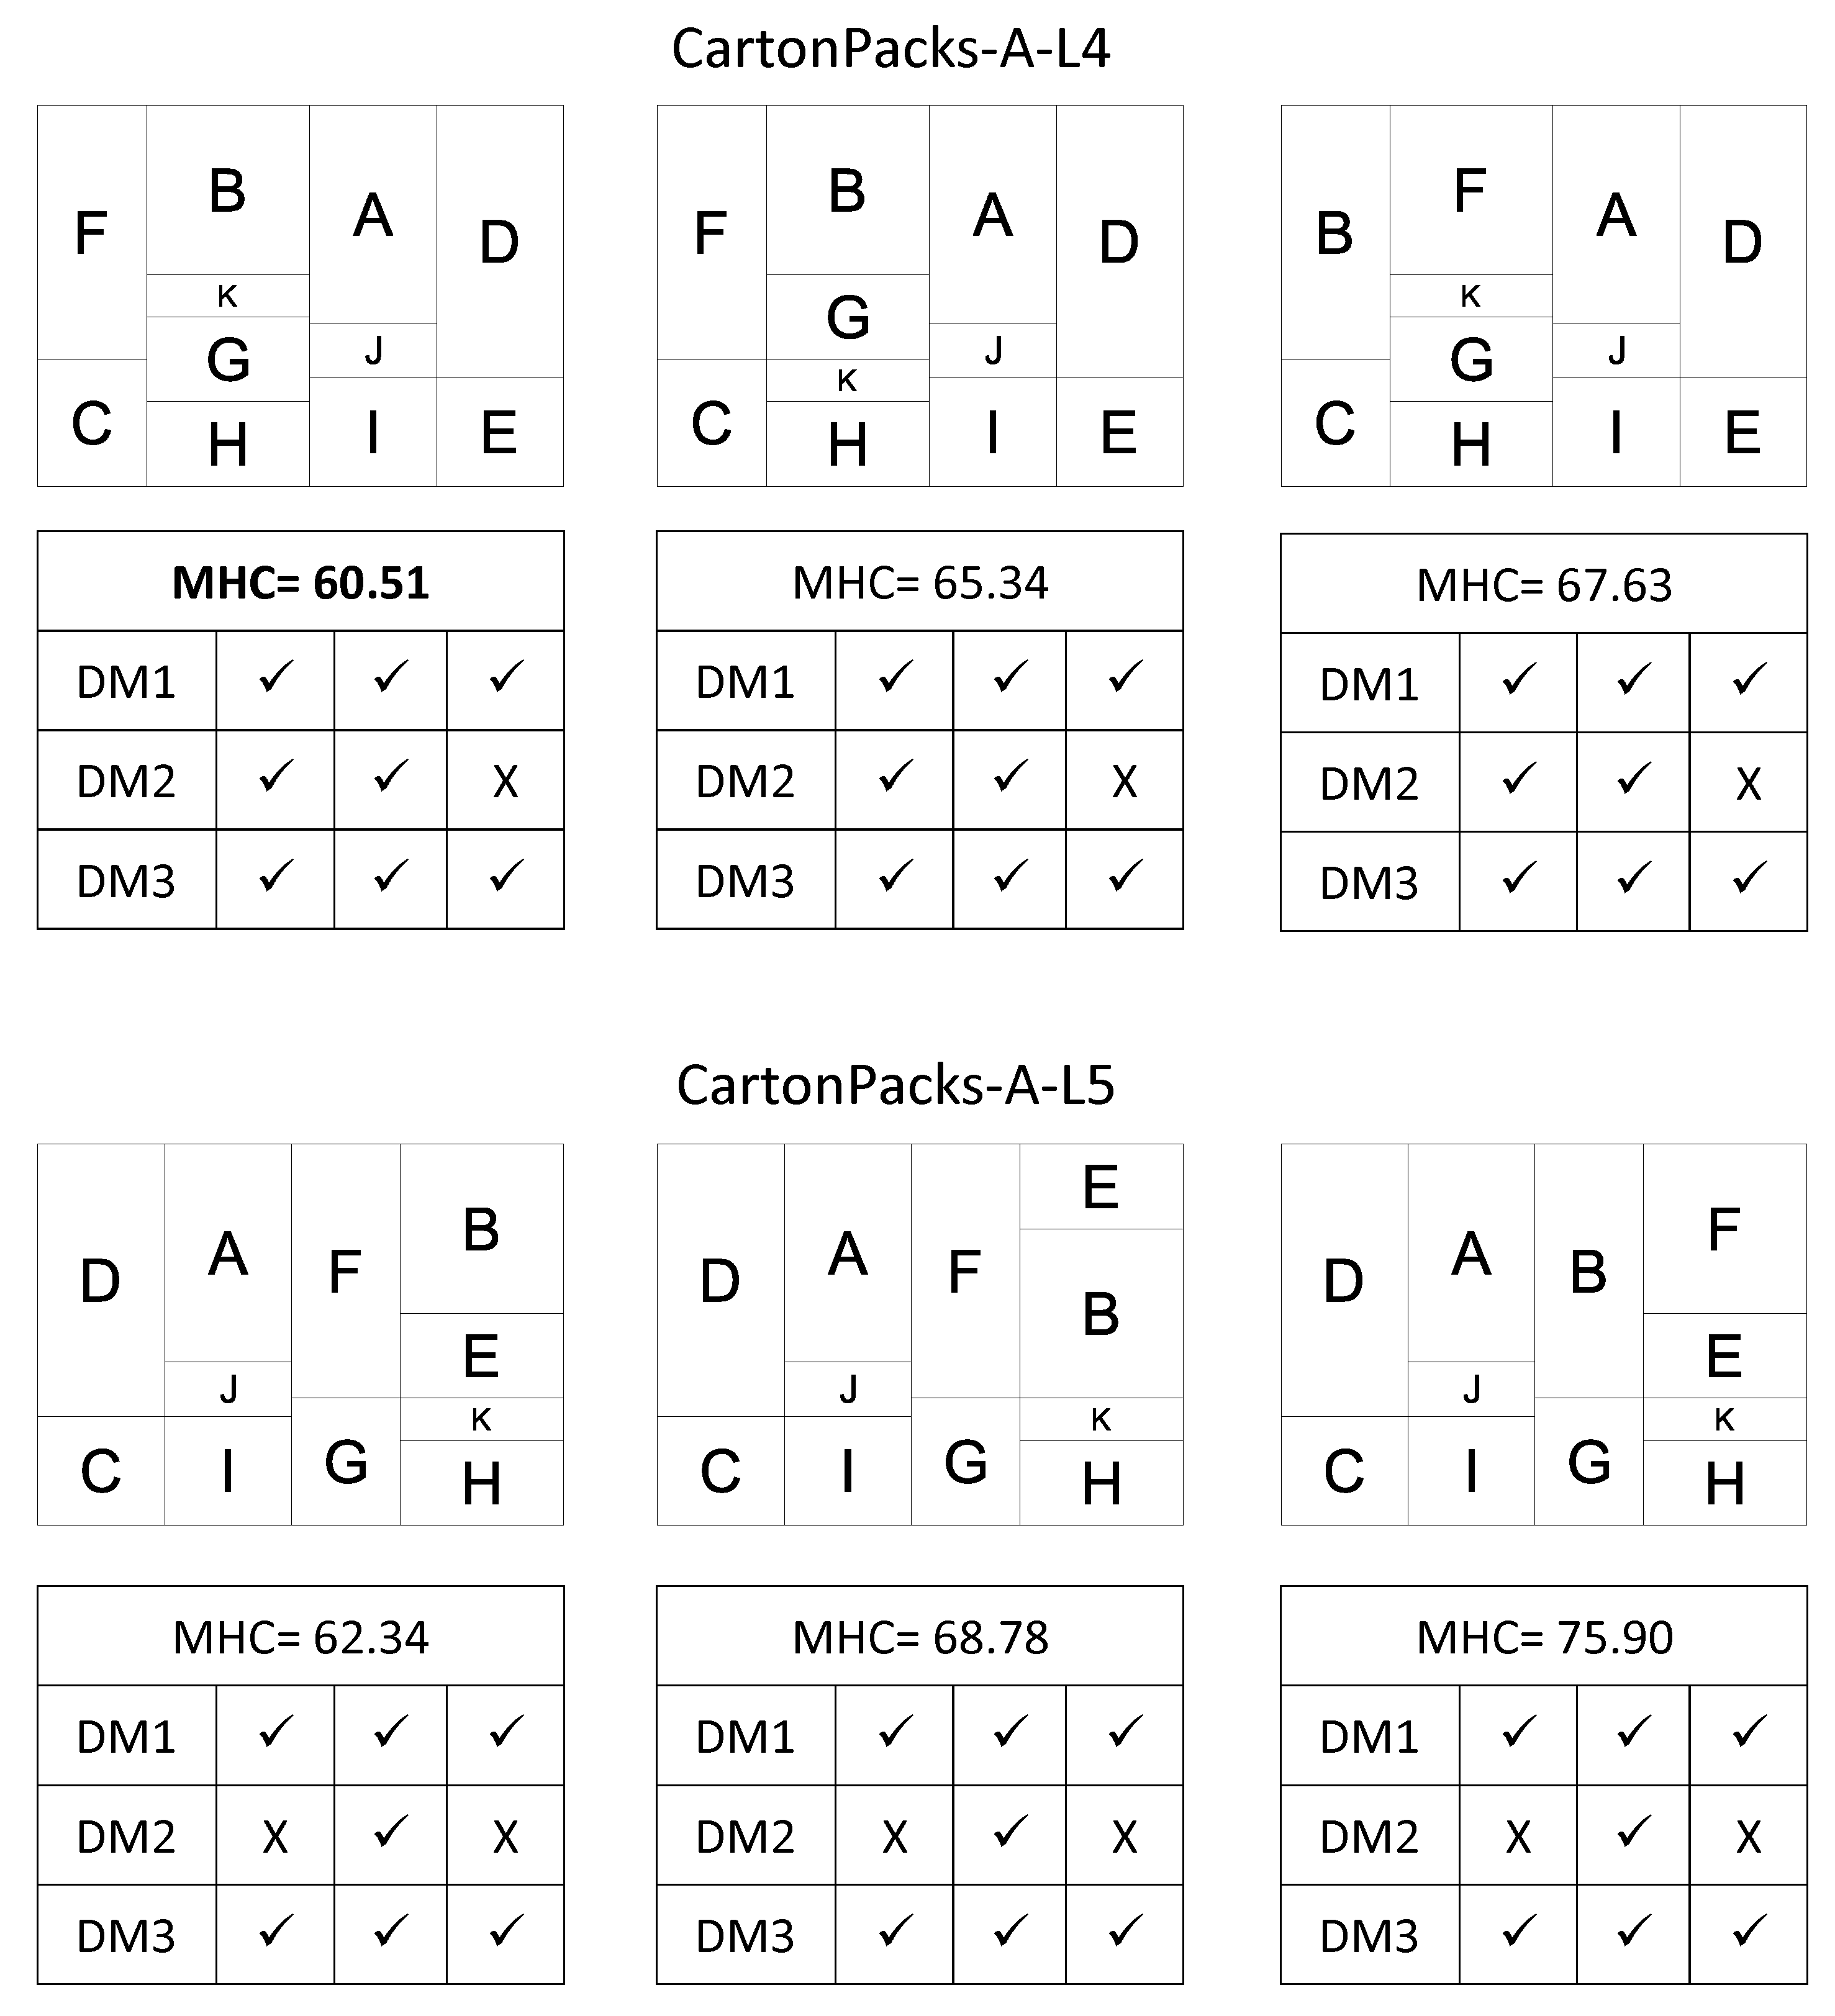
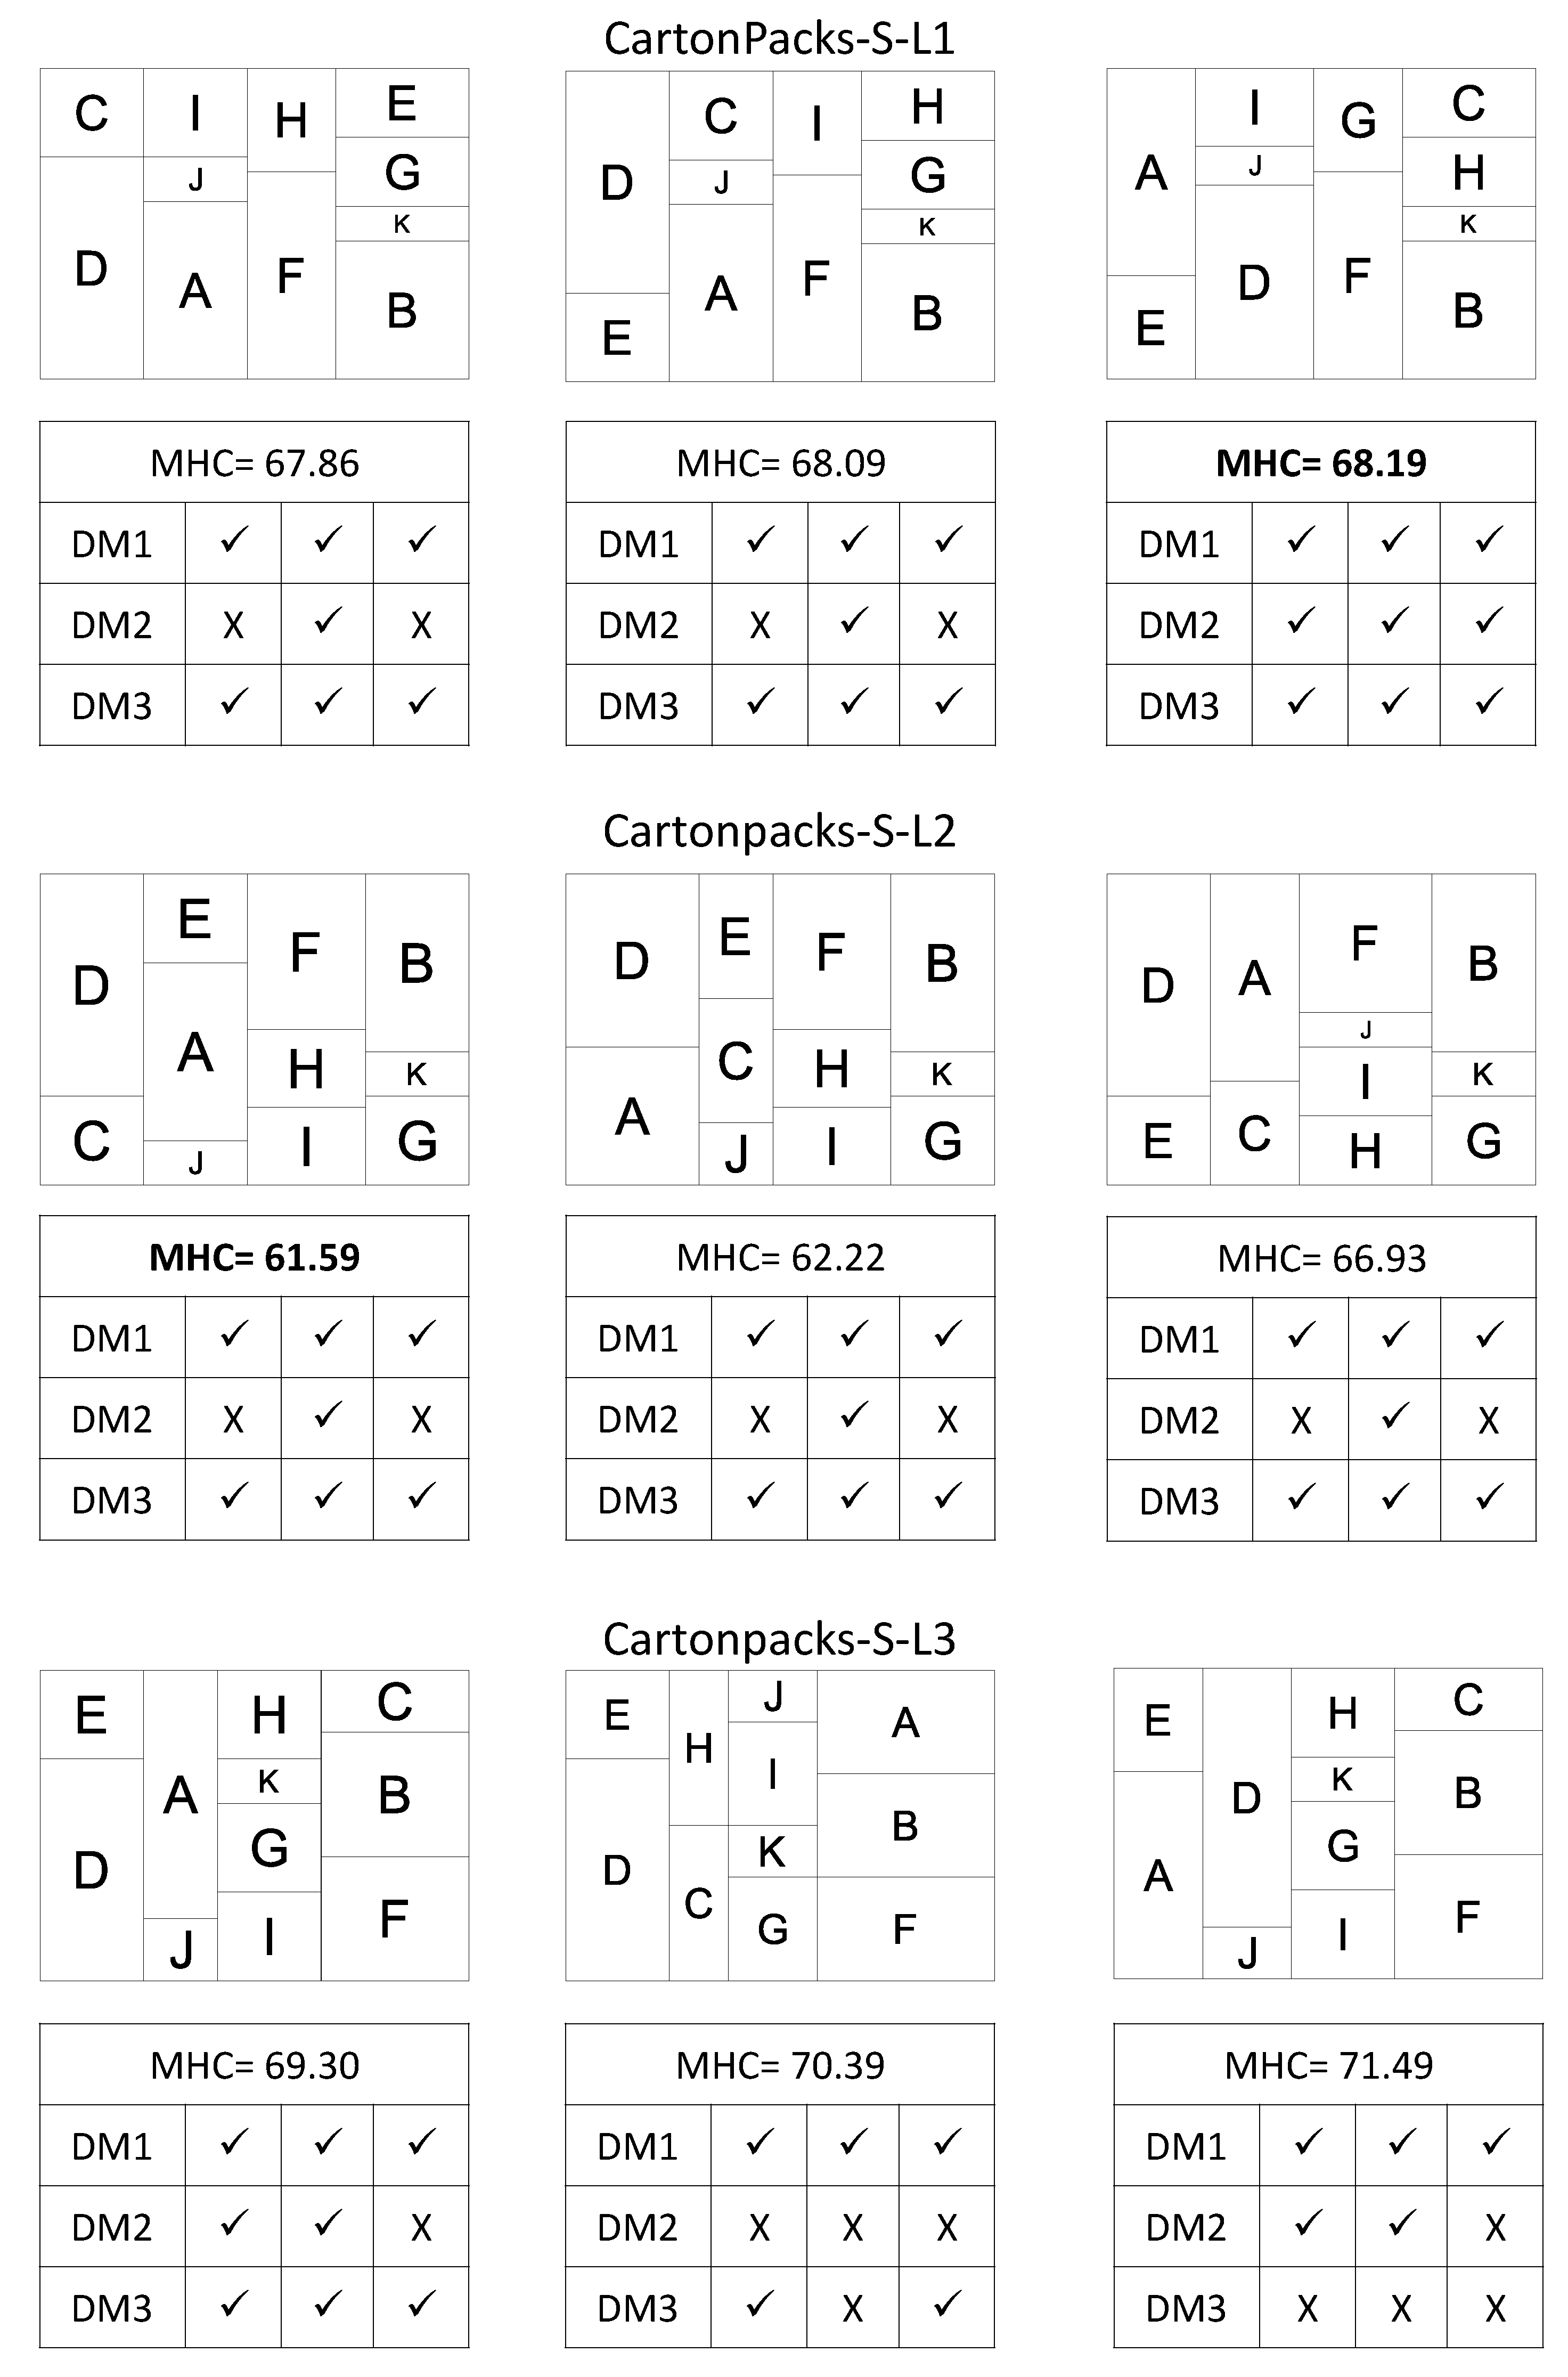
| Cartonpacks/ Alternative | 57.29 | DC | EF | HKB | GIJA | 60.51 | FC | BKHG | AJI | DE |
| Cartonpacks/ Sequential | 61.59 | DC | EAJ | FHI | DKG | 68.19 | AE | IJD | GF | CHKB |
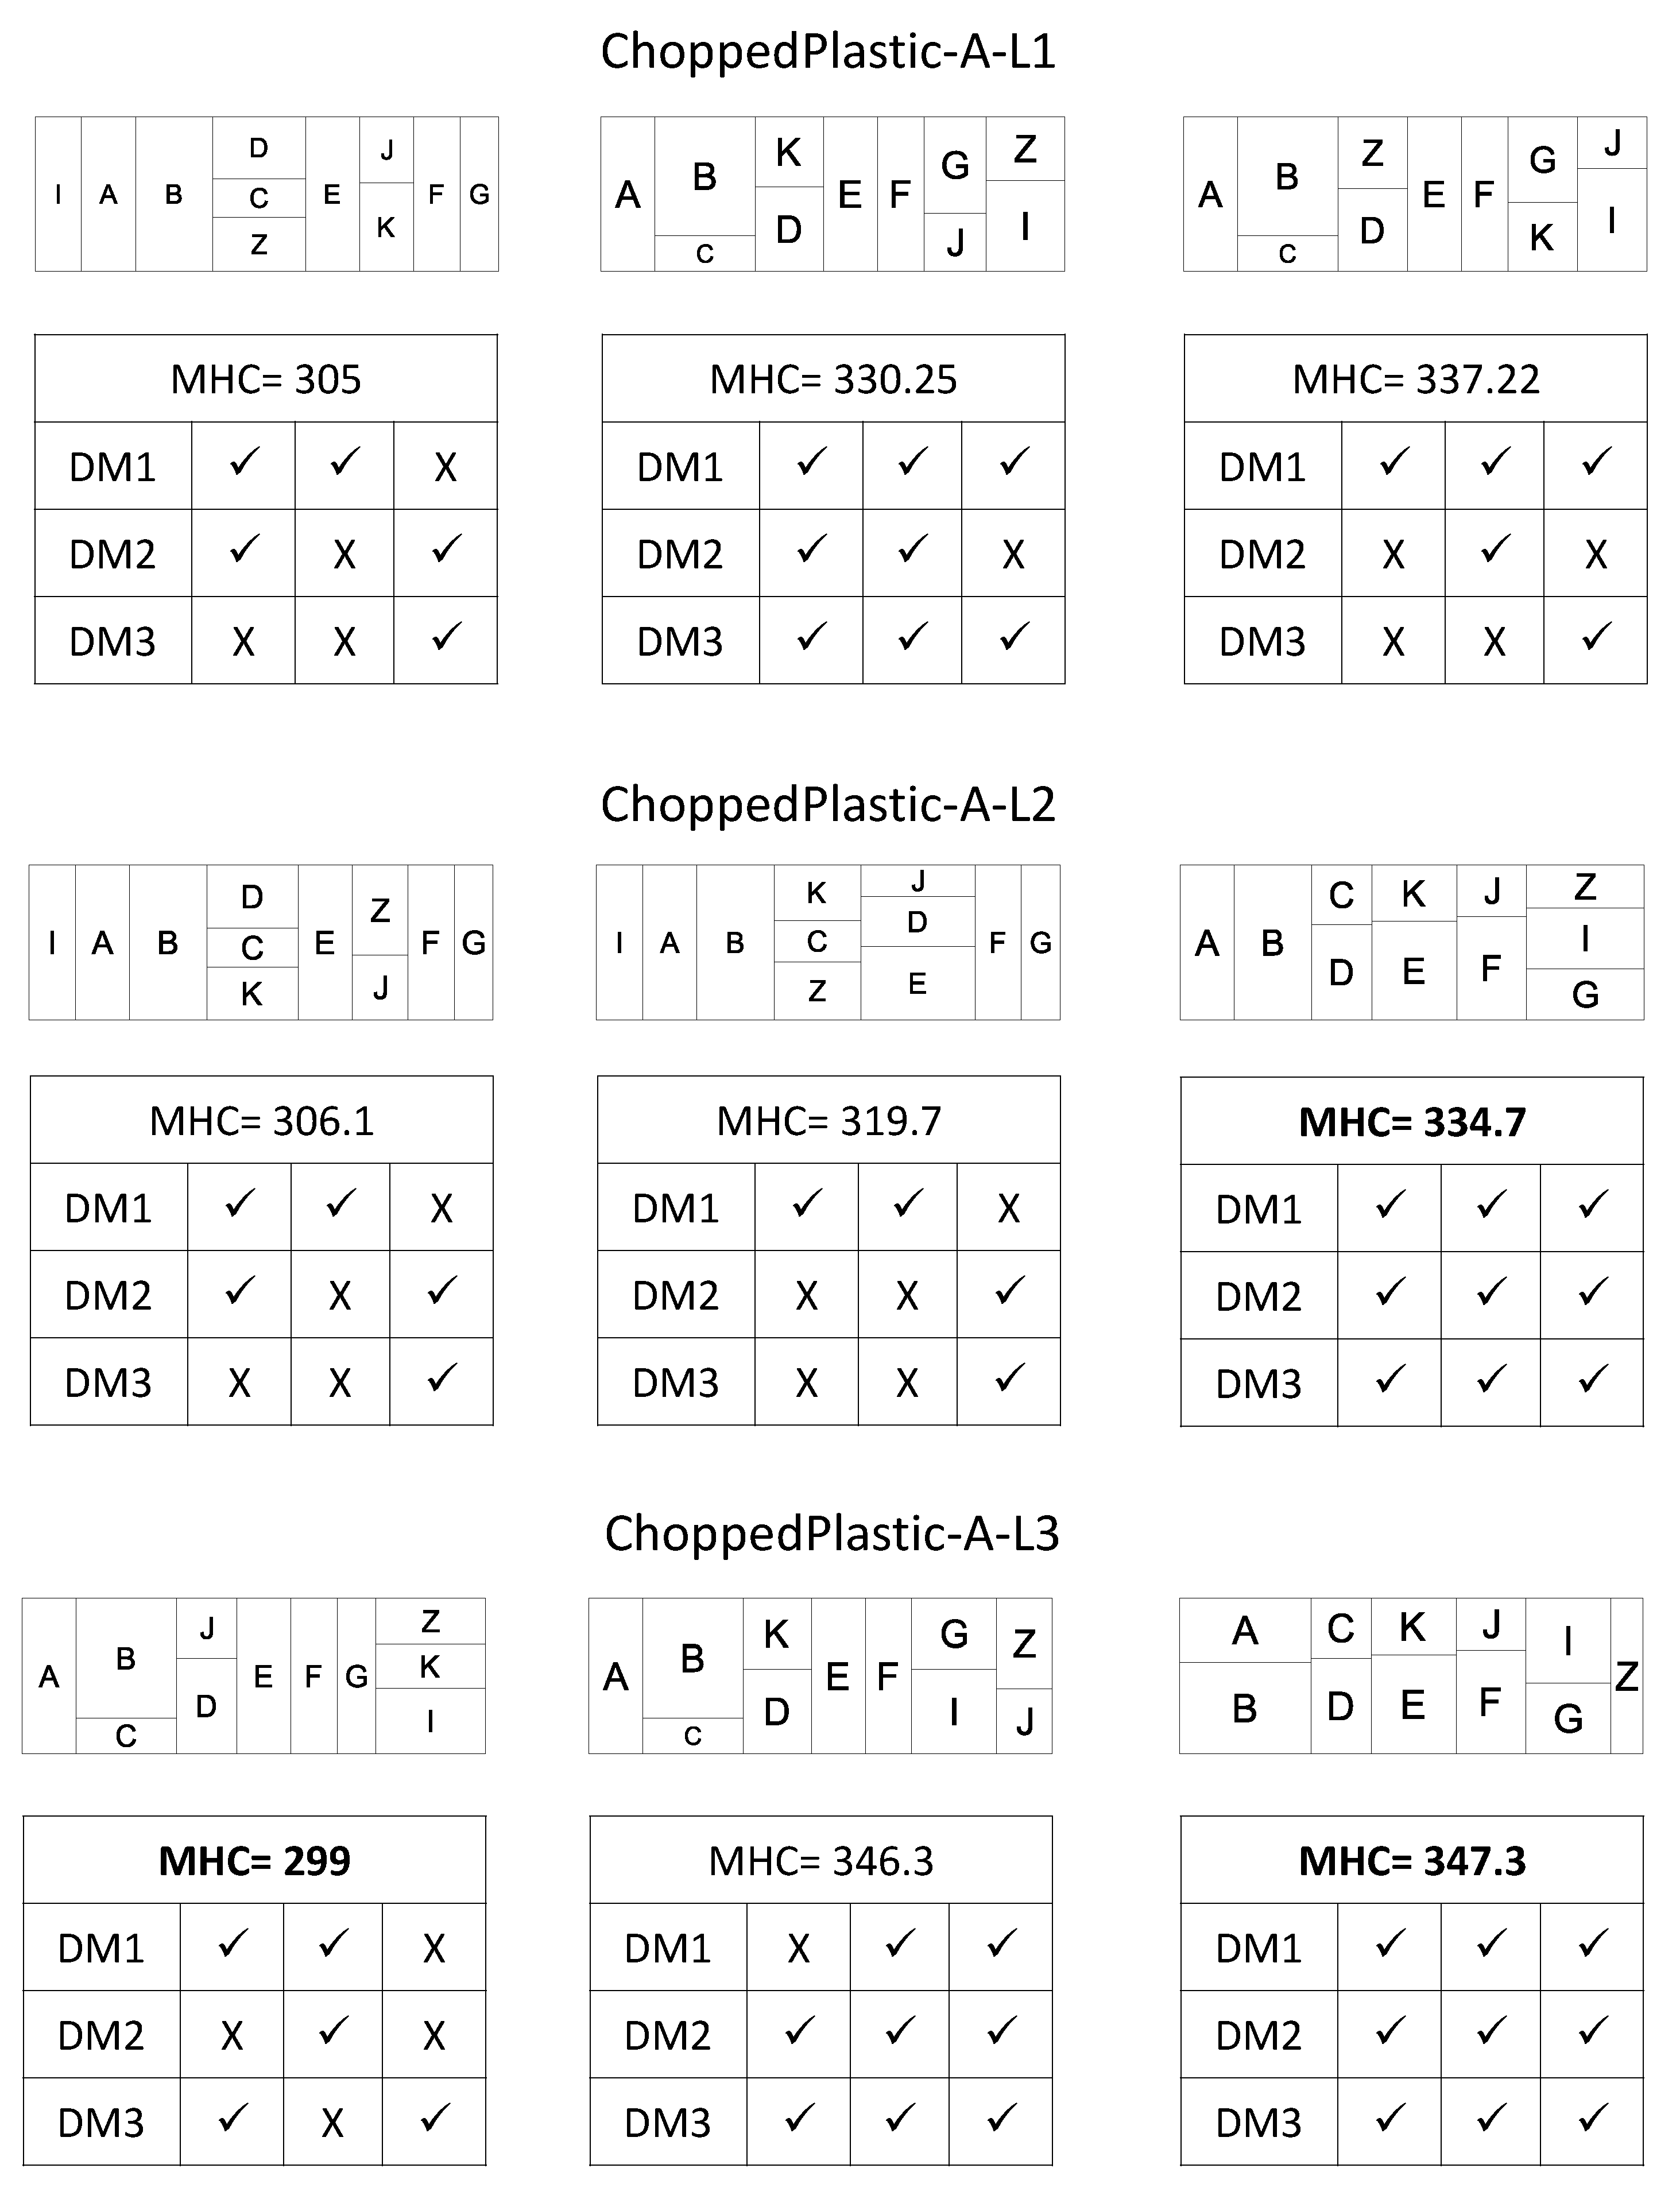
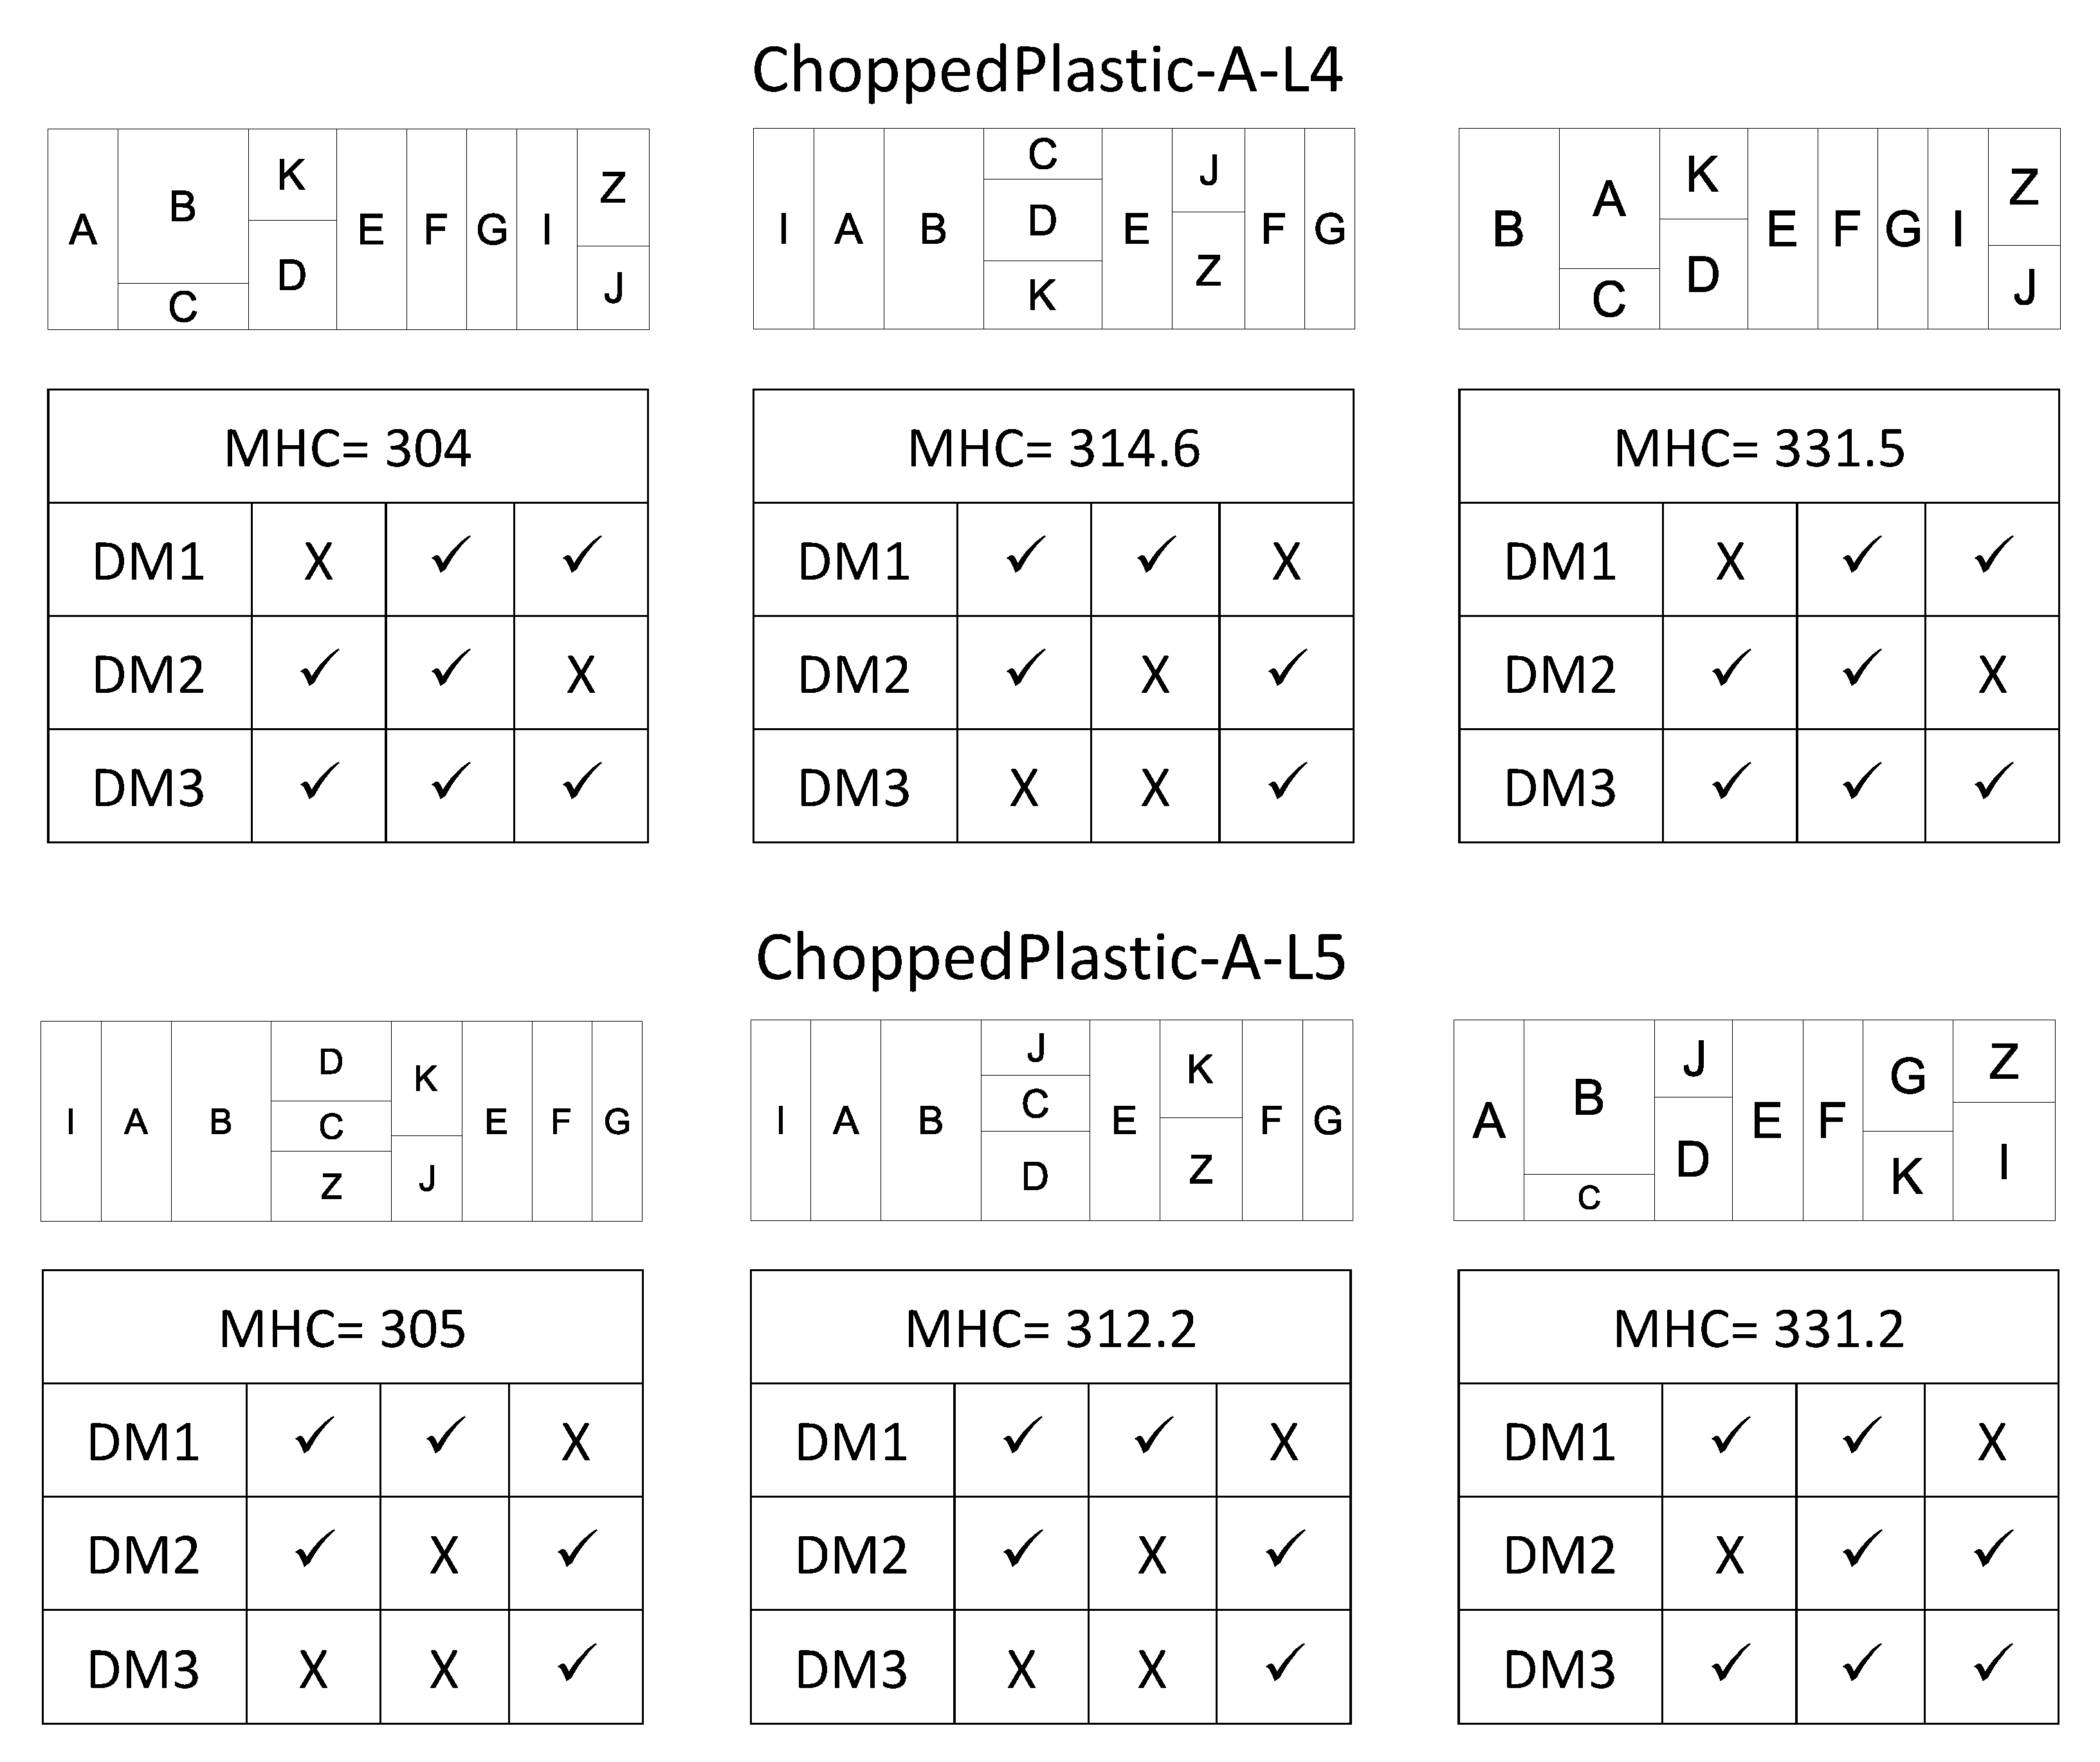
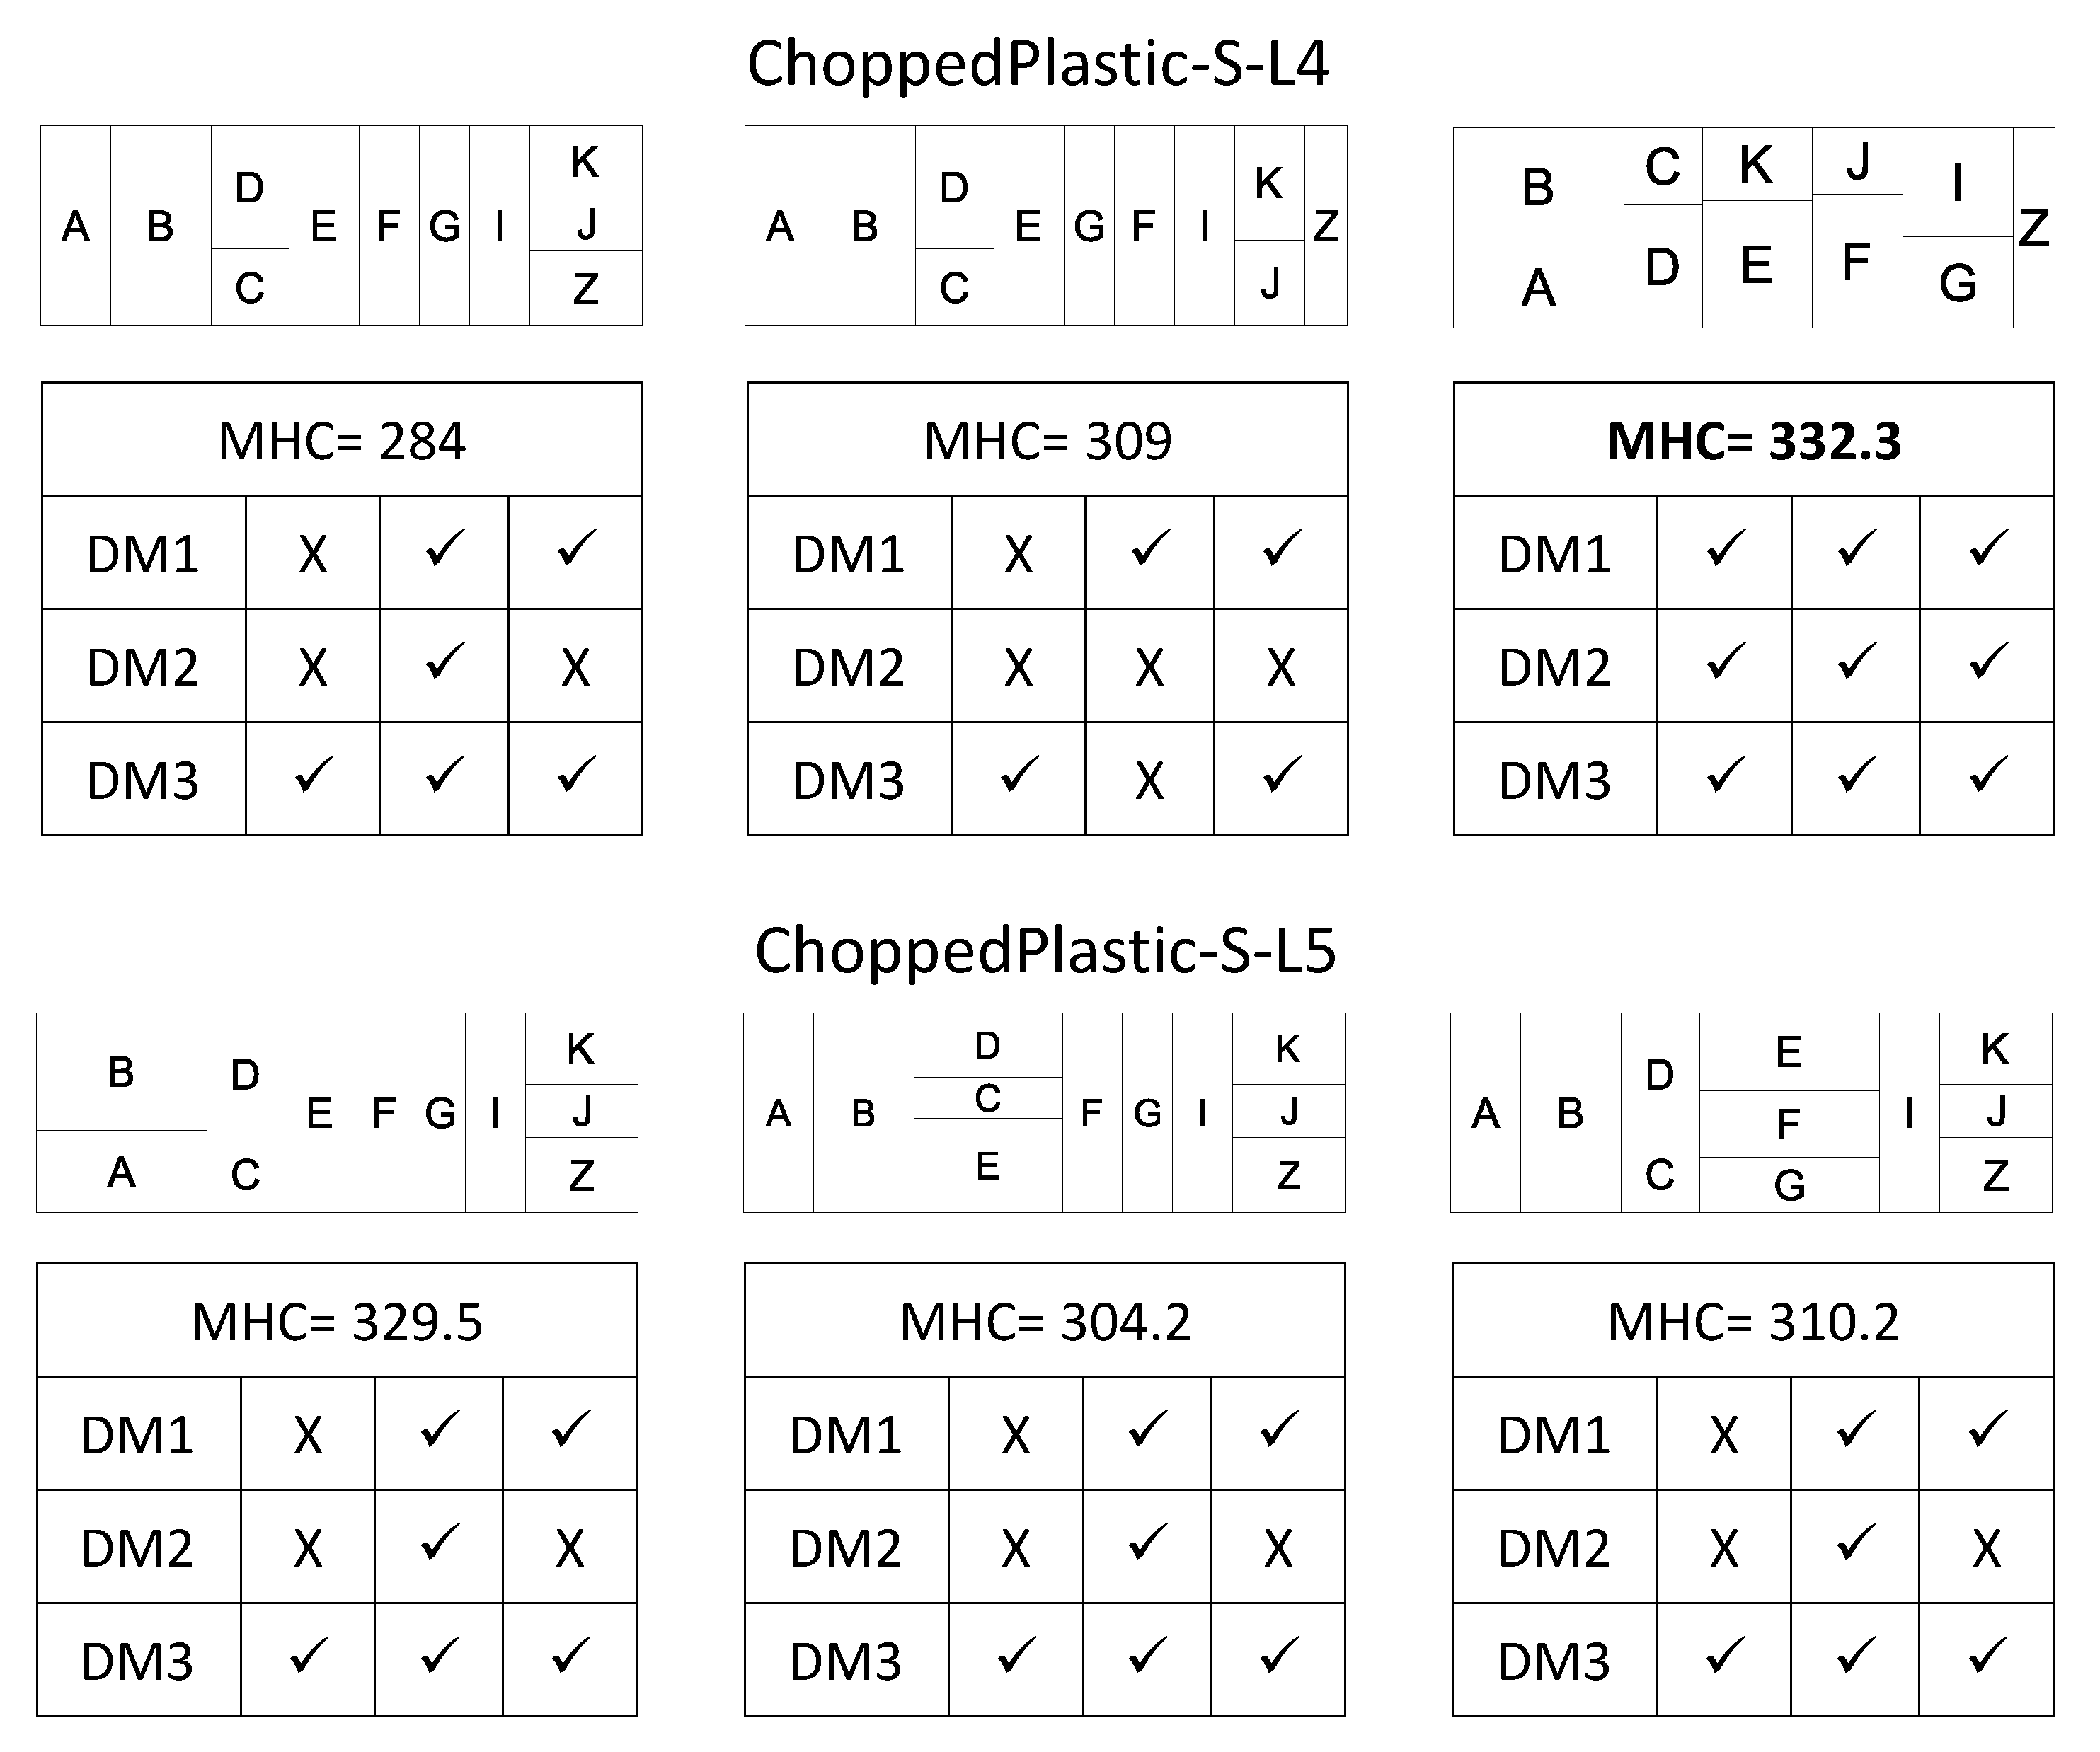
| ChoppedPlastic/ Alternative | 299 | A | BC | JD | E | F | G | ZKI | 334.7 | A | B | CD | KE | JF | ZIG |
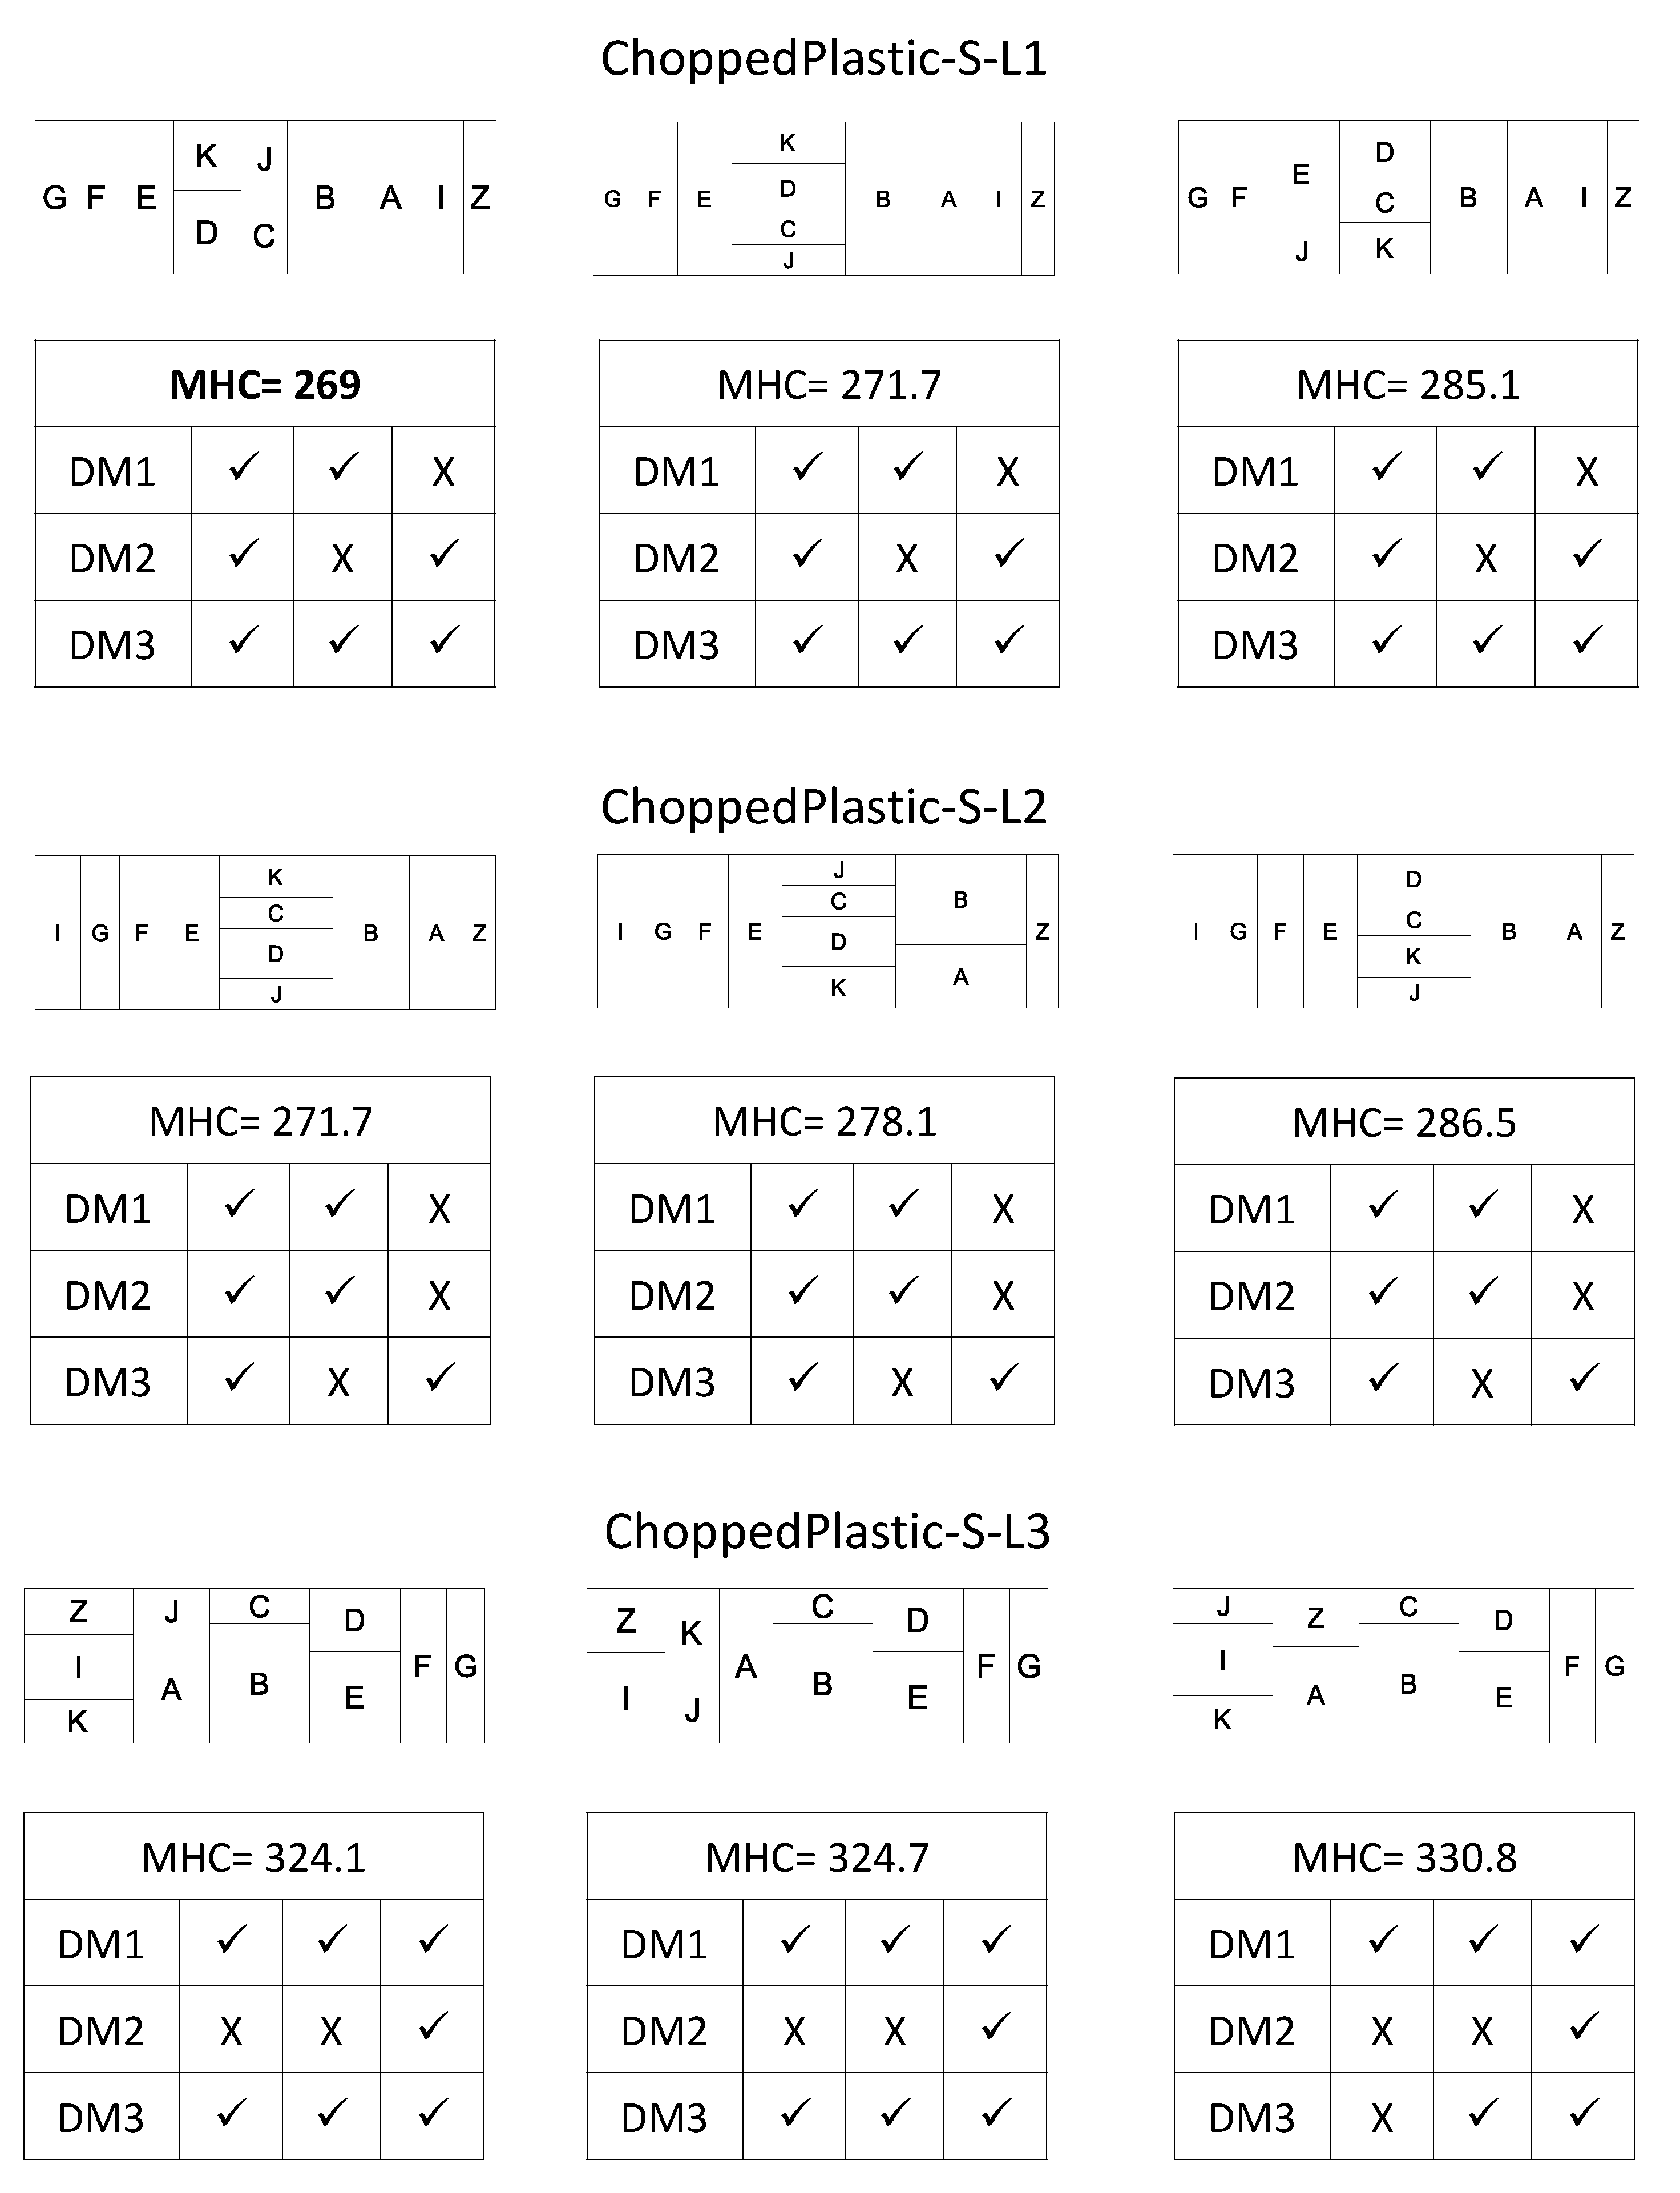
| ChoppedPlastic/ Sequential | 269 | G | F | E | KD | JC | B | A | I | Z | 332.3 | BA | CD | KE | JF | IG | Z |
Publisher’s Note: MDPI stays neutral with regard to jurisdictional claims in published maps and institutional affiliations. |
© 2021 by the authors. Licensee MDPI, Basel, Switzerland. This article is an open access article distributed under the terms and conditions of the Creative Commons Attribution (CC BY) license (https://creativecommons.org/licenses/by/4.0/).
Share and Cite
Salas-Morera, L.; García-Hernández, L.; Carmona-Muñoz, C. A Multi-User Interactive Coral Reef Optimization Algorithm for Considering Expert Knowledge in the Unequal Area Facility Layout Problem. Appl. Sci. 2021, 11, 6676. https://0-doi-org.brum.beds.ac.uk/10.3390/app11156676
Salas-Morera L, García-Hernández L, Carmona-Muñoz C. A Multi-User Interactive Coral Reef Optimization Algorithm for Considering Expert Knowledge in the Unequal Area Facility Layout Problem. Applied Sciences. 2021; 11(15):6676. https://0-doi-org.brum.beds.ac.uk/10.3390/app11156676
Chicago/Turabian StyleSalas-Morera, Lorenzo, Laura García-Hernández, and Carlos Carmona-Muñoz. 2021. "A Multi-User Interactive Coral Reef Optimization Algorithm for Considering Expert Knowledge in the Unequal Area Facility Layout Problem" Applied Sciences 11, no. 15: 6676. https://0-doi-org.brum.beds.ac.uk/10.3390/app11156676