
Comparative Surface Quality of Larch (Larix decidua Mill.) Fretwork Patterns Cut through by CNC Routing and by Laser


Faculty of Furniture Design and Wood Engineering, Transilvania University of Brasov, B-dul Eroilor, nr. 29, 500036 Brasov, Romania
*
Author to whom correspondence should be addressed.
Appl. Sci. 2021, 11(15), 6875; https://0-doi-org.brum.beds.ac.uk/10.3390/app11156875
Submission received: 6 July 2021
/
Revised: 16 July 2021
/
Accepted: 18 July 2021
/
Published: 26 July 2021
(This article belongs to the Special Issue Advances in Wood Engineering and Forestry)
Abstract
:Fretwork, as a decorating technique, can today be performed with modern means by laser or CNC routing, but the tool influence on the surface quality must be well understood for further optimization of the cutting parameters. The paper presents an experimental work for the determination of the influence of the cutting angle with respect to the grain on the surface quality of larch wood (Larix decidua Mill.) cut through by laser and CNC routing at different feed speeds. The research considered geometric fretwork patterns derived from triangle, where the cutting angles with respect to the wood grain were 0°, 15°, 30°, 45°, 60°, 75° and 90°. The feed speeds of the CNC routing were set for 2, 2.5, 3, 3.5 and 4 m/min. The surface quality was analyzed by a range of roughness, waviness and primary profile parameters combined with stereomicroscopic images. Although the principle of cutting and interaction with wood of the two processing tools, laser and CNC, is very different, the analysis with roughness parameters has revealed that the cutting angle with respect to the grain has an essential influence, whatever the cutting tool. The surface quality decreases with an increase in the feed speed of the CNC router and processing at 15° and 60° appears to be the worst option from all angle variants for both types of processing. Cutting by laser is melting wood in latewood areas resulting in a smoothing effect.
1. Introduction
Geometric patterns used for fretted panels have the roots in the Islamic culture and they are constructed following symmetry and mathematical rules and using basic geometric shapes, such as triangle, rectangle and pentagon [1]. There are two main possibilities of using modern technology to obtain wood-fretted panels with complex geometric patterns and they are laser cutting and CNC routing.
As the fretwork manufacture is used for furniture decoration, the aesthetic aspect as well as the quality of processing are important factors which deserve attention and care [2].
Some studies were conducted by researchers to investigate the quality of the surface obtained by using laser technology on various materials by measuring the roughness parameters. Research on Norway maple, which has a uniform texture, has indicated that the roughness parameters (Ra, Rsk, Rt, Rk, Rpk, and Rvk) increased with the laser power and decreased with the laser scanning speed [3]. However, comprehensive studies on surface roughness of wood surfaces cut by the laser are scarce and are limited to a few species. The quality of the surface has been also investigated on CO2 laser cut engineered materials, such as MDF [4], melamine faced particleboard and phenolic resin boards [5], measuring the Ra roughness parameter [4], and the Rz roughness parameter [5]. The results showed that the roughness parameters of the cut surfaces decreased with the increasing laser power and focal point position of the laser beam.
Other studies on laser engraving have shown that the inhomogeneity of the wood species, such as chestnut, oak and pine, plays an important role in the material removal rate because of the burning process, which is more intense for the low-density cells from early wood than for the increased density from the late wood cells [6]. The early wood has wide cells with thin walls, and with the advancement of the seasons, the late wood cells with thicker walls are formed [7]. In an annual ring, the wood density gradually increases and the wood degradation rate under the laser beam action decreases, so that an abrupt transition between early wood and late wood occurs, such as for spruce wood [8]. Glossy surface as a melting layer and strong carbonization were observed for high laser intensity, explained as chemical reaction occurring in the hemicellulose and the lignin complex due to CO2 laser treatment on the wood surface [9]. Laser cutting of spruce wood parallel to the wood grain resulted in the increasing of the width of the cutting kerf with an increasing of laser power and decreasing of the wood density [10].
With regard to the studies on the second processing method, during the cutting process of wood by Computerized Numerical Control (CNC) routers, researchers found an interaction between various input factors, such as wood anatomical structure, grain pattern and orientation, wood moisture content, processing parameters and the quality of the machined wood surfaces. The surface roughness of wood and wood engineering materials was determined by methods based on using surface-measuring equipment, both by contact and contactless. Generally, the average roughness (Ra), the maximum height of profiles (Rz) and the root mean square deviation (Rq) were the roughness parameters used for the evaluation of the processed surface quality [11,12,13,14,15,16]. In this respect, it was determined [11] that pine surface quality is influenced mostly by the cutting direction, whilst for spruce, the significant factors were cutting depth and feed speed. Other studies found that the wood species with high density and low porosity may result in smoother machined surfaces [12,13]. For engineered materials such as MDF, high spindle speeds resulted in better surface quality and increased stepover and feed rate affected negatively the surface roughness [14,15]. It was found that the material is the most significant factor that affects the roughness parameters values, and MDF recorded the highest value of the average roughness parameter (Ra) of the machined surface, compared to spruce edge-glued panel, in the same machining regime [16,17]. A study on the surface quality of edge-glued-panels made of larch wood [18] has shown that the Ra roughness parameter has the lowest value for a spindle speed of 16,000 rpm and a feed speed of 2 m/min.
As a general remark from judging the reports from the literature related to the evaluation of surface quality, it can be concluded that researchers have limited their studies to one or two roughness parameters and a comprehensive interpretation is lacking. Examining the surface quality is a complex process and the surface cannot be characterized by a single parameter. There are many parameters proposed by various standards, which must be well understood in order to be used for surface characterization and with a correct meaning and interpretation. The most used parameters in the literature cannot always be interpreted in isolation from other parameters [19].
The surface quality is most commonly characterized by the surface roughness. According to [20], roughness represents “the finer irregularities of the surface texture that usually result from the inherent action of the production process or the material condition” [21]. However, apart from surface roughness, other parameters which indicate the surface undulation, therefore characterizing longer wavelength irregularities, can also be useful for a more comprehensive understanding of the effect of processing on wood surface topography. The main problem in assessing the wood surface quality is the overlapping of the roughness components to the anatomical structure and surface irregularities due to machining, so it is recommended to analyze a large set of parameters for a good evaluation [22].
Therefore, the study in this paper will cover a comprehensive set of parameters for surface characterization, such as Ra, Rp, Rv, Rsk, Wa, Wt, Pa, Pt [23] and the Abbot-curve parameters: Rk, Rpk and Rvk [24]. Since no study was found in the literature simultaneously investigating the effect of CNC routing and laser cutting on the surface quality of fretwork patterns of wood, such a research appears opportune. The purpose of this paper is to investigate and compare the quality of the surfaces obtained by laser cutting and CNC milling of larch wood (Larix Decidua Mill.) fretwork patterns cut at various angles with respect to the grain and at different feed speeds of the CNC routing. The interpretation of the surface quality results will be supported by the stereo-microscopic analysis of larch.
2. Materials and Methods
2.1. Wood Samples
Panels with sizes of 370 mm × 200 mm × 12 mm were cut from straightened and planed larch wood planks. The planks were further processed in fretwork patterns derived from triangle, by laser and CNC routing, respectively. The cut-out wood for investigation were samples with sizes of 80 mm × 11 mm × 12 mm with processed edges at 0°, 15°, 30°, 45°, 60°, 75° and 90° with respect to the wood grain.
2.1.1. Samples Processed by CNC Milling
The CNC router, type ISEL GFV, German production, with 3 axes was used to cut the samples with spindle speed of 15,000 rpm and variable feed speeds of 2 m/min, 2.5 m/min, 3 m/min, 3.5 m/min and 4 m/min. The cutting depth was set up at 2 mm.
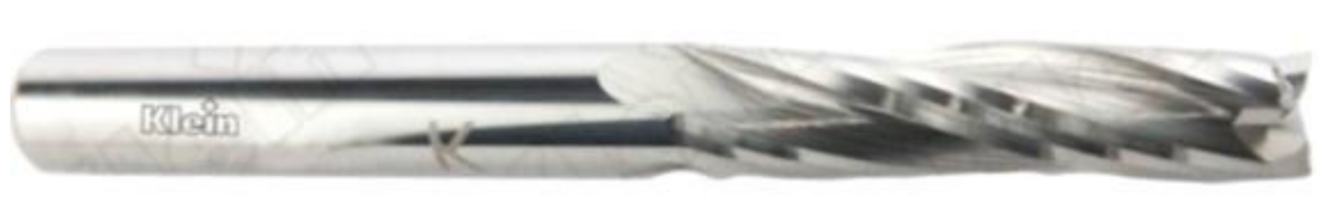
Integral Helical CMS milling cutter, with Z = 2 UPCUT DR, the diameter of 3 mm and length of 40 mm has been used for cutting the samples (Figure 1).
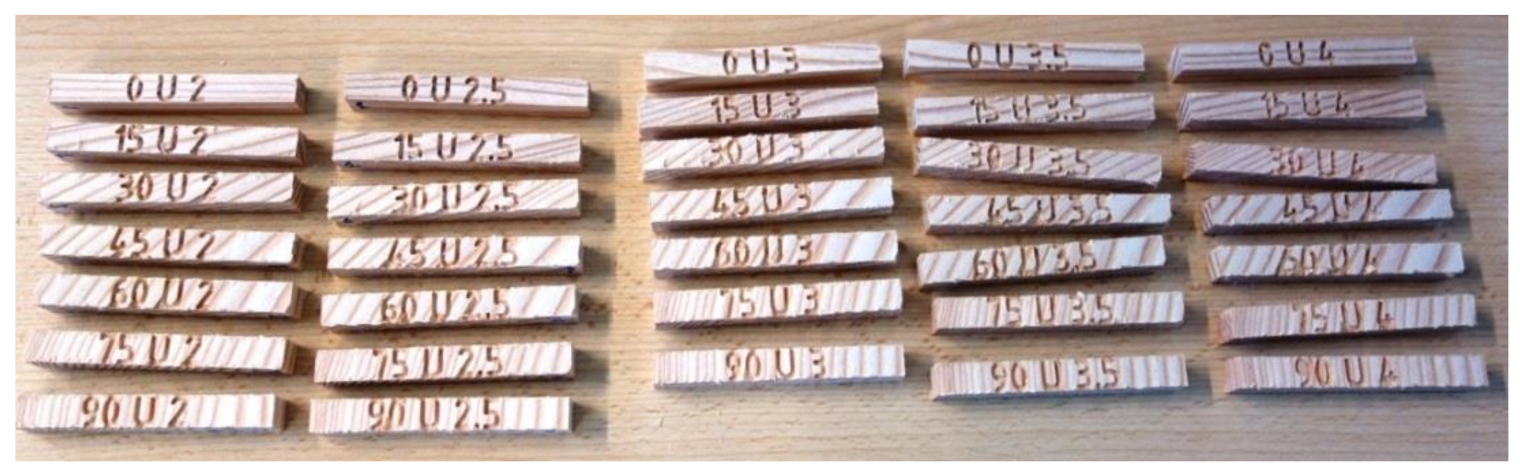
The samples were marked for their cutting angle with respect to the grain, one for each angle and feed speed (2 m/min, 2.5 m/min, 3 m/min, 3.5 m/min and 4 m/min) so that a total of 35 samples processed on both edges were available for measurement (Figure 2).
2.1.2. Samples Processed by Laser
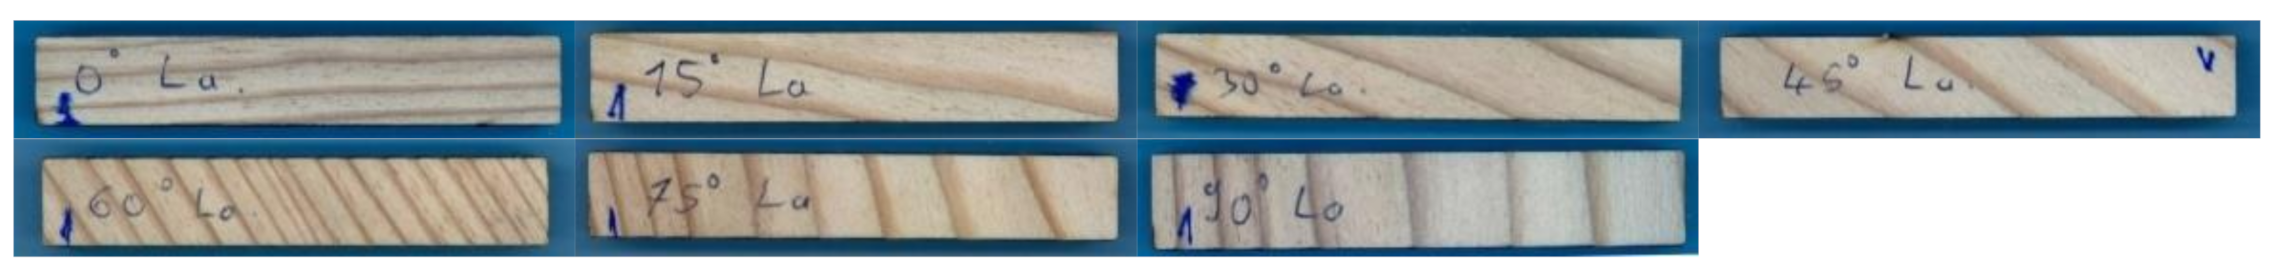
The laser engraving and cutting machine OmniBEAM 150 has been used for cutting the samples from the larch wood panels using the same seven angles with respect to the grain as in case of CNC routing: 0°, 15°, 30°, 45°, 60°, 75° and 90°. The equipment has the laser power of 150 W and maximum cutting speed of 50.8 m/min and works with nitrogen as the assist gas. The BeamHMI software was used to configure the position of the samples on the panel. A power of 100% was set up for cutting the samples presented in Figure 3. Seven samples, one for each cutting angle were prepared.
2.2. Surface Quality Measurements
Surface quality measurements were performed using a MarSurf XT20 instrument manufactured by MAHR Gottingen GMBH (Göttingen, Germany), fitted with a MFW 250 scanning head with a tracing arm in the range of ±750 µm and a stylus with a 2-µm tip radius and 90° tip angle, which measured the specimens along the processing direction, at a speed of 0.5 mm/s, a low scanning force of 0.7 mN, and a lateral resolution of 5 µm. Two processed edges per category provided 3 profile measurements each, with a length of 50 mm, so that a total of six profiles were analyzed for each processing combination. This meant a total of 252 measured profiles for both processing methods (210 for CNC router and 42 for laser).
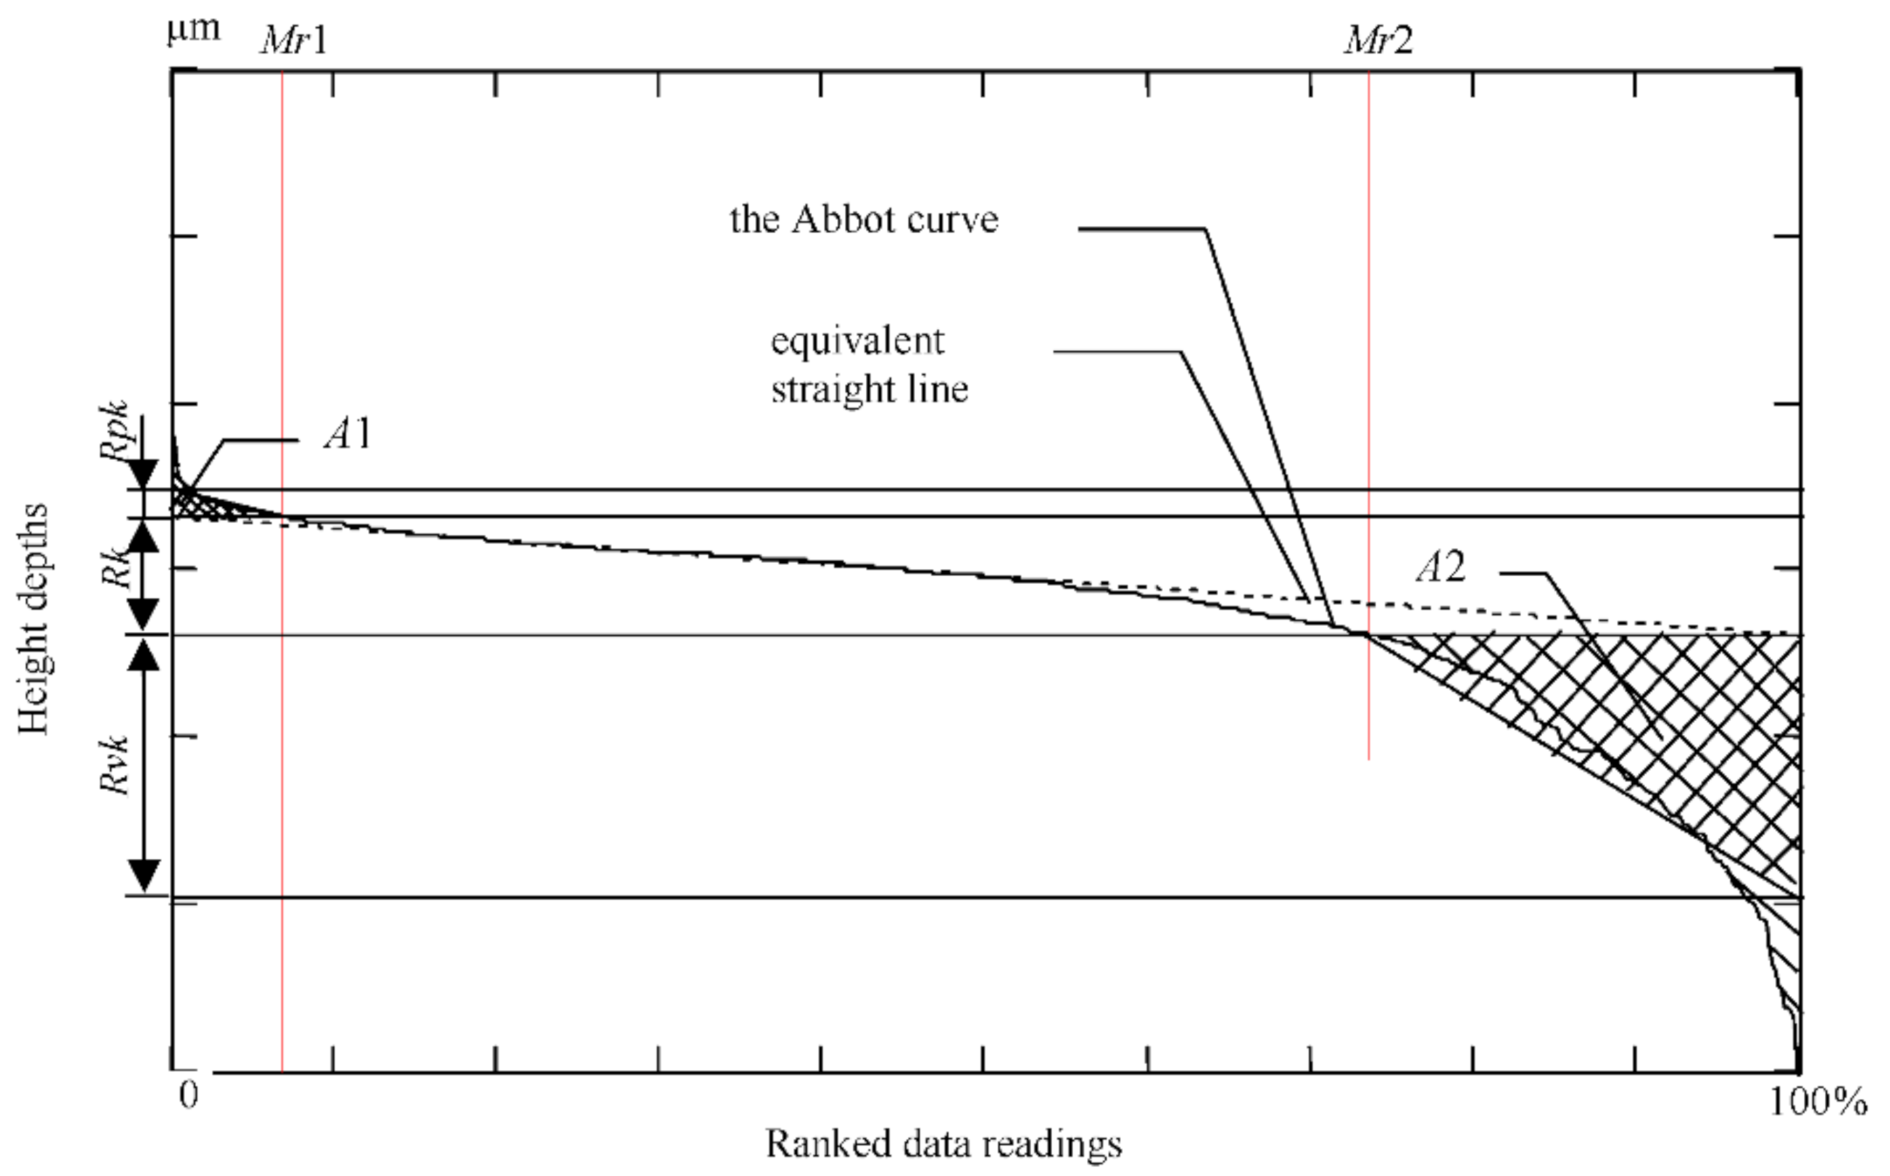
The scanned profiles were processed with the MARWIN XR20 software provided by the instrument supplier (Göttingen, Germany). After removing the form error, the primary profiles were obtained, out of which, P parameters were calculated. From these, other two types of profiles were generated by separating the irregularities in two types of wavelengths: waviness profiles and roughness profiles, which issued the W parameters and R parameters. The longest wavelengths correspond to waviness and the shortest to roughness. The separation was made with a robust Gaussian regression filter [25], with a cut-off length of 2.5 mm recommended for wood [26,27]. Mean values parameters were calculated, such as: Ra (arithmetic mean deviation of the roughness profile), Rp (the maximum profile peak height), Rv (the largest absolute profile valley depth), Rsk (skewness of the profile), Wa (arithmetic mean deviation of the waviness profile), Wt (total height of the waviness profile), Pa (arithmetic mean deviation of the primary profile), Pt (total height of the primary profile) from [23]. Other parameters were the Abbot-curve parameters: Rk (the core roughness depth), Rpk (the reduced peak height), and Rvk (the reduced valley depth) from [24]. For clarity, the calculation of Abbot-curve parameters is illustrated in Figure 3.
Rk is the parameter that best characterizes the processing roughness and is the least influenced by wood anatomical cavities [19]. It is calculated from the Abbot-curve and measures the height of the core roughness, region defined by the highest concentration of data points in a measured profile, which excludes isolated peaks and isolated valleys. The calculation of Rk is represented in Figure 4 [19]. Rpk in Figure 4 is a measure of the isolated peaks, which for a processed wood surface could be raised grain and fuzziness. Rvk is a measure of isolated surface gaps caused by material being pulled-out during processing and/or anatomical cell lumens that exceed the depth of the processing marks.
2.3. Stereo-Microscopy Analysis
The stereo-microscope NIKON SMZ 18-LOT2 (Nikon Instruments, Melville, NY, USA), with 405x total magnification was used for the microscopic investigations of the cut edges, both for the samples processed by CNC milling and laser cutting. The stereo-microscopic analysis was performed on specific areas of the edges, in order to compare the surface topography visualized with the microscope with the results obtained by surface measurements.
3. Results and Discussions
3.1. Surface Quality Measurements
3.1.1. Surface Quality Resulting from CNC Milling of Wood
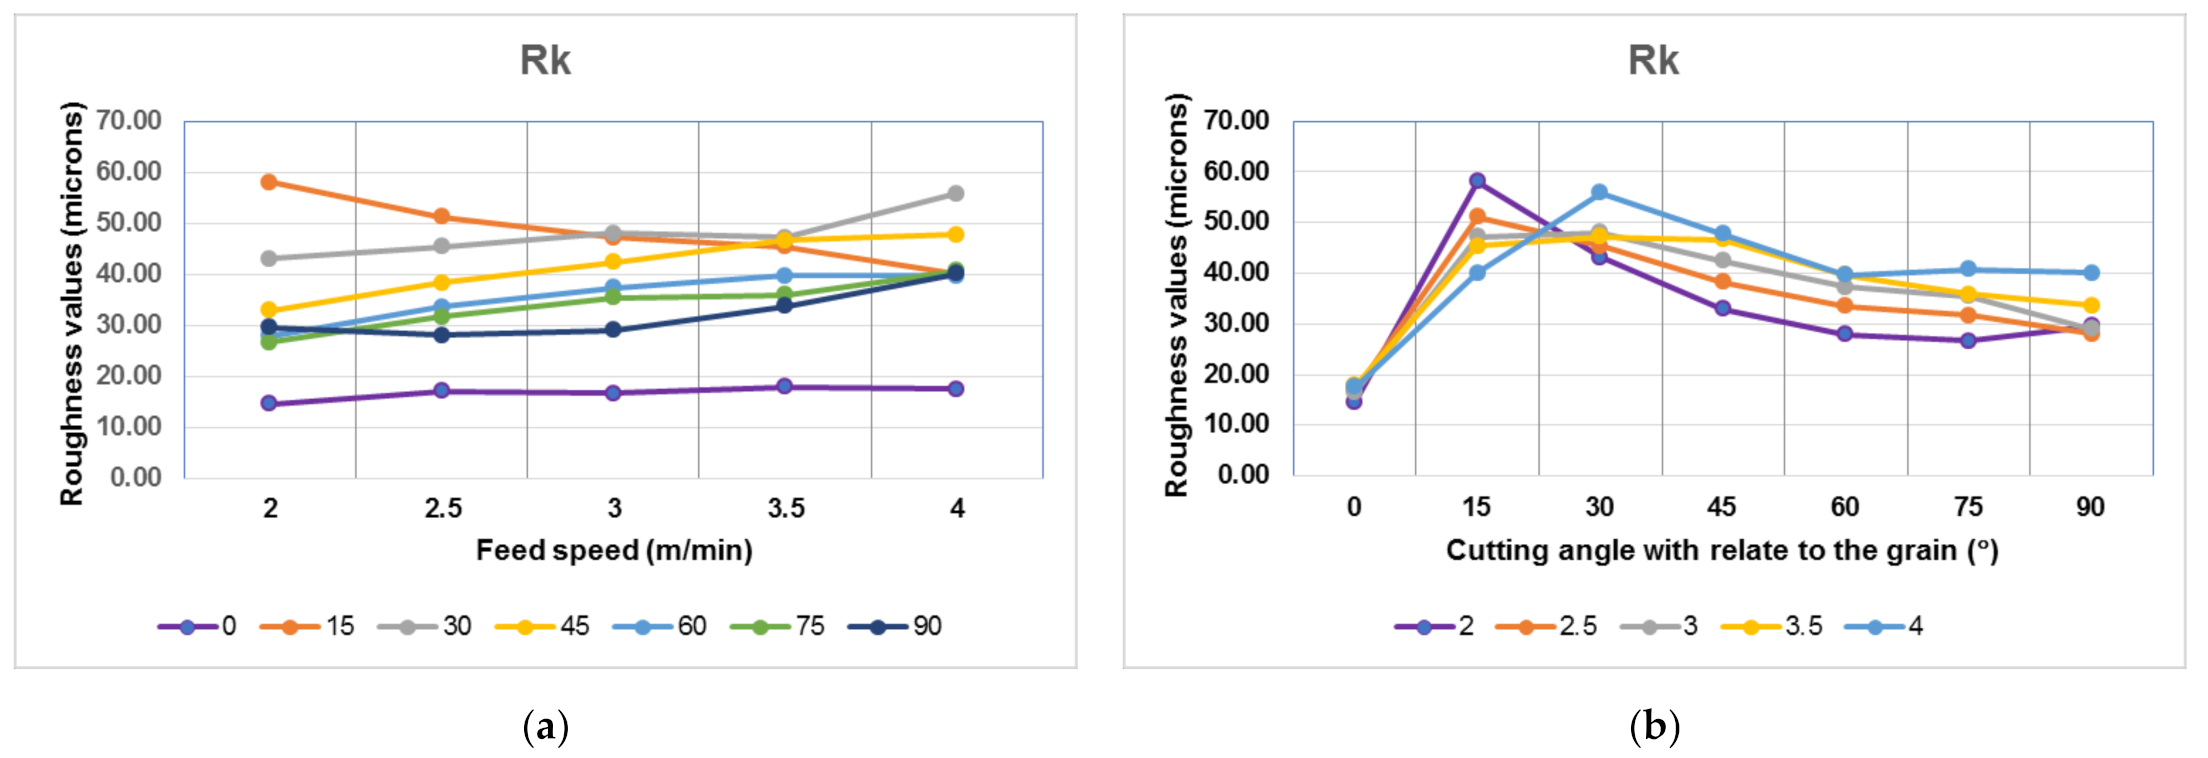
The analysis of Rk has shown an increase in processing roughness with the feed speed and this was valid for all angles with respect to the grain tested (Figure 5a). An exception was the 15° processing angle, for which Rk had the highest magnitude for the feed speed of 2 m/min, then almost linearly decreasing. Changing the cutting direction from longitudinal (0°) to 15°, Rk has increased approximately 2–4 times with the greatest amount for the feed speed of 2 m/min, and this was statistically significant when checked with the Duncan test (Table 1).
The roughest surfaces were obtained for angles of 15° and 30° (Figure 5b). The best processing roughness, Rk, was always obtained for a processing along the grain, followed nearly double by 90° and then 75°. Considering the influence on Rk of the cutting angle and the feed speed, the cutting angle was the most significant parameter after statistical analysis with ANOVA and the Duncan multiple range test (p < 0.05).
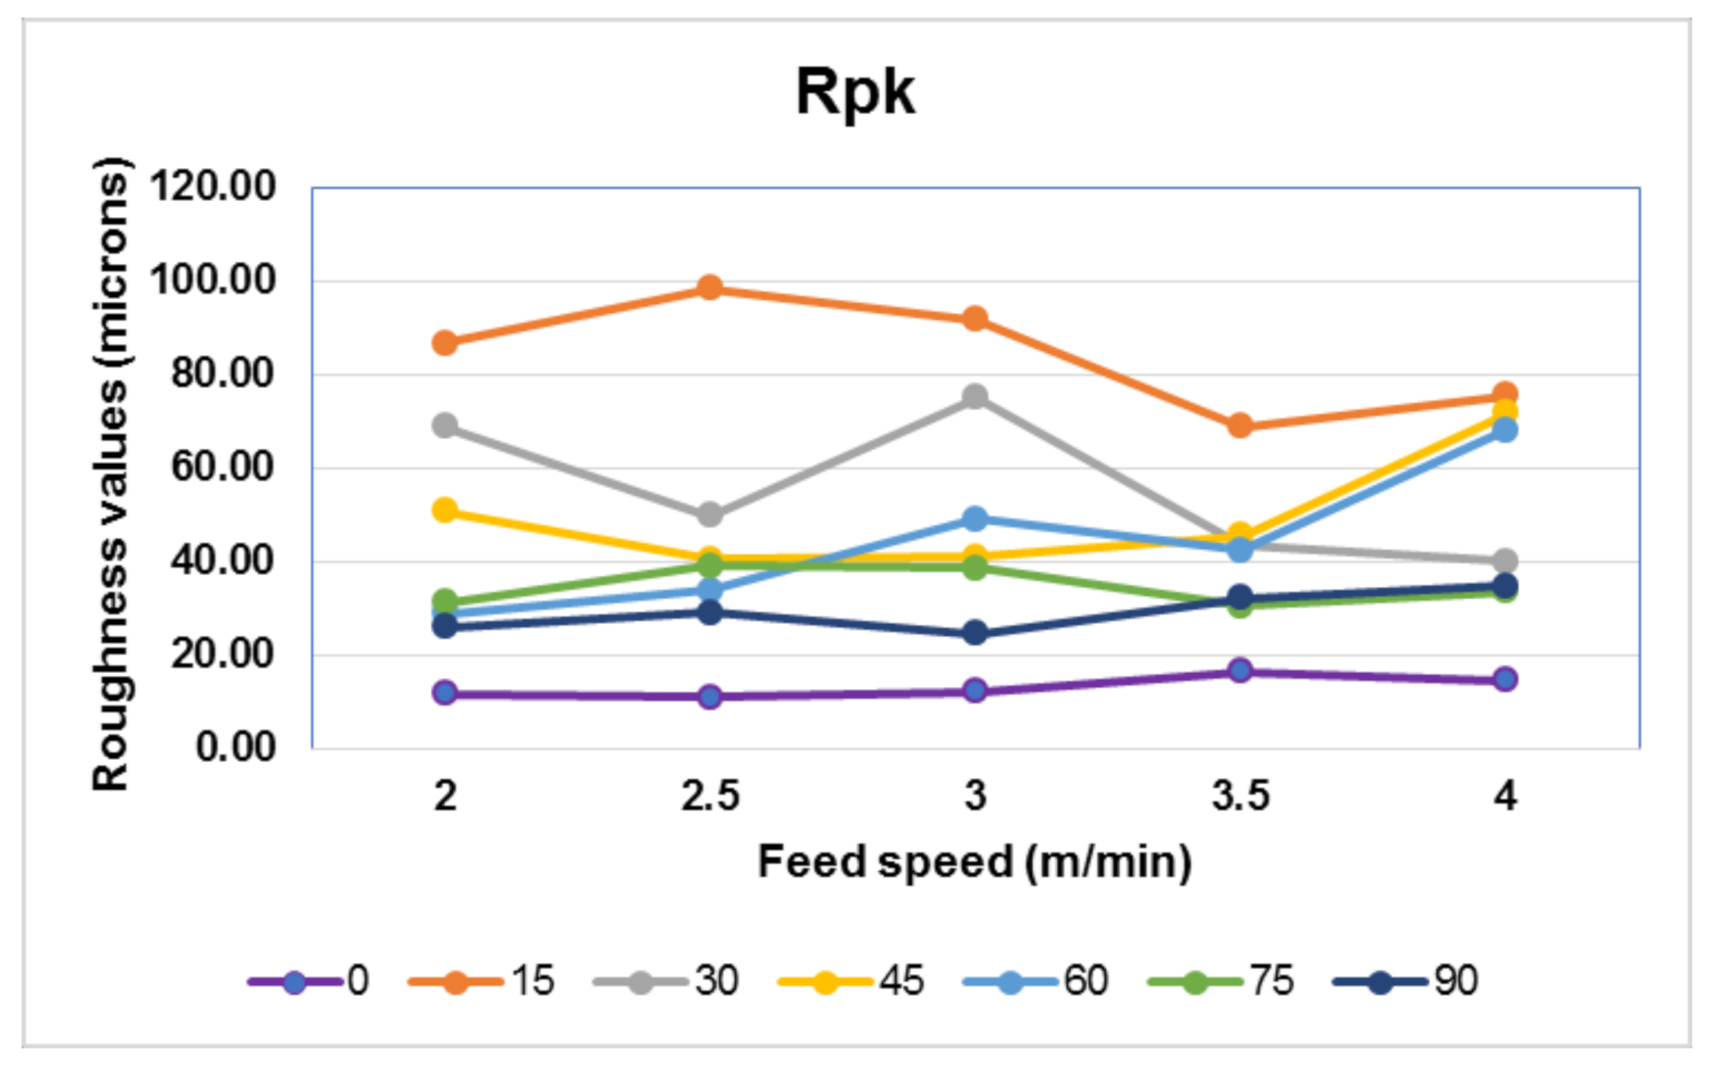
Further, there was the question why the angles of 15° and 30° are causing a rough surface and whether this phenomenon is extending beyond the core roughness. By analyzing the parameter Rpk, which is sensitive to isolated peaks, it is confirmed that the special angles of 15° and 30° give rise to accentuated fuzziness, 7–8 times stronger in comparison with 0° (Figure 6).
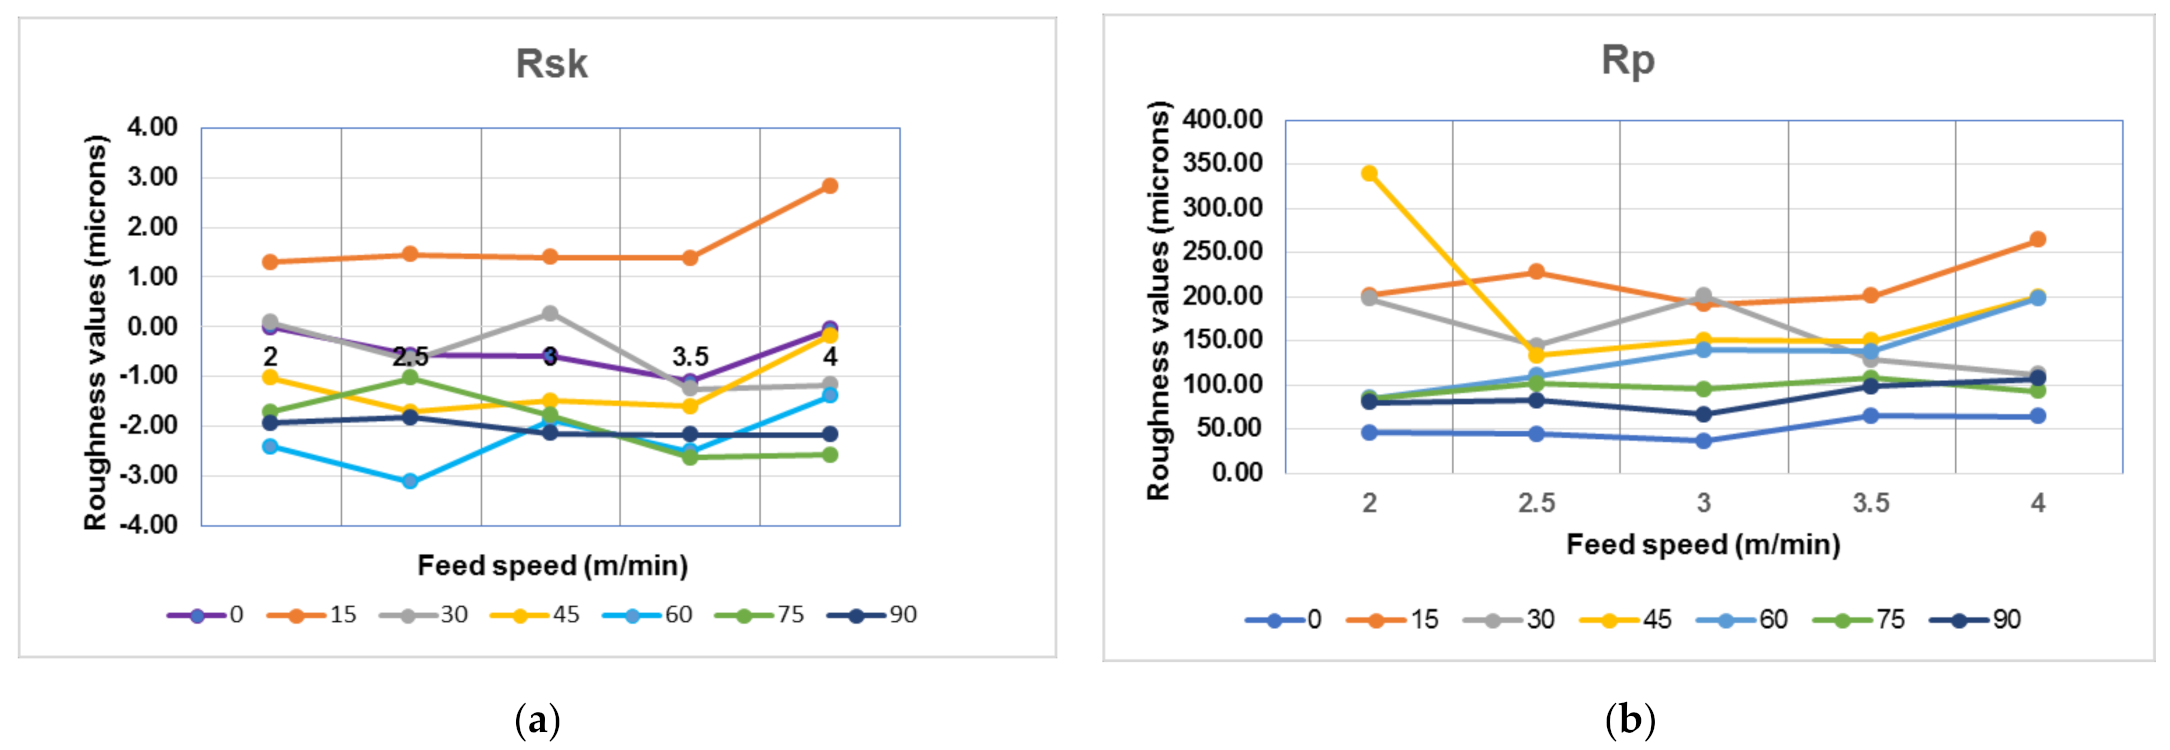
In support to this observation comes Rsk, which was positive for all feed speeds for a processing angle of 15° (Figure 7a), but also Rp (Figure 7b), which measures the highest single peak within the measured profile.
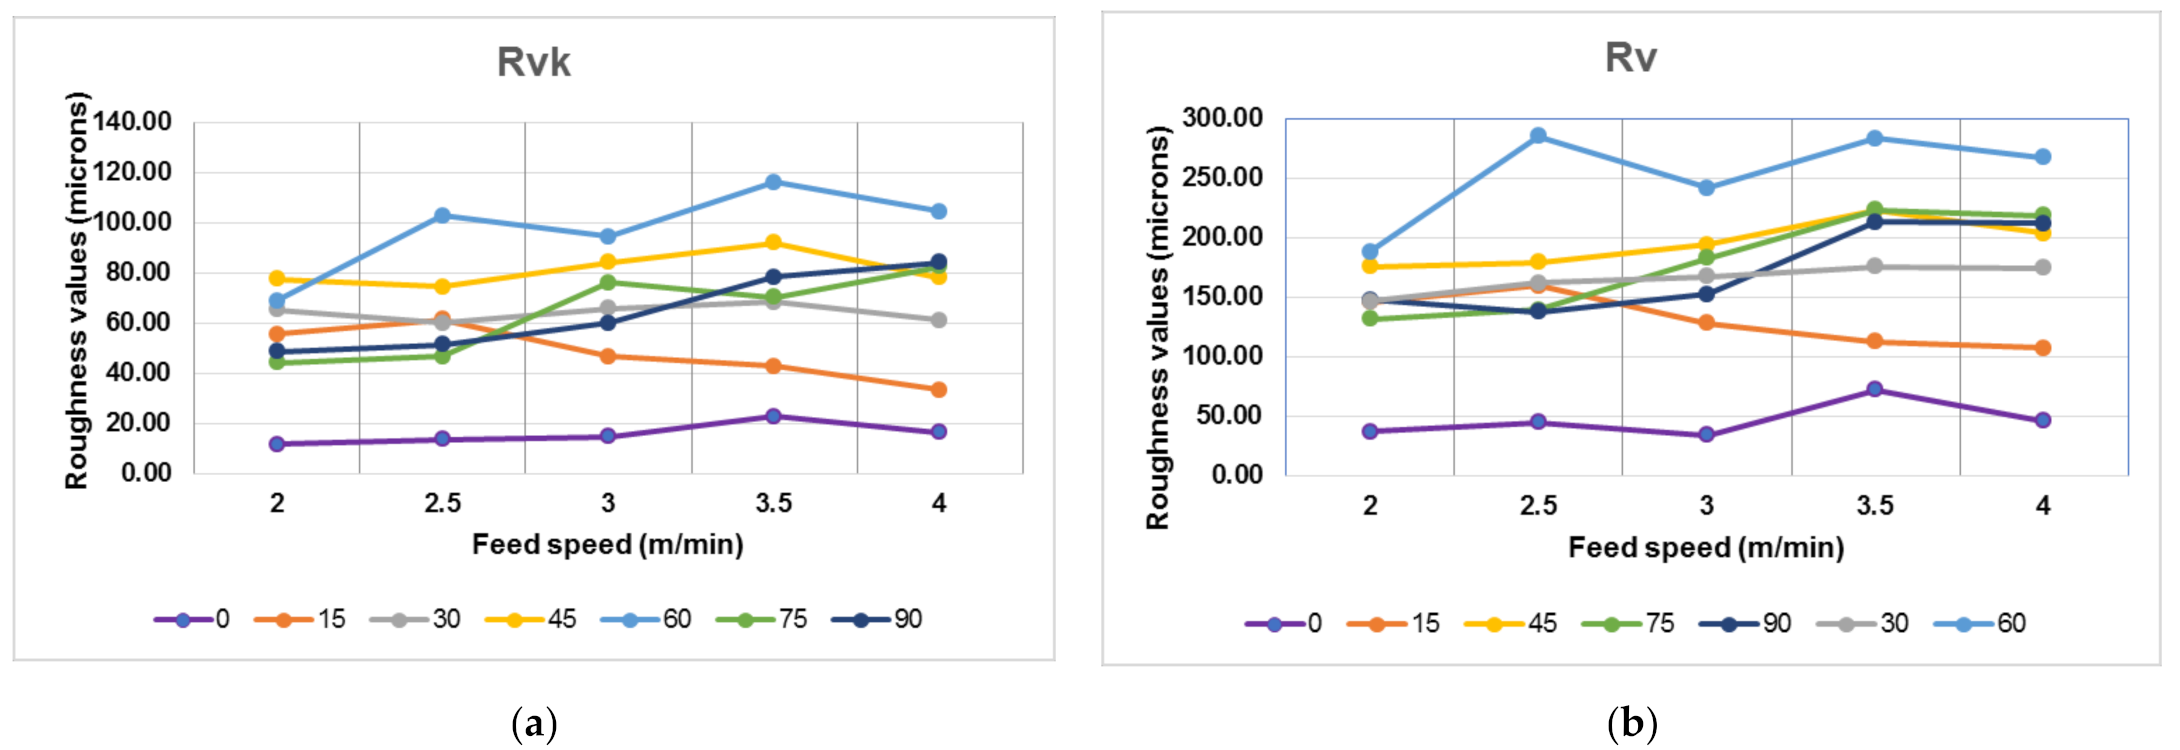
A high magnitude Rsk in the negative direction is an indication of isolated surface gaps, caused by material pull-out. This was observed especially for a cutting angle of 60°. In order to check the state of the surface below the core roughness, Rvk can be of help, because it is sensitive to the presence of isolated valleys (Figure 8a). Indeed, the processing with a cutting angle of 60° increased the occurrence of pull-out material and Rvk increased 5–7 times as compared with processing along the grain. As expected, Rv (Figure 8b), which measures the deepest single valley within the measured profile, confirmed the same observation: the occurrence of pull-out material is increasing with an increase in the processing angle in the range 0°–60°, with the highest magnitude for 60°. The occurrence of pull-out material was visible also by naked eye.
The ratio Rpk/Rvk confirms that fuzziness was greater in magnitude than isolated gaps for a cutting angle of 15° and for all feed speeds. This particular cutting angle generates accentuated fuzzy surfaces. The ratio Rvk/Rpk confirms that the surface pull-out was greater in magnitude than fuzzy grain, for mostly all cutting angles, with the exception of 15° and sometimes 30°, where fuzziness was predominant. The findings are in agreement with those of other researchers [28], who found, when CNC milling Douglas Fir, with a feed speed of 5 m/min, that for small angles (10°–20°) the occurrence of pull-out material is limited, but fuzzy grain is formed, while for greater angles, the pull-out phenomenon becomes more important. An explanation comes from the researchers [29] who analyzed the wood surface defects occurred by milling under different angles. When the wood reaction against splitting is higher than the strength of material, surface failure occurs and this appears when cutting takes place under an angle different than 0° with respect to the grain.
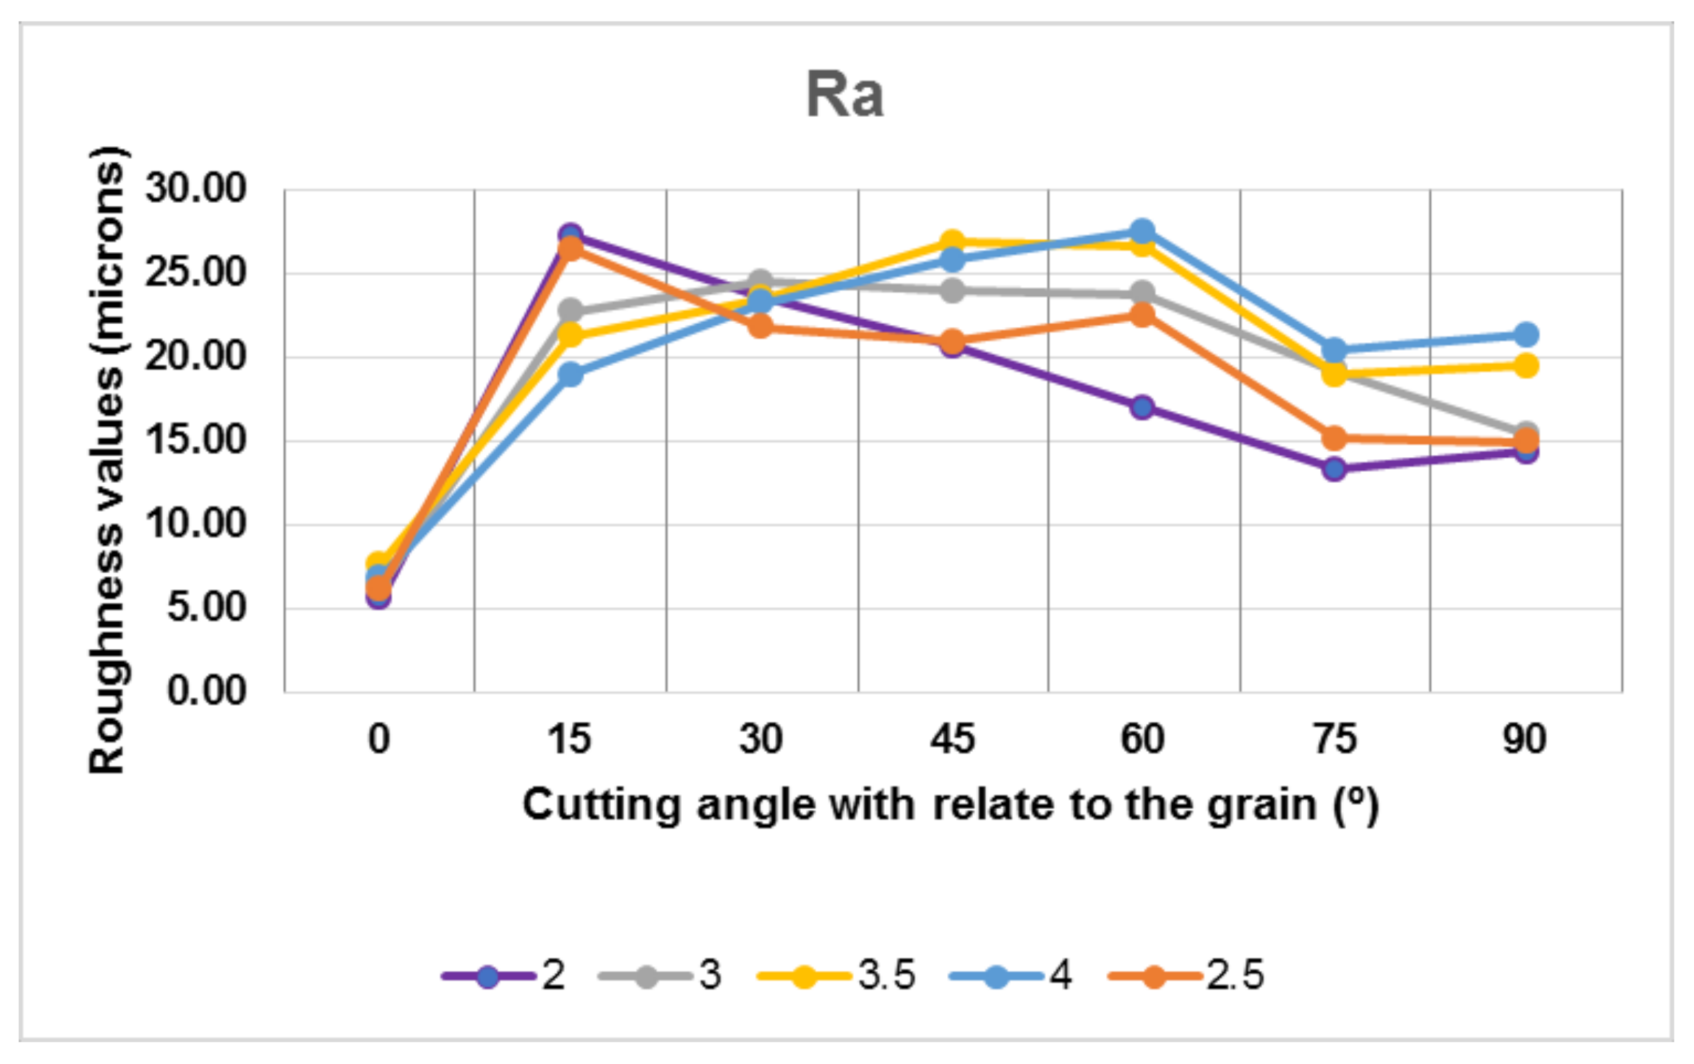
Figure 9 presents the variation of Ra, the most used parameter in the literature and its values for various feed speeds with the cutting angles. Judged in separation from other roughness parameters, it is hard to be interpreted. However, in view of the previous discussion, it appears that Ra cumulates the effect of processing, with the high fuzziness for a 15° cutting angle and with the effect of occasional surface destruction by material pull-out, for a 60° cutting angle with respect to the grain. Ra appears maximum at these two cutting angles.
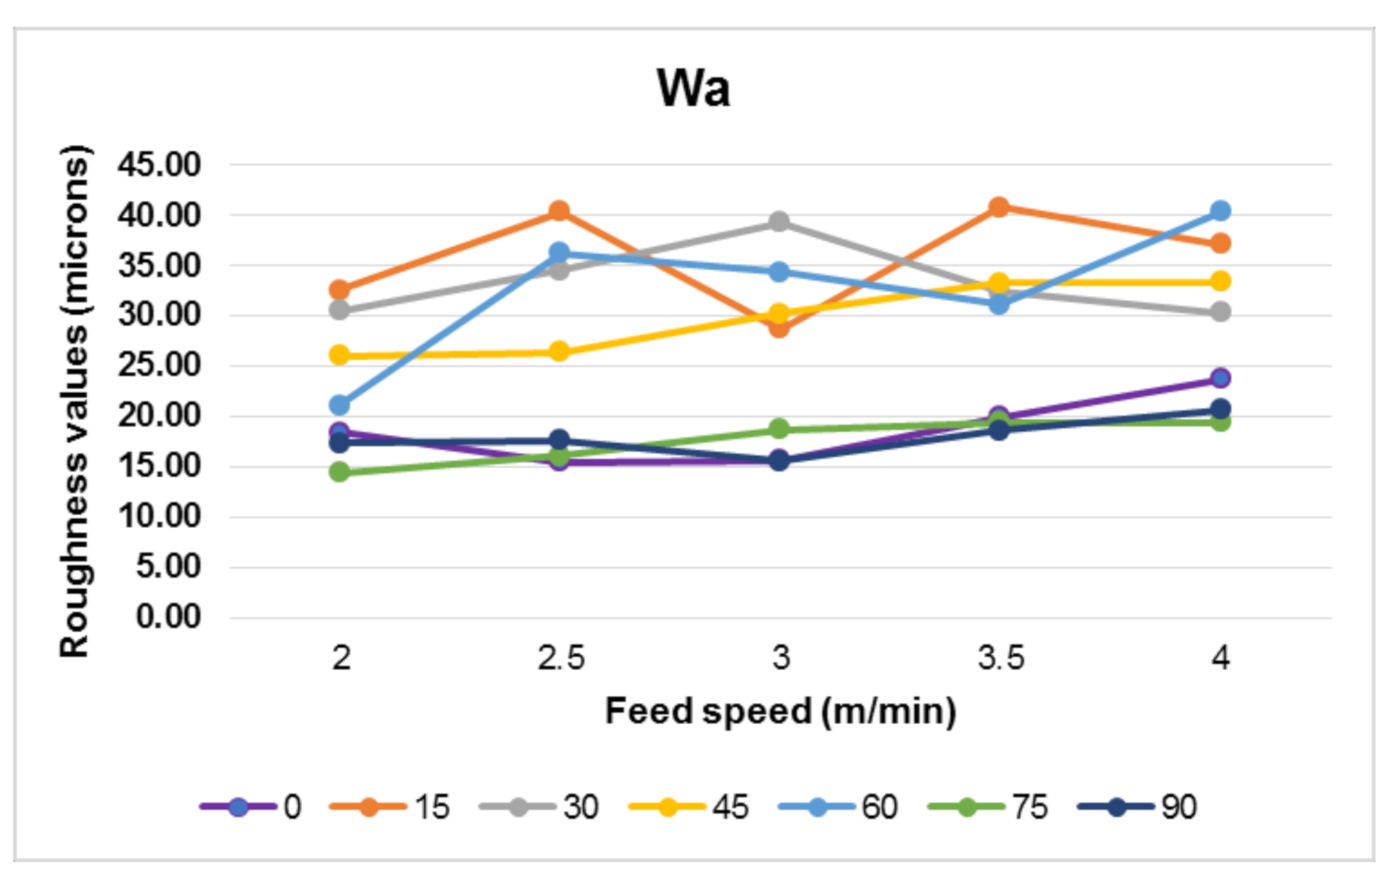
However, wood is a heterogeneous material, contains areas with different structure and density within the growth ring. As result of the interaction with the cutting tool, the surface presents a variation in the elastic response, so that waviness is born, which differs in wavelength from roughness. Waviness may be also caused by the kinematic interaction between wood and the tool or by any vibration occurring during cutting. In general, waviness increased with the feed speed and this was clearly the case for the cutting angles of 0°, 45° 75° and 90°. The least wavy surfaces were obtained for angles of 0°, 75° and 90°. The waviness for the other angles, such as 15°, 30°, 75° and 60° does not show a clear trend, perhaps being biased by either raised fibers or incidental gaps (Figure 10).
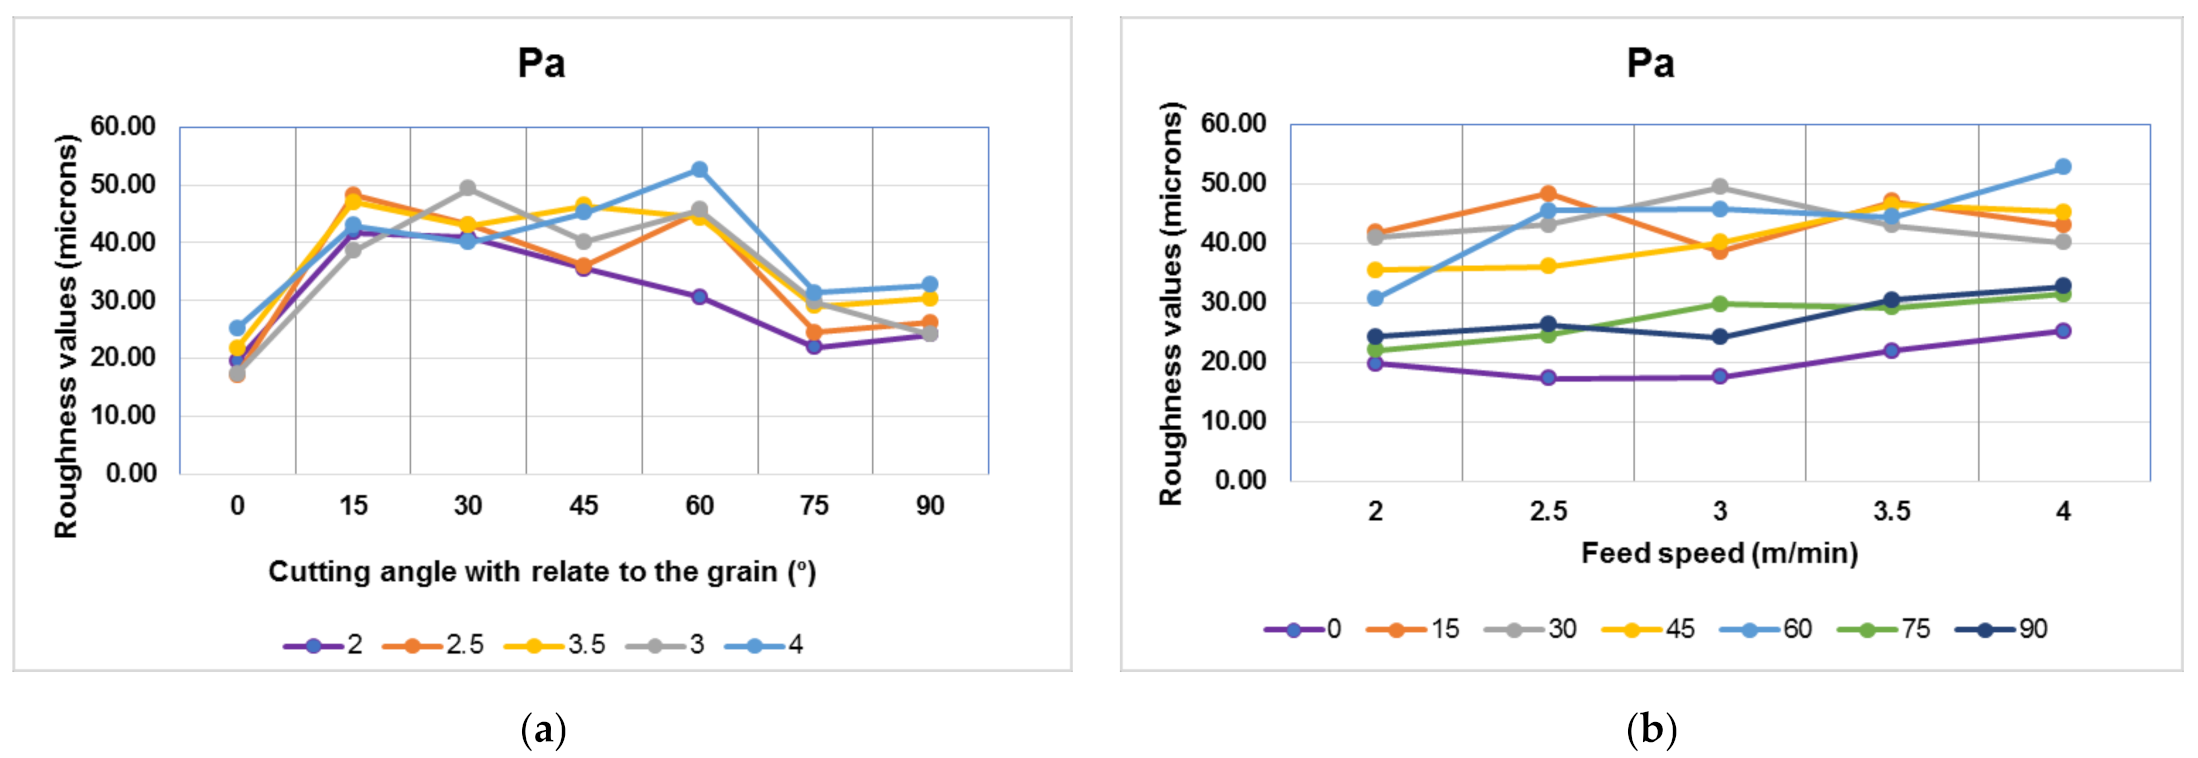
The cumulating effect of roughness and waviness appear in the primary profile, which is the measured profile after subtraction of form error. Even at this level of magnitude of the surface irregularities, from the smallest (roughness) to the largest (waviness) wavelengths, the processing at 15° and 60° appears to be the worst for all angle variants. Somehow similar, Pa, for Douglas Fir processed by milling at 5m/min feed speed, suddenly increased for 30° and then again for 70°, in down-milling against the grain [28]. The best quality was the one parallel to the grain, followed by 90° and 75°, which confirms previous findings in the analysis of the surface roughness (Figure 11a). The surface quality, evaluated by the combined effect of roughness and waviness, decreases with an increase in the feed speed, with the exception of the cutting angles of 15° and 30° which seem to be biased by outliers and without a clear trend (Figure 11b).
3.1.2. Surface Quality Resulting from Laser Cutting of Wood
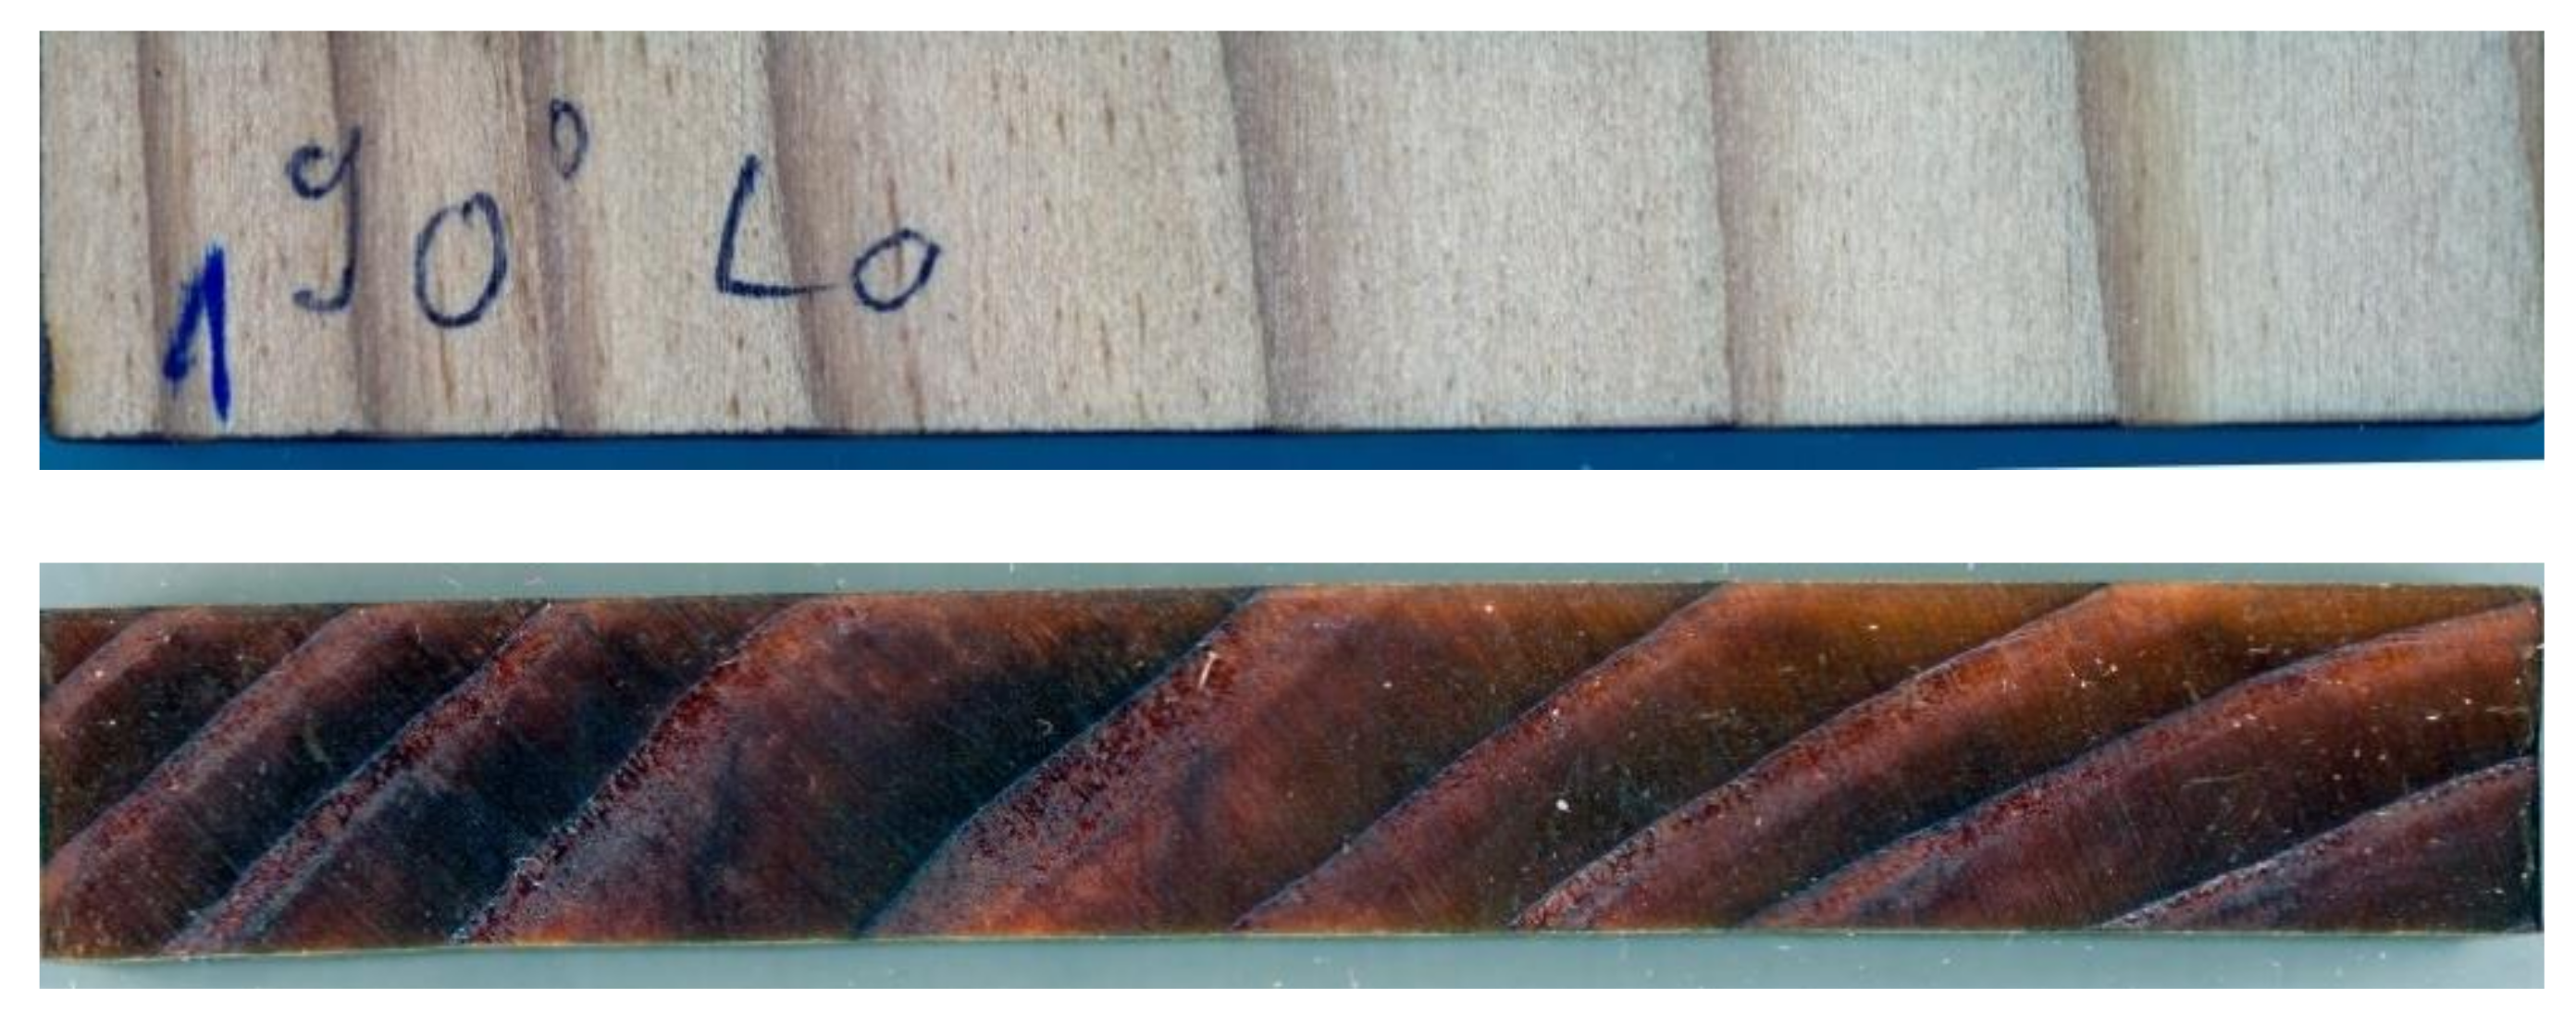
The processing with the laser has a different interaction with the wood surface than the CNC. The laser seems to affect more the earlywood areas, which appear burned and black in Figure 12, bottom.
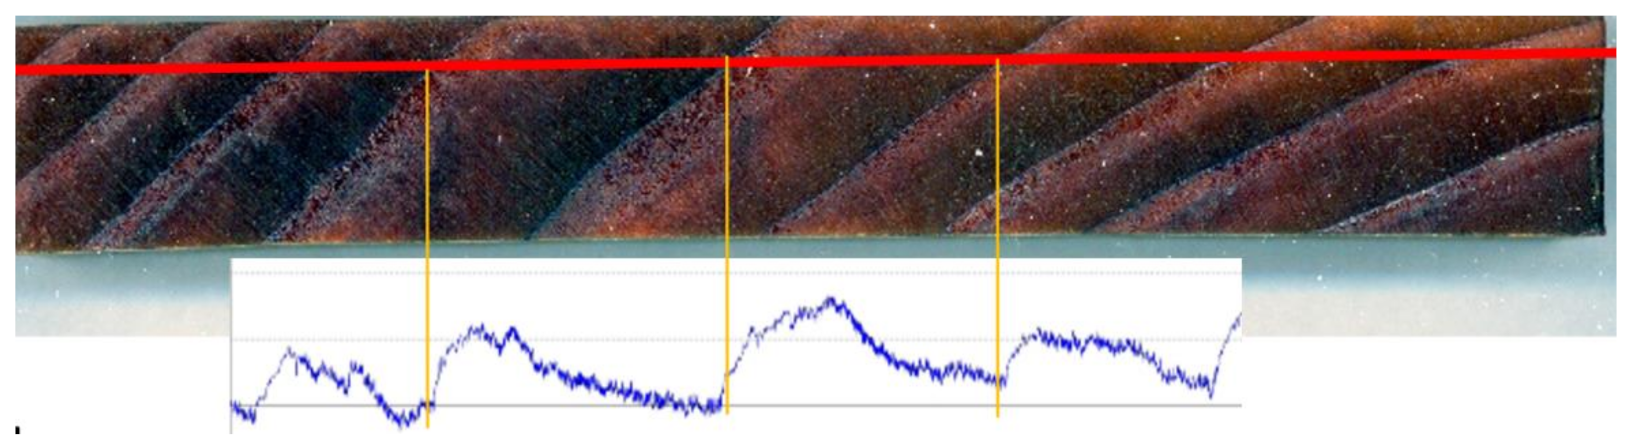
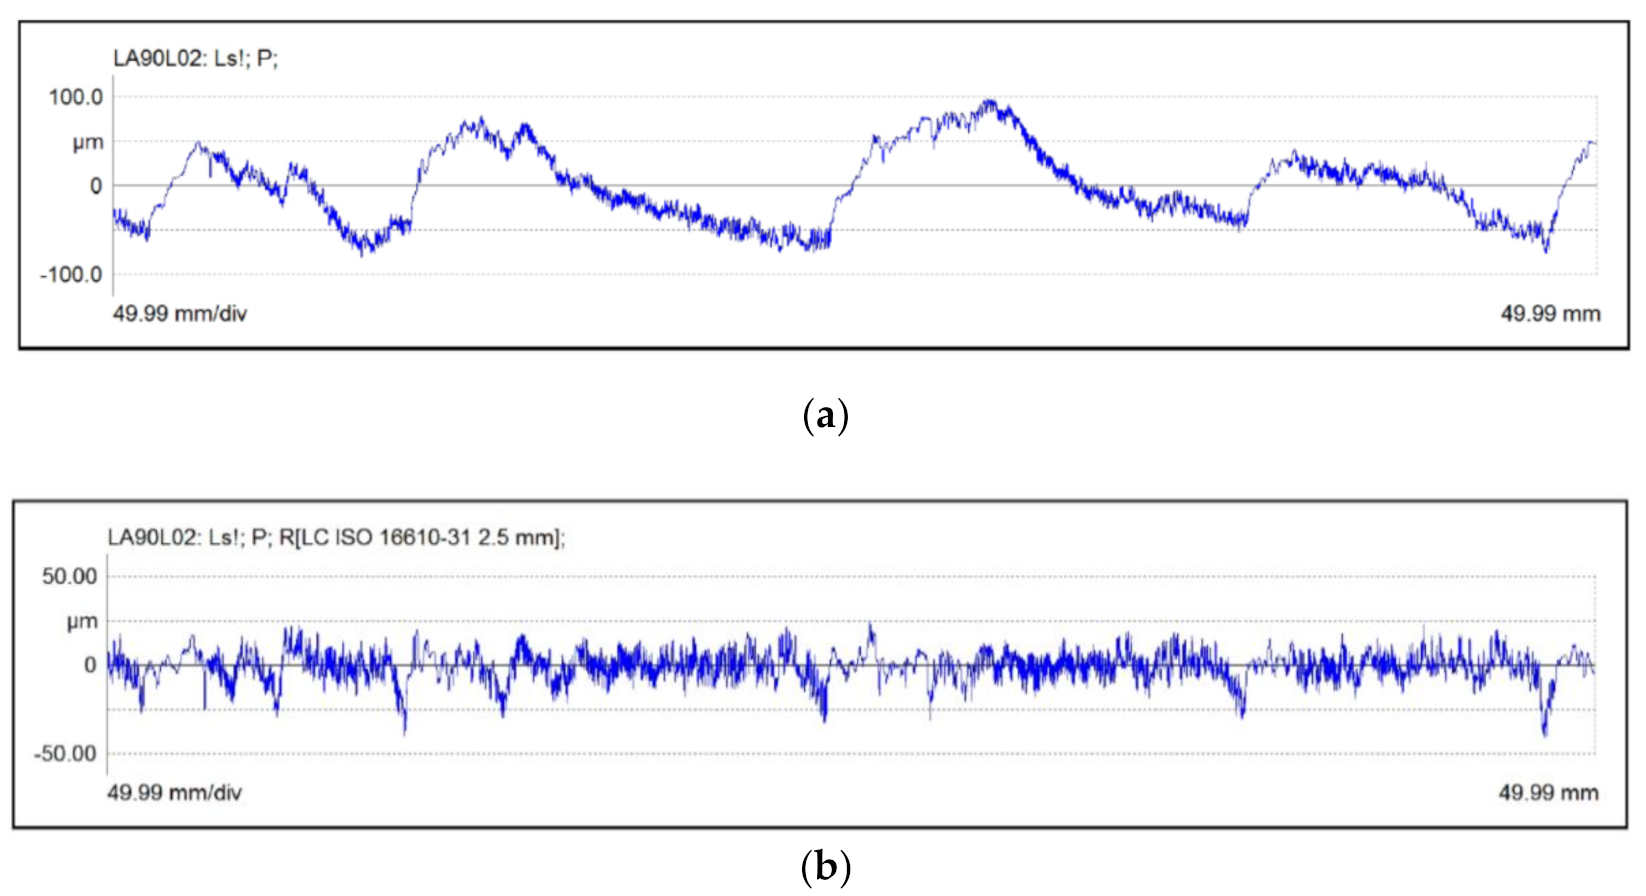
Another interesting phenomenon was a surface waviness having a similar pattern with the annual growth areas and increasing in magnitude with the grain angle with respect to the cutting direction. The measured profiles appear like indentations, with highest peaks in the latewood and valleys in the earlywood. The laser seems to have more pronouncedly carbonized earlywood; especially, at the annual ring limit creating gaps below the processed surface (Figure 13). This observation was also made by researchers [8] when examining spruce engraved by the laser. However, the anatomical structure is still identifiable in earlywood areas, in contrast to the latewood, areas of higher density, where the degradation process did not cause a total carbonization, but a melting stage of the wood material appearing under the microscope like a honey topping, as previously noticed by other researchers [8]. The melted material has penetrated the cell lumens and solidified so that no anatomy structure is identifiable in latewood areas and the result was a glossy surface. These areas can be identified in the roughness profiles by a less detailed region, irregularities seem smoothed in comparison with earlywood (Figure 14).
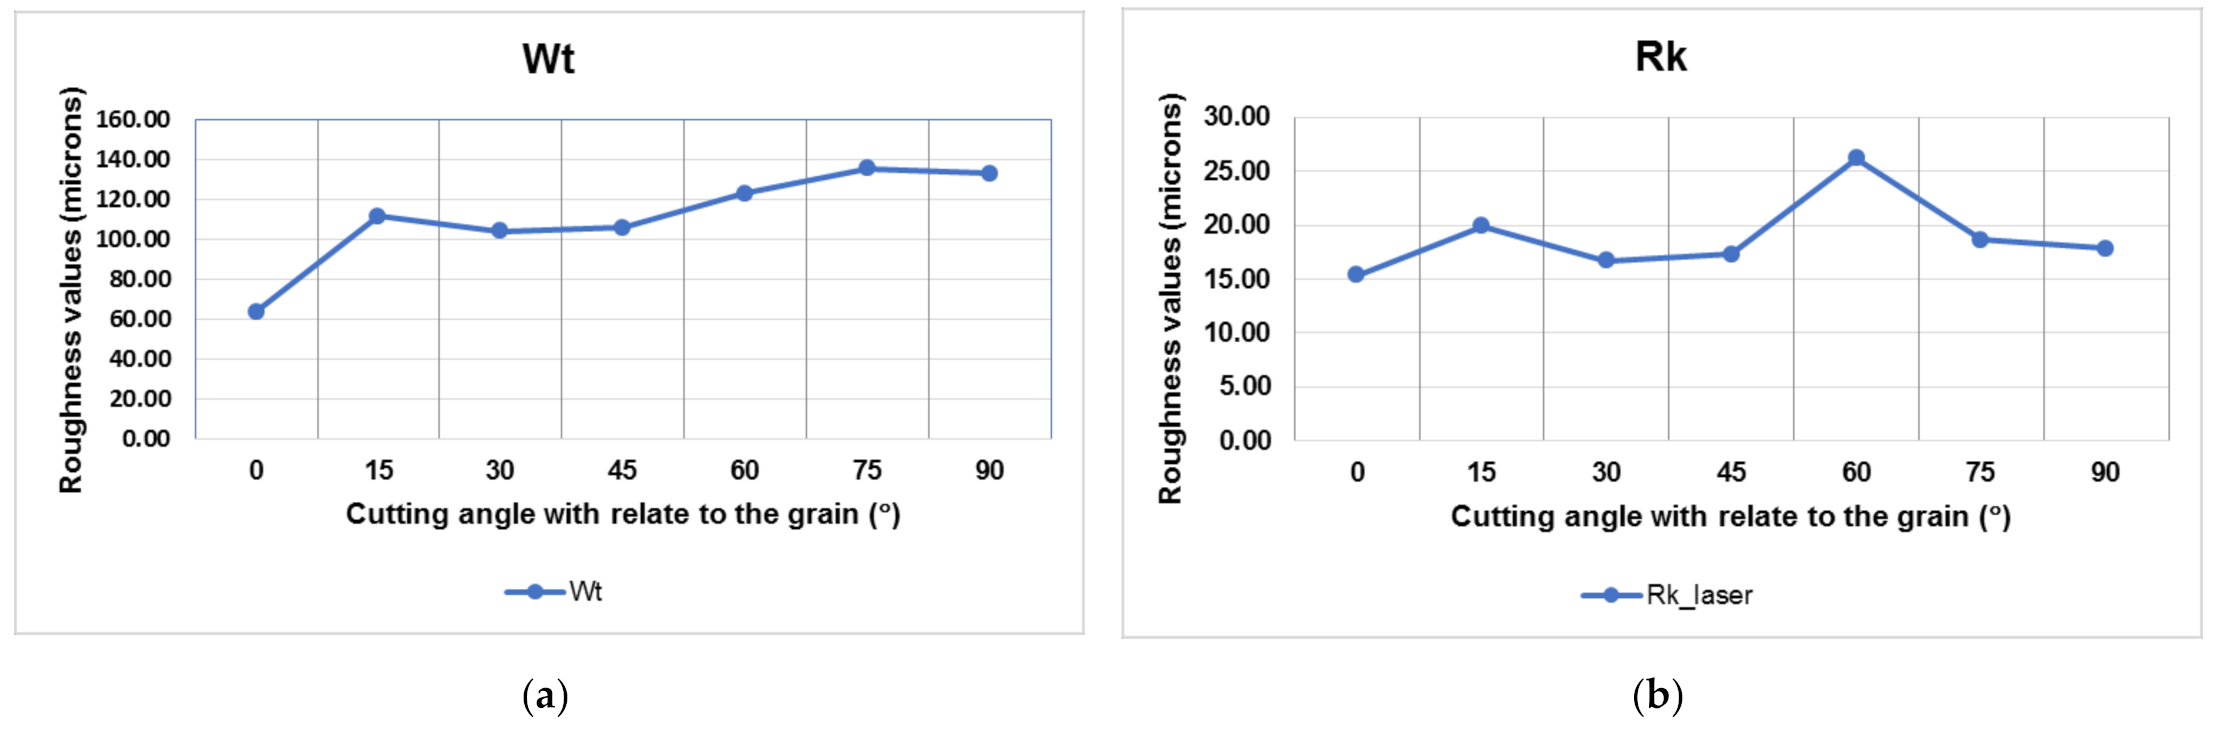
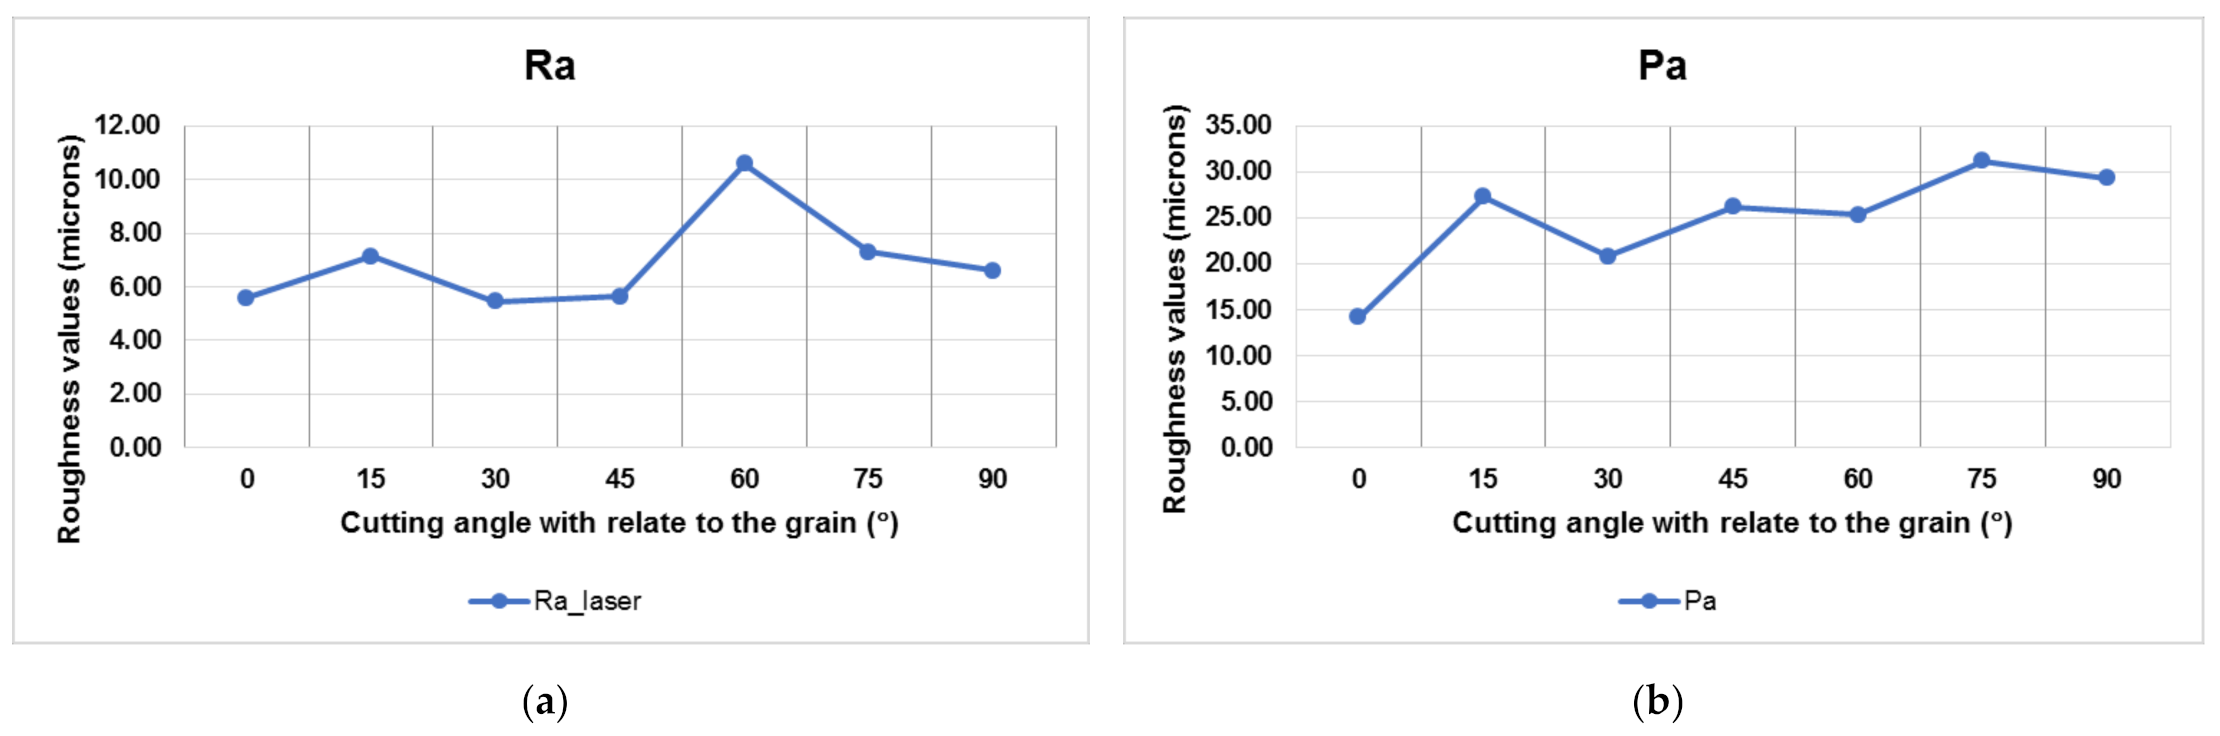
The waviness phenomenon has increased with the cutting angle with respect to the grain, as shown by the parameter Wt, the total height of the waviness profile (Figure 15a). The surface roughness measured by Rk and Ra increased with the cutting angle, marking two peaks at 15° and, more obvious, for 60°. The worse surface roughness seems to have occurred for a cutting angle of 60° (Figure 15b and Figure 16a).
When the combined effect of surface roughness and waviness was examined by the parameter Pa (Figure 16b), the best surface quality was obtained for a direction of cutting along the grain, which decreased with the cutting angle. In addition, Pa shows a sudden decrease in quality at 15° with respect to the grain. As in the case of CNC cutting, when processing with the laser, the surface quality seems particularly affected by the cutting angles of 15° and 60°.
3.2. Laser Cutting versus CNC Routing in Terms of Surface Quality
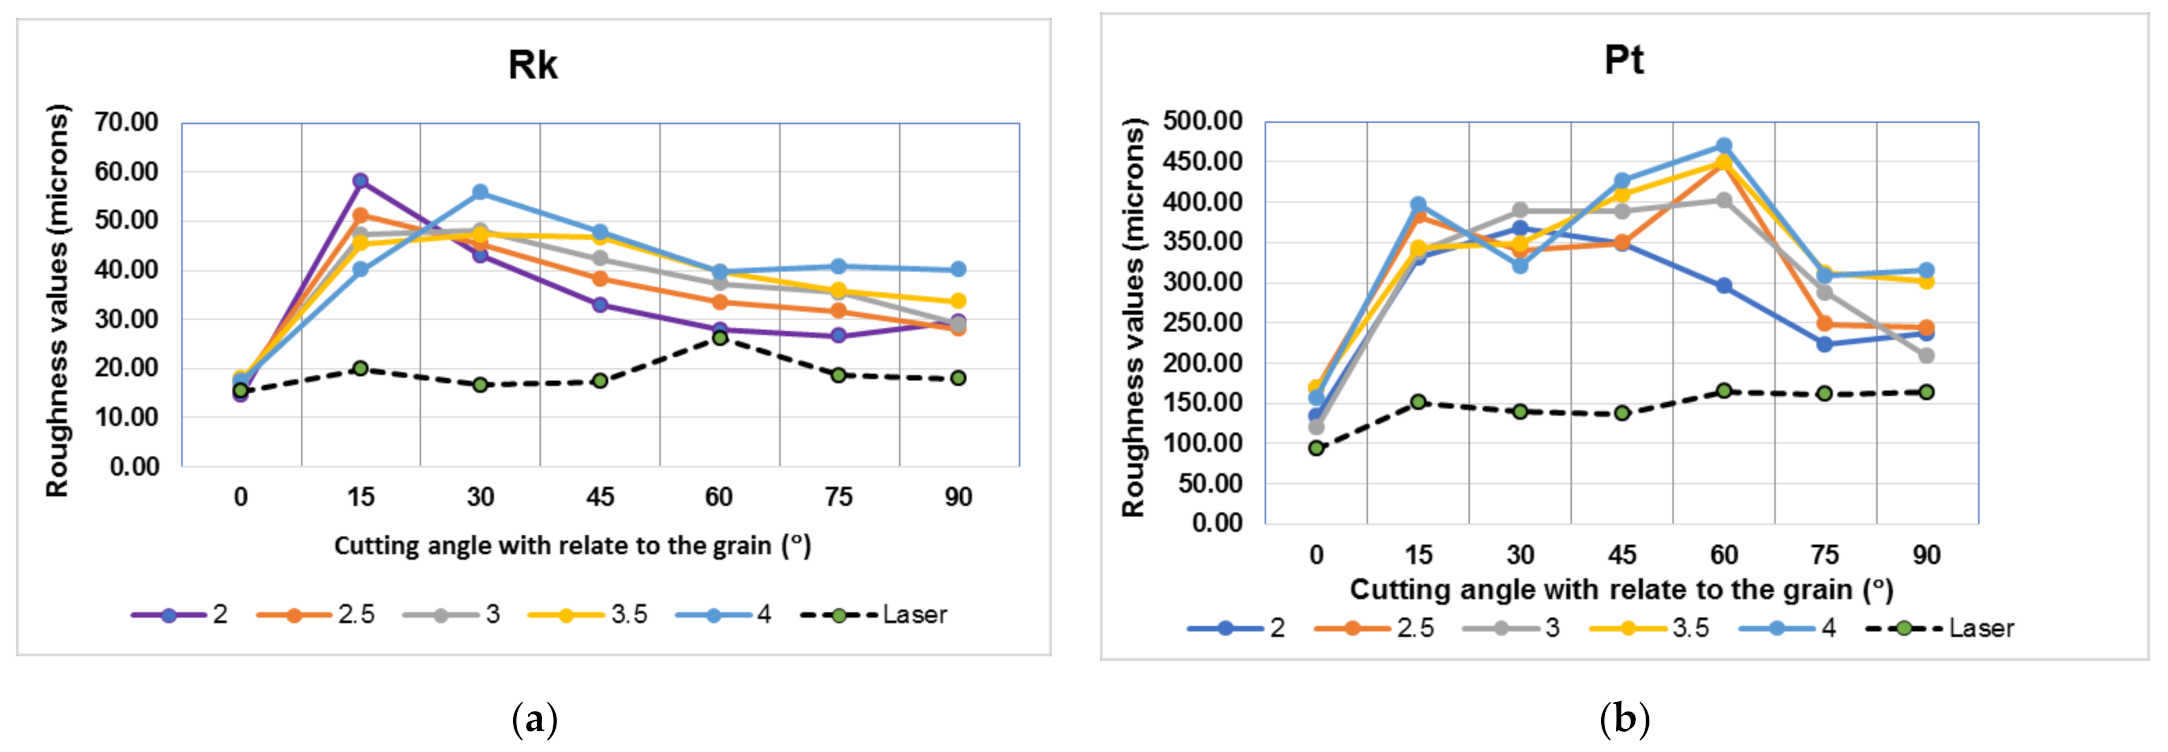
Along the grain, processing roughness values measured by Rk for laser cutting were very close to CNC cutting, especially when milling with a 2 m/min feed speed. This was also true for other roughness parameters. However, an increase in the cutting angle to 15° has tripled the quality difference between the laser and CNC, in favor of the laser (Figure 17a).
For both types of processing, CNC and laser, the cutting angles of 15° and 60° mark inflexion points in the surface quality measured considering roughness and waviness together (Figure 17b).
3.3. Stereo-Microscopic Investigation
3.3.1. CNC Routing Samples
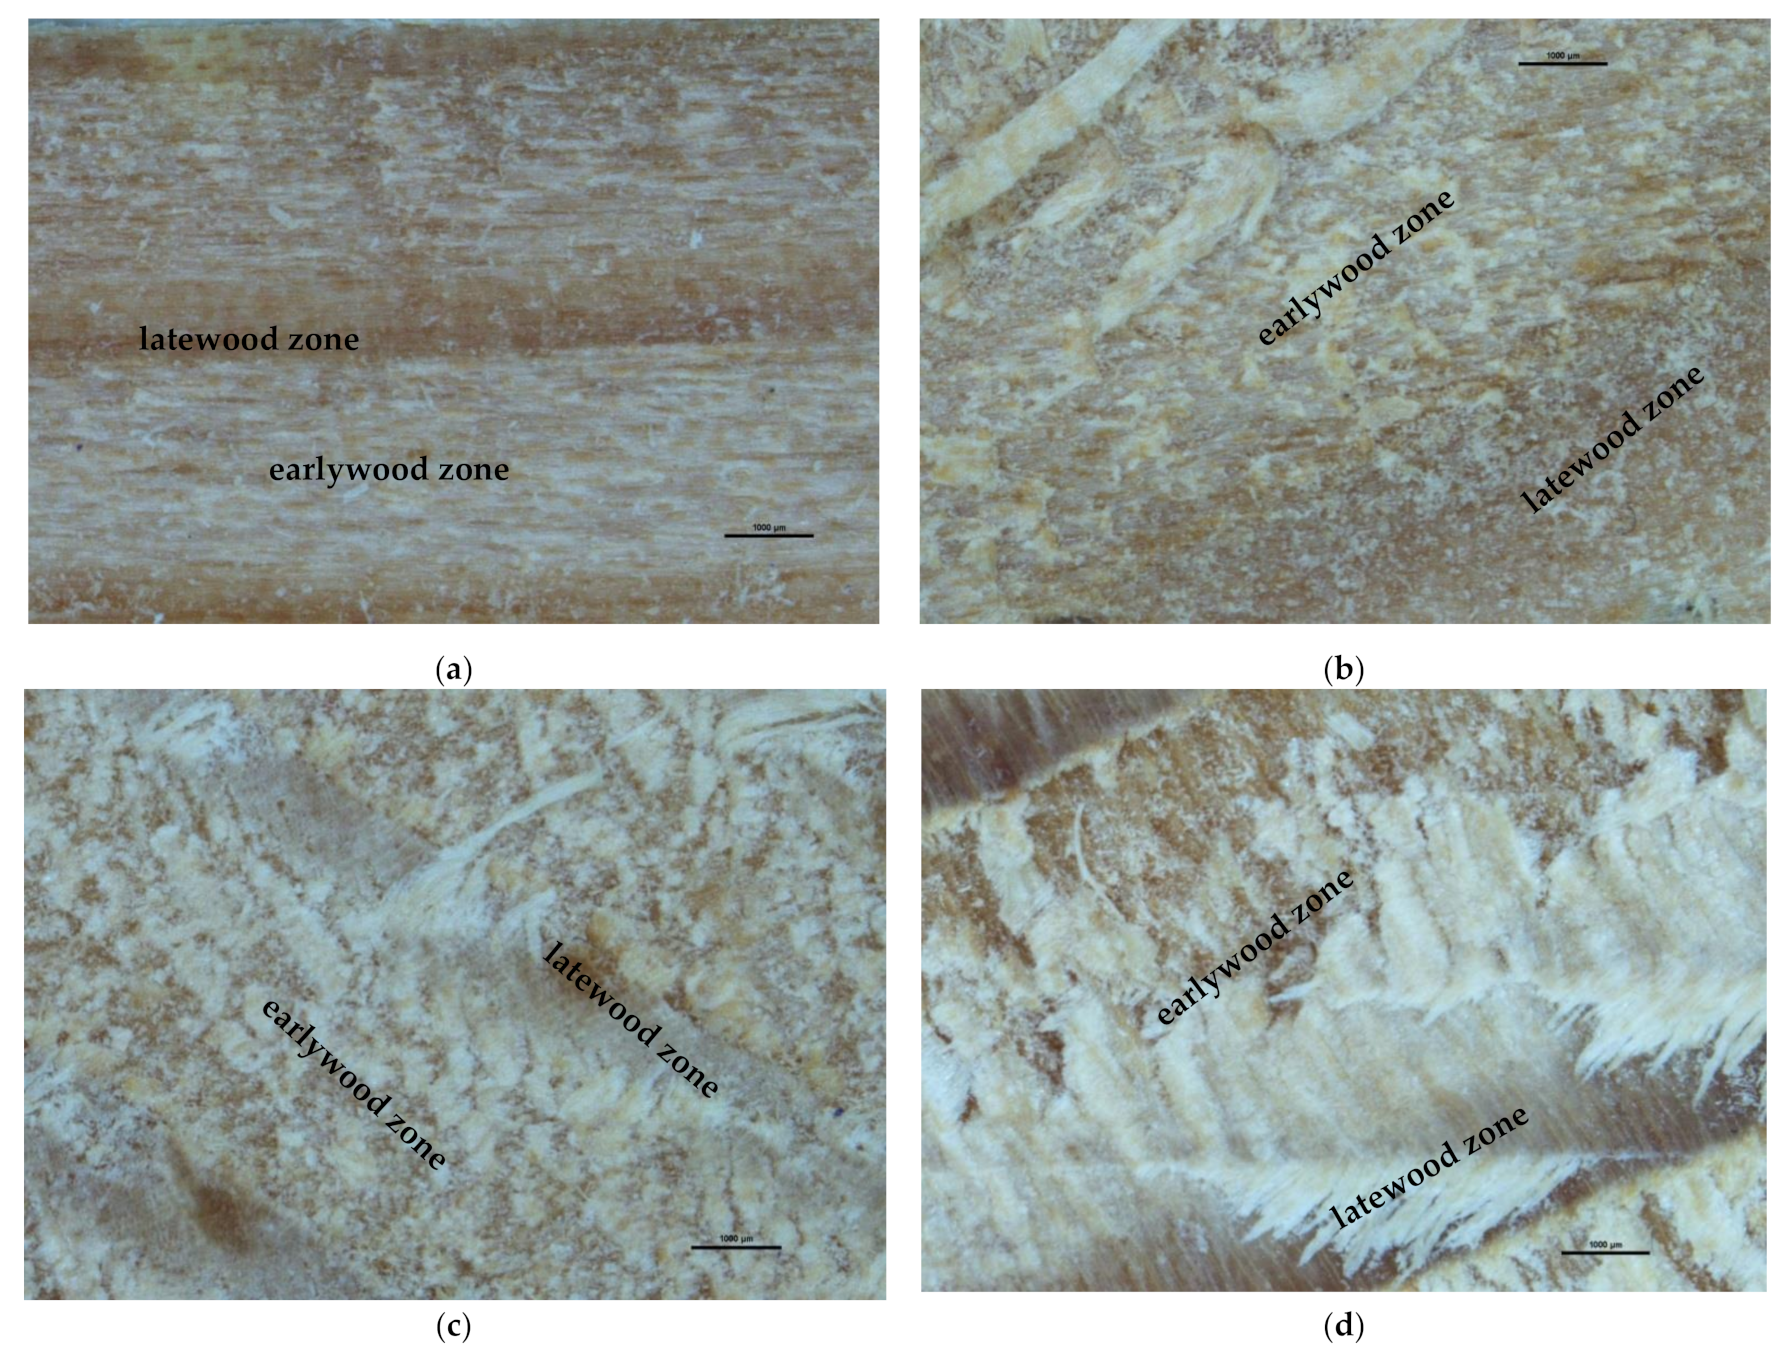
The microscopic investigation was performed for edges cut at angles of 15°, 30°, 60° with respect to the grain, for which high fuzziness and combined effect of surface roughness and waviness were noticed. The reference was 0° for the comparison, this cutting angle recording the lowest values of roughness parameters. The investigation was performed with 22.5x total magnification, in order to comprise both earlywood and latewood.
The images in Figure 18 confirm that processing at cutting angles of 15° and 30° give rise to accentuated fuzziness, especially for early wood zones, whilst processing with a cutting angle of 60° is producing the highest amount of pull-out material.
3.3.2. Laser Cutting Samples
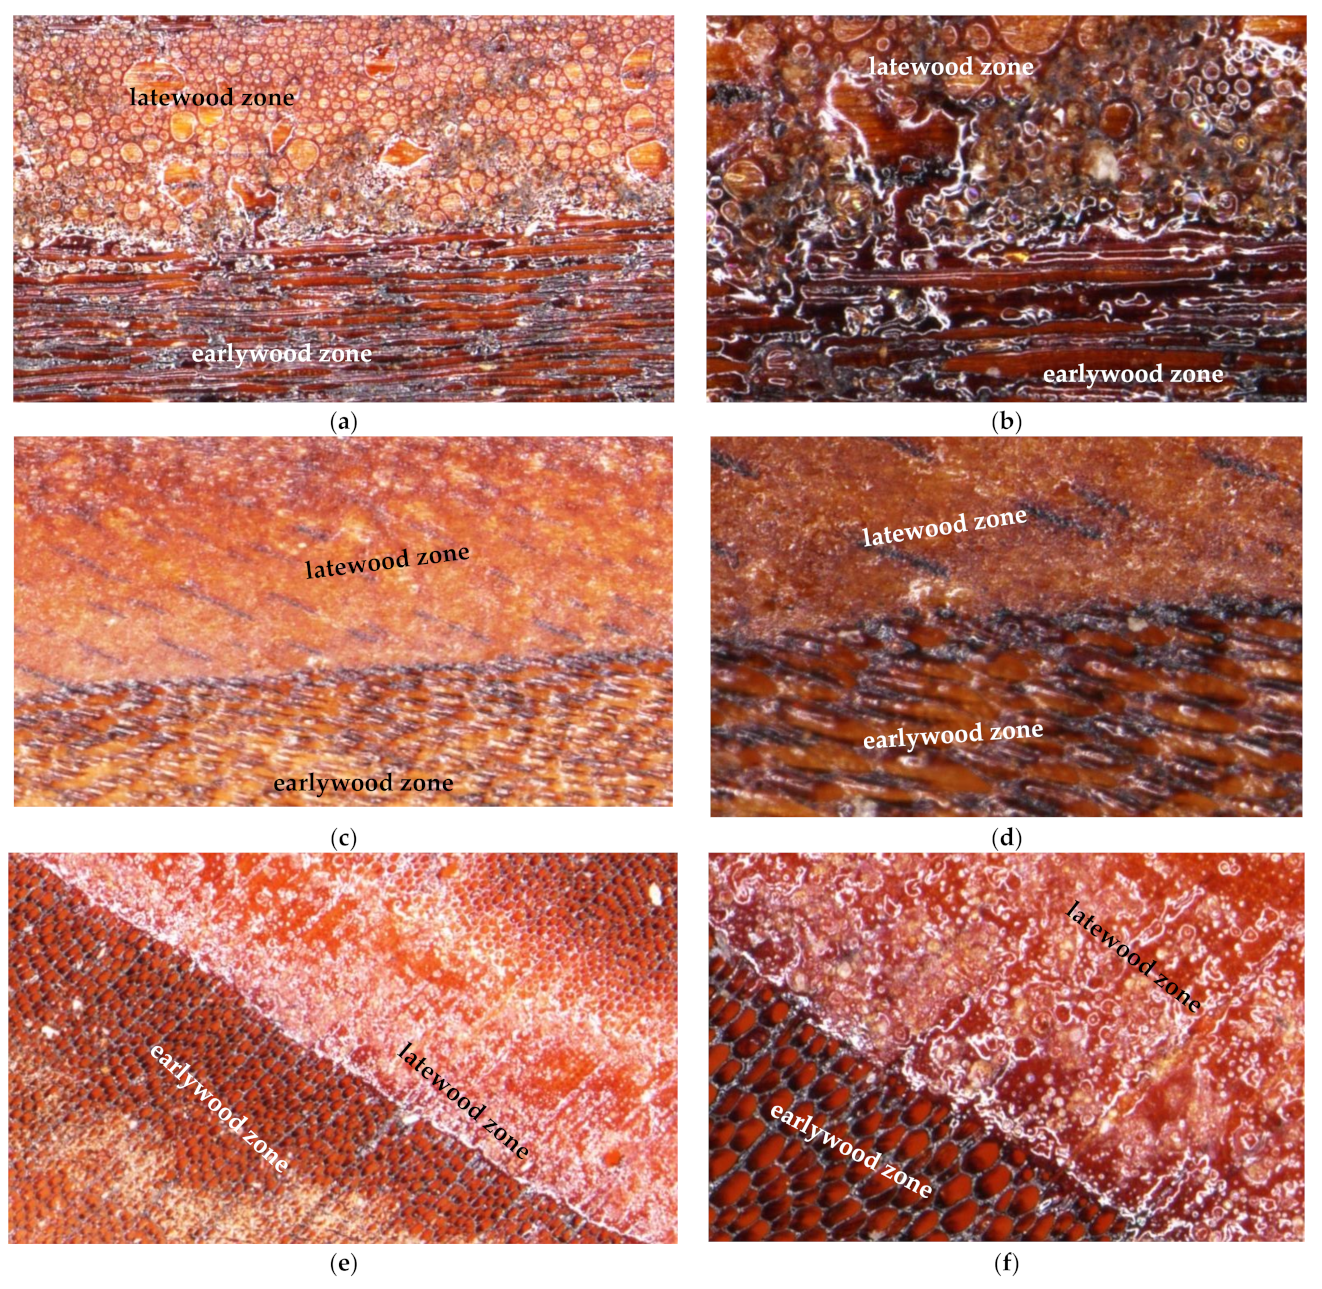
The microscopic investigation was performed for edges cut at cutting angles of 15° and 60°, for which high roughness parameters were recorded. The processing at 0° was used for the comparison. The phenomena of smoothing the surface in the late wood area, as a result of melting the wood material, were also observed by stereo-microscopy analysis. The cut edges were investigated with 60×, 120×, 180× and 240× total magnifications. In Figure 19, only images with 60× and 180× magnifications are shown.
At the microscopic level, in Figure 19, the difference between the early wood surface and the late wood surface is more visible for the cutting angle of 60°, given the more cross-cut orientation of the processing. The latewood zone, where the melted material such as honey topping appears, is smoothed compared to the earlywood zone. This explains the smoothed irregularities in the latewood areas of the roughness profiles. On the other hand, at the border between growth areas (earlywood in the new ring and latewood from the previous), a dark line is visible, indicating a totally carbonized layer showing as gap in the roughness profile (Figure 13). The wood structure corresponding to this carbonized area is clearly recognizable and belongs to the first cells in the earlywood, where the laser seems to have removed more material in comparison with the remaining area of the growth ring. This explains the waviness observed in the measured profiles (Figure 13).
In conclusion, processing with CNC at 2 m/min gives similar processing roughness as the laser, with the advantage of a surface unchanged in color and not affected by carbonization. However, if processing under angles different than 0 is required, the laser offers a better quality due to the smoothing effect produced by material melting.
4. Conclusions
The investigation of larch fretwork surface quality when processed by laser and CNC routing at different cutting angles and feed speeds of the router has led to some conclusions based on the analysis of roughness and waviness parameters and surface microscopy.
The parameter Rk that best characterizes the processing roughness showed an increase with the feed speed of the CNC routing, for all cutting angles with the exception of 15°. Changing the cutting direction from longitudinal (0°) to 15°, Rk has increased approximately 2–4 times, with the greatest amount for the feed speed of 2 m/min. By far, the best processing roughness was obtained when cutting along the grain, at a feed speed of 2 m/min, followed nearly double for the angles of 90° and 75°. The roughest processing roughness was produced for an angle of 15°, followed by 30°. Considering the influence on Rk of the cutting angle and the feed speed, the cutting angle was the most significant parameter. By examining a series of various roughness parameters sensitive to surface outliers, such as fuzzy grain (Rpk) and surface accidental gaps (Rvk), that go beyond the highest density datapoints expressed by Rk, it appeared that processing at cutting angles of 15° and 30° gives rise to accentuated fuzziness (Rpk), 7–8 times stronger in comparison with 0°, while processing with a cutting angle of 60° is producing the highest amount of pull-out material (Rvk). Rvk increased 5–7 times as compared with processing along the grain. The ratio Rpk/Rvk confirmed that fuzziness was greater in magnitude than isolated gaps for a cutting angle of 15° and for all feed speeds. The ratio Rvk/Rpk confirmed that the surface pull-out was greater in magnitude than fuzzy grain, for mostly all cutting angles, with the exception of 15° and sometimes 30°, where fuzziness was predominant. When the surface was examined at a higher wavelength scale, it was found that, in general, the waviness increased with the feed speed and this was clearly the case for the cutting angles of 0°, 45° 75° and 90°. The surface quality, evaluated by the combined effect of roughness and waviness, decreases with an increase in the feed speed and processing at 15° and 60° appear the worst options from all angle variants, and this conclusion was backed by the stereo-microscopic analysis.
Although the principle of cutting and interaction with wood of the two processing tools, laser and CNC, is very different, the analysis with roughness parameters has revealed that the cutting angle with respect to the grain has an essential influence, whatever the cutting tool. The cutting angles that stand out from the others from the point of view of surface quality seem to be 15° and 60°. The processing roughness measured by Rk along the grain gave the best surface quality and was similar for both types of processing: CNC and laser, especially when milling took place with a 2 m/min feed speed. However, changing the angle with respect to the grain sharply increased the quality difference between the two cutting methods. An increase in the cutting angle to 15° has tripled the quality difference between the laser and CNC, in favor of the laser. The surface processed by CNC does not cause carbonization, but laser tends to smooth the surface irregularities by melting wood, especially in latewood areas.
Further work will focus on other species in order to examine if the critical processing angles remain the same.
Author Contributions
Conceptualization, C.C.; methodology, L.G. and C.C.; software, L.G. and C.C.; validation, L.G., C.C. and I.P.; formal analysis, L.G. and C.C.; investigation, L.G., C.C. and I.P.; resources, L.G. and C.C.; data curation, L.G. and C.C.; writing—original draft preparation, C.C. and L.G.; supervision, C.C. and L.G.; project administration, C.C.; funding acquisition, C.C. All authors have read and agreed to the published version of the manuscript.
Funding
This research received no external funding.
Institutional Review Board Statement
Not applicable.
Informed Consent Statement
Not applicable.
Data Availability Statement
Not applicable.
Acknowledgments
We hereby acknowledge the structural funds project PRO-DD (POS-CCE, O.2.2.1., ID 123, SMIS 2637, No. 11/2009) for providing the infrastructure used in this work and the Contract No. 7/9.01.2014.
Conflicts of Interest
The authors declare no conflict of interest.
References
- Cenani, S.; Cagdas, G. Shape Grammar of Geometric Islamic Ornaments. In Proceedings of the 24th Conference on Education in Computer Aided Architectural Design in Europe ECAA, Volos, Greece, 6–9 September 2006; pp. 290–297. [Google Scholar]
- Paiu, I.; Cosereanu, C. Fretted Panels Made of Plywood and Beech Wood. Comparison and Quality Evaluation by Stereo Microscopy. Pro Ligno 2021, 17, 45–54. [Google Scholar]
- Gurău, L.; Petru, A. The Influence of CO2 Laser Beam Power Output and Scanning Speed on Surface Quality of Norway Maple (Acer platanoides). BioResources 2018, 13, 8168–8183. [Google Scholar] [CrossRef]
- Eltawahni, H.A.; Olabi, A.G.; Benyounis, K.Y. Investigating the CO2 Laser Cutting Parameters of MDF Wood Composite Material. Opt. Laser Technol. 2011, 43, 648–659. [Google Scholar] [CrossRef] [Green Version]
- Quintero, F.; Riveiro, A.; Lusquiños, F.; Comesaña, R.; Pou, J. Feasibility Study on Laser Cutting of Phenolic Resin Boards. Phys. Procedia 2011, 12, 578–583. [Google Scholar] [CrossRef] [Green Version]
- Leone, C.; Lopresto, V.; De Iorio, I. Wood engraving by Q-switched diode-pumped frequency-doubled Nd: YAG green laser. Opt. Lasers Eng. 2009, 47, 161–168. [Google Scholar] [CrossRef]
- Torbenson, M.C.A.; Stahle, D.W.; Villanueva Díaz, J.; Cook, E.R.; Griffin, D. The Relationship between Earlywood and Latewood Ring-Growth across North America. Tree-Ring Res. 2016, 72, 53–66. [Google Scholar] [CrossRef]
- Kúdela, J.; Andrejko, M.; Mišíková, O. Wood Surface Morphology Alteration Induced by Engraving with CO2 Laser under Different Raster Density Values. Acta Fac. Xylologiae Zvolen 2021, 63, 35–47. [Google Scholar]
- Petutschnigg, A.; Stöckler, M.; Steinwendner, F.; Schnepps, J.; Gütler, H.; Blinzer, J.; Holzer, H.; Schnabel, T. Laser Treatment of Wood Surfaces for Ski Cores: An Experimental Parameter Study. Adv. Mater. Sci. Eng. 2013, 2013, 123085, 1–7. [Google Scholar] [CrossRef] [Green Version]
- Kubovský, I.; Krišt’ák, L.; Suja, J.; Gajtanska, M.; Igaz, R.; Ružiak, I.; Réh, R. Optimization of Parameters for the Cutting of Wood-Based Materials by a CO2 Laser. Appl. Sci. 2020, 10, 8113. [Google Scholar] [CrossRef]
- Sütçü, A. Investigation of Parameters Affecting Surface Roughness in CNC Routing Operation on Wooden EGP. BioResources 2013, 8, 795–805. [Google Scholar] [CrossRef]
- Sütçü, A.; Karagŏz, Ü. The Influence of Process Parameters on the Surface Roughness in Aesthetic Machining of Wooden Edge-Glued Panels (EGPs). BioResources 2013, 8, 5435–5448. [Google Scholar] [CrossRef]
- Thoma, H.; Peri, L.; Lato, E. Evaluation of Wood Surface Roughness Depending on Species Characteristics. Maderas. Cienc. Tecnol. 2015, 17, 285–292. [Google Scholar] [CrossRef] [Green Version]
- Sütçü, A.; Karagŏz, Ü. Effect of machining parameters on surface quality after face milling on MDF. Wood Res. 2012, 57, 231–240. [Google Scholar]
- Sedlecký, M. Surface Roughness of Medium-Density Fiberboard (MDF) and Edge-Glued Panel (EGP) After Edge Milling. BioResources 2017, 12, 8119–8133. [Google Scholar]
- Sedlecký, M.; Kvietková, M.S.; Kminiak, R. Medium-Density Fiberboard (MDF) and Edge-Glued Panels (EGP) After Edge Milling—Surface Roughness after Machining with Different Parameters. BioResources 2018, 13, 2005–2021. [Google Scholar] [CrossRef]
- De Deus, P.R.; Alves, C.S.M.; Vieira, F.H.A. The quality of MDF workpieces machined in CNC milling machine in cutting speeds, feedrate, and depth of cut. Mecanica 2015, 50, 2899–2906. [Google Scholar] [CrossRef] [Green Version]
- Sofuoglu, S.D. Determination of Optimal Machining Parameters of Massive Wooden Edge-Glued Panels Made of European larch (Larix decidua Mill.) using Taguchi Design Method. BioResources 2015, 10, 7772–7781. [Google Scholar] [CrossRef] [Green Version]
- Gurau, L. The Roughness of Sanded Wood Surfaces. Doctoral Thesis, Brunel University, London, UK, 2004. [Google Scholar]
- ASME B46.1, Surface Texture. (Surface Roughness, Waviness, Lay); ASME B46 Committee: New York, NY, USA, 2009.
- Gurau, L.; Irle, M. Surface roughness evaluation methods for wood products: A review. Curr. For. Rep. 2017, 3, 119–131. [Google Scholar] [CrossRef]
- Magoss, E. General Regularities of Wood Surface Roughness. Acta Silv. Lign. Hung 2008, 4, 81–93. [Google Scholar]
- ISO 4287. Geometrical Product Specifications (GPS). Surface Texture. Profile Method. Terms. Definitions and Surface Texture Parameters; International Organization for Standardization: Genève, Switzerland, 2009. [Google Scholar]
- ISO 13565-2. Geometrical Product Specifications (GPS)—Surface Texture: Profile Method. Surfaces Having Stratified Functional Properties. Part 2: Height Characterisation Using the Linear Material Ratio Curve; International Organization for Standardization: Genève, Switzerland, 1998. [Google Scholar]
- ISO/TS 16610-31. Geometrical Product Specification (GPS)—Filtration. Part 31: Robust Profile Filters. Gaussian Regression Filters; International Organization for Standardization: Genève, Switzerland, 2010. [Google Scholar]
- Gurau, L.; Mansfield-Williams, H.; Irle, M. Filtering the Roughness of a Sanded Wood Surface. Holz Roh Werkst. 2006, 64, 363–371. [Google Scholar] [CrossRef]
- Tan, P.L.; Sharif, S.; Sudin, I. Roughness models for sanded wood surfaces. Wood Sci. Technol. 2012, 46, 129–142. [Google Scholar] [CrossRef]
- Goli, G.; Bléron, L.; Marchal, R.; Uzielli, L.; Negri, M. Formation and quality of wood surfaces processed at various grain angles-Douglas Fir and Oak. In Proceedings of the 4th IUFRO Symposium Wood Structure and Properties 02, Bystra, Slovakia, 1–3 September 2002; Kudela, J., Kurjatko, S., Eds.; Arbora Publishers: Zvolen, Slovakia, 2002; pp. 91–98, ISBN 80-967088-9-9. [Google Scholar]
- Goli, G.; Marchal, R.; Uzielli, L. Classification of wood surface defects according to their mechanical formation during machining. In Proceedings of the 2nd International Symposium on Wood Machining—Properties of Wood and Wood Composites Related to Machining, Vienna, Austria, 5–7 July 2004. ISBN/ISSN 978-3-9501315-2-9. [Google Scholar]
Figure 1.
The tool used for the CNC cutting the larch wood samples.

Figure 2.
Samples processed by CNC milling cut out from the larch fretwork panels.

Figure 3.
Samples processed by laser, cut out from the larch fretwork panels.

Figure 4.
The calculation of the Abbot-curve parameters: Rk, Rpk and Rvk [19].
Figure 4.
The calculation of the Abbot-curve parameters: Rk, Rpk and Rvk [19].

Figure 5.
The variation of the core roughness parameter, Rk: (a) for various cutting angles, with the feed speed; (b) for various feed speeds with the cutting angles.
Figure 5.
The variation of the core roughness parameter, Rk: (a) for various cutting angles, with the feed speed; (b) for various feed speeds with the cutting angles.

Figure 6.
The variation of the reduced peak height parameter, Rpk, for various cutting angles, with the feed speed.
Figure 6.
The variation of the reduced peak height parameter, Rpk, for various cutting angles, with the feed speed.

Figure 7.
The variation of the roughness parameters Rsk and Rp for various cutting angles with the feed speed: (a) Rsk; (b) Rp.
Figure 7.
The variation of the roughness parameters Rsk and Rp for various cutting angles with the feed speed: (a) Rsk; (b) Rp.

Figure 8.
The variation of the roughness parameters Rvk and Rv for various cutting angles with the feed speed: (a) Rvk; (b) Rv.
Figure 8.
The variation of the roughness parameters Rvk and Rv for various cutting angles with the feed speed: (a) Rvk; (b) Rv.

Figure 9.
The variation of the arithmetic mean deviation of the roughness profile, Ra, for various feed speeds with the cutting angles.
Figure 9.
The variation of the arithmetic mean deviation of the roughness profile, Ra, for various feed speeds with the cutting angles.

Figure 10.
The variation of the arithmetic mean deviation of the waviness profile, Wa, for various cutting angles, with the feed speed.
Figure 10.
The variation of the arithmetic mean deviation of the waviness profile, Wa, for various cutting angles, with the feed speed.

Figure 11.
The variation of the roughness parameter Pa: (a) for various cutting angles, with the feed speed; (b) for various feed speeds with the cutting angles.
Figure 11.
The variation of the roughness parameter Pa: (a) for various cutting angles, with the feed speed; (b) for various feed speeds with the cutting angles.

Figure 12.
Larch processed by laser at 90° angle as relate to the grain (face-top image and cut edge —bottom image).
Figure 12.
Larch processed by laser at 90° angle as relate to the grain (face-top image and cut edge —bottom image).

Figure 13.
Larch processed by laser at 90° angle with respect to the grain with representation of a measured profile. The location of the selected profile is marked by the red line.
Figure 13.
Larch processed by laser at 90° angle with respect to the grain with representation of a measured profile. The location of the selected profile is marked by the red line.

Figure 14.
Surface measurement of larch processed by laser at a 90° angle with respect to the grain: (a) primary profile (profile having roughness and waviness together); (b) roughness profile (after the waviness was subtracted).
Figure 14.
Surface measurement of larch processed by laser at a 90° angle with respect to the grain: (a) primary profile (profile having roughness and waviness together); (b) roughness profile (after the waviness was subtracted).

Figure 15.
The variation of the roughness parameters Wt and Rk for various cutting angles, with the feed speed: (a) Wt; (b) Rk.
Figure 15.
The variation of the roughness parameters Wt and Rk for various cutting angles, with the feed speed: (a) Wt; (b) Rk.

Figure 16.
The variation of the roughness parameters Ra and Pa for various cutting angles, with the feed speed: (a) Wt; (b) Rk.
Figure 16.
The variation of the roughness parameters Ra and Pa for various cutting angles, with the feed speed: (a) Wt; (b) Rk.

Figure 17.
The variation of Rk and Pt roughness parameters with the cutting angles for laser processing and CNC milling with different feed speeds: (a) Rk; (b) Pt.
Figure 17.
The variation of Rk and Pt roughness parameters with the cutting angles for laser processing and CNC milling with different feed speeds: (a) Rk; (b) Pt.

Figure 18.
Microscopic images of the CNC routed surfaces for the most disadvantageous processing angles and feed speeds as compared with processing angle of 0°: (a) processing angle of 0° and 2 m/min feed speed (reference); (b) processing angle of 15° and 2.5 m/min feed speed; (c) processing angle of 30° and 3 m/min feed speed; (d) processing angle of 60° and 4 m/min feed speed.

Figure 19.
Microscopic images of laser cutting surfaces: (a) cutting angle of 0° and 60× magnification; (b) cutting angle of 0° and 180× magnification; (c) cutting angle of 15° and 60× magnification; (d) cutting angle of 15° and 180× magnification; (e) cutting angle of 60° and 60× magnification; (f) cutting angle of 60° and 180× magnification.


Table 1.
Checking the significance on Rk of varying the cutting angle with respect to the grain for various feed speeds.
Table 1.
Checking the significance on Rk of varying the cutting angle with respect to the grain for various feed speeds.
| Cutting Angle, in ° | Data | Rk, in µm, at Various Feed Speeds | ||||
|---|---|---|---|---|---|---|
| 2 m/min | 2.5 m/min | 3 m/min | 3.5 m/min | 4 m/min | ||
| 0 | Mean Rk (STDEV) 1 Significance | 14.63 | 17.03 | 16.59 | 17.90 | 17.55 |
| (5.47) | (5.57) | (4.64) | (4.39) | (3.68) | ||
| A | A | A | A | A | ||
| 15 | Mean Rk (STDEV) Significance | 58.05 | 51.19 | 47.19 | 45.42 | 40.12 |
| (12.83) | (5.74) | (6.66) | (5.02) | (4.13) | ||
| C | B | D | C | B | ||
| 30 | Mean Rk (STDEV) Significance | 43.11 | 45.46 | 48.03 | 47.26 | 55.85 |
| (11.97) | (8.49) | (6.42) | (5.97) | (11.71) | ||
| D | B,C | D | C | C | ||
| 45 | Mean Rk (STDEV) Significance | 32.90 | 38.25 | 42.39 | 46.69 | 47.75 |
| (3.96) | (5.07) | (2.12) | (7.35) | (5.09) | ||
| B,D | C,D | C,D | C | B,C | ||
| 60 | Mean Rk (STDEV) Significance | 27.90 | 33.53 | 37.30 | 39.72 | 39.69 |
| (3.34) | (4.97) | (7.61) | (3.95) | (5.98) | ||
| A,B | D,E | C | B,C | B | ||
| 75 | Mean Rk (STDEV) Significance | 26.62 | 31.63 | 35.46 | 35.94 | 40.73 |
| (4.08) | (6.48) | (5.74) | (3.82) | (8.90) | ||
| A,B | D,E | B.C | B | B | ||
| 90 | Mean Rk (STDEV) Significance | 29.59 | 27.99 | 29.05 | 33.68 | 40.13 |
| (13.81) | (7.12) | (3.35) | (6.03) | (10.45) | ||
| A,D | E | B | B | B | ||
1 Standard deviation.
Publisher’s Note: MDPI stays neutral with regard to jurisdictional claims in published maps and institutional affiliations. |
© 2021 by the authors. Licensee MDPI, Basel, Switzerland. This article is an open access article distributed under the terms and conditions of the Creative Commons Attribution (CC BY) license (https://creativecommons.org/licenses/by/4.0/).
Share and Cite
MDPI and ACS Style
Gurău, L.; Coşereanu, C.; Paiu, I. Comparative Surface Quality of Larch (Larix decidua Mill.) Fretwork Patterns Cut through by CNC Routing and by Laser. Appl. Sci. 2021, 11, 6875. https://0-doi-org.brum.beds.ac.uk/10.3390/app11156875
AMA Style
Gurău L, Coşereanu C, Paiu I. Comparative Surface Quality of Larch (Larix decidua Mill.) Fretwork Patterns Cut through by CNC Routing and by Laser. Applied Sciences. 2021; 11(15):6875. https://0-doi-org.brum.beds.ac.uk/10.3390/app11156875
Chicago/Turabian StyleGurău, Lidia, Camelia Coşereanu, and Iulian Paiu. 2021. "Comparative Surface Quality of Larch (Larix decidua Mill.) Fretwork Patterns Cut through by CNC Routing and by Laser" Applied Sciences 11, no. 15: 6875. https://0-doi-org.brum.beds.ac.uk/10.3390/app11156875
Note that from the first issue of 2016, this journal uses article numbers instead of page numbers. See further details here.