
Influence of Some Additives on the Properties of OPC Solidified Sandy Silt


School of Civil Engineering and Architecture, Zhejiang Sci-Tech University, Hangzhou 300018, China
*
Author to whom correspondence should be addressed.
Appl. Sci. 2021, 11(16), 7252; https://0-doi-org.brum.beds.ac.uk/10.3390/app11167252
Submission received: 6 July 2021
/
Revised: 30 July 2021
/
Accepted: 2 August 2021
/
Published: 6 August 2021
(This article belongs to the Special Issue Research and Enhancement of Mechanical Properties of Cementitious Materials)
Abstract
:The ordinary Portland cement (OPC)-based solidification process is used extensively to reinforce soils due to its available and good bonding properties. Alternative products are used in cementitious materials to enhance the strength and to reduce OPC consumption. In this study, the effect of additive type and mass fraction on the microstructure and mechanical properties of solidified sandy silt are investigated. There are four types of additives (gypsum, lime, clay particles, and fly ash) at mass fractions of 2, 3, and 4% that are considered in order to study their mechanical properties (unconfined compression, indirect tensile, flexural strength, and compressive resilient modulus) at 7, 14, 28, 60, and 90 days. The optimal contents of additive gypsum, clay particles, and fly ash are determined to be 2%, 4%, and 4%, respectively. Such improvement of additive-modified OPC solidified sandy silt is due to the formation of the crystalline compound or the gradation composition improvement via field emission scanning electron and X-ray diffraction analysis.
1. Introduction
With rapid urbanization, massive housing demolitions and foundation pit excavations have produced infinite construction waste soil. The inappropriate accumulation and landfill of this construction waste soil will cause serious land depletion casualties, such as the severe landslide accident in Shenzhen in 2016 [1,2]. Therefore, how to use this construction waste soil reasonably is still an enormous challenge for geotechnical engineers. Hangzhou, a large city located in the southeast of China, generated more than 8.5 million tons of construction waste soil in 2015. Currently, a large number of methods has been used to handle the mechanical property disadvantages, such as the soil replacement cushion, the vibroflotation process, dynamic compaction, the bored pile method, etc. [3,4,5].
However, additives have been proved to improve the properties of waste soil effectively, including ductility as well as compressive and shear behaviors [6,7]. Ordinary Portland cement (OPC) is the topmost volume cementitious material, and it has been considered as the primary binding agent for both stabilizers and concrete because of its acceptable available and mechanical properties as well as its high-temperature resistance [8,9]. Recently, various types of additives have been employed to improve the performance of the OPC-based stabilizer in practice. To achieve an appropriate proportion of bentonite with OPC and lime, Sivapullaiah et al. [10] studied the mechanical properties of solidified soil, and relevant test results showed that 20% bentonite plus 1% lime or OPC can mainly enhance the strength of red soil: the early strength of the OPC-stabilized soils increased rapidly; for lime-cured soil, the later strength increased faster. According to the optimal moisture content and compaction degree, Oza et al. [11] compared the compressive strength performance of cured soil specimens in different contents of curing montmorillonite soil with OPC only, OPC plus lime, and lime only. The results illustrated that 7%, 8%, and 9% were the best contents of these three stabilizers, respectively. Yilmaz et al. [12] studied the compaction characteristics, stress–axial strain, and unconfined compressive strength of solidified soil with different contents and ages by using the ratio of hard boracite slag and OPC that had to solidified clay. Lee et al. [13] conducted tests on solidified soil, and the results showed that the increase of the soil–OPC ratio improved solidified soil. Narendra et al. [14] established a nonlinear functional strength model of OPC-cured soil taking the unknown factors of strength development into consideration. Ribeiro et al. [15] studied the influence of OPC content, water–cement ratio, and age on the compressive strength of solidified soil and analyzed the test results through bonding parameters. Consoli et al. [16] obtained the relationship between the porosity, OPC content, and strength of solidified soil through an experimental study on OPC-stabilized soil with different moisture content, porosity, OPC content, and curing time and proposed that the cost of solidifying soil could be reduced by controlling the porosity and OPC content.
In general, previous research has mainly focused on solidified clay, and the mechanism for how to solidify it. Furthermore, the cost analysis of OPC with different additives has not been systematically analyzed. It is easy for sandy silt to cause various geological disasters due to its loose structure, poor cohesive strength, and liquefaction that can be easily caused by vibrations. For pouring sandy silt into a foundation pit with groundwater can form quicksand during excavation [17]; aa sandy silt slope of a highway can be damaged by rainfall infiltration [18]; a sandy silt bank the slope on a river course can be damaged by erosion, which can cause bank collapse under the action of water flow [19]; sandy silt can be liquefied due to earthquakes, thus causing foundation invalidation, ground subsidence, and other destruction [20]. Thus, it is imperative to find a suitable method for sandy silt solidification. This study investigates the influence of plenty of additives, which occur in practices, in the development of mechanical properties as well as in the microstructures of OPC-stabilized sandy silt. The parameters contained the types and the content of the additives together with the curing periods. The lab experiments were conducted via unconfined compressive, indirect tensile, flexural strength, and compressive resilient modulus tests. Additionally, the microstructure of the mortars was assessed with the aid of field emission scanning electron (FESEM) and X-ray diffraction (XRD) analysis.
2. Experimental Work
2.1. Materials
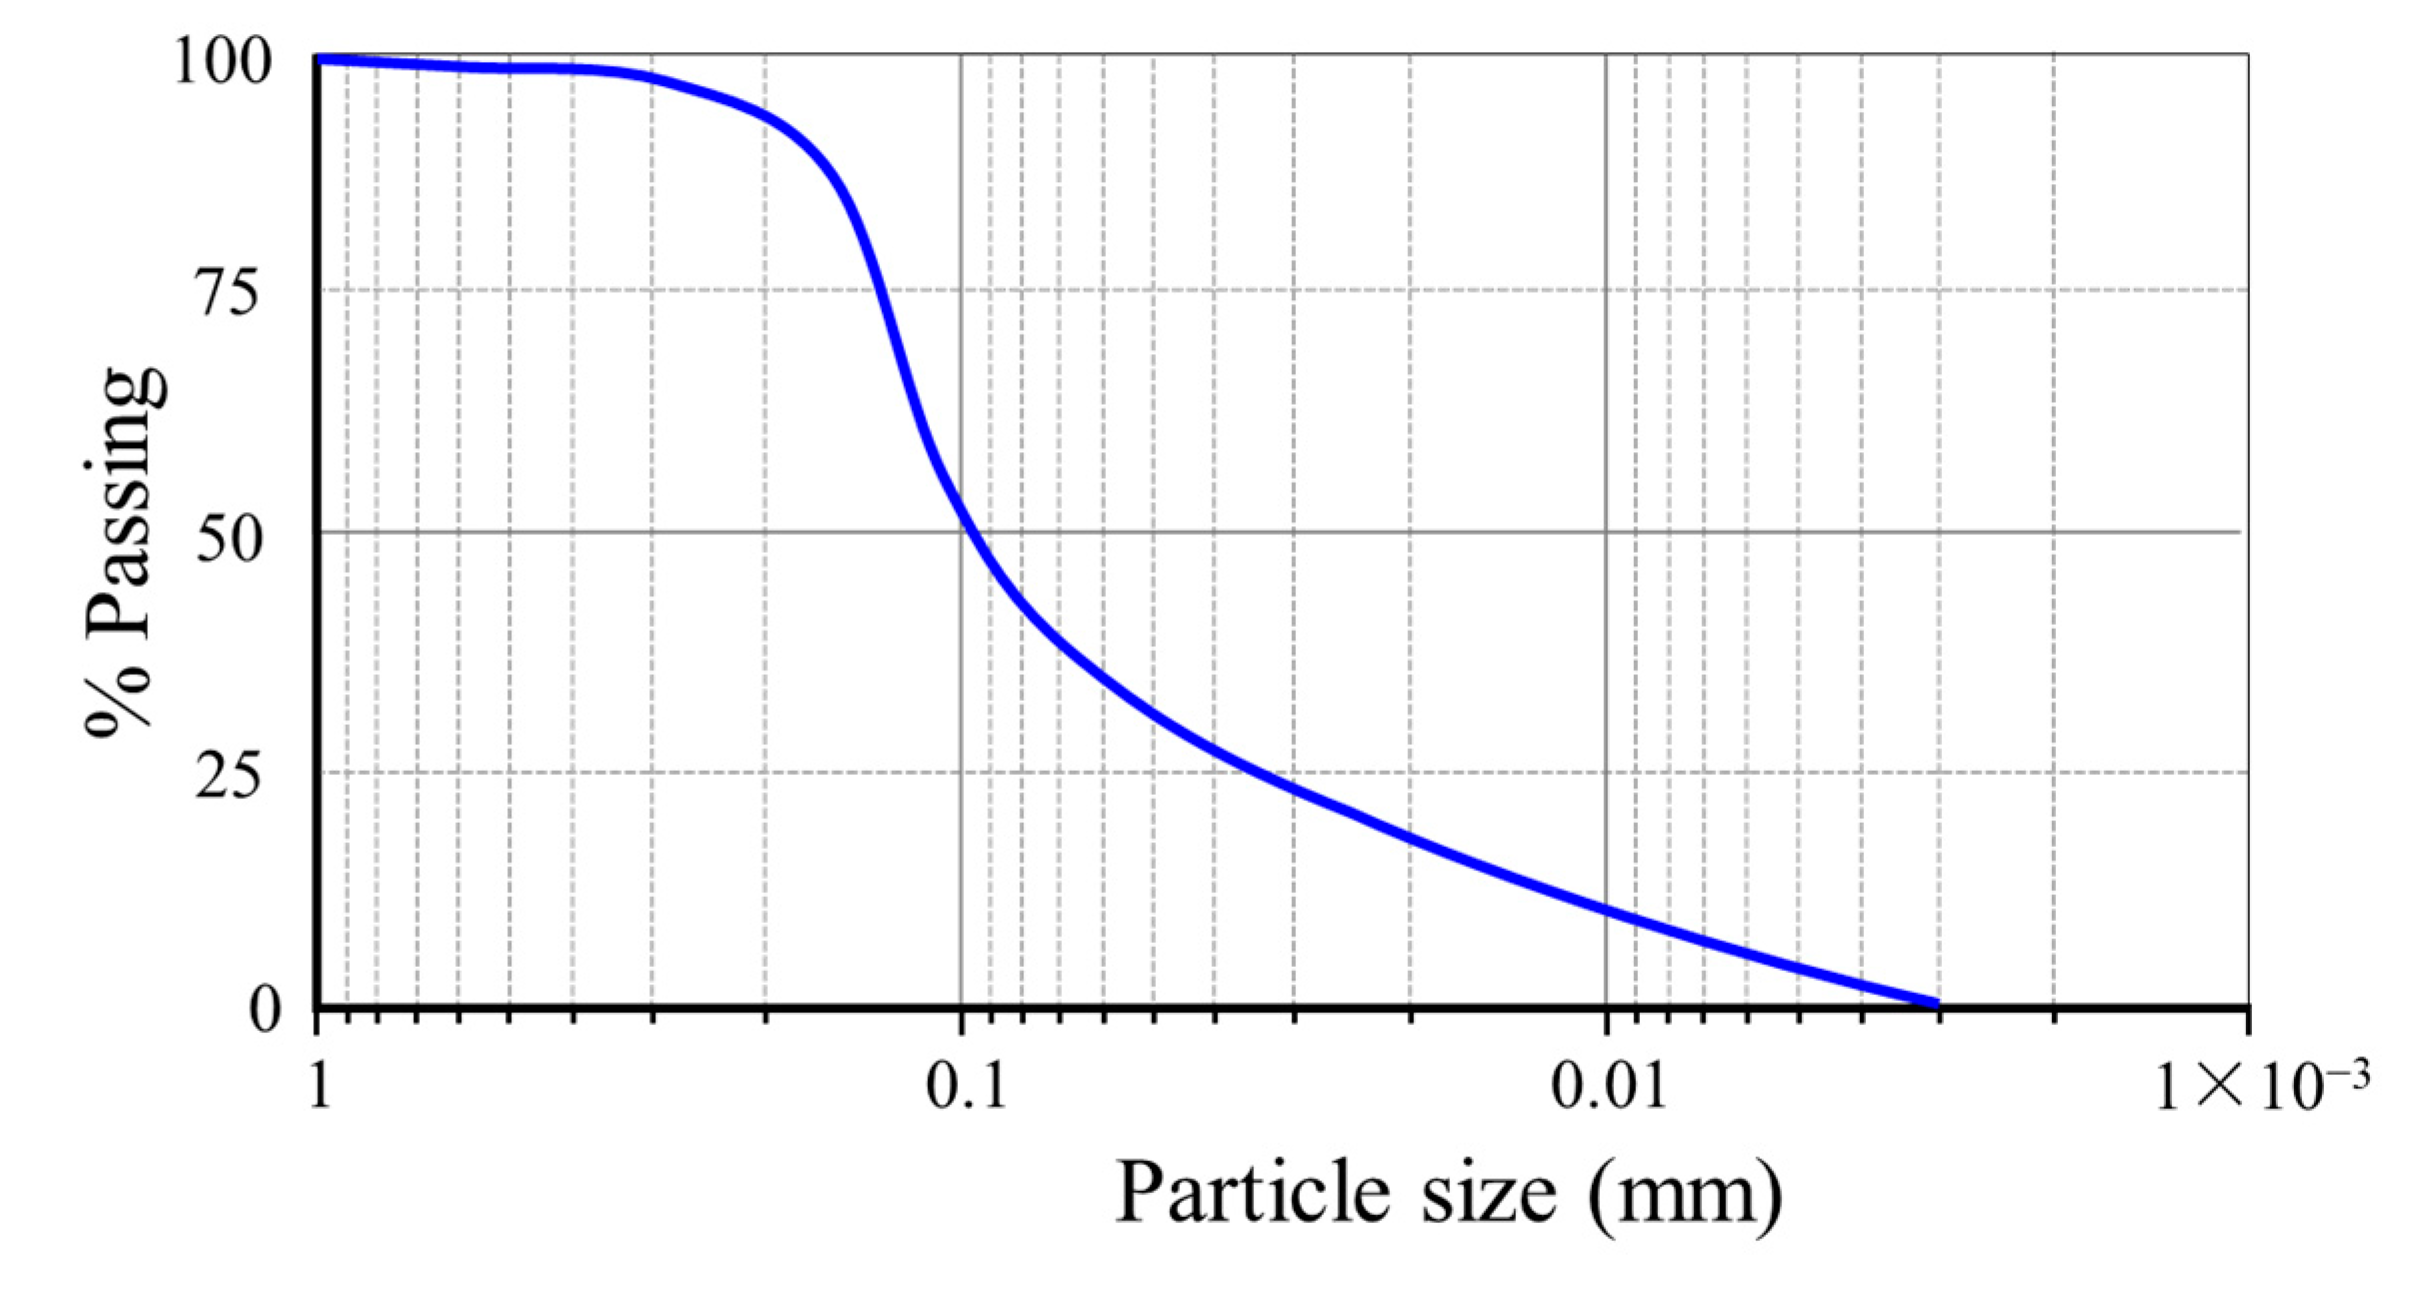
In this test, sandy silt was collected from depths of approximately 2 to 4 m in the Xiaoshan region, Hangzhou, China. The plastic limit, liquid limit, and plasticity index of the sandy silt was 18%, 24%, and 6, respectively. The result of particle size distribution is shown in Figure 1. OPC was used as a stabilizer, and its physical property details are in Table 1. Lime, clay particles, gypsum, and fly ash were chosen as the additives, and Table 2 lists the main chemical compositions obtained by X-ray fluorescence (XRF) analysis.
The clay particles were extracted from the raw clay, were mixed in the ratio of soil:water = 1:5, were placed in the cylinder, and were soaked for 24 h so that the gravel and fine soil particles were separated after mixing the mud through a 0.1 mm sieve for analysis. The fine particles were then boiled through an iron pot and were cooled to settle. According to Stokes law, the diameter of the soil particles controls the settlement velocity of the soil particles. According to formula (1), the settlement distance Hd was 45 cm, the water temperature was 25 °C, and the time for the soil particles with a diameter of 5 μm to settle from the top to the bottom of the tube was 5 h [21,22]. Therefore, the moisture evaporated, and the upper suspension was dried to obtain the clay particles.
Here, is the settling time of the soil particles. is the settling distance of the soil particle.
2.2. Preparation and Test Methods
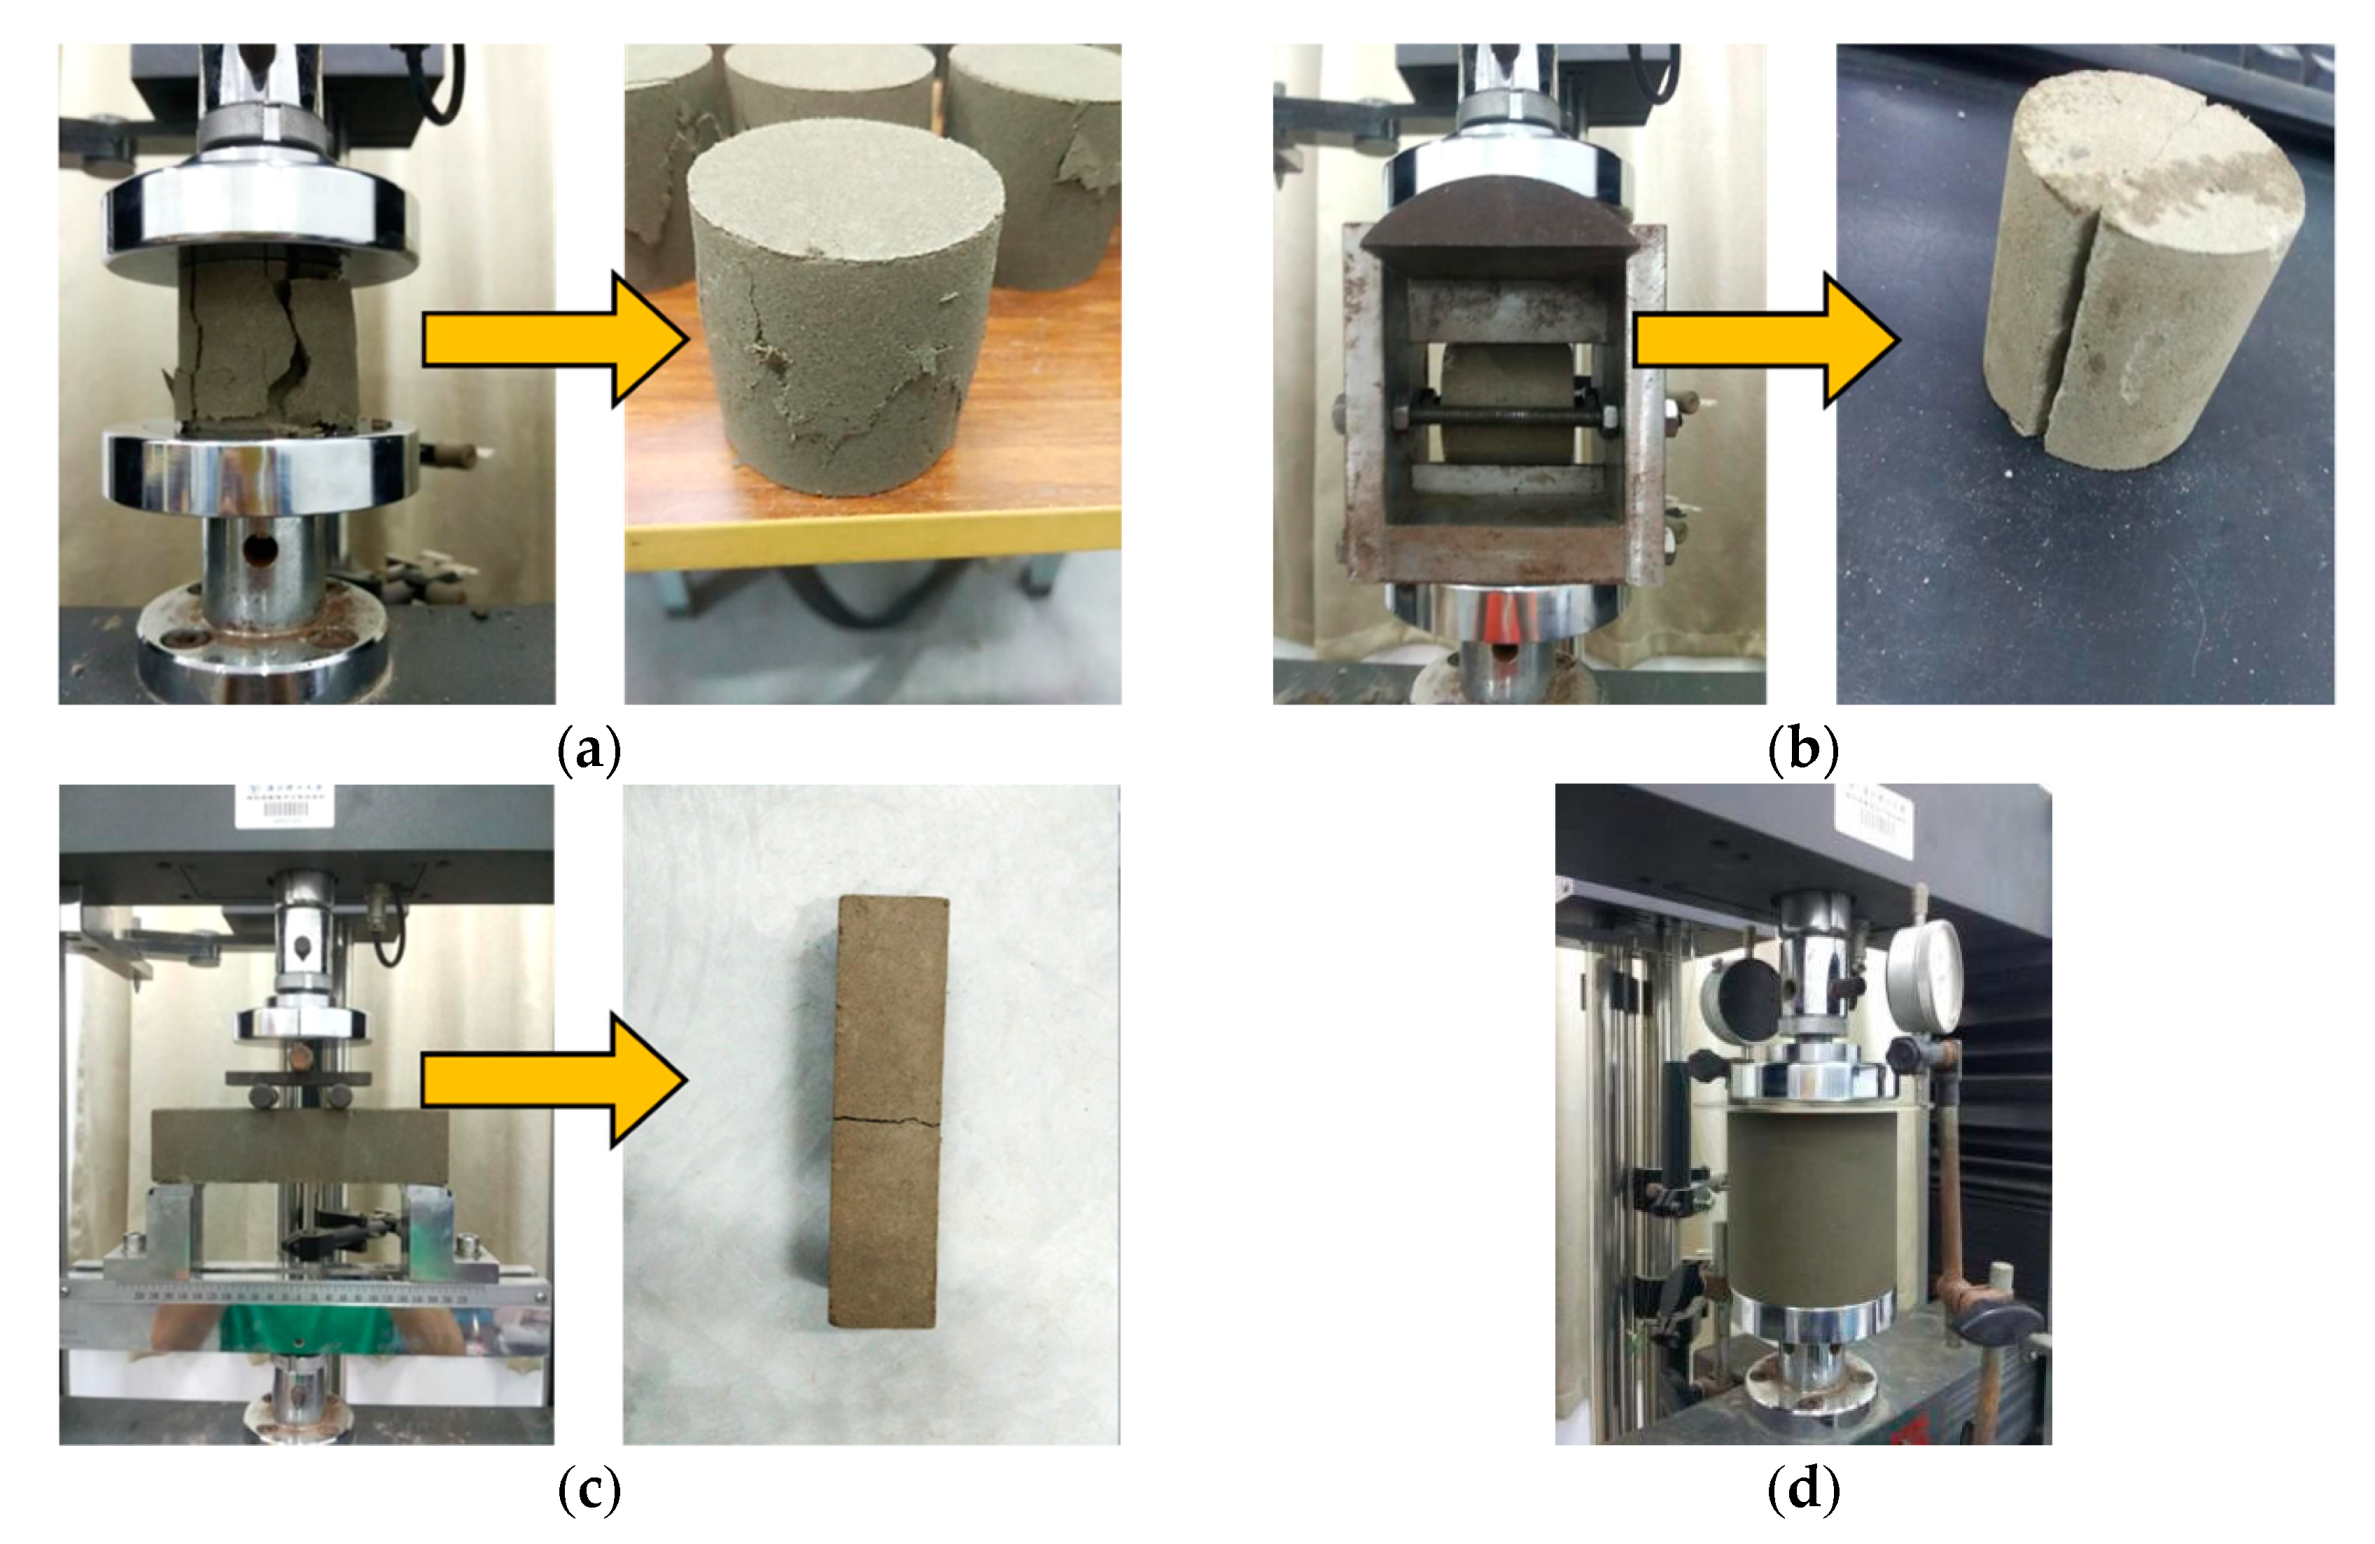
Previous studies conducted on sandy silt indicated that oven drying could change the plasticity and properties of the soil [23]. Therefore, in this test, air-dried undisturbed sandy silt was selected and was ground into smaller sizes using a sieve, and sandy silt with a moisture content of 20% was disposed of. The mix proportion of OPC was first determined through trail mixing so that the stabilized soil had good mechanical properties and a moderate setting time. All solidified soil specimens were prepared under the condition of 11% OPC inclusion. The proportion of additives is shown in Table 3 (sandy soil weight basis). OPC and different types of additives were dry mixed in a Hobart mixer. The liquid components of the soil specimens and the concrete were gradually added to the solid particles over the next one minute and were then further mixed for 3 min for homogeneity. The paste was cast into molds (cylinder specimens with a diameter of 50 mm and a height of 50 mm for unconfined compression and tensile strength tests; 40 × 40 × 160 mm prisms for flexural and cylinder specimens with a diameter of 100 mm and a height of 100 mm for compressive resilient modulus test) in three layers on a table vibrator and were then wrapped using a thin plastic sheet to prevent the evaporation of the solution. The specimens were stored in a standard curing chamber (temperature = 18 °C–22 °C; relative humidity > 95%).
Unconfined compression and tensile strength tests for the specimens were executed according to GB/T 50123-2019 [24] using a WEW-2000D universal testing machine. Specimens were loaded at a rate of 0.5 mm/min under displacement control. A flexural strength test was conducted by using a YDW-10 cement bending machine (loading speed = 40 N/s). The strengths were calculated using Equations (2)–(4).
where, , , , , and b are the peak load (N), the cross-sectional area (mm2), the diameter (mm), the height (mm), and the width (mm) of the specimen, respectively; and are the central angle of the half-width and the width of the pressing strip.
For the compressive resilient modulus tests, the loading gradually increased from a low load to a high load. The maximum values of the loading band were collected as well as their corresponding displacement variations [25].
where, is the load amplitude (N), is the deformation amplitude (mm).
Every solidified sandy silt specimen was prepared in triplicate for each mixture and curing period, and the results were expressed in terms of the average. A total of 510 specimens were prepared in this test. Moreover, the test set-up and failure detail of the specimens are shown in Figure 2.
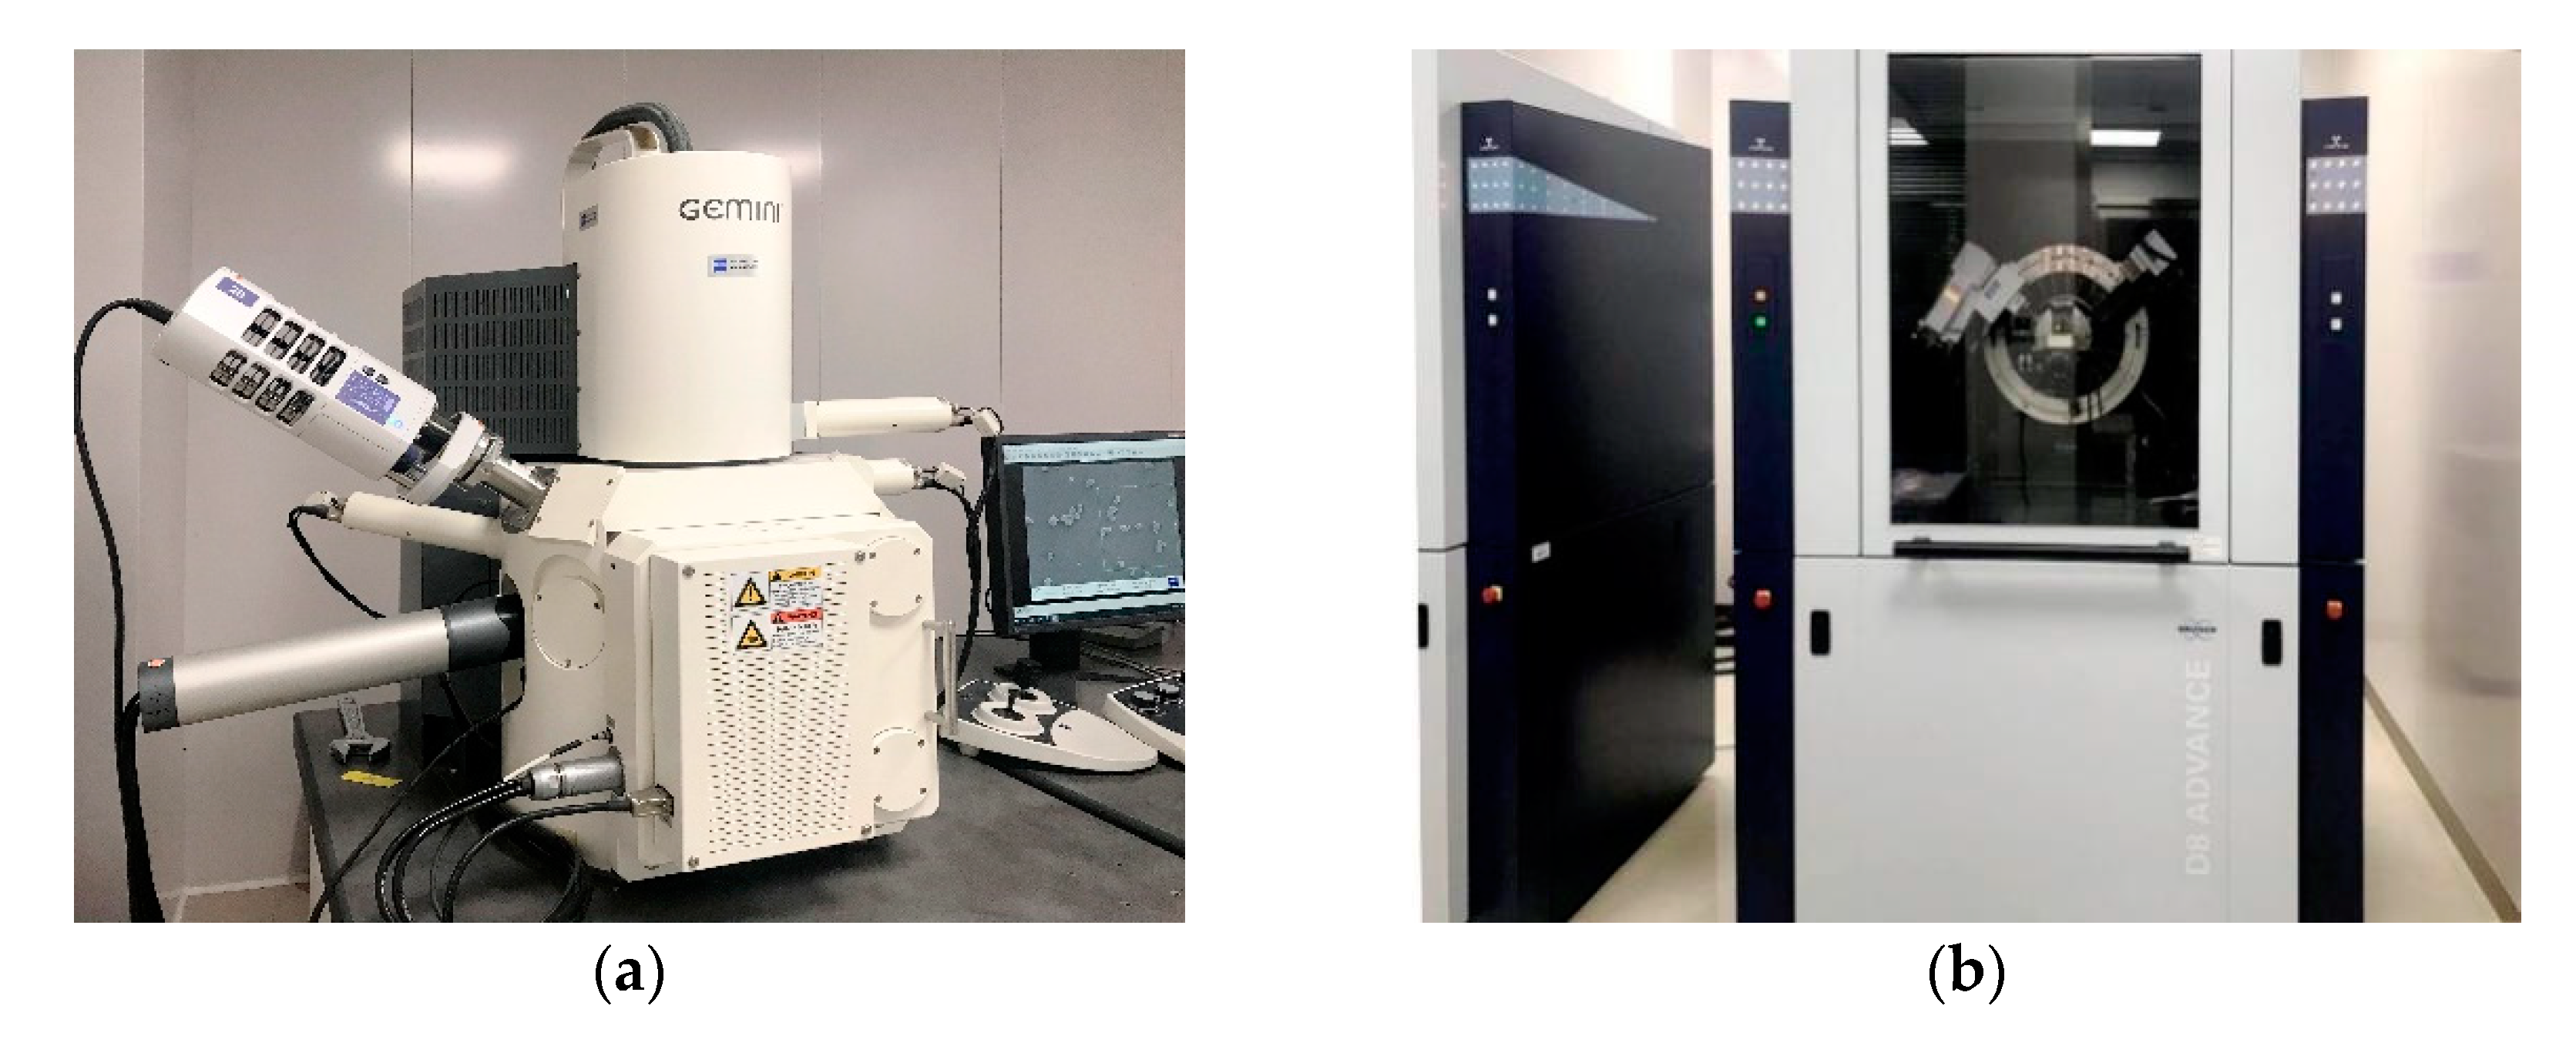
In the FESEM test, the fracture surface morphologies of the specimens with a metallic coating were examined using a Gemini Vltra55 field emission scanning electron microscope at a 3-kV accelerated voltage, as shown in Figure 3a. XRD analyses were completed using the Bruker AXS D8 Advance diffractometer (German) with a measurement range of 2θ = 10–80°, a step time of 0.1 s, a voltage of 40 kV, and a current density of 30 mA (see Figure 3b). Jade software was then used to process peak positions through comparison with a Powder Diffraction File (PDF).
3. Results
3.1. Unconfined Compression Test
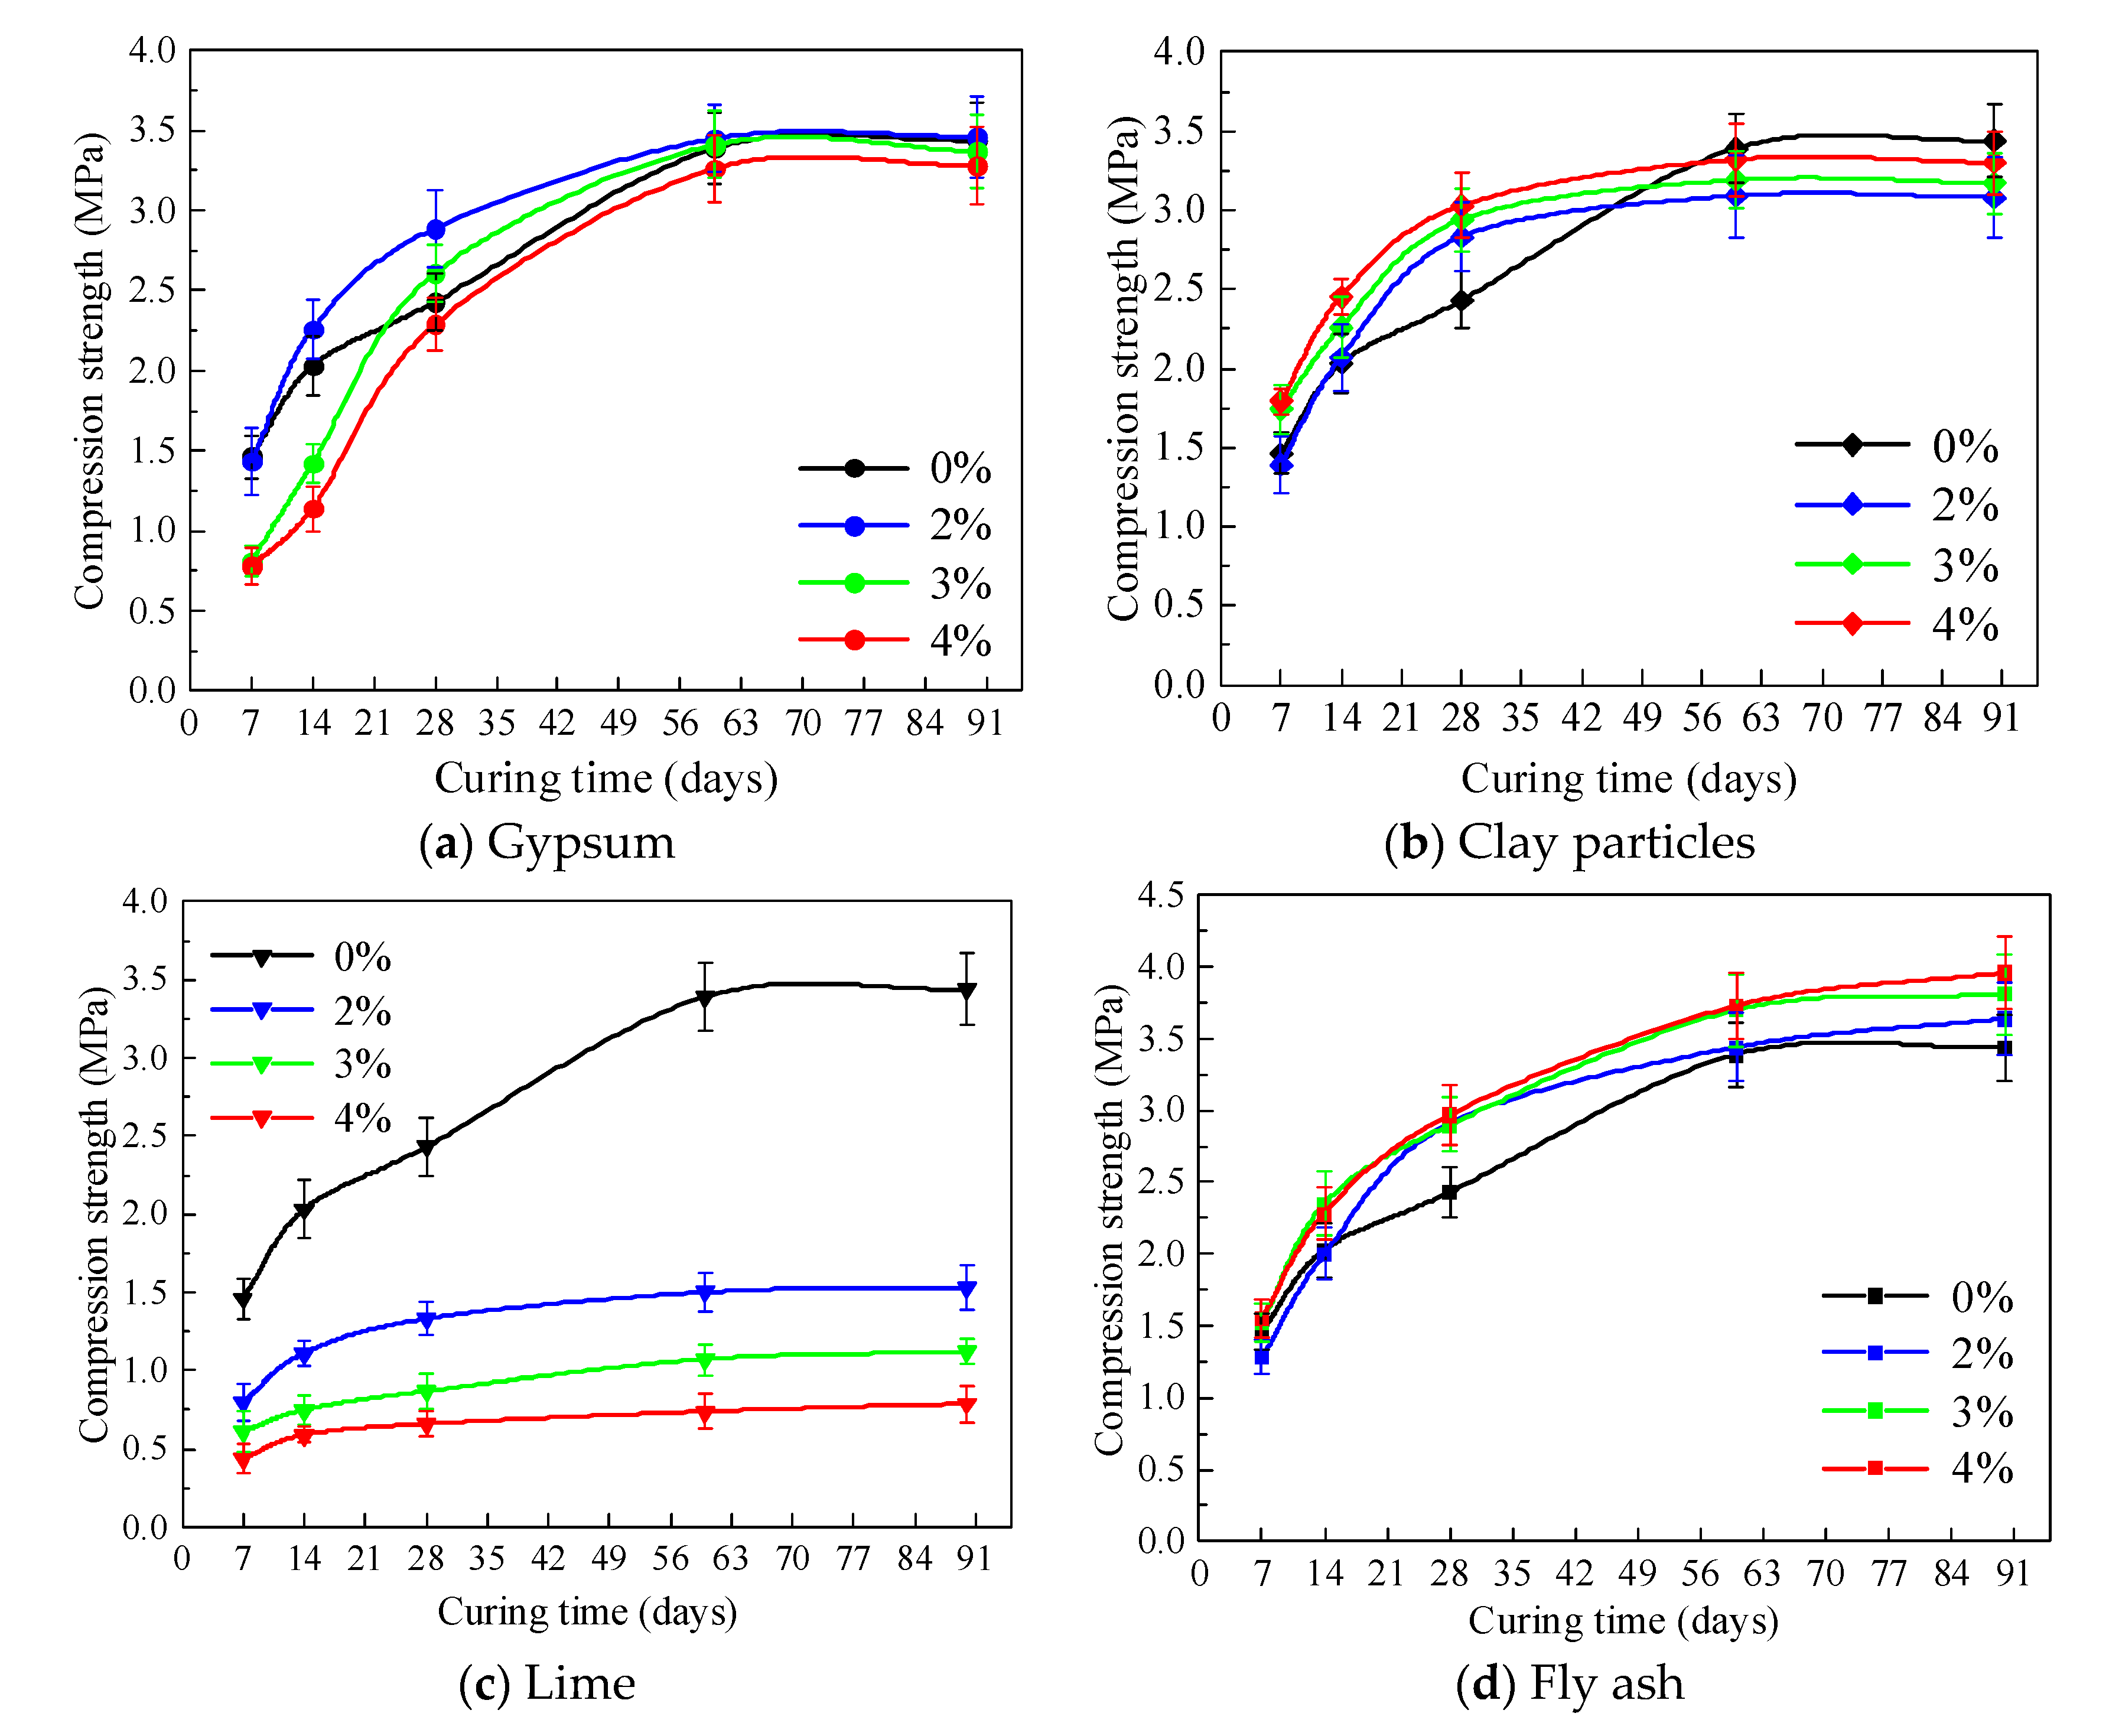
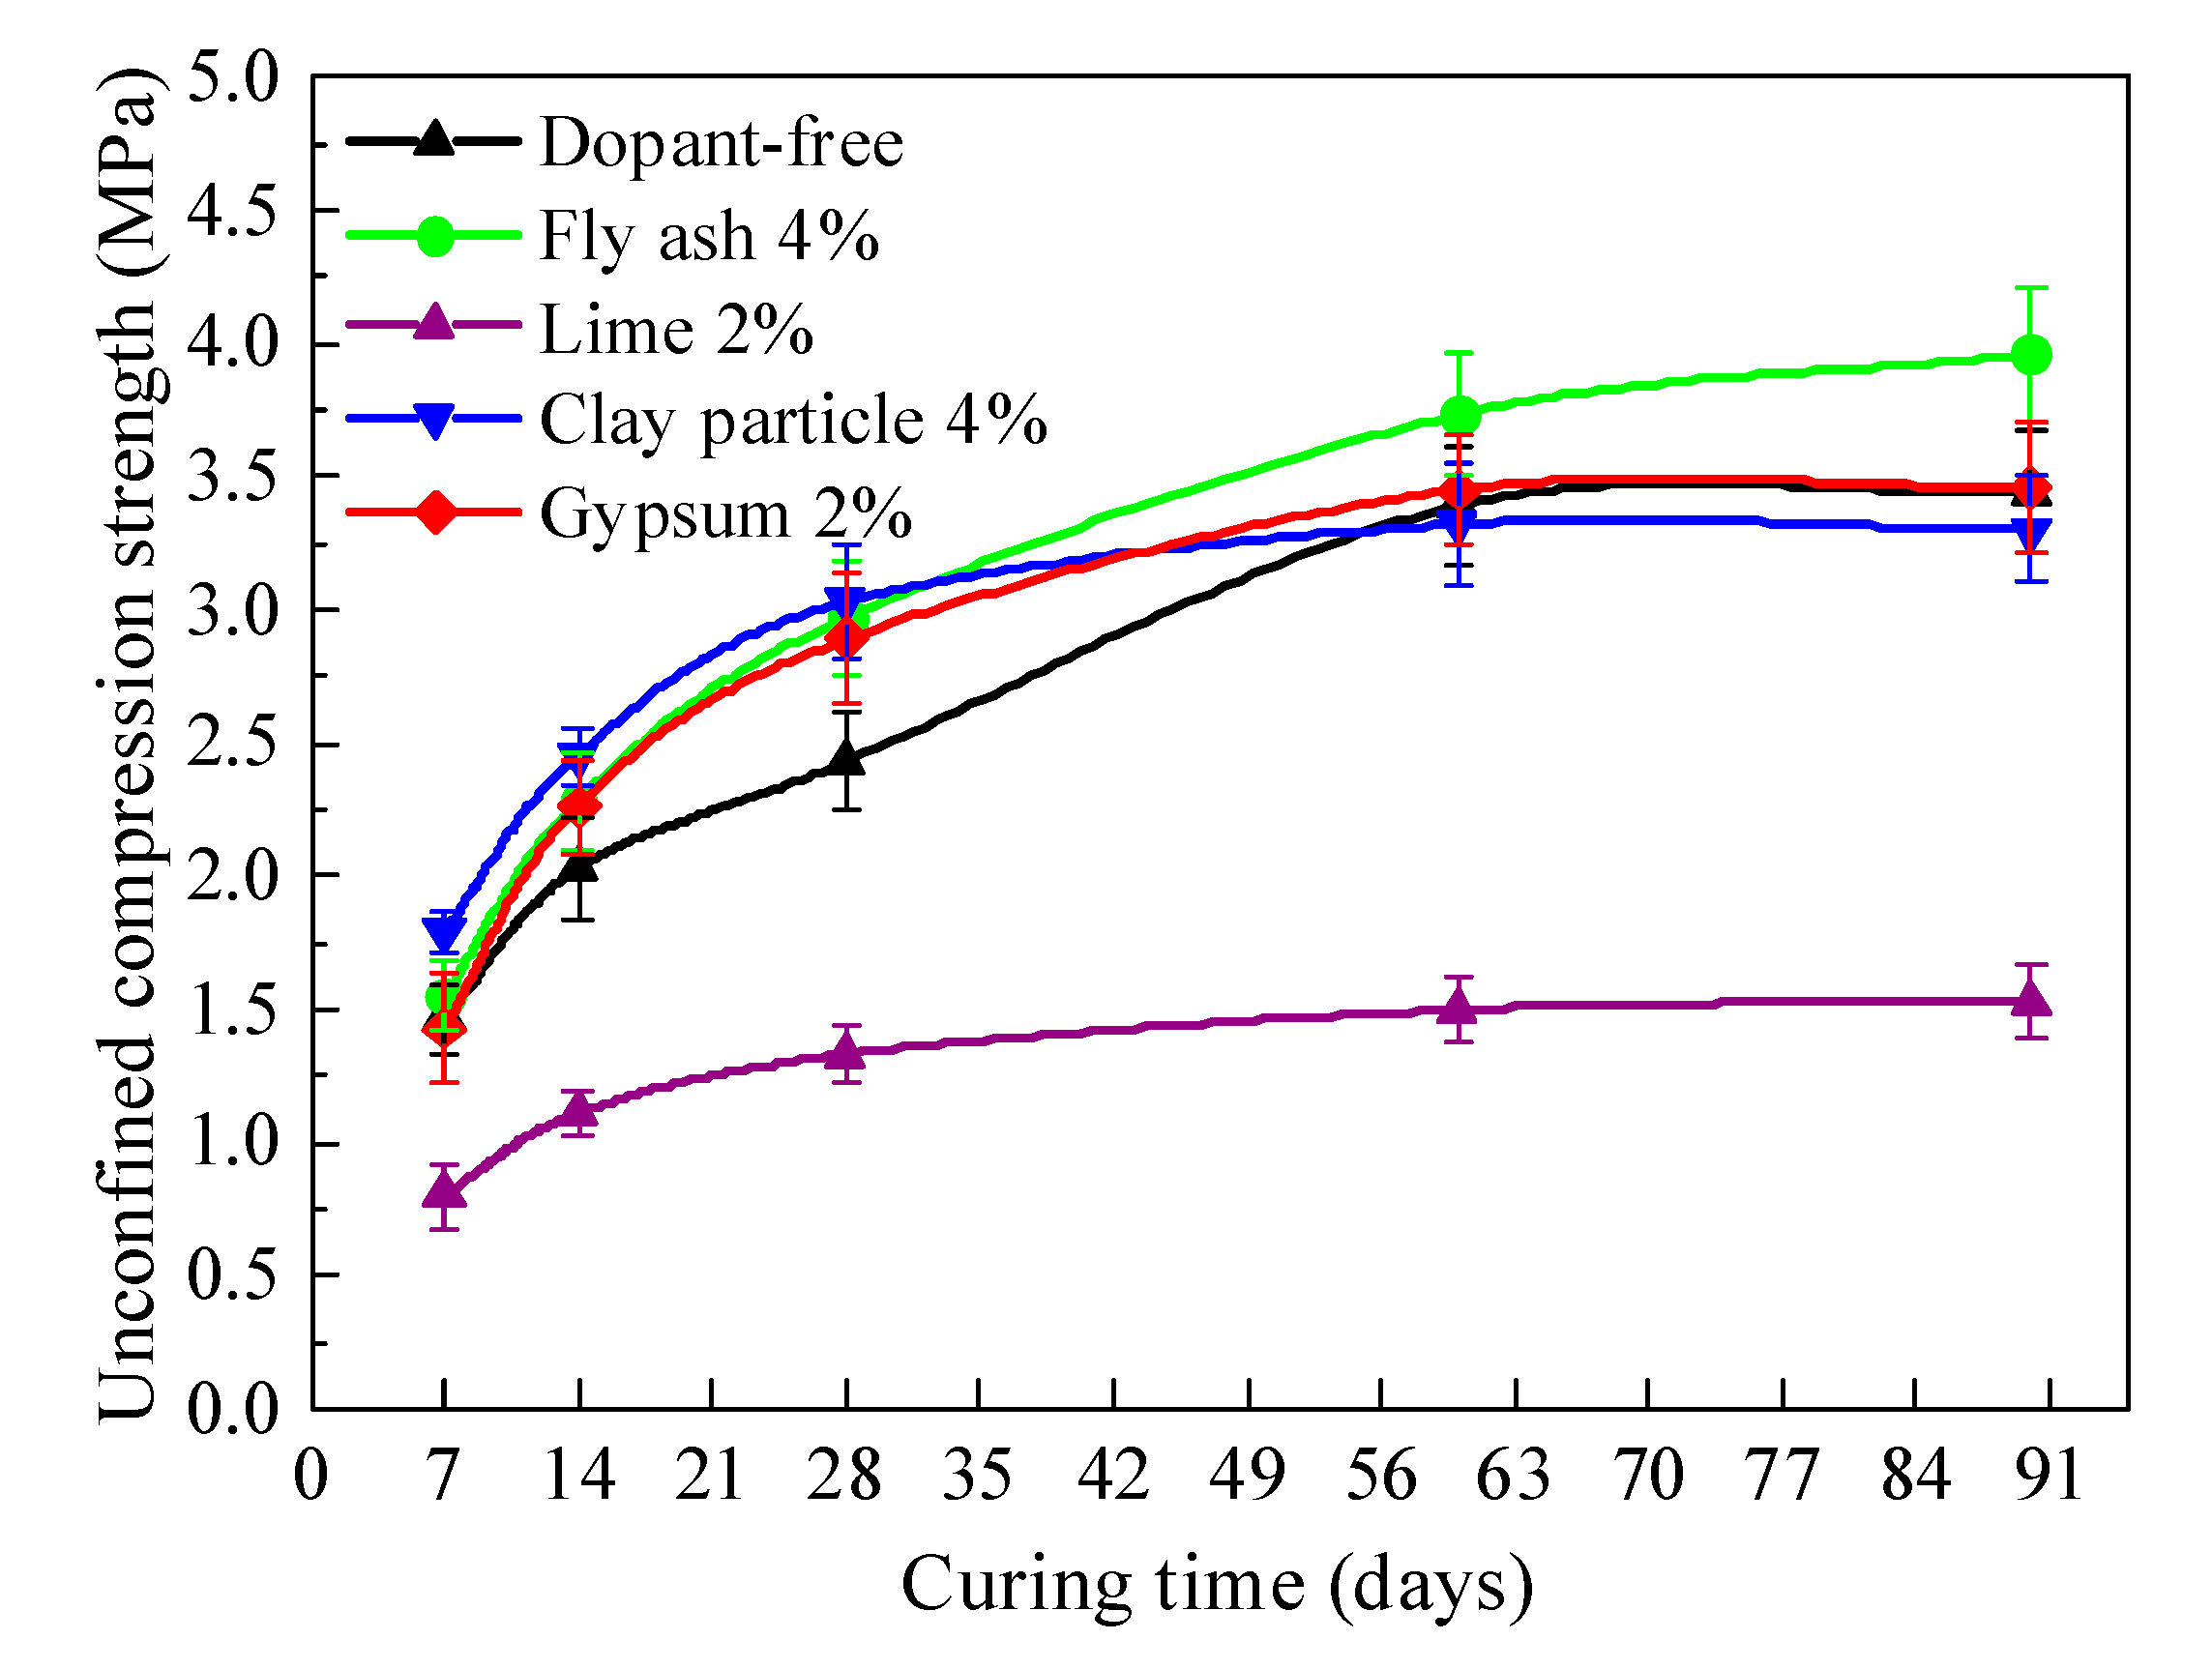
Figure 4 and Table 4 shows the unconfined compressive strength test results with different additive replacement ratios. The rapid improvement in strength was observed in all 145 specimens at the age of 28 days and became stable after 60 days. For gypsum, the unconfined compressive strength reached its maximum level when the content was 2%, and the strength slightly decreased with the increase of the gypsum. For example, the reduction for SS3 and SS4 was 1.2 and 4.4% compared to SS2 at the age of 90 days. For the clay particles, it is noted that with the increase of content, the unconfined compressive strength increased at all ages. However, the effect of the clay particles on the solidified sandy silt is not ideal for long periods, which may attribute to the free water discharge [26]. It is noted that the addition of lime reduced the unconfined compressive strength. Specimens with 4% lime reached a minimum value of 0.79 MPa at the age of 90 days, decreasing by 77.0% compared to the control group. Saeed et al. [27] also reported similar conclusions. However, they found that the OPC experiences more retardation with heavy metals than with lime in the soil. For fly ash, the strength of the specimens shows an increasing trend, which is similar to that of gypsum. When the fly ash replacement ratio increased to 4%, the strength increased by 22.2 and 15.1% at the ages of 28 and 90 days. Figure 5 also illustrates unconfined compressive strength with the optimal content of each additive to the comparison. Overall, the unconfined compressive strength of the solidified sandy silt was increased in the order of 2% lime < 4% clay particle < 2% gypsum < 4% fly ash for 90 days.
3.2. Indirect Tensile Strength
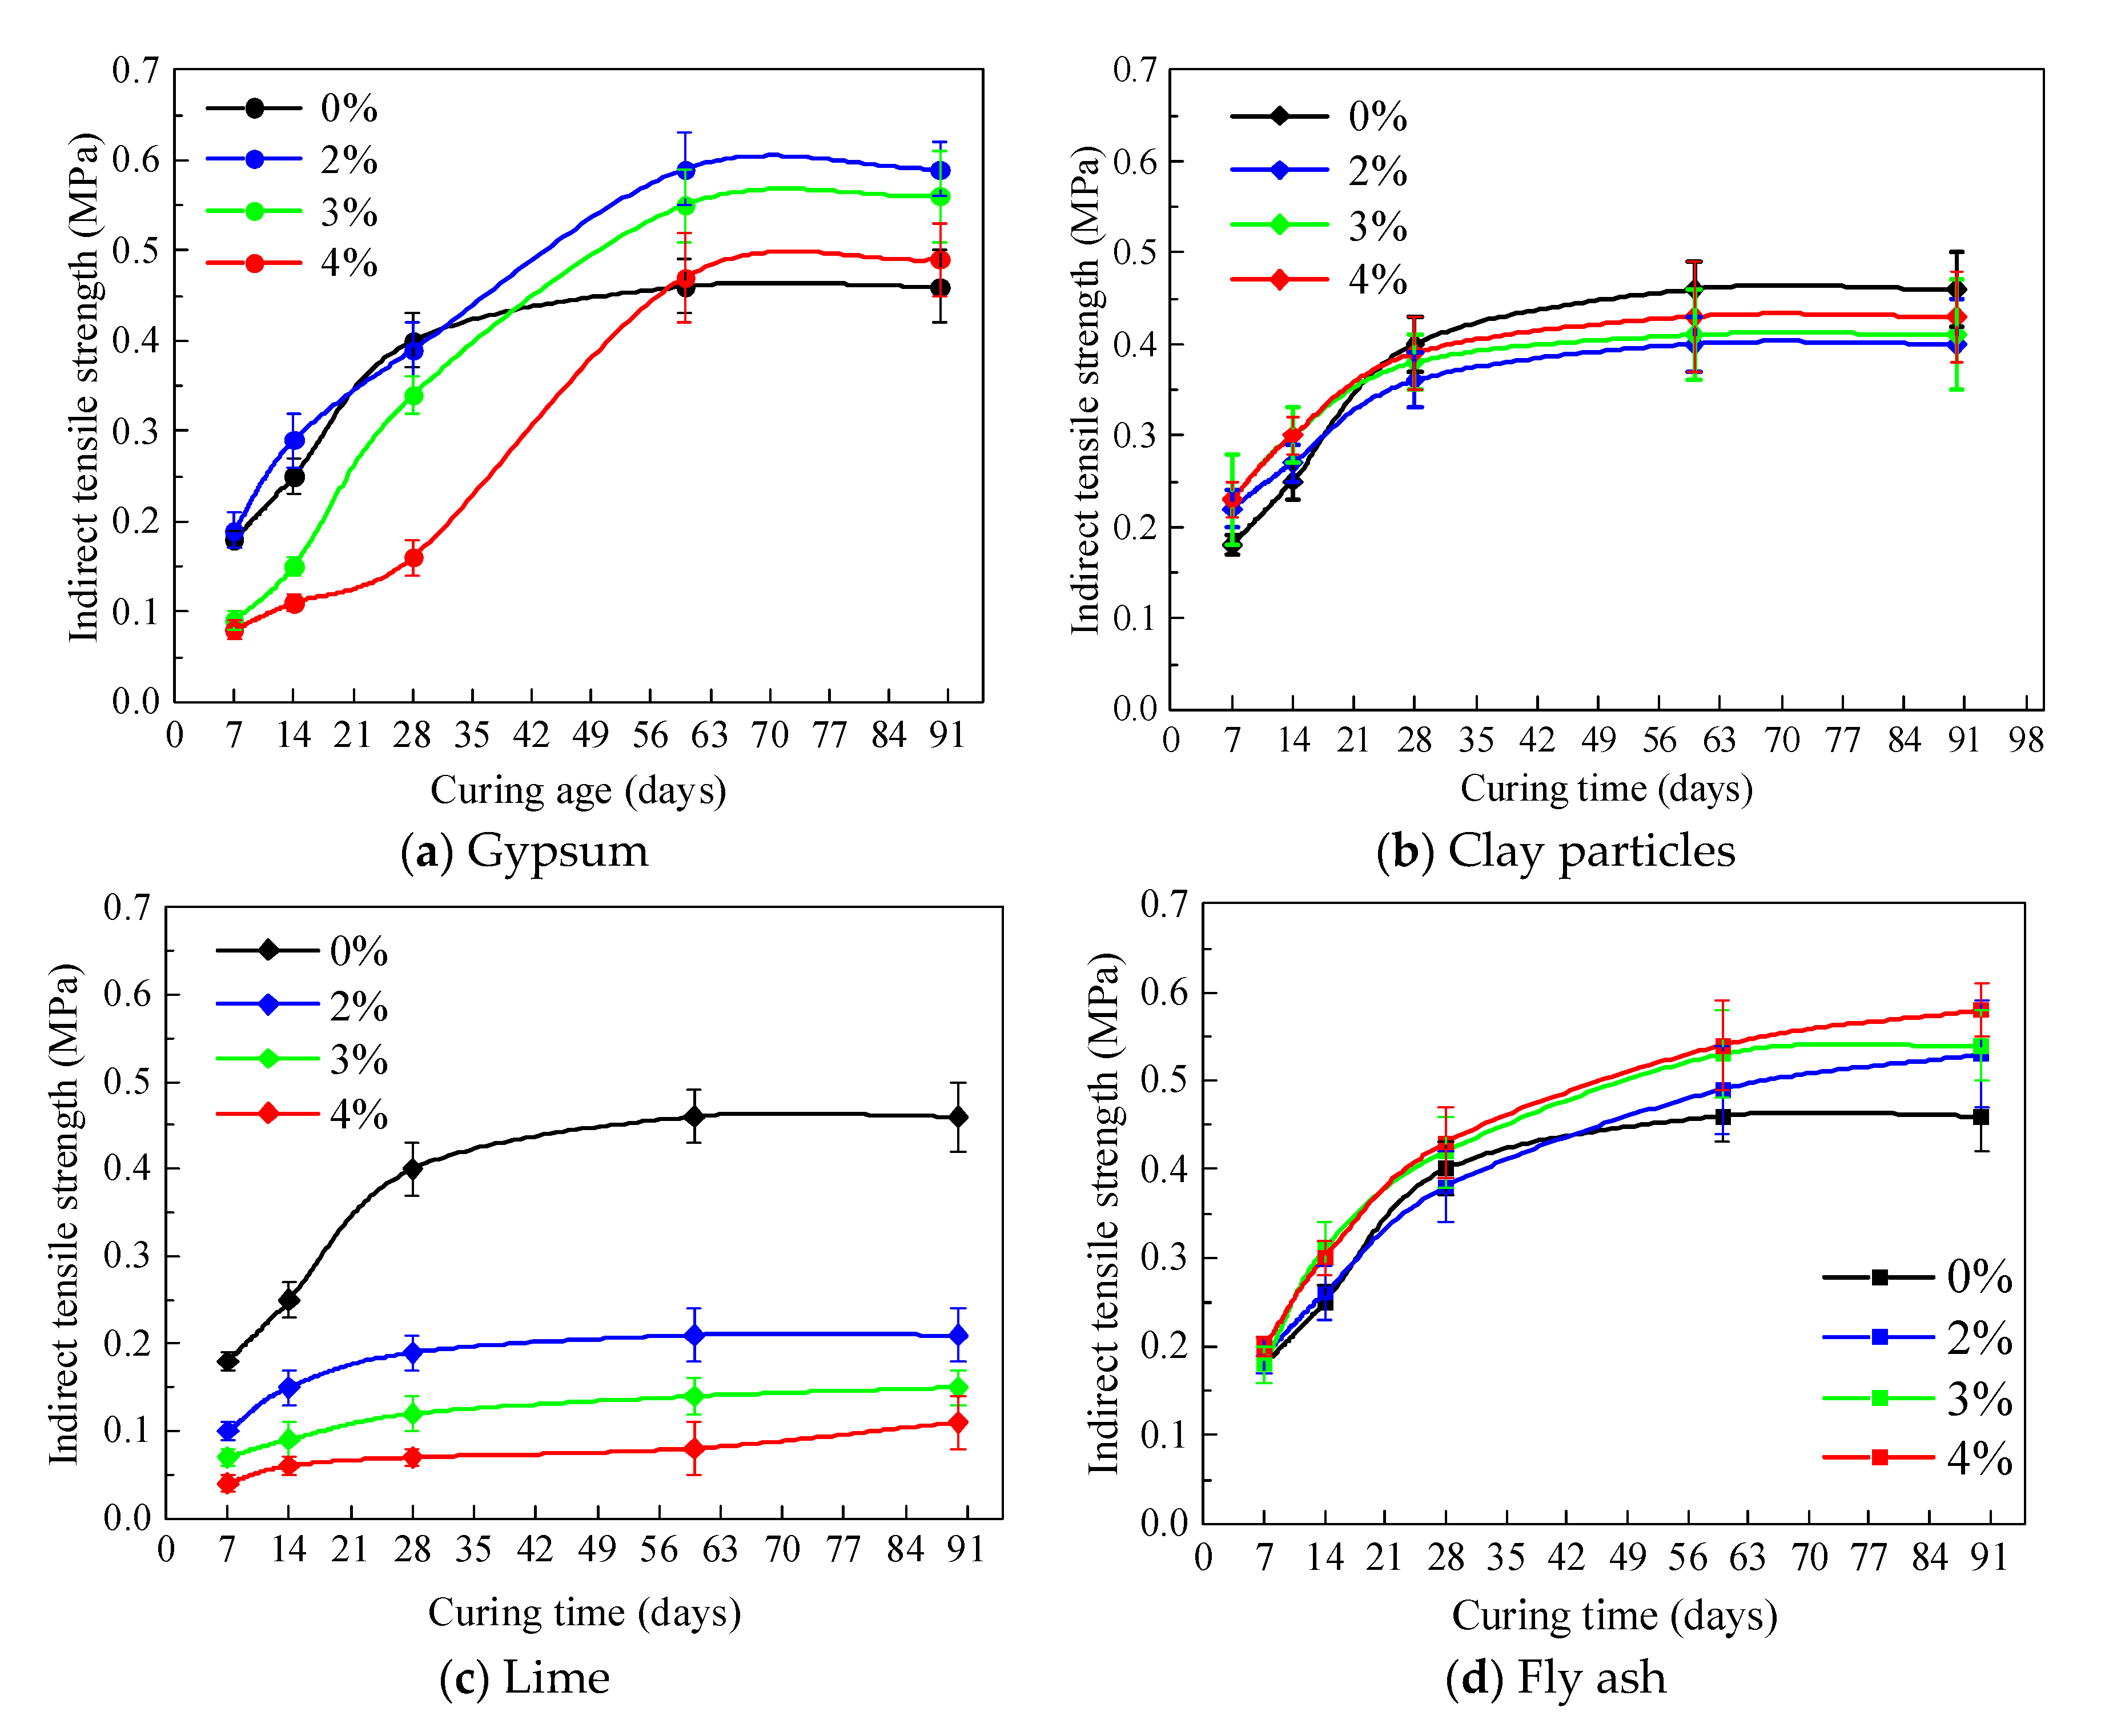
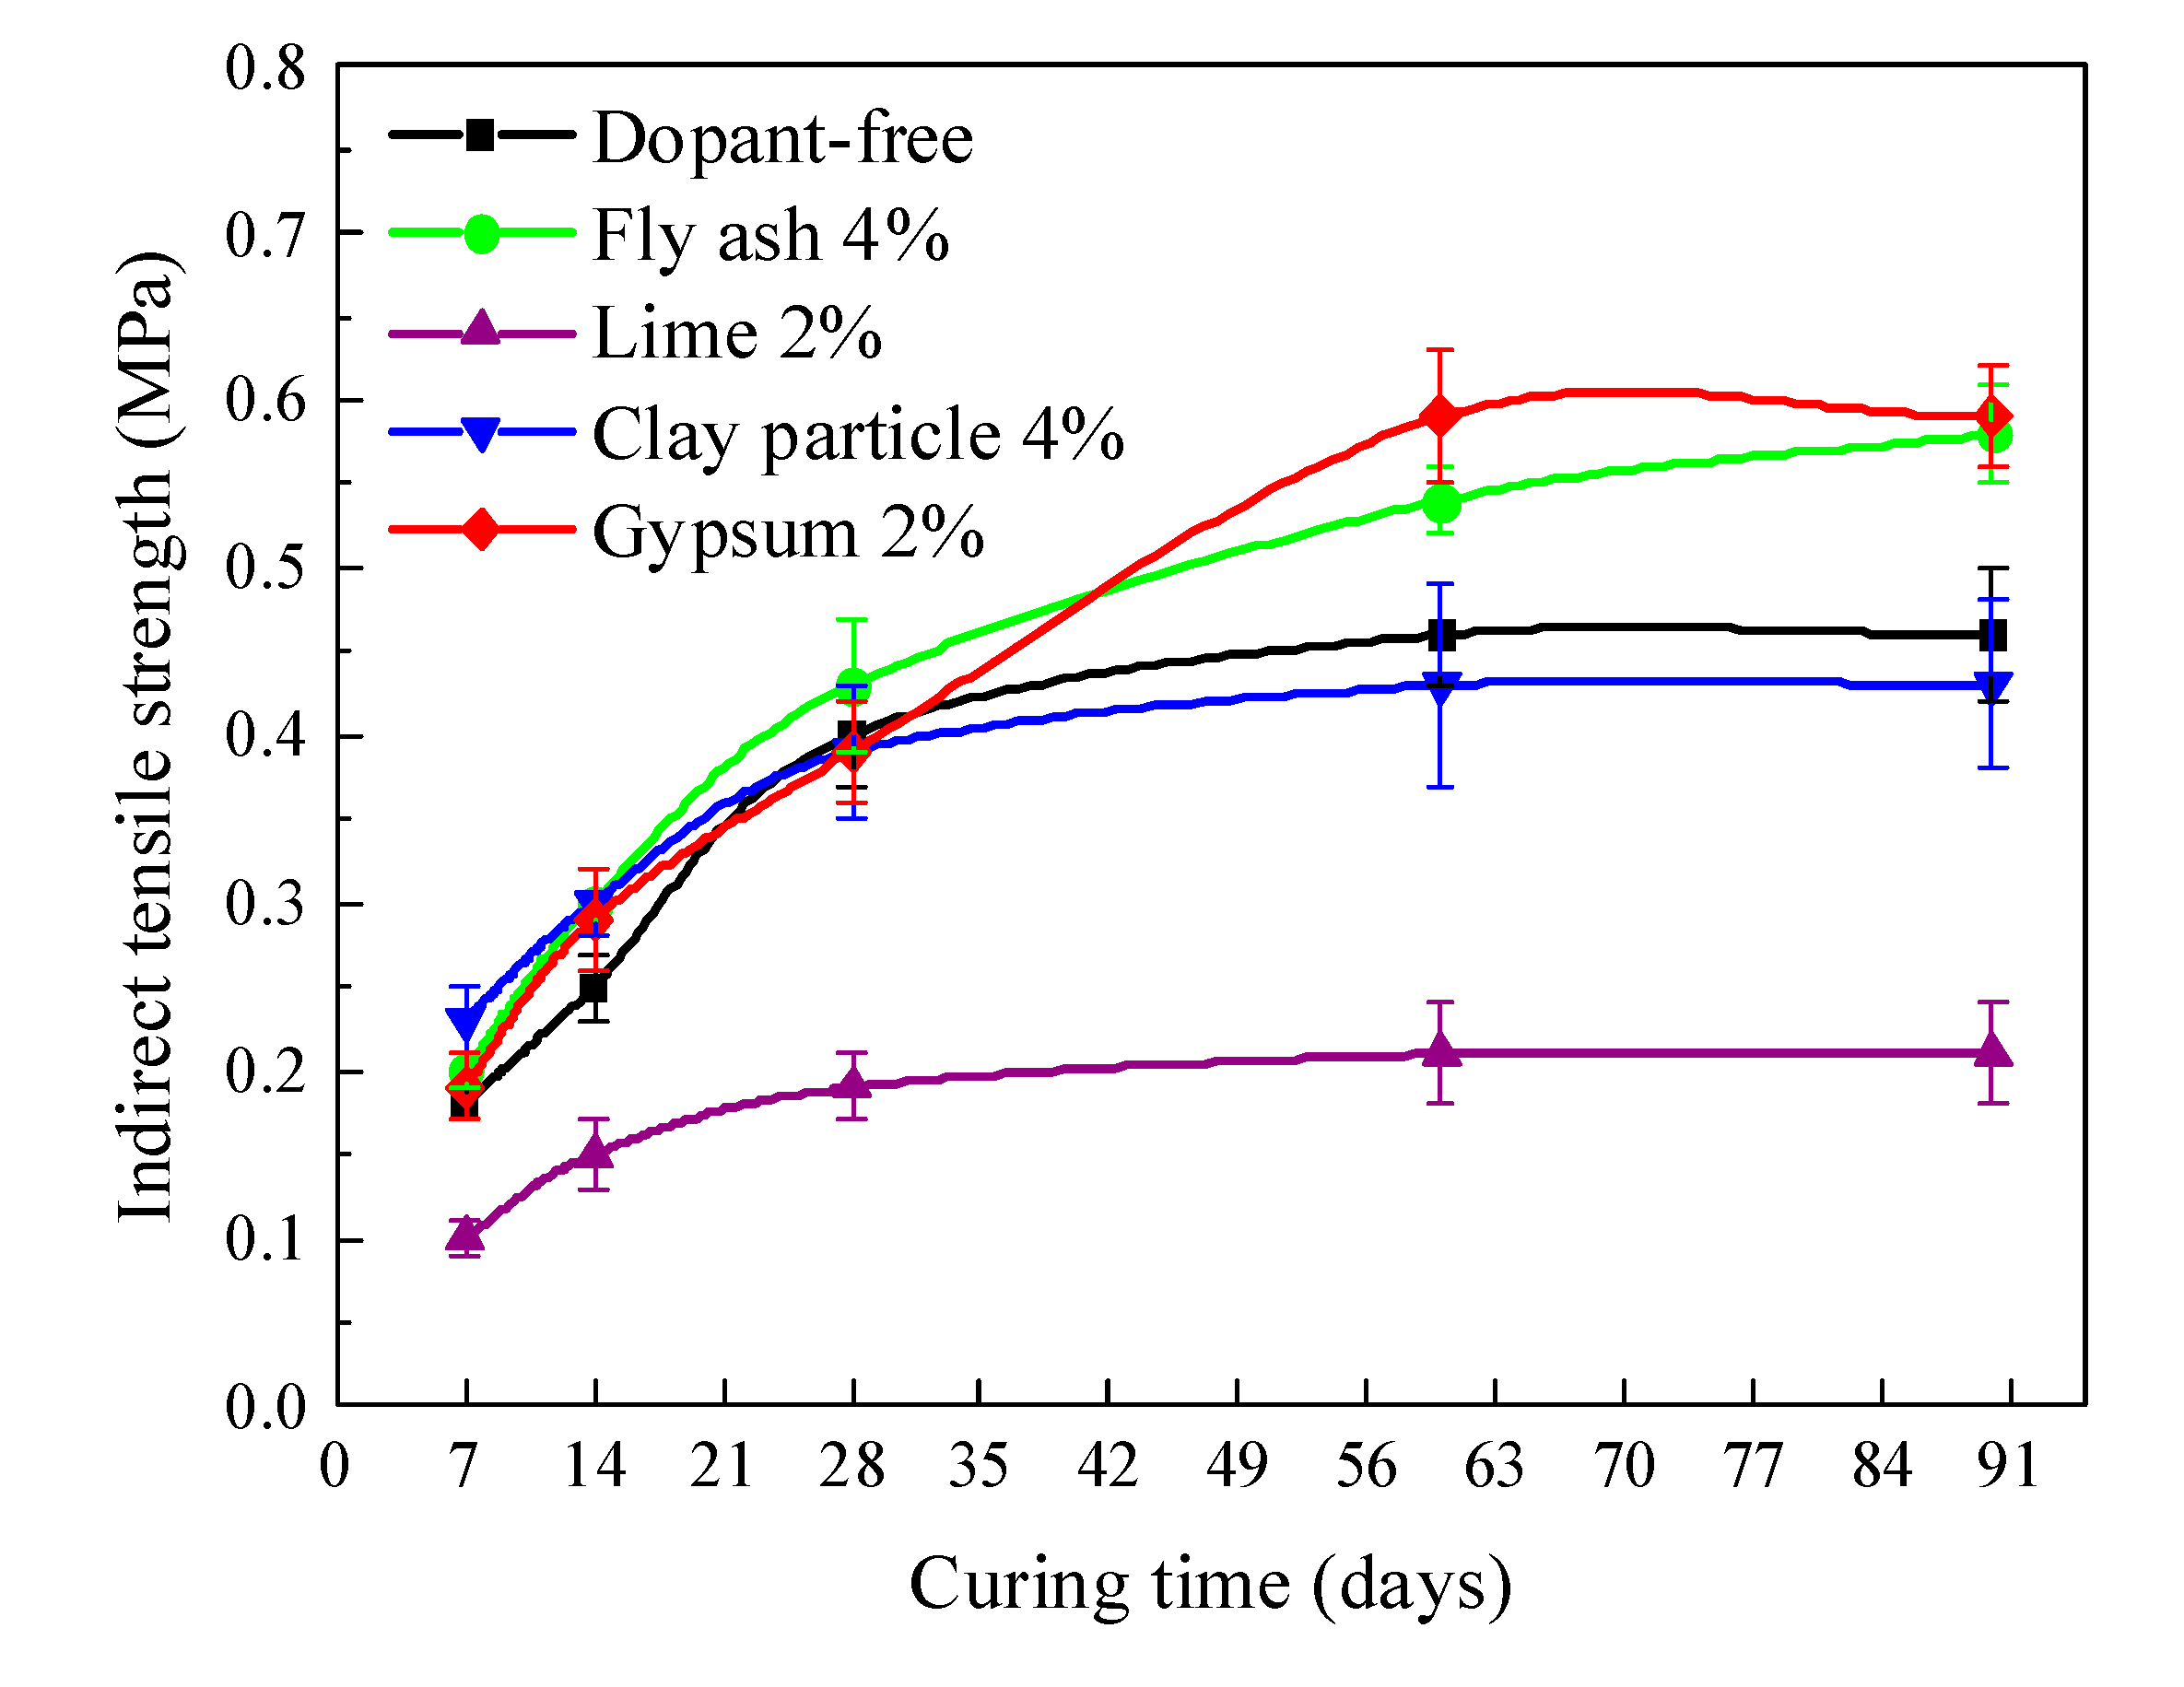
The trend of the indirect tensile strength changes was similar to those of unconfined compression, as shown in Figure 6 and Table 5. All specimens showed an increasing rate up to the age of 60 days and then a constant rate of change. For gypsum, the effect of a different content on tensile strength was not similar to that in the early stage of curing. The strength of the control group was similar to that of the specimen with 2% gypsum in the early stage, while after 28 days, the strength of the latter was higher than in the control group. For example, the strength of SS2 increased by 28.26% compared to SS1 at the age of 90 days. Overall, the OPC and gypsum solidified sandy silt establishes higher indirect tensile strength than the others. For the clay particles, the indirect tensile strength of the specimens decreased slightly with various displacement ratios. It is noted that the strength of SS1 increased by 15.0%, 12.2%, and 7.0% compared to that of SN2, SN3, and SN4, respectively, after 90 days. For lime, the change of indirect tensile strength was not very different from the compressive strength, with the results indicating that lime is not an ideal reinforcement for solidified sandy silt, which even has negative effects. The inclusion of fly ash has little effect on the indirect tensile strength of the specimens at the early stage. For example, the increase in the strength of the specimens was 5.0% and 7.5% with the 3% and 4% addition of fly as compared to SS1 at 28 days. However, the increase reached 15.2% and 26.1% after 90 days. The results indicate that the fly ash activity is low in the early reaction stages, and the fly ash activity is exerted in the late stage when the OPC hydration forms alkaline environment [28]. Figure 7 also illustrates indirect tensile strength with the optimal content of each additive in order to complete the comparison. Overall, the unconfined compressive strength of the solidified sandy silt increased in the order of 2% lime < 4% clay particle < 4% fly ash < 2% gypsum for 90 days.
3.3. Flexural Strength
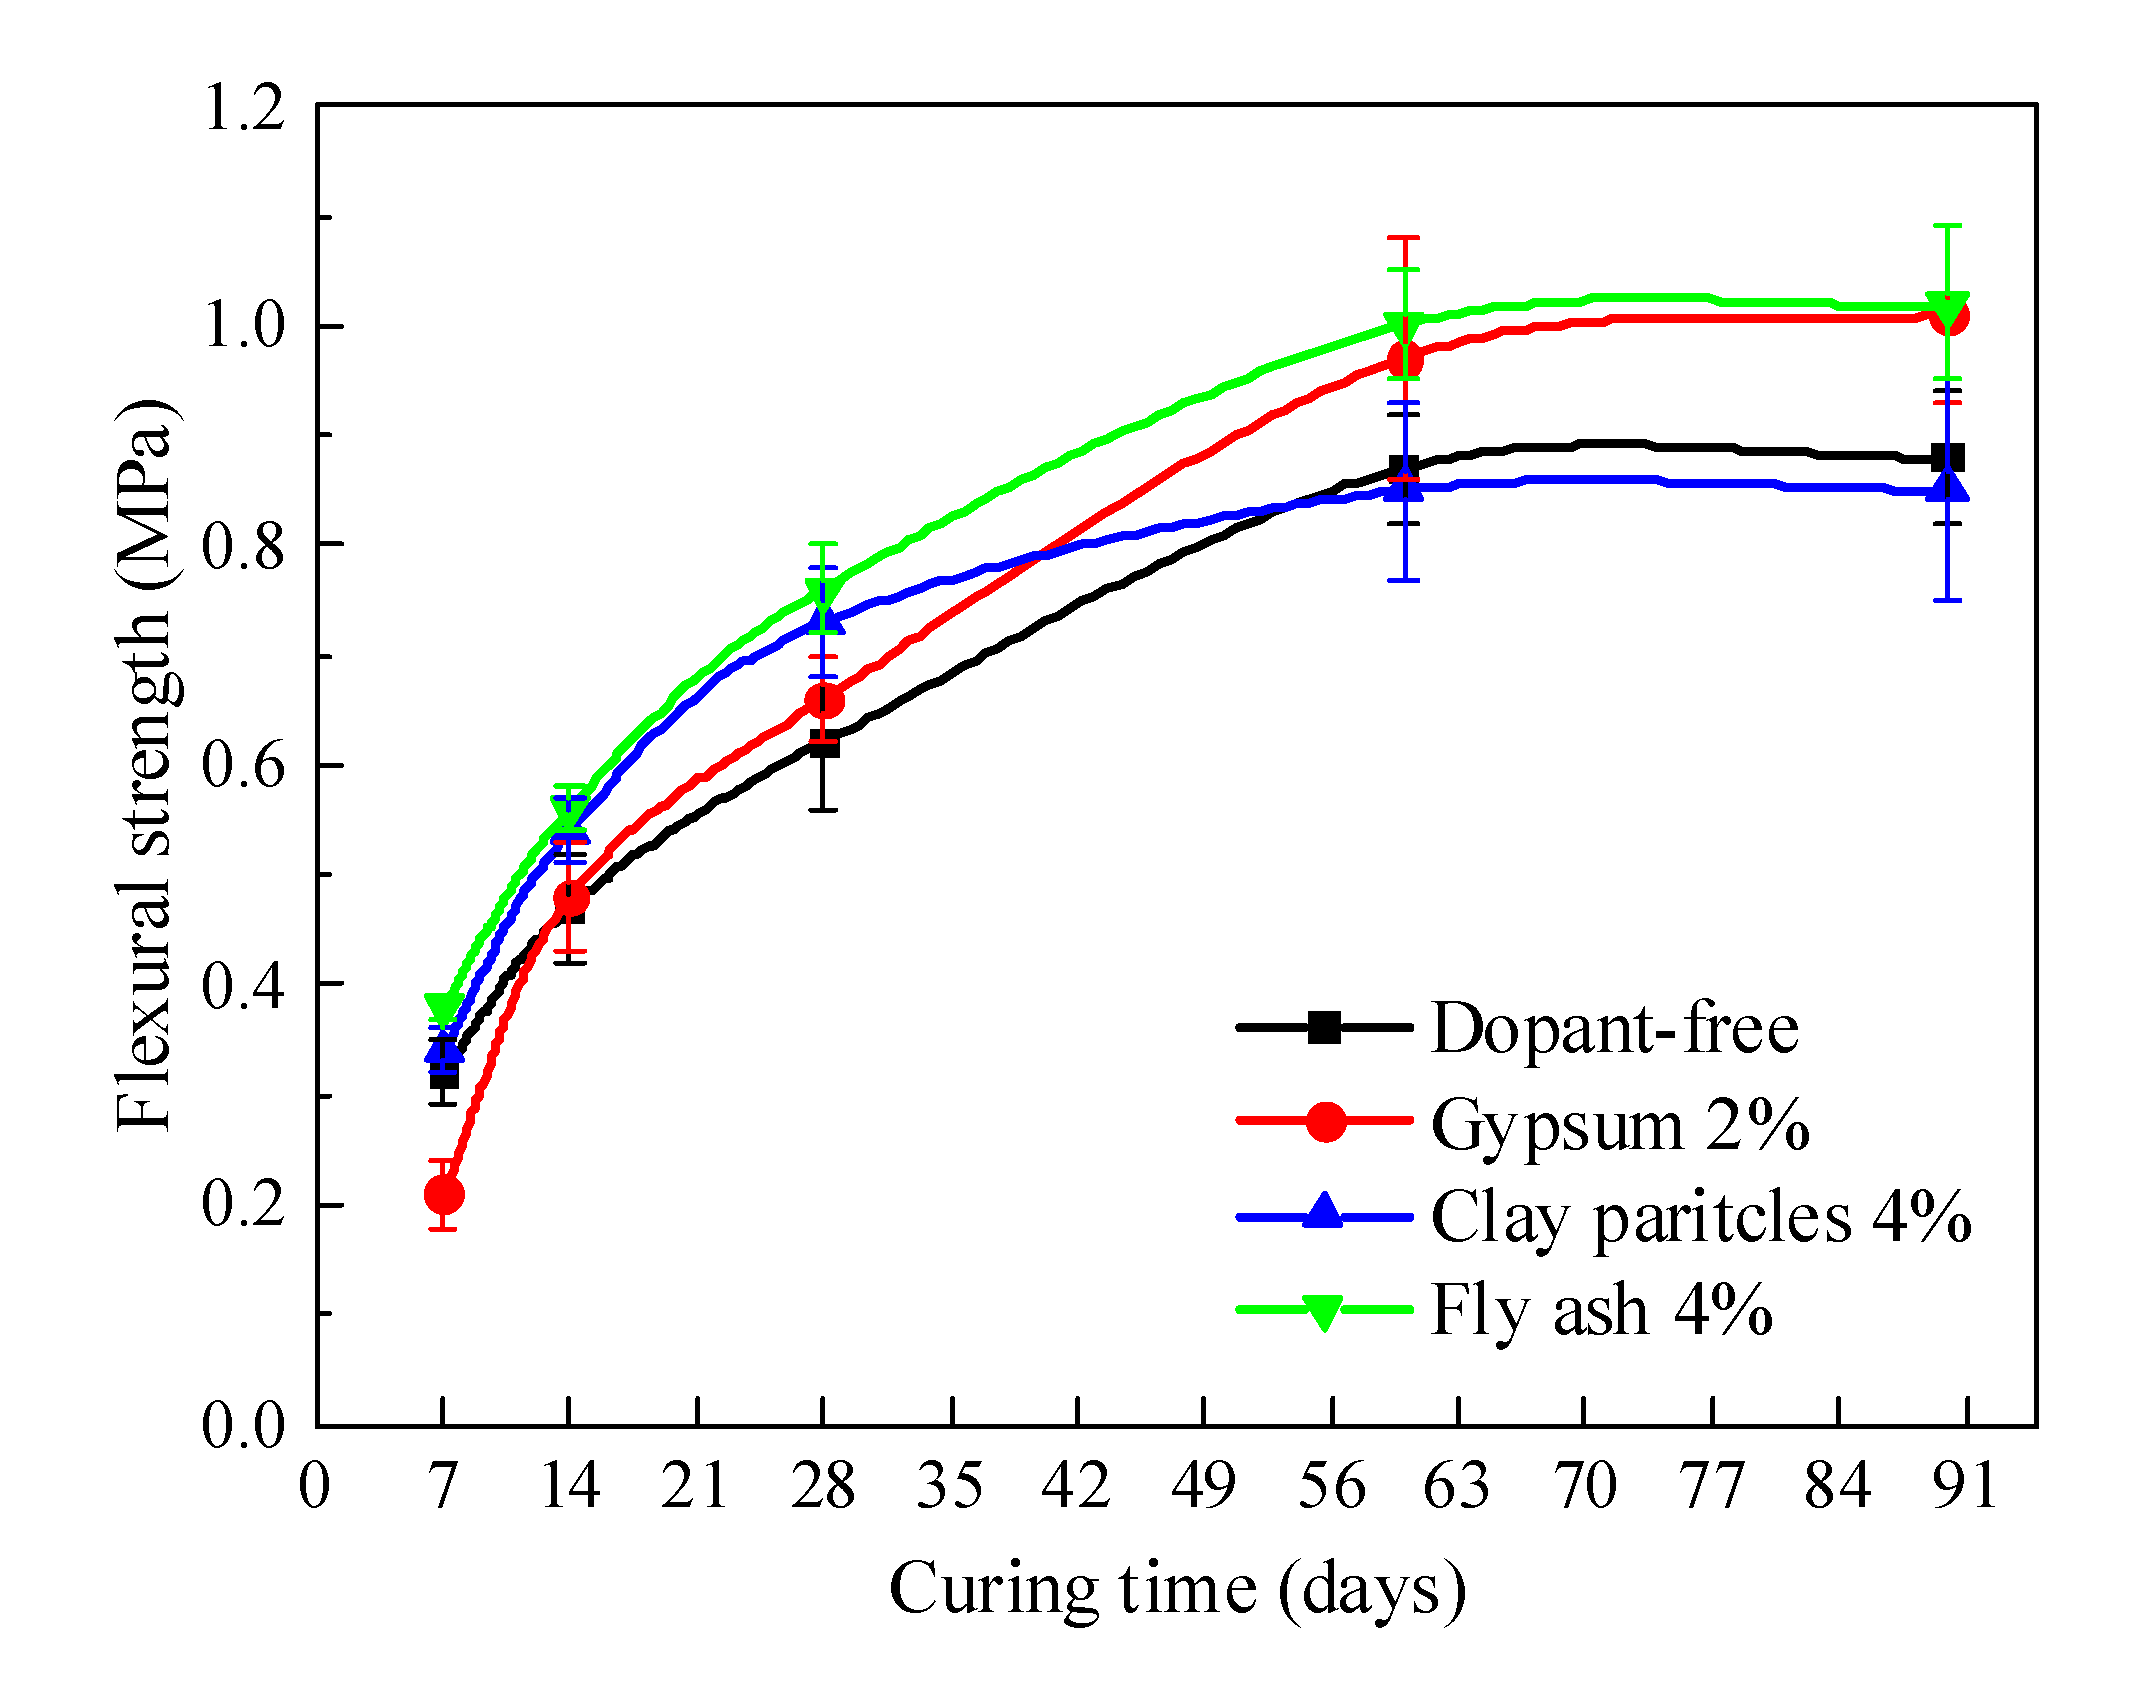
The flexural strength increased with age and was mostly stable at 60 days, as shown in Figure 8 and Table 6. The flexural strength of 2% gypsum and 4% fly ash was higher than that of the solidified soil without the additive at all ages, and the flexural strength of 4% clay particles was higher in the early stage than that of the solidified soil without additive, and the increase speed was slower in the later stage. On the contrary, the compressive strength of solidified soil without additive was high at 60 and 90 days. The increase in the flexural strength for SS2 and SF4 were 14.77 and 15.91% compared to S11.
3.4. Compression Rebound Modulus
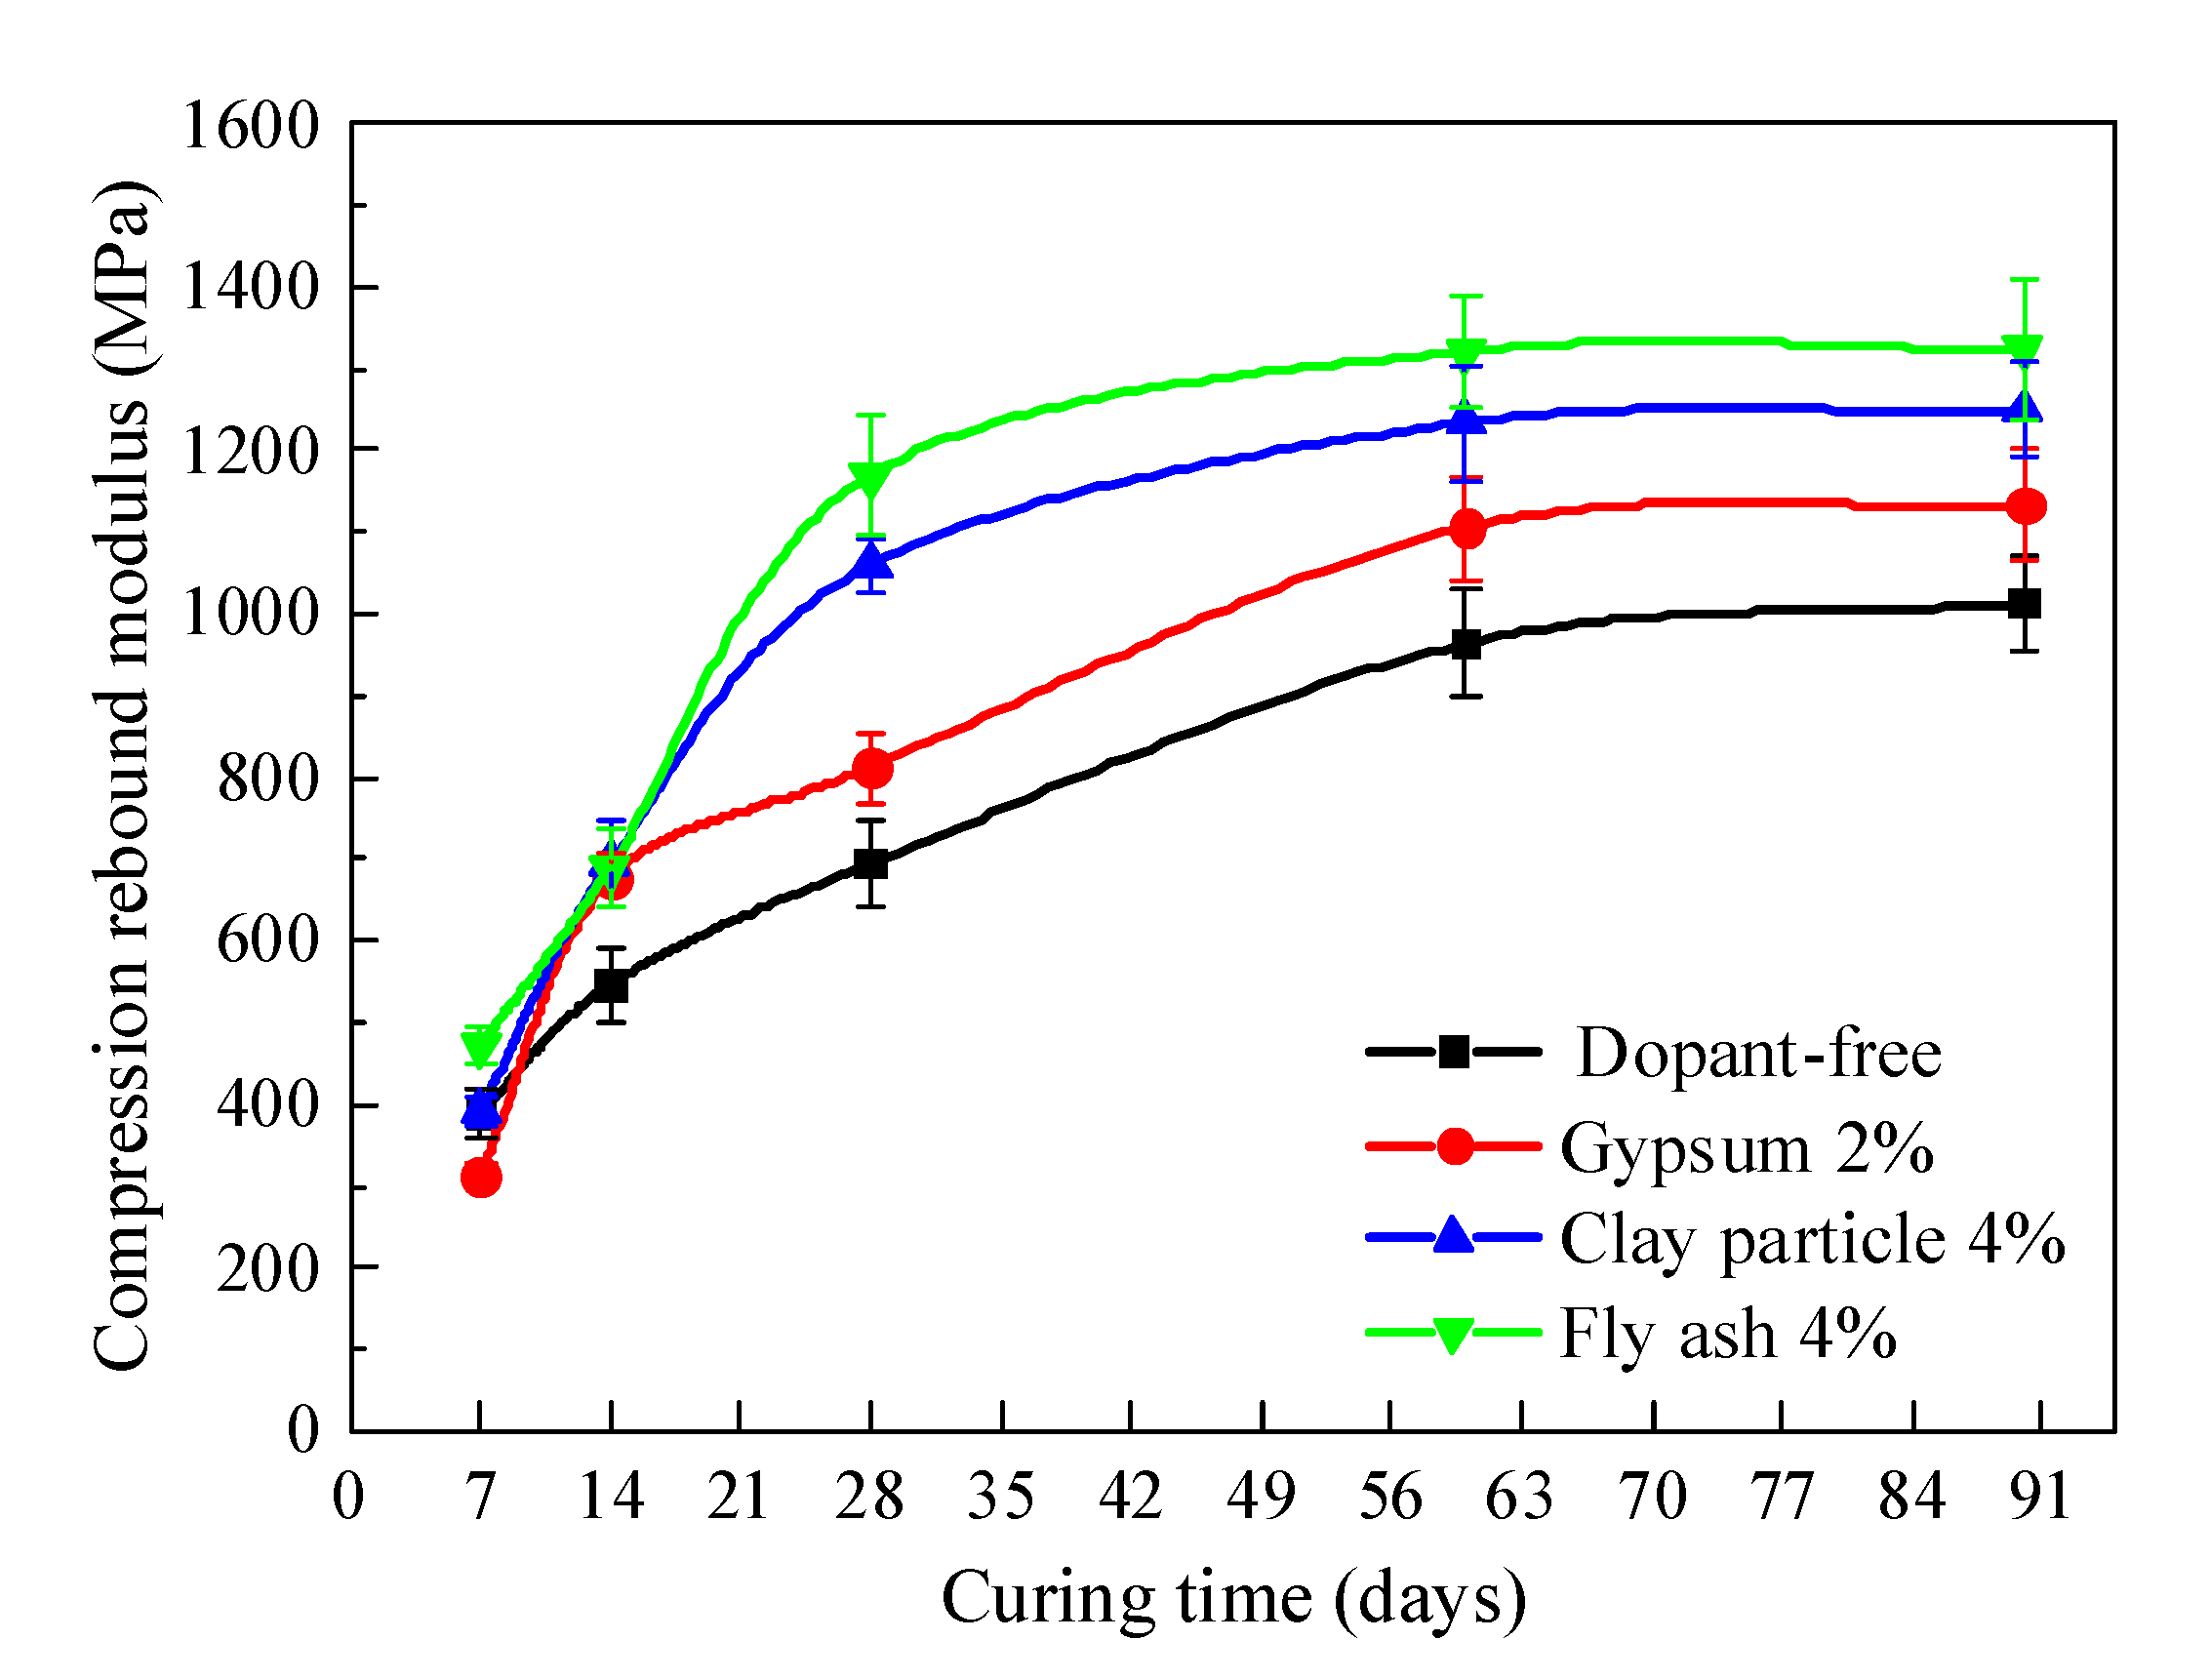
In order to highlight the effect of an additive on the energy that solidified sandy silt can yield under an external load, the compression rebound modulus was made to determine this information was developed and is shown in Figure 9 and Table 7. The compressive resilience modulus increased with age and then had a constant rate of change at the age of 60 days. The findings state that the three types of additives show a positive effect on increasing the compression and rebound modulus. For example, the compressive elastic modulus increases in specimens with 2% gypsum, 4% clay particle, and 4% fly ash were 11.97%, 23.3%, and 30.46%, respectively, at the age of 90 days. Table 7 also illustrates the detailed results of the test.
3.5. FESEM Micrographs Analysis
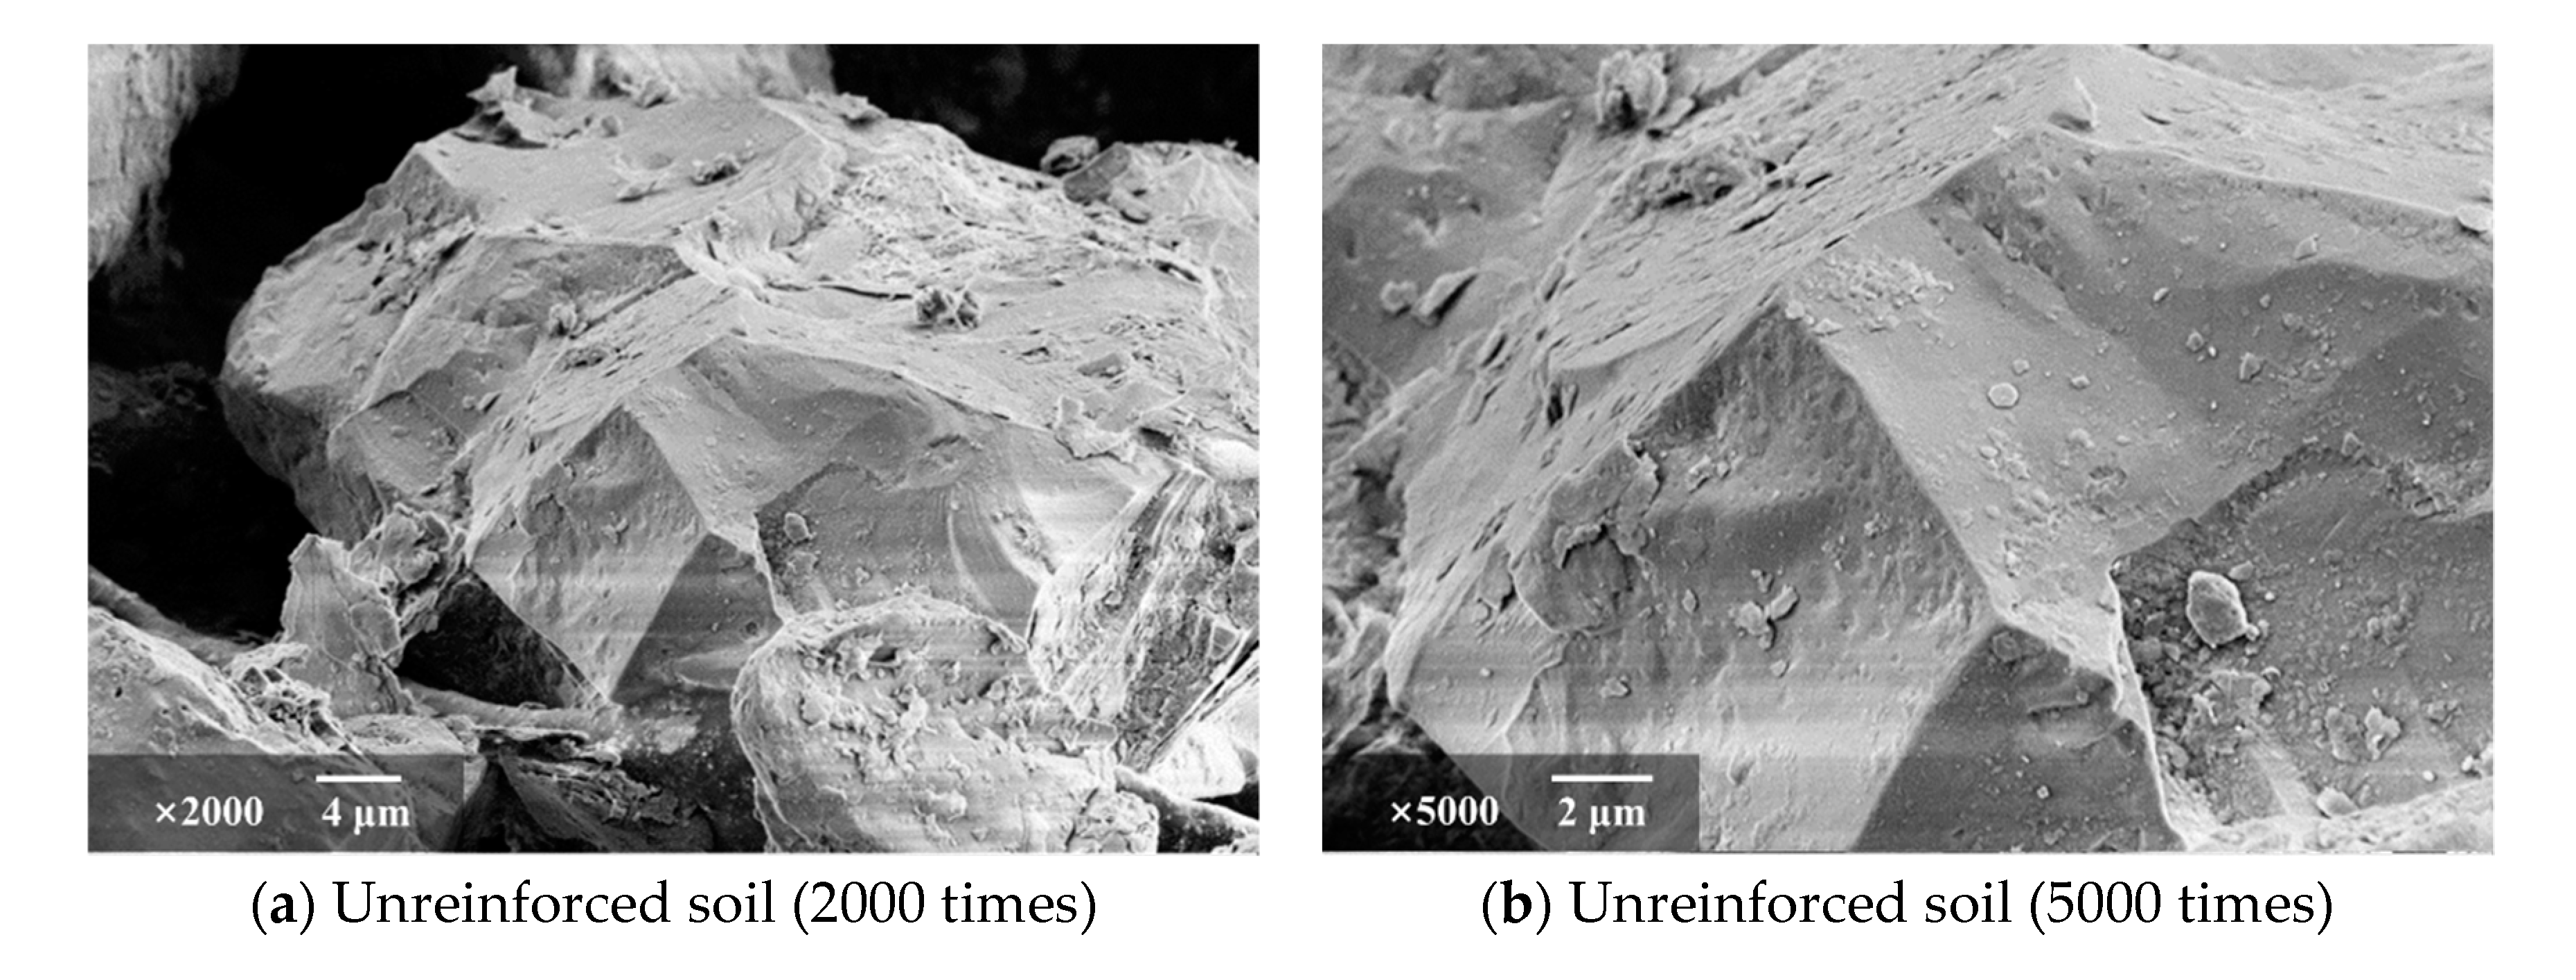
Figure 10 shows the FESEM images of unconsolidated unreinforced sandy silt particles. The surface is smooth with no cementitious substances and only a small number of fine particles. Therefore, the sand silt particles cannot be well connected. When reflected in the macroscopic view, it has low friction, poor stability, low strength, and stiffness.
Figure 11 illustrates the FESEM micrographs of specimens with and without additives after being cured for 28 days. A large number of needle-like (AFt) and Ca(OH)2/CaCO3 particles can be observed on the surface of OPC-stabilized sandy silt as well as the strong bonds between the gelatinous C-S-H gel and matrix, as shown in Figure 11a. An alkaline solution in the pore space leached the soluble aluminosilicate composition available from fly ash (pozzolanic reaction), resulting in it coexistence with N-A-S-H and C-S-H gels [29,30,31]. When gypsum was added (see Figure 11c), the acicular AFt was bigger and denser than the unadulterated AFt, which could better fill the void in the later period. However, it can be seen that the clay particle-stabilized soil had a smaller particle size, which improved the gradation composition and contributed to the connection and fusion between the particles. Additionally, the figure shows that the amount of crystalline compound in SF4 is less than in the control group.
3.6. XRD Result Analysis
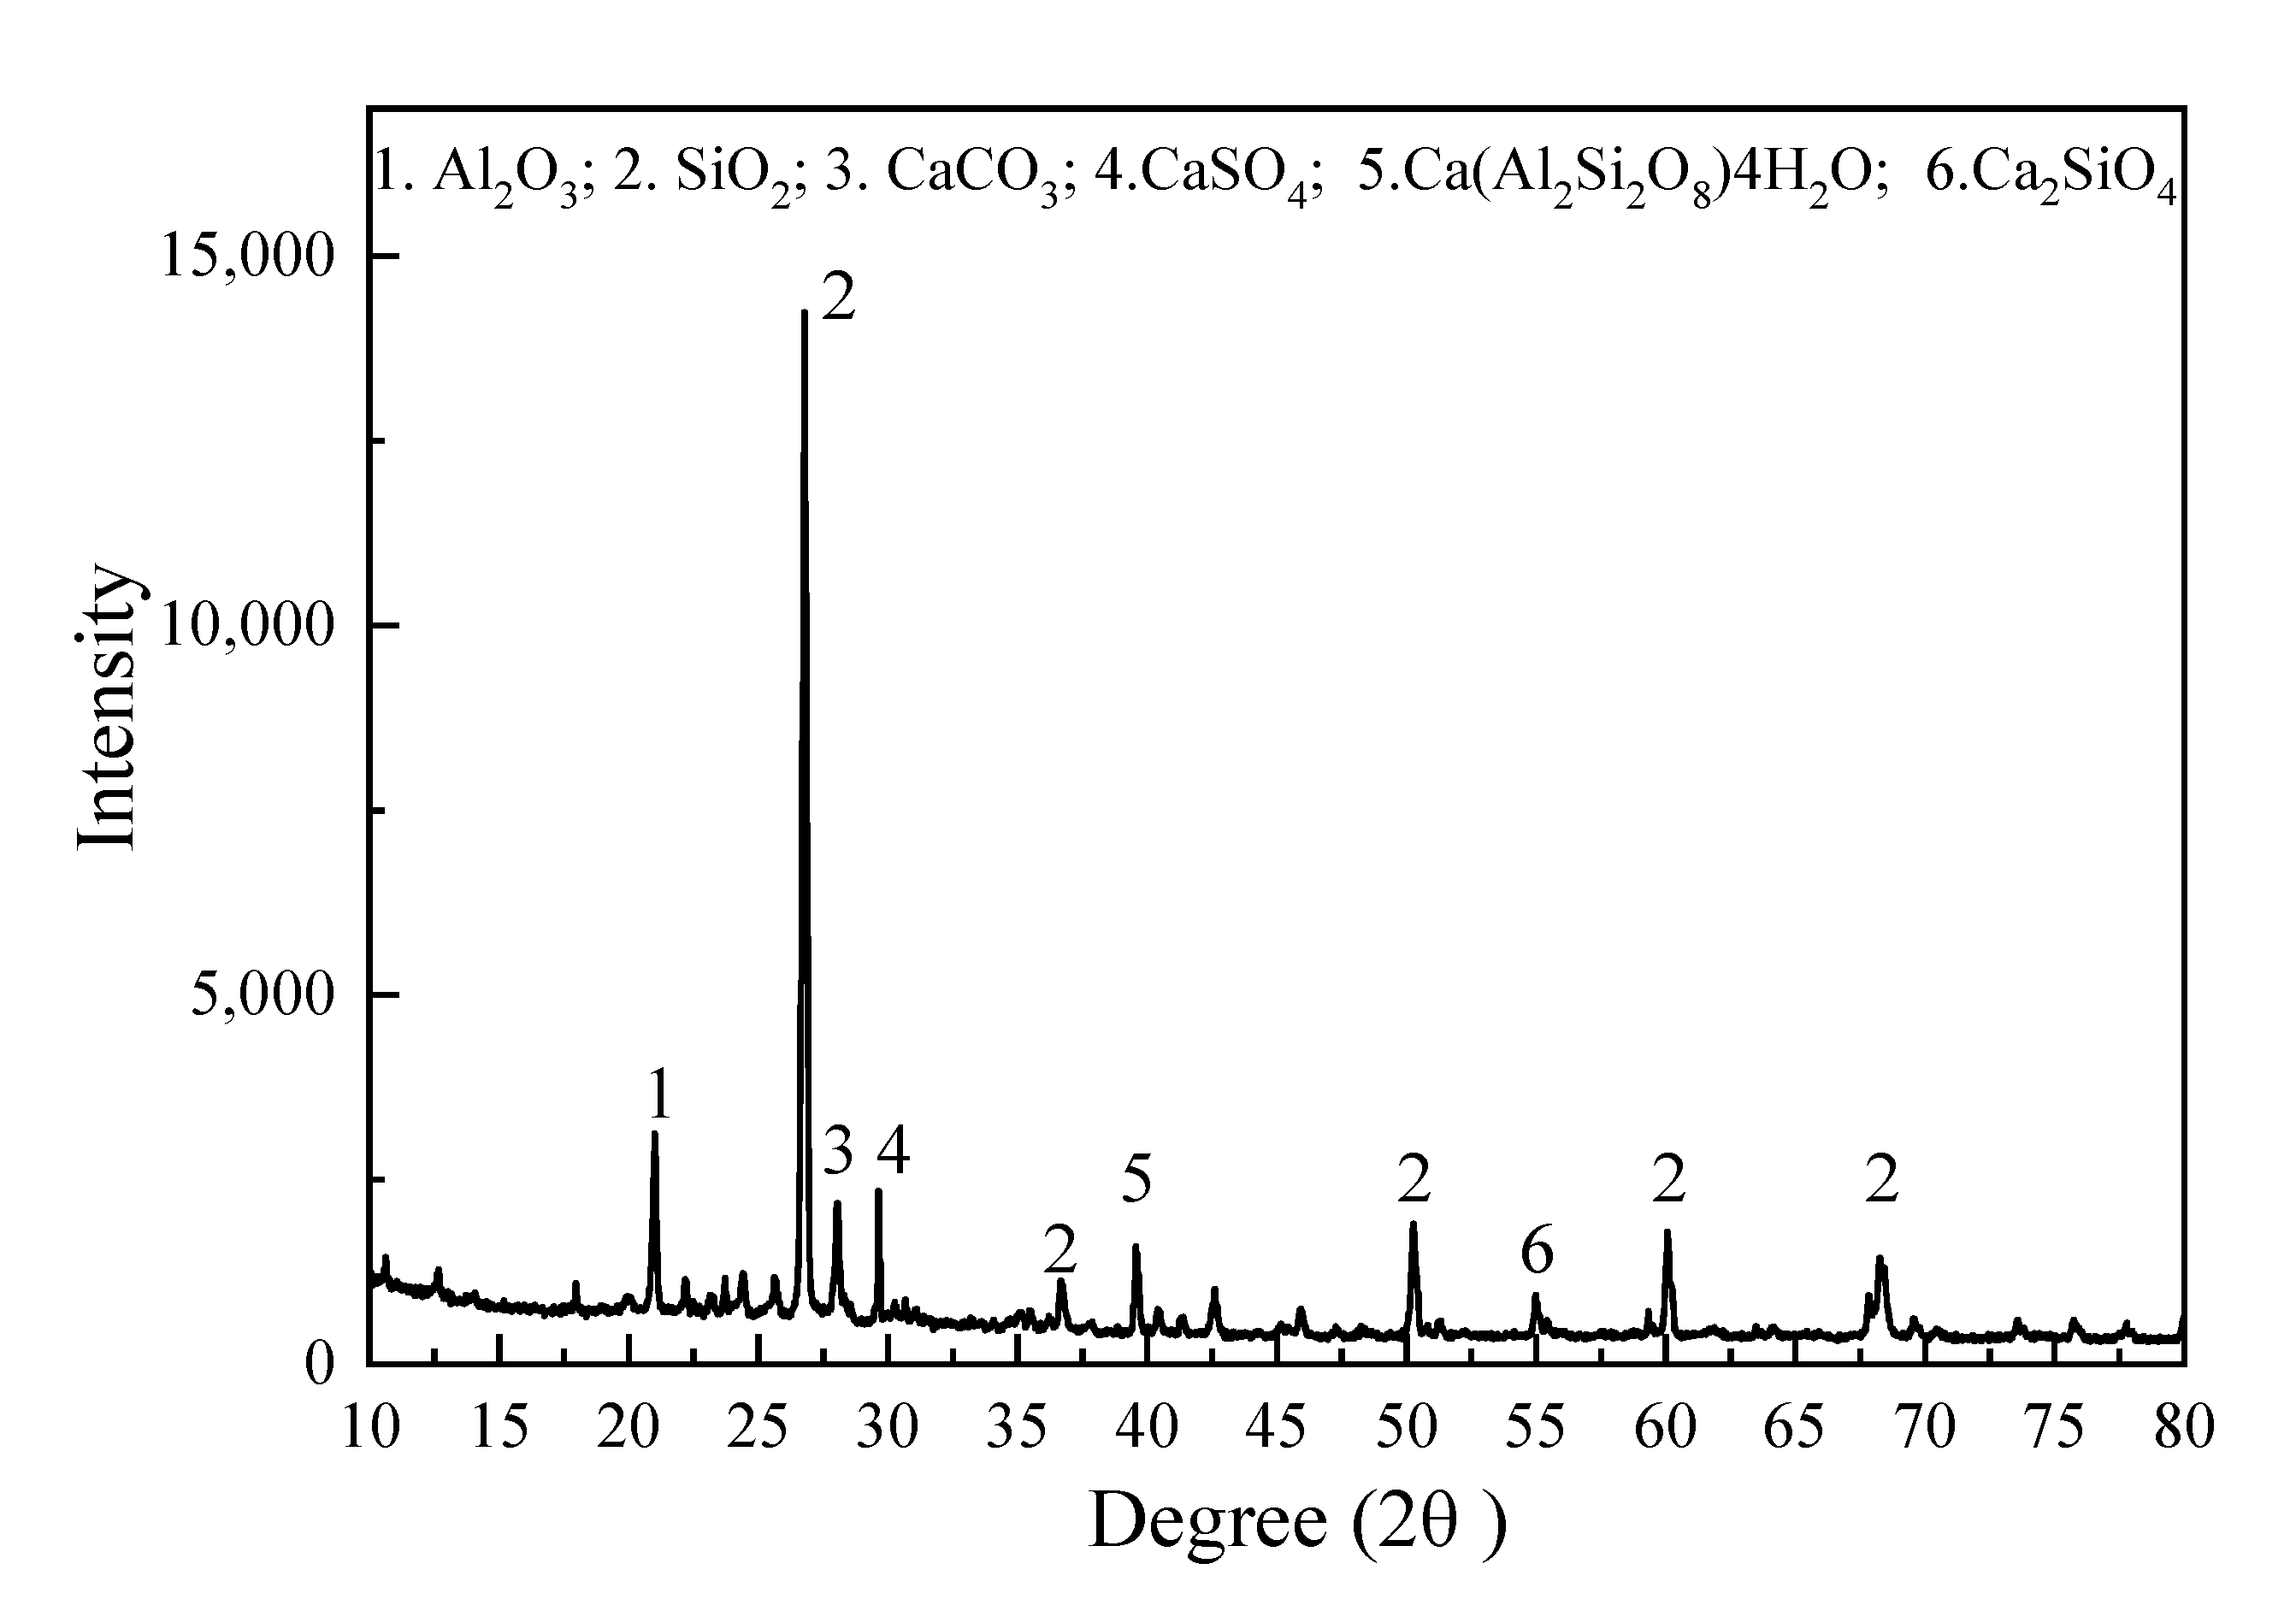
Figure 12 illustrates the X-ray diffraction pattern of sandy silty soil particles. Since an X-ray diffractometer can only scan crystal, the native soil particles contain at least Al2O3, SiO2, CaCO3, CaSO4, Ca(Al2Si2O8)4H2O and Ca2SiO4, among which SiO2 is the major component.
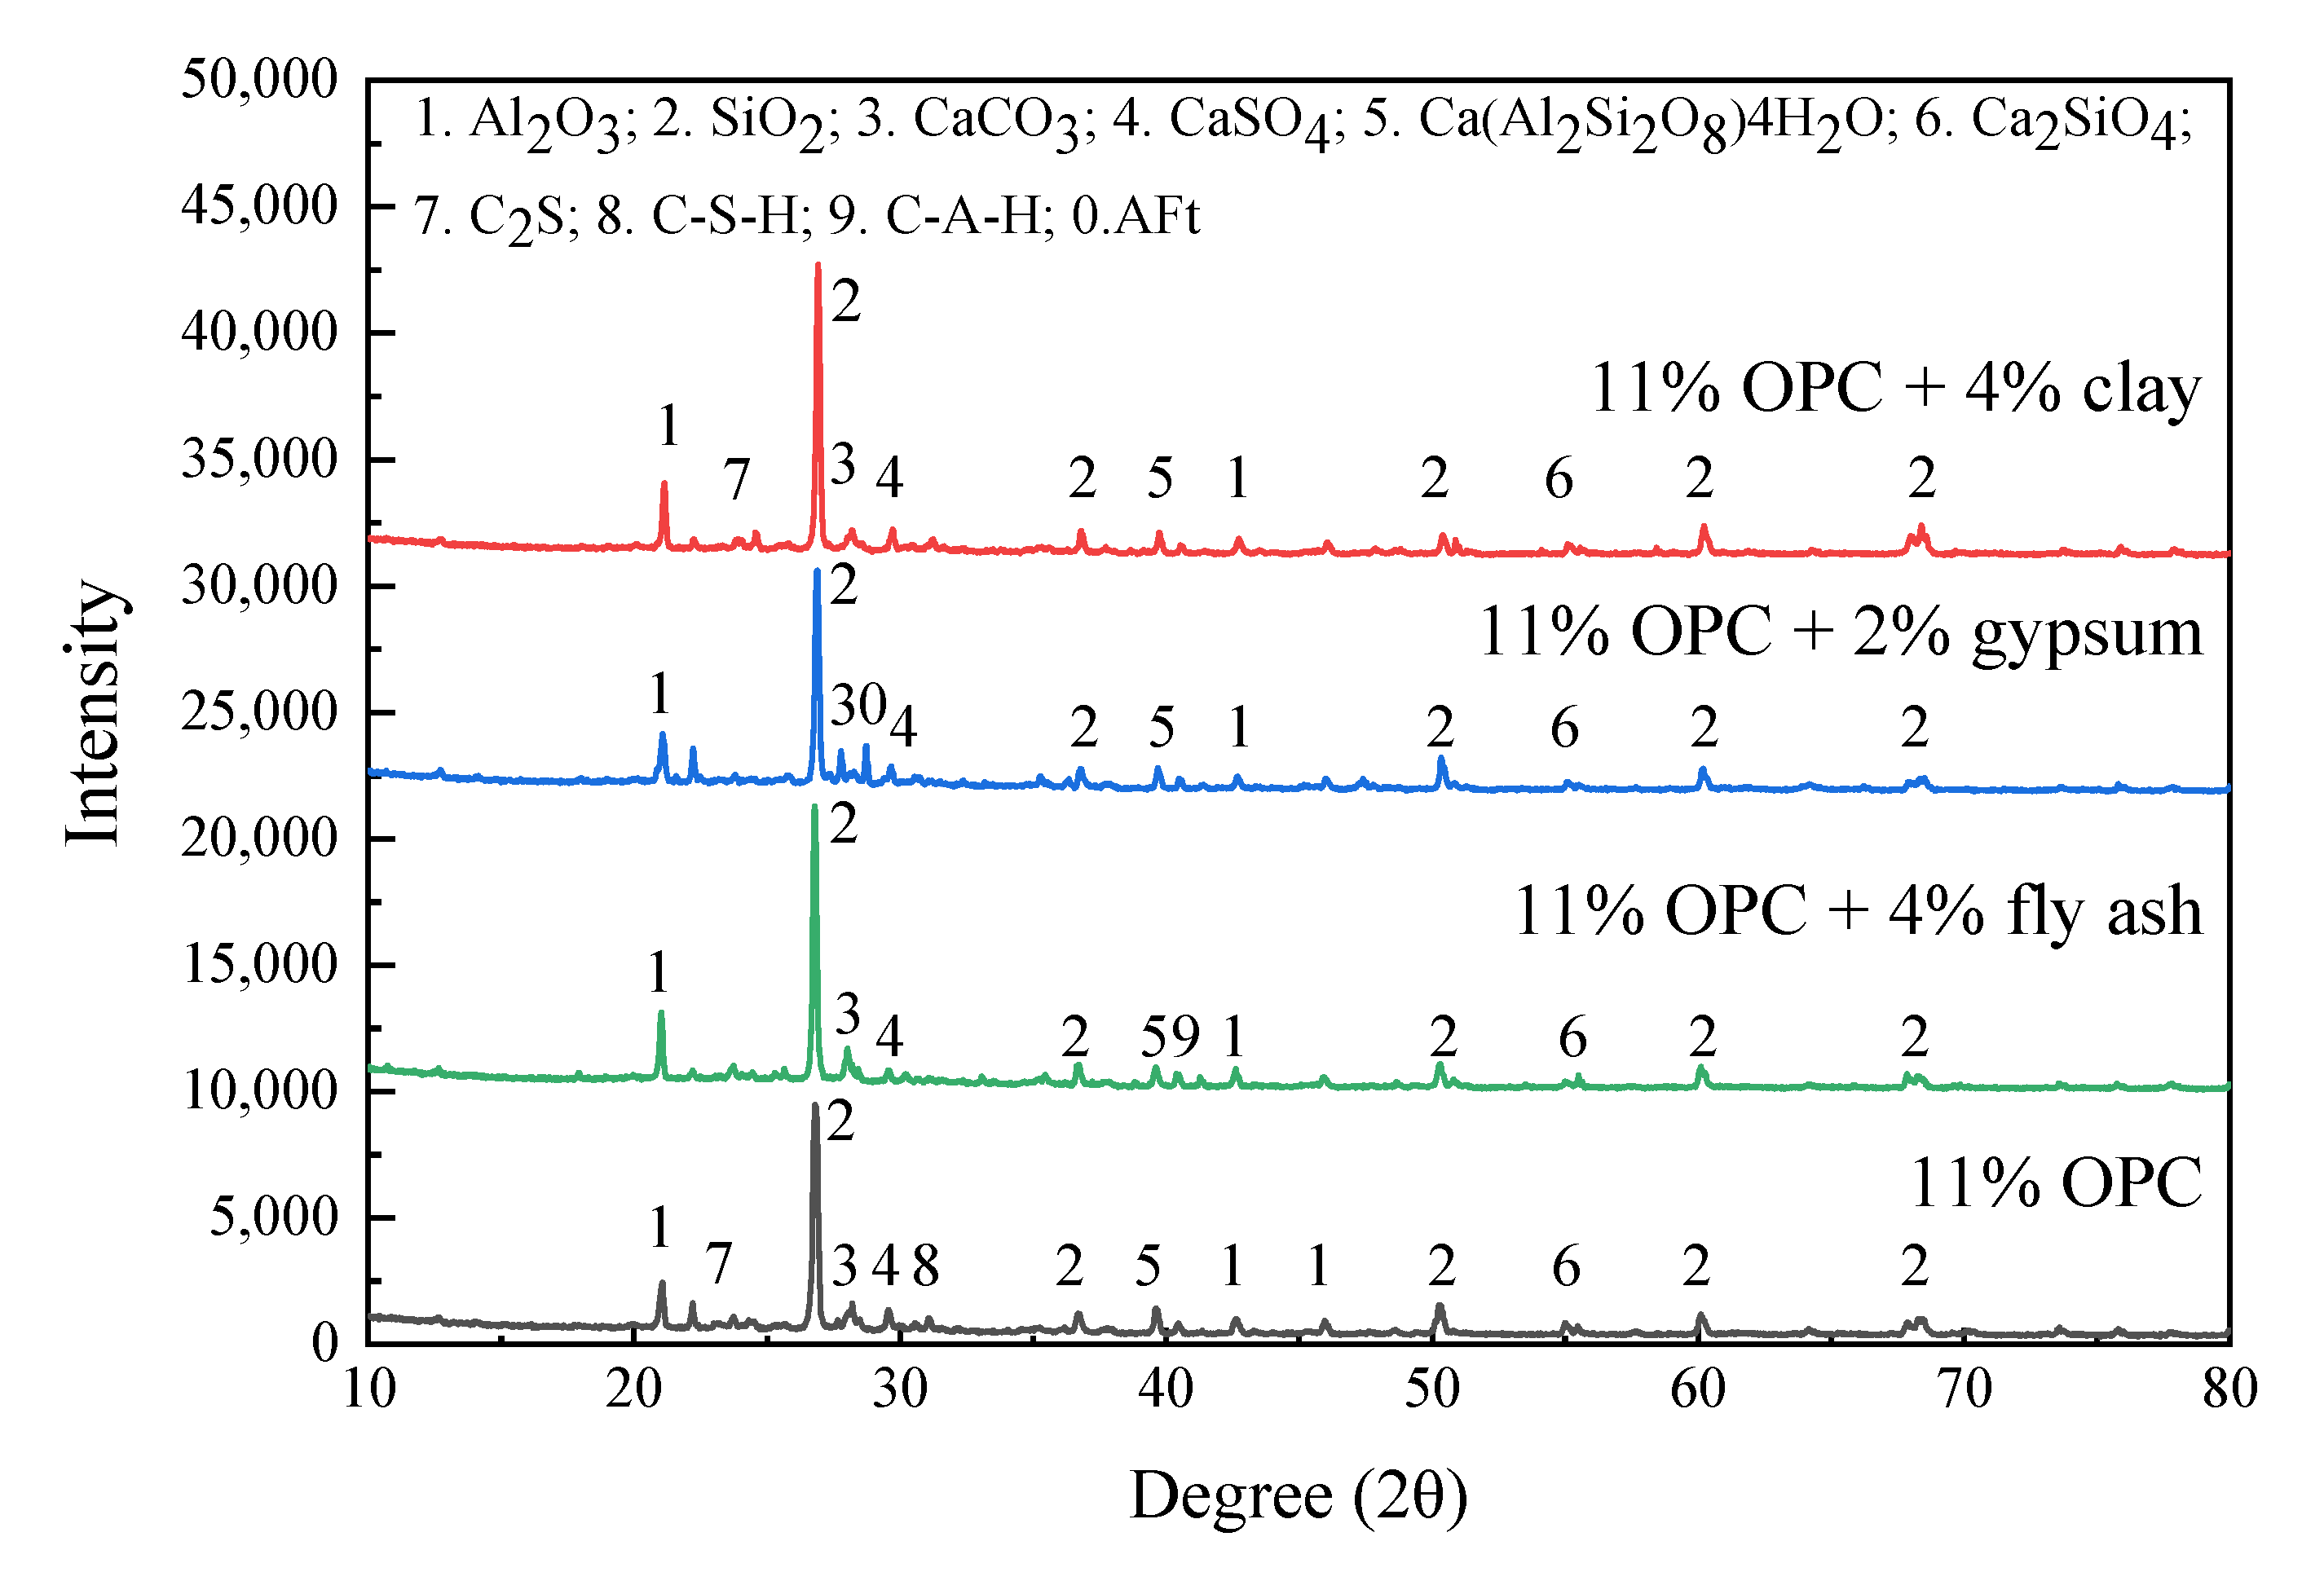
Figure 13 illustrates comparison diagrams from the XRD of the solidified soil with and without additives at 28 days. As show in Figure 13a, with the growth of the phase, the peak intensity of C2S gradually decreased and disappeared, while the C-S-H peak began to appear. This was due to the hydration of OPC, and the hydration of C-S-H was generated by the reaction of C2S. Because the active substance in fly ash had a secondary hydration reaction (pozzolanic reaction), it can be seen that when fly ash was added, the C-S-H peak was more prominent; when gypsum was added, AFt was generated by the hydration reaction between gypsum and tricalcium aluminate, resulting in the appearance of AFt peak in the X-ray diffraction figure. After adding clay particles, it can be seen that the peaks were basically the same as when the clay particles were not added, indicating that the principal function of the clay particles was not to participate in chemical reactions but to improve the physical gradation composition to improve the strength of solidified soil.
4. Conclusions
In this study, four types of additives (gypsum, lime, clay particles, and fly ash) were incorporated into OPC solidified sandy silt. With the aid of mechanical property tests (unconfined compression, indirect tensile, flexural strength, and compressive resilient modulus) at 7, 14, 28, 60, and 90 days as well as FESEM and XRD analyses, the following conclusions can be drawn.
The solidified mechanism of fly ash in sandy silt is mainly a secondary hydration reaction (pozzolanic reaction), causing an increasing number of C-S-H gel in the system. The increase in the unconfined compression, indirect tensile, flexural strength, and compression rebound modulus of the specimens with 4% fly ash were 15.1%, 26.1%, 15.9%, and 30.5%, respectively, at the age of 90 days. When gypsum was added, AFt was generated by a hydration reaction between gypsum and tricalcium aluminate. The addition of clay particles can improve the grain gradation of solidified soil and can form smaller particles, which can help enhance the strength of the soil through physical cementation. However, its intensity and development speed can appear as a specific drop in the later curing period. The decrease in the unconfined compression, indirect tensile, flexural strength, and compression rebound modulus of specimens with 4% clay particles were 4.1%, 6.5% 3.4%, and 23.3%, respectively, the age of 90 days. In general, the strength development of the stabilized sandy silt with lime was much lower than that of the control specimens, indicating that lime is not an ideal reinforcement for solidified sandy silt.
Author Contributions
Conceptualization, D.W.; methodology, K.C.; software, Z.Z.; validation, K.C. and L.C.; formal analysis, K.C.; investigation, K.C.; resources, K.C.; data curation, K.C.; writing—original draft preparation, K.C.; writing—review and editing, K.C.; visualization, D.W. and K.C.; supervision, D.W.; project administration, Z.Z.; funding acquisition, D.W. All authors have read and agreed to the published version of the manuscript.
Funding
This research was funded by the National Natural Science Foundation of China, grant number 51678533; Zhejiang Province Basic Public Welfare Research Project, grant number LGG21E080012.
Institutional Review Board Statement
Not applicable.
Informed Consent Statement
Not applicable.
Data Availability Statement
Details on all data supporting the reported results can be obtained in Table 1, Table 2, Table 3, Table 4, Table 5, Table 6 and Table 7 and Figure 1, Figure 2, Figure 3, Figure 4, Figure 5, Figure 6, Figure 7, Figure 8, Figure 9, Figure 10, Figure 11, Figure 12 and Figure 13, this original manuscript.
Acknowledgments
The author would like to express very great appreciation to Chenyang Tu from Zhejiang Sci-Tech university, who provided expertise that assisted this study.
Conflicts of Interest
The authors declare no conflict of interest.
References
- Tang, Y. Shenzhen 12.20 landslide disaster causes and security measure analysis. Land Res. Inf. 2016, 1, 39–43. [Google Scholar]
- Rojat, F.; Hamard, E.; Fabbri, A.; Carnus, B.; McGregor, F. Towards an easy decision tool to assess soil suitability for earth building. Constr. Build. Mater. 2020, 257, 119544. [Google Scholar] [CrossRef]
- Zheng, G.; Gong, X.N.; Xie, Y.L.; Li, G.X. Review on development of foundation process technology. J. Civ. Eng. 2012, 45, 127–146. [Google Scholar]
- Yuan, J.; Liu, X.W.; Chen, W.L. Effect of construction of deep excavation in Hangzhou silty sand on adjacent metro tunnels and stations. Chin. J. Geotech. Eng. 2012, 34, 398–403. [Google Scholar]
- Liu, C.; Ma, Y.F. Comparative test on vibroflotation without backfill and dynamic compaction for soft foundation treatment. Port Waterw. Eng. 2016, 11, 167–173. [Google Scholar]
- Qu, J.L.; Zhu, H. Modifying mechanical properties of Shanghai clayey soil with construction waste and pulverized lime. Sci. Eng. Compos. Mater. 2020, 27, 163–176. [Google Scholar]
- Jiang, Y.Z. Water immersion-induced strength performance of solidified soils with reactive MgO-a green and low carbon binder. J. Test. Eval. 2019, 47, 1569–1585. [Google Scholar]
- Qu, B.; Martin, A.; Pastor, J.Y.; Palomo, A.; Fernández-Jiménez, A. Microstructural characterisation of hybrid cement after exposure to high temperatures. Constr. Build. Mater. 2020, 262, 120843. [Google Scholar] [CrossRef]
- Qu, B.; Martin, A.; Pastor, J.Y.; Palomo, A.; Fernández-Jiménez, A. Characterisation of pre-industrial hybrid cement and effect of pre-curing temperature. Cem. Concr. Compos. 2016, 73, 281–288. [Google Scholar] [CrossRef]
- Sivapullaiah, P.V.; Lakshmikantha, H. Chemical compatibility of lime stabilized Indian red earth as liner material. Soil Sediment Contam. 2005, 14, 515–526. [Google Scholar] [CrossRef]
- Oza, J.B.; Gundaliya, P.J. Study of black cotton soil characteristics with cement waste dust and lime. In Proceedings of the 3rd Nirma-University International Conference on Engineering (NUICONE), Ahmedabad, India, 6–8 December 2012. [Google Scholar]
- Yilmaz, Y.; Ozaydin, V. Compaction and shear strength characteristics of colemanite ore waste modified active belite cement stabilized high plasticity soils. Eng. Geol. 2013, 155, 45–53. [Google Scholar] [CrossRef]
- Lee, F.H.; Lee, Y.; Chew, S.H.; Yong, K.Y. Strength and modulus of marine clay-cement mixes. J. Geotech. Geoenviron. Eng. 2005, 131, 178–186. [Google Scholar] [CrossRef]
- Narendra, B.S.; Sivapullaiah, P.V.; Suresh, S.; Omkar, S.N. Prediction of unconfined compressive strength of soft grounds using computational intelligence techniques: A comparative study. Comput. Geotech. 2006, 33, 196–208. [Google Scholar] [CrossRef]
- Ribeiro, D.; Neri, R.; Cardoso, R. Influence of water content in the UCS of soil-cement mixtures for different cement dosages. Procedia Eng. 2016, 143, 59–66. [Google Scholar] [CrossRef] [Green Version]
- Consoli, N.C.; Ferreira, P.M.V.; Tang, C.S.; Marques, S.F.V.; Festugato, L.; Corte, M.B. A unique relationship determining strength of silty/clayey soils—Portland cement mixes. Soils Found. 2016, 56, 1082–1088. [Google Scholar] [CrossRef]
- Gao, G.Y.; Yao, S.F.; Cui, Y.J.; Chen, Q.S.; Zhang, X.L.; Wang, K.W. Zoning of confined aquifers inrush and quicksand in Shanghai region. Nat. Hazards 2018, 91, 1341–1363. [Google Scholar] [CrossRef]
- Chatra, A.S.; Dodagoudar, G.R.; Maji, V.B. Numerical modelling of rainfall effects on the stability of soil slopes. Int. J. Geotech. Eng. 2019, 13, 425–437. [Google Scholar] [CrossRef]
- Shu, A.; Zhou, X.; Duan, G. Estimation for the riverbank collapse volume with sandy-riverbank in the desert reach of the upper Yellow River. In Proceedings of the 13th International Symposium on River Sedimentation (ISRS), Stuttgart, Germany, 19 September 2016. [Google Scholar]
- Ueng, T.S.; Wang, Z.F.; Chu, M.C.; Ge, L. Laboratory tests for permeability of sand during liquefaction. Soil Dyn. Earthq. Eng. 2017, 100, 249–256. [Google Scholar] [CrossRef]
- Moruzzi, R.B.; Bridgeman, J.; Silva, P.A.G. A combined experimental and numerical approach to the assessment of floc settling velocity using fractal geometry. Waste Sci. Technol. 2020, 81, 915–924. [Google Scholar]
- Sutherland, B.R.; Barrett, K.J.; Gingras, M.K. Clay settling in fresh and salt water. Environ. Fluid Mech. 2015, 15, 147–160. [Google Scholar] [CrossRef]
- Tang, Y.Q.; Li, J.Z. Test method and application for microstructures of undisturbed silty sand and sandy silt. Environ. Earth Sci. 2018, 77, 602–610. [Google Scholar] [CrossRef]
- GB/T 50123-2019 Standard for Geotechnical Testing Method; Ministry of Housing and Urban-Rural Development: Beijing, China, 2019.
- Wang, Y.Q.; Tan, Y.Q.; Guo, M.; Liu, Z.Y.; Wang, X.L. Study on the dynamic compressive resilient modulus and frost resistance of semi-rigid base materials. Road Mater. Pavement 2017, 18, 259–269. [Google Scholar] [CrossRef]
- Li, S.; Wang, C.M.; Wu, Q.; Zhang, Z.M.; Zhang, Z.N. Variations of bound water and microstructure in consolidation-creep process of Shanghai mucky clay. Rock Soil Mech. 2017, 38, 2806–2816. [Google Scholar]
- Saeed, K.A.; Kassim, K.A.; Nur, H.; Yunus, N.Z.M. Strength of lime-cement stabilized tropical lateritic clay contaminated by heavy metals. KSCE J. Civ. Eng. 2015, 19, 887–892. [Google Scholar] [CrossRef] [Green Version]
- Donatello, S.; Maltseva, O.; Fernandez-Jimenez, A.; Palomo, A. The early age hydration reactions of a hybrid cement containing a very high content of coal bottom ash. J. Am. Ceram. Soc. 2014, 97, 929–937. [Google Scholar] [CrossRef] [Green Version]
- Fernández-Jiménez, A.; Pastor, J.Y.; Martin, A.; Palomo, A. High-temperature resistance in alkali-activated cement. J. Am. Ceram. Soc. 2010, 93, 3411–3417. [Google Scholar] [CrossRef]
- Fernández-Jiménez, A.; Palomo, A.; Pastor, J.Y.; Martin, A. New cementitious materials based on alkali-activated fly ash: Performance at high temperatures. J. Am. Ceram. Soc. 2010, 91, 3308–3314. [Google Scholar] [CrossRef] [Green Version]
- Chen, K.Y.; Wu, D.Z.; Yi, M.; Cai, Q.M.; Zhang, Z.Y. Mechanical and durability properties of metakaolin blended with slag geopolymer mortars used for pavement repair. Constr. Build. Mater. 2021, 281, 122566. [Google Scholar] [CrossRef]
Figure 1.
Particle size analysis of sandy silt.

Figure 2.
Test set-up and failure details of the specimens: (a) unconfined compression strength, (b) tensile strength, (c) flexural strength, and (d) compressive resilient modulus tests.
Figure 2.
Test set-up and failure details of the specimens: (a) unconfined compression strength, (b) tensile strength, (c) flexural strength, and (d) compressive resilient modulus tests.

Figure 3.
Microstructure test instruments: (a) FESEM and (b) XRD.

Figure 4.
Curve of unconfined compressive strength with different replacement ratios of the additives.
Figure 4.
Curve of unconfined compressive strength with different replacement ratios of the additives.

Figure 5.
Curve of unconfined compressive strength with optimal content of the additives.

Figure 6.
Curve of indirect tensile strength with different replacement ratios of the additives.

Figure 7.
Curve of indirect tensile strength with optimal content of the additives.

Figure 8.
Flexural strength with different replacement ratios of the additives.

Figure 9.
Compression rebound modulus with different replacement ratios of the additives.

Figure 10.
FESEM micrographs of undisturbed soil.

Figure 11.
FESEM micrographs of specimens with and without additives after curing for 28 days (5000 times).
Figure 11.
FESEM micrographs of specimens with and without additives after curing for 28 days (5000 times).

Figure 12.
X-ray diffraction pattern of unreinforced sandy silt.

Figure 13.
XRD pattern contrast of solidified sandy silty soil at the age of 28 days.


Table 1.
Physical properties of the OPC.
| Initial Setting Time/(min) | Final Setting Time/(min) | Compressive Strength/(MPa) | Flexural Strength/(MPa) | ||
|---|---|---|---|---|---|
| 3d | 28d | 3d | 28d | ||
| 150 ± 3 | 210 + 5 | 27.5 ± 1.4 | 49.6 ± 2.0 | 5.5 ± 0.6 | 9.0 ± 1.0 |
Table 2.
Chemical compositions (wt.%) of raw materials used.
| Material | SiO2 | Fe2O3 | Al2O3 | CaO | MgO | SO2 | SO3 | Others | LOI a |
|---|---|---|---|---|---|---|---|---|---|
| OPC | 21.14 | 2.70 | 4.70 | 63.66 | 2.61 | — | 2.53 | 1.21 | 1.45 |
| Gypsum | 2.68 | 0.37 | 0.54 | 36.12 | 1.03 | 42.7 | — | 14.51 | 2.05 |
| Lime | 1.74 | — | 0.56 | 93.64 | 1.37 | — | 1.14 | 0.90 | 0.65 |
| Fly ash | 58.05 | 4.32 | 30.10 | 1.53 | 2.81 | — | 0.43 | 1.82 | 0.94 |
a Loss on ignition.
Table 3.
Mixture proportions varying additives.
| Additives | Content/% | Specimen Mark |
|---|---|---|
| None | 0 | S11 |
| Gypsum | 2, 3, 4 | SS2, SS3, SS4 |
| Clay particle | 2, 3, 4 | SN2, SN3, SN4 |
| Lime | 2, 3, 4 | SH2, SH3, SH4 |
| Fly ash | 2, 3, 4 | SF2, SF3, SF4 |
Table 4.
Test results for unconfined compression strength (MPa).
| Additives | Content/% | Mixture | Curing Days | ||||
|---|---|---|---|---|---|---|---|
| 7 | 14 | 28 | 60 | 90 | |||
| None | 0 | S11 | 1.46 ± 0.13 | 2.03 ± 0.19 | 2.43 ± 0.18 | 3.39 ± 0.22 | 3.44 ± 0.23 |
| Gypsum | 2 | SS2 | 1.43 ± 0.21 | 2.26 ± 0.18 | 2.89 ± 0.24 | 3.45 ± 0.21 | 3.46 ± 0.25 |
| 3 | SS3 | 0.81 ± 0.09 | 1.42 ± 0.12 | 2.61 ± 0.18 | 3.41 ± 0.21 | 3.37 ± 0.23 | |
| 4 | SS4 | 0.78 ± 0.11 | 1.14 ± 0.14 | 2.29 ± 0.16 | 3.26 ± 0.20 | 3.28 ± 0.24 | |
| Clay particles | 2 | SN2 | 1.39 ± 0.18 | 2.07 ± 0.21 | 2.83 ± 0.22 | 3.09 ± 0.26 | 3.08 ± 0.25 |
| 3 | SN3 | 1.74 ± 0.16 | 2.26 ± 0.19 | 2.94 ± 0.20 | 3.19 ± 0.18 | 3.17 ± 0.19 | |
| 4 | SN4 | 1.79 ± 0.08 | 2.45 ± 0.11 | 3.03 ± 0.21 | 3.32 ± 0.23 | 3.30 ± 0.20 | |
| Lime | 2 | SH2 | 0.80 ± 0.12 | 1.11 ± 0.08 | 1.33 ± 0.11 | 1.50 ± 0.12 | 1.53 ± 0.14 |
| 3 | SH3 | 0.61 ± 0.13 | 0.75 ± 0.09 | 0.87 ± 0.11 | 1.07 ± 0.10 | 1.12 ± 0.08 | |
| 4 | SH4 | 0.44 ± 0.09 | 0.59 ± 0.05 | 0.66 ± 0.08 | 0.74 ± 0.11 | 0.79 ± 0.12 | |
| Fly ash | 2 | SF2 | 1.28 ± 0.12 | 2.00 ± 0.18 | 2.91 ± 0.19 | 3.44 ± 0.24 | 3.64 ± 0.25 |
| 3 | SF3 | 1.52 ± 0.13 | 2.35 ± 0.22 | 2.90 ± 0.19 | 3.70 ± 0.25 | 3.81 ± 0.28 | |
| 4 | SF4 | 1.55 ± 0.13 | 2.28 ± 0.18 | 2.97 ± 0.21 | 3.73 ± 0.23 | 3.96 ± 0.25 | |
Table 5.
Test results for indirect tensile strength (MPa).
| Additives | Content/% | Mixture | Curing Days | ||||
|---|---|---|---|---|---|---|---|
| 7 | 14 | 28 | 60 | 90 | |||
| None | 0 | S11 | 0.18 ± 0.01 | 0.25 ± 0.02 | 0.40 ± 0.03 | 0.46 ± 0.03 | 0.46 ± 0.04 |
| Gypsum | 2 | SS2 | 0.19 ± 0.02 | 0.29 ± 0.03 | 0.39 ± 0.03 | 0.59 ± 0.04 | 0.59 ± 0.03 |
| 3 | SS3 | 0.09 ± 0.01 | 0.15 ± 0.01 | 0.34 ± 0.02 | 0.55 ± 0.04 | 0.56 ± 0.05 | |
| 4 | SS4 | 0.08 ± 0.01 | 0.11 ± 0.01 | 0.16 ± 0.02 | 0.47 ± 0.05 | 0.49 ± 0.04 | |
| Clay particles | 2 | SN2 | 0.22 ± 0.02 | 0.27 ± 0.02 | 0.36 ± 0.03 | 0.40 ± 0.03 | 0.40 ± 0.05 |
| 3 | SN3 | 0.23 ± 0.05 | 0.30 ± 0.03 | 0.38 ± 0.03 | 0.41 ± 0.05 | 0.41 ± 0.06 | |
| 4 | SN4 | 0.23 ± 0.02 | 0.30 ± 0.02 | 0.39 ± 0.04 | 0.43 ± 0.06 | 0.43 ± 0.05 | |
| Lime | 2 | SH2 | 0.10 ± 0.01 | 0.15 ± 0.02 | 0.19 ± 0.02 | 0.21 ± 0.03 | 0.21 ± 0.03 |
| 3 | SH3 | 0.07 ± 0.01 | 0.09 ± 0.02 | 0.12 ± 0.02 | 0.14 ± 0.02 | 0.15 ± 0.02 | |
| 4 | SH4 | 0.04 ± 0.01 | 0.06 ± 0.01 | 0.07 ± 0.01 | 0.08 ± 0.03 | 0.11 ± 0.03 | |
| Fly ash | 2 | SF2 | 0.19 ± 0.02 | 0.26 ± 0.03 | 0.38 ± 0.04 | 0.49 ± 0.05 | 0.53 ± 0.06 |
| 3 | SF3 | 0.18 ± 0.02 | 0.31 ± 0.03 | 0.42 ± 0.04 | 0.53 ± 0.05 | 0.54 ± 0.04 | |
| 4 | SF4 | 0.20 ± 0.01 | 0.30 ± 0.02 | 0.43 ± 0.04 | 0.54 ± 0.05 | 0.58 ± 0.03 | |
Table 6.
Test results for flexural strength (MPa).
| Additives | Content/% | Mixture | Curing Days | ||||
|---|---|---|---|---|---|---|---|
| 7 | 14 | 28 | 60 | 90 | |||
| None | 0 | S11 | 0.32 ± 0.03 | 0.47 ± 0.05 | 0.62 ± 0.06 | 0.87 ± 0.05 | 0.88 ± 0.06 |
| Gypsum | 2 | SS2 | 0.21 ± 0.03 | 0.48 ± 0.05 | 0.66 ± 0.04 | 0.97 ± 0.11 | 1.01 ± 0.08 |
| Clay particles | 4 | SN4 | 0.34 ± 0.02 | 0.54 ± 0.03 | 0.73 ± 0.05 | 0.85 ± 0.08 | 0.85 ± 0.10 |
| Fly ash | 4 | SF4 | 0.38 ± 0.01 | 0.56 ± 0.02 | 0.76 ± 0.04 | 1.00 ± 0.05 | 1.02 ± 0.07 |
Table 7.
Test results for compression rebound modulus (MPa).
| Additives | Content/% | Mixture | Curing Days | ||||
|---|---|---|---|---|---|---|---|
| 7 | 14 | 28 | 60 | 90 | |||
| None | 0 | S11 | 389.36 ± 28.66 | 545.71 ± 45.19 | 694.18 ± 53.12 | 963.32 ± 66.23 | 1012.6 ± 58.72 |
| Gypsum | 2 | SS2 | 314.05 ± 13.54 | 674.96 ± 34.23 | 811.96 ± 42.15 | 1105.19 ± 63.14 | 1133.77 ± 68.05 |
| Clay particles | 4 | SN4 | 391.16 ± 18.61 | 694.62 ± 54.20 | 1059.44 ± 33.14 | 1234.31 ± 70.05 | 1248.5 ± 57.62 |
| Fly ash | 4 | SF4 | 470.94 ± 23.55 | 689.63 ± 47.08 | 1170.19 ± 72.12 | 1286.85 ± 68.26 | 1321.01 ± 86.10 |
Publisher’s Note: MDPI stays neutral with regard to jurisdictional claims in published maps and institutional affiliations. |
© 2021 by the authors. Licensee MDPI, Basel, Switzerland. This article is an open access article distributed under the terms and conditions of the Creative Commons Attribution (CC BY) license (https://creativecommons.org/licenses/by/4.0/).
Share and Cite
MDPI and ACS Style
Wu, D.; Chen, K.; Zhang, Z.; Chang, L. Influence of Some Additives on the Properties of OPC Solidified Sandy Silt. Appl. Sci. 2021, 11, 7252. https://0-doi-org.brum.beds.ac.uk/10.3390/app11167252
AMA Style
Wu D, Chen K, Zhang Z, Chang L. Influence of Some Additives on the Properties of OPC Solidified Sandy Silt. Applied Sciences. 2021; 11(16):7252. https://0-doi-org.brum.beds.ac.uk/10.3390/app11167252
Chicago/Turabian StyleWu, Dazhi, Keyu Chen, Zilong Zhang, and Lifu Chang. 2021. "Influence of Some Additives on the Properties of OPC Solidified Sandy Silt" Applied Sciences 11, no. 16: 7252. https://0-doi-org.brum.beds.ac.uk/10.3390/app11167252
Note that from the first issue of 2016, this journal uses article numbers instead of page numbers. See further details here.